Regulation and role of Siah proteins in Helicobacter pylori-mediated gastric cancer
By
LOPAMUDRA DAS
LIFE11201004002
National Institute of Science Education and Research (NISER)
Bhubaneswar
A thesis submitted to the
Board of Studies in Life Sciences
In partial fulfilment of requirements
for the Degree of
DOCTOR OF PHILOSOPHY
Of
HOMI BHABHA NATIONAL INSTITUTE
February, 2017


STATEMENT BY AUTHOR
This dissertation has been submitted in partial fulfilment of requirements for an advanced
degree at Homi Bhabha National Institute (HBNI) and is deposited in the Library to be made
available to borrowers under rules of the HBNI.
Brief quotations from this dissertation are allowable without special permission, provided that
accurate acknowledgement of source is made. Requests for permission for extended quotation
from or reproduction of this manuscript in whole or in part may be granted by the Competent
Authority of HBNI when in his or her judgment the proposed use of the material is in the
interests of scholarship. In all other instances, however, permission must be obtained from the
author.
Signature
Lopamudra Das
Dt-27/02/2017

DECLARATION
I, hereby declare that the investigation presented in the thesis has been carried out by me. The
work is original and has not been submitted earlier as a whole or in part for a degree/ diploma
at this or any other Institution/ University.
Signature
Lopamudra Das
Dt-27/02/2017

CERTIFICATE
This is to certify that the thesis entitled “Regulation and role of Siah proteins in
Helicobacter pylori-mediated gastric cancer”, which is being submitted by Mrs. Lopamudra
Das in partial fulfilment of the degree of Doctor of Philosophy in Life Sciences of Homi
Bhabha National Institute is a record of her own research work carried by her. She has carried
out her investigations for the last five years on the subject matter of the thesis under my
supervision at National Institute of Science Education and Research, Bhubaneswar. To the
best of our knowledge, the matter embodied in this thesis has not been submitted for the
award of any other degree.
Signature of the Candidate Signature of the Supervisor
Dt-27/02/2017 Dt-27/02/2017
Lopamudra Das Dr. Asima Bhattacharyya
National Institute of Science Reader F
Education and Research (NISER) National Institute of Science
Bhubaneswar Education and Research (NISER)
Bhubaneswar

List of Publications
a. Published
1. Regulation of Noxa-mediated apoptosis in Helicobacter pylori–infected gastric
epithelial cells. Suvasmita Rath, Lopamudra Das, Shrikant Babanrao Kokate, B M
Pratheek, Subhasis Chattopadhyay, Chandan Goswami, Ranajoy Chattopadhyay,
Sheila Eileen Crowe, Asima Bhattacharyya. FASEB J. 2015 Mar; 29(3): 796-8
2. Cobalt chloride-mediated protein kinase Cα (PKCα) phosphorylation induces
hypoxia-inducible factor 1α (HIF1α) in the nucleus of gastric cancer cell. Suvasmita
Rath, Aditya Anand, Nilabh Ghosh, Lopamudra Das, Shrikant Babanrao Kokate,
Pragyesh Dixit, Swetapadma Majhi, Niranjan Rout, Shivaram Prasad Singh, Asima
Bhattacharyya. Biochem Biophys Res Commun. 2016 Feb 26; 471(1): 205-12
3. *ETS2 and Twist1 promote invasiveness of Helicobacter pylori-infected gastric
cancer cells by inducing Siah2. Lopamudra Das, Shrikant Babanrao Kokate,
Suvasmita Rath, Niranjan Rout, Shivaram Prasad Singh, Sheila Eileen Crowe, Asish
K Mukhopadhyay, Asima Bhattacharyya. Biochem. J. (2016) 473, 1629–1640
4. Inhibition of Histone/Lysine Acetyltransferase Activity by CTK7A Selectively Kills
Hypoxic Gastric Cancer Cells. Suvasmita Rath, Lopamudra Das, Shrikant Babanrao
Kokate, Nilabh Ghosh, Pragyesh Dixit, Niranjan Rout, Shivaram P Singh, Subhasis
Chattopadhyay, Hassan Ashktorab, Duane T Smoot, Mahadeva M Swamy, Tapas K
Kundu, Sheila E Crowe, Asima Bhattacharyya. Int J Biochem Cell Biol. 2017
Jan;82:28-40
b. Under Review:
1. *Helicobacter pylori enhances membrane-bound β-Catenin degradation in the gastric
epithelial cancer cell via ETS2- mediated Siah1 induction. #Lopamudra Das,
#Shrikant Babanrao Kokate, Pragyesh Dixit, Suvasmita Rath, Niranjan Rout,
Shivaram Prasad Singh, Asima Bhattacharyya.
c. Other Publications:
1. *Role of Siah1 in Helicobacter pylori-infected gastric epithelial cancer cells.
Lopamudra Das, Shrikant Babanrao Kokate, Suvasmita Rath, Shivaram P. Singh,
Asima Bhattacharyya. International Journal of Molecular Medicine 01/2014; 34:S46-
S46.
*pertaining to this thesis; #contributed equally Signature of the student
Dt-27/02/2017
Conference Presentations
ORAL PRESENTATIONS
“Role of Siah1 in Helicobacter pylori-infected gastric epithelial cancer cells”, Lopamudra
Das, Shrikant Babanrao Kokate, Suvasmita Rath, Shivaram P. Singh, Asima Bhattacharyya.
19th
World Congress on Advances in Oncology and 17th
International Symposium on
Molecular Medicine, October 9-11, 2014, Athens, Greece
“Selective killing of hypoxic gastric epithelial cancer cells showing metastatic properties”.
Suvasmita Rath, Lopamudra Das, Shrikant Babanrao Kokate, Tapas K Kundu, Shivaram P.
Singh, Asima Bhattacharyya. 2nd
International Meet on Advanced Studies in Cell Signaling
Network, IICB, Kolkata, Dec 13-15, 2014
“Regulation of Helicobacter pylori-mediated gastric cancer: a perspective on Siah2”,
Lopamudra Das, Shrikant Babanrao Kokate, Suvasmita Rath, Shivaram P. Singh, Asima
Bhattacharyya. 2nd
International Meet on Advanced Studies in Cell Signaling Network, IICB,
Kolkata, Dec 13-15, 2014
POSTER PRESENTATIONS:
“Regulation of hypoxia-Inducible factor 1α in gastric cancer metastasis”. Suvasmita Rath,
Lopamudra Das, Tapas K Kundu, Asima Bhattacharyya. 81st Annual Meeting of Society of
Biological Chemists (India), Science City, Kolkata, Nov 2012
“Regulation and role of the E3 ubiquitin ligase SIAH1 in Helicobacter pylori-mediated
gastric cancer”. Lopamudra Das, Shrikant Babanrao Kokate, Suvasmita Rath, Shivaram P
Singh, Asima Bhattacharyya. 2nd
International Meet on Advanced Studies in Cell Signaling
Network, IICB, Kolkata, Dec 13-15, 2014
“Regulation of apoptosis induction in hypoxic gastric epithelial cancer cells with metastatic
properties”. Suvasmita Rath, Lopamudra Das,Shrikant Babanrao Kokate, Tapas K Kundu,
Shivaram P Singh, Asima Bhattacharyya. 2nd
International Conference on Frontiers in
Biological Sciences, NIT, Rourkela, 22-24 Jan, 2015
“Regulation of Mitochondria-Mediated Apoptosis Induction in Hypoxic Gastric Epithelial
Cancer Cells. Suvasmita Rath, Shrikant Babanrao Kokate, Lopamudra Das, Tapas K Kundu,
Shivaram P Singh, Asima Bhattacharyya. Cell Symposia: Multifaceted Mitochondria, P
1.088, 2015 – Chicago, IL, USA”.

Dedicated to my family……………

ACKNOWLEDGEMENT
I am expressing my deepest gratefulness to my project supervisor Dr. Asima Bhattacharyya for her valuable
guidance and constructive criticism that endured the enthusiasm to completion this project. Her advice and
valuable suggestions throughout these years have made me believe in myself and encouraged me to
accomplish this work.
I would also avail this opportunity to express my sincere thanks to the director of NISER, Prof.
V. Chandrashekhar, for allowing me to work in this institute. I am very much gratified to my doctoral
committee members Prof. Jagneshwar Dandapat, Dr. Subhasis Chattopadhaya, Dr. Chandan Goswami,
Dr. Harapriya Mohapatra for their critical evaluation and valuable suggestions during my work. I would
like to thank Prof. Shivaram Prasad Singh of SCB Med College, Cuttack and Prof Niranjan Rout,
AHRCC, Cuttack for providing tissue samples used in this study
I am thankful to my lab members Mrs. Suvasmita Rath, Mr. Shrikant B Kokate, Mr.
Pragyesh Dixit, Mr. Nilabh Ghosh, Mr. Aditya Anand and Mr. Indrajit Poirah for their help and
inspiration in completing this thesis. I appreciate all my batchmates (especially Dr. Sanjima Pal and
Ashutosh Jha) along with juniors for their constant support and motivation throughout the work which
kept me going.
I am grateful to all the faculty members and staff of SBS for their blessings and encouragement. I sincerely
appreciate the help received from all the scientists who gifted plasmids constructs used in this study. I
acknowledge the central instrumentation facilities, computer centre, library staff and timely help received
from the academic, non-academic staff at NISER.
My parents are the greatest motivational force behind me in completing my work and perhaps no
word of acknowledgment is sufficient for them. I am highly indebted to my husband Dr. Debasis Bisoi for
his constant support, encouragement and inspiration at every phase of my life. A special thanks to my elder
sister, brother-in law, and brother for encouragement and support. With lots of Love I would like to
appreciate my daughter Jagrutee for her unconditional love.
CONTENTS
Page No.
SYNOPSIS i-x
ABBREVIATIONS xi-xv
LIST OF FIGURES xvi-xviii
LIST OF TABLES xviii
Chapter 1. INTRODUCTION
1.1. Ubiquitination and Ubiquitin-Mediated Proteasomal Degradation 1-5
1.2. RING Type E3 ubiquitin Ligases and their Involvement in
Human Cancers 5-7
1.3. Siah Proteins and their Roles in Cancer Progression 7-8
1.4. Gastric Cancer 9-10
1.5. Gastric Carcinogenesis by H. pylori 10-15
1.5.1. Overview 10-12
1.5.2. Epidemiology and routes of transmission 12
1.5.3. Pathogenesis 12-15
1.6. Intercellular Junctions and their Roles in Cancer Invasion
and Metastasis 15-21
1.6.1. Intercellular junctions 15-17
1.6.2. Role of cadherins and β-catenin during cancer invasion 17-20
1.6.3. RING finger E3 ubiquitin ligases regulate E-cadherin-catenin
complex during cancer metastasis 20-21
1.7. Objectives 21
Chapter 2. MATERIALS AND METHODS
2.1. Materials Used 23-27

2.1.1. Cell lines 23
2.1.2. H. pylori strains 23
2.1.3. Competent cells 23
2.1.4. Human gastric cancer biopsy specimen 23
2.1.5. Plasmid constructs, siRNAs and antibodies 24
2.1.6. Reagents, kits, and instruments 24-27
For cell culture 24
For H. pylori culture 24
For bacterial culture 24
For polymerase chain reaction (PCR) RNA/DNA 24-25
For cloning 25
For transfection and stable cells 25
For immunoblotting 25
For chromatin immunoprecipitation assay and
immunoprecipitation assay 25
For DNA binding assay 26
For tissue sectioning 26
For soft agar assay 26
For transwell migration and invasion assay 26
Kits 26
Instruments 26-27
2.2. Methodology 27-54
2.2.1. Culture of human gastric cancer cells (GCCs) MKN45, AGS,
Kato III and immortalized normal gastric epithelial cells HFE145 27
2.2.2. Cell freezing and revival 27-28
2.2.3. H. pylori culture and infection of cells 28

2.2.4. Cloning, expression and site-directed mutagenesis 28-36
2.2.4.1. Cloning of human siah1 gene 28-32
2.2.4.2. Cloning and mutation of human siah1and siah2 promoters 32-35
2.2.4.3. Transient transfection 36
2.2.5. Infection of GCCs with H. pylori 37
2.2.6. Whole cell lysate preparation from GCCs after H. pylori infection 37
2.2.7. Isolation of membrane, cytosol and nuclear fractions from MKN45
cells after H. pylori infection 37-39
2.2.8. Sodium dodecyl sulfate polyacrylamide gel electrophoresis (SDS) 39-41
2.2.9. Immunoblotting 41-43
2.2.10. Total RNA isolation and real time RT-PCR in MKN45 cells
to study expression of Siah1and Siah2 after H. pylori infection 43-45
2.2.11. In vitro binding assay 45-46
2.2.12. In vivo binding assay 46-48
2.2.13. Dual luciferase reporter assay 49
2.2.14. Immunoprecipitation (IP) assay 49-50
2.2.15. Generations of stable cell lines overexpressing ETS2, Twist1,
Siah1 and Siah2 50
2.2.16. Embedding and sectioning of gastric biopsy samples 50-51
2.2.17. Immunofluorescence and confocal microscopy 51-52
2.2.18. Wound-healing assay or scratch assay 52
2.2.19. Anchorage-independent growth assay 52-53
2.2.20. Transwell migration and invasion assay 53-54
2.2.21. Statistical analysis 54
Chapter 3. RESULTS
3.1. H. pylori Induced Expression of Siah Proteins in Cultured

Human GCCs 56-60
3.2. Identification of Transcription Factors Regulating Expression of
Siah1 and Siah2 60-63
3.3. Induced Expression of ETS2, Twist1, Siah1 and Siah2 in
H. pylori-Infected Human GCCs 63-68
3.4. ETS2 Binds with the 5’ UTR of siah1in H. pylori-Infected GCCs 68-69
3.5. ETS2 and Twist1 Bind with siah2 Promoter in H. pylori-Infected GCCs 70-71
3.6. Cloning of siah1 5’ UTR and siah2 Promoter to Prepare Luciferase
Constructs and Generation of Respective Mutants 72-73
3.7. ETS2 Augments siah1 Transcription in H. pylori-Infected GCCs 73-75
3.8. ETS2 and Twist1 Enhance siah2 Transcription in H. pylori-
-Infected GCCs 75-78
3.9. Discussion 78-79
Chapter 4. RESULTS
4.1. Cloning of Human siah1 Gene 81
4.2. Siah1 Mediates Degradation of Membrane-Bound β-catenin in
H. pylori-Infected GCCs 82-88
4.3. Siah Induces Cell Migration and Invasion in H. pylori-Infected GCCs 88-93
4.4. ETS2 and Twist1 Induce Migration and Invasion of H. pylori-
-Infected GCCs 93-95
4.5. Discussion 95-97
Chapter 5. SUMMARRY AND CONCLUSION 99-100
BIBLIOGRAPHY 102-118
APPENDIX 119-131
PUBLICATIONS
i
Homi Bhabha National Institute
Ph. D. PROGRAMME 1. Name of the Student : Lopamudra Das
2. Name of the Constituent Institution : National Institute of Science Education and
Research (NISER)
3. Enrolment no : LIFE11201004002
4. Title of the thesis : Regulation and Role of Siah Proteins in
Helicobacter pylori-Mediated Gastric
Cancer
5. Board of studies : Life Sciences

ii
SYNOPSIS
Understanding the role of Siah Proteins and its regulation during Helicobacter pylori-
mediated gastric cancer is the primary objective of this thesis.
Ubiquitin-mediated proteasomal degradation pathways control protein structure,
function, assembly, localization as well as denaturation [1]. This pathway involves a series of
enzymatic reactions catalyzed by a cascade of enzymes, i.e. E1 ubiquitin-activating enzymes,
E2 ubiquitin-conjugating enzymes and E3 ubiquitin-ligase enzyme that causes transfer of E2-
linked ubiquitin to a Lys residue of a targeted protein. The tagged proteins get degraded
either by the 26S proteasome or by the lysosome [2]. The importance of E3 ligase lies in that
it confers specificity to ubiquitination by identifying the target proteins and thus acts as a
mediator for transfer of ubiquitin from an E2 ubiquitin-conjugating enzyme to the target
protein [1]. The really interesting new gene (RING) family of E3 ubiquitin ligases play
crucial role in regulating cancer progression and metastasis for adenocarcinoma [3] and have
drawn attention as potential drug targets [4]. The evolutionarily conserved seven in absentia
homolog (Siah) proteins belong to the RING family of E3 ubiquitin ligases. So far three siah
genes have been identified in human i.e. siah-1, siah-2 and siah-3 [5, 6]. There are no reports
on the role of Siah3 in cancer progression whereas the other two Siah proteins were shown to
interact with and regulate the stability of multiple factors involved in oncogenesis including
prolyl hydroxylases, β-catenin, NUMB, tumour necrosis factor receptor 2–associated factor
and Sprouty [7-11]. Induced expression of Siah proteins in various cancers supports their
tumour-promoting role [12-16]. Moreover, elevated level of Siah2 expression in breast,
prostate and liver cancer cells has been linked with malignancy and cancer invasiveness [12,
13]. But limited number of studies are available that explored role of Siah proteins in gastric
cancer progression. Gastric cancer is the most common malignant cancer and is a leading
cause of cancer-related mortality. Due to its complex initiation and progression mechanism it

iii
is generally diagnosed at later stages when the cancer has already started metastasizing [17,
18]. Infection with H. pylori is the prime factor responsible for gastric cancer. H. pylori
colonizes nearly half of the world population and has been recognized as a type I carcinogen
for gastric cancer [19]. Therefore, understanding the role of Siah proteins in the complex
process of gastric cancer progression and metastasis is imperative in the H. pylori-infected
gastric epithelium. It is interesting to identify transcription factors regulating expression of
Siah proteins as there are very few reports. So far, Siah1 has been mainly reported as a
tumour-suppressor but Siah2 has been portrayed as a tumour-promoting agent. This
discrepancy in function suggests that a Siah1 and Siah2 might have different set of
downstream target proteins modulating various signalling network [20]. Hence, identifying
the regulation of Siah protein expression and in-depth understanding of their functions during
gastric cancer progression are important. This thesis work focuses to understand the role of
Siah proteins and their regulation during H. pylori-mediated gastric cancer progression. This
thesis has been structured into five chapters and contents of each chapter have been discussed
briefly as follows.
Chapter 1: Introduction:
This is the introductory section of the thesis that includes a review of literature on role of H.
pylori in gastric cancer. A discussion on the cell-cell attachment complex on the cell
membrane, followed by literature studies on the degradation of membrane-bound β-catenin
during H. pylori infection and its role in cell migration is explained in this chapter. Focus is
given on elaborating E3 ubiquitin ligases and Siah proteins belonging to the RING finger
family of ubiquitin ligases. This chapter collates the current understanding on Siah proteins
during cancer progression and its potential as a potential target for therapy.

iv
Chapter 2: Experimental procedures
Chapter 2 includes description of various strains of H. pylori, gastric cancer cell lines,
reagents, chemicals, tissue samples used for completion of the thesis work. It also includes
the details of experimental procedures/methodologies employed to complete the objectives of
this thesis. This chapter illustrates the culture techniques used for various gastric epithelial
cell lines and H. pylori as well as method of infecting cell lines with H. pylori.
This chapter also includes description of several molecular biology techniques used for the
study. Cloning of human siah1 gene into the mammalian expression vector pcDNA3.1+,
cloning of human siah1 and siah2 promoters in the pGL3 basic (luciferase reporter vector)
and mutation at the ETS2-binding site for human siah1 promoter and mutation at the ETS2
and Twist1-binding sites for the human siah2 promoter using site-directed mutagenesis are
explained. The procedure for examining the mRNA status is also incorporated in this chapter.
The detailed methodology to examine protein expressions using techniques such as
immunoblotting, immunoprecipitation, fluorescence microscopy and confocal microscopy are
elucidated. Methods for in vitro DNA-protein binding assay, chromatin immunoprecipitation
assay and dual luciferase assay are also included in this chapter.
Detailed procedures for generation of stable cell lines expressing Siah1, Siah2, ETS2 and
Twist1 are explained in this chapter. Cell migration and invasiveness, as assessed by wound
healing assay, soft agar assay, transwell migration and invasion assays are illustrated in this
chapter. Methods employed to study human gastric biopsy samples using fluorescence
microscopy are included in this chapter.
Chapter 3: Transcriptional regulation of Siah proteins in H. pylori-infected human
gastric cancer cells (GCCs)
This chapter describes the status of Siah1 and 2 proteins in H. pylori-infected GCCs.
Transcription factors regulating Siah expression has also not been studied in H. pylori-
v
infected GCCs. Analysis has been performed with Siah1 5‟ UTR and Siah2 promoter using
bioinformatics tool such as MatInspector (professional version 6.2.2). ETS2 is implicated in
having very high probability of binding to Siah1 5‟ UTR whereas ETS2 and Twist1 both are
shown to have very high probability of binding to Siah2 promoter. The metastasis promoting
role of Twist1 has been reported in various cancers [21, 22] including gastric cancer [23]
while enhancement of lymph node and distant metastases are reported in Twist1-expressing
gastric cancer cells [24]. So far, ETS2 has been linked with increased apoptosis or tumour
suppression in gastric cancer [25]. This chapter experimentally proves that ETS2 and Twist1
mediate H. pylori-induced Siah2 expression and ETS2 is the transcriptional regulator of
Siah1.
Chapter 4: Role of Siah proteins in inducing gastric cancer metastasis
H. pylori induce inflammatory responses and neoplastic changes owing to the loss of the
epithelial barrier function of the gastric epithelium accompanied by loss of epithelial cell
morphology and cell to cell adhesions [26]. The membrane-bound cadherin-catenin complex
is responsible for cell-cell adhesion. The other pool of β-catenin is in the cytosolic
compartment. The membrane-bound β-catenin is an integral component of the adherens
junctions linking cadherin receptors with the actin cytoskeleton while the nonmembranous
cytoplasmic-nuclear pool play a role in Wnt signalling [27]. Chapter 4 describes studies
related to ETS2-mediated Siah1 induction resulting in degradation of membrane-bound β-
catenin in H. pylori-infected gastric cancer cells. Induced expression of Siah1 protein is
observed after infection in gastric cancer cell lines. Here we report for the first time that the
membrane-bound β-catenin is a target of proteasomal degradation mediated by Siah1. We
show that following H. pylori infection, Siah1 is upregulated in the cytosolic fraction but it
does not degrade the cytosolic β-catenin. Surprisingly, a decrease in membrane-bound β-
catenin is noticed in the infected gastric cancer cells. H. pylori-mediated degradation of β-

vi
catenin is further enhanced in gastric cancer cells with ectopic expression of Siah1.
Furthermore, we notice that Siah1 overexpression significantly enhance the ability of cell
migration and invasivness. ETS2-mediated Siah2 induction also shows an increase in cell
invasiveness and migration with H. pylori infection in GCCs.
Chapter 5: Summary and conclusion
Chapter 5 presents concluding remarks on our findings which demonstrate crucial roles of
Siah proteins during H. pylori infection in gastric cancer cells promoting invasion and
migration. Our studies also indicate ETS2-mediated induction of Siah1 and ETS2 and
Twist1-mediated induction of Siah2 in H. pylori-infected gastric epithelial cancer cells.
Furthermore, our findings provide an important insight towards the fact that although Siah1
and Siah2 are induced by ETS2 and have roles in gastric cancer metastasis, their cellular
targets are not the same. Thus, Siah1 and Siah2 are not showing functional redundancy at
least in promoting gastric cancer.
Summary Figure: Mechanism of Siah2 induction and degradation of membrane bound
β-catenin during H. pylori infection. H. pylori infection induces ETS2 and Twist1
expression in gastric epithelial cells. ETS2 and Twist1 bind to the siah2 promoter and
mediate Siah2 expression in H. pylori-infected in gastric cancer cells. Induced expression of
Siah2 enhances metastatic properties of gastric cancer cells.

vii
Summary Figure: Siah1 induced in H. pylori-infected gastric cancer cell degrades
membrane bound β-catenin. H. pylori infection induces ETS2 expression. ETS2 binds to
the siah1 promoter and promotes Siah1 transcription in H. pylori-infected gastric cancer cells.
Induced expression of Siah1 results in the degradation of membrane bound β-catenin. As a
result, infected cells become more migratory and invasive.
References:
[1] A. Ciechanover, The ubiquitin-proteasome pathway: on protein death and cell life, The
EMBO journal, 17 (1998) 7151-7160.
[2] D. Rotin, S. Kumar, Physiological functions of the HECT family of ubiquitin ligases,
Nature reviews. Molecular cell biology, 10 (2009) 398-409.
[3] S.C. Pavlides, K.T. Huang, D.A. Reid, L. Wu, S.V. Blank, K. Mittal, L. Guo, E.
Rothenberg, B. Rueda, T. Cardozo, L.I. Gold, Inhibitors of SCF-Skp2/Cks1 E3 ligase block
estrogen-induced growth stimulation and degradation of nuclear p27kip1: therapeutic
potential for endometrial cancer, Endocrinology, 154 (2013) 4030-4045.
[4] M. Shen, S. Schmitt, D. Buac, Q.P. Dou, Targeting the ubiquitin-proteasome system for
cancer therapy, Expert Opin Ther Targets, 17 (2013) 1091-1108.
[5] S.A. Hasson, L.A. Kane, K. Yamano, C.H. Huang, D.A. Sliter, E. Buehler, C. Wang,
S.M. Heman-Ackah, T. Hessa, R. Guha, S.E. Martin, R.J. Youle, High-content genome-wide

viii
RNAi screens identify regulators of parkin upstream of mitophagy, Nature, 504 (2013) 291-
295.
[6] J. Qi, H. Kim, M. Scortegagna, Z.A. Ronai, Regulators and effectors of Siah ubiquitin
ligases, Cell biochemistry and biophysics, 67 (2013) 15-24.
[7] H. Habelhah, I.J. Frew, A. Laine, P.W. Janes, F. Relaix, D. Sassoon, D.D. Bowtell, Z.
Ronai, Stress-induced decrease in TRAF2 stability is mediated by Siah2, The EMBO journal,
21 (2002) 5756-5765.
[8] S.I. Matsuzawa, J.C. Reed, Siah-1, SIP, and Ebi collaborate in a novel pathway for beta-
catenin degradation linked to p53 responses, Molecular cell, 7 (2001) 915-926.
[9] R.J. Nadeau, J.L. Toher, X. Yang, D. Kovalenko, R. Friesel, Regulation of Sprouty2
stability by mammalian Seven-in-Absentia homolog 2, J Cell Biochem, 100 (2007) 151-160.
[10] K. Nakayama, I.J. Frew, M. Hagensen, M. Skals, H. Habelhah, A. Bhoumik, T. Kadoya,
H. Erdjument-Bromage, P. Tempst, P.B. Frappell, D.D. Bowtell, Z. Ronai, Siah2 regulates
stability of prolyl-hydroxylases, controls HIF1alpha abundance, and modulates physiological
responses to hypoxia, Cell, 117 (2004) 941-952.
[11] L. Susini, B.J. Passer, N. Amzallag-Elbaz, T. Juven-Gershon, S. Prieur, N. Privat, M.
Tuynder, M.C. Gendron, A. Israel, R. Amson, M. Oren, A. Telerman, Siah-1 binds and
regulates the function of Numb, Proc Natl Acad Sci U S A, 98 (2001) 15067-15072.
[12] M. Malz, A. Aulmann, J. Samarin, M. Bissinger, T. Longerich, S. Schmitt, P.
Schirmacher, K. Breuhahn, Nuclear accumulation of seven in absentia homologue-2 supports
motility and proliferation of liver cancer cells, International journal of cancer, 131 (2012)
2016-2026.
[13] J. Qi, K. Nakayama, R.D. Cardiff, A.D. Borowsky, K. Kaul, R. Williams, S. Krajewski,
D. Mercola, P.M. Carpenter, D. Bowtell, Z.A. Ronai, Siah2-dependent concerted activity of

ix
HIF and FoxA2 regulates formation of neuroendocrine phenotype and neuroendocrine
prostate tumors, Cancer Cell, 18 (2010) 23-38.
[14] J. Qi, K. Nakayama, S. Gaitonde, J.S. Goydos, S. Krajewski, A. Eroshkin, D. Bar-Sagi,
D. Bowtell, Z. Ronai, The ubiquitin ligase Siah2 regulates tumorigenesis and metastasis by
HIF-dependent and -independent pathways, Proc Natl Acad Sci U S A, 105 (2008) 16713-
16718.
[15] A.U. Ahmed, R.L. Schmidt, C.H. Park, N.R. Reed, S.E. Hesse, C.F. Thomas, J.R.
Molina, C. Deschamps, P. Yang, M.C. Aubry, A.H. Tang, Effect of disrupting seven-in-
absentia homolog 2 function on lung cancer cell growth, J Natl Cancer Inst, 100 (2008) 1606-
1629.
[16] P. Chan, A. Moller, M.C. Liu, J.E. Sceneay, C.S. Wong, N. Waddell, K.T. Huang, A.
Dobrovic, E.K. Millar, S.A. O'Toole, C.M. McNeil, R.L. Sutherland, D.D. Bowtell, S.B. Fox,
The expression of the ubiquitin ligase SIAH2 (seven in absentia homolog 2) is mediated
through gene copy number in breast cancer and is associated with a basal-like phenotype and
p53 expression, Breast Cancer Res, 13 (2011) R19.
[17] A. Jemal, R. Siegel, E. Ward, Y. Hao, J. Xu, T. Murray, M.J. Thun, Cancer statistics,
2008, CA Cancer J Clin, 58 (2008) 71-96.
[18] S. Tsugane, S. Sasazuki, Diet and the risk of gastric cancer: review of epidemiological
evidence, Gastric Cancer, 10 (2007) 75-83.
[19] C. de Martel, J. Ferlay, S. Franceschi, J. Vignat, F. Bray, D. Forman, M. Plummer,
Global burden of cancers attributable to infections in 2008: a review and synthetic analysis,
The Lancet. Oncology, 13 (2012) 607-615.
[20] C.S. Wong, A. Moller, Siah: a promising anticancer target, Cancer research, 73 (2013)
2400-2406.

x
[21] M. Shiota, A. Zardan, A. Takeuchi, M. Kumano, E. Beraldi, S. Naito, A. Zoubeidi, M.E.
Gleave, Clusterin mediates TGF-beta-induced epithelial-mesenchymal transition and
metastasis via Twist1 in prostate cancer cells, Cancer research, 72 (2012) 5261-5272.
[22] M. Croset, D. Goehrig, A. Frackowiak, E. Bonnelye, S. Ansieau, A. Puisieux, P.
Clezardin, TWIST1 expression in breast cancer cells facilitates bone metastasis formation, J
Bone Miner Res, 29 (2014) 1886-1899.
[23] Z. Yang, X. Zhang, H. Gang, X. Li, Z. Li, T. Wang, J. Han, T. Luo, F. Wen, X. Wu, Up-
regulation of gastric cancer cell invasion by Twist is accompanied by N-cadherin and
fibronectin expression, Biochemical and biophysical research communications, 358 (2007)
925-930.
[24] G.Q. Ru, H.J. Wang, W.J. Xu, Z.S. Zhao, Upregulation of Twist in gastric carcinoma
associated with tumor invasion and poor prognosis, Pathology oncology research : POR, 17
(2011) 341-347.
[25] Y.L. Liao, L.Y. Hu, K.W. Tsai, C.W. Wu, W.C. Chan, S.C. Li, C.H. Lai, M.R. Ho, W.L.
Fang, K.H. Huang, W.C. Lin, Transcriptional regulation of miR-196b by ETS2 in gastric
cancer cells, Carcinogenesis, 33 (2012) 760-769.
[26] P. Correa, M.B. Piazuelo, Helicobacter pylori Infection and Gastric Adenocarcinoma,
US gastroenterology & hepatology review, 7 (2011) 59-64.
[27] B. Baum, M. Georgiou, Dynamics of adherens junctions in epithelial establishment,
maintenance, and remodeling, The Journal of cell biology, 192 (2011) 907-917.

xi
ABBREVIATIONS
AJs Adherens junction
AlpA/B Adherence-associated lipoprotein A and B
APS Ammonium persulfate
ATP Adenosine tri phosphate
BabA Blood group antigen-binding adhesin
BARD1 Breast cancer1-associated RING domain 1
bp Base pair
BMI1 B-cell-specific moloney murine leukaemia virus integration site 1
BIRC2 Baculoviral IAP repeat-containing protein2
BRCA1 Breast cancer1
BSA Bovine serum albumin
C-terminal Carboxyl terminal
C/EBPδ CCAAT/enhancer-binding protein delta
cag Cytotoxin-associated gene
Cbl Casitas B-lineage lymphoma
ccRCC Clear-cell renal cell carcinoma
CER Cytoplasmic extraction reagent
ChIP Chromatin immunoprecipitation
CNRs Cadherin-related neuronal receptor
CO2 Carbon dioxide
CP Core particle
CRL Cullin RING ligases
Cys Cysteine
DUB Deubiquitinating enzymes

xii
DMSO Dimethyl sulfoxide
Dvl Dishevelled
EBS ETS2 binding site
E-cadherin Epithelial cadherin
EDTA Ethylene-diamine-tetra-acetic acid
EMT Epithelial-mesenchymal transition
FBS Fetal bovine serum
FZD Cell surface receptor Frizzled
GCCs Gastric cancer cells
Gly Glycine
H. pylori Helicobacter pylori
HCC Hepato cellular carinoma
HDAC Histone deacetylase
HECT Homology to E6-associated protein carboxyl terminus
HIF1α Hypoxia-inducible factor1α
His Histidine
HopO Helicobacter-specific outer membrane proteins O
HopQ Helicobacter-specific outer membrane proteins Q
HopZ Helicobacter-specific outer membrane proteins Z
HpaA H. pylori adhesion A
HRP Horse radish peroxidise
Hsp60 Heat shock protein 60
HtrA High temperature requirement A
IceA Induced by contact with epithelium A
IHC Immunohistochemistry
xiii
IL Interleukin
IP Immunoprecipitation
IRAC The international agency for research on cancer
kb Kilo base
kDa Kilo Dalton
LAR Luciferase assay reagent
LEF Lymphoid Enhancer Factor
Lys Lysine
LRP5/6 Low Density Lipoprotein Receptor-Related Protein 5/6
MALT Mucosa–associated lymphoid tissue
MAPK Mitogen-activated protein kinases
MDCK Madin Darby canine kidney
MDM2 Murine double minute2
MMPs Matrix metalloprotease
MOI Multiplicity of infection
Mut Mutant
N-terminal Amino terminal
Nap Neutrophil activating protein
NER Nuclear extraction reagent
NFDM Non-fat dry milk
OipA Outer inflammatory protein A
PAGE Polyacrlamide gel electrophoresis
PAI Pathogenicity island
PBS Phosphate-buffered saline
PFA Paraformaldehyde

xiv
PHD Plant homeo-domain
PVDF Polyvinylidene fluoride
pVHL von Hippel-Lindau tumor-suppressor protein
RING Really interesting new gene
RNF4 RING finger protein4
RP Regulatory particle
RT Room temperature
RT-PCR Reverse transcription polymerase chain reaction
SabA Sialic acid-binding adhesion
SIAH Seven in absentia homolog
SIP Siah-interactin protein
siRNA Short interfering RNA
SDS Sodium dodecyl sulfate
β-TrCP β-Transducin repeat-Containing Protein
TAE Tris-acetate buffer
TBS Tris-buffered saline
TBS Twist1 binding site
TCF4 T cell factor4
TE Tris-EDTA
T4SS Type IV secretion system
TJs Tight junctions
TLR Toll-like receptor
TNF Tumor necrosis factor
TRAF TNF receptor associated factor
TRIM Tripartite motiff

xv
TSA Tripticase soy agar
Tyr Tyrosine
VacA Vacuolating cytotoxin geneA
VHL von Hippel-Lindau
WT Wild type
ZO-1 Zona occludens 1

xvi
LIST OF FIGURES
Description Page No.
Chapter 1
Figure 1.1.1 The ubiquitin-proteasome pathway 4
Figure 1.1.2 Types of E3 ubiquitin ligases 5
Figure 1.3.1 The RING domain structure of Siah proteins 7
Figure 1.4.1 The mechanism of metastasis progression 10
Figure 1.5.1.1 Disease pathogenesis by H. pylori 12
Figure 1.5.3.1 Major virulence factors of H. pylori 15
Figure 1.6.1.1 Adherens junction of epithelial cell 17
Figure 1.6.2.1 Cadherin bound β-catenin in cell-cell
adhesion and cytoplasmic β-catenin in
Wnt signalling 19
Figure 1.6.2.2 Disruption of epithelial junction by H. pylori 20
Chapter 3
Figure 3.1.1 H. pylori induce Siah1 and Siah2 protein
expression in MKN45 cells 57-58
Figure 3.1.2 H. pylori enhances Siah1 and Siah2 mRNA
and proteins expression in GCCs 59-60
Figure 3.2.1 Analysis of human siah1 promoter and 5‟UTR 61
Figure 3.2.2 Sequence analysis of human siah2 promoter 62
Figure 3.3.1 H. pylori infection induces parallel expression of ETS2,
Twist1, Siah1 and Siah2 proteins in MKN45 cells 63-64
Figure 3.3.2 H. pylori infection induces ETS2, Twist1, Siah1
and Siah2 proteins in MKN45 cells 65
Figure 3.3.3 H. pylori infection induces ETS2 and Twist1
expression in GCCs 66-67

xvii
Figure 3.3.4 Coexistence of ETS2, Twist1, Siah1 and Siah2
proteins in human gastric adenocarcinoma biopsy sample 67-68
Figure 3.4.1 Binding of ETS2 with the EBS of siah1 5‟ UTR after
H. pylori-infection 69
Figure 3.5.1 ETS2 binds with the EBS and Twist1 binds with the
TBS of siah2 promoter after H. pylori-infection 71
Figure 3.6.1 Cloning of human siah1 5‟UTR and siah2 promoter 72-73
Figure 3.7.1 ETS2 enhances siah1 transcription in H. pylori-
-infected GCCs 74
Figure 3.7.2 ETS2 enhances Siah1 protein expression in
H. pylori-infected GCCs 75
Figure 3.8.1 ETS2 and Twist1 augment siah2 transcription
In H. pylori-infected GCCs 76
Figure 3.8.2 ETS2 and Twist1 augment siah2 transcription and
expression in H. pylori-infected GCCs 77-78
Chapter 4
Figure 4.1.1 Cloning of human siah1 gene 81
Figure 4.2.1 Degradation of membrane-bound β-catenin in
H. pylori-infected GCCs 83-84
Figure 4.2.2 Siah-mediated degradation of membrane-bound
β-catenin in H. pylori-infected GCCs 85-86
Figure 4.2.3 Siah1 binds to membrane-bound β-catenin in
H. pylori-infected GCCs and status of membrane
bound E-cadherin in H. pylori-infected GCCs 87-88
Figure 4.3.1 Elevated Siah expression enhances cell motility
and wound-healing property in H. pylori-infected GCCs 89
Figure 4.3.2 Elevated Siah expression enhances cell migration and
xviii
Invasiveness of H. pylori-infected GCCs 90-91
Figure 4.3.3 Siah suppression reduces cell migration and invasiveness
of H. pylori-infected GCCs 91-93
Figure 4.4.1 ETS2 and Twist 1 enhances cell motility, wound-healing
and invasive property of H. pylori-infected GCCs 93-95
LIST OF TABLES
Description Page No.
Table 1. Parameters for transient transfection 36
Table 2. Reagents used for cell fractionation using NE-PER kit 38

1
INTRODUCTION
Chapter 1

2
INTRODUCTION
1.1. Ubiquitination and Ubiquitin-Mediated Proteasomal Degradation
Protein ubiquitination involves attachment of ubiquitin to targeted proteins which
subsequently leads to regulation of many cellular processes. Ubiquitinated proteins can be
targeted for degradation or they can regulate cell cycle and growth, or take part in
intracellular trafficking, as well as localization [1]. Ubiquitin is a small protein (seventy six
amino acid) modifier which is highly conserved and found only in eukaryotic system.
Ubiquitin has seven Lys residues (Lys6, Lys
11, Lys
27, Lys
29, Lys
33, Lys
48 and Lys
63).
Homotypic or heterotypic linkages of proteins with Lys residues of ubiquitin determine the
fate of proteins. Polyubiquitination leads to proteasomal degradation of target proteins [2].
Polyubiquitinated proteins are targeted for degradation by the 26S proteasome pathway. The
26S proteasome complex is highly conserved in eukaryotes in terms of its structure and
function. This complex consists of a barrel-shaped 20S protease core particle (CP) in the
middle part [3]. The CP consists of two identical inner β and outer α units stacked on one
another forming an axial heptameric ring. The central β-ring is formed of seven different β-
subunits β1–7, and the peripheral α-ring is also formed of seven different α-subunits, α1–7
[3]. The 19S regulatory particle (RP) forms a cap at each end of the 20S CP. The 19S RP can
be further divided into the base and lid (sub complexes). The 19S RP regulates the proteolytic
function of the core protease [3]. Attachment of ubiquitin to the target protein is a reversible
process mediated by specific ubiquitin ligases and proteases {known as deubiquitinating
enzymes (DUBs)}. DUBs counteract activity of specific ubiquitin ligases by removing
ubiquitin and editing ubiquitin chains. DUBs also maintain free ubiquitin monomers in the
cellular pool [4].
Ubiquitination of targeted proteins involves a series of enzymatic reactions catalyzed
by a cascade of enzymes. Ubiquitin molecules get covalently attached to the target protein

3
and tagged proteins get degraded either by the 26S proteasome or by the lysosome [5].
Ubiquitin conjugation to the target proteins involves E1 ubiquitin-activating enzymes that
activate ubiquitin at its C-terminal Gly through a thio-ester bond in an ATP-dependent
manner. At first, transfer of activated ubiquitin to Cys residues of E2 ubiquitin-conjugating
enzymes takes place. E3 ubiquitin-ligase enzyme causes transfer of E2-linked ubiquitin to a
Lys residue of a targeted protein. As illustrated in fig. 1.1.1. The importance of E3 ligase is
that it confers specificity to ubiquitination by identifying target proteins and thus acts as a
mediator for transfer of ubiquitin from an E2 ubiquitin-conjugating enzyme to the target
protein [1]. E3 ubiquitin-ligases either exist as single polypeptides or in multimeric
complexes [1]. They are classified into three distinct types based on recognition of substrate
specificity and structure of the domains: N-end rule E3s specifically targeting protein
substrates bearing destabilizing N-terminal residues; E3s containing the homology to E6-
associated protein (E6AP) carboxyl terminus (HECT) domain and E3s with the really
interesting new gene (RING) finger, including its derivatives, the U-box and the plant
homeo-domain (PHD) [6]. Over six hundred E3s are encoded by the human genome [6]

4
Figure 1.1.1 The ubiquitin-proteasome pathway
The RING type and the HECT type are the two most commonly found E3s. Human
E3s are dominated by the RING family members (nearly ninety five percent) and only twenty
eight enzymes belong to the HECT family. The basic difference between these two families
lies in the way of substrate presentation. The HECT type E3 forms an intermediate thioester
bond with the C terminus of ubiquitin of an E2 through a conserved Cys residue and then
transfers that to the substrate. Whereas, the RING E3s are scaffold proteins that bring the E2s
in close proximity to their substrates to aid in ubiquitin transfer [5]. As demonstrated in figure
1.1.2. RING E3s are elaborately discussed in the next section.

5
Figure1.1.2 Types of E3 ubiquitin ligases (Courtesy Ref: [7])
1.2. RING Type E3 Ubiquitin Ligases and their Involvement in Human Cancers
RING domain E3 ubiquitin ligases form the largest family of human E3 ubiquitin ligases.
Members of this family contain a classic C3H2C3 or C3HC4 RING (that is, three conserved
Cys residues followed by two conserved His and then three additional conserved Cys or three
conserved Cys residues followed by a conserved His and then four additional conserved Cys)
finger domain with a characteristic linear sequence of Cys-X2-Cys-X9–39-Cys-X1–3-His-X2–3-
Cys/His-X2-Cys-X4–48-Cys-X2-Cys, where X stands for any amino acid [8]. A typical RING
finger consists of Zn2+
-coordinating domain with Cys and His residues spaced sequentially,
and aids in E2-dependent ubiquitination of targeted substrate [9].
Monomers, dimers or multi-subunit complex family members exist within the RING
finger family. Homodimers and heterodimers are formed due to dimerization of the RING
finger domains or neighbouring regions. Homodimer RING finger E3s include cellular
inhibitor of apoptosis or BIRC2 (cIAP), RNF4, seven in absentia homologue (Siah), and TNF
receptor associated factor 2 (TRAF2) [10-12]. Heterodimeric family members include murine
double minute 2 (MDM2), also known as HDM2 in human and MDMX or MDM4 (HDMX

6
or HDM4 in human), breast cancer 1 (BRCA1) and BRCA1-associated RING domain 1
(BARD1), RING1b (known as RNF2) and B-cell-specific moloney murine leukaemia virus
integration site 1 (BMI1) [13, 14]. For heterodimers, one RING domain is used to stabilize
the active E2-binding RING domain and generally lacks ligase activity. The cullin RING
ligase (CRL) superfamily belongs to multi-subunit RING E3s [15].
Members of the RING family E3 ubiquitin ligases play important roles in many
biological processes including DNA repair, cell cycle, apoptosis pathway, lysosome
degradation, and angiogenesis [9]. Several members of these subfamilies have been
associated with various disease pathogenesis including cancer. RING finger E3 ubiquitin
ligases have been implicated either as oncogenes or as tumor suppressors. Many members of
CRL superfamily have been linked to tumor progression including breast cancer, skin cancer,
colorectal cancer and gastric cancer [16]. Likewise various members of the tripartite motif
(TRIM) superfamily are also known for regulating cancer progression. The tumor suppressor
BRCA1 is often mutated in breast and ovarian cancer [17]. Cbl, Cbl-b, and Cbl-c are
members of casitas B-lineage lymphoma (Cbl) RING ubiquitin ligase family that have been
implicated in myeloid lymphoma, breast cancer, gastric cancer, and lung cancer [18-22]. The
oncoprotein MDM2 is upregulated in many cancers targeting ubiquitin-mediated degradation
of tumor-suppressor protein p53 [23].
Metastasis is a critical event during cancer progression and is the foremost causes of
cancer-related mortality. Tumor microenvironment plays a crucial role in metastasis
progression and one such key factor is hypoxia or low oxygen tension [24]. During hypoxia,
the RING finger E3 ubiquitin ligase von Hippel-Lindau (VHL) tumor suppressor protein
(pVHL) is found to be inactivated in clear-cell renal cell carcinoma (ccRCC), thus activating
the hypoxia pathway via hypoxia inducible factor1α (HIF1α) [25]. Another class of RING
7
finger E3 ubiquitin ligases regulating HIF1α stability are the Siah proteins. The role of Siah
proteins in cancer progression and metastasis are elaborated here.
1.3. Siah Proteins and their Roles in Cancer Progression
Human homolog of the Drosophila seven in absentia (sina) protein Siah superfamily of RING
finger E3 ubiquitin ligases has three members- Siah1, Siah2 and Siah3. Structural analysis of
highly conserved Siah proteins reveals that these are dimeric proteins with two novel zinc
fingers. A Siah protein has a divergent N-terminal with a highly conserved catalytic RING
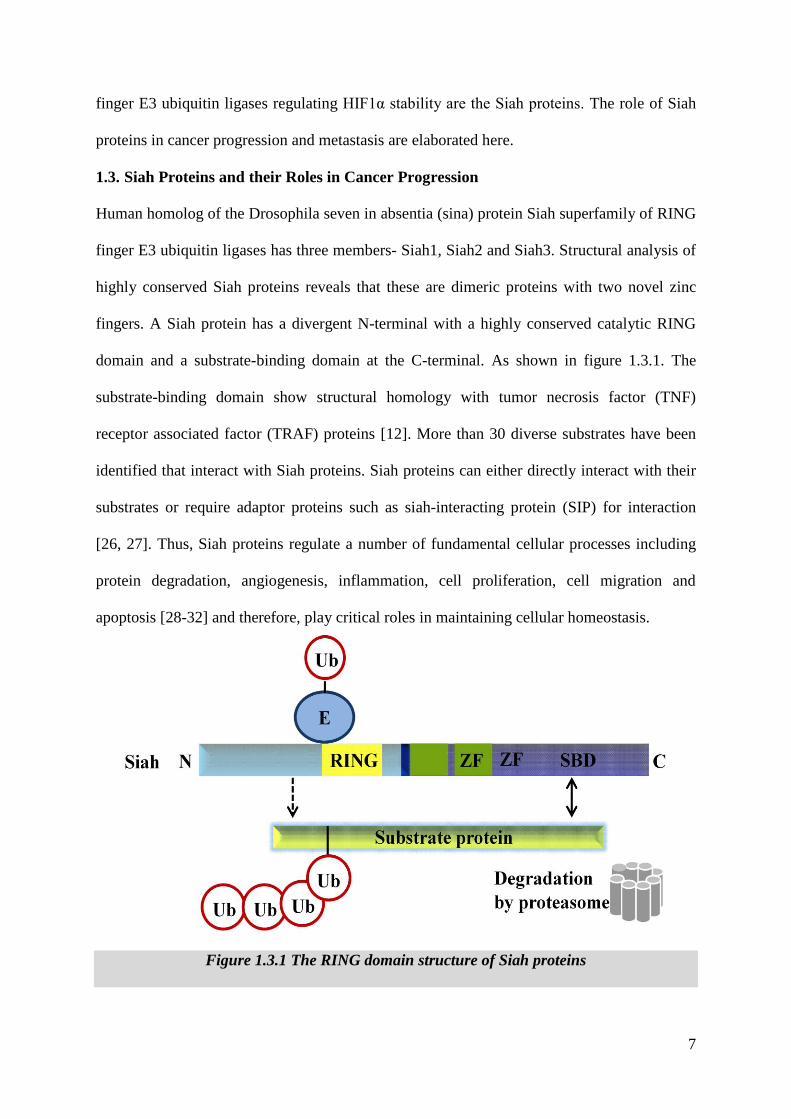
domain and a substrate-binding domain at the C-terminal. As shown in figure 1.3.1. The
substrate-binding domain show structural homology with tumor necrosis factor (TNF)
receptor associated factor (TRAF) proteins [12]. More than 30 diverse substrates have been
identified that interact with Siah proteins. Siah proteins can either directly interact with their
substrates or require adaptor proteins such as siah-interacting protein (SIP) for interaction
[26, 27]. Thus, Siah proteins regulate a number of fundamental cellular processes including
protein degradation, angiogenesis, inflammation, cell proliferation, cell migration and
apoptosis [28-32] and therefore, play critical roles in maintaining cellular homeostasis.
Figure 1.3.1 The RING domain structure of Siah proteins

8
Siah1 and Siah2 proteins regulate the stability of several oncogenic factors such as
prolyl hydroxylases, β-catenin, NUMB, TRAF2, Sprouty2, and CCAAT/enhancer-binding
protein delta (C/EBPδ) [26, 27, 33-35]. Specifically in hypoxic microenvironment, Siah2
regulates the hippo signalling pathway that plays a critical role in tissue growth and results in
survival and growth of hypoxic tumor cells [36]. Siah3, the newest member in the Siah
family, however, has not been functionally characterized yet. Siah1 and Siah2 have
oncogenic functions in animal models, while in vitro cell-based assays suggest tumor-
promoting roles for Siah2 and apoptosis-inducing role for Siah1 [37]. As both proteins have
structural similarity, they often show functional redundancy. As a result, some substrates are
targeted by both Siah proteins while some are targeted by one and not by the other. This
redundancy can be attributed to either post-translational modification of these proteins or
their subcellular localization. [37].
In spite of the increasing research interest on Siah proteins, there are very few reports
on their transcriptional regulation during disease processes including cancer. Siah2 is
transcriptionally upregulated by estrogen in estrogen-responsive breast cancer [38]. Wnt5α
induces Siah2 expression in colon cancer cells [39]. Hypoxia, which is known to induce
Siah2, [34] does so by inducing the p38 MAPK and Akt pathways [40, 41]. Siah1 is
transcriptionally induced by E2F1, p53 and Sp1 and causes apoptosis [42, 43]. Surprisingly,
there has not been any study to understand the mechanism of expression of Siah2 proteins in
gastric cancer cells (GCCs), while only one study has shown that Siah1 has a rare inactivating
mutation in gastric cancer tissue [44]. Thus, the role of Siah1 in regulating gastric cancer is
not possibly limited to its tumor-suppressive role. This notion is further potentiated by studies
on animal models which portray Siah1 as a tumor-promoter [37].
9
1.4. Gastric Cancer
Stomach cancer is the fifth lethal malignancy in the world and its poor prognosis makes it the
third leading cause of cancer-related mortality [45]. Developing countries such as Asia, Latin
America, central and eastern Europe have very high burden of gastric cancer as compared to
the developed countries like North America and western Europe where it is no longer a
common cancer [46]. It is twice more prevalent in males in the developing countries as
compared to females [47]. Helicobacter pylori (H. pylori) infection is considered as the
greatest risk factor for causing gastric carcinogenesis along with environmental factors, host
and bacterial genetic polymorphisms. Diet and smoking habit also play roles in causing this
disease [48]. Adenocarcinoma is the most common type of stomach cancer originating from
the glandular cells of the stomach lining. Lauren has classified adenocarcinoma into two
types i.e. intestinal and diffuse according to the histological features [49].
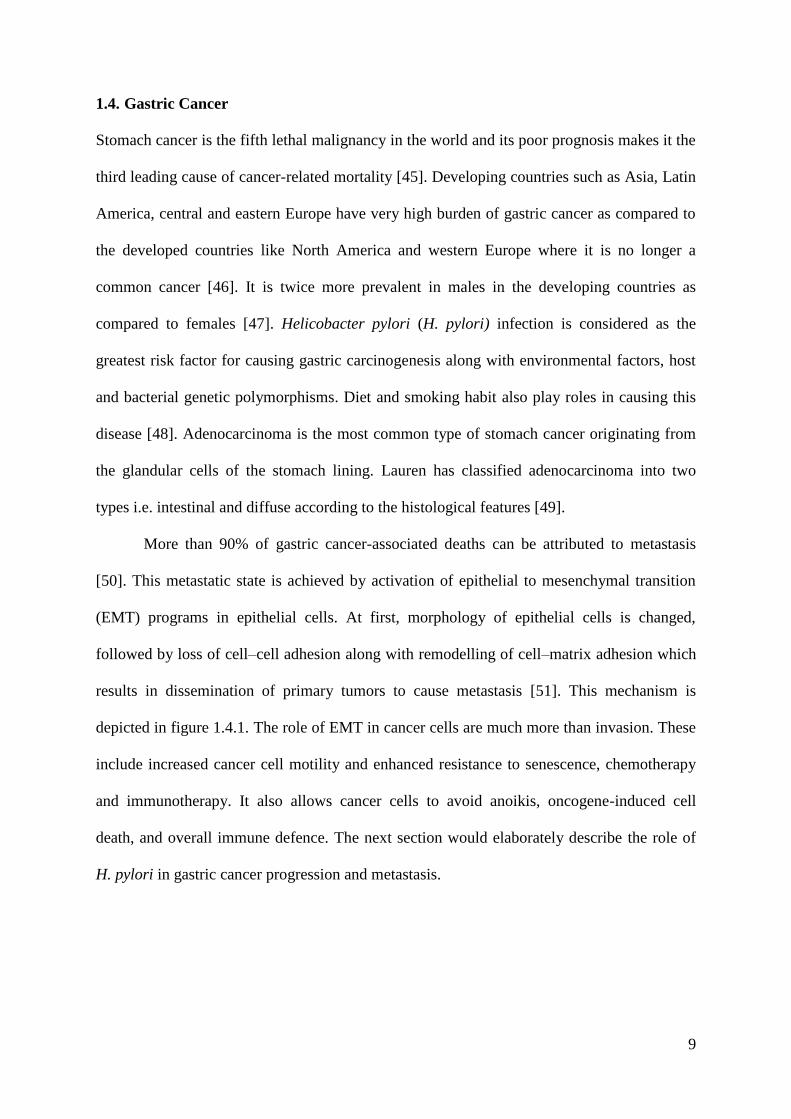
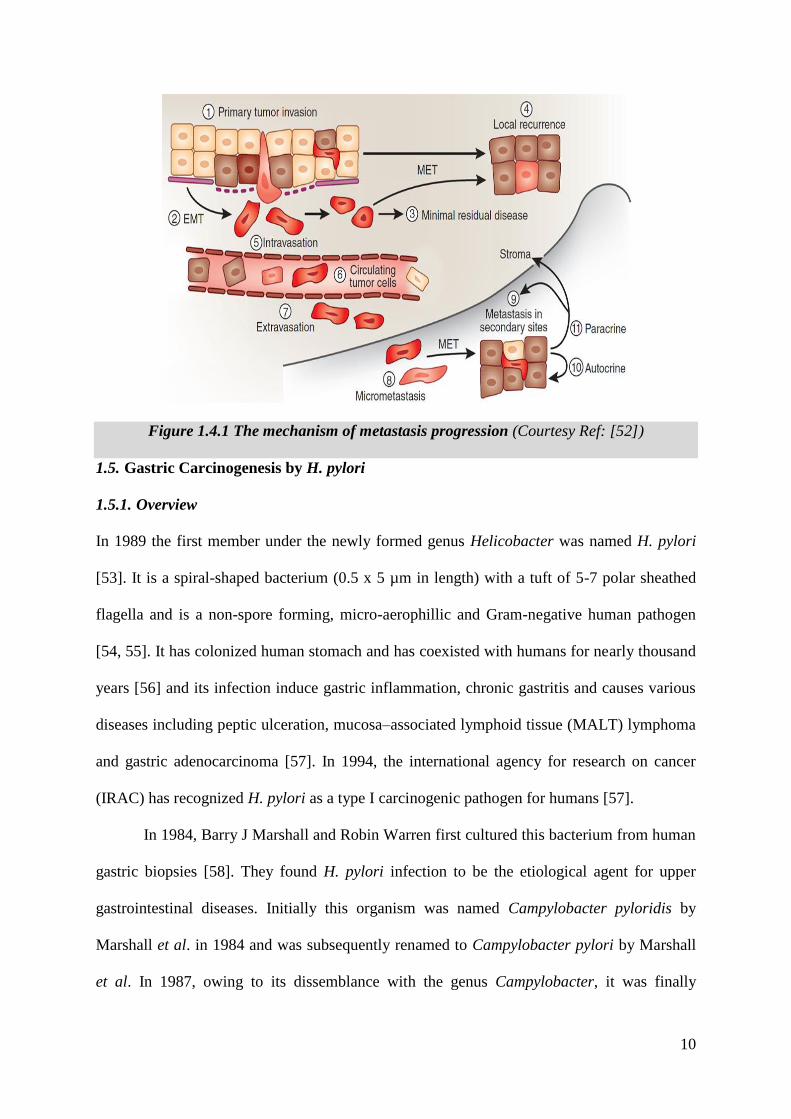
More than 90% of gastric cancer-associated deaths can be attributed to metastasis
[50]. This metastatic state is achieved by activation of epithelial to mesenchymal transition
(EMT) programs in epithelial cells. At first, morphology of epithelial cells is changed,
followed by loss of cell–cell adhesion along with remodelling of cell–matrix adhesion which
results in dissemination of primary tumors to cause metastasis [51]. This mechanism is
depicted in figure 1.4.1. The role of EMT in cancer cells are much more than invasion. These
include increased cancer cell motility and enhanced resistance to senescence, chemotherapy
and immunotherapy. It also allows cancer cells to avoid anoikis, oncogene-induced cell
death, and overall immune defence. The next section would elaborately describe the role of
H. pylori in gastric cancer progression and metastasis.
10
Figure 1.4.1 The mechanism of metastasis progression (Courtesy Ref: [52])
1.5. Gastric Carcinogenesis by H. pylori
1.5.1. Overview
In 1989 the first member under the newly formed genus Helicobacter was named H. pylori
[53]. It is a spiral-shaped bacterium (0.5 x 5 µm in length) with a tuft of 5-7 polar sheathed
flagella and is a non-spore forming, micro-aerophillic and Gram-negative human pathogen
[54, 55]. It has colonized human stomach and has coexisted with humans for nearly thousand
years [56] and its infection induce gastric inflammation, chronic gastritis and causes various
diseases including peptic ulceration, mucosa–associated lymphoid tissue (MALT) lymphoma
and gastric adenocarcinoma [57]. In 1994, the international agency for research on cancer
(IRAC) has recognized H. pylori as a type I carcinogenic pathogen for humans [57].
In 1984, Barry J Marshall and Robin Warren first cultured this bacterium from human
gastric biopsies [58]. They found H. pylori infection to be the etiological agent for upper
gastrointestinal diseases. Initially this organism was named Campylobacter pyloridis by
Marshall et al. in 1984 and was subsequently renamed to Campylobacter pylori by Marshall
et al. In 1987, owing to its dissemblance with the genus Campylobacter, it was finally

11
assigned to anew genus Helicobacter and was renamed as Helicobacter pylori in 1989 by
Goodwin et al [53]. Half of the world‟s population are infected with H. pylori but only 3% of
the infected individuals develop gastric cancer. In the majority of cases with H. pylori
colonization there is an increase in inflammatory and immune responses against the bacteria
and if untreated, the infection persists for decades. Infection with H. pylori can predispose to
two equally exclusive conditions. In some cases, infection becomes chronic and leads to
corpus-predominant gastritis, which includes stimulation of gastric inflammation resulting in
the degradation of normal gastric glands and replacement with intestinal-type epithelium
resulting in atrophic gastritis followed by intestinal metaplasia, hypochlorhydria and finally
gastric cancer [59]. As illustrated in figure 1.5.1.1. In some cases, it can also lead to
pangastritis or duodenal ulcer where an antrum-predominant gastritis leads to
hyperchlorhydria. This difference in outcome depends on differences among individual host
response to H. pylori infection or host genetic polymorphisms, genotypes of H. pylori strains,
environmental factors like high salt diet, smoking habit and certain gastric commensal
organisms [60].
Polymorphisms within the host innate immune factor encoding genes are crucial in
pathogenesis. Polymorphism in the cytokine genes results in inter-individual disparity
towards cytokine responses that contributes to an array of clinical outcome in H. pylori-
infected individuals [61]. Studies so far have reported about polymorphism of the genes
encoding IL-1β, TNFα, IL-8, IL-17 and IL-10 or their receptors to modulate the risk of
gastric cancer [62]. Similar risk for gastric cancer is also involved in hosts with
polymorphism of genes involved in TLR signalling pathway [63]. Genes of several virulence
factors of H. pylori such as cytotoxin-associated gene A (CagA), vacuolating cytotoxin A
(VacA), outer inflammatory protein A (OipA), Helicobacter-specific outer membrane

12
proteins O and Q (HopO and HopQ) and the induced by contact with epithelium A (IceA)
show genetic variability and play critical roles in disease pathogenesis.
Figure 1.5.1.1 Disease pathogenesis by H. pylori (Courtesy: Ref [64])
1.5.2. Epidemiology and routes of transmission
H. pylori infection is global. While one-third of adults are infected in the north European and
north American population, its prevalence is more than 50% in the south and eastern Europe,
south America and Asia. Infection is mostly acquired during childhood where lower
socioeconomic status has a higher risk of carrying the infection (Helicobacter ISSN 1523-
5378). Direct transmission may occur via oral-oral, gastro-oral or faecal-oral route, whereas
indirect transmission may occur through contaminated food, water and raw milk of animals
(such as sheep and cow) [65].
1.5.3. Pathogenesis
The bacterium mostly adheres to the gastric epithelial lining of the antral region of the
stomach. Following transmission, bacteria have to avoid host defence mechanism and
therefore, follow a complex adaptation process to successfully colonize inside the human
stomach. Urease enzyme produced by H. pylori and polar sheathed flagella helps initially in
the colonization process. H+-gated urea channel UreI controls the urease release [66].The
enzyme hydrolyzes urea into carbon dioxide and ammonia, resulting in an increase in the pH

13
of gastric mucosa and in the immediate vicinity of the bacterium. This allows the bacteria to
neutralize gastric acidity and to persist in the highly acidic gastric lumen [66]. The spiral
structure and flagella help H. pylori to swim through and penetrate the surface epithelium of
the stomach where the more neutral pH favours for its successful colonization and growth.
H. pylori adhere to the microvilli-containing regions of mucus-secreting gastric
epithelial cells via bacterial adhesins that interact with the host cell receptors. H. pylori
adhesin-mediated colonization depends on multiple factors. Initial adherence of H. pylori to
the gastric epithelium occurs through glycolipids or through the Lewis b antigen. This
increases expression of sialic acid glycoproteins, which allow tighter binding of H. pylori to
the epithelial cell surface. A few well-described adhesins are blood group antigen-binding
adhesin (BabA), sialic acid-binding adhesin (SabA), adherence-associated lipoprotein A and
B (AlpA/B), H. pylori adhesion A (HpaA), heat shock protein 60 (Hsp60), neutrophil
activating protein (Nap), Catalase, OipA and HopZ. While the outer membrane protein of H.
pylori BabA binds to Lewis b antigen of the host receptor, SabA is a sialic acid-binding
adhesin and functions as a hemaglutinin whereas laminin is a target of both AlpA/B. The
binding receptor for other adhesins still remains to be identified [67]. After the bacteria gets
tightly adhered to the gastric epithelial cell, actin filament polymerization and cytoskeletal
rearrangements take place followed by formation of pedestal and cup-like projections.
Some strains of H. pylori are more virulent than others and develop more clinical
complications post infection. Although H. pylori possess a number of virulence factors, two
classical virulence determinants expressed by H. pylori are the CagA protein encoded by the
cag pathogenicity island (cag PAI) and the VacA). Based on whether the H. pylori strains
express CagA or not, they are broadly classified into two families i.e. CagA-positive and
CagA-negative strains. CagA is the strongest virulence factor within the cag PAI. The CagA-
negative strain is less virulent.

14
The cag PAI is nearly 40 kb DNA insertion element inserted in the chromosomal
glutamate racemase gene flanked by 31 bp direct repeats and encodes between 27-31 proteins
[68]. The 140 kDa CagA protein is a terminal gene product of the cag PAI. After H. pylori
adheres to the epithelial surface of the host cells, the cag PAI encodes a type IV secretion
system (T4SS) that forms a syringe-like structure and penetrates the gastric epithelial cells
facilitating the translocation of CagA and other bacterial virulence proteins into the
eukaryotic cells. After translocation into the host cells, the CagA is tyrosine (tyr)
phosphorylated at the glutamate-proline-isoleucine-tyrosine-alanine (EPIYA) motif gets
converted into Cag AP-Tyr
[60]. Phosphorylation of the EPIYA motif of CagA triggers
numerous cellular signaling pathways in the infected gastric epithelial cells leading to the
expression of proinflammatory cytokines and chemokines along with deregulation of
signalling pathways that control cell morphology, adhesion and transformation resulting in
“the hummingbird phenotype” [69]. This morphological feature makes H. pylori-infected
cells more motile. Even if CagA is nonphosphrylated, it may lead to aberrant catenin
activation, disruption of intercellular junctions and loss of epithelial cellular polarity [70].
The other important virulent factor VacA also contributes towards change of epithelial cell
structure and function. It triggers a series of events leading to the modification of
endolysosomal trafficking followed by cellular vacuolation, immune cell inhibition,
mitochondrial damage and apoptosis [62, 71, 72]. One of the important events during
persistent H. pylori colonization and gastric cancer progression is the disruption of tight
junctions and cellular transformation. The next section describes intracellular adhesion, its
significance in cancer invasion and metastasis followed by the role of H. pylori on these
junctions.

15
Figure 1.5.3.1 Major virulence factors of H. pylori (Courtesy: Ref [64])
1.6. Intercellular Junctions and their Roles in Cancer Invasion and Metastasis
1.6.1. Intercellular junctions
A number of intercellular junctions are present in vertebrates that help in adhesion between
epithelial cells. These are tight junctions (TJs), cadherin-based adherens junction (AJs)
(attached to the actin cytoskeleton), gap junctions (which allow chemical interactions
between neighbouring cells), desmosomes (help in connecting to the intermediate filament of
cytoskeleton), cell-extracellular matrix interactions mediated by integrins and other
molecules [73]. As illustrated in figure 1.6.1.1. These are together known as the intercellular
junctional complexes and play important roles in integrating a number of cellular processes
that include maintainance of cytoskeletal dynamics to cellular proliferation, transcription, and
differentiation [73, 74]. AJs also called zonula adherens are an important component of cell-
cell junctions and are key features of all epithelial sheets. They also transfer signal from the
environment to the inside of cells. Cadherins are the most important components present in
the transmembrane core of AJs. In most solid tissues, they cluster at sites of cell-cell contact
16
[73]. There are nearly 80 members of cadherin super-family which includes classic cadherins,
desmogleins, desmocollins, protocadherins, cadherin-related neuronal receptor (CNRs), fat-
related cadherins, seven-pass transmembrane cadherins, and receptor tyrosine kinase (RET).
These classical cadherins are the main intermediaries of calcium-dependent cell–cell
adhesion [75]. Classical cadherins have five ectodomains which are responsible for binding
with calcium ion and these domains are also responsible for homophilic interactions between
epithelial cadherins (E-cadherins) of adjacent cells. Thus cadherins provide a strong adhesive
link between cells [73, 76, 77]. The inner cytoplasmic tail of the cadherin is responsible for
forming the nexus with the cytoskeleton β-catenin and p120 catenin. α-catenin acts as a
bridge for binding β-catenin to actin and several actin-associated proteins that help E-
cadherin to modulate actin filament organization. Binding of microtubules to cadherin occurs
through p120 catenin. It also prevents cadherin endocytosis and degradation. Intra or inter
cellular signals generated can also be transduced to the nucleus to alter gene expression
Through the cytoplasmic tails of E-cadherin [78]. Adenocarcinoma is of epithelial origin and
loss of epithelial characteristics from the original tissue along with appearance of
mesenchymal cells is an important hallmark of advanced cancers. During invasion phase,
cancerous cells must lose their structural integrity to attain a mesenchymal phenotype [79].
Hence, irrespective of signalling pathways that may get activated in one or the other tumor
types, these events must ultimately result in loosening of intercellular junctions.

17
Figure 1.6.1.1 Adherens junction of epithelial cell (Courtesy: Ref [80])
1.6.2. Role of cadherins and β-catenin during cancer invasion
Cell-cell adhesions are degraded in epithelial cells during EMT. As reported in several
tumors, reduced expression of E-cadherin along with an increased N-cadherin expression lead
to cell detachment from epithelial clusters during EMT [81-83]. Several groups have
demonstrated that overexpression of E-cadherin in epithelial tumor cells result in the reversal
from an invasive, mesenchymal phenotype to a benign, epithelial phenotype [84, 85]. Active
turnover of E-cadherin can occur through clathrin-mediated endocytosis that is critical for
rapid transition between epithelial and mesenchymal states [78].
In 1989, β-catenin was identified as a binding partner of E-cadherin by Nagafuchi and
Takeichi [86]. In vertebrates, two separate pools of β-catenin with two different cellular

18
functions have been reported- one is the membrane-bound pool and the other one is the
cytoplasmic pool [87, 88]. Membrane β-catenin is involved in cell-cell adhesion. Cadherin
mutants lacking the β-catenin-binding domain are often poorly adhesive suggesting their
importance in cadherin function. Similarly, mutations in β-catenin results in loss of E-
cadherin function with reduced cell-cell adhesion [89]. Loss of E-cadherin-catenin complex
also promotes cancer progression in humans [90].
The non-membranous cytoplasmic-nuclear pool of β-catenin function is cadherin-
independent and functions as transcriptional activator in Wnt/ β-catenin signalling pathway
[91]. The Wnt/β-catenin signaling pathway activates transcription factors or cellular activities
such as cell proliferation and differentiation or maintenance of stemness [92]. The canonical
Wnt/β-catenin signaling pathway is activated through the binding of insoluble Wnt protein to
its cell surface receptor frizzled (FZD) and co-receptor low density lipoprotein receptor-
related protein 5/6 (LRP5/6) complexes. This complex deactivates GSK-3β via intracellular
protein dishevelled (Dvl). Inactivated GSK-3β results in stabilization of transcription cofactor
β-catenin making it free from the destruction complex to enter inside the nucleus and interact
with transcription factors of the T cell factor 4 (TCF 4) /lymphoid enhancer factor (LEF)
family to initiate transcription of Wnt target genes [93]. In the absence of Wnt signaling
cascade, the destruction complex formed with the participation of proteins Axin-APC-GSK3β
ubiquitinates β-catenin via the ubiquitin ligase β-transducin repeat-containing protein (β-
TrCP) and leads to proteasome mediated degradation of β-catenin [92]. So far, various
studies have reported the role of Wnt/ β-catenin signalling pathway in gastric cancer
progression [94, 95]. This is shown in figure 1.6.2.1.

19
Figure 1.6.2.1 Cadherin-bound β-catenin in cell-cell adhesion and cytoplasmic β-
catenin in Wnt signalling (Courtesy: Ref [90])
The critical role H. pylori play in regulating tight junctions, and E-cadherin-catenin
complex during gastric cancer progression is now illustrated. H. pylori disrupt the
intercellular apical junctions of epithelial cells by targeting the epithelial adhesion receptors,
E-cadherin and specific cellular receptors and stimulate various signalling pathways to
degrade the tight junctions [62]. The virulent factor CagA interacts with junction proteins like
E-cadherin and zona occludens 1 (ZO-1), and alters the TJs or AJs in a phosphorylation-
independent manner. The unphosphorylated form of CagA disrupts the cell-cell junction and
results in loss of cell polarity whereas the phosphorylated form of CagA deregulates multiple
signalling pathway cell shape and adhesion. The high temperature requirement A
(HtrA) proteases secreted by H. pylori cleave E-cadherin [96]. Thus the displaced E-

20
cadherin, via Akt-dependent inactivation of the β-catenin inhibitor, GSK3β releases the
oncogenic protein β-catenin [97]. The released oncogenic protein β-catenin gets accumulated
in the perinuclear endocytic recycling compartment and upon Wnt activation is translocated
to the nucleus and activates the β-catenin-mediated signalling pathways that alter the gastric
epithelial cells [98].
Figure 1.6.2.2 Disruption of epithelial junction by H. pylori (Courtesy: Ref [98])
1.6.3. RING finger E3 ubiquitin ligases regulate E-cadherin-catenin complex during
cancer metastasis
The RING finger ubiquitin ligase Hakai was the first E3 ubiquitin identified that target cell
membrane-bound E-cadherin as well as β-catenin [99]. It ubquitinates E-cadherin leading to
the internalization of the E-cadherin complex and enhances migration of the Madin Darby
canine kidney (MDCK) epithelial cells [99, 100]. The fate of cadherin-bound β-catenin after
the complex is dissociated from the AJ is still not clear but is considered to be either
21
degraded or recycled [101]. Another E3 ubiquitin ligase, Ozz-E3, ubiquitinates only the
membrane-bound, but not cytosolic β-catenin at the sarcolemma and causes its proteasomal
degradation [102]. However, the effect of Siah proteins on AJs and therefore, on metastasis is
not known.
1.7. Objectives
In light of the above-mentioned information, the following objectives were set-
1. To study expression of Siah proteins in the H. pylori-infected gastric epithelium
2. To decipher factors regulating expression of Siah proteins during H. pylori infection
3. To identify target molecules regulated by Siah proteins and their roles in gastric
cancer

22
MATERIALS AND METHODS
Chapter 2
23
2. MATERIALSAND METHODS
2.1. Materials Used
2.1.1. Cell lines
The human gastric cancer cells (GCCs) MKN45, AGS, Kato III and NCI-N87 were procured
from the University of Virginia, USA. The immortalized non-neoplastic human gastric
epithelial cell HFE145 was received as a gift from Dr. Hassan Ashktorab, Department of
Medicine, Howard University, USA. Details of several stable cell lines generated in our lab
are mentioned later.
2.1.2. H. pylori strains
Three strains of H. pylori were used in this study: H. pylori 26695, a cag PAI (+) strain;
strain 8-1, a cag PAI (-) strain (both strains were obtained from the University of Virginia,
USA) and strain D154, a cag PAI (-) strain (received from the archived collection of H.
pylori strains at National Institute of Cholera and Enteric Diseases, Kolkata, India).
2.1.3. Competent cells
For cloning of plasmids, Subcloning Efficiency DH5α Competent Cells (#18265017,
Invitrogen, USA) were used. For cloning after site-directed mutagenesis, XL10-
Gold Ultracompetent cells (#200314, Agilent, USA) were used.
2.1.4. Human gastric cancer biopsy specimen
Gastric biopsy samples (from the antral gastric mucosa) were collected from gastric cancer
patients undergoing diagnostic esophagogastroduodenoscopy following a National Institute
of Science Education and Research (NISER) Review Board-approved protocol (under the
supervision of Prof. S.P Singh, SCB Medical College and pathologically certified by Prof.
Niranjan Rout, AHRCC) and investigation were carried out in accordance with the
Declaration of Helsinki (2013) of the World Medical Association. Written informed consent
was obtained from all patients prior to the study.

24
2.1.5. Plasmid constructs, siRNAs and antibodies
A list of all plasmid constructs, siRNAs and antibodies used in this research are mentioned in
appendix I, II and III respectively.
2.1.6. Reagents, kits, and instruments
For cell culture: Roswell park memorial institute (RPMI)-1640 media containing L-
Glutamine and Sodium bicarbonate (#AL028A, HiMedia, INDIA), Fetal bovine serum (FBS)
(#RM9970, HiMedia), 0.25%Trypsin, 0.02% EDTA in Ca++
-Mg++
-free Dulbecco‟s phosphate
buffered saline (DPBS) solution (#TCL007, HiMedia), Dimethyl sulfoxide (DMSO)
(#TC185, HiMedia), MG132 (#M7449-200UL, Sigma-Aldrich, USA), Penicillin-
Streptomycin solution (#P0781, Sigma-Aldrich), 1X PBS buffer (#SH30256.02, HyClone,
USA), Difco Bacto agar (#214010, BD, USA).
For H. pylori culture: Trypticase soy agar w/5% sheep blood (TSA) plates (#221239, BD
BBL, USA), Brucella broth (#211088, BD BBL).
For bacterial culture: Ampicillin sodium salt (#194526, MP Biomedicals, USA), Glycerol
(#RM1027-1LTR, HiMedia), SOC media (#15544034, Invitrogen), Luria Bertani Agar,
Miller (#M1151-500G, HiMedia), Luria Bertani Broth, Miller (#M1245-500G, HiMedia).
For polymerase chain reaction (PCR) RNA/DNA: TaqMan universal PCR master mix
(#4304437, Applied Biosystems, USA), human Siah1 TaqMan gene expression assay reagent
(#Hs00361785_m1, Applied Biosystems), human Siah2 TaqMan gene expression assay
reagent (#Hs00192581_m1, Applied Biosystems), Eukaryotic 18S rRNA (#Hs03003631_g1,
Applied Biosystems), Platinum Taq DNA polymerase High Fidelity (#11304011, Invitrogen),
Amplitaq Gold 360 DNA polymerase (#4398823, Invitrogen), Taq DNA polymerase
(#M0273S, New England Biolabs, USA), 10mM DNTP mix (#18427088, Invitrogen),
Betaine solution (#B0300-1VL, Sigma-Aldrich), 10X TE buffer pH8.0 (#ML012-500ML,
HiMedia), 50X TAE (#ML012-500ML, HiMedia), Ethidium bromide solution (#MB074-

25
10ML, HiMedia), Agarose (#0219398425-25 g, MP Biomedicals), Gel loading dye, blue
(6X) (B7021S, New England Biolabs), 1 kb DNA Ladder (#N3232S, New England Biolabs),
50 bp DNA Ladder (#N3236S, New England Biolabs).
For cloning: HindIII (#R0104S, New England Biolabs), XhoI (#R0146S, New England
Biolabs), KpnI (#R0142S, New England Biolabs), Quick ligation kit (#M2200S, New
England Biolabs), T4 DNA ligase (#M0202S, New England Biolabs).
For transfection and stable cells: Lipofectamine2000 (#11668019, Invitrogen),
Lipofectamine 3000 (#L3000015, Invitrogen), G418 (#G8168-10ML, Sigma-Aldrich),
Cloning Disc (#Z374458-100EA, Sigma-Aldrich).
For immunoblotting: 100X protease inhibitor (ML051-1ML, HiMedia), 2X Laemmli buffer
(#ML021, HiMedia), β-Mercaptoethanol (#MB041-500ML, HiMedia), 10X
Tris/Glycine/SDS buffer (#1610732, BIO- RAD), 10X Tris/Glycine buffer (#1610771, BIO-
RAD), SDS (#MB010-500G, HiMedia), 30% Acrylamide/Bis solution (#1610156, BIO-
RAD, USA), Resolving gel buffer (#1610798, BIO- RAD), Stacking gel buffer (#1610799,
BIO-RAD), Glycerol (#MB 060-500ML, HiMedia), TEMED (#1610800, BIO- RAD),
Ammonium persulfate (#1610700, BIO- RAD), BLUelf prestained protein ladder (#BM008-
500, BR Biochem, India), 10X TBS (ML029-5X100ML, HiMedia),10X PBS (ML023-
2X500ML, HiMedia), Polyvinylidenedifluoride membrane (PVDF)(#IPVH00010, Millipore,
India), Tween 20 (RM156-500G, HiMedia), BSA Cohn fraction V (#RM3151, HiMedia),
Skim milk powder (#RM1254-500G, HiMedia), Restore plus western blot stripping buffer
(#46430, ThermoFischer scientific, USA), SuperSignal west femto maximum
sensitivity substrate (#34095, ThermoFischer scientific).
For chromatin immunoprecipitation assay and immunoprecipitation assay: 37%
formaldehyde (#MB059-500ML, HiMedia), Protein A/G PLUS-Agarose (#sc-2003, Santa
Cruz Biotechnology).

26
For DNA binding assay: Dynabeads M-280 Streptavidin (#11205D, Invitrogen), DynaMag-2
Magnet (#12321D, Invitrogen).
For tissue sectioning: Poly-L-lysine solution (#P8920-100ML, Sigma Aldrich), Tissue
Freezing Medium (#3808609E, Leica, Germany). Fluoromount G (#0100-01, Southern
Biotech, USA).
For soft agar assay: Bacto agar (#199835, MP Biomedicals), Dulbecco's Modified Eagle
Medium/ Nutrient Mixture F-12 Ham (DMEM/ F12, 1:1 mixture) media (#AT140A,
HiMedia).
For transwell migration and invasion assay: Growth Factor Reduced BD Matrigel, 8 µm
inserts (# 354483, BD Biocoat), Tissue Culture-treated, 8 µm inserts for 24-well plates (#
353097, BD Biocoat).
Kits: Genomic DNA isolation kit- FlexiGene DNA Kit (#51204, Qiagen,USA), Gel
extraction kit- QIAquick gel extraction kit (#28706, Qiagen), PCR purification kit- (#28104,
Qiagen). Miniprep Kit- QIAprep Spin Miniprep Kit (#27106, Qiagen), Maxiprep kit-
(#43776, Qiagen), Site-directed mutagenesis- Quick change multi Site-directed mutagenesis
kit (#200517, Agilient technology), Nuclear and cytoplasmic extraction reagents- NE-PER
(#78833, ThermoFischer Scientific), Qiagen RNeasy mini kit- (#74106, Qiagen), SuperScript
First-Strand c-DNA Synthesis kit- (#11904-018, Invitrogen), QuikChIP chromatin
immunoprecipitation kit- (#30101K, Imgenex, India), QuikChIP DNA purification kit-
(#30401K, Imgenex), Dual-Luciferase Reporter Assay- (#E1910, Promega)
Instruments: Cell culture Hood (Model No. Cell Gard ES NU-480-400E Class II, Nuaire,
USA), Cell culture incubator (New Brunswick Galaxy 170R, Eppendorf, Germany),
Centrifuge (Sorvall Biofuge Stratos, Model No. D35720, Thermo Scientific), UV/Vis
spectrophotometer (Model No-DU 720 General purpose UV/Vis spectrophotometer,
Beckman Coulter),Centrifuge (Model No. 5415-R, Eppendorf), PCR (PCR Mastercycler pro

27
vapo. protect, Eppendorf), Mini-protean tetra system gel apparatus (Model No. 165-8003,
Bio-Rad), mini transblot cell wet transfer apparatus (Model No. 170-3940, Bio-Rad),
transblot sd semidry blot apparatus (Model No.170-3940, Bio-Rad), ChemiDoc XRS (Model
No. 1708265, Bio-Rad Laboratories, USA), Real Time-RT PCR (Model No7500, Applied
Biosystem), Cryostat (Model No. LEICA CM3050 S, Leica Biosystems), Fluorescence
microscope (Model No.BX51, Olympus Co., Japan), Laser scanning confocal microscope
(Model No.LSM 780, Carl Zeiss, Germany), Bright field inverted microscope (Primo vert,
Carl Zeiss).
2.2. Methodology
2.2.1. Culture of human gastric cancer cells (GCCs) MKN45, AGS, KatoIII and
immortalized normal gastric epithelial cells HFE145
MKN45, AGS, KatoIII and HFE145 were maintained in RPMI-1640 media supplemented
with 10 % FBS (heat-inactivated). All cells were cultured in T-75 flasks and incubated inside
a 37oC incubator maintaining 5% CO2 and 95% humidity.
For passaging, the old media was decanted off from the T-75 flask and adherent
gastric cancer cells were treated with 3 ml of prewarmed trypsin-EDTA solution. The trypsin-
EDTA-treated flask was placed inside the incubator with 5% CO2 at 37oC for 5 minutes to
detach cells from the flask. Sterile serological pipettes were used to gently dislodge cells
from the flask and to add in a centrifuge tube containing fresh complete media. Cells were
counted using a Neubauer improved haemocytometer under an inverted microscope followed
by its centrifugation at 300xg for 8 minutes at room temperature (RT). Resuspension of the
cell pellet was done in a small volume of medium followed by seeding in fresh T-75 flasks.
2.2.2. Cell freezing and revival
Cell freezing was performed usually at a lower passage number when cells became confluent
(70-80%) from the previous passage. A confluent T-75 flask was trypsinized with 3 ml of
28
prewarmed trypsin-EDTA solution and trypsinized cells were added in a centrifuge tube to
fresh complete media. Cells were pelleted at 300xg for 8 minutes at 4oC. Supernatant was
discarded and cell pellet was resuspended in freezing mix (20% DMSO in FBS). Cells were
aliquoted into freezing vials and kept overnight at -80 oC followed by storage at liquid
nitrogen for long term preservation.
2.2.3. H. pylori culture and infection of cells
H. pylori were grown on TSA plates and were incubated at 37ºC in a microaerophilic
environment of 90 % N2, 1% O2, 10 % CO2. After 48-72 h of incubation, colonies grown on
plates were inoculated in brucella broth supplemented with 10 % heat-inactivated FBS. After
18 h of incubation, an aliquot of bacteria in broth was taken for OD in a spectrophotometer.
OD600 0.3 was equivalent to 2x10⁸ CFU/ml. Culture that reached OD between 0.5 to 1 was
pelleted at 300xg for 10 min at 4oC and used to infect GCCs after resuspending bacteria in
complete RPMI-1640 media to reach desirable multiplicity of infection (MOI).
2.2.4. Cloning, expression and site-directed mutagenesis
2.2.4.1. Cloning of human siah1 gene
Primer design: Primers were designed for cloning of human siah1 gene (GenBank:
BC044920.1) by using Integrated DNA Technology (IDT) software. A Detailed list of
primers is given in Appendix IV)
Human genomic DNA isolation: Human genomic DNA was isolated from AGS cells using
Qiagen flexi gene DNA kit as instructed by the manufacturer. Amplification of siah1 gene
(848 bp) from genomic DNA was performed as follows.
Polymerase chain reaction (PCR): siah1 gene was amplified from human genomic DNA
isolated from AGS cells using Platinum Taq DNA polymerase High Fidelity (HIF). PCR was
set up using the following reaction mixture: 5 µl 10X HIF buffer (1X), 1 µl 10 mM dNTP
(0.2mM), 2 µl 50 mM MgSO4 (2.0 mM), 1 µl forward primer (10 pmole) 1 µl reverse primer

29
(10 pmole), 1 µl genomic DNA (250 ng), 0.5 µl HIF Taq polymerase, 38.5 µl H2O. The
reaction condition for PCR is mentioned in Appendix V. The amplified PCR product (848
bp) was run on 1.2% agarose gel to qualitatively examine the desired PCR product.
Agarose gel electrophoresis and gel extraction of the PCR product: To isolate and purify the
desired DNA of siah1, agarose gel electrophoresis was performed with the amplified PCR
product. 0.8% agarose gels were prepared in 1X TAE buffer and 0.5 μg/ml ethidium bromide
was added. The gel was run at 90 V for 30 min in a horizontal electrophoresis unit and band
position of DNA along with its corresponding molecular weight markers in the gel was
visualized using an ultraviolet (UV) transilluminator. The amplified siah1 PCR product in the
agarose gel was excised by using a scalpel. The gel was weighed and to one gel volume three
volumes of QG buffer was added. The mixture was incubated at 50oC for 10 min and
vortexed at every 2-3 min for a complete dissolution of the gel. To the mixture, one gel
volume of isopropanol was added and mixed. The sample was loaded to the spin column and
incubated for 2 min. The column was subsequently centrifuged for 1 min at 16,100xg and the
flow through was discarded. 0.5 ml of QG buffer was added to the column and was
centrifuged for 1 min at 16,100xg and the flow through was discarded. The column was then
incubated with 0.75 ml of buffer PE for 2 min and was centrifuged at top speed for 1 min.
Finally, 30 μl EB buffer was added to the column and DNA was eluted into a fresh
microcentrifuge tube by centrifuging at top speed for 1min. The purified PCR product was
subjected to restriction digestion.
Restriction digestion of purified PCR product: HindIII (on the F primer) and XhoI (on the R
primer) were used to clone siah1 in pcDNA3.1+
vector. Restriction digestion of the PCR
product and vector was performed using1 μg of template DNA in a 37oC water bath for 3 h.
For restriction digestion, the following reaction mixture was used: 5 µl 10X buffer 2 (1X),
0.5 µl XhoI (20,000 U/ml NEB), 0.5 µl HindIII (20,000 U/ml NEB), 15 µl PCR product (1

30
μg), 29 µl H2O. The following reaction mixture was used for restriction digestion of the
empty vector: 5 µl 10X buffer 2 (1X), 0.5 µl XhoI (20,000 U/ml NEB), 0.5 µl HindIII
(20,000 U/ml NEB), 1 µl pcDNA3.1+ (1 μg), 43 µl H2O. The digested PCR product and
vector was then purified using PCR purification kit.
Purification of restriction digested product: The restriction digested products were subjected
to purification using PCR purification kit. Five volumes of buffer PB1 was added to one
volume of restriction digested products, mixed and was applied to QIAquick column. The
column was centrifuged at 16,100xg for 1 min and the flow through was discarded. 0.75 ml
PE buffer was added to the column and centrifuged for 1 min at 16,100xg. At the final step,
DNA was eluted with 20 μl of EB buffer after centrifugation at top speed.
DNA Ligation: The empty vector and siah1 gene were ligated using the Quick ligation kit.
DNA ligation was performed at 16oC for 30 min. The ligase calculator software was used to
calculate the amount of vector and insert for the reaction. Vector to insert ratio was 1:6.
Calculation for ligation mix (20 μl): 10 µl 2X Quick ligation reaction buffer (1X), 1.46 µl
vector (75 ng), 2.18 µl insert (70.66 ng), 1 µl ligase, 5.36 µl H2O.
Transformation: 3 μl of ligation mix and 50 μl Ecsherichia coli DH5α competent cells were
mixed by swirling and incubated on ice for 30 min. Heat shock was given by incubating tubes
in 42oC water bath for 45 sec. 450 μl SOC media was added to the cell within 2 min of the
heat shock, mixed and incubated for 1 h at 37oC in a shaker. L-shaped spreader was used to
spread the bacterial suspension uniformly on LB agar plates containing 75 μg/ml ampicillin
and the plate was incubated for overnight at 37oC.
Selection of positive clones: One colony was picked up from the plate with the help of
autoclaved toothpick. The toothpick was used to inoculate a gridded master plate and also to
inoculate 5 ml LB broth with 100 μg/ml of ampicillin and incubated at 37oC for 16 h with
shaking. Plasmid DNA was isolated from bacterial culture using miniprep kit.
31
Miniprep plasmid isolation: Overnight bacterial culture was centrifuged at 6800xg for 3 min
at RT. The bacterial pellet was resuspended in 250 μl buffer P1 followed by addition of 250
μl buffer P2, inverted 10-12 times till the solution turned evenly blue and was kept for 5 min
at RT to lyse bacteria. 350 μl buffer N3 was added and was mixed thoroughly by inverting
the tubes 10-12 times till the solution became colourless. It was centrifuged for 10 min and
the supernatant was applied to spin column. After a 60 sec of centrifugation, the column was
washed with 500 μl of buffer PB followed by 750 μl of buffer PE. 30 μl of EB buffer was
added to the column, incubated for 1 min followed by centrifugation for 1 min at top speed to
elute DNA. To select the correct recombinant, restriction digestion was performed once more
with Hind III/Xho I enzyme. The restriction digested products along with their corresponding
undigested plasmids were run on 1.2% agarose gel. 848 bp release was obtained from only
one clone and were checked by sequencing (outsourced). As the result of sequencing was
positive for siah1 gene, the plamid was amplified by maxiprep.
Maxiprep of plasmid: To get higher yield of the selected positive clone Maxiprep was done.
The positive clone was picked up from the master plate and inoculated into 100 ml LB broth
with 100 μg/ml of ampicillin and incubated for 16 h at 37oC. The culture was centrifuged at
6000xg for 15 min at 4oC. The bacterial pellet was resuspended in 10 ml of buffer P1
followed by addition of 10 ml of buffer P2, mixed thoroughly by vigorously inverting 4-6
times till the blue color appears and incubated for 5 min at RT. 10 ml of prechilled buffer P3
was added to the mixture and mixed by vigorously inverting 4-6 times. The lysate was
transferred into the barrel of the Qiafilter catridge. The mix was then incubated for 10 min at
RT. During the incubation period, hispeed maxi tip was equilibrated by adding 10 ml Buffer
QBT. Bacterial lysates were filtered into the previously equilibrated hispeed tip. The clear
lysate was allowed to enter the resin through gravity flow. 60 ml Buffer QC was added to the
Qiagen tip. DNA was eluted into a 50 ml of centrifuge tube by adding 15 ml Buffer QF to the

32
Qiagen tip. 10.5 ml of isopropanol was added to precipitate DNA. After 5 min of incubation,
the mixture was transferred to a 30 ml syringe, the plunger was inserted and by using
constant pressure, the mixture was filtered through Qiaprecipitator. 2 ml 70% ethanol was
added to the syringe and was filtered through Qiaprecipitator. The outlet nozzle of
Qiaprecipitator was air-dried to prevent ethanol carryover. The Qiaprecipitator was attached
to a 5 ml syringe and 500 μl of prewarmed TE buffer was added to the syringe. The plunger
was inserted to collect DNA from the other side in a DNase/RNase free microfuge tube.
2.2.4.2. Cloning and mutation of human siah1and siah2 promoters
Primer design: Primers were designed for cloning of human siah1 5‟ UTR (GenBank:
AJ400626.1) and human siah2 promoter (NM_005067.5). The human siah1 5‟ UTR and
siah2 promoter are highly GC rich regions. For successful cloning, two different primer sets
were designed. One set of primers were having no restriction enzymes site while the second
set of primer was designed with restriction site inserted (vide Appendix VI). Integrated DNA
Technology (IDT) software was used to design primers for the target sequences.
Human genomic DNA isolation: Human genomic DNA was isolated from MKN45 cells
using Qiagen flexi gene DNA kit as instructed by manufacturer. Amplification of siah1 5‟
UTR and siah2 promoter from genomic DNA was performed as follows.
PCR: siah1 5‟ UTR and siah2 promoter were amplified from human genomic DNA isolated
from MKN45 cell lines using AmpliTaq Gold360 DNA polymerase. For both siah promoters
the first set of PCR was set up with primers that had no restriction site. For siah1 5‟ UTR
PCR: 50 µl reaction volume was set up as follows- 5 µl 10X AmpliTaq Gold 360 Buffer
(1X), 4 µl 10 mM dNTP mix (0.2 mM each), 6 µl 25 mM MgCl2 (3.0 mM), 2 µl forward
primer (20 pmole), 2 µl reverse primer (20 pmole), 10 µl 360 GC Enhancer, 3 µl genomic
DNA (250 ng), 2 µl AmpliTaq Gold 360 DNA polymerase (10 U), 16 µl H2O. The reaction

33
condition for PCR is mentioned in Appendix VII. The amplified PCR product (656 bp) was
run on 1.2% agarose gel to qualitatively examine the desired PCR product.
For siah2 promoter PCR: 50 µl reaction volume was set up as follows- 5 µl 10X
AmpliTaq Gold 360 Buffer (1X),4 µl 10 mM dNTP mix (0.2 mM each),4 µl 25 mM MgCl2
(2.0 mM), 2 µl forward primer (20 pmole), 2 µl Reverse Primer (20 pmole),10 µl 360 GC
Enhancer, 3 µl genomic DNA (250 ng),1 µl AmpliTaq Gold 360 DNA polymerase (5 U), 19
µl H2O. The reaction condition for PCR is mentioned in Appendix VII. The amplified PCR
product (545 bp) was run on 1.2% agarose gel to qualitatively examine the desired PCR
product.
PCR purification: The amplified PCR products were PCR purified using Qiagen PCR
purification kit as described earlier.
PCR on PCR: PCR was performed on the purified PCR product with the second set of
primers i.e. primers with restriction site. Forward primer had KpnI and the reverse primer had
HindIII site. For siah1 5‟ UTR PCR on PCR: 50 µl reaction volume was set up as follows- 5
µl 10X AmpliTaq Gold 360 Buffer (1X), 4 µl 10 mM dNTP mix (0.2 mM each),6 µl 25 mM
MgCl2 (3.0 mM), 2 µl Forward Primer (20 pmole), 2 µl Reverse Primer (20 pmole), 10 µl
360 GC Enhancer, 1 µl PCR product (10 ng),1 µl Ampli Taq Gold 360 DNA polymerase (5
U), 15 µl H2O. The reaction condition for PCR is mentioned in Appendix VII. The amplified
PCR product (454 bp) was run on 1.2% agarose gel to qualitatively examine the desired PCR
product.
For siah2 promoter PCR on PCR: 50 µl reaction volume was set up as follows: 5 µl
10X AmpliTaq Gold 360 Buffer (1X), 4 µl 10 mM dNTP mix (0.2 mM each), 4 µl 25 mM
MgCl2 (2.0 mM), 2 µl Forward Primer (20 pmole), 2 µl Reverse Primer (20 pmole), 10 µl
360 GC Enhancer, 1 µl PCR product (13.3 ng), 1 µl AmpliTaq Gold 360 DNA polymerase (5
U), 21 µl H2O. The reaction condition for PCR is mentioned in Appendix VII. The amplified

34
PCR product (543 bp) was run on 1.2% agarose gel to qualitatively examine the desired PCR
product.
PCR purification: The amplified PCR products were purified using Qiagen PCR purification
kit as described earlier.
Restriction digestion of purified PCR product: Kpn I and Hind III restriction sites were used
(Kpn I on the forward primer and Hind III on the reverse primer) to clone siah1 5‟ UTR and
siah2 promoter in pGL3 basic vector. Restriction digestion of the PCR product and the vector
was performed using 1 μg of template DNA in a 37oC water bath for 3 h.
For restriction digestion of siah1 5‟ UTR, the following reaction mixture was
prepared: 5 µl 10X buffer 2 (1X), 5 µl of 10X BSA (1X), 2.5 µl KpnI (20,000 U/ml NEB), 1
µl HindIII (20,000 U/ml NEB), 14.7 µl PCR product (1 μg), 21.8 µl H2O. For restriction
digestion of siah2 promoter, the following reaction mixture was used: 5 µl 10X buffer 2 (1X),
5 µl 10X BSA (1X), 2.5 µl KpnI (20,000 U/ml NEB), 1 µl HindIII (20,000 U/ml NEB), 10 µl
PCR product (1 μg), 26.5µl H2O.
For restriction digestion of empty vector the following set of reaction mixture was
prepared: 5 µl 10X buffer 2 (1X), 5 µl 10X BSA (1X), 2.5 µl KpnI (20,000 U/ml NEB),1 µl
HindIII (20,000 U/ml NEB), 1 µl PCR product (1 μg), 35.5 µl H2O. The digested PCR
products and vector were then purified using PCR purification kit.
Purification of restriction digested product: The restriction digested products were subjected
to purification using PCR purification kit as described earlier.
DNA Ligation: To ligate purified digested products of empty vector, siah1 5‟ UTR and siah2
promoter, T4 DNA ligase was used. DNA ligation was performed at 16oC for 12 h. The
ligase calculator software did the calculation for the amount of vector and insert to be used in
the reaction for ligation. Vector to insert ratio was 1:6.
35
Calculation for ligation mix for siah1 5‟ UTR (10 μl): 1 µl 10X T4 ligase buffer (1X), 2.07 µl
vector (75 ng), 1.27 µl insert (40 ng), 1 µl ligase, 4.66 µl H2O.
Calculation for ligation mix for siah2 promoter (10 μl): 1 µl 10X T4 ligase buffer (1X), 2.07
µl vector (75 ng), 1.64 µl insert (49.96 ng), 1 µl ligase, 4.28 µl H2O.
Transformation of ligated product was done as described earlier, followed by plasmid
isolation using miniprep plasmid kit. Restriction digestion of the isolated plasmid was
performed to select the positive clone which was confirmed by sequencing. To further
amplify the plasmid, maxiprep was done using maxiprep plasmid isolation kit.
Mutation at ETS2 binding site (EBS) of siah1 5‟ UTR and EBS and Twist1 binding site
(TBS) of siah2 promoter: Site-directed mutagenesis was done at EBS for siah1 5‟ UTR and
EBS and TBS for siah2 promoter using Quick change multi site-directed mutagenesis kit.
Primer sequence is mentioned in Appendix VIII.
The mutagenesis reaction mix (25 µl) had the following components: 2.5 µl 10X
Quikchange multi reaction buffer (1X), 0.75 µl Quik solution, 1µl dsDNA template (100 ng),
1 µl primer (100 ng), 1 µl dNTP, 1 µl Quik change multi enzyme, 17.75 µl H2O. The PCR
reaction conditions for site-directed mutagenesis are mentioned in Appendix VIII.
Amplified PCR products were treated with 1 μL (10 U/μL) Dpn I restriction enzyme
(an endonuclease; targeted sequence: 5´-Gm6ATC-3´ and is specific for methylated and
hemimethylated DNAs) and incubated at 37°C for 2 h. Parental strands of DNA were
digested at specific sites by this enzyme leaving the new strand intact. After digestion, Dpn I-
treated DNAs from mutagenesis reaction were transformed into XL10-Gold ultracompetent
cells as discussed previously. The mutant closed-circle ssDNA was converted into a duplex
form in vivo. Mutants were confirmed by restriction digestion and sequencing; positive
clones were further amplified by maxi prep method.

36
2.2.4.3. Transient transfection
Lipofectamine2000 reagent was used for transient transfection of various plasmid constructs
and Lipofectamine3000 was used for transient transfection of siRNA. The cell:DNA:
Lipofectamine ratio for different cell-culture plate sizes is mentioned in Table 1. MKN45
cells were plated in cell-culture plate with an appropriate volume of complete growth media
and placed inside an incubator at 37oC and 5 % CO2 24 h prior to transfection. Growth media
was gently aspirated from the wells and fresh complete growth media was added to cells 1 h
before transfection. Two reaction mixtures were prepared in DNase, RNase and pyrogen-free
1.5 ml microfuge tube. Mix A contained required amount of DNA in serum free media
(SFM) and mix B contained required amount of Lipofectamine2000/3000 reagent in serum
free media. Tubes were incubated for 5 minutes at RT. Mix A and B were mixed together by
gently pipetting up and down 5 times and the reaction tube was incubated for 25 minutes at
25ºC to allow complex formation. Reaction mixture containing transfection complexes was
added drop-wise to cells in plate and the plate was swirled gently to ensure uniform
distribution of the complex. Cells with the complex mix were incubated in the incubator for
24 h at 37ºC and 5% CO2. Cells were then treated as per experimental protocol.
Table 1. Parameters for transient transfection (Adapted from Invitrogen)
Culture plate
Volume of
plating media in
(μl)
Cell No. per
plate
DNA (μg) in and
dilution volume
SFM (μl)
DNA-Lipid
complex added
to cells (μl)
96-well
100
4x10⁴
0.1(μg) in 10 (μl)
20
24-well
500
2x10⁵
0.8 (μg) in 50 (μl)
100
12-well
1000
4x10⁵
1.6 (μg) in 100 (μl)
200
6-well
2000
1x10⁶
4 (μg) in 250 (μl)
500

37
2.2.5. Infection of GCCs with H. pylori
24 h prior to infection, 1x10⁶
MKN45 cells were seeded in 6-well cell culture plate with 1.5
ml of complete media in each well. Plates were placed inside a 37oC incubator maintaining
5% CO2. As described earlier, H. pylori was inoculated in Brucella broth supplemented with
10% heat-inactivated fetal bovine serum and were agitated for 18 h inside an incubator at
37oC and 10% CO2.1 ml of the broth with bacteria was taken in cuvette and its OD was
measured in a spectrophotometer. The rest amount of broth was centrifuged down at 300xg
for 10 min. The supernatant was discarded and the pellet was resuspended in desired volume
of RPMI-1640 complete media. Cells were infected with H. pylori at 100, 200 and 300 MOI
for 3 h and 6 h time point.
2.2.6. Whole cell lysate preparation from GCCs after H. pylori infection
After infection, plates were placed inside the incubator at 37oC and 5% CO2 for the required
time. Plates were taken out from the incubator and placed on ice bath. Cells were scraped
gently, centrifuged at 250xg for 5 min at 4oC and the supernatant was thrown away. 40 μl of
2X protease inhibitor cocktail was added to the pellet and vortexed. 40 μl of 2X sample
buffer with β-mercaptoethanol was added to the mix, vortexed and boiled at 100oC for 8 min
to prepare the whole cell lysate.
2.2.7. Isolation of membrane, cytosol and nuclear fractions from MKN45 cells after H.
pylori infection
For membrane, cytosolic and nuclear fraction isolation, NE-PER nuclear and cytoplasmic
extraction reagents was used. The cytoplasmic and nuclear fractions were isolated as per the
instruction of manufacturer whereas the membrane fraction was isolated from the
cytoplasmic fraction as described below. 2 x 10⁶ MKN45 cells were plated in 60 mm cell
culture dish 24 h prior to infection, and were incubated at 5% CO2 and 37ºC. Cells were left
uninfected or were infected with H. pylori for various time points and were centrifuged down

38
at 500xg for 5 min. The supernatant was discarded and other reagents were added based on
packed cell volume as mentioned below.
Table 2. Reagents used for cell fractionation using NE-PER kit (Adapted from NE-PER
manual)
Packed Cell Volume (µl)
CER I (µl)
CER II (µl)
NER (µl)
10
100
5.5
50
20
200
11
100
50
500
27.5
250
100
1000
55
500
2 × 10⁶ cells is equivalent to 20µl packed cell volume.
A premix of protease inhibitor cocktail and ice-cold CER I buffer was added to the pellet and
vortexed vigorously for 15 sec. The pellet was incubated on ice for 10 min. After incubation,
CER II was added and vortexed vigorously for 5 sec and followed by 1 min incubation on
ice. Tubes were again vortexed for 5 sec followed by centrifugation at 16000xg for 5 min at
4oC. The insoluble pellet containing nuclei was resuspended in ice-cold NER supplemented
with protease inhibitor and vortexed for 15 sec. The suspension was incubated on ice and
vortexed for 15 sec with 10 min interval for a total of 40 min. Finally, tubes were centrifuged
at 16000xg for 10 min and the supernatant (nuclear extract) was collected in prechilled
microcentrifuge tubes and stored at -80oC till further processing.
To isolate the membrane fraction, the supernatant (cytoplasmic extract) was
immediately transferred to prechilled microcentrifuge tubes and was again subjected to
centrifugation at 16000xg for 40 min at 4oC. The pellet obtained after centrifugation was the
39
membrane fraction and the supernatant was the cytoplasmic fraction. Both were stored at -80
oC until used.
2.2.8. Sodium dodecyl sulfate polyacrylamide gel electrophoresis (SDS)
Based on molecular mass, protein samples were separated by SDS-PAGE following Laemmli
method (1970).
Stock solutions:
Acrylamide solution or solution A: 30 % acrylamide and bis-acrylamide solution, 29:1.
Resolving gel buffer or solution B: Resolving gel buffer, 1.5M Tris-HCl buffer pH 8.8.
Stacking gel buffer or solution C: Stacking gel buffer, 0.5M Tris-HCl buffer pH 6.8.
Glycerol: A 50 % glycerol solution was prepared by adding 50 ml glycerol with 50 ml double
distilled water.
TEMED: N, N, N‟, N‟,-Tetramethylethylenediamine was used as an essential catalyst for
polymerization of SDS PAGE.
Ammonium persulfate (APS): A 10% solution was made by dissolving 20 mg of APS in 200
μl double distilled water. APS is an oxidizing agent used with TEMED for catalyzation of
SDS PAGE.
Working solutions:
Resolving gel solution: The stock solutions were mixed in the following proportions to obtain
a 7.5% resolving gel solution, calculation for 2 gels: 2.25 ml of Solution A, 2.25 ml of
Solution B, 2 ml of Double distilled water, 2.5 ml of 50% glycerol, 5 μl of TEMED, 70 μl of
10% APS. To prepare other percentages of gel, the volume of solution A and double distilled
water were changed appropriately while volume of other components remained the same.
Stacking gel solutions: The stock solutions were mixed in the following proportions (for 2
gels): 900 μl of Solution A, 1.5 ml of Solution C, 3.6 ml of double distilled water, 6 μl of

40
TEMED, 36 μl of 10% APS. APS and TEMED were added to the solution just prior to
polymerization.
Electrophoresis buffer: Gel running 1X TGS buffer containing 25 mM Tris-HCl, 190 mM
glycine and 0.1% SDS was prepared from 10X TGS buffer by adding 100 ml of 10X TGS
and 900 ml of double distilled water.
Sample denaturing (Laemmli) buffer: Laemmli buffer was prepared by adding ready to use
2X Laemmli buffer and 5% (v/v) β-mercaptoethanol (to 750 μl 2X Laemmli buffer 37.5 μl β-
mercaptoethanol was added). This denaturing buffer was stored at –20 ºC for upto one month.
Protease inhibitor cocktail: 2X protease inhibitor cocktail mix was prepared from 100X
protease inhibitor cocktail by adding 3.6 μl 100X protease inhibitor cocktail and 176.4 μl
molecular biology grade water.
Polymerization:
Mini-PROTEAN tetra system (Bio-Rad) was used to carry out gel electrophoresis. The short
glass plates and 1 mm thick spacer glass plates were assembled inside the casting frame as
per instructions provided by manufacturer. Initially, the resolving gel solution was prepared,
swirled gently and poured in between the two glass plates up to a height of three-fourth of the
total height. Stacking gel solution was very slowly layered upon the resolving gel so that the
level of the separating gel was not disturbed. A 1 mm thick 10-well comb was inserted into
the stacking gel solution and the solutions were allowed to solidify at RT for 20-30 minutes.
The comb was gently removed after complete polymerization of both solutions. Glass plates
were removed from the casting frame and placed within the buffer dam. Electrophoresis
buffer was added to the inner chambers of the apparatus till it overflew to remove
unpolymerized acrylamide and air bubbles. The outer chamber was also filled with
electrophoresis buffer upto the required level.

41
Sample preparation:
Sample preparation methodology has already been explained above. Samples stored at -80oC
were taken out, thawed and ran on gel.
Sample loading and electrophoresis:
Preheated samples were loaded in wells of the polyacrylamide gel. To know the molecular
masses of sample proteins, one of the empty wells was loaded with marker proteins of known
molecular mass. The inner chamber was then gently filled up with electrophoresis buffer.
The electrophoresis chamber was connected to a power pack and electrophoresis was
carried out initially for 15 min at a constant voltage of 130 volts. Then it was changed to a
constant voltage of 180 volts for 75 min i.e. till the bromophenol blue dye front was just out
from the base of the gel.
2.2.9. Immunoblotting
The Towbin et al. (1979) method was used to perform immunoblotting. The details are given
below.
Immunoblotting solutions:
Tris-buffered saline (TBS): 1X TBS was prepared from 10X TBS by adding 100 ml of 10X
TBS to 900 ml of double distilled water.
Phosphate-buffered saline (PBS): 1X PBS was prepared from 10X PBS by adding 100 ml of
10X PBS to 900 ml of double distilled water.
Tween-20 wash solution (TBST): 0.1% (v/v) Tween-20 was dissolved in TBS.
Primary antibody dilution buffer: 3% (w/v) bovine serum albumin (BSA) dissolved in TBST.
Blocking buffer or secondary antibody dilution buffer: 5% non-fat-dry-milk (NFDM)
dissolved in TBST.

42
Transfer buffer for PVDF membrane: 100 ml of 10X TG buffer was dissolved in 700 ml of
double distilled water and 200 ml of methanol. 0.0375 gm of SDS was added to 1X TG
buffer.
Procedure for transfer of protein onto PVDF membrane: Wet transfer: To transfer higher
molecular weight protein, wet transfer methodology was followed. The transfer of protein
onto PVDF membrane was performed in Mini trans-blot cell. Initially protein samples were
separated based on their molecular mass in SDS polyacrylamide gel. The gel was
immediately transferred to pre-chilled transfer buffer and was kept for 5 min. To reduce
hydrophobicity of PVDF membrane, it was soaked in pre-chilled methanol for 1 min
followed by a washing in water. The membrane was then placed in pre-chilled transfer buffer.
A glass casserole was filled with pre-chilled transfer buffer. Mini gel holder cassette was
placed inside the casserole with its gray side down. Pre-wetted foam pad was placed on the
gray side of the cassette. A sheet of Mini trans-blot filter paper soaked in transfer buffer was
placed on the foam pad. The equilibrated gel was then placed over the filter paper. The pre-
wetted membrane was placed over the gel. A glass tube was gently rolled over the membrane
to remove air bubbles trapped in between. The sandwich was completed by placing filter
paper on the membrane and another foam pad on the top. The cassette was firmly closed and
placed inside the module. The module was placed inside the tank along with a cooling unit
and a stir bar. The tank was filled with chilled transfer buffer till the blotting mark on the
tank. The lid was placed and the cables were plugged into the power supply. Transfer was
carried out at a “constant voltage” of 40 volt for 4 h.
Semi-dry Transfer: To transfer of low molecular weight proteins, the semi-dry transfer
technique was used. After SDS gel electrophoresis was over the processing of PVDF and gel
was similar to that of wet transfer. A thick filter paper was soaked in transfer buffer and was
placed over the transfer assembly on the anode followed by placement of a PVDF membrane,

43
the electrophoresed gel and another thick paper (towards the cathode). After rolling out air
bubbles from the assembly, transfer was carried out at 25 volt for 35 min.
After transfer, the blotting sandwich was dismantled for both wet and semi-dry
transfers and the PVDF membrane was transferred to TBS for 5 min. The membrane was
then placed in blocking solution for 1 h in a shaker, to prevent non-specific binding of IgG.
The membrane was transferred to the primary antibody solution and kept at RT for 1 h with
constant shaking. The membrane was then kept at 4oC for overnight incubation with constant
shaking. The membrane was washed thrice for 10 min each with TBST, and then transferred
into the secondary antibody solution containing horse-radish peroxidase (HRP)-conjugated
IgG. It was incubated in the secondary antibody solution at RT for 1 h with constant shaking.
The membrane was washed thrice with TBST for 5 min each. For detecting HRP on
immunoblots, supersignal west femto maximum sensitivity substrate kit was used. This kit
contained two solutions: luminol and stable peroxide solution. Both solutions were mixed at
equal volume just before detection and were applied uniformly over the blot. The blot was
covered with clear plastic wrap and imaging was done with Chemidoc XRS equipped with
Quantity 1-D analysis software version 4.6.9 (Bio-rad Laboratories).
Reprobing of the PVDF membrane: Reprobing of the PVDF membrane was done with
restore plus western blot stripping buffer. After the blot was developed, it was washed thrice
with TBST 5 min each followed by an incubation in stripping buffer for 30 min with constant
shaking at 37oC. The blot was washed thrice with TBST for 15 min each at RT followed by
blocking, incubation with antibodies and detection as described above.
2.2.10. Total RNA isolation and real time RT-PCR in MKN45 cells to study expression of
Siah1 and Siah2 after H. pylori infection
1x10⁶
MKN45 cells were seeded in 6-well cell culture plate 24 h prior to infection and were
placed inside an incubator at 37oC and 5 % CO2. On the next day, cells were infected with H.

44
pylori. Total RNA was isolated using Qiagen RNeasy mini kit. Uninfected and H. pylori-
infected cells were harvested with a new cell scraper. Harvested cells were placed inside
microcentrifuge tubes and centrifuged down at 500xg for 5 min. Supernatant was gently
aspirated and the cell pellet was loosened by flicking the tubes. 350 μl of buffer RLT (with
1% β-mercaptoethanol) was added and cells were homogenized with a 20-gauge needle fitted
to an RNase-free syringe. 350 μl of 70% ethanol was added to the homogenized lysate and
was mixed thoroughly by pipetting. 700 μl of the sample was added to an RNeasy-mini
column placed in a 2 ml collection tube and was centrifuged down at 8000xg for 15 s. The
flow through in collection tube was discarded and 350 μl buffer RW1 was added to the
column and was centrifuged at 8000xg for 15 s. The flow through in the collection tube was
discarded. On-column DNase digestion was performed to prevent contamination from
genomic DNA. For this, 80 μl DNase mix (10 l of DNase 1 stock solution + 70 l of Buffer
RDD) was added to the mini column and was incubated for 15 min at RT. 350 μl of buffer
RW1 was added and was centrifuged at 8000xg for 15 s. The flow through in the collection
tube was discarded. 500 μl of buffer RPE was next added and centrifuged at 8000xg for 15 s
and the flow through was discarded. 500 μl of buffer RPE was added, centrifuged at 8000xg
for 2 min and the flow through was discarded from the collection tube and was again
centrifuged down at top speed for 1 min. The mini column was transferred to a 1.5 ml
centrifuge tube, 30 μl of RNase-free water was added to the column, incubated for 1 min and
was centrifuged at 8000xg for 1 min. The RNA yield was estimated spectrophotometrically.
First strand cDNA was synthesized from total RNA using SuperScript First Strand
Synthesis System for RT-PCR. Initially, RNA/Primer mix was prepared in a DNase/RNase
free 0.2 ml microfuge tube. The RNA/Primer mix consisted of 0.5 μg total RNA, 1 μl random
hexamers, 1 μl 10 mM dNTP mix and the volume was made upto 10 μl by adding DEPC-
treated H2O. Tubes were incubated at 65oC for 5 min and then on ice for 1 min. Then, 2 μl
45
10X RT buffer (1X), 4 μl 25 mM MgCl2, 2 μl 0.1 M DTT, 1 μl RNaseOUT were added to
the RNA/Primer mix and was incubated at 65oC for 5 min. 9 μl reaction mixture was added to
the RNA/Primer mix, mixed gently and given a brief centrifugation. The mix was then
incubated at 25oC for 2 min. 1 µl (50 units) of SuperScriptII RT was added to each tube and
incubated at 25°C for 10 min. Next, reaction tubes were incubated at 42oC for 50 min. The
reaction was terminated by incubating at 70°C for 15 min and was chilled on ice. The
reactions were collected by brief centrifugation. To degrade RNA, 1 μl RNase H was added
to each tube and was incubated for 20 min at 37oC. The synthesized cDNA was used to
perform Real time RT-PCR in the 7500 Real-time PCR system (Applied Biosystems). The
reaction mixture consisted of 12.5 μl Taqman universal mix, 1.25 μl 20X primer/probe, 1.5 μl
cDNA, 9.75 μl DEPC-treated H2O. The PCR conditions are mentioned in Appendix IX.
2.2.11. In vitro binding assay
Annealing of single stranded (ss) complementary oligonucleotides (oligos) in STE buffer:
The 5‟ biotinylated complementary oligos of human siah1 5‟ UTR at EBS and siah2
promoter at EBS and TBS were annealed. The list of 5‟ biotinylated wild type (WT) and
mutant (Mut) oligos are mentioned in Appendix X. These oligos were reconstituted in
DNase, RNase-free DEPC-treated H2O at 100 pmol/μl concentration. Complimentary DNA
strands were annealed in STE buffer (1X TE, 100 mM NaCl). 40 μl (4000 pmol) of each
strand of complimentary oligos were added in 500 μl reaction volume. The reaction mixture
with oligonucleotide was incubated at 80oC for 15 min followed by slow cooling to room
temperature and was stored at -20oC.
Nuclear lysate preparation: 5x10⁶ MKN45 cells were seeded in 100 mm cell culture dish 24 h
prior to infection and were placed inside an incubator maintaining 37oC and 5 % CO2. On the
next day, cells were infected with H. pylori or were left untreated. Nuclear isolation was done

46
for treated and untreated cells using NE-PER nuclear and cytoplasmic extraction kits as
described earlier.
Processing of dynabeads M-280 streptavidin and gel running: Dynabeads were resuspended
in the supplied vial by rotating to get a homogeneous suspension and 20 μl of it was taken in
a microfuge tube. The microfuge tube was placed on a magnet for 1 min and the supernatant
was discarded. The tube was removed from the magnet and beads were resuspended in equal
volume of 2X binding and washing buffer (B&W buffer, 10 mM Tris HCl pH 7.5, 1 mM
EDTA, 2 M NaCl), next, beads and were washed again as per the instruction mentioned
above. After washing, the buffer was removed and was resuspended in binding buffer (1X
binding buffer EMSA kit pierce, 2.5% glycerol, 5 mM MgCl2, 10 mM EDTA) twice of the
original volume. Biotinylated oligo was next added and beads were incubated for 10 min with
gentle rotation/short tapping. Microfuge tubes were placed on the magnet and beads were
separated using magnet. Beads were washed three times with 1X B&W buffer and were then
incubated with infected or uninfected nuclear lysates for 30 min at room temperature. Beads
were washed twice with 1X B&W buffer followed by resuspension in 25 μl of sample buffer
with β-mercaptoethanol and was boiled at 100oC for 10 min. Proteins were resolved in a
polyacrylamide gel and electrotransferred to a PVDF membrane for detection.
2.2.12. In vivo binding assay
5x10⁶ MKN45 cells were seeded in 100 mm cell culture dish 24 h prior to transfection and
the next day cells were either left uninfected or were infected with H. pylori. ChIP assay was
performed with nuclear lysates using QuikChIP kit. To cross-link protein/DNA complex in
the nucleus, 3 h post-infection cells were centrifuged at 3000xg for 5 min and 10 ml of 1%
formaldehyde solution (270 μl of 37% formaldehyde added to 10 ml of cell culture media)
was added to cells after gently aspirating out old media. Cells were incubated at 37oC for 10
min. To stop cells getting over-fixed, 1 ml of 10X glycine was added to the tube, gently

47
swirled to mix and incubated at room temperature for 5 min. Cells were centrifuged at
3000xg for 5 min and media was removed as much as possible without disturbing the cell
pellet. Cells were washed two times with 10 ml of ice cold PBS. Then, 1 ml of ice cold PBS
(supplemented with PMSF and PIC) was added and centrifuged at 7000xg at 4oC for 5 min.
The supernatant was discarded. The pellet was resuspended in 1 ml of SDS lysis buffer
(supplemented with PMSF and PIC) and was incubated on ice for 10 min. The lysate was
sonicated on ice at 40% of the max speed with 25 pulses for 30 sec on and 30 sec rest on ice.
The sonicated lysate was centrifuged at 7000xg at 4oC for 10 min to pellet the insoluble
material. The supernatant was transferred to fresh microfuge tubes and stored at -80oC. The
next day, 200 μl of supernatant and 800 μl of ChIP dilution buffer containing PIC were taken
in microfuge tubes. To remove molecules that can non-specifically bind to the protein A/G
agarose, 75 μl of salmon sperm DNA/protein A/G agarose was added to the tubes and rotated
for 30 min at 4oC. Samples were centrifuged at 3000xg for 1 min. Supernatant was taken in a
fresh microfuge tube. 10 μl sample of the supernatant was aliquoted into a fresh microfuge
tube and stored at 4oC to be used as input. 5 μg of immunoprecipitating antibody was added
to the supernatant of both control and infected sample and 5 μg of IgG was added to the
control lysate. Tubes were rotated overnight at 4oC. To collect the antibody/antigen/DNA
complex, 60 μl of salmon sperm DNA/protein A/G agarose was added to the tubes and
rotated for 1 h at 4oC. The protein/A/G agarose/antibody/chromatin complex was collected
after centrifugation at 3000xg for 1 min. The supernatant was discarded and the complex was
washed on a rotating platform with wash buffers A, B, C and D. 500 μl of elution buffer was
added to the input tube and set aside. 250 μl of elution buffer was added to the protein A/G
agarose/antibody/chromatin complex. Tubes were incubated at RT for 15 min followed by
centrifugation at 3000xg for 1 min and the supernatant was collected. The elution step was
again repeated for the second time and the eluates were combined (total volume ~500 μl). To

48
reverse cross-link of DNA and protein complex, 20 μl of 5M NaCl was added to the eluates
and incubated at 65oC for overnight. Next day, 1 μl of RNase A was added and incubated at
37oC for 30 min. 10 ul of 0.5 M EDTA, 20 ul of 1 M Tris HCl pH 6.5, and 2 ul 10 mg/ml
proteinase K was added and incubated at 45oC, for 1 h. The DNA was purified using
QuikChIP DNA purification kit. 750 μl of binding buffer was added to 500 μl of the reversed
cross-link eluates and was loaded on spin column fitted with collection tube. Columns were
incubated for 1 min at RT followed by centrifugation at 8000xg for 1 min at RT. The flow
through was discarded and 700 μl of column wash solution was added, centrifuged at 8000xg
for 30 sec at RT. The column was removed from the collection tube and the flowthrough was
discarded and again centrifuged at 8000xg for 30 sec at RT. The column was fitted on a
microfuge tube and 15 ul of elution buffer was added, incubated for 1 min at RT followed by
centrifugation at 8000xg for 1 min at RT. The DNA concentration was measured using a
spectrophotometer as well as by gel running. The eluted DNA was used to perform PCR
using primer from ETS2/Twist1 binding regions of siah1 5‟ UTR and siah2 promoter. Primer
pairs used for performing PCR is mentioned in Appendix XI.
PCR for Siah1 was set up using the following reaction mixture: 5 µl 10X buffer (1X),
1 µl 10 mM dNTP (0.2 mM), 1 µl primer F (10 pmole), 1 µl primer R (10 pmole), 1 µl DNA
(20 ng), 5 µl mix (2.7 M betaine, 6.7 mM DTT, 6.7% DMSO, 55 µg/ml BSA), 2 µl NEB Taq
polymerase, 34 µl H2O. The reaction condition for PCR is mentioned in Appendix XI. The
amplified PCR product was run on 1.2% agarose gel.
PCR for Siah2 was set up using the following reaction mixture: 5 µl 10X HIF buffer
(1X), 1 µl 10 mM dNTP (0.2 mM), 2 µl 50 mM MgSO4 (2.0 mM), 1 µl Primer F (10 pmole),
1 µl Primer R (10 pmole), 1 µl DNA (20 ng),1 µl HIF Taq polymerase, 38 µl H2O. The
reaction condition for PCR is mentioned in Appendix XI. The amplified PCR product was
run on 1.2% agarose gel.
49
2.2.13. Dual luciferase reporter assay
Cell lysate preparation: 24 h prior to transfection, MKN45 cells were plated in 24-well
culture plates with cell density of 2x10⁵cells per well. Plates were placed inside an incubator
at 37oC with 95% humidity and 5% CO2. Cells were transfected with Lipofectamine2000
reagent. Transfected cells were infected with H. pylori or were left untreated. Cells were
scraped in media and harvested at 500xg for 5 min. The pellet was resuspended in 83.33 µl
passive lysis buffer (PLB). Cells were vortexed and kept at room temperature for 5 min
followed by two freeze and thaw cycles (at -70oC and 37
oC for 20 min each).
Dual luciferase assay protocol: 15 µl cell lysates were added to wells of a 96-well plate. The
luminometer was programmed to perform a 2 sec pre-measurement delay followed by a 10-
sec measurement read for luciferase activity. 75 µl of the luciferase assay reagent II (LARII)
equilibrated to RT was added to each well using a multi-channel pipette and mixed by
pipetting 2-3 times. The plate was placed immediately inside the luminometer and readings
were recorded. The plate was taken out, 75 µl of stop and glo buffer was added and placed
inside the luminometer for readings.
2.2.14. Immunoprecipitation (IP) assay
To study interaction of membrane-bound β-catenin with Siah1 protein, immunoprecipitation
assay (IP) was performed. 5x10⁶ cells were seeded in 100 mm cell culture dish 1 day prior to
infection. Membrane fraction was isolated from uninfected and H. pylori-infected cells as
mentioned earlier. To the membrane fraction, 200 μl of TEN buffer (150 mM NaCl, 50 mM
Tris pH 7.5, 1 mM EDTA) supplemented with 1% Triton X-100 and protease inhibitor
cocktail (10 μl/ml) was added. Tubes were kept on ice for 30 min with vortexing at every 10
min interval for complete lysis. 800 μl TEN buffer supplemented with protease inhibitor
cocktail (10 μl/ml) but without Triton X-100 was added to each tube. Siah1 antibody was
added to cell lysate at 1:50 dilution, whereas equal amount of IgG B was added to uninfected

50
cell lysates and was incubated overnight at 4oC with shaking. After overnight incubation, 15
μl of 50% protein A/G plus-agarose was added to each tube and was again incubated for 3 h
with shaking at 4oC. The agarose-bound immunocomplex was centrifuged down and the
pellet was washed twice with ice cold 1X PBS (230 g for 5 min). 25 μl of sample buffer
supplemented with 5% β-mercaptoethanol was added to the pellet and cooked. lysates were
then loaded onto SDS gel, Proteins were separated based on their molecular weight followed
by immunoblotting. Detection was performed as described previously.
2.2.15. Generations of stable cell lines overexpressing ETS2, Twist1, Siah1 and Siah2
Both MKN45 and AGS cells were used to stably express ETS2, Twist1, Siah1, Siah2 and the
empty vector pcDNA3.1+. 24 h prior to transfection, cells were seeded in a 96-well plate.
Cells were transfected as described previously and 36 h post transfection, cells were
trypsinized and re-plated in a 6-well plate. 300 µg/ml of G418 was added to select cells
expressing the desired protein. After each 3 days, old media was discarded and fresh media
with 300 µg/ml of G418 was added. This pressure was maintained till colonies were obtained
from single cells and positive colonies were selected using cloning disc. Colonies were
placed in a 12-well plate and were kept under the selection pressure by adding 300 µg/ml of
G418. After the colonies were confluent, they were transferred to T-75 flask and were
allowed to grow till 70-80% confluency is reached. Flasks were trypsinized and cells were
frozen using freezing mix as described earlier. To confirm the expression of desired protein,
0.5x10⁶ cells were taken out from the trypsinized flasks and boiled in sample buffer with 5%
β-mercaptoethanol. Immunoblotting was performed as described previously.
2.2.16. Embedding and sectioning of gastric biopsy samples
Gastric biopsies were stored overnight in 4% PFA followed by storage in 25% sucrose
solution. 24 h prior to sectioning, the cryostat instrument was brought to -20oC. Just prior to
sectioning, poly-L-lysine coating was given over glass slides where tissue sections would be
51
mounted and incubated at 37oC for 30 min. Tissue sample was placed over specimen holder
and was embedded in OCT media followed by immediate freezing by placing it inside the
cryostat. 10 µm thick sections were prepared from adenocarcinoma and control samples.
Tissue section was processed for immunofluorescence staining as described in the next
section.
2.2.17. Immunofluorescence and confocal microscopy
To study ETS2, Twist1, Siah1 and Siah2 expression in adenocarcinoma gastric biopsies,
tissue sections were immunostained with their respective antibodies. The tissue section was
washed with 1X PBS followed by treatment with 0.5% Triton-X-100 in PBS for 20 min.
Tissue section was blocked with 3% FBS in PBST for 1 h. The section was then incubated
with primary antibody diluted in blocking buffer for 1 h at RT followed by overnight
incubation at 4oC. The section was washed with PBST three times of 5 min each followed by
incubation with fluorescently conjugated secondary antibodies diluted in blocking buffer for
1 h at RT. The section was washed two times with PBST for 5 min each and then incubated
for 20 min with DAPI diluted in PBS. Final washing was with 1X PBS, and the section was
mounted with fluoromount G. Digital images were captured for the immunofluorescence
stained sections in a fluorescence microscope. (Refer to appendix III for dilutions of
antibodies used).
For immunofluorescence staining of AGS and MKN45 cells, 0.2x10⁶ cells were
grown on coverslips. Uninfected or H. pylori-infected cells were fixed with 4% PFA in PBS
and permeabilized with 0.1% Triton-X-100 as described earlier. Cells were incubated with
blocking buffer (3% BSA in PBST) for 1 h, followed by overnight incubation with respective
primary antibodies diluted in blocking buffers. After overnight incubation, cells were washed
twice in PBST followed by treatment with secondary antibody for 1 h at RT. Cells were
stained with DAPI and mounted in fluoromount G as described earlier. Cells were scanned
52
for imaging either by a fluorescence microscope or confocal microscope. For confocal
microscopy, images were captured using a LSM-TPMT camera system (Carl Zeiss) and Zen
2010 software (Carl Zeiss). Images were analysed using LSM software (Carl Zeiss) and were
processed using Adobe Photoshop CS4.
2.2.18. Wound-healing assay or scratch assay
Wound-healing properties of Siah1, Siah2, ETS2 and Twist1 expressing cells in the presence
of H. pylori was studied by performing scratch assay using AGS cells stably expressing these
proteins. One day prior to infection, 1x10⁶
AGS cells stably expressing Siah1, Siah2, ETS2,
Twist1 or pcDNA3.1+ were seeded in 6-well cell culture plate. After a monolayer was formed
on the next day of plating, a wound was marked over the monolayer with a 200 µl pipette tip.
To remove dislodged cells, old media was discarded and fresh media was added to wells.
Cells were either infected with H. pylori or left uninfected for 24 h. Cell migration in the
wound was studied for a span of 24 h and images were taken at 6 h, 12 h and 24 h time points
using a bright-field microscope. The number of cells migrated was counted using ImageJ
1.43 software (NIH).
2.2.19. Anchorage-independent growth assay
Soft agar assay was performed with uninfected or H. pylori-infected MKN45 cells stably
expressing Siah1, Siah2, ETS2, Twist1 or pcDNA3.1+
to study anchorage-independent
growth of cells. Cells were seeded in between two different layers of agar and anchorage-
independent growth of cells was studied after colony was formed. MKN45 cells stably
expressing Siah1, Siah2, ETS2, Twist1 or pcDNA3.1+
were seeded in 24-well cell culture
plate at a density of 0.1x10⁶. Next day, cells were either infected with H. pylori for 6 h or left
uninfected and treated with gentamicin for 2 h to kill extracellular bacteria. Cells were
harvested and mixed with top agar.

53
First a layer of 0.6% bottom agar was prepared in 6-well cell culture plate from a
mixture of 1.2% Bacto agar (1.2 gm of Bacto agar dissolved in 100 ml of distilled H2O,
autoclaved and maintained at 50oC to prevent solidification) added to equal volume of
Dulbecco's Modified Eagle Medium/ Nutrient Mixture F-12 Ham (DMEM/ F12, 1:1 mixture)
media. After adding the bottom layer, the plate was kept inside incubator at 37oC for 30 min.
Then 0.3% top agar was prepared by adding 1.2% agar suspension, 2X media (DMEM/F12,
1:1 mixture), gentamicin treated cells (0.1x10⁴) and distilled H2O. The plate with bottom
agar was taken out from the incubator and the top agar with cells was plated over the bottom
agar. Plates were placed inside humidified incubators containing 5% CO2 and maintained at
37oC for 3 weeks. Cells were fed twice weekly with fresh media. Visible colonies started
appearing on the top agar. The number of colonies appeared were directly counted and the
colony size was compared between various treatment groups.
2.2.20. Transwell migration and invasion assay
Transwell migration and invasion assay was performed to study invasive properties of GCCs
overexpressing Siah1 or Siah2. Transwell migration assay was performed using 8-μm pore
size Transwell Biocoat control inserts whereas Transwell invasion assay was performed with
8-μm pore size Transwell Biocoat matrigel-coated inserts. AGS cells were seeded in a 24-
well cell culture plate 24 h prior to transfection. AGS cells were either transfected with
overexpression plasmid Siah1, Siah2, pcDNA3.1+ or with siRNA of Siah1, Siah2 and control
duplex using a methodology described earlier. 36 h post transfection, cells were harvested
and 0.5x10⁴ cells were seeded on Transwell control inserts or coated matrigel inserts placed
inside a 24-well plate. The upper chamber was filled with serum free RPMI media whereas
the lower chamber was filled with complete media. Cells were infected with H. pylori or left
uninfected and was kept inside a 37oC humidified incubator at with 5% CO2. Inserts were
taken out after 24 h of incubation and cells on the top surface of Transwell were scraped off
54
with a cotton swab. Inserts were washed in 1X PBS. Cells in the lower side of inserts were
fixed with 4% paraformaldehyde for 30 min, washed with 1X PBS followed by
permeabilization with 0.5% Triton-X-100 in PBS. Cells were then incubated for 30 min in
haematoxylin and washed with 1X PBS. Inserts were air dried for 1 h, and then membrane
was cut from the insert and mounted over glass slides keeping the lower side down. The
number of cells migrated and invaded was counted using a bright field microscope.
2.2.21. Statistical analysis
Densitometric analyses of western blot images were done by Quantity 1-D Analysis software
version 4.6.9 (Bio-rad Laboratories). Statistical analysis of quantitative data was performed
by Student‟s t tests. Values were given as mean±SEM. Statistical significance was
determined at *P<0.05.

55
RESULTS
Chapter 3

56
3. RESULTS
3.1. H. pylori Induced Expression of Siah Proteins in Cultured Human GCCs:
The status of Siah expression in gastric cancer was not known. To study the expression of
Siah proteins after H. pylori infection on human GCCs, MKN45 cells were infected with cag
PAI(+) H. pylori strain 26695 at MOI 100 and 200 for 3 h and 6 h. Western blots performed
with whole cell lysates showed induced expression of both Siah1 and 2 proteins post
infection (p.i) (Fig. 3.1.1A and Fig. 3.1.1B). Although representative western blot analysis
(n=3) revealed Siah1 and 2 induction with 200 MOI at 3 h and 6 h time points, 200 MOI at 6
h was optimal for induction of both Siah1 and 2 proteins. All cells were infected by H. pylori
at MOI 200. To assess the optimum time for Siah1 and 2 expression, a time-kinetic study was
performed with uninfected and 1 h, 3 h, and 6 h H. pylori-infected whole cell lysates,
Western blot analysis revealed that 6 h was the optimum time required for expression of both
Siah1 and 2 proteins after infection with H. pylori (Fig.3.1.1C and Fig. 3.1.1D). Hence, all
future experiments were performed with strain 26695 at 200 MOI for 6 h time point unless
mentioned otherwise. Immunofluorescence microscopy of MKN45 cells also showed
induced expression of Siah1 and 2 proteins further confirming role of H. pylori as a potent
inducer of Siah (Fig. 3.1E and Fig. 3.1F).
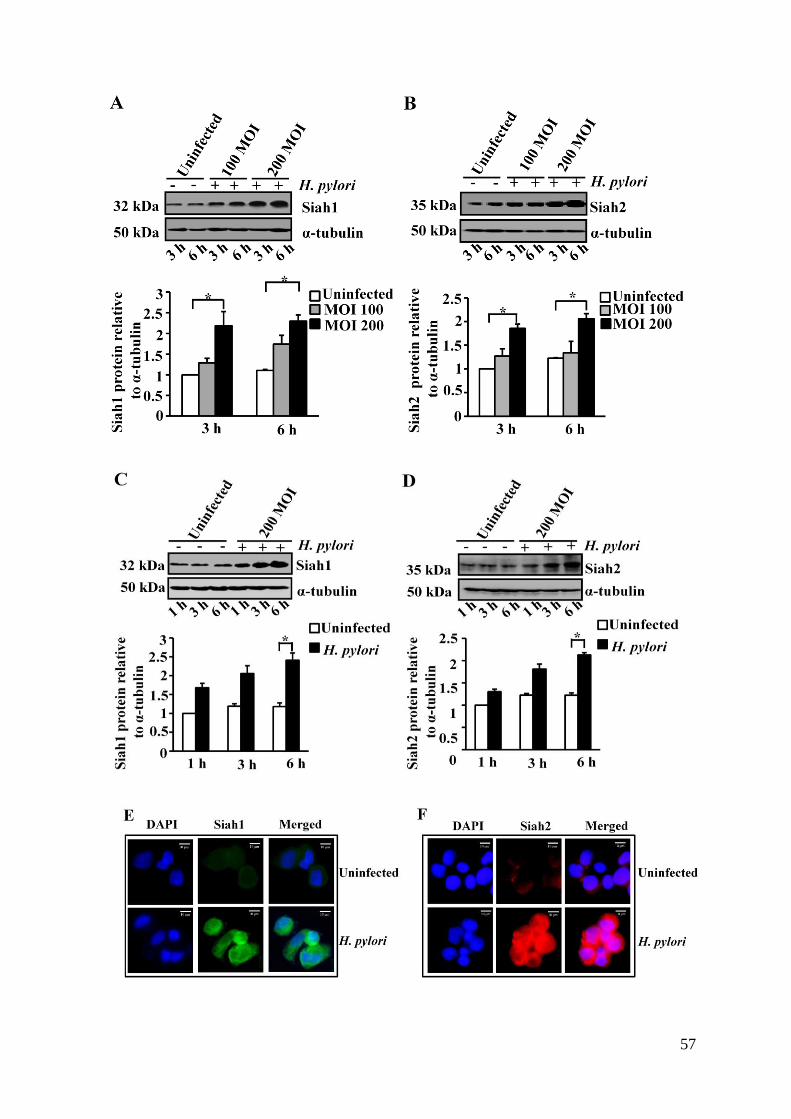
57

58
Figure 3.1.1 H. pylori induce Siah1 and Siah2 protein expression in MKN45 cells. (A)
Western blot of total cell lysates from uninfected and H. pylori-infected (3 h and 6 h with
MOI 100 and 200) MKN45 cells shows induced level of Siah1 protein expression in infected
GCCs.α-tubulin is the loading control. A graphical representation of the western blot data
reveal that MOI 200 at 6 h is optimal for Siah1 induction. Bar represents normalized data
(mean±SEM, n=3), *P<0.05.(B) A representative western blot (n=3) shows optimal
induction of Siah2 protein at MOI 200 and 6 h time point from uninfected and infected whole
cell lysates of MKN45 cells. Bar depicts normalized data (mean±SEM, n=3), *P<0.05. (C)
Time kinetics of Siah1 protein expression in the infected MKN45 cells. Western blot analysis
reveal 6 h is optimum for Siah1 induction. Bar represents normalized data (mean±SEM,
n=3), *P<0.05. (D) A representative time course study of Siah2 protein expression in
uninfected and H. pylori-infected MKN45 cells shows 6 h as optimal time for Siah2
expression. A graphical representation of the data reveals that 6 h is optimal for Siah2
induction. Bar represents normalized data (mean±SEM, n=3), *P<0.05. (E-F)A
representative fluorescence microscopy (n=3) showing Siah1 expression in panel E and
Siah2 induction in panel F of H. pylori-infected MKN45 cells.
The status of Siah1 and 2 expression at transcriptional level was also studied. Real-
time RT-PCR performed with uninfected and infected cells showed significant increase in
Siah1 and 2 messenger RNA level 2 h p.i. as compared to uninfected cells (Fig. 3.1.2A and
Fig. 3.1.2B). As the expression of proteins often alters with cell lines, two other human GCCs
Kato III and AGS were examined for their expression of Siah proteins. Western blot results
showed significant induction of Siah1 and 2 proteins p.i. in Kato III and AGS cells (Fig.
3.1.2C and 3.1.2D). Earlier studies indicated p53 as a transcriptional regulator of Siah1
protein [103]. Western blotting of cell lysates prepared from p53-null KatoIII cells confirmed
that the expression of Siah1 in H. pylori-infected GCCs was p53-independent. To identify the
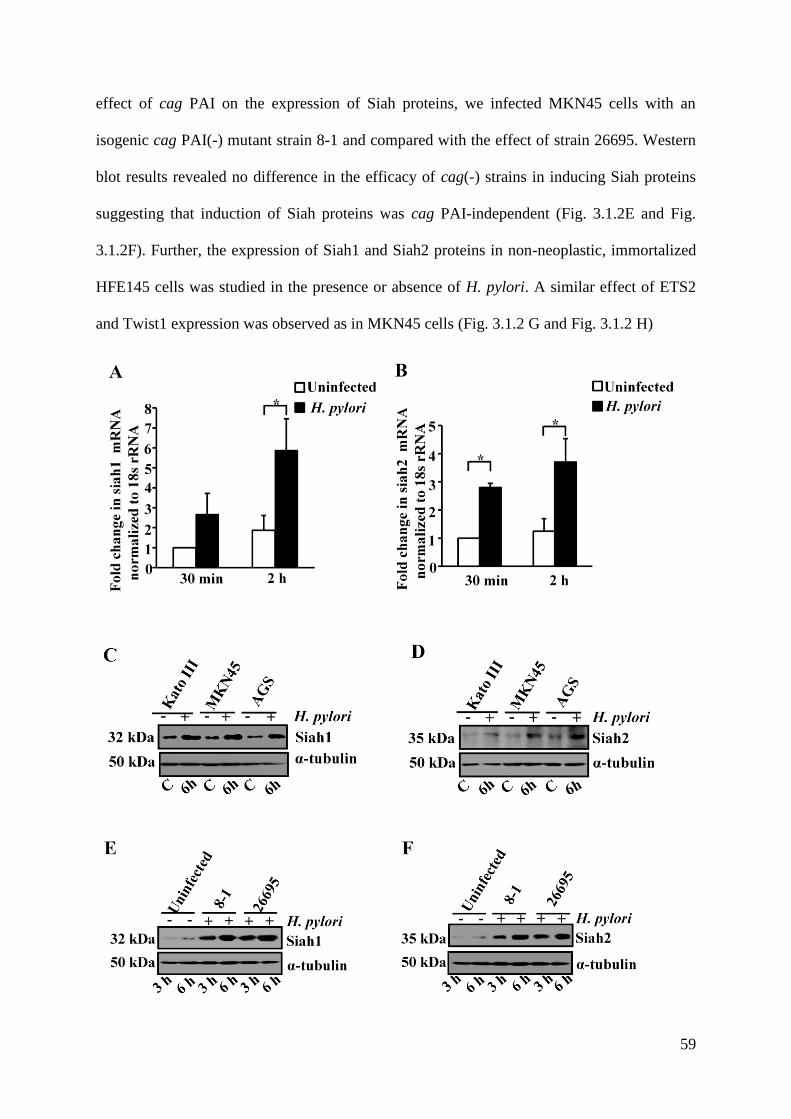
59
effect of cag PAI on the expression of Siah proteins, we infected MKN45 cells with an
isogenic cag PAI(-) mutant strain 8-1 and compared with the effect of strain 26695. Western
blot results revealed no difference in the efficacy of cag(-) strains in inducing Siah proteins
suggesting that induction of Siah proteins was cag PAI-independent (Fig. 3.1.2E and Fig.
3.1.2F). Further, the expression of Siah1 and Siah2 proteins in non-neoplastic, immortalized
HFE145 cells was studied in the presence or absence of H. pylori. A similar effect of ETS2
and Twist1 expression was observed as in MKN45 cells (Fig. 3.1.2 G and Fig. 3.1.2 H)

60
Figure 3.1.2 H. pylori enhances Siah1 and Siah2 mRNA and protein expression in GCCs.
(A-B) Graphical analysis of real time RT-PCR data of uninfected and H. pylori-infected
MKN45 cells reveal induced expression of Siah1 and Siah2 at transcriptional level. Bar
represents normalized data (mean±SEM, n=3), *P<0.05. (C-D) Representative western blot
results (n=3) showing expression of Siah1and Siah2 from whole cell lysates isolated from
uninfected and H. pylori-infected (MOI 200 and 6 h) KatoIII, MKN45 and AGS cells. (E-F)
Western blot results (n=3) showing Siah1and Siah2 expression from whole cell lysates
isolated from uninfected and 26695 or 8-1 H. pylori-infected MKN45 cells, respectively. (G-
H) Representative western blot (n=3) results showing expression of Siah1 (G) and (H) Siah2
in non-neoplastic immortalized HFE145 cells.
3.2. Identification of Transcription Factors Regulating Expression of Siah1 and Siah2
Very few reports exist that describe the transcriptional regulation of Siah proteins. In order to
understand the transcriptional regulation of Siah proteins, we analyzed both siah1 and siah2
promoters using the Genomatix Suite of sequence analysis tool MatInspector (professional
version 6.2.2). A number of transcription factor binding sites were implicated in siah1 and
siah2 promoters {as 5‟ untranslated region (UTR) might be involved in gene regulation, we
also analyzed UTR regions}. Oncogenic transcription factor E26 transformation-specific 2
(ETS2) was showing very high probability of binding to the siah1 5‟ UTR at the putative
ETS2 binding site (EBS). The core element GGAA/T [42, 104] was found to be located

61
between +92 to +95, GenBank: AJ400626.1. (Fig. 3.2.1). For siah2 promoter, ETS2 and
Twist-related protein1 (Twist1) showed very high probability of binding to the putative EBS
{(GGAA/T) between -465 bp to -462 bp} and Twist1 binding site (TBS) {(CANNTG), [105]
431 to 426 bp upstream of the siah2 transcription initiation site} (Fig. 3.2.2).
Figure 3.2.1 Analysis of human siah1 promoter and 5’UTR. The EBS of human siah1
promoter is depicted inside the box and is located between +92 to +95. The first exon of
siah1 cDNA is assumed to be at position +1 [42]
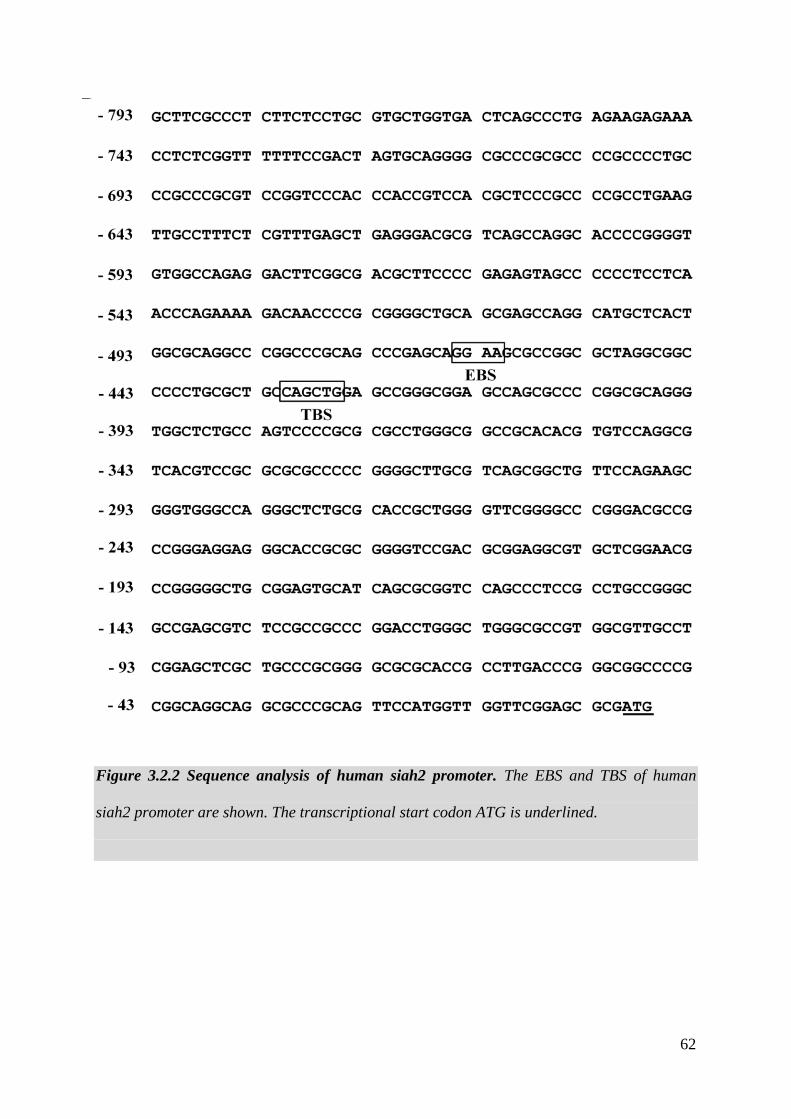
62
Figure 3.2.2 Sequence analysis of human siah2 promoter. The EBS and TBS of human
siah2 promoter are shown. The transcriptional start codon ATG is underlined.

63
The oncogenic transcription factor Twist1 belongs to the basic-helix-loop-helix
proteins (bHLH) family and its metastasis promoting role has been implicated in various
cancers [106] including gastric cancer [107]. Several members from the evolutionarily
conserved ETS family have been implicated in cancer progression along with ETS2 [108].
While Twist1 expression in GCCs were linked to the enhancment of lymph node and distant
metastasis [109], ETS2 expression was linked with increased apoptosis or tumor suppression
[110]. Therefore, it was imperative to study expression of ETS2 in relation to the Siah1
expression and Twist1 and ETS2 in relation to the expression of Siah2.
3.3. Induced Expression of ETS2, Twist1, Siah1 and Siah2 in H. pylori-Infected Human
GCCs
In order to study the expression of ETS2 and Twist1 proteins in H. pylori-infected human
GCCs, western blotting was performed with uninfected and H. pylori-infected whole cell
lysates. Dose-kinetics performed at 3 h and 6 h p.i. with MOI 100 and 200 showed that MOI
200 was more effective in inducing ETS2, Siah1 or Siah2 expression than MOI 100 (Fig.
3.3.1 A and Fig. 3.3.1 B). Similarly, 200 MOI was more effective in inducing Twist1 and
Siah2 expression than 100 MOI (Fig. 3.3.1 C).
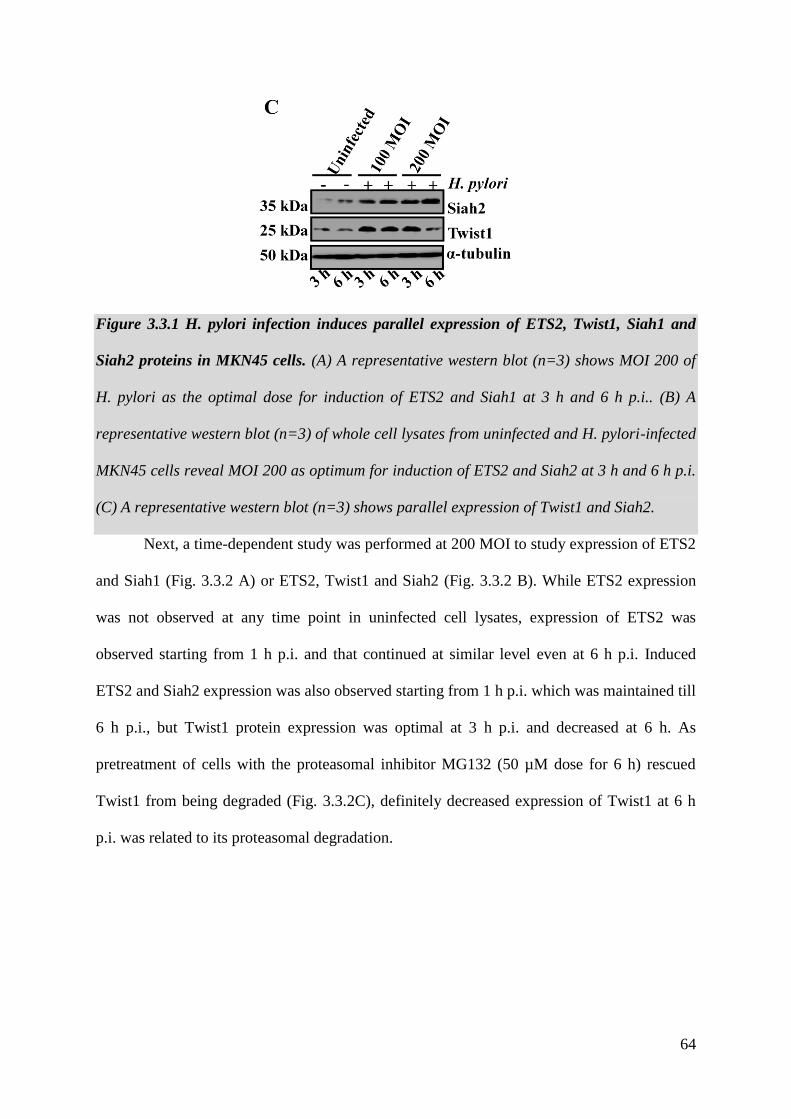
64
Figure 3.3.1 H. pylori infection induces parallel expression of ETS2, Twist1, Siah1 and
Siah2 proteins in MKN45 cells. (A) A representative western blot (n=3) shows MOI 200 of
H. pylori as the optimal dose for induction of ETS2 and Siah1 at 3 h and 6 h p.i.. (B) A
representative western blot (n=3) of whole cell lysates from uninfected and H. pylori-infected
MKN45 cells reveal MOI 200 as optimum for induction of ETS2 and Siah2 at 3 h and 6 h p.i.
(C) A representative western blot (n=3) shows parallel expression of Twist1 and Siah2.
Next, a time-dependent study was performed at 200 MOI to study expression of ETS2
and Siah1 (Fig. 3.3.2 A) or ETS2, Twist1 and Siah2 (Fig. 3.3.2 B). While ETS2 expression
was not observed at any time point in uninfected cell lysates, expression of ETS2 was
observed starting from 1 h p.i. and that continued at similar level even at 6 h p.i. Induced
ETS2 and Siah2 expression was also observed starting from 1 h p.i. which was maintained till
6 h p.i., but Twist1 protein expression was optimal at 3 h p.i. and decreased at 6 h. As
pretreatment of cells with the proteasomal inhibitor MG132 (50 µM dose for 6 h) rescued
Twist1 from being degraded (Fig. 3.3.2C), definitely decreased expression of Twist1 at 6 h
p.i. was related to its proteasomal degradation.

65
Figure 3.3.2 H. pylori infection induces ETS2, Twist1, Siah1 and Siah2 proteins in
MKN45 cells. (A) Time kinetics (1 h, 3 h and 6 h) of ETS2 and Siah1 protein expression in
total cell lysates of uninfected or H. pylori-infected MKN45 cells at MOI 200 (n=3). (B) A
representative western blot of time kinetics (1 h, 3 h and 6 h) for ETS2, Twist1 and Siah2
protein expression in cell lysates of uninfected or H. pylori-infected MKN45 cells at MOI 200
(n=3). (C) Western blot (n=4) depicting Twist1 protein expression in whole cell lysates from
uninfected or infected MKN45 cells that are either pretreated with 50µM of MG132 for 6 h
prior to infection or are left untreated.
To further study the status of ETS2 and Twist1 proteins in other human GCCs,
western blotting was performed with whole cell lysates of Kato III, AGS (MKN45 cells were
kept as positive control) at 3 h p.i. (MOI 200). Western blot analysis from three independent
experiments (n=3) revealed noticeable enhancement in ETS2 (Fig. 3.3.3 A) and Twist1

66
proteins (Fig. 3.3.3 B) in all cell lines. Furthermore, two other cag(-) strains of H. pylori 8-1
and D154 were also equally effective as the cag(+) strain 26695 in inducing ETS2 and
Twist1 expression (Fig. 3.3.3 C and Fig. 3.3.3 D). Further, expression of ETS2 and Twist1
proteins in non-neoplastic, immortalized HFE145 cells was studied in the presence or
absence of H. pylori. A similar effect of ETS2 and Twist1 expression was observed as in
MKN45 cells (Fig. 3.3.3 E and Fig. 3.3.3 F).

67
Figure 3.3.3 H. pylori infection induces ETS2 and Twist1 expression in GCCs (A) Western
blot (n=3) for ETS2 expression in whole cell lysates prepared from uninfected or infected
(MOI 200 of H. pylori for 3 h ) Kato III, MKN45 and AGS cells. (B) A representative western
blot (n=3) showing Twist1 expression in uninfected and H. pylori-infected Kato III, MKN45
and AGS cells. (C) A representative western blot (n=3) showing equal effectiveness of strain
8-1, D154 and 26695 in inducing ETS2 (D) and Twist1 protein expression. (E) A
representative western blot (n=3) result showing expression of ETS2 and (F) Twist1 in non-
neoplastic immortalized HFE145 cells.
To further study the expression of ETS2, Twist1, Siah1 and Siah2 proteins in gastric
adenocarcinoma, antral biopsy samples (stage III) were collected from consenting patients
undergoing gastric endoscopy. Fluorescence microscopy of gastric cancer biopsy samples
and adjacent non-cancer gastric tissue samples showed a marked increase in ETS2, Twist1,
Siah1 and Siah2 expression in adenocarcinoma biopsy samples compared to non-cancer
tissues (Fig. 3.3.4 A, Fig. 3.3.4 B, Fig. 3.3.4 C and Fig. 3.3.4 D). Nevertheless, the status of
H. pylori infection in studied adenocarcinoma samples could not be directly confirmed as
previous case histories were absent, urea-breath test and urease-test negativity of patients at
the time of sample collection. However, this data confirmed of coexistence of ETS2, Twist1,
Siah1 and Siah2 in gastric adenocarcinoma.

68
Figure 3.3.4 Coexistence of ETS2, Twist1, Siah1 and Siah2 proteins in human gastric
adenocarcinoma biopsy samples. Fluorescence microscopy of gastric cancer biopsy samples
and adjacent non-cancer gastric tissue samples (n=4 for each group) reveal induced
expression of (A) ETS2, (B) Twist1, (C) Siah1 and (D) Siah2 in cancer biopsy samples as
compared to non-cancer tissues. Arrows point to the epithelial lining of the gastric mucosa.
3.4. ETS2 Binds with the 5’ UTR of siah1 in H. pylori-Infected GCCs
To determine if indeed ETS2 binds with the EBS in the 5‟ UTR of siah1 in uninfected and H.
pylori-infected MKN45 cells, initially a DNA pull-down assay using streptavidin-coated
magnetic beads was performed. 5‟ biotinylated oligonucleotides of Siah1 promoter WT or
EBS-Mut (Appendix X) were coated on magnetic beads just prior to incubation with nuclear
lysates prepared from H. pylori-infected (MOI 200, 3 h) or uninfected MKN45 cells. Western
blotting of bead-bound proteins showed ETS2 binding with the WT EBS in the siah1 5‟UTR
only in the infected cells (Fig. 3.4.1A). Western blots of input nuclear lysates revealed
expression of ETS2 in the nuclear fraction (as was found in whole cell lysates). HDAC1 was
used as a nuclear loading control.
To further validate ETS2 binding with siah1 EBS, ChIP assay was performed.
Nuclear lysates of uninfected and H. pylori-infected (MOI 200, 3 h) MKN45 cells were
immunoprecipitated using ETS2-specific antibody. PCR products was obtained only from the
H. pylori-infected immunocomplex representing the siah1 promoter and 5‟ UTR flanking the

69
EBS (S= specific PCR product). No PCR product was obtained from the 5‟ far upstream
sequence (NS= non-specific PCR product) (Fig. 3.4.1 B).
Figure 3.4.1 Binding of ETS2 with the EBS of siah1 5’ UTR after H. pylori-infection.
(A)Western blot (n=3) showing binding of bead-bound proteins to the WT EBS biotinylated
oligo of the siah1 5’UTR only in the infected cells but not to the Mut EBS biotinylated oligo.
Western blot results of input nuclear lysates shows ETS2 protein expression in the infected
lanes. HDAC1 is the loading control. (B) ChIP analysis of uninfected and H. pylori-infected
ETS2 immunocomplex for siah1 EBS. IgG= immunoglobulin G; M= MW marker; NS= non-
specific primer, S= specific primer.

70
3.5. ETS2 and Twist1 Bind with siah2 Promoter in H. pylori-Infected GCCs
In vitro DNA binding assay was performed to study ETS2 binding with the siah2 EBS and
Twist1 binding with siah2TBS in uninfected and infected MKN45 cells. After 3 h of H.
pylori infection in MKN45 cells, nuclear extracts were prepared.5‟ biotinylated WT and Mut
EBS and TBS siah2 promoter oligonucleotides were synthesized (Appendix X). Magnetic
beads were coated with oligonucleotides as described before. Western blots performed with
bead-bound proteins revealed ETS2 binding with the siah2 EBS (Fig. 3.5.1 A) and Twist1
with siah2 TBS only after H. pylori infection (Fig 3.5.1 B). Input nuclear lysates were also
run simultaneously to study the expression of ETS2 (Fig. 3.5.1 A) and Twist1 (Fig. 3.5.1 B).
HDAC1 was used as a nuclear loading control. Western blot data of input lysates showed
both ETS2 and Twist1 increment in the nuclear fractions after H. pylori infection. While no
ETS2 expression was detected in the uninfected cells, low level of Twist1 expression was
observed in the nucleus of uninfected cells.
ChIP assay was also performed to detect binding of ETS2 and Twist1 to the siah2
promoter in vivo. Nuclear lysates of uninfected or 3 h of H. pylori- infected MKN45 cells
were assessed by using ETS2 (Fig. 3.5.1 C) and Twist1 (Fig. 3.5.1 D) antibodies. No PCR
product was obtained from the immunocomplex corresponding to the 5‟ far upstream
sequence (NS= non-specific PCR product) while PCR products of DNA in these
immunocomplexes corresponding to the siah2 promoter flanking the EBS and TBS (S=
specific PCR product) further confirmed ETS2 and Twist1 binding with the siah2 promoter.

71
Figure 3.5.1 ETS2 binds with the EBS and Twist1 binds with the TBS of siah2 promoter
after H. pylori-infection. (A) A representative western blot (n=3) results depicting H. pylori-
induced binding of ETS2 with the siah2 promoter (n=3). ETS2 binds specifically to the WT
EBS only but not with the EBS-Mut oligo. Western blot of input nuclear lysates shows ETS2
expression only in the infected lysates. HDAC1 is the loading control for nuclear lysates. (B)
Western blot results (n=3) depicting H. pylori-induced binding of Twist1 with the siah2
promoter (n=3). Twist1 binds to the WT TBS only but not with the TBS-Mut oligo. Western
blot of input nuclear lysates shows Twist1 expression only in the infected lysates. HDAC1 is
the loading control for nuclear lysates. (C)ChIP assay result of uninfected and H. pylori-
infected ETS2 immunocomplex for siah2 EBS. (D) ChIP assay result of uninfected and H.
pylori-infected Twist1 immunocomplex for siah2 TBS. IgG= immunoglobulin G; M= MW
marker; NS= non-specific primer, S= specific primer.
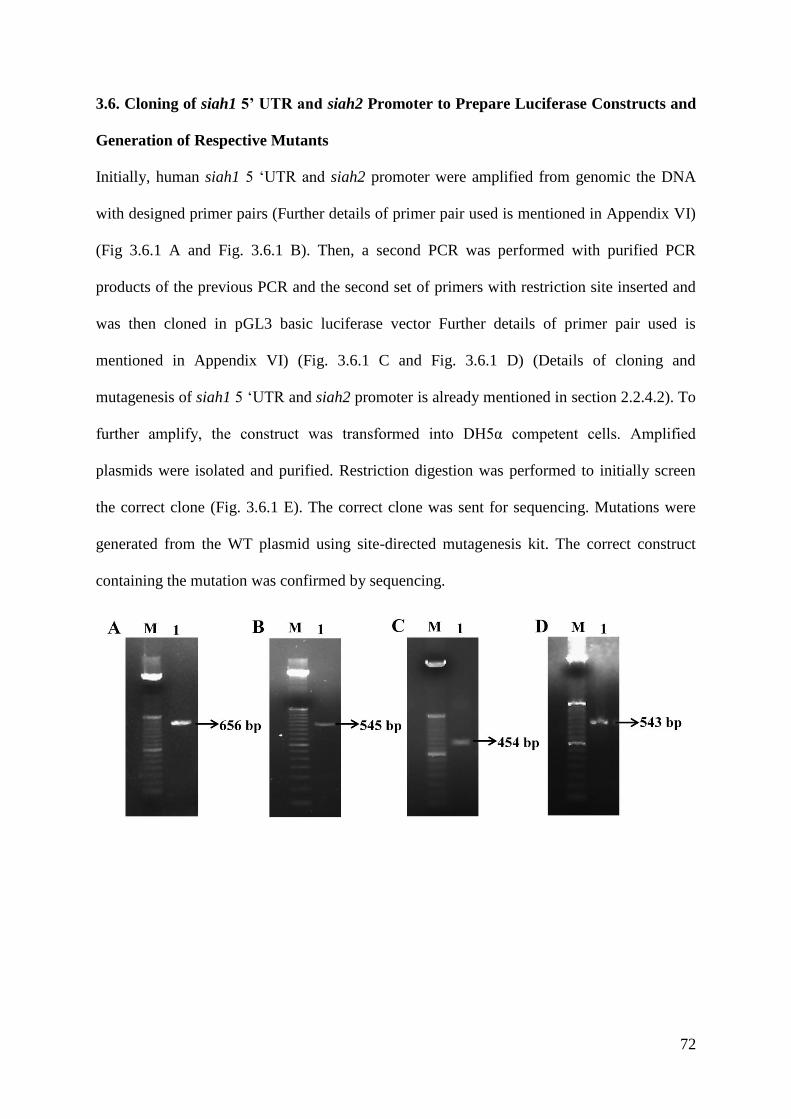
72
3.6. Cloning of siah1 5’ UTR and siah2 Promoter to Prepare Luciferase Constructs and
Generation of Respective Mutants
Initially, human siah1 5 „UTR and siah2 promoter were amplified from genomic the DNA
with designed primer pairs (Further details of primer pair used is mentioned in Appendix VI)
(Fig 3.6.1 A and Fig. 3.6.1 B). Then, a second PCR was performed with purified PCR
products of the previous PCR and the second set of primers with restriction site inserted and
was then cloned in pGL3 basic luciferase vector Further details of primer pair used is
mentioned in Appendix VI) (Fig. 3.6.1 C and Fig. 3.6.1 D) (Details of cloning and
mutagenesis of siah1 5 „UTR and siah2 promoter is already mentioned in section 2.2.4.2). To
further amplify, the construct was transformed into DH5α competent cells. Amplified
plasmids were isolated and purified. Restriction digestion was performed to initially screen
the correct clone (Fig. 3.6.1 E). The correct clone was sent for sequencing. Mutations were
generated from the WT plasmid using site-directed mutagenesis kit. The correct construct
containing the mutation was confirmed by sequencing.

73
Figure 3.6.1 Cloning of human siah1 5’UTR and siah2 promoter. (A) Amplification of
human siah1 5’UTR using primers without any restriction enzyme site. M=Marker lane (50
bp of DNA ladder was used) and Lane1=Desired PCR product. (B) Amplification of human
siah2 promoter using primers without any restriction enzyme site. M=Marker lane (50 bp of
DNA ladder was used) and Lane1=Desired PCR product. (C) Amplification of human siah1
5’UTR using the PCR product obtained from lane A as template and primers with restriction
enzyme site inserted. M=Marker lane (50 bp of DNA ladder was used) and Lane1=Desired
PCR product.(D) Amplification of human siah2 promoter using template of PCR product
obtained from lane B and primers with restriction enzyme site inserted. M=Marker lane (50
bp of DNA ladder was used) and Lane1=Desired PCR product. (E)Restriction digestion of
pGL3 basic, siah1 5’UTR cloned into pGL3 basic and siah2 promoter cloned into pGL3
basic using BamH1 and Hind III. M=Marker (1kbp DNA ladder), 1=undigested pGL3 basic,
2=Undigested siah2 promoter plasmid, 3= Undigested siah1 5’ UTR plasmid, 4=Restriction
digested pGL3 basic, 5=Restriction digested siah2 promoter plasmid, 6=Restriction digested
siah1 5’UTR plasmid.
3.7. ETS2 Augments siah1 Transcription in H. pylori-Infected GCCs
In order to study the role of ETS2 in siah1 transactivation, dual luciferase assay was
performed. For this, MKN45 cells were co-transfected with the WT or EBS-Mut siah1
reporter construct along with Renilla luciferase construct phRLTK followed by infection with
H. pylori for 1 h. Data revealed a significant enhancement in siah1 transactivation in H.
pylori-infected siah1 EBS-WT expressing cells, while reduced siah1 transactivation was

74
observed in EBS-mut expressing cells, thus confirming ETS2-mediated siah1 transcription in
H. pylori-infected GCCs (Fig.3.7.1 A). To further validate the role of ETS2 in siah1
transcription, ETS2 was ectopically expressed along with the WT siah1 5‟UTR construct and
the Renilla luciferase construct phRLTK. Dual luciferase assay was performed with
uninfected or 1 h H. pylori-infected cell lysates. Dual luciferase assay data revealed that
ectopic ETS2 expression could significantly augment H. pylori-mediated siah1 transcription
(Fig.3.7.1 B).
Figure 3.7.1 ETS2 enhances siah1 transcription in H. pylori-infected GCCs. (A) Graphical
analysis of luciferase activities (mean±SEM, n=3) of WT and ETS2-Mut siah1 5’ UTR-
transfected MKN45 cells. Bar graphs depict normalized data (mean±SEM, n=3), *P<0.05.
(D) Dual luciferase assay data showing the effect of ectopic ETS2 expression and H. pylori
infection and transcriptional activation of WT siah1 5’ UTR (mean±SEM, n=3) *P<0.05.
To know whether ETS2 regulates Siah1 expression at protein level, western blotting
was performed with whole cell lysates of MKN45 cells transfected with ETS2 siRNA or
control duplex and infected with H. pylori or left uninfected. A substantial reduction in Siah1
expression was observed in ETS2-suppressed cells as compared to the control duplex-

75
transfected cells after H. pylori infection, thus further confirming that ETS2 could mediate
Siah1 expression during H. pylori infection (Fig.3.7.2).
Figure 3.7.2 ETS2 enhances Siah1 protein expression in H. pylori-infected GCCs. Western
blot (n=3) result showing the effect of ETS2 suppression with Siah1 protein expression in
ETS2 siRNA transiently transfected MKN45 cells that were either left uninfected or infected
with H. pylori.
3.8. ETS2 and Twist1 Enhance siah2 Transcription in H. pylori-Infected GCCs
To study the role of ETS2 and Twist1 in siah2 transcription following H. pylori infection,
dual luciferase assays were performed. Simultaneous transfection of the Renilla luciferase
construct phRLTK and the WT or EBS or TBS-Mut siah2-reporter constructs in MKN45
cells showed a significant enhancement of siah2 transactivation in 2 h H. pylori-infected and
WT siah2 luciferase construct-transfected cells. Considerable reduction of siah2
transactivation in the EBS Mut (Fig.3.8.1 A) or TBS Mut-expressing infected cells (Fig.3.8.1
B) confirmed that ETS2 and Twist1 mediated siah2 transcription in H. pylori-infected GCCs.

76
Figure 3.8.1 ETS2 and Twist1 augment siah2 transcription in H. pylori-infected GCCs. (A)
Bar graphs depict dual luciferase assay results (mean±SEM, n=3) of WT and ETS2-Mut
siah2 promoter-transfected MKN45 cells in the presence or absence of H. pylori. Bar graphs
depict normalized data (mean±SEM, n=3), *P<0.05. (B) Graphical analysis of dual
luciferase activities (mean±SEM, n=3) driven by the WT and Twist1-Mut siah2 promoter-
transfected in MKN45 cells in the presence or absence of H. pylori. Bar graphs depict
normalized data (mean±SEM, n=3) *P<0.05.
Overexpression of ETS2 plasmid construct along with WT siah2 promoter construct
and the phRLTK construct followed by infection with H. pylori for 2 h revealed that ETS2
overexpression significantly enhanced siah2 transcription (Fig.3.8.2 A). Twist1
overexpression also showed a similar inducing effect on siah2 luciferase activity (Fig 3.8.2
B). ETS2 and Twist1 overexpression followed by western blotting further established the
importance of these proteins in inducing Siah2 expression following H. pylori infection (Fig.
3.8.2 C and Fig. 3.8.2 D, respectively). Although Twist1 expression was high in uninfected
Twist1-expressing cells as compared to the infected pcDNA3.1+-expressing cells, Siah2
expression was less in uninfected Twist1-expressing cells which indicated towards the

77
likelihood of post-translational modification(s) of Twist1 followed by H. pylori that might
have played a role in its activation.
Figure 3.8.2 ETS2 and Twist1 augment siah2 transcription and expression in H. pylori-
infected GCCs. (A) Bar graph of dual luciferase assay results (mean±SEM, n=3) showing the
efficacy of ectopically expressing ETS2 on transcriptional activation of WT siah2 promoter in
the presence of H. pylori. Bar graphs depict normalized data (mean±SEM, n=3), *P<0.05.
(B)Bar graph of dual luciferase assay results (mean±SEM, n=3) showing the efficacy of
ectopically expressing Twist1 on transcriptional activation of WT siah2 promoter in the
presence of H. pylori. Bar graphs depict normalized data (mean±SEM, n=3), *P<0.05. (C)
Western blot result (n=3) showing the effect of ETS2 overexpression in Siah2 protein in
uninfected and H. pylori-infected MKN45 cells. (D) Western blot results (n=3) showing the
78
effect of Twist1 ectopic expression on Siah2 protein expression in uninfected and H. pylori-
infected MKN45 cells.
3.9. Discussion
Despite a decline in gastric cancer incidence, it still remains a threat to patients with high rate
of mortality associated with it [111]. As it remains asymptomatic at its early stage, and its
detection usually occurs at late stage, mortality from this disease is associated with metastasis
which presents either with peritoneal dissemination or hematogenous spread to the liver and
lungs [112]. Infection with H. pylori is considered as the most potent risk factor for
development of gastric cancer. Understanding the mechanism contributing to gastric cancer
initiation and progression could provide a better therapeutic strategy. We observed induction
of both Siah1 and Siah2 proteins in H. pylori-infected GCCs and identified ETS2 and Twist1
as two novel inducers of Siah proteins. While ETS2 enhanced Siah1 transcription in H.
pylori-infected GCCs, Siah2 expression was induced by both ETS2 and Twist1. Gastric
cancer biopsy samples collected from metastatic gastric tumors also exhibited noticeable
induction of ETS2, Twist1, Siah1 and Siah2 expression that is in sync with our in vitro data.
Thus, we concluded that both Siah1 and Siah2 might play significant roles in H. pylori-
mediated gastric cancer metastasis and also predict that Siah1 and Siah2 along with ETS2 and
Twist1, could be promising therapeutic targets for gastric cancer.
ETS2 can concurrently induce both Siah proteins in H. pylori-infected GCCs. As
Twist1-binding site is absent in Siah1, we speculate that these isotypes can still be
differentially regulated since ETS2 and Twist1 expression might vary depending on the
staging of gastric cancer. Upregulation of Siah1 protein in p53-dependent manner has been
widely accepted to be associated with apoptosis [44, 103, 113]. Remarkably, we found that
Siah1 induction in H. pylori-infected GCCs was not dependent on p53 as it was also induced
after infection in p53-null Kato III cells. Our data corroborated earlier findings that showed
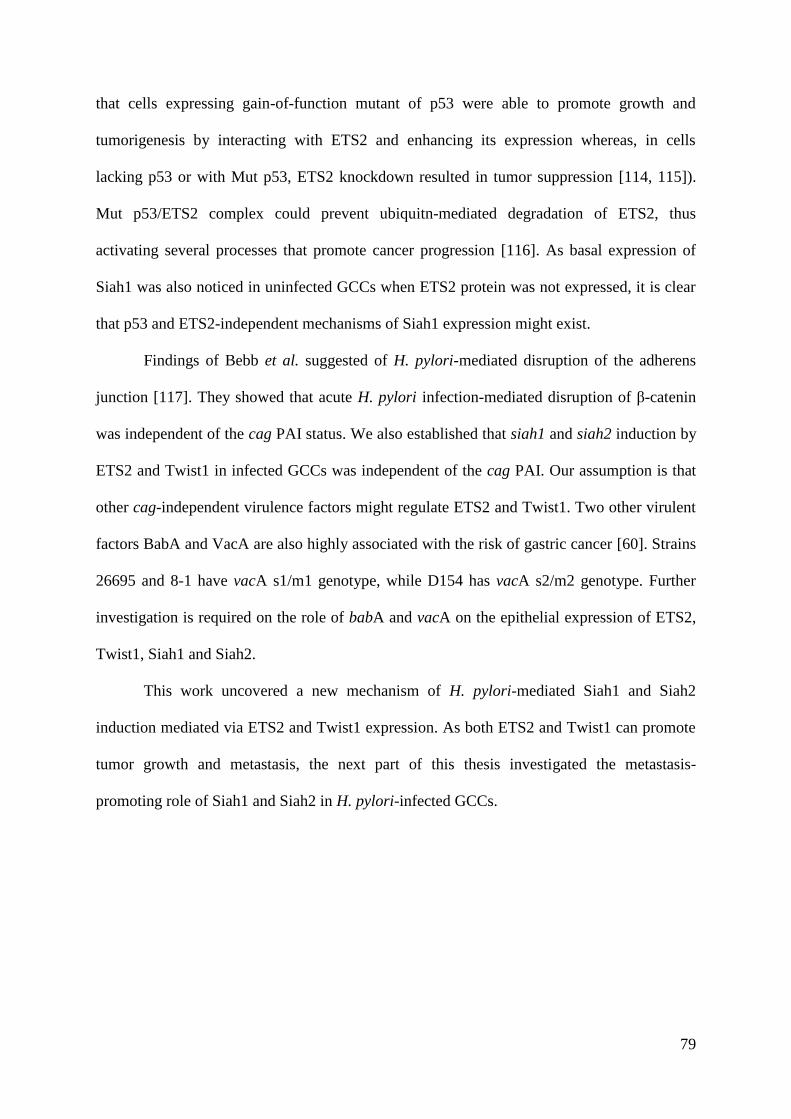
79
that cells expressing gain-of-function mutant of p53 were able to promote growth and
tumorigenesis by interacting with ETS2 and enhancing its expression whereas, in cells
lacking p53 or with Mut p53, ETS2 knockdown resulted in tumor suppression [114, 115]).
Mut p53/ETS2 complex could prevent ubiquitn-mediated degradation of ETS2, thus
activating several processes that promote cancer progression [116]. As basal expression of
Siah1 was also noticed in uninfected GCCs when ETS2 protein was not expressed, it is clear
that p53 and ETS2-independent mechanisms of Siah1 expression might exist.
Findings of Bebb et al. suggested of H. pylori-mediated disruption of the adherens
junction [117]. They showed that acute H. pylori infection-mediated disruption of β-catenin
was independent of the cag PAI status. We also established that siah1 and siah2 induction by
ETS2 and Twist1 in infected GCCs was independent of the cag PAI. Our assumption is that
other cag-independent virulence factors might regulate ETS2 and Twist1. Two other virulent
factors BabA and VacA are also highly associated with the risk of gastric cancer [60]. Strains
26695 and 8-1 have vacA s1/m1 genotype, while D154 has vacA s2/m2 genotype. Further
investigation is required on the role of babA and vacA on the epithelial expression of ETS2,
Twist1, Siah1 and Siah2.
This work uncovered a new mechanism of H. pylori-mediated Siah1 and Siah2
induction mediated via ETS2 and Twist1 expression. As both ETS2 and Twist1 can promote
tumor growth and metastasis, the next part of this thesis investigated the metastasis-
promoting role of Siah1 and Siah2 in H. pylori-infected GCCs.

80
Chapter 4
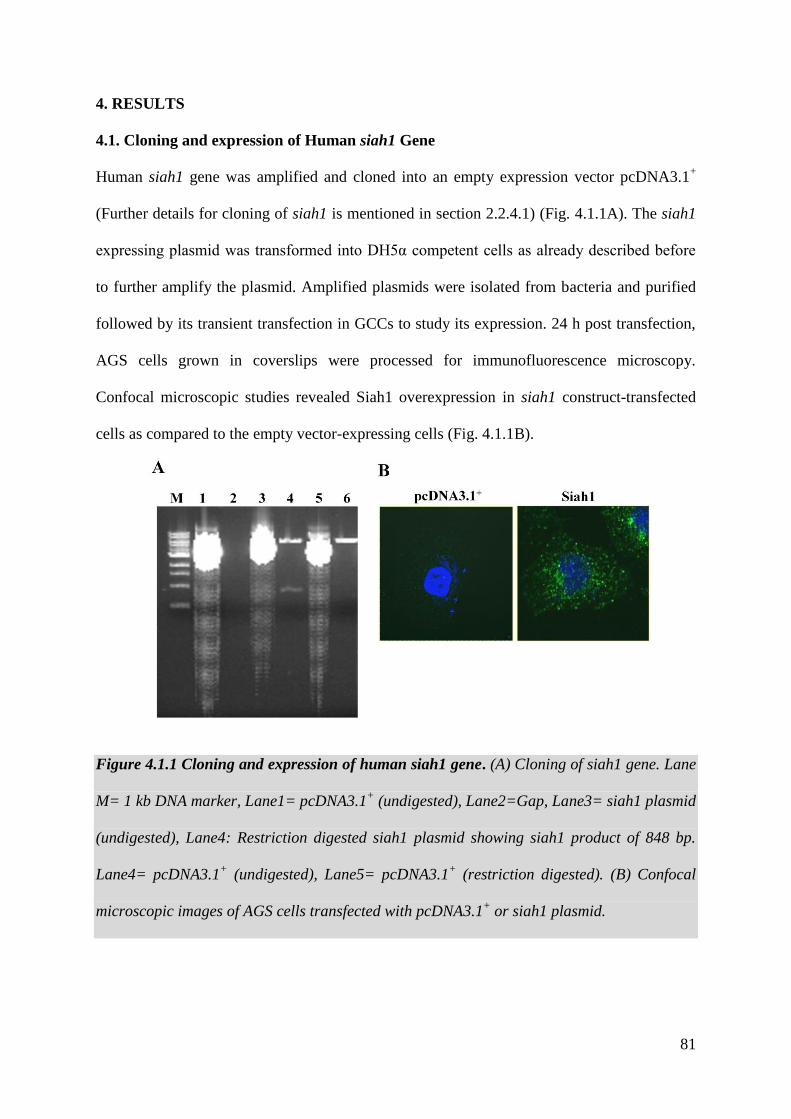
81
4. RESULTS
4.1. Cloning and expression of Human siah1 Gene
Human siah1 gene was amplified and cloned into an empty expression vector pcDNA3.1+
(Further details for cloning of siah1 is mentioned in section 2.2.4.1) (Fig. 4.1.1A). The siah1
expressing plasmid was transformed into DH5α competent cells as already described before
to further amplify the plasmid. Amplified plasmids were isolated from bacteria and purified
followed by its transient transfection in GCCs to study its expression. 24 h post transfection,
AGS cells grown in coverslips were processed for immunofluorescence microscopy.
Confocal microscopic studies revealed Siah1 overexpression in siah1 construct-transfected
cells as compared to the empty vector-expressing cells (Fig. 4.1.1B).
Figure 4.1.1 Cloning and expression of human siah1 gene. (A) Cloning of siah1 gene. Lane
M= 1 kb DNA marker, Lane1= pcDNA3.1+ (undigested), Lane2=Gap, Lane3= siah1 plasmid
(undigested), Lane4: Restriction digested siah1 plasmid showing siah1 product of 848 bp.
Lane4= pcDNA3.1+ (undigested), Lane5= pcDNA3.1
+ (restriction digested). (B) Confocal
microscopic images of AGS cells transfected with pcDNA3.1+ or siah1 plasmid.

82
4.2. Siah1 Mediates Degradation of Membrane-Bound β-catenin in H. pylori-Infected
GCCs
Siah1 was found to induce apoptosis and cell-cycle arrest by reducing cytosolic β-catenin
[27, 118]. Siah1-mediated phosphorylation-independent degradation of β-catenin was noticed
in the cytosolic compartment of hepatocytes which resulted in growth arrests and apoptosis in
hepatocytes [119]. This study also revealed that, Siah1 had no effect on the membrane-bound
β-catenin. Siah1-mediated degradation of cytosolic β-catenin was also reported in cervical
epithelial cancer cells [120]. Elevated expression of Siah1 protein was observed at 6 h time
point. So, time kinetics (6 h, 14 h and 20 h) were performed to study the expression of Siah1
protein and total β-catenin in H. pylori-infected cells. Western blotting was performed with
whole cell lysates prepared from H. pylori-infected or uninfected MKN45 cells. Data
revealed that although β-catenin expression level remained unchanged in the whole cell lysate
before or after H. pylori infection (Fig. 4.2.1 A). To study the status of β-catenin in
subcellular compartments, membrane-enriched fraction, cytosolic and nuclear fractions of H.
pylori-infected and uninfected cells were western blotted. Pan-cadherin, α-tubulin, and
histone-deacetylase 1 (HDAC1) served as loading controls for the membrane fraction,
cytoplasmic fraction and nuclear fractions, respectively. Data revealed that β-catenin was
only decreased in the membrane fraction only after 20 h of H. pylori infection and not in the
cytosolic or nuclear compartments (Fig. 4.2.1 B). However, no change in membrane-bound
Siah1 was noted following H. pylori infection. Siah2 was altogether absent in the membrane
fraction. However, in spite of elevated cytosolic Siah1 expression in H. pylori-infected cells,
there was no additional loss of β-catenin in the cytosol. On the contrary, nuclear fractions
exhibited a time-dependent upsurge in Siah1 expression but unchanged β-catenin expression
after H. pylori infection. Confocal microscopy of MKN45 cells further showed a reduction in
membrane-bound β-catenin after 20 h of H. pylori infection (Fig. 4.2.1 C). E-cadherin-null

83
AGS cells, on the contrary, showed induced Siah1 expression in both nuclear and cytosolic
fractions after H. pylori infection and cytosolic or nuclear β-catenin in AGS cells did not
decrease p.i. (Fig. 4.2.1 D).
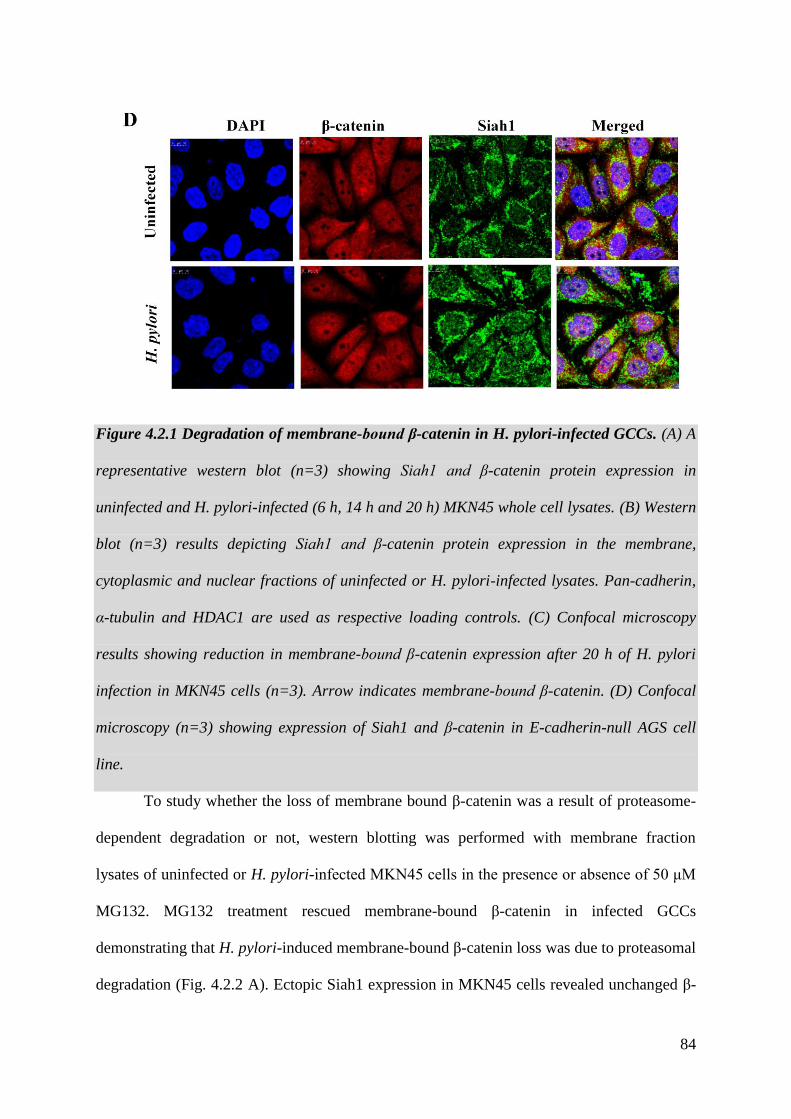
84
Figure 4.2.1 Degradation of membrane-bound β-catenin in H. pylori-infected GCCs. (A) A
representative western blot (n=3) showing Siah1 and β-catenin protein expression in
uninfected and H. pylori-infected (6 h, 14 h and 20 h) MKN45 whole cell lysates. (B) Western
blot (n=3) results depicting Siah1 and β-catenin protein expression in the membrane,
cytoplasmic and nuclear fractions of uninfected or H. pylori-infected lysates. Pan-cadherin,
α-tubulin and HDAC1 are used as respective loading controls. (C) Confocal microscopy
results showing reduction in membrane-bound β-catenin expression after 20 h of H. pylori
infection in MKN45 cells (n=3). Arrow indicates membrane-bound β-catenin. (D) Confocal
microscopy (n=3) showing expression of Siah1 and β-catenin in E-cadherin-null AGS cell
line.
To study whether the loss of membrane bound β-catenin was a result of proteasome-
dependent degradation or not, western blotting was performed with membrane fraction
lysates of uninfected or H. pylori-infected MKN45 cells in the presence or absence of 50 μM
MG132. MG132 treatment rescued membrane-bound β-catenin in infected GCCs
demonstrating that H. pylori-induced membrane-bound β-catenin loss was due to proteasomal
degradation (Fig. 4.2.2 A). Ectopic Siah1 expression in MKN45 cells revealed unchanged β-

85
catenin expression in whole cell lysate even after 20 h of H. pylori infection (Fig. 4.2.2 B)
while western blot with membrane fractions prepared from cells overexpressing Siah1
showed loss of β-catenin in the membrane which was markedly enhanced after H. pylori
infection (Fig. 4.2.2 C). Transient transfection of MKN45 cells with Siah1 siRNA revealed
unchanged β-catenin expression in whole cell lysates even after 20 h of H. pylori infection
(Fig. 4.2.2 D), but this rescued the degradation of membrane-bound β-catenin after 20 h of H.
pylori infection (Fig. 4.2.2 E),

86
Figure 4.2.2 Siah1-mediated degradation of membrane-bound β-catenin in H. pylori-
infected GCCs. (A) A representative western blot (n=3) showing the rescue of membrane-
bound β-catenin from degradation in 20 h of H. pylori-infected membrane lysates by
treatment with a proteasome inhibitor, MG132. (B) A representative western blot (n=3) of
whole cell lysates prepared from Siah1 or empty vector (pcDNA3.1+) transfected and H.
pylori-infected or uninfected MKN45 cells. α-tubulin is the loading control. (C) Further
reduction in membrane-bound β-catenin expression is seen in Siah1-overexpressed and H.
pylori-infected cells. (D) A representative western blot (n=3) of whole cell lysates prepared
from MKN45 cells transfected with siRNA of Siah1 or control duplex and infected (or
uninfected) with H. pylori. α-tubulin is the loading control. (E) Rescue of membrane-bound
β-catenin expression is seen in Siah1-supressed and H. pylori-infected cells.
Immunoprecipitation assay was performed on the membrane-rich lysates to study the
interaction of membrane-bound β-catenin with Siah1. Result (Fig. 4.2.3 A) revealed that
Siah1 and β-catenin interacted in uninfected or infected cells at 14 h and in uninfected cells at
20 h, β-catenin was completely absent in the immunoprecipitate after 20 h of infection.
Cadherin-catenin complex are known to be degraded by E3 ubiquitin ligases [99] and earlier
studies reported about loss of E-cadherin from the membrane in H. pylori-infected GCCs
[121, 122].To study the status of E-cadherin in the membrane of Siah1-overexpressed cells
after H. pylori infection, confocal microscopy was performed. For this, MKN45 cells
transfected with the empty vector (pcDNA3.1+) or Siah1 construct were infected with H.
pylori for 20 h in the presence or absence of either vehicle control or 50 μM MG132. Data
revealed that neither Siah1 overexpression nor H. pylori could induce E-cadherin loss in the
membrane fraction of GCCs (Fig. 4.2.3 B).

87
Figure 4.2.3 H. pylori infection induces Siah1 binding to the membrane-bound β-catenin
in infected GCCs but does not change membrane bound E-cadherin expression. (A)
Immunoprecipitation assay showing the interaction of membrane-bound β-catenin and Siah1.
Anti-Siah1 antibody is the immunoprecipitating antibody. Nonspecific band/ loading

88
control= immunoglobulin heavy chain band. (B) Confocal microscopy (n=3) depicting E-
cadherin expression in MKN45 cells that are transfected with empty vector (pcDNA3.1+) or
Siah1 construct and treated with MG132 following H. pylori-infection (or no infection).
4.3. Siah Induces Cell Migration and Invasion in H. pylori-Infected GCCs
Loss of β-catenin from the adherens junction induces cancer invasiveness [123-125]. A case
study has reported frequent loss of membrane-bound β-catenin in metastatic gastric cancer
[126]. Our findings have also shown Siah1-mediated loss of membrane-bound β-catenin
during H. pylori infection. As H. pylori infection in GCCs induces EMT and Siah2
expression also plays a critical role in metastasis [127], we were interested in studying the
effect of Siah1 and Siah2 expression on cell migration and invasion of H. pylori-infected
GCCs. Wound-healing assay was performed to study cell migration. For this study,
preference was given to the highly adherent AGS cells over the partially adherent MKN45
cells as the latter grow in clumps and hence it is difficult to get a uniform monolayer using
MKN45 cells. AGS cells stably expressing Siah1, Siah2 or empty vector were grown in
monolayer on 35 mm cell culture plates and a wound was marked with the help of a pipette
tip. Cells were incubated for 24 h in the presence or absence of H. pylori and cell migration
was monitored through imaging. Siah1 or Siah2-expressing H. pylori-infected AGS cells
showed significant time-dependent increase in cell migration as compared to the empty-
vector-expressing H. pylori-infected cells (Fig. 4.3.1 A and Fig. 4.3.1 B).
89
Figure 4.3.1 Elevated Siah expression enhances cell motility and wound-healing property
in H. pylori-infected GCCs. (A) A representative scratch assay result showing enhanced
migration potential of AGS cells stably expressing Siah1 and infected with H. pylori. Bar
graphs depicts the average number of migrated cells from three independent experiment
(mean±SEM, n=3), *P<0.05. Scale shown: 100 µm. (B) Scratch assay of AGS cells stably
expressing Siah2 or empty vector reveals enhanced migration potential of Siah2 expressing
cells infected with H. pylori. Bar graphs depict normalized data (mean±SEM, n=3),
*P<0.05. Scale shown: 100 µm.
To further validate our results, transwell migration and matrigel invasion assay were
also performed with Siah1 and Siah2-overexpressing AGS cells, or Siah1 and Siah2-
suppressed AGS cells. Significant induction in cell migration and invasion was observed with
exogenous Siah1 and Siah2-expressing infected cells (Fig. 4.3.2 A-D).

90
Figure 4.3.2 Elevated Siah expression enhances cell migration and invasiveness of H.
pylori-infected GCCs. (A) Results of transwell migration assay with AGS cells transiently
expressing Siah1 or empty vector and infected with H. pylori (or uninfected). Bar graphs
depicts the average number of migrated cells from three independent experiments
(mean±SEM, n=3), *P<0.05. Scale shown: 100 µm (B) Results of transwell migration assay
with uninfected or infected AGS cells transiently expressing Siah2 or empty vector. Bar graph
depicts the average number of migrated cells from three independent experiments
(mean±SEM, n=3), *P<0.05. Scale shown: 100 µm. (C) Results of transwell invasion assay
with AGS cells transiently transfected with Siah1 construct or pcDNA3.1+ show an increase
in invasiveness of H. pylori-infected GCCs. Bar graph depicts the average number of invaded
cells from three independent experiments (mean±SEM, n=3), *P<0.05 (D) Results of
transwell invasion assay with AGS cells transiently transfected with Siah2 construct or

91
pcDNA3.1+ shows an increase in invasiveness of H. pylori-infected GCCs. Bar graph depicts
the average number of invade cells from three independent experiments (mean±SEM, n=3),
*P<0.05.
Significant inhibition in cell migration and invasion was observed in siSiah1- and
siSiah2-expressing infected cells as compared to control siRNA-transfected and H. pylori-
infected cells (Fig. 4.3.3 A-D). These results were suggestive of positive effects of both Siah1
and Siah2 on H. pylori-induced cell migration and invasion. Anchorage independent growth
was also studied in MKN45 cells stably expressing Siah1 and Siah2. A substantial increase in
colony forming ability was observed in H. pylori-infected Siah1 and Siah2expressing cells as
compared to cells expressing the empty vector (Fig. 4.3.3 E and Fig. 4.3.3 F). Protein level of
Siah1 and Siah2 in stable cells are shown underneath of Figures 4.3.3 E and 4.3.3 F,
respectively.
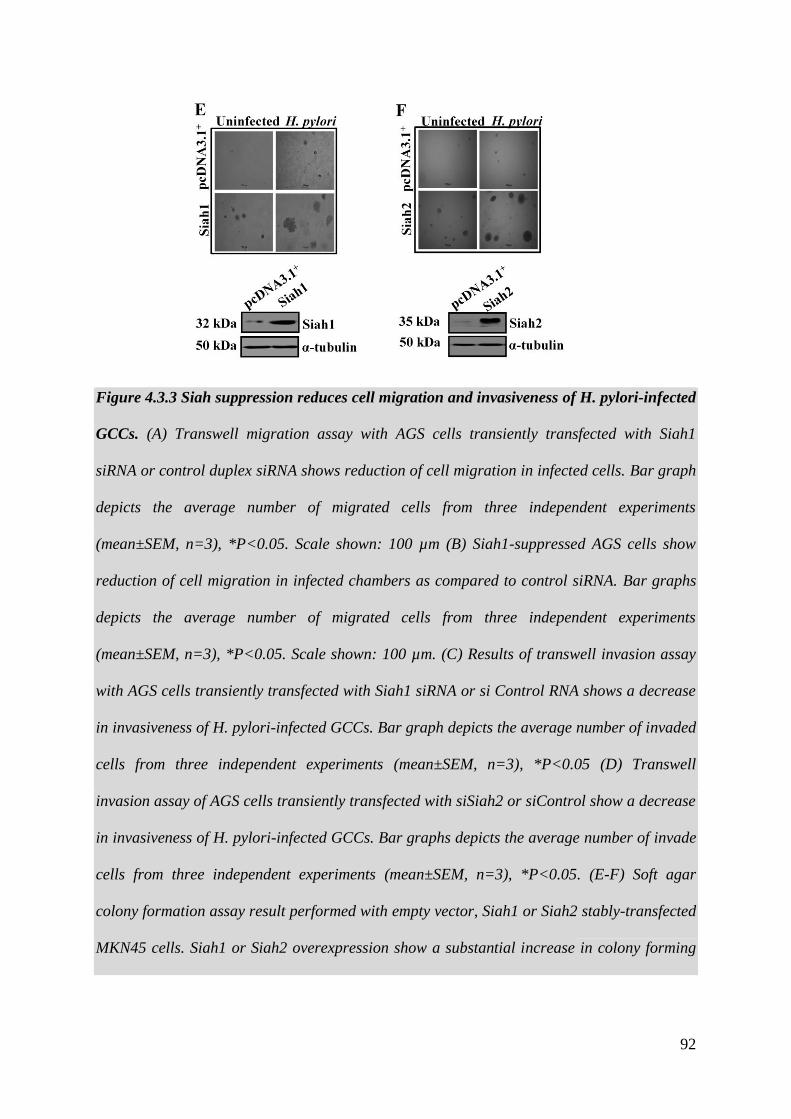
92
Figure 4.3.3 Siah suppression reduces cell migration and invasiveness of H. pylori-infected
GCCs. (A) Transwell migration assay with AGS cells transiently transfected with Siah1
siRNA or control duplex siRNA shows reduction of cell migration in infected cells. Bar graph
depicts the average number of migrated cells from three independent experiments
(mean±SEM, n=3), *P<0.05. Scale shown: 100 µm (B) Siah1-suppressed AGS cells show
reduction of cell migration in infected chambers as compared to control siRNA. Bar graphs
depicts the average number of migrated cells from three independent experiments
(mean±SEM, n=3), *P<0.05. Scale shown: 100 µm. (C) Results of transwell invasion assay
with AGS cells transiently transfected with Siah1 siRNA or si Control RNA shows a decrease
in invasiveness of H. pylori-infected GCCs. Bar graph depicts the average number of invaded
cells from three independent experiments (mean±SEM, n=3), *P<0.05 (D) Transwell
invasion assay of AGS cells transiently transfected with siSiah2 or siControl show a decrease
in invasiveness of H. pylori-infected GCCs. Bar graphs depicts the average number of invade
cells from three independent experiments (mean±SEM, n=3), *P<0.05. (E-F) Soft agar
colony formation assay result performed with empty vector, Siah1 or Siah2 stably-transfected
MKN45 cells. Siah1 or Siah2 overexpression show a substantial increase in colony forming

93
ability post H. pylori infection compared to cells expressing the empty vector. Accompanying
western blot result depicts Siah1 and Siah2 protein level in the used stable cells.
4.4. ETS2 and Twist1 Induce Migration and Invasion of H. pylori-Infected GCCs
Wound-healing assay was performed to study the role of ETS2 and Twist in inducing
migration of H. pylori-infected cells. Both ETS2 and Twist1-overexpressing AGS cells
showed significantly increased cell migration as compared to the empty vector-expressing H.
pylori-infected cells (Fig. 4.4.1 A and Fig. 4.4.1 B). Soft agar assay performed with ETS2
and Twist1 stably-expressing MKN45 cells showed dose-dependent increase in colony
formation after H. pylori infection (Fig. 4.4.1 C and Fig. 4.4.1 D). Western blot results shown
underneath the soft agar assay data of Fig 4.4.1 C and Fig 4.4.1 D indicated expression status
of ETS2 and Twist1 in the respective stable cells used for the assay.

94
Figure 4.4.1 ETS2 and Twist 1 enhances cell motility, wound-healing and invasive
property of H. pylori-infected GCCs. (A) A representative wound healing assay image
showing enhanced cell migration in AGS cells stably expressing ETS2 and infected with H.
pylori. Bar graph depicts the average number of migrated cells from three independent
experiments (mean±SEM, n=3), *P<0.05. Scale shown: 100 µm (B) Scratch assay of AGS
cells stably expressing Twist1 or empty vector reveals enhanced migration potential of Twist1
expressing stable cells infected with H. pylori. Bar graph depicts normalized data
(mean±SEM, n=3), *P<0.05. Scale shown: 100 µm. (C) A representative soft agar assay
study showing cells stably expressing ETS2 and infected with H. pylori have higher number
of colonies as compared to empty vector (D) A representative soft agar assay study showing
cells stably expressing Twist1 and infected with H. pylori have higher number of colonies as
compared to empty vector. Western blot results show ETS2 and Twist1 protein status in
stable cells.

95
4.5. Discussion
H. pylori colonization lasts for decades, induces inflammatory responses and histological
changes that disrupt epithelial tight junctions followed by loss of epithelial barrier function of
the gastric epithelium complemented by loss of epithelial cell morphology [98]. The loss of
epithelial cell-to-cell adhesions take place as disruption of the junctional cadherin-catenin
complex occurs via cagA and other virulence factors [98]. The present study reports for the
first time that the oncogenic protein ETS2 enhances both siah1 and siah2 transcription while
Twist1 enhances siah2 transcription in the H. pylori-infected GCCs. Further, up-regulation of
Siah1 and Siah2 in H. pylori-infected GCCs induces cell motility and invasiveness. Siah1 up-
regulation in H. pylori-infected GCCs promotes loss of the membrane-bound β-catenin
without affecting the cytoplasmic and nuclear pools. Moreover, we also show that H. pylori-
mediated Siah2 induction in GCCs does not cause degradation of E-cadherin from the cell
membrane.
The cadherin-catenin complex is an essential component of the adherens junctions
and act as bridge between cadherin receptors and the actin cytoskeleton [98]. E-cadherin
binding protein Hakai ubiquitinates and internalizes E-cadherin complex by endocytosis
resulting in disruption of cell-cell adhesion [99]. Internalization of E-cadherin complex via
endocytosis possibly plays a role in releasing β-catenin from the cadherin-catenin complex
[128]. Else, β-catenin phosphorylation at Tyr142
can also disrupt its interaction with α-catenin
and E-cadherin [129]. Another study has shown the E-cadherin-bound β-catenin accumulates
at the perinuclear endocytic recycling compartment and Wnt signalling activation translocates
the complex to the nucleus [130]. During EMT, Hakai-mediated ubiquitination of E-cadherin
results in sorting of cadherin to lysosomes, that redirect the latter from a recycling pathway to
a lysosome-mediated degradation process. Thus, the cell loses its ability to form cell-cell

96
contacts and remain motile [131]. E3 ubiquitin ligases Hakai and Ozz also target degradation
of membrane-bound β-catenin via the ubiquitin-mediated degradation pathway [99, 102]. Src-
mediated phosphorylation of the cadherin-catenin complex results in ubiquitination by Hakai.
Other ubiquitin ligases such as MDM2 and K5, can also ubiquitinate and degrade E-cadherin
[132, 133]. However, this study is the first one to report that the E3 ubiquitin ligase Siah1
enhances degradation of the cell membrane-bound β-catenin in the H. pylori-infected GCCs
and inhibition of proteasomal degradation rescues membrane-bound β-catenin from being
degraded by Siah1.
This work also shows that loss of membrane-bound β-catenin mediated by H. pylori-
infection is independent of membrane E-cadherin as there is no change in membrane-
localized E-cadherin following H. pylori infection as well as Siah1 up-regulation. H. pylori
virulence factor CagA destabilizes the cadherin-catenin complex, thereby inducing
degradation of cytoplasmic β-catenin and accumulation of nuclear β-catenin [97]. However,
this study confirms that β-catenin is not lost from the cytosol and no increment in nuclear β-
catenin occurs in MKN45 cells infected with H. pylori. Our findings matches with the report
by Bebb et al. which shows that H. pylori-infection decreases membrane β-catenin without
accompanying increased cytosolic and nuclear pool [117]. As only nonphosphorylated CagA
interacts with E-cadherin [42, 44] and CagA always gets phosphorylated in the H. pylori-
infected host cell [45, 46], disruption of E-cadherin-β-catenin complex is not CagA-mediated.
This study reveals that loss of membrane-bound β-catenin occurs only in H. pylori-infected
GCCs but not in uninfected GCCs. This could be due to the induced activity of Siah1 in H.
pylori-infected GCCs. Further research is required to identify the possible role of
posttranslational modification(s) in regulating Siah1 activity.
Like Siah1, Siah2 also induces migration ability and invasiveness of H. pylori-
infected cells. As Siah2 is absent in the membrane fraction, the metastasis inducing role for

97
Siah2 is possibly linked to some other mechanism other than membrane-bound β-catenin
degradation in H. pylori-infected cells. Recently, Siah2 is reported to disrupt of the tight
junction integrity and cell polarity in hypoxic bone-osteosarcoma cells by degrading the
tumor-suppressor protein apoptosis-stimulating proteins of p532 (ASPP2) [134]. In the
majority of hepatic cell carcinomas (HCCs), nuclear accumulation of Siah2 is correlated with
induced hepatic cell proliferation, tumor progression and distant metastasis [135]. The role of
nuclear Siah2 in H. pylori-infected GCCs needs to be studied in future.
H. pylori are known to enhance cell migration [136, 137]. However, identification of
the role of Siah1 and Siah2 in inducing cell motility in H. pylori-infected GCCs has made this
study very important to understand H. pylori-mediated gastric carcinogenesis and metastatic
progression. This study also gives clue that although ETS2 is the inducer of both Siah1 and
Siah2, their effect on β-catenin are not the same. It is therefore imperative to study stage-
specific expression of Siah proteins in gastric cancer which will definitely enrich us to better
understand the molecular mechanism of gastric cancer.

98
SUMMARRY AND CONCLUSION
Chapter 5
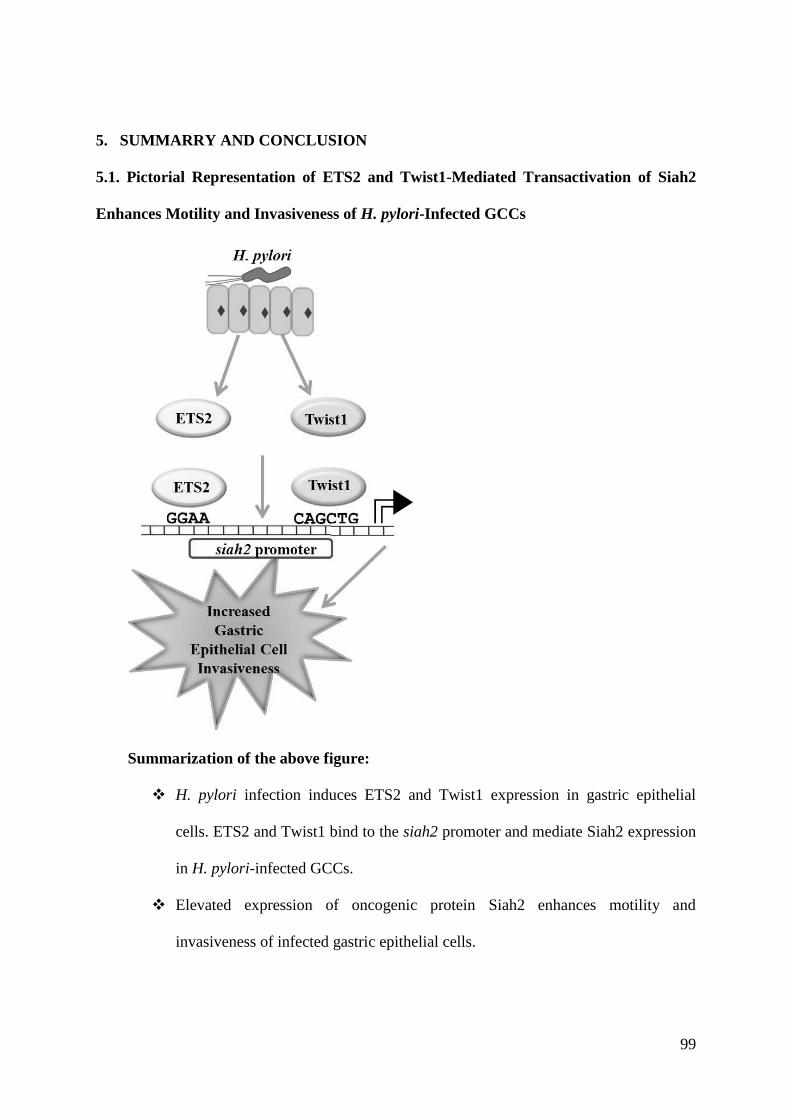
99
5. SUMMARRY AND CONCLUSION
5.1. Pictorial Representation of ETS2 and Twist1-Mediated Transactivation of Siah2
Enhances Motility and Invasiveness of H. pylori-Infected GCCs
Summarization of the above figure:
H. pylori infection induces ETS2 and Twist1 expression in gastric epithelial
cells. ETS2 and Twist1 bind to the siah2 promoter and mediate Siah2 expression
in H. pylori-infected GCCs.
Elevated expression of oncogenic protein Siah2 enhances motility and
invasiveness of infected gastric epithelial cells.

100
5.2. ETS2-Mediated Siah1 Induction Enhances Membrane-Bound β-catenin
Degradation in the H. pylori-Infected GCCs
Summary of the above figure
H. pylori infection induces ETS2 expression. ETS2 binds to the siah1 promoter and
promotes siah1 transcription in H. pylori-infected gastric cancer cells.
Induced expression of Siah1 results in the degradation of membrane bound β-catenin.
As a result, infected cells become more migratory and invasive.
In conclusion, this thesis work reveals crucial roles of Siah proteins during H. pylori
infection in gastric cancer cells promoting invasion and migration. Our work shows a novel
mechanism of ETS2-mediated induction of Siah1 and ETS2 and Twist1-mediated induction
of Siah2 in H. pylori-infected gastric epithelial cancer cells. Furthermore, our findings
provide an important insight towards the fact that although Siah1 and Siah2 are induced by
ETS2 and have roles in gastric cancer metastasis, their cellular targets are not the same. Thus,
Siah1 and Siah2 are not showing functional redundancy at least in promoting gastric cancer.

101
BIBLIOGRAPHY

102
1. Ciechanover, A. (1998) The ubiquitin-proteasome pathway: on protein death and cell life,
The EMBO journal. 17, 7151-60.
2. Dikic, I., Wakatsuki, S. & Walters, K. J. (2009) Ubiquitin-binding domains - from
structures to functions, Nature reviews Molecular cell biology. 10, 659-71.
3. Kim, H. M., Yu, Y. & Cheng, Y. (2011) Structure characterization of the 26S proteasome,
Biochimica et biophysica acta. 1809, 67-79.
4. Kowalski, J. R. & Juo, P. (2012) The role of deubiquitinating enzymes in synaptic
function and nervous system diseases, Neural plasticity. 2012, 892749.
5. Rotin, D. & Kumar, S. (2009) Physiological functions of the HECT family of ubiquitin
ligases, Nature reviews Molecular cell biology. 10, 398-409.
6. Li, W., Bengtson, M. H., Ulbrich, A., Matsuda, A., Reddy, V. A., Orth, A., Chanda, S. K.,
Batalov, S. & Joazeiro, C. A. (2008) Genome-wide and functional annotation of human E3
ubiquitin ligases identifies MULAN, a mitochondrial E3 that regulates the organelle's
dynamics and signaling, PloS one. 3, e1487.
7. Haglund, K. & Dikic, I. (2012) The role of ubiquitylation in receptor endocytosis and
endosomal sorting, Journal of cell science. 125, 265-75.
8. Freemont, P. S. (2000) RING for destruction?, Current biology : CB. 10, R84-7.
9. Metzger, M. B., Hristova, V. A. & Weissman, A. M. (2012) HECT and RING finger
families of E3 ubiquitin ligases at a glance, Journal of cell science. 125, 531-7.
10. Liew, C. W., Sun, H., Hunter, T. & Day, C. L. (2010) RING domain dimerization is
essential for RNF4 function, The Biochemical journal. 431, 23-9.
11. Mace, P. D., Linke, K., Feltham, R., Schumacher, F. R., Smith, C. A., Vaux, D. L., Silke,
J. & Day, C. L. (2008) Structures of the cIAP2 RING domain reveal conformational changes
associated with ubiquitin-conjugating enzyme (E2) recruitment, The Journal of biological
chemistry. 283, 31633-40.

103
12. Polekhina, G., House, C. M., Traficante, N., Mackay, J. P., Relaix, F., Sassoon, D. A.,
Parker, M. W. & Bowtell, D. D. (2002) Siah ubiquitin ligase is structurally related to TRAF
and modulates TNF-alpha signaling, Nature structural biology. 9, 68-75.
13. Brzovic, P. S., Rajagopal, P., Hoyt, D. W., King, M. C. & Klevit, R. E. (2001) Structure
of a BRCA1-BARD1 heterodimeric RING-RING complex, Nature structural biology. 8,
833-7.
14. Buchwald, G., van der Stoop, P., Weichenrieder, O., Perrakis, A., van Lohuizen, M. &
Sixma, T. K. (2006) Structure and E3-ligase activity of the Ring-Ring complex of polycomb
proteins Bmi1 and Ring1b, The EMBO journal. 25, 2465-74.
15. Hua, Z. & Vierstra, R. D. (2011) The cullin-RING ubiquitin-protein ligases, Annual
review of plant biology. 62, 299-334.
16. Chen, P. & Yao, G. D. (2016) The role of cullin proteins in gastric cancer, Tumour
biology : the journal of the International Society for Oncodevelopmental Biology and
Medicine. 37, 29-37.
17. Welcsh, P. L. & King, M. C. (2001) BRCA1 and BRCA2 and the genetics of breast and
ovarian cancer, Human molecular genetics. 10, 705-13.
18. Liyasova, M. S., Ma, K. & Lipkowitz, S. (2015) Molecular pathways: cbl proteins in
tumorigenesis and antitumor immunity-opportunities for cancer treatment, Clinical cancer
research : an official journal of the American Association for Cancer Research. 21, 1789-94.
19. Kang, J. M., Park, S., Kim, S. J., Hong, H. Y., Jeong, J. & Kim, H. S. (2012) CBL
enhances breast tumor formation by inhibiting tumor suppressive activity of TGF-beta
signaling, Oncogene. 31, 5123-31.
20. Dong, Q., Liu, Y. P., Qu, X. J., Hou, K. Z. & Li, L. L. (2010) [Expression of c-Cbl, Cbl-
b, and epidermal growth factor receptor in gastric carcinoma and their clinical significance],
Chinese journal of cancer. 29, 59-64.
104
21. Lo, F. Y., Tan, Y. H., Cheng, H. C., Salgia, R. & Wang, Y. C. (2011) An E3 ubiquitin
ligase: c-Cbl: a new therapeutic target of lung cancer, Cancer. 117, 5344-50.
22. Jiao, X., Jin, B., Qu, X., Yan, S., Hou, K., Liu, Y. & Hu, X. (2011) [Expressions of c-
Cbl, Cbl-b and EGFR and its role of prognosis in NSCLC], Zhongguo fei ai za zhi = Chinese
journal of lung cancer. 14, 512-7.
23. Haupt, Y., Maya, R., Kazaz, A. & Oren, M. (1997) Mdm2 promotes the rapid
degradation of p53, Nature. 387, 296-9.
24. Rankin, E. B. & Giaccia, A. J. (2016) Hypoxic control of metastasis, Science. 352, 175-
80.
25. Gossage, L., Eisen, T. & Maher, E. R. (2015) VHL, the story of a tumour suppressor
gene, Nature reviews Cancer. 15, 55-64.
26. Habelhah, H., Frew, I. J., Laine, A., Janes, P. W., Relaix, F., Sassoon, D., Bowtell, D. D.
& Ronai, Z. (2002) Stress-induced decrease in TRAF2 stability is mediated by Siah2, The
EMBO journal. 21, 5756-65.
27. Matsuzawa, S. I. & Reed, J. C. (2001) Siah-1, SIP, and Ebi collaborate in a novel
pathway for beta-catenin degradation linked to p53 responses, Molecular cell. 7, 915-26.
28. Wong, C. S., Sceneay, J., House, C. M., Halse, H. M., Liu, M. C., George, J., Hunnam,
T. C., Parker, B. S., Haviv, I., Ronai, Z., Cullinane, C., Bowtell, D. D. & Moller, A. (2012)
Vascular normalization by loss of Siah2 results in increased chemotherapeutic efficacy,
Cancer research. 72, 1694-704.
29. House, C. M., Moller, A. & Bowtell, D. D. (2009) Siah proteins: novel drug targets in the
Ras and hypoxia pathways, Cancer research. 69, 8835-8.
30. Brauckhoff, A., Malz, M., Tschaharganeh, D., Malek, N., Weber, A., Riener, M. O., Soll,
C., Samarin, J., Bissinger, M., Schmidt, J., Longerich, T., Ehemann, V., Schirmacher, P. &

105
Breuhahn, K. (2011) Nuclear expression of the ubiquitin ligase seven in absentia homolog
(SIAH)-1 induces proliferation and migration of liver cancer cells, J Hepatol. 55, 1049-57.
31. Nagano, Y., Fukushima, T., Okemoto, K., Tanaka, K., Bowtell, D. D., Ronai, Z., Reed, J.
C. & Matsuzawa, S. (2011) Siah1/SIP regulates p27(kip1) stability and cell migration under
metabolic stress, Cell Cycle. 10, 2592-602.
32. Hara, M. R., Agrawal, N., Kim, S. F., Cascio, M. B., Fujimuro, M., Ozeki, Y.,
Takahashi, M., Cheah, J. H., Tankou, S. K., Hester, L. D., Ferris, C. D., Hayward, S. D.,
Snyder, S. H. & Sawa, A. (2005) S-nitrosylated GAPDH initiates apoptotic cell death by
nuclear translocation following Siah1 binding, Nature cell biology. 7, 665-74.
33. Nadeau, R. J., Toher, J. L., Yang, X., Kovalenko, D. & Friesel, R. (2007) Regulation of
Sprouty2 stability by mammalian Seven-in-Absentia homolog 2, J Cell Biochem. 100, 151-
60.
34. Nakayama, K., Frew, I. J., Hagensen, M., Skals, M., Habelhah, H., Bhoumik, A.,
Kadoya, T., Erdjument-Bromage, H., Tempst, P., Frappell, P. B., Bowtell, D. D. & Ronai, Z.
(2004) Siah2 regulates stability of prolyl-hydroxylases, controls HIF1alpha abundance, and
modulates physiological responses to hypoxia, Cell. 117, 941-52.
35. Susini, L., Passer, B. J., Amzallag-Elbaz, N., Juven-Gershon, T., Prieur, S., Privat, N.,
Tuynder, M., Gendron, M. C., Israel, A., Amson, R., Oren, M. & Telerman, A. (2001) Siah-1
binds and regulates the function of Numb, Proceedings of the National Academy of Sciences
of the United States of America. 98, 15067-72.
36. Ma, B., Chen, Y., Chen, L., Cheng, H., Mu, C., Li, J., Gao, R., Zhou, C., Cao, L., Liu, J.,
Zhu, Y., Chen, Q. & Wu, S. (2015) Hypoxia regulates Hippo signalling through the SIAH2
ubiquitin E3 ligase, Nature cell biology. 17, 95-103.
37. Wong, C. S. & Moller, A. (2013) Siah: a promising anticancer target, Cancer research.
73, 2400-6.
106
38. Frasor, J., Danes, J. M., Funk, C. C. & Katzenellenbogen, B. S. (2005) Estrogen down-
regulation of the corepressor N-CoR: mechanism and implications for estrogen derepression
of N-CoR-regulated genes, Proceedings of the National Academy of Sciences of the United
States of America. 102, 13153-7.
39. MacLeod, R. J., Hayes, M. & Pacheco, I. (2007) Wnt5a secretion stimulated by the
extracellular calcium-sensing receptor inhibits defective Wnt signaling in colon cancer cells,
Am J Physiol Gastrointest Liver Physiol. 293, G403-11.
40. Jing, Y., Liu, L. Z., Jiang, Y., Zhu, Y., Guo, N. L., Barnett, J., Rojanasakul, Y., Agani, F.
& Jiang, B. H. (2012) Cadmium increases HIF-1 and VEGF expression through ROS, ERK,
and AKT signaling pathways and induces malignant transformation of human bronchial
epithelial cells, Toxicol Sci. 125, 10-9.
41. Mo, C., Dai, Y., Kang, N., Cui, L. & He, W. (2012) Ectopic expression of human MutS
homologue 2 on renal carcinoma cells is induced by oxidative stress with interleukin-18
promotion via p38 mitogen-activated protein kinase (MAPK) and c-Jun N-terminal kinase
(JNK) signaling pathways, The Journal of biological chemistry. 287, 19242-54.
42. Maeda, A., Yoshida, T., Kusuzaki, K. & Sakai, T. (2002) The characterization of the
human Siah-1 promoter(1), FEBS letters. 512, 223-6.
43. Xie, W., Jin, L., Mei, Y. & Wu, M. (2009) E2F1 represses beta-catenin/TCF activity by
direct up-regulation of Siah1, Journal of cellular and molecular medicine. 13, 1719-27.
44. Kim, C. J., Cho, Y. G., Park, C. H., Jeong, S. W., Nam, S. W., Kim, S. Y., Lee, S. H.,
Yoo, N. J., Lee, J. Y. & Park, W. S. (2004) Inactivating mutations of the Siah-1 gene in
gastric cancer, Oncogene. 23, 8591-6.
45. Ferro, A., Peleteiro, B., Malvezzi, M., Bosetti, C., Bertuccio, P., Levi, F., Negri, E., La
Vecchia, C. & Lunet, N. (2014) Worldwide trends in gastric cancer mortality (1980-2011),
with predictions to 2015, and incidence by subtype, Eur J Cancer. 50, 1330-44.

107
46. Ferlay, J., Shin, H. R., Bray, F., Forman, D., Mathers, C. & Parkin, D. M. (2010)
Estimates of worldwide burden of cancer in 2008: GLOBOCAN 2008, International journal
of cancer. 127, 2893-917.
47. Parkin, D. M., Bray, F., Ferlay, J. & Pisani, P. (2001) Estimating the world cancer
burden: Globocan 2000, International journal of cancer. 94, 153-6.
48. Goh, L. Y., Leow, A. H. & Goh, K. L. (2014) Observations on the epidemiology of
gastrointestinal and liver cancers in the Asia-Pacific region, Journal of digestive diseases. 15,
463-8.
49. Lauren, P. (1965) The Two Histological Main Types of Gastric Carcinoma: Diffuse and
So-Called Intestinal-Type Carcinoma. An Attempt at a Histo-Clinical Classification, Acta
pathologica et microbiologica Scandinavica. 64, 31-49.
50. An, J. Y., Pak, K. H., Inaba, K., Cheong, J. H., Hyung, W. J. & Noh, S. H. (2011)
Relevance of lymph node metastasis along the superior mesenteric vein in gastric cancer, The
British journal of surgery. 98, 667-72.
51. Tiwari, N., Gheldof, A., Tatari, M. & Christofori, G. (2012) EMT as the ultimate
survival mechanism of cancer cells, Seminars in cancer biology. 22, 194-207.
52. Thompson, E. W. & Haviv, I. (2011) The social aspects of EMT-MET plasticity, Nature
medicine. 17, 1048-9.
53. GOODWIN, C. S., ARMSTRONG, J. A., CHILVERS, T., PETERS, M., COLLINS, M.
D., SLY, L., McCONNELL, W. & HARPER, W. E. S. (1989) Transfer of Campylobacter
pylori and Campylobacter mustelae to Helicobacter gen. nov. as Helicobacter pylori comb.
nov. and Helicobacter mustelae comb. nov., Respectively, International Journal of
Systematic and Evolutionary Microbiology. 39, 397-405.

108
54. Goodwin, C. S., McCulloch, R. K., Armstrong, J. A. & Wee, S. H. (1985) Unusual
cellular fatty acids and distinctive ultrastructure in a new spiral bacterium (Campylobacter
pyloridis) from the human gastric mucosa, Journal of medical microbiology. 19, 257-67.
55. Jones, D. M., Curry, A. & Fox, A. J. (1985) An ultrastructural study of the gastric
campylobacter-like organism 'Campylobacter pyloridis', Journal of general microbiology.
131, 2335-41.
56. Linz, B., Balloux, F., Moodley, Y., Manica, A., Liu, H., Roumagnac, P., Falush, D.,
Stamer, C., Prugnolle, F., van der Merwe, S. W., Yamaoka, Y., Graham, D. Y., Perez-
Trallero, E., Wadstrom, T., Suerbaum, S. & Achtman, M. (2007) An African origin for the
intimate association between humans and Helicobacter pylori, Nature. 445, 915-8.
57. Mishra, S. (2013) Is Helicobacter pylori good or bad?, European journal of clinical
microbiology & infectious diseases : official publication of the European Society of Clinical
Microbiology. 32, 301-4.
58. Marshall, B. J. & Warren, J. R. (1984) Unidentified curved bacilli in the stomach of
patients with gastritis and peptic ulceration, Lancet. 1, 1311-5.
59. El-Omar, E. M., Oien, K., Murray, L. S., El-Nujumi, A., Wirz, A., Gillen, D., Williams,
C., Fullarton, G. & McColl, K. E. (2000) Increased prevalence of precancerous changes in
relatives of gastric cancer patients: critical role of H. pylori, Gastroenterology. 118, 22-30.
60. Khatoon, J., Rai, R. P. & Prasad, K. N. (2016) Role of Helicobacter pylori in gastric
cancer: Updates, World journal of gastrointestinal oncology. 8, 147-58.
61. Oluwasola, A. O. (2014) Genetic determinants and clinico-pathological outcomes of
helicobacter pylori infection, Annals of Ibadan postgraduate medicine. 12, 22-30.
62. Amieva, M. R. & El-Omar, E. M. (2008) Host-bacterial interactions in Helicobacter
pylori infection, Gastroenterology. 134, 306-23.

109
63. Castano-Rodriguez, N., Kaakoush, N. O. & Mitchell, H. M. (2014) Pattern-recognition
receptors and gastric cancer, Frontiers in immunology. 5, 336.
64. Conteduca, V., Sansonno, D., Lauletta, G., Russi, S., Ingravallo, G. & Dammacco, F.
(2013) H. pylori infection and gastric cancer: state of the art (review), International journal
of oncology. 42, 5-18.
65. Khalifa, M. M., Sharaf, R. R. & Aziz, R. K. (2010) Helicobacter pylori: a poor man's gut
pathogen?, Gut Pathogens. 2, 1-12.
66. Kusters, J. G., van Vliet, A. H. & Kuipers, E. J. (2006) Pathogenesis of Helicobacter
pylori infection, Clinical microbiology reviews. 19, 449-90.
67. Backert, S., Clyne, M. & Tegtmeyer, N. (2011) Molecular mechanisms of gastric
epithelial cell adhesion and injection of CagA by Helicobacter pylori, Cell communication
and signaling : CCS. 9, 28.
68. Censini, S., Lange, C., Xiang, Z., Crabtree, J. E., Ghiara, P., Borodovsky, M., Rappuoli,
R. & Covacci, A. (1996) cag, a pathogenicity island of Helicobacter pylori, encodes type I-
specific and disease-associated virulence factors, Proceedings of the National Academy of
Sciences of the United States of America. 93, 14648-53.
69. Segal, E. D., Cha, J., Lo, J., Falkow, S. & Tompkins, L. S. (1999) Altered states:
involvement of phosphorylated CagA in the induction of host cellular growth changes by
Helicobacter pylori, Proceedings of the National Academy of Sciences of the United States of
America. 96, 14559-64.
70. Bagnoli, F., Buti, L., Tompkins, L., Covacci, A. & Amieva, M. R. (2005) Helicobacter
pylori CagA induces a transition from polarized to invasive phenotypes in MDCK cells,
Proceedings of the National Academy of Sciences of the United States of America. 102,
16339-44.

110
71. Allen, L. A., Schlesinger, L. S. & Kang, B. (2000) Virulent strains of Helicobacter pylori
demonstrate delayed phagocytosis and stimulate homotypic phagosome fusion in
macrophages, The Journal of experimental medicine. 191, 115-28.
72. Torres, V. J., VanCompernolle, S. E., Sundrud, M. S., Unutmaz, D. & Cover, T. L.
(2007) Helicobacter pylori vacuolating cytotoxin inhibits activation-induced proliferation of
human T and B lymphocyte subsets, J Immunol. 179, 5433-40.
73. Perez-Moreno, M., Jamora, C. & Fuchs, E. (2003) Sticky business: orchestrating cellular
signals at adherens junctions, Cell. 112, 535-48.
74. Franke, W. W. (2009) Discovering the molecular components of intercellular junctions--
a historical view, Cold Spring Harbor perspectives in biology. 1, a003061.
75. Yagi, T. & Takeichi, M. (2000) Cadherin superfamily genes: functions, genomic
organization, and neurologic diversity, Genes & development. 14, 1169-80.
76. Yonemura, S., Itoh, M., Nagafuchi, A. & Tsukita, S. (1995) Cell-to-cell adherens
junction formation and actin filament organization: similarities and differences between non-
polarized fibroblasts and polarized epithelial cells, Journal of cell science. 108 ( Pt 1), 127-
42.
77. Adams, C. L. & Nelson, W. J. (1998) Cytomechanics of cadherin-mediated cell-cell
adhesion, Current opinion in cell biology. 10, 572-7.
78. Baum, B. & Georgiou, M. (2011) Dynamics of adherens junctions in epithelial
establishment, maintenance, and remodeling, The Journal of cell biology. 192, 907-17.
79. Wu, Y. & Zhou, B. P. (2008) New insights of epithelial-mesenchymal transition in
cancer metastasis, Acta biochimica et biophysica Sinica. 40, 643-50.
80. Radisky, D. C. (2005) Epithelial-mesenchymal transition, Journal of cell science. 118,
4325-6.

111
81. Christiansen, J. J. & Rajasekaran, A. K. (2006) Reassessing epithelial to mesenchymal
transition as a prerequisite for carcinoma invasion and metastasis, Cancer research. 66, 8319-
26.
82. Tran, N. L., Nagle, R. B., Cress, A. E. & Heimark, R. L. (1999) N-Cadherin expression
in human prostate carcinoma cell lines. An epithelial-mesenchymal transformation mediating
adhesion withStromal cells, The American journal of pathology. 155, 787-98.
83. Kang, Y. & Massague, J. (2004) Epithelial-mesenchymal transitions: twist in
development and metastasis, Cell. 118, 277-9.
84. Vleminckx, K., Vakaet, L., Jr., Mareel, M., Fiers, W. & van Roy, F. (1991) Genetic
manipulation of E-cadherin expression by epithelial tumor cells reveals an invasion
suppressor role, Cell. 66, 107-19.
85. Perl, A. K., Wilgenbus, P., Dahl, U., Semb, H. & Christofori, G. (1998) A causal role for
E-cadherin in the transition from adenoma to carcinoma, Nature. 392, 190-3.
86. Nagafuchi, A. & Takeichi, M. (1989) Transmembrane control of cadherin-mediated cell
adhesion: a 94 kDa protein functionally associated with a specific region of the cytoplasmic
domain of E-cadherin, Cell regulation. 1, 37-44.
87. Maelandsmo, G. M., Holm, R., Nesland, J. M., Fodstad, O. & Florenes, V. A. (2003)
Reduced beta-catenin expression in the cytoplasm of advanced-stage superficial spreading
malignant melanoma, Clinical cancer research : an official journal of the American
Association for Cancer Research. 9, 3383-8.
88. Gottardi, C. J. & Gumbiner, B. M. (2004) Distinct molecular forms of beta-catenin are
targeted to adhesive or transcriptional complexes, The Journal of cell biology. 167, 339-49.
89. Kawanishi, J., Kato, J., Sasaki, K., Fujii, S., Watanabe, N. & Niitsu, Y. (1995) Loss of E-
cadherin-dependent cell-cell adhesion due to mutation of the beta-catenin gene in a human
cancer cell line, HSC-39, Molecular and cellular biology. 15, 1175-81.
112
90. Tian, X., Liu, Z., Niu, B., Zhang, J., Tan, T. K., Lee, S. R., Zhao, Y., Harris, D. C. &
Zheng, G. (2011) E-cadherin/beta-catenin complex and the epithelial barrier, Journal of
biomedicine & biotechnology. 2011, 567305.
91. Daugherty, R. L. & Gottardi, C. J. (2007) Phospho-regulation of Beta-catenin adhesion
and signaling functions, Physiology (Bethesda). 22, 303-9.
92. Sarkar, F. H., Li, Y., Wang, Z. & Kong, D. (2010) The role of nutraceuticals in the
regulation of Wnt and Hedgehog signaling in cancer, Cancer metastasis reviews. 29, 383-94.
93. Kim, W., Kim, M. & Jho, E. H. (2013) Wnt/beta-catenin signalling: from plasma
membrane to nucleus, The Biochemical journal. 450, 9-21.
94. Song, X., Xin, N., Wang, W. & Zhao, C. (2015) Wnt/beta-catenin, an oncogenic pathway
targeted by H. pylori in gastric carcinogenesis, Oncotarget. 6, 35579-88.
95. Chiurillo, M. A. (2015) Role of the Wnt/beta-catenin pathway in gastric cancer: An in-
depth literature review, World journal of experimental medicine. 5, 84-102.
96. Hoy, B., Lower, M., Weydig, C., Carra, G., Tegtmeyer, N., Geppert, T., Schroder, P.,
Sewald, N., Backert, S., Schneider, G. & Wessler, S. (2010) Helicobacter pylori HtrA is a
new secreted virulence factor that cleaves E-cadherin to disrupt intercellular adhesion, EMBO
reports. 11, 798-804.
97. Murata-Kamiya, N., Kurashima, Y., Teishikata, Y., Yamahashi, Y., Saito, Y., Higashi,
H., Aburatani, H., Akiyama, T., Peek, R. M., Jr., Azuma, T. & Hatakeyama, M. (2007)
Helicobacter pylori CagA interacts with E-cadherin and deregulates the beta-catenin signal
that promotes intestinal transdifferentiation in gastric epithelial cells, Oncogene. 26, 4617-26.
98. Alzahrani, S., Lina, T. T., Gonzalez, J., Pinchuk, I. V., Beswick, E. J. & Reyes, V. E.
(2014) Effect of Helicobacter pylori on gastric epithelial cells, World journal of
gastroenterology. 20, 12767-80.

113
99. Fujita, Y., Krause, G., Scheffner, M., Zechner, D., Leddy, H. E., Behrens, J., Sommer, T.
& Birchmeier, W. (2002) Hakai, a c-Cbl-like protein, ubiquitinates and induces endocytosis
of the E-cadherin complex, Nature cell biology. 4, 222-31.
100. Tauriello, D. V. & Maurice, M. M. (2010) The various roles of ubiquitin in Wnt
pathway regulation, Cell Cycle. 9, 3700-9.
101. Bryant, D. M. & Stow, J. L. (2004) The ins and outs of E-cadherin trafficking, Trends
in cell biology. 14, 427-34.
102. Nastasi, T., Bongiovanni, A., Campos, Y., Mann, L., Toy, J. N., Bostrom, J., Rottier,
R., Hahn, C., Conaway, J. W., Harris, A. J. & D'Azzo, A. (2004) Ozz-E3, a muscle-specific
ubiquitin ligase, regulates beta-catenin degradation during myogenesis, Developmental cell.
6, 269-82.
103. Iwai, A., Marusawa, H., Matsuzawa, S., Fukushima, T., Hijikata, M., Reed, J. C.,
Shimotohno, K. & Chiba, T. (2004) Siah-1L, a novel transcript variant belonging to the
human Siah family of proteins, regulates beta-catenin activity in a p53-dependent manner,
Oncogene. 23, 7593-600.
104. Sementchenko, V. I. & Watson, D. K. (2000) Ets target genes: past, present and future,
Oncogene. 19, 6533-48.
105. Chang, A. T., Liu, Y., Ayyanathan, K., Benner, C., Jiang, Y., Prokop, J. W., Paz, H.,
Wang, D., Li, H. R., Fu, X. D., Rauscher, F. J., 3rd & Yang, J. (2015) An evolutionarily
conserved DNA architecture determines target specificity of the TWIST family bHLH
transcription factors, Genes & development. 29, 603-16.
106. Tania, M., Khan, M. A. & Fu, J. (2014) Epithelial to mesenchymal transition inducing
transcription factors and metastatic cancer, Tumour biology : the journal of the International
Society for Oncodevelopmental Biology and Medicine. 35, 7335-42.
114
107. Yang, Z., Zhang, X., Gang, H., Li, X., Li, Z., Wang, T., Han, J., Luo, T., Wen, F. &
Wu, X. (2007) Up-regulation of gastric cancer cell invasion by Twist is accompanied by N-
cadherin and fibronectin expression, Biochemical and biophysical research communications.
358, 925-30.
108. Seth, A. & Watson, D. K. (2005) ETS transcription factors and their emerging roles in
human cancer, Eur J Cancer. 41, 2462-78.
109. Ru, G. Q., Wang, H. J., Xu, W. J. & Zhao, Z. S. (2011) Upregulation of Twist in gastric
carcinoma associated with tumor invasion and poor prognosis, Pathology oncology research :
POR. 17, 341-7.
110. Liao, Y. L., Hu, L. Y., Tsai, K. W., Wu, C. W., Chan, W. C., Li, S. C., Lai, C. H., Ho,
M. R., Fang, W. L., Huang, K. H. & Lin, W. C. (2012) Transcriptional regulation of miR-
196b by ETS2 in gastric cancer cells, Carcinogenesis. 33, 760-9.
111. Tsugane, S. & Sasazuki, S. (2007) Diet and the risk of gastric cancer: review of
epidemiological evidence, Gastric Cancer. 10, 75-83.
112. Griffin, N., Burke, C. & Grant, L. A. (2011) Common primary tumours of the abdomen
and pelvis and their patterns of tumour spread as seen on multi-detector computed
tomography, Insights into imaging. 2, 205-214.
113. Matsuzawa, S., Takayama, S., Froesch, B. A., Zapata, J. M. & Reed, J. C. (1998) p53-
inducible human homologue of Drosophila seven in absentia (Siah) inhibits cell growth:
suppression by BAG-1, The EMBO journal. 17, 2736-47.
114. Kollareddy, M., Dimitrova, E., Vallabhaneni, K. C., Chan, A., Le, T., Chauhan, K. M.,
Carrero, Z. I., Ramakrishnan, G., Watabe, K., Haupt, Y., Haupt, S., Pochampally, R., Boss,
G. R., Romero, D. G., Radu, C. G. & Martinez, L. A. (2015) Regulation of nucleotide
metabolism by mutant p53 contributes to its gain-of-function activities, Nature
communications. 6, 7389.

115
115. Xiong, S., Tu, H., Kollareddy, M., Pant, V., Li, Q., Zhang, Y., Jackson, J. G., Suh, Y.
A., Elizondo-Fraire, A. C., Yang, P., Chau, G., Tashakori, M., Wasylishen, A. R., Ju, Z.,
Solomon, H., Rotter, V., Liu, B., El-Naggar, A. K., Donehower, L. A., Martinez, L. A. &
Lozano, G. (2014) Pla2g16 phospholipase mediates gain-of-function activities of mutant p53,
Proceedings of the National Academy of Sciences of the United States of America. 111,
11145-50.
116. Do, P. M., Varanasi, L., Fan, S., Li, C., Kubacka, I., Newman, V., Chauhan, K.,
Daniels, S. R., Boccetta, M., Garrett, M. R., Li, R. & Martinez, L. A. (2012) Mutant p53
cooperates with ETS2 to promote etoposide resistance, Genes & development. 26, 830-45.
117. Bebb, J. R., Leach, L., Zaitoun, A., Hand, N., Letley, D. P., Thomas, R. & Atherton, J.
C. (2006) Effects of Helicobacter pylori on the cadherin-catenin complex, J Clin Pathol. 59,
1261-6.
118. Liu, J., Stevens, J., Rote, C. A., Yost, H. J., Hu, Y., Neufeld, K. L., White, R. L. &
Matsunami, N. (2001) Siah-1 mediates a novel beta-catenin degradation pathway linking p53
to the adenomatous polyposis coli protein, Molecular cell. 7, 927-36.
119. Yoshibayashi, H., Okabe, H., Satoh, S., Hida, K., Kawashima, K., Hamasu, S., Nomura,
A., Hasegawa, S., Ikai, I. & Sakai, Y. (2007) SIAH1 causes growth arrest and apoptosis in
hepatoma cells through beta-catenin degradation-dependent and -independent mechanisms,
Oncology reports. 17, 549-56.
120. Leung, C. O., Deng, W., Ye, T. M., Ngan, H. Y., Tsao, S. W., Cheung, A. N., Pang, R.
T. & Yeung, W. S. (2014) miR-135a leads to cervical cancer cell transformation through
regulation of beta-catenin via a SIAH1-dependent ubiquitin proteosomal pathway,
Carcinogenesis. 35, 1931-40.
121. Weydig, C., Starzinski-Powitz, A., Carra, G., Lower, J. & Wessler, S. (2007) CagA-
independent disruption of adherence junction complexes involves E-cadherin shedding and
116
implies multiple steps in Helicobacter pylori pathogenicity, Experimental cell research. 313,
3459-71.
122. Costa, A. M., Leite, M., Seruca, R. & Figueiredo, C. (2013) Adherens junctions as
targets of microorganisms: a focus on Helicobacter pylori, FEBS letters. 587, 259-65.
123. Takayama, T., Shiozaki, H., Shibamoto, S., Oka, H., Kimura, Y., Tamura, S., Inoue,
M., Monden, T., Ito, F. & Monden, M. (1996) Beta-catenin expression in human cancers, The
American journal of pathology. 148, 39-46.
124. Chen, K. H., Tung, P. Y., Wu, J. C., Chen, Y., Chen, P. C., Huang, S. H. & Wang, S.
M. (2008) An acidic extracellular pH induces Src kinase-dependent loss of beta-catenin from
the adherens junction, Cancer letters. 267, 37-48.
125. Stanczak, A., Stec, R., Bodnar, L., Olszewski, W., Cichowicz, M., Kozlowski, W.,
Szczylik, C., Pietrucha, T., Wieczorek, M. & Lamparska-Przybysz, M. (2011) Prognostic
significance of Wnt-1, beta-catenin and E-cadherin expression in advanced colorectal
carcinoma, Pathology oncology research : POR. 17, 955-63.
126. Ebert, M. P., Yu, J., Hoffmann, J., Rocco, A., Rocken, C., Kahmann, S., Muller, O.,
Korc, M., Sung, J. J. & Malfertheiner, P. (2003) Loss of beta-catenin expression in metastatic
gastric cancer, Journal of clinical oncology : official journal of the American Society of
Clinical Oncology. 21, 1708-14.
127. Qi, J., Nakayama, K., Gaitonde, S., Goydos, J. S., Krajewski, S., Eroshkin, A., Bar-
Sagi, D., Bowtell, D. & Ronai, Z. (2008) The ubiquitin ligase Siah2 regulates tumorigenesis
and metastasis by HIF-dependent and -independent pathways, Proceedings of the National
Academy of Sciences of the United States of America. 105, 16713-8.
128. Howard, S., Deroo, T., Fujita, Y. & Itasaki, N. (2011) A positive role of cadherin in
Wnt/beta-catenin signalling during epithelial-mesenchymal transition, PloS one. 6, e23899.
117
129. Brembeck, F. H., Schwarz-Romond, T., Bakkers, J., Wilhelm, S., Hammerschmidt, M.
& Birchmeier, W. (2004) Essential role of BCL9-2 in the switch between beta-catenin's
adhesive and transcriptional functions, Genes & development. 18, 2225-30.
130. Kam, Y. & Quaranta, V. (2009) Cadherin-bound beta-catenin feeds into the Wnt
pathway upon adherens junctions dissociation: evidence for an intersection between beta-
catenin pools, PloS one. 4, e4580.
131. Palacios, F., Tushir, J. S., Fujita, Y. & D'Souza-Schorey, C. (2005) Lysosomal targeting
of E-cadherin: a unique mechanism for the down-regulation of cell-cell adhesion during
epithelial to mesenchymal transitions, Molecular and cellular biology. 25, 389-402.
132. Yang, J. Y., Zong, C. S., Xia, W., Wei, Y., Ali-Seyed, M., Li, Z., Broglio, K., Berry, D.
A. & Hung, M. C. (2006) MDM2 promotes cell motility and invasiveness by regulating E-
cadherin degradation, Molecular and cellular biology. 26, 7269-82.
133. Mansouri, M., Rose, P. P., Moses, A. V. & Fruh, K. (2008) Remodeling of endothelial
adherens junctions by Kaposi's sarcoma-associated herpesvirus, Journal of virology. 82,
9615-28.
134. Kim, H., Claps, G., Moller, A., Bowtell, D., Lu, X. & Ronai, Z. A. (2014) Siah2
regulates tight junction integrity and cell polarity through control of ASPP2 stability,
Oncogene. 33, 2004-10.
135. Malz, M., Aulmann, A., Samarin, J., Bissinger, M., Longerich, T., Schmitt, S.,
Schirmacher, P. & Breuhahn, K. (2012) Nuclear accumulation of seven in absentia
homologue-2 supports motility and proliferation of liver cancer cells, International journal of
cancer. 131, 2016-26.
136. Krueger, S., Hundertmark, T., Kuester, D., Kalinski, T., Peitz, U. & Roessner, A.
(2007) Helicobacter pylori alters the distribution of ZO-1 and p120ctn in primary human
gastric epithelial cells, Pathol Res Pract. 203, 433-44.

118
137. Moese, S., Selbach, M., Kwok, T., Brinkmann, V., Konig, W., Meyer, T. F. & Backert,
S. (2004) Helicobacter pylori induces AGS cell motility and elongation via independent
signaling pathways, Infect Immun. 72, 3646-9.

119
APPENDIX I
PLASMID CONSTRUCTS USED
Constructs
Description
Source
pcDNA3.1+-Siah1
WT construct
Generated
pCMV6-AC-GFP-
Siah2
WT construct
Origene
pcDNA3-FLAG-ETS2
WT construct
Addgene plasmid 28128
pcDNA3-Flag-Twist
WT construct
Gifted by Dr. Kimitoshi
Kohno, University of
Occupational and
Environmental Health,
Japan
pGL3-Siah1
Luciferase construct
Generated
pGL3-Siah1-EBS mut
EBS mutation
Generated from WT Siah1
promoter
pGL3-Siah2
Luciferase construct
Generated
pGL3-Siah2-EBS mut
EBS mutation
Generated from WT Siah2
promoter
pGL3-Siah2-TBS mut
TBS mutation
Generated from WT Siah2
promoter

120
Constructs
Description
Source
pcDNA3.1+
Empty vector
Invitrogen
pHRLTK
Luciferase construct
Promega
APPENDIX II
siRNAs USED
siRNA
Cat No.
Company
Siah1
sc-37495
Santa Cruz Biotechnology
Control siRNA
sc-37007
Santa Cruz Biotechnology
Siah2
SR304370
Origene
ETS2
SR301471
Origene
Twist1
SR304977
Origene
Trilencer-27 universal
scrambled negative
control
SR30004
Origene

121
APPENDIX III
PRIMARY ANTIBODIES USED
Antibodies
Clone
Dilution
Company
Catalogue
Siah1
Goat
Polyclonal
1:250 (WB)
Novus
Biologicals
NB300-974
Siah1
Goat
Polyclonal
1:100 (IF)
Santa Cruz
Biotechnology
sc-5505
Siah2
Goat
Polyclonal
1:250 (WB)
1:100 (IF)
Santa Cruz
Biotechnology
sc-5505
Siah2
Rabbit
Polyclonal
1:500 (WB)
1:100 (IF)
Abcam
ab72064
ETS2
Rabbit
Polyclonal
1:1000 (WB)
1:100 (IF)
Santa Cruz
Biotechnology
sc-22803
Anti-Twist1
Mouse
Polyclonal
1:250 (WB)
1:50 (IF)
Abcam
ab50887
β-catenin
Rabbit
Monoclonal
1:5000 (WB)
1:250 (IF)
Abcam
ab32572
E-Cadherin
Rabbit
Polyclonal
1:1000 (WB)
1:100 (IF)
Cell Signalling
Technology
3195
α-tubulin
Rabbit
Monoclonal
1:10000 (WB)
Abcam
ab52866
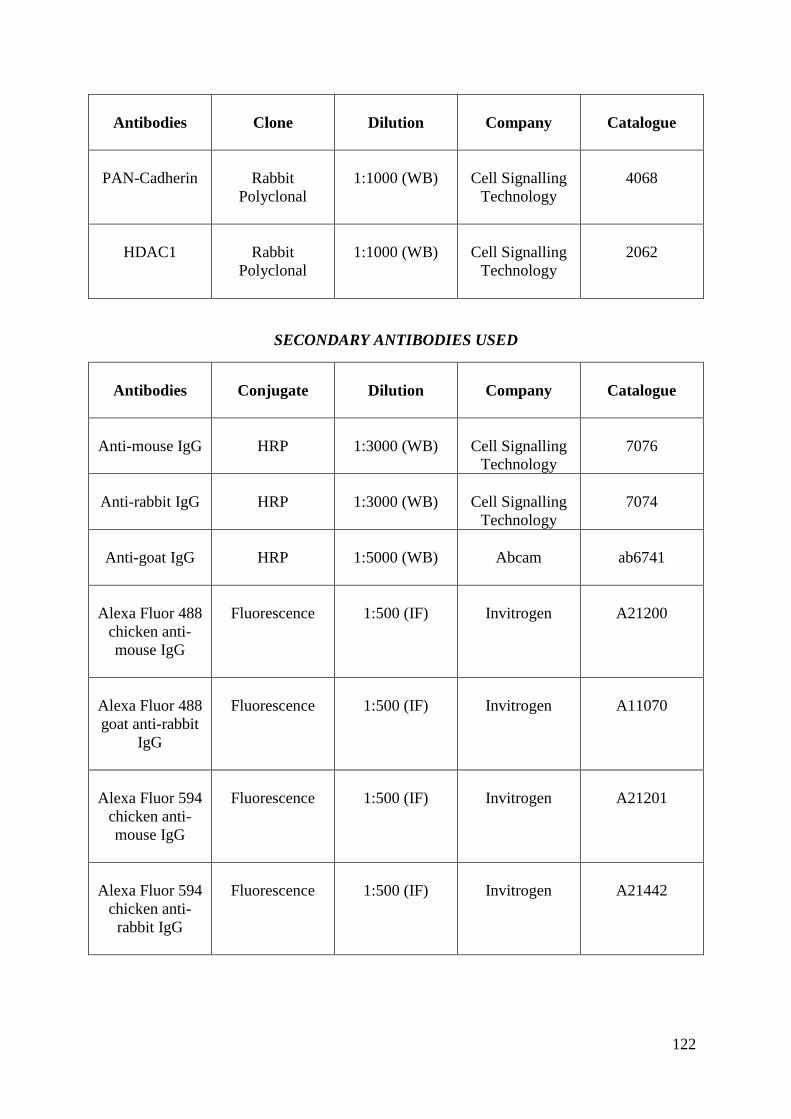
122
Antibodies
Clone
Dilution
Company
Catalogue
PAN-Cadherin
Rabbit
Polyclonal
1:1000 (WB)
Cell Signalling
Technology
4068
HDAC1
Rabbit
Polyclonal
1:1000 (WB)
Cell Signalling
Technology
2062
SECONDARY ANTIBODIES USED
Antibodies
Conjugate
Dilution
Company
Catalogue
Anti-mouse IgG
HRP
1:3000 (WB)
Cell Signalling
Technology
7076
Anti-rabbit IgG
HRP
1:3000 (WB)
Cell Signalling
Technology
7074
Anti-goat IgG
HRP
1:5000 (WB)
Abcam
ab6741
Alexa Fluor 488
chicken anti-
mouse IgG
Fluorescence
1:500 (IF)
Invitrogen
A21200
Alexa Fluor 488
goat anti-rabbit
IgG
Fluorescence
1:500 (IF)
Invitrogen
A11070
Alexa Fluor 594
chicken anti-
mouse IgG
Fluorescence
1:500 (IF)
Invitrogen
A21201
Alexa Fluor 594
chicken anti-
rabbit IgG
Fluorescence
1:500 (IF)
Invitrogen
A21442

123
Antibodies
Conjugate
Dilution
Company
Catalogue
Alexa Fluor 488
donkey anti-goat
IgG
Fluorescence
1:500 (IF)
Invitrogen
A11055
DAPI
Dye
1:2000
Invitrogen
D3571
WB=Western blot; IF=Immunofluorescence

124
APPENDIX IV
PRIMER SEQUENCES FOR siah1 CLONING
Primer
Sequence
Forward
5’AAAAGCTTCAAAATGAGCCGTCAGACTGCTACAGCATTA 3’
Reverse
5’CCTCGAGTCAACACATGGAAATAGTTACATTGATG 3’
APPENDIX V
REACTION CONDITION FOR PCR OF siah1 GENE
Temperature (oC)
Time (min)
No. of cycles
Initial Denaturation 94 2 1
Denaturation 94 1
35 Annealing 58.8 1
Extension 68 1
Final extension 68 10 1

125
APPENDIX VI
PRIMER SEQUENCES USED FOR siah1 5’ UTR CLONING
Primer
Sequence
Forward
5’CGCTGGGCTAAATCAGCAGAC3’
Reverse
5’ ACTTACCTGTGGGCGGAGAG 3’
Forward
(KpnI)
5’ AAGGTACCAGCAACGGTAGC 3’
Reverse
(HindIII)
5’ ATTAAGCTTTGTGGGCGGAGAG 3’
PRIMER SEQUENCES USED FOR siah2 PROMOTER CLONING
Primer
Sequence
Forward
5’CCCAATGCTTCTCGTCCTGACTC3’
Reverse
5’GCTTCTGGAACAGCCGCTGAC 3’
Forward
(KpnI)
5’ AGAGGTACCGACTCCGAACACAG 3’
Reverse
(HindIII)
5’ TGTAAGCTTCTTCTGGAACAGCCG 3’
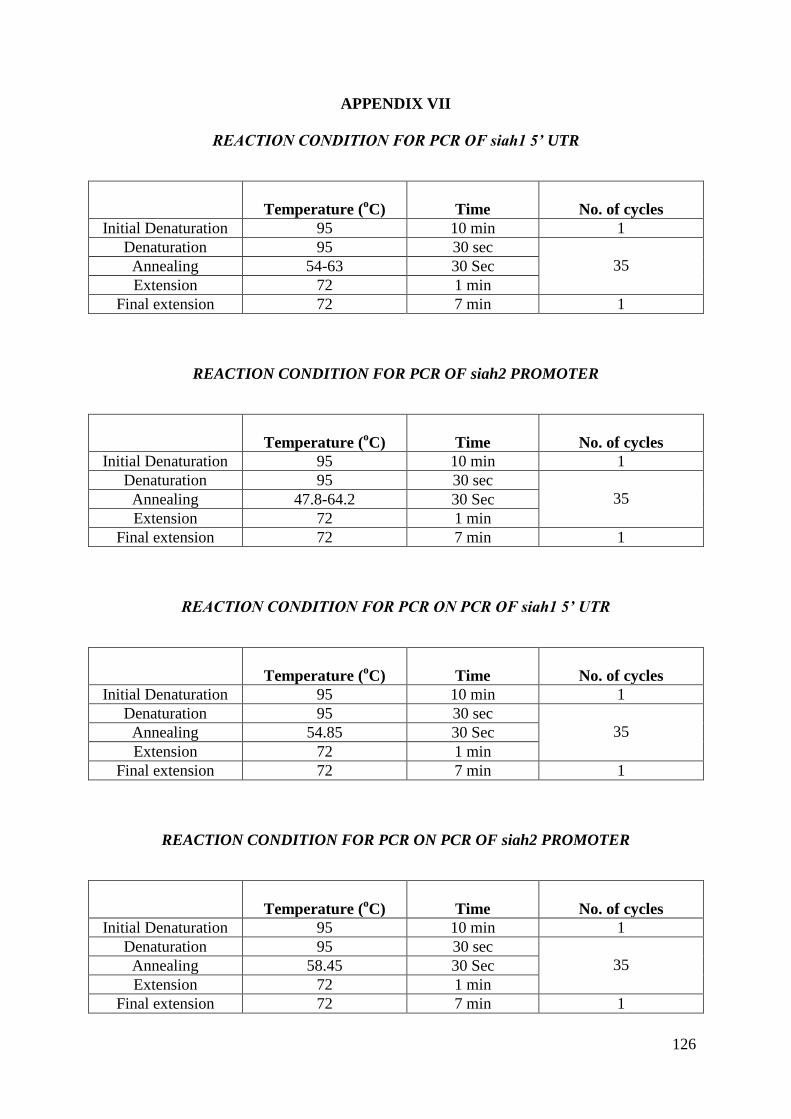
126
APPENDIX VII
REACTION CONDITION FOR PCR OF siah1 5’ UTR
Temperature (oC)
Time
No. of cycles
Initial Denaturation 95 10 min 1
Denaturation 95 30 sec
35 Annealing 54-63 30 Sec
Extension 72 1 min
Final extension 72 7 min 1
REACTION CONDITION FOR PCR OF siah2 PROMOTER
Temperature (oC)
Time
No. of cycles
Initial Denaturation 95 10 min 1
Denaturation 95 30 sec
35 Annealing 47.8-64.2 30 Sec
Extension 72 1 min
Final extension 72 7 min 1
REACTION CONDITION FOR PCR ON PCR OF siah1 5’ UTR
Temperature (oC)
Time
No. of cycles
Initial Denaturation 95 10 min 1
Denaturation 95 30 sec
35 Annealing 54.85 30 Sec
Extension 72 1 min
Final extension 72 7 min 1
REACTION CONDITION FOR PCR ON PCR OF siah2 PROMOTER
Temperature (oC)
Time
No. of cycles
Initial Denaturation 95 10 min 1
Denaturation 95 30 sec
35 Annealing 58.45 30 Sec
Extension 72 1 min
Final extension 72 7 min 1

127
APPENDIX VIII
PRIMER USED FOR siah1 5’ UTR EBS MUTATION
Mutagenesis
Primer
Sequence
EBS#
5’ GTCGGTCTCGGCGCCATTAAGAGGCGGTGGCGC 3’
WT EBS=GGAA; #
Mutations are shown in boldface and in italics
PRIMER USED FOR siah2 PROMOTER EBS AND TBS MUTATION
Mutagenesis
Primer
Sequence
EBS#
5’ CCCGCAGCCCGAGCATTAAGCGCCGGCGCTAGG 3’
TBS#
5’ GCCCCCTGCGCTGCTTGCTAGAGCCGGGCGGAGC 3’
WT EBS=GGAA; WT TBS=CANNTG; #
Mutations are boldfaced and in italics.
PCR REACTION CONDITION FOR SITE-DIRECTED MUTAGENESIS
Temperature (oC)
Time (min)
No. of cycles
Initial Denaturation 95 1 1
Denaturation 95 1
30 Annealing 55 1
Extension 65 10#
Final extension 65 10 1 #2min/kb of plasmid length

128
APPENDIX IX
REACTION CONDITION FOR REAL-TIME RT-PCR
Stage
Temperature (oC)
Time (min)
No. of cycles
Hold 50 2 1
Hold 95 10 1
Cycles 95 0.15 40
Cycles 72 1
APPENDIX X
BIOTINYLATED OLIGOS OF siah1 5’ UTR EBS
5’ Biotinylated
Primer
Sequence
Forward$
WT
5’ TCTCGGCGCCGGGAAGAGGCGGTGGCG 3’
Reverse
WT
5’ CGCCACCGCCTCTTCCCGGCGCCGAGA 3’
Forward#
Mutant
5’TCTCGGCGCCATTAAGAGGCGGTGGCG3’
Reverse
Mutant
5’CGCCACCGCCTCTTAATGGCGCCGAGA3’
$EBS is underlined,
#Mutations are underlined and bold

129
BIOTINYLATED OLIGOS OF siah2 PROMOTER EBS
5’ Biotinylated
Primer
Sequence
Forward$
WT
5’ CAGCCCGAGCAGGAAGCGCCGGCGCTA 3’
Reverse
WT
5’ TAGCGCCGGCGCTTCCTGCTCGGGCTG 3’
Forward#
Mutant
5’ CAGCCCGAGCATTAAGCGCCGGCGCTA 3’
Reverse
Mutant
5’ TAGCGCCGGCGCTTAATGCTCGGGCTG 3’
$EBS are underlined,
#Mutations are bold faced italics
BIOTINYLATED OLIGOS OF siah2 PROMOTER TBS
5’ Biotinylated
Primer
Sequence
Forward$
WT
5’ CCCTGCGCTGCCAGCTGGAGCCGGGCG 3’
Reverse
WT
5’ CGCCCGGCTCCAGCTGGCAGCGCAGGG 3’
Forward#
Mutant
5’ CCCTGCGCTGCTTGCTAGAGCCGGGCG 3’
Reverse
Mutant
5’ CGCCCGGCTCTAGCAAGCAGCGCAGGG 3’
$TBS is underlined,
#Mutations are boldfaced and in italics

130
APPENDIX XI
PRIMER SEQUENCES USED FOR siah1 5’ UTR CHIP ASSAY
Primer
Sequence
Forward
(Specific)
5’ CGCAGTGTGTGGTATTTAGCG 3’
Reverse
(Specific)
5’ TCCTGGCACCAACGCG 3’
Forward
(Non-Specific)
5’CACTAGCCACTACTTGAGGTTTA 3’
Reverse
(Non-Specific)
5’GCTTTTGATGGTGGCTTTACT 3’
PRIMER SEQUENCES USED FOR siah2 PROMOTER CHIP ASSAY
Primer
Sequence
Forward
(Specific)
5’ ACCCAGAAAAGACAACCCCGCG 3’
Reverse
(Specific)
5’ GACGTGACGCCTGGACACGT 3’
Forward
(Non-Specific)
5’ CTGGTAGACACTTTGAAAGAGA 3’
Reverse
(Non-Specific)
5’ TCCACTCTCTTCCACAAAAG 3’
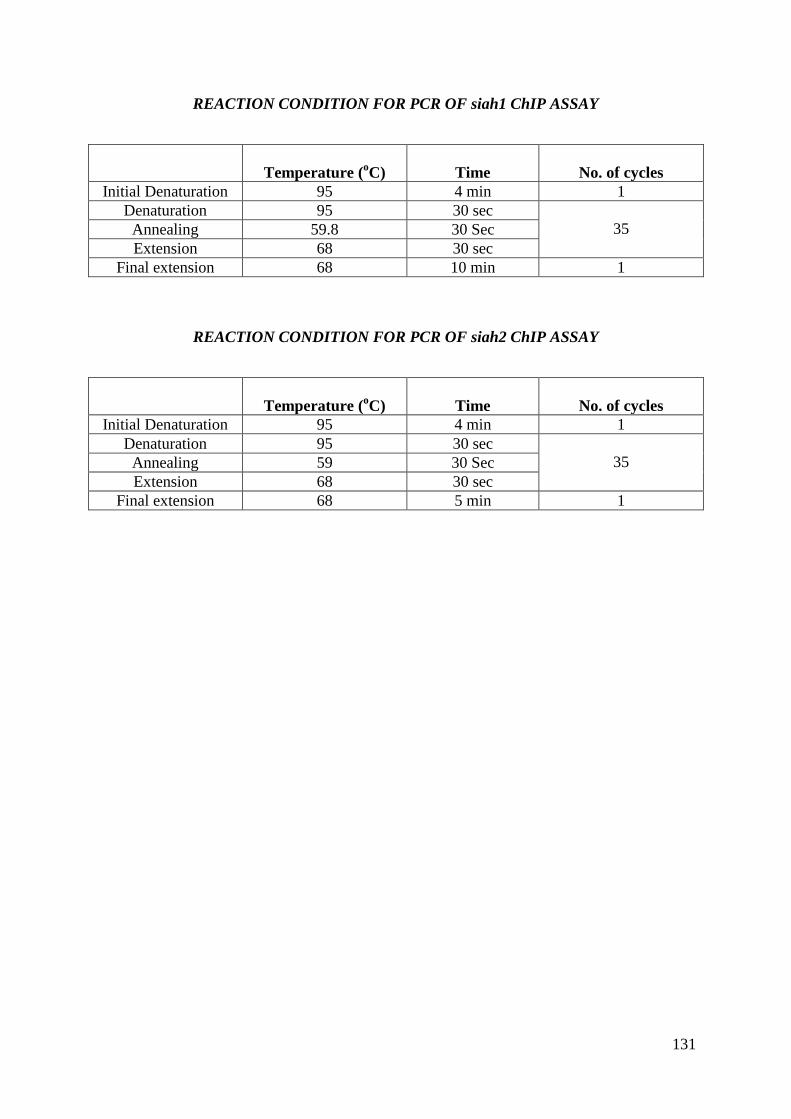
131
REACTION CONDITION FOR PCR OF siah1 ChIP ASSAY
Temperature (oC)
Time
No. of cycles
Initial Denaturation 95 4 min 1
Denaturation 95 30 sec
35 Annealing 59.8 30 Sec
Extension 68 30 sec
Final extension 68 10 min 1
REACTION CONDITION FOR PCR OF siah2 ChIP ASSAY
Temperature (oC)
Time
No. of cycles
Initial Denaturation 95 4 min 1
Denaturation 95 30 sec
35 Annealing 59 30 Sec
Extension 68 30 sec
Final extension 68 5 min 1

132
PUBLICATIONS

Biochem. J. (2016) 473, 1629–1640 doi:10.1042/BCJ20160187 1629
ETS2 and Twist1 promote invasiveness of Helicobacter pylori-infectedgastric cancer cells by inducing Siah2Lopamudra Das*, Shrikant Babanrao Kokate*, Suvasmita Rath*, Niranjan Rout†, Shivaram Prasad Singh‡, Sheila Eileen Crowe§,Asish K. Mukhopadhyay‖ and Asima Bhattacharyya*1
*School of Biological Sciences, National Institute of Science Education and Research (NISER), P.O. Bhimpur-Padanpur, Via Jatni, Dist. Khurda 752050, Odisha, India†Department of Oncopathology, Acharya Harihar Regional Cancer Centre, Cuttack 753007, Odisha, India‡Department of Gastroenterology, SCB Medical College, Cuttack 753007, Odisha, India§School of Medicine, Division of Gastroenterology, UC San Diego, CA 92093, U.S.A.‖Division of Bacteriology, National Institute of Cholera and Enteric Diseases (NICED), Kolkata 700010, India
Helicobacter pylori infection is one of the most potentfactors leading to gastric carcinogenesis. The seven in absentiahomologue (Siah2) is an E3 ubiquitin ligase which has beenimplicated in various cancers but its role in H. pylori-mediatedgastric carcinogenesis has not been established. We investigatedthe involvement of Siah2 in gastric cancer metastasis which wasassessed by invasiveness and migration of H. pylori-infectedgastric epithelial cancer cells. Cultured gastric cancer cells(GCCs) MKN45, AGS and Kato III showed significantly inducedexpression of Siah2, increased invasiveness and migration afterbeing challenged with the pathogen. Siah2-expressing stablecells showed increased invasiveness and migration after H.pylori infection. Siah2 was transcriptionally activated by E26transformation-specific sequence 2 (ETS2)- and Twist-related
protein 1 (Twist1) induced in H. pylori-infected gastric epithelialcells. These transcription factors dose-dependently enhancedthe aggressiveness of infected GCCs. Our data suggested thatH. pylori-infected GCCs gained cell motility and invasivenessthrough Siah2 induction. As gastric cancer biopsy samples alsoshowed highly induced expression of ETS2, Twist1 and Siah2compared with noncancerous gastric tissue, we surmise thatETS2- and Twist1-mediated Siah2 up-regulation has potentialdiagnostic and prognostic significance and could be targeted fortherapeutic purpose.
Key words: ETS2, gastric cancer, H. pylori, metastasis, Siah2,Twist1.
INTRODUCTION
Gastric cancer is one of the most common malignant cancers. Itis generally diagnosed at very late stages when the cancer hasalready metastasized to neighbouring lymph nodes or tissues.This occurs mostly due to the complex initiation and progressionmechanisms of the disease as well as the lack of symptomsand detection markers at early stages. Therefore, in spite of adecline in gastric cancer cases in recent years, this disease stillremains the second leading cause of cancer-related mortalityin the world [1,2]. Helicobacter pylori infection is the primefactor responsible for gastric cancer. Up to 80% of people incertain parts of the world are infected with H. pylori [3]. Hostresponses towards infection and the possession of a ∼40 kbstretch of genetic element by the pathogen called the cytotoxin-associated gene (cag) pathogenicity island (PAI) play a role indetermining the outcome of infection. Like any other solid tumourof epithelial origin, development of the invasive gastric cancerphenotype employs epithelial–mesenchymal transition (EMT)wherein the epithelial cells lose their epithelial characteristics,gain mesenchymal features and show enhanced motility. AberrantEMT has been closely associated with gastric carcinogenesis. H.pylori induce migration of the primary gastric epithelial cells [4],and enhance motility of the gastric epithelial cancer cell line AGS
as well as Madin–Darby canine kidney (MDCK) epithelial cells[5,6]. However, the precise molecular events that contribute ininducing motility and invasiveness of H. pylori-infected gastriccancer cells remain to be determined.
Crucial roles for E3 ubiquitin ligases have been recentlyidentified in modulating cancer progression and metastasis foradenocarcinoma [7]. The really interesting new gene (RING)family E3 ubiquitin ligases regulate metastasis in several cancers[8] and have drawn attention as potential drug targets [9]. Theseven in absentia homologue (Siah) proteins belong to the RINGfamily of E3 ubiquitin ligases. Siah proteins impart specificity toproteasomal degradation of target proteins and are required forthe ubiquitin-dependent proteolysis of their targets. Siah proteinsinteract with and regulate the stability of multiple factors involvedin oncogenesis including prolyl hydroxylases, β-catenin, NUMB,tumour necrosis factor receptor 2-associated factor and Sprouty[10–14]. Increased Siah2 expression in various cancers signifiesits oncogenic role [15–19]. Moreover, enhanced expression ofSiah2 in breast, prostate and liver cancer cells is associatedwith malignancy and cancer invasiveness [15,16]. Wong et al.have shown that loss of Siah2 causes delayed tumour onset andincreases the efficacy of chemotherapy in a transgenic modelof aggressive breast cancer [20]. Elaborate studies have beenperformed to identify downstream targets of Siah2 proteins.
Abbreviations: cag, cytotoxin-associated gene; EBS, ETS2-binding site; EMT, epithelial–mesenchymal transition; ETS2, E26 transformation-specificsequence 2; GCCs, gastric cancer cells; HDAC1, histone-deacetylase 1; HIF1α, hypoxia-inducible factor 1α; MOI, multiplicity of infection; PAI, pathogenicityisland; real-time RT-PCR, real-time reverse transcription PCR; RING, really interesting new gene; Siah, the seven in absentia homologue; TBS, Twist1-bindingsite; Twist1, Twist-related protein 1.
1 To whom correspondence should be addressed (email [email protected]).
c© 2016 The Author(s). Published by Portland Press Limited on behalf of the Biochemical Society.

1630 L. Das and others
Recently Siah2 has been reported to regulate tight junctionintegrity and cell polarity in the hypoxic milieu through theregulation of apoptosis-stimulating proteins of p53 (ASPP) 2stability [21]. Siah2 mediates ubiquitination and degradation ofthe CCAAT/enhancer-binding protein δ (C/EBPδ) during breastcancer progression, thus contributing to the transformation ofbreast tumour cells [22].
Siah2 up-regulation in breast cancer is caused by oestrogenwhich leads to the proteasomal degradation of the transcriptionalco-regulator nuclear receptor corepressor (N-CoR) [23]. Althoughthe exact mechanism is not known, Wnt5a has been found toinduce Siah2 expression in colon cancer cells [24]. Hypoxiais another potent inducer of Siah2 [13] and it regulates Siah2stability by modulating the p38 MAPK and Akt pathways [25,26].Although independent studies have reported that Siah2 andH. pylori infection can induce stability and accumulation ofthe hypoxia-inducible factor 1α (HIF1α), a major oncogenictranscription factor induced during hypoxia [13,27], to date nostudy has identified the effect of H. pylori infection on gastricepithelial Siah2 expression.
Given the crucial role of Siah2 in driving cellulartransformation and tumorigenesis in several human cancers, weexamined the effect of H. pylori infection on Siah2 expression.We identified that proto-oncogenic transcription factors E26transformation-specific sequence 2 (ETS2) and Twist-relatedprotein 1 (Twist1) induce siah2 in H. pylori-infected gastric cancercells (GCCs) and also demonstrated that Siah2 regulates motilityand invasiveness of infected GCCs. Our study thus establishedthe role of Siah2 in regulating H. pylori-mediated gastric cancerprogression. As human gastric cancer biopsy samples also showedhighly-increased expression of Twist1 and ETS2 along withSiah2, these molecules could be tested as novel molecular targetsto treat gastric cancer.
EXPERIMENTAL
Cell culture, H. pylori strains, infection and treatments
The human GCCs MKN45, Kato III, AGS along with H. pylori26695 and 8-1, a cag PAI ( + ) strain (A.T.C.C.) and a cagPAI ( − ) strain, respectively, were cultured and maintained asreported previously [28,29]. Another cag PAI ( − ) strain D154was received from the archived collection of H. pylori strainsat National Institute of Cholera and enteric Diseases, Kolkata,India. Strain 8-1 is an isogenic derivative of the reference strain26695 lacking the entire cag PAI [28] (DNA isolated from D154does not produce any cagA or cag PAI amplicon). GCCs wereinfected with various multiplicity of infection (MOI) of H. pyloristrain 26695 for specified periods. Strain 26695 was used for allstudies except for comparison studies involving 26695, 8-1 andD154 strains. For inhibitor studies, cells were treated with theproteasome inhibitor MG132 (Sigma–Aldrich) at 50 μM dose for6 h prior to bacterial infection.
Human gastric mucosal biopsy specimen collection
Gastric biopsy samples from the antral gastric mucosa werecollected from patients suffering from gastric cancer andundergoing diagnostic esophagogastroduodenoscopy following aNational Institute of Science Education and Research (NISER)Review Board-approved protocol and research was carried outin accordance with the Declaration of Helsinki (2013) of theWorld Medical Association. Written informed consent wasobtained from all patients prior to the study. Note that gastric
adenocarcinoma biopsy samples were obtained from patientslacking any previously established case-history. Because thegastric cancer samples were from patients that were urea breathtest, rapid urease test as well as tissue-invasion negative, theseadenocarcinoma cases could not be linked to H. pylori infectionstatus.
Plasmids and mutagenesis
Twist1 overexpression construct was obtained as a kind giftfrom Dr Kimitoshi Kohno. ETS2 construct was purchased fromAddgene (Addgene plasmid 28128). The Siah2 plasmid waspurchased from Origene Technologies (Origene Technologies).The full length human siah2 promoter (NM_005067) was clonedinto the pGL3 basic vector (Promega) using restriction sitesfor KpnI and HindIII. siah2 WT promoter construct was usedas a template to generate individual mutations at the ETS2-binding site (EBS) and Twist1-binding site (TBS) using theQuikChange site-directed mutagenesis kit (Agilent Technologies)as per manufacturers’ standard procedure. Sequencing was doneto confirm mutations at the EBS and TBS. Primer sequences areshown in Supplementary Figure S1.
Transient transfection of plasmids or siRNAs and generation ofstable cell lines
For transient expression of ETS2 and Twist1, 1 × 10⁶ MKN45cells were seeded in 6-well cell culture plates 24 h prior totransfection. Cells were transfected with 2 μg of plasmid DNAand 10 μl of Lipofectamine 2000 reagent (Invitrogen, CA, USA).Cells were infected after 36 h of transfection. To generate stablecell lines, MKN45 or AGS cells were seeded in 96-well plates24 h before transfection and transfection was done as mentioned.Cells were cultured in the presence of 300 μg/ml G418 (Sigma–Aldrich) for 4 weeks. Positive clones were picked using cloningdiscs (Sigma–Aldrich) and expanded to establish stable celllines. To knockdown expression of ETS2 and Twist1, 0.2 × 10⁶
MKN45 cells were seeded in 6-well cell culture plates 24 h priorto transfection. Cells were transfected with 50 nM of siRNAduplexes of ETS2 or Twist1 (Origene) along with 10 μl ofLipofectamine 3000 reagent (Invitrogen). Control duplexes werealso transfected. After 60 h of transfection, cells were infectedwith H. pylori.
In vitro binding assay
5′ biotinylated double-stranded siah2 EBS oligonucleotides [WT(wild-type) or Mut (mutant)] were captured by Streptavidin-coated superparamagnetic beads (Dynabeads M-280 Streptavidin,Dynal, Invitrogen) and binding assays were performed usingnuclear lysates as described previously [28]. Bound proteins weredissociated by boiling in 1× Laemmli sample buffer and analysedby Western blotting. Oligonucleotide sequences are shown inSupplementary Figure S1.
Luciferase assay
Activation of the siah2 promoter after H. pylori infectionwas measured by dual luciferase assays. For this, cells wereco-transfected with either the WT or ETS2 and Twist1-Mut siah2 luciferase promoter constructs (cloned in pGL3basic vector) along with the phRL-TK Renilla luciferaseconstruct (Promega) at a ratio of 50:1 using Lipofectamine
c© 2016 The Author(s). Published by Portland Press Limited on behalf of the Biochemical Society.

H. pylori induces Siah2 expression 1631
2000 reagent (Invitrogen). For some experiments, cells wereco-transfected with the WT siah2 promoter construct alongwith the WT ETS2 or Twist1 overexpression plasmid and thephRL-TK Renilla luciferase construct at a ratio of 25:25:1using Lipofectamine 2000 reagent (Invitrogen). At 36 h post-transfection, cells were either left uninfected or were infectedwith H. pylori for 2 h. Cells were thereafter lysed andluciferase activity was estimated using the Dual-LuciferaseReporter Assay System (Promega) as per manufacturers’instructions. Quantification of luminescence signal was doneusing MicroBeta2 LumiJETTM Microplate Counter (PerkinElmer).
MTT assay
pcDNA3.1+ and Siah2 overexpressing stable cells were seededon 96-well microplates with a seeding density of 5 × 10³
cells per well 24 h before transfection. Cell proliferation wasassessed using an MTT cell proliferation kit according tothe manufacturer’s protocol (HiMedia). The absorbance wasmeasured at 595 nm test and 650 nm reference wavelengths. Datawere analysed by t test, and presented as mean +− S.E.M., andconfirmed by three independent experiments.
Transwell migration and invasion assays
Cell migration and invasion assays were performed using 8-μmpore size Transwell Biocoat control inserts (migration assay) ormatrigel-coated inserts, as per manufacture’s instruction (BectonDickinson). In brief, 5 × 10⁴ AGS cells were seeded on atranswell plate. The chambers were incubated at 37 ◦C, 5%CO2. After incubating for 24 h, cells on the top surface of thetranswell were scraped off. Cells were fixed for 30 min with 4 %paraformaldehyde, and stained for 30 min with haematoxylin. Wecounted the number of cells (five high-power fields) that invadedinserts under an inverted microscope (Primo Vert, Carl Zeiss).Individual experiments were repeated thrice.
Soft agar assay
MKN45 cells stably expressing Siah2, ETS2 and Twist1 proteinor empty vector were seeded in 24-well plates at a density of0.1 × 106 cells per well. After 24 h cells were infected withH. pylori for 6 h followed by 2 h gentamicin treatment to killextracellular bacteria. Cells were harvested and 1000 cells weremixed with 0.3% top agar and plated on to 0.6% bottom agar in6 cm cell culture plates. These plates were fed twice weekly andmaintained for 3 weeks in humidified incubators containing 5%CO2. At the end of the incubation period, visible colonies on thetop agar were directly counted and colony sizes were comparedbetween various treatment groups.
Wound healing assay
We wanted to assess the effect of ETS2, Twist1 or Siah2expression on wound-healing property of GCCs. As MKN45cells are partly adherent and partly floating in nature [30], wedid not consider these cells suitable for wound-healing assays.Rather, AGS cells being adherent cells were considered moreappropriate for this purpose. Various stable cells were seeded in6-well cell culture plates and were allowed to grow in monolayertill 90% confluency was obtained in complete media. Multipleuniform streaks were made on the monolayer culture with 100 μlpipette tips. Streaked plates were immediately washed with
PBS to remove detached cells followed by infection with H.pylori in serum-free media. Cell migration was monitored upto 24 h, and pictures were taken at 0, 6, 12 and 24 h timepoints using a digital camera attached to an inverted microscope(Primo Vert, Carl Zeiss). Six to eight fields were analysed, andcells filling the wound mark were counted using ImageJ 1.45software.
To study the effect of Siah2 suppression on wound healingproperty of GCCs, 0.5 × 10⁶ AGS cells were seeded in 6-wellcell culture plates 24 h prior to transfection of 50 nM of siRNAcontrol or Siah2 duplex and 10 μl of Lipofectamine 3000 reagent.Cells were infected and wound healing assay was performed after48 h of transfection.
Statistical analysis
Statistical analysis of quantitative data was performed byStudent’s t tests. Values were given as mean +− S.E.M. Statisticalsignificance was determined at *P < 0.05.
The online supplementary file contains additional EXPERI-MENTAL methods that include immunoblotting, real-time RT(reverse transcription)-PCR, ChIP assay, immunofluorescenceand confocal microscopy.
RESULTS
H. pylori induces Siah2 in cultured GCCs
To identify the effect of H. pylori infection on GCCs, MKN45 cellswere infected with a cag PAI ( + ) H. pylori strain 26695 at a MOIof 100, 200 and 300 for 3 and 6 h. A representative Western blotresult (n = 3) showed significant induction of Siah2 expression byH. pylori at 3 and 6 h post infection (p.i.) with MOI 200 and 300.Results further confirmed that at 6 h p.i., MOI 200 was equivalentto infection with MOI 300 for 6 h with respect to Siah2 induction(Figure 1A). Supplementary Figure S2(A) shows that MOI 200 at6 h was optimum to induce Siah2 expression. Therefore, all futureexperiments were performed with MOI 200 with strain 26695for 6 h to study Siah2 expression unless mentioned otherwise.Fluorescence microscopic images of uninfected cells and infectedcells further confirmed H. pylori as a potent inducer of Siah2(Supplementary Figure S2B). Confocal microscopy revealed thatH. pylori substantially induced nuclear accumulation of Siah2 inthe infected GCCs (Supplementary Figure S2C). Comparison ofbasal and p.i. expression of Siah2 at mRNA level (real-timeRT-PCR) also showed significant increase in Siah2 expressionafter H. pylori infection (Figure 1B). As various GCCs couldshow difference in their protein expression pattern, we sought todetermine whether MOI 200 was effective in inducing Siah2 inother GCCs. Western blot of the comparative study revealedthat MOI 200 also induced Siah2 in Kato III and AGS cells(Figure 1C). There was an equivalent induction of Siah2 proteinwhen MKN45 cells were infected with either 26695, 8-1 or D154H. pylori strains indicating that Siah2 induction was not dependenton cag PAI status (Figure 1D).
ETS2 and Twist1 are induced in H. pylori-infected GCCs
In order to identify transcription factors regulating Siah2expression, we performed promoter analysis for siah2 usingbioinformatics tools such as MatInspector (professional version6.2.2). Although several transcription factor binding sites wereimplicated in the siah2 promoter region, ETS2 and Twist1showed very high probability of binding. The putative EBS
c© 2016 The Author(s). Published by Portland Press Limited on behalf of the Biochemical Society.

1632 L. Das and others
Figure 1 Siah2 is induced in H. pylori-infected GCCs
(A) A representative Western blot (n = 3) of whole cell lysates prepared from uninfected and infected (3 and 6 h with MOI 100, 200 and 300) MKN45 cells shows Siah2 induction in infected GCCs.α-Tubulin was used as a loading control. A graphical representation of the data confirms that MOI 200 at 6 h is optimal in inducing Siah2. Bars depict normalized data (mean +− S.E.M., n = 3),*P < 0.05. (B) Siah2 expression in MKN45 cells at mRNA level as detected by real-time RT-PCR. Bars depict normalized data (mean +− S.E.M., n = 3), *P < 0.05. (C) A representative Westernblot (n = 3) shows Siah2 induction in Kato III, MKN45 and AGS cells after being infected with MOI 200 of H. pylori for 6 h. Bars shown below represent normalized data (mean +− S.E.M., n = 3),*P < 0.05. (D) Western blot results (n = 3) showing expression of Siah2 in cell lysates prepared from uninfected or infected MKN45 cells. Strains of H. pylori used for the experiment were cag PAI( + ) strain 26695, cag PAI ( − ) strains 8-1 and D154. Bars shown below represent normalized data (mean +− S.E.M., n = 3), *P < 0.05.
(GGAA/T) was between the − 465 and − 462 bp and TBS(CANNTG) was between the − 431 and − 426 bp upstream ofthe siah2 transcription initiation site (Figure 2). We performedWestern blot analysis to assess ETS2 expression at protein levelin MKN45 cells infected with H. pylori. Although the optimal
time and dose for Siah2 expression were determined in Figure 1,we needed to identify the same for ETS2 and Twist1. A time-dependent study showed induced expression of ETS2 as early as1 h p.i. and that was maintained at the same level even at 6 hp.i. whereas no ETS2 expression was noticed at any time point in
c© 2016 The Author(s). Published by Portland Press Limited on behalf of the Biochemical Society.

H. pylori induces Siah2 expression 1633
Figure 2 Analysis of human siah2 promoter. The EBS and TBS of the humansiah2 promoter are shown. The ATG start codon is underlined.
uninfected cells (Figure 3A). The same study also revealed that theexpression of Twist1 was induced at 1 h p.i. and was maintainedat the same level up to 3 h and decreased at 6 h. Dose-kineticsperformed at 3 h and 6 h p.i. with MOI 100 and 200 clearly showedthat 200 MOI was more effective in inducing ETS2 (Figure 3B)and Twist1 (Figure 3C) expression than MOI 100. We performedWestern blotting on cell lysates prepared from other GCCs suchas Kato III and AGS along with MKN45 cells at 3 h p.i. (MOI200) to assess the expression of ETS2 and Twist1. RepresentativeWestern blots from independent experiments (n = 3) showedmarked enhancement in ETS2 (Figure 3D) and Twist1 expression(Figure 3E) in all cell lines. We observed that strain 8-1 and strainD154 were equally effective in inducing ETS2 and Twist1 asstrain 26695 (Figures 3F and 3G respectively). As we observedthat although Twist1 was induced at 3 h of infection, the levelof Twist1 at 6 h p.i. was equal to its basal expression level ofeither 3 or 6 h, we presumed that proteasomal degradation mighthave caused Twist1 degradation at 6 h of infection. Pretreatmentof MKN45 cells with MG132 prior to H. pylori infectionclearly rescued Twist1 protein from degradation indicating thatubiquitination-mediated proteasomal degradation of Twist1 wasunderway at 6 h p.i. (Figure 3H). Graphical representation of alldata is shown in Supplementary Figure S3.
Antral biopsy samples obtained from consenting patientsduring gastric endoscopy were used to study expression ofTwist1, ETS2 and Siah2 proteins in gastric adenocarcinoma.Fluorescence microscopic analysis of gastric biopsies fromadenocarcinoma patients with samples from adjacent non-cancer gastric tissue samples revealed that Siah2 (SupplementaryFigure S4A), ETS2 (Supplementary Figure S4B) and Twist1(Supplementary Figure S4C) were highly increased inadenocarcinoma biopsy samples compared with non-cancertissues.
ETS2 and Twist1 bind with siah2 promoter in H. pylori-infectedGCCs
Next we assessed ETS2 binding with the siah2 EBS and TBSin uninfected and infected MKN45 cells. Nuclear extracts wereprepared from 3 h H. pylori-infected (MOI 200) MKN45 cells.WT as well as EBS and TBS-Mut siah2 promoter oligonucleotides(Supplementary Figure S1) were synthesized. Magnetic beadswere coated with oligonucleotides just prior to incubation withnuclear lysates from infected and uninfected cells. Analysis ofbead-bound proteins by Western blot determined binding of ETS2with the siah2 EBS (Figure 4A) and Twist1 with siah2 TBS onlyafter H. pylori infection (Figure 4B). Input nuclear lysates werealso run to assess the expression of ETS2 (Figure 4A) and Twist1(Figure 4B) in nuclear lysates and histone-deacetylase 1 (HDAC1)was used as a nuclear loading control. Results confirmed thatboth ETS2 and Twist1 were increased in the nuclear fraction byH. pylori infection. We did not detect any ETS2 expression inthe uninfected cells whereas low level of Twist1 expression wasobserved in the nucleus of uninfected cells.
In order to detect binding of ETS2 and Twist1 to the siah2promoter in vivo, MKN45 cells were infected with MOI 200of strain 26695 for 3 h and nuclear lysates were assessed byChIP assay using ETS2 (Figure 4C) and Twist1 (Figure 4D)antibodies. The PCR products of DNA in these immunocomplexescorresponding to the siah2 promoter flanking the EBS and TBS(S = specific PCR product), respectively, were not present inthe PCR product corresponding to the 5′ far upstream sequence(NS = non-specific PCR product).
ETS2 and Twist1 enhance Siah2 expression in H. pylori-infectedGCCs
Dual luciferase assays were performed to assess the role of ETS2and Twist1 in H. pylori infection-induced siah2 transcription.MKN45 cells were first co-transfected with the Renilla luciferaseconstruct phRLTK along with the WT or EBS or TBS-Mut siah2-reporter constructs followed by infection with H. pylori for 2 h.Significant enhancement of siah2 transactivation was observedin the infected MKN45 cells expressing WT siah2 luciferaseconstructs. The effect was significantly reduced in the EBS Mut(Figure 5A) or TBS Mut-expressing cells (Figure 5B) confirmingthat ETS2 and Twist1 mediate siah2 transcription in the infectedGCCs.
We next sought to determine the effect of ectopic expressionof ETS2 and Twist1 on siah2 transcription. For this, the emptyvector or ETS2 overexpression plasmids were transfected alongwith the WT siah2 promoter construct and the Renilla luciferaseconstruct phRLTK followed by infection with H. pylori for 2 h(Figure 5C). Dual luciferase assay data confirmed that ETS2significantly enhanced H. pylori-induced siah2 transcription.Twist1 overexpression showed a similar inducing effect of Twist1on siah2 luciferase activity (Figure 5D). Western blot analysisfurther established that overexpression of ETS2 and Twist1mediated induction of Siah2 protein expression in H. pylori-infected GCCs (Figures 5E and 5F respectively). We also notedthat although Twist1 was highly induced in uninfected Twist1-expressing cells as compared with the infected pcDNA3.1+ -expressing cells, Siah2 expression was lower in the first groupwhich indicated the possibility of a post-translational modificationof Twist1 only after infection with H. pylori that might beresponsible for its activation.
c© 2016 The Author(s). Published by Portland Press Limited on behalf of the Biochemical Society.
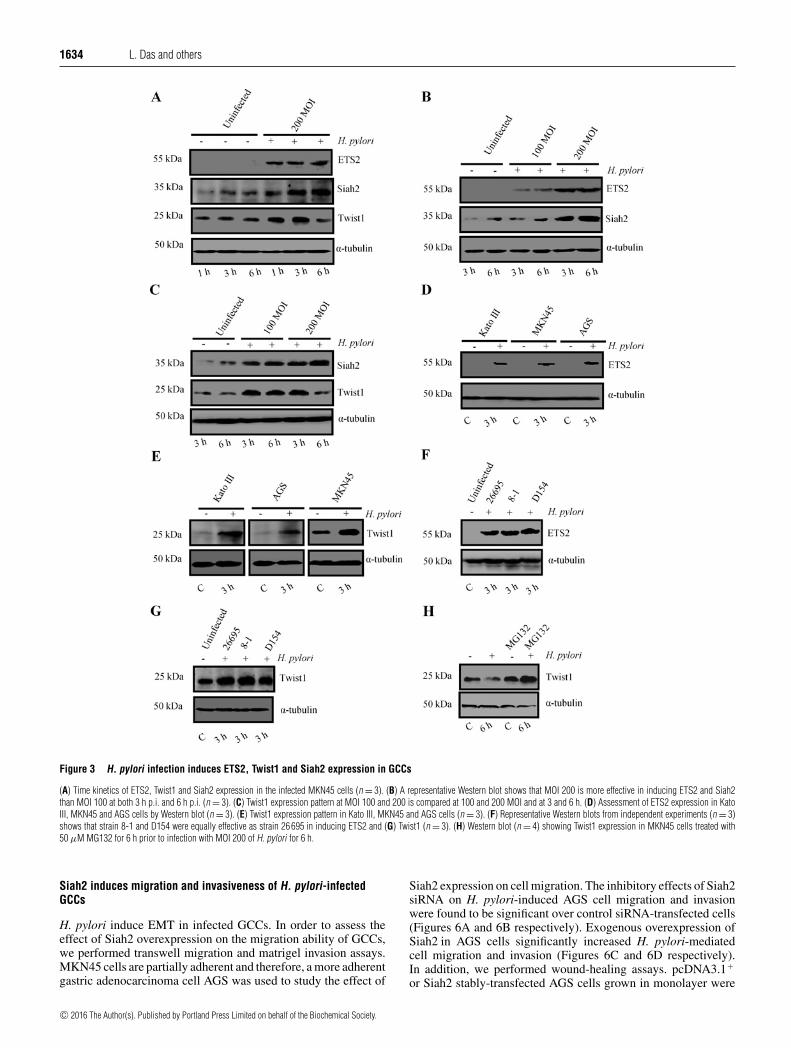
1634 L. Das and others
Figure 3 H. pylori infection induces ETS2, Twist1 and Siah2 expression in GCCs
(A) Time kinetics of ETS2, Twist1 and Siah2 expression in the infected MKN45 cells (n = 3). (B) A representative Western blot shows that MOI 200 is more effective in inducing ETS2 and Siah2than MOI 100 at both 3 h p.i. and 6 h p.i. (n = 3). (C) Twist1 expression pattern at MOI 100 and 200 is compared at 100 and 200 MOI and at 3 and 6 h. (D) Assessment of ETS2 expression in KatoIII, MKN45 and AGS cells by Western blot (n = 3). (E) Twist1 expression pattern in Kato III, MKN45 and AGS cells (n = 3). (F) Representative Western blots from independent experiments (n = 3)shows that strain 8-1 and D154 were equally effective as strain 26 695 in inducing ETS2 and (G) Twist1 (n = 3). (H) Western blot (n = 4) showing Twist1 expression in MKN45 cells treated with50 μM MG132 for 6 h prior to infection with MOI 200 of H. pylori for 6 h.
Siah2 induces migration and invasiveness of H. pylori-infectedGCCs
H. pylori induce EMT in infected GCCs. In order to assess theeffect of Siah2 overexpression on the migration ability of GCCs,we performed transwell migration and matrigel invasion assays.MKN45 cells are partially adherent and therefore, a more adherentgastric adenocarcinoma cell AGS was used to study the effect of
Siah2 expression on cell migration. The inhibitory effects of Siah2siRNA on H. pylori-induced AGS cell migration and invasionwere found to be significant over control siRNA-transfected cells(Figures 6A and 6B respectively). Exogenous overexpression ofSiah2 in AGS cells significantly increased H. pylori-mediatedcell migration and invasion (Figures 6C and 6D respectively).In addition, we performed wound-healing assays. pcDNA3.1+
or Siah2 stably-transfected AGS cells grown in monolayer were
c© 2016 The Author(s). Published by Portland Press Limited on behalf of the Biochemical Society.

H. pylori induces Siah2 expression 1635
Figure 4 ETS2 and Twist1 bind to the siah2 promoter in H. pylori-infected GCCs
(A) Western blot showing H. pylori-induced ETS2 binding with the siah2 promoter (n = 3). ETS2 binds to the WT EBS only but not with the EBS-Mut oligo. Input lanes show expression of ETS2 in thenuclear lysates. HDAC1 is the loading control for nuclear lysates. (B) Western blot showing H. pylori-induced Twist1 binding with the siah2 promoter (n = 3). Twist1 specifically binds to the WT TBSbut not to the TBS-Mut oligo. Input lanes show expression of Twist1 in the nuclear lysates. (C) ChIP analysis of ETS2 immunocomplex for siah2 EBS. (D) ChIP analysis of Twist1 immunocomplexfor siah2 TBS. IgG, immunoglobulin G; M, MW marker; NS, non-specific primer, S, specific primer.
used to prepare wound marks and cells were incubated in thepresence or absence of H. pylori. Siah2-expressing H. pylori-infected AGS cells showed significantly higher migration thanempty-vector-expressing infected cells (Supplementary FiguresS5A and S5B) indicating that Siah2 induced cell migrationability of infected GCCs. The effect of Siah2 overexpressionand H. pylori infection on AGS cell proliferation was testedby MTT assay. Siah2 overexpression significantly induced cellproliferation which was further induced by H. pylori, at 24 h ofinfection (Supplementary Figure S5C). Anchorage-independentgrowth, an additional indicator of more aggressive cancercell behaviour, was evaluated by soft-agar colony formationassays. We found a substantial induction in colony formationby H. pylori-infected Siah2 stably-expressing MKN45 cells ascompared with the uninfected empty-vector expressing cells(Supplementary Figure S5D). Siah2 protein expression statusin the stable MKN45 cells used for the soft-agar assay isshown in the accompanying Western blot image (SupplementaryFigure S5D).
ETS2- and Twist1-mediated induction of Siah2 migration andwound-healing properties of H. pylori-infected GCCs
Wound healing assay was performed to examine the involvementof ETS2 and Twist1 in H. pylori-mediated enhancement ofGCC migration. For this, pcDNA3.1+ , ETS2 or Twist1 stably-expressing AGS cells were used. Both ETS2- and Twist1-expressing cells showed significantly higher wound-healingproperties following H. pylori infection compared with thepcDNA3.1+ -expressing infected cells (Supplementary FiguresS6A and S6B respectively). In order to assess the effect of ETS2and Twist1 in H. pylori-mediated induction of cell invasion, weused stable-transfected cells. Our results confirmed that ETS2and Twist1 dose-dependently induced colony formation abilityof H. pylori-infected cells (Supplementary Figures S7A and S7Brespectively). Accompanying Western blot images show ETS2and Twist1 expression status in stable cells. To further ascertainthe role of ETS2 and Twist1 in Siah2 expression we transfectedMKN45 cells with ETS2 and Twist1 siRNAs along with control
c© 2016 The Author(s). Published by Portland Press Limited on behalf of the Biochemical Society.

1636 L. Das and others
Figure 5 ETS2 and Twist1 enhance siah2 transcription
(A) Bar graph of dual luciferase activities (mean +− S.E.M., n = 3) driven by the WT and ETS2-Mut siah2 promoters in MKN45 cells with or without H. pylori infection. *P < 0.05. (B) Bar graphof dual luciferase activities (mean +− S.E.M., n = 3) to show the effect of Twist1 binding with the WT and Twist1-Mut siah2 promoters in presence or absence of H. pylori infection in MKN45cells. *P < 0.05. (C) Dual luciferase assay to show the effect of ectopically expressed ETS2 on the transcriptional activation of WT siah2 promoter (mean +− S.E.M., n = 3). *P < 0.05. (D) Dualluciferase assay showing the effect of ectopically expressed Twist1 on the WT siah2 promoter luciferase activity (mean +− S.E.M., n = 3). *P < 0.05. (E) Western blot analysis showing the effect ofoverexpression of ETS2 on Siah2 protein expression in H. pylori-infected GCCs. Bars shown below represent normalized data (mean +− S.E.M., n = 3), *P < 0.05. (F) Western blotting shows theeffect of Twist1 overexpression on Siah2 expression in H. pylori-infected GCCs. Bars depict normalized data (mean +− S.E.M., n = 3), *P < 0.05.
duplex siRNA. Western blotting showed significant reduction inSiah2 expression in ETS2- and Twist1-suppressed and H. pylori-infected cells (Supplementary Figures S8A and S8B respectively).Next, we suppressed Siah2 in MKN45 cells to find out its role inH. pylori-mediated cell migration. Siah2-suppressed cells showed
significantly less wound-healing property following H. pyloriinfection compared with the control duplex-expressing infectedcells (Supplementary Figure S8C). Accompanying Western blotresults represent Siah2-suppression status in MKN45 cells usedfor the above experiment.
c© 2016 The Author(s). Published by Portland Press Limited on behalf of the Biochemical Society.

H. pylori induces Siah2 expression 1637
Figure 6 Siah2 increases migration and invasion property of H. pylori-infected GCCs
(A) Transwell migration assay using siControl and siSiah2-transfected AGS cells (n = 3).Cells were seeded in serum-free media on to the upper chamber of Transwell. After 24 h of infection (with orwithout H. pylori), migrated cells at the lower surface of the membrane were stained with haematoxylin and counted. Imaging was done using an inverted microscope. Scale shown = 50 μm. Barsrepresent number of cells migrated from three independent experiments (mean +− S.E.M.). *P < 0.05. (B) Results of Transwell invasion assay on the Siah2 siRNA and siControl expressed AGS cells(infected with or without H. pylori). Cells were seeded on the upper chamber of the matrigel-precoated Transwell. Cells were allowed to invade through the membrane for 24 h. Invaded cells werecounted from three independent experiments. Scale shown = 50 μm. Bar graph represents the average number of invaded cells (mean +− S.E.M.). *P < 0.05. (C) Transwell migration was performedusing empty vector and Siah2-overexpressing infected and uninfected AGS cells following procedures mentioned in Figure 6A. Scale shown = 50 μm. Bars represent (mean +− S.E.M.). *P < 0.05.(D) Cell invasiveness was measured using empty vector and Siah2-overexpressing AGS cells with or without infection as explained in Figure 6B. Scale shown = 50 μm. Bar graph represents theaverage number of invaded cells (mean +− S.E.M.), *P < 0.05.
c© 2016 The Author(s). Published by Portland Press Limited on behalf of the Biochemical Society.
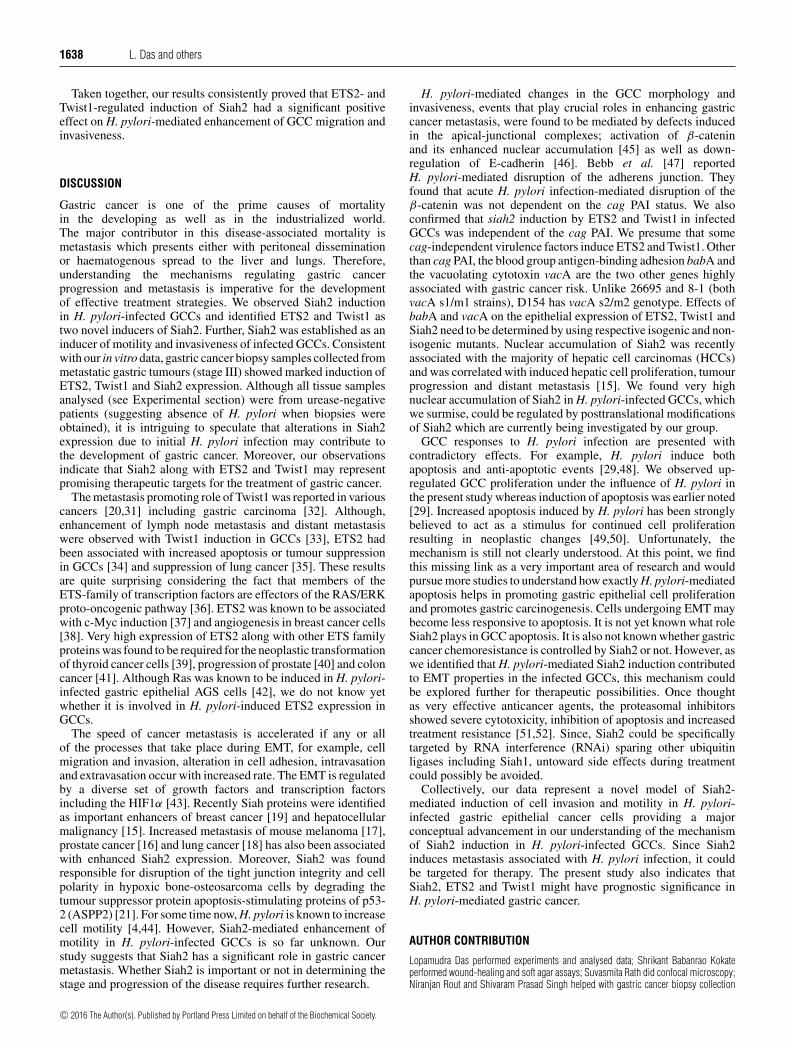
1638 L. Das and others
Taken together, our results consistently proved that ETS2- andTwist1-regulated induction of Siah2 had a significant positiveeffect on H. pylori-mediated enhancement of GCC migration andinvasiveness.
DISCUSSION
Gastric cancer is one of the prime causes of mortalityin the developing as well as in the industrialized world.The major contributor in this disease-associated mortality ismetastasis which presents either with peritoneal disseminationor haematogenous spread to the liver and lungs. Therefore,understanding the mechanisms regulating gastric cancerprogression and metastasis is imperative for the developmentof effective treatment strategies. We observed Siah2 inductionin H. pylori-infected GCCs and identified ETS2 and Twist1 astwo novel inducers of Siah2. Further, Siah2 was established as aninducer of motility and invasiveness of infected GCCs. Consistentwith our in vitro data, gastric cancer biopsy samples collected frommetastatic gastric tumours (stage III) showed marked induction ofETS2, Twist1 and Siah2 expression. Although all tissue samplesanalysed (see Experimental section) were from urease-negativepatients (suggesting absence of H. pylori when biopsies wereobtained), it is intriguing to speculate that alterations in Siah2expression due to initial H. pylori infection may contribute tothe development of gastric cancer. Moreover, our observationsindicate that Siah2 along with ETS2 and Twist1 may representpromising therapeutic targets for the treatment of gastric cancer.
The metastasis promoting role of Twist1 was reported in variouscancers [20,31] including gastric carcinoma [32]. Although,enhancement of lymph node metastasis and distant metastasiswere observed with Twist1 induction in GCCs [33], ETS2 hadbeen associated with increased apoptosis or tumour suppressionin GCCs [34] and suppression of lung cancer [35]. These resultsare quite surprising considering the fact that members of theETS-family of transcription factors are effectors of the RAS/ERKproto-oncogenic pathway [36]. ETS2 was known to be associatedwith c-Myc induction [37] and angiogenesis in breast cancer cells[38]. Very high expression of ETS2 along with other ETS familyproteins was found to be required for the neoplastic transformationof thyroid cancer cells [39], progression of prostate [40] and coloncancer [41]. Although Ras was known to be induced in H. pylori-infected gastric epithelial AGS cells [42], we do not know yetwhether it is involved in H. pylori-induced ETS2 expression inGCCs.
The speed of cancer metastasis is accelerated if any or allof the processes that take place during EMT, for example, cellmigration and invasion, alteration in cell adhesion, intravasationand extravasation occur with increased rate. The EMT is regulatedby a diverse set of growth factors and transcription factorsincluding the HIF1α [43]. Recently Siah proteins were identifiedas important enhancers of breast cancer [19] and hepatocellularmalignancy [15]. Increased metastasis of mouse melanoma [17],prostate cancer [16] and lung cancer [18] has also been associatedwith enhanced Siah2 expression. Moreover, Siah2 was foundresponsible for disruption of the tight junction integrity and cellpolarity in hypoxic bone-osteosarcoma cells by degrading thetumour suppressor protein apoptosis-stimulating proteins of p53-2 (ASPP2) [21]. For some time now, H. pylori is known to increasecell motility [4,44]. However, Siah2-mediated enhancement ofmotility in H. pylori-infected GCCs is so far unknown. Ourstudy suggests that Siah2 has a significant role in gastric cancermetastasis. Whether Siah2 is important or not in determining thestage and progression of the disease requires further research.
H. pylori-mediated changes in the GCC morphology andinvasiveness, events that play crucial roles in enhancing gastriccancer metastasis, were found to be mediated by defects inducedin the apical-junctional complexes; activation of β-cateninand its enhanced nuclear accumulation [45] as well as down-regulation of E-cadherin [46]. Bebb et al. [47] reportedH. pylori-mediated disruption of the adherens junction. Theyfound that acute H. pylori infection-mediated disruption of theβ-catenin was not dependent on the cag PAI status. We alsoconfirmed that siah2 induction by ETS2 and Twist1 in infectedGCCs was independent of the cag PAI. We presume that somecag-independent virulence factors induce ETS2 and Twist1. Otherthan cag PAI, the blood group antigen-binding adhesion babA andthe vacuolating cytotoxin vacA are the two other genes highlyassociated with gastric cancer risk. Unlike 26695 and 8-1 (bothvacA s1/m1 strains), D154 has vacA s2/m2 genotype. Effects ofbabA and vacA on the epithelial expression of ETS2, Twist1 andSiah2 need to be determined by using respective isogenic and non-isogenic mutants. Nuclear accumulation of Siah2 was recentlyassociated with the majority of hepatic cell carcinomas (HCCs)and was correlated with induced hepatic cell proliferation, tumourprogression and distant metastasis [15]. We found very highnuclear accumulation of Siah2 in H. pylori-infected GCCs, whichwe surmise, could be regulated by posttranslational modificationsof Siah2 which are currently being investigated by our group.
GCC responses to H. pylori infection are presented withcontradictory effects. For example, H. pylori induce bothapoptosis and anti-apoptotic events [29,48]. We observed up-regulated GCC proliferation under the influence of H. pylori inthe present study whereas induction of apoptosis was earlier noted[29]. Increased apoptosis induced by H. pylori has been stronglybelieved to act as a stimulus for continued cell proliferationresulting in neoplastic changes [49,50]. Unfortunately, themechanism is still not clearly understood. At this point, we findthis missing link as a very important area of research and wouldpursue more studies to understand how exactly H. pylori-mediatedapoptosis helps in promoting gastric epithelial cell proliferationand promotes gastric carcinogenesis. Cells undergoing EMT maybecome less responsive to apoptosis. It is not yet known what roleSiah2 plays in GCC apoptosis. It is also not known whether gastriccancer chemoresistance is controlled by Siah2 or not. However, aswe identified that H. pylori-mediated Siah2 induction contributedto EMT properties in the infected GCCs, this mechanism couldbe explored further for therapeutic possibilities. Once thoughtas very effective anticancer agents, the proteasomal inhibitorsshowed severe cytotoxicity, inhibition of apoptosis and increasedtreatment resistance [51,52]. Since, Siah2 could be specificallytargeted by RNA interference (RNAi) sparing other ubiquitinligases including Siah1, untoward side effects during treatmentcould possibly be avoided.
Collectively, our data represent a novel model of Siah2-mediated induction of cell invasion and motility in H. pylori-infected gastric epithelial cancer cells providing a majorconceptual advancement in our understanding of the mechanismof Siah2 induction in H. pylori-infected GCCs. Since Siah2induces metastasis associated with H. pylori infection, it couldbe targeted for therapy. The present study also indicates thatSiah2, ETS2 and Twist1 might have prognostic significance inH. pylori-mediated gastric cancer.
AUTHOR CONTRIBUTION
Lopamudra Das performed experiments and analysed data; Shrikant Babanrao Kokateperformed wound-healing and soft agar assays; Suvasmita Rath did confocal microscopy;Niranjan Rout and Shivaram Prasad Singh helped with gastric cancer biopsy collection
c© 2016 The Author(s). Published by Portland Press Limited on behalf of the Biochemical Society.

H. pylori induces Siah2 expression 1639
and analysis; Asish Mukhopadhyay provided a crucial reagent; Sheila Crowe gave expertcomments; Asima Bhattacharyya conceived the work, designed experiments, analysed thedata, supervised the work and wrote the paper.
FUNDING
This work was supported by the Department of Biotechnology, Govt. of India [grant numberBT/PR15092/GBD/27/311/2011 (to A.B.)]; the Science and Engineering Research Board,Government of India [grant number SB/SO/BB-0015/2014 (to A.B.)]; the Indian Councilof Medical Research fellowship [grant number 3/1/3/JRF-2010/HRD-94 (Roll- 41439) (toS.R.)]; and NISER fellowship, Department of Atomic Energy, Government of India (to L.D.and S.B.K.).
REFERENCES
1 Jemal, A., Siegel, R., Ward, E., Hao, Y., Xu, J., Murray, T. and Thun, M.J. (2008) Cancerstatistics, 2008. CA Cancer J. Clin. 58, 71–96 CrossRef PubMed
2 Tsugane, S. and Sasazuki, S. (2007) Diet and the risk of gastric cancer: review ofepidemiological evidence. Gastric Cancer 10, 75–83 CrossRef PubMed
3 Bessede, E., Staedel, C., Acuna Amador, L.A., Nguyen, P.H., Chambonnier, L.,Hatakeyama, M., Belleannee, G., Megraud, F. and Varon, C. (2013) Helicobacter pylorigenerates cells with cancer stem cell properties via epithelial-mesenchymal transition-likechanges. Oncogene 33, 4123–4131 CrossRef PubMed
4 Krueger, S., Hundertmark, T., Kuester, D., Kalinski, T., Peitz, U. and Roessner, A. (2007)Helicobacter pylori alters the distribution of ZO-1 and p120ctn in primary human gastricepithelial cells. Pathol. Res. Pract. 203, 433–444 CrossRef PubMed
5 Amieva, M.R., Vogelmann, R., Covacci, A., Tompkins, L.S., Nelson, W.J. and Falkow, S.(2003) Disruption of the epithelial apical-junctional complex by Helicobacter pylori CagA.Science 300, 1430–1434 CrossRef PubMed
6 Churin, Y., Al-Ghoul, L., Kepp, O., Meyer, T.F., Birchmeier, W. and Naumann, M. (2003)Helicobacter pylori CagA protein targets the c-Met receptor and enhances the motogenicresponse. J. Cell Biol. 161, 249–255 CrossRef PubMed
7 Pavlides, S.C., Huang, K.T., Reid, D.A., Wu, L., Blank, S.V., Mittal, K., Guo, L.,Rothenberg, E., Rueda, B., Cardozo, T. and Gold, L.I. (2013) Inhibitors of SCF-Skp2/Cks1E3 ligase block estrogen-induced growth stimulation and degradation of nuclear p27kip1:therapeutic potential for endometrial cancer. Endocrinology 154, 4030–4045CrossRef PubMed
8 Lipkowitz, S. and Weissman, A.M. (2011) RINGs of good and evil: RING finger ubiquitinligases at the crossroads of tumour suppression and oncogenesis. Nat. Rev. Cancer 11,629–643 CrossRef PubMed
9 Shen, M., Schmitt, S., Buac, D. and Dou, Q.P. (2013) Targeting the ubiquitin-proteasomesystem for cancer therapy. Expert Opin. Ther. Targets 17, 1091–1108CrossRef PubMed
10 Habelhah, H., Frew, I.J., Laine, A., Janes, P.W., Relaix, F., Sassoon, D., Bowtell, D.D. andRonai, Z. (2002) Stress-induced decrease in TRAF2 stability is mediated by Siah2. EMBOJ. 21, 5756–5765 CrossRef PubMed
11 Matsuzawa, S.I. and Reed, J.C. (2001) Siah-1, SIP, and Ebi collaborate in a novel pathwayfor beta-catenin degradation linked to p53 responses. Mol. Cell 7, 915–926CrossRef PubMed
12 Nadeau, R.J., Toher, J.L., Yang, X., Kovalenko, D. and Friesel, R. (2007) Regulation ofSprouty2 stability by mammalian Seven-in-Absentia homolog 2. J. Cell. Biochem. 100,151–160 CrossRef PubMed
13 Nakayama, K., Frew, I.J., Hagensen, M., Skals, M., Habelhah, H., Bhoumik, A., Kadoya, T.,Erdjument-Bromage, H., Tempst, P., Frappell, P.B. et al. (2004) Siah2 regulates stability ofprolyl-hydroxylases, controls HIF1alpha abundance, and modulates physiologicalresponses to hypoxia. Cell 117, 941–952 CrossRef PubMed
14 Susini, L., Passer, B.J., Amzallag-Elbaz, N., Juven-Gershon, T., Prieur, S., Privat, N.,Tuynder, M., Gendron, M.C., Israel, A., Amson, R. et al. (2001) Siah-1 binds and regulatesthe function of Numb. Proc. Natl. Acad. Sci. U.S.A. 98, 15067–15072CrossRef PubMed
15 Malz, M., Aulmann, A., Samarin, J., Bissinger, M., Longerich, T., Schmitt, S.,Schirmacher, P. and Breuhahn, K. (2012) Nuclear accumulation of seven in absentiahomologue-2 supports motility and proliferation of liver cancer cells. Int. J. Cancer 131,2016–2026 CrossRef PubMed
16 Qi, J., Nakayama, K., Cardiff, R.D., Borowsky, A.D., Kaul, K., Williams, R., Krajewski, S.,Mercola, D., Carpenter, P.M., Bowtell, D. and Ronai, Z.A. (2010) Siah2-dependentconcerted activity of HIF and FoxA2 regulates formation of neuroendocrine phenotype andneuroendocrine prostate tumors. Cancer Cell 18, 23–38 CrossRef PubMed
17 Qi, J., Nakayama, K., Gaitonde, S., Goydos, J.S., Krajewski, S., Eroshkin, A., Bar-Sagi, D.,Bowtell, D. and Ronai, Z. (2008) The ubiquitin ligase Siah2 regulates tumorigenesis andmetastasis by HIF-dependent and -independent pathways. Proc. Natl. Acad. Sci. U.S.A.105, 16713–16718 CrossRef PubMed
18 Ahmed, A.U., Schmidt, R.L., Park, C.H., Reed, N.R., Hesse, S.E., Thomas, C.F., Molina,J.R., Deschamps, C., Yang, P., Aubry, M.C. and Tang, A.H. (2008) Effect of disruptingseven-in-absentia homolog 2 function on lung cancer cell growth. J. Natl. Cancer Inst.100, 1606–1629 CrossRef PubMed
19 Chan, P., Moller, A., Liu, M.C., Sceneay, J.E., Wong, C.S., Waddell, N., Huang, K.T.,Dobrovic, A., Millar, E. K., O’Toole, S.A. et al. (2011) The expression of the ubiquitinligase SIAH2 (seven in absentia homolog 2) is mediated through gene copy number inbreast cancer and is associated with a basal-like phenotype and p53 expression. BreastCancer Res. 13, R19 CrossRef PubMed
20 Shiota, M., Zardan, A., Takeuchi, A., Kumano, M., Beraldi, E., Naito, S., Zoubeidi, A. andGleave, M.E. (2012) Clusterin mediates TGF-beta-induced epithelial-mesenchymaltransition and metastasis via Twist1 in prostate cancer cells. Cancer Res. 72, 5261–5272CrossRef PubMed
21 Kim, H., Claps, G., Moller, A., Bowtell, D., Lu, X. and Ronai, Z.A. (2014) Siah2 regulatestight junction integrity and cell polarity through control of ASPP2 stability. Oncogene 33,2004–2010 CrossRef PubMed
22 Sarkar, T.R., Sharan, S., Wang, J., Pawar, S.A., Cantwell, C.A., Johnson, P.F., Morrison,D.K., Wang, J.M. and Sterneck, E. (2012) Identification of a Src tyrosine kinase/SIAH2 E3ubiquitin ligase pathway that regulates C/EBPdelta expression and contributes totransformation of breast tumor cells. Mol. Cell. Biol. 32, 320–332 CrossRef PubMed
23 Frasor, J., Danes, J.M., Funk, C.C. and Katzenellenbogen, B.S. (2005) Estrogendown-regulation of the corepressor N-CoR: mechanism and implications for estrogenderepression of N-CoR-regulated genes. Proc. Natl. Acad. Sci. U.S.A. 102, 13153–13157CrossRef PubMed
24 MacLeod, R.J., Hayes, M. and Pacheco, I. (2007) Wnt5a secretion stimulated by theextracellular calcium-sensing receptor inhibits defective Wnt signaling in colon cancercells. Am. J. Physiol. Gastrointest. Liver Physiol. 293, G403–G411 CrossRef PubMed
25 Jing, Y., Liu, L.Z., Jiang, Y., Zhu, Y., Guo, N.L., Barnett, J., Rojanasakul, Y., Agani, F. andJiang, B.H. (2012) Cadmium increases HIF-1 and VEGF expression through ROS, ERK,and AKT signaling pathways and induces malignant transformation of human bronchialepithelial cells. Toxicol. Sci. 125, 10–19 CrossRef PubMed
26 Mo, C., Dai, Y., Kang, N., Cui, L. and He, W. (2012) Ectopic expression of human MutShomologue 2 on renal carcinoma cells is induced by oxidative stress with interleukin-18promotion via p38 mitogen-activated protein kinase (MAPK) and c-Jun N-terminal kinase(JNK) signaling pathways. J. Biol. Chem. 287, 19242–19254 CrossRef PubMed
27 Bhattacharyya, A., Chattopadhyay, R., Hall, E.H., Mebrahtu, S.T., Ernst, P.B. and Crowe,S.E. (2010) Mechanism of hypoxia-inducible factor 1 alpha-mediated Mcl1 regulation inHelicobacter pylori-infected human gastric epithelium. Am. J. Physiol. Gastrointest. LiverPhysiol. 299, G1177–G1186 CrossRef PubMed
28 Bhattacharyya, A., Chattopadhyay, R., Burnette, B.R., Cross, J.V., Mitra, S., Ernst, P.B.,Bhakat, K.K. and Crowe, S.E. (2009) Acetylation of apurinic/apyrimidinic endonuclease-1regulates Helicobacter pylori-mediated gastric epithelial cell apoptosis. Gastroenterology136, 2258–2269 CrossRef PubMed
29 Rath, S., Das, L., Kokate, S.B., Pratheek, B.M., Chattopadhyay, S., Goswami, C.,Chattopadhyay, R., Crowe, S.E. and Bhattacharyya, A. (2015) Regulation ofNoxa-mediated apoptosis in Helicobacter pylori-infected gastric epithelial cells. FASEB J.29, 796–806 CrossRef PubMed
30 Sekiguchi, M. and Suzuki, T. (1994) 11 – gastric tumor cell lines. In Atlas of HumanTumor Cell Lines (Hay, R.K.M., Park, J.-G.B. and Gazdar, A., eds), pp. 287–316,Academic Press, San Diego CrossRef
31 Croset, M., Goehrig, D., Frackowiak, A., Bonnelye, E., Ansieau, S., Puisieux, A. andClezardin, P. (2014) TWIST1 expression in breast cancer cells facilitates bone metastasisformation. J. Bone Miner. Res. 29, 1886–1899 CrossRef PubMed
32 Yang, Z., Zhang, X., Gang, H., Li, X., Li, Z., Wang, T., Han, J., Luo, T., Wen, F. and Wu, X.(2007) Up-regulation of gastric cancer cell invasion by Twist is accompanied byN-cadherin and fibronectin expression. Biochem. Biophys. Res. Commun. 358, 925–930CrossRef PubMed
33 Ru, G.Q., Wang, H.J., Xu, W.J. and Zhao, Z.S. (2011) Upregulation of Twist in gastriccarcinoma associated with tumor invasion and poor prognosis. Pathol. Oncol. Res. 17,341–347 CrossRef PubMed
34 Liao, Y.L., Hu, L.Y., Tsai, K.W., Wu, C.W., Chan, W.C., Li, S.C., Lai, C.H., Ho, M.R., Fang,W.L., Huang, K.H. and Lin, W.C. (2012) Transcriptional regulation of miR-196b byETS2 in gastric cancer cells. Carcinogenesis 33, 760–769 CrossRef PubMed
35 Kabbout, M., Garcia, M.M., Fujimoto, J., Liu, D.D., Woods, D., Chow, C.W., Mendoza, G.,Momin, A.A., James, B.P., Solis, L. et al. (2013) ETS2 mediated tumor suppressivefunction and MET oncogene inhibition in human non-small cell lung cancer. Clin. CancerRes. 19, 3383–3395 CrossRef PubMed
36 Kabbout, M., Dakhlallah, D., Sharma, S., Bronisz, A., Srinivasan, R., Piper, M., Marsh,C.B. and Ostrowski, M.C. (2014) MicroRNA 17–92 cluster mediates ETS1 andETS2-dependent RAS-oncogenic transformation. PLoS One 9, e100693CrossRef PubMed
c© 2016 The Author(s). Published by Portland Press Limited on behalf of the Biochemical Society.

1640 L. Das and others
37 Al-azawi, D., Ilroy, M.M., Kelly, G., Redmond, A.M., Bane, F.T., Cocchiglia, S., Hill, A.D.and Young, L.S. (2008) Ets-2 and p160 proteins collaborate to regulate c-Myc inendocrine resistant breast cancer. Oncogene 27, 3021–3031 CrossRef PubMed
38 Zabuawala, T., Taffany, D.A., Sharma, S.M., Merchant, A., Adair, B., Srinivasan, R., Rosol,T.J., Fernandez, S., Huang, K., Leone, G. and Ostrowski, M.C. (2010) An ets2-driventranscriptional program in tumor-associated macrophages promotes tumor metastasis.Cancer Res. 70, 1323–1333 CrossRef PubMed
39 de Nigris, F., Mega, T., Berger, N., Barone, M.V., Santoro, M., Viglietto, G., Verde, P. andFusco, A. (2001) Induction of ETS-1 and ETS-2 transcription factors is required forthyroid cell transformation. Cancer Res. 61, 2267–2275 PubMed
40 Carbone, G.M., Napoli, S., Valentini, A., Cavalli, F., Watson, D.K. and Catapano, C.V.(2004) Triplex DNA-mediated downregulation of Ets2 expression results in growthinhibition and apoptosis in human prostate cancer cells. Nucleic Acids Res. 32,4358–4367 CrossRef PubMed
41 Flavin, P., Redmond, A., McBryan, J., Cocchiglia, S., Tibbitts, P., Fahy-Browne, P., Kay, E.,Treumann, A., Perrem, K., McIlroy, M. et al. (2011) RuvBl2 cooperates with Ets2 totranscriptionally regulate hTERT in colon cancer. FEBS Lett 585, 2537–2544CrossRef PubMed
42 Cho, S.O., Lim, J.W., Kim, K.H. and Kim, H. (2010) Involvement of Ras and AP-1 inHelicobacter pylori-induced expression of COX-2 and iNOS in gastric epithelial AGScells. Dig. Dis. Sci. 55, 988–996 CrossRef PubMed
43 Hanahan, D. and Weinberg, R.A. (2011) Hallmarks of cancer: the next generation. Cell144, 646–674 CrossRef PubMed
44 Moese, S., Selbach, M., Kwok, T., Brinkmann, V., Konig, W., Meyer, T.F. and Backert, S.(2004) Helicobacter pylori induces AGS cell motility and elongation via independentsignaling pathways. Infect. Immun. 72, 3646–3649 CrossRef PubMed
45 Vogelmann, R., Amieva, M.R., Falkow, S. and Nelson, W.J. (2004) Breaking into theepithelial apical-junctional complex–news from pathogen hackers. Curr. Opin. Cell Biol.16, 86–93 CrossRef PubMed
46 Terres, A.M., Pajares, J.M., O’Toole, D., Ahern, S. and Kelleher, D. (1998) H. pyloriinfection is associated with downregulation of E-cadherin, a molecule involved inepithelial cell adhesion and proliferation control. J. Clin. Pathol. 51, 410–412CrossRef PubMed
47 Bebb, J.R., Leach, L., Zaitoun, A., Hand, N., Letley, D.P., Thomas, R. and Atherton, J. C.(2006) Effects of Helicobacter pylori on the cadherin-catenin complex. J. Clin. Pathol. 59,1261–1266 CrossRef PubMed
48 Yanai, A., Hirata, Y., Mitsuno, Y., Maeda, S., Shibata, W., Akanuma, M., Yoshida, H.,Kawabe, T. and Omata, M. (2003) Helicobacter pylori induces antiapoptosis throughbuclear factor-kappaB activation. J. Infect. Dis. 188, 1741–1751 CrossRef PubMed
49 Xia, H.H. and Talley, N.J. (2001) Apoptosis in gastric epithelium induced by Helicobacterpylori infection: implications in gastric carcinogenesis. Am. J. Gastroenterol. 96, 16–26CrossRef PubMed
50 Jang, T.J. and Kim, J.R. (2000) Proliferation and apoptosis in gastric antral epithelial cellsof patients infected with Helicobacter pylori. J. Gastroenterol. 35, 265–271CrossRef PubMed
51 Kane, R.C., Farrell, A.T., Sridhara, R. and Pazdur, R. (2006) United States Food and DrugAdministration approval summary: bortezomib for the treatment of progressive multiplemyeloma after one prior therapy. Clin. Cancer Res. 12, 2955–2960 CrossRef PubMed
52 Sloss, C.M., Wang, F., Liu, R., Xia, L., Houston, M., Ljungman, D., Palladino, M.A. andCusack, Jr, J.C. (2008) Proteasome inhibition activates epidermal growth factor receptor(EGFR) and EGFR-independent mitogenic kinase signaling pathways in pancreatic cancercells. Clin. Cancer Res. 14, 5116–5123 CrossRef PubMed
Received 10 August 2015/30 March 2016; accepted 5 April 2016Accepted Manuscript online 5 April 2016, doi:10.1042/BCJ20160187
c© 2016 The Author(s). Published by Portland Press Limited on behalf of the Biochemical Society.

ETS2 and Twist1 promote invasiveness of Helicobacter pyloriinfected gastric by inducing Siah2
Das L et al.
SUPPLEMENTARY EXPERIMENTAL Immunoblotting Whole-cell extracts were prepared from GCCs after infection with H. pylori. Proteins were separated by SDS-PAGE and electrotransferred onto PVDF membranes (Millipore, MA, USA). Blots were probed with primary antibodies to Siah2, ETS2 (1:1000) (Santa Cruz Biotechnology, CA, USA) and Twist1 (1:5000) (Abcam, MA, USA). α-tubulin (1:5000) (Abcam) and histone deacetlase 1 (HDAC1) (1:1000) (Cell Signalling Technology, MA, USA) antibodies were used for normalization of protein loading. Immunoreactivity was detected using Super Signal West Femto kit (Thermo Scientific, MI, USA). Immunoblot images were taken with Chemidoc XRS (Bio-Rad) which was equipped with Quantity One-4.6.9 software. Real-time reverse transcription PCR (Real-time RT-PCR) MKN45 cells were seeded in 6-well plates 24 h prior to infection with 200 MOI of H. pylori.Total RNA was extracted after 30 minutes and 2 h of infection with an RNeasy kit (Qiagen, CA, USA). cDNA was synthesized from RNA using SuperScript First Strand synthesis system (Invitrogen). Human Siah2 TaqMan Gene Expression Assay (Applied Biosystems, CA, USA) was used to perform real-time RT-PCR using the 7500 Real-time PCR system (Applied Biosystems).Chromatin immunoprecipitation (ChlP) assayChIP assay was performed using the QuickChIP chromatin immunoprecipitation kit (Imgenex, CA, USA). Cells were infected as indicated; chromatin was sonicated into 0.5–3kb long fragments followed by centrifugation at 12,000×g for 10 min. Supernatants were diluted in dilution buffer and immunoprecipitation was performed using ETS2 antibody (Santa Cruz Biotechnology) or Twist1 antibody (Abcam). DNA-protein cross-links of the immunocomplexes were reversed and in vivo binding of ETS2 to the siah2 EBS and Twist1 to the siah2 TBS was analyzed by performing PCR. Primers for the ChIP assay are shown in Supplementary Figure 1. Immunofluorescence and confocal microscopy MKN45 cells were grown on coverslips. Cells were either left uninfected or were infected with MOI 200 of H. pylori for 6 h followed by fixation with 4% paraformaldehyde, permeabilization with 0.1% Triton-X-100, and blocking with 3% bovine serum albumin. The cells were then treated with Siah2 primary antibody (Santa Cruz Biotechnology) for overnight and further incubated with fluorescently conjugated secondary antibody for 1 h followed by DAPI (4', 6-Diamidino-2-Phenylindole, Dilactate) (Invitrogen) treatment for 20 min. This experiment was repeated three times and cells were viewed with either a fluorescent microscope (Olympus BX51, Japan) or under a laser scanning confocal microscope (LSM 780 Systems, Carl Zeiss).
All gastric biopsy specimens for immunofluorescence examination were collected and fixed with 4% paraformaldehyde. 10 μm tissue sections were prepared by cryomicrotomy,permeabilized, and blocked as mentioned before. The sections were then treated with primary antibodies against Siah2 or ETS2 (Santa Cruz Biotechnology) or Twist1 (Abcam) for overnight and further incubated with fluorescently conjugated secondary antibodies for 1 h and DAPI (Invitrogen) treatment for 20 min. Digital images were captured using a fluorescence microscope (Model BX51, Olympus Co., Japan).

siah2 promoter primers
WT forward: 5’ AGAGGTACCGACTCCGAACACAG 3’WT reverse: 5’ TGTAAGCTTCTTCTGGAACAGCCG 3’
EBS mutant: 5’ CCCGCAGCCCGAGCATTAAGCGCCGGCGCTAGG 3’TBS mutant: 5’ GCCCCCTGCGCTGCTTGCTAGAGCCGGGCGGAGC 3’
siah2 promoter EBS oligos for in vitro binding assay
5’ Biotinylated WT forward: 5’ CAGCCCGAGCAGGAAGCGCCGGCGCTA 3’5’ Biotinylated WT reverse: 5’ TAGCGCCGGCGCTTCCTGCTCGGGCTG 3’
5’ Biotinylated mutant forward: 5’ CAGCCCGAGCATTAAGCGCCGGCGCTA 3’5’ Biotinylated mutant reverse: 5’ TAGCGCCGGCGCTTAATGCTCGGGCTG 3’
siah2 promoter TBS oligos for in vitro binding assay
5’ Biotinylated WT forward: 5’ CCCTGCGCTGCCAGCTGGAGCCGGGCG 3’5’ Biotinylated WT reverse: 5’ CGCCCGGCTCCAGCTGGCAGCGCAGGG 3’
5’ Biotinylated mutant forward: 5’ CCCTGCGCTGCTTGCTAGAGCCGGGCG 3’5’ Biotinylated mutant reverse: 5’ CGCCCGGCTCTAGCAAGCAGCGCAGGG 3’
Primers for ChIP assay
Forward (Specific): 5’ ACCCAGAAAAGACAACCCCGCG 3’Reverse (Specific): 5’ GACGTGACGCCTGGACACGT 3’
Forward (Non Specific): 5’ CTGGTAGACACTTTGAAAGAGA 3’Reverse (Non Specific): 5’ TCCACTCTCTTCCACAAAAG 3’
Supplementary Figure 1 List of primers and oligonucleotides used in the study. Underlined are EBSand TBS. Mutations are shown in boldfaced italics.

- - - + + + H. pylori
Siah2
-tubulin
A
B
Uninfected
H. pylori
DAPI Siah2 Merged
10 m 10 m 10 m
10 m 10 m 10 m
Supplementary Figure 2 Siah2 induction by H. pylori in the infected G Cs(A) A representative time-course study on H. pylori-infected MKN45 cells (n=3). H. pylorioptimally induce Siah2 at 6 h of infection. (B) A representative fluorescence microscopicanalysis showing Siah2 induction in H. pylori-infected MKN45 cells. (C) A representativeconfocal microscopic study showing very high nuclear accumulation of Siah2 in H. pylori-infected MKN45 cells.
50 kDa
35 kDa
H. pylori
DAPI Siah2 Merged
Uninfected
C

Siah
2 pr
otei
n re
lativ
e to
-tu
bulin
E UninfectedH. pylori
Twis
t1 p
rote
in re
lativ
e to
-tu
bulin
Twis
t1 p
rote
in re
lativ
e to
-tu
bulin
Siah
2 pr
otei
n re
lativ
e to
-tu
bulin
Supplementary Figure 3 H. pylori infection induces ETS2, Twist1 and Siah2 expression inGraphical representation of Figure 3A, 3B, 3C, 3D, 3E, 3F, 3G from three independent experiments(mean±SEM), *P < 0.05 (A-G); Bar graph of Figure 3H from four independent experiments(mean±SEM), *P < 0.05 (H).
ETS2
pro
tein
rela
tive
to
-tubu
lin
1 h 3 h 6 h
A UninfectedH. pylori
0
1
2
33.5
0.5
1.5
2.5
* * *
Twis
t1 p
rote
in re
lativ
e to
-tu
bulin
1 h 3 h 6 h0
1
2
0.5
1.5
2.5*
*
Siah
2 pr
otei
n re
lativ
e to
-tu
bulin
1 h 3 h 6 h0
1
2
0.5
1.5
2.5*
*
BUninfected
MOI 200MOI 100
3 h 6 hETS2
pro
tein
rela
tive
to
-tubu
lin
3 h 6 h0
1
2
3
0.5
1.5
2.5
3.5
0
1
2
0.5
1.5
2.5
*
*
*
**
*
C
3 h 6 hTwis
t1 p
rote
in re
lativ
e to
-tu
bulin
Uninfected
MOI 200MOI 100
3 h 6 h0
1
2
0.5
1.5
2.5
0
1
2
0.5
1.5
2.5*
***
*
Kato III MKN45AGS0
Twis
t1 p
rote
in re
lativ
e to
-tu
bulin
1
2
3
0.5
1.5
2.5
0
1
2
0.5
1.5
0
1
2
0.5
1.5
2.5* *
*
UninfectedH. pylori
D
MKN45ETS2
pro
tein
rela
tive
to
-tubu
lin
0
1
2
3
0.5
1.5
2.5
Kato III
2
3
0.5
1.5
2.5
1
ETS2
pro
tein
rela
tive
t o
-tubu
lin
2
3
1
ETS2
pro
tein
rela
tive
to
-tubu
lin
0.5
1.5
2.5
* * *
AGS0 0
ETS2
pro
tein
rela
tive
to
-tubu
lin
0
1
2
3
4
Uninfected 8-1 26695 D154
F
0.5
1.5
2.5
3.5
*
*
*
0
1
2
3
Twis
t1 p
rote
in re
lativ
e to
-tu
bulin
Uninfected 8-1 26695 D154
0.5
1.5
2.5
G
*
*
*
Untreated MG132
H
Twis
t1 p
rote
in re
lativ
e to
-tu
bulin
UninfectedH. pylori
0
1
2
3
0.5
1.5
2.5
*
*
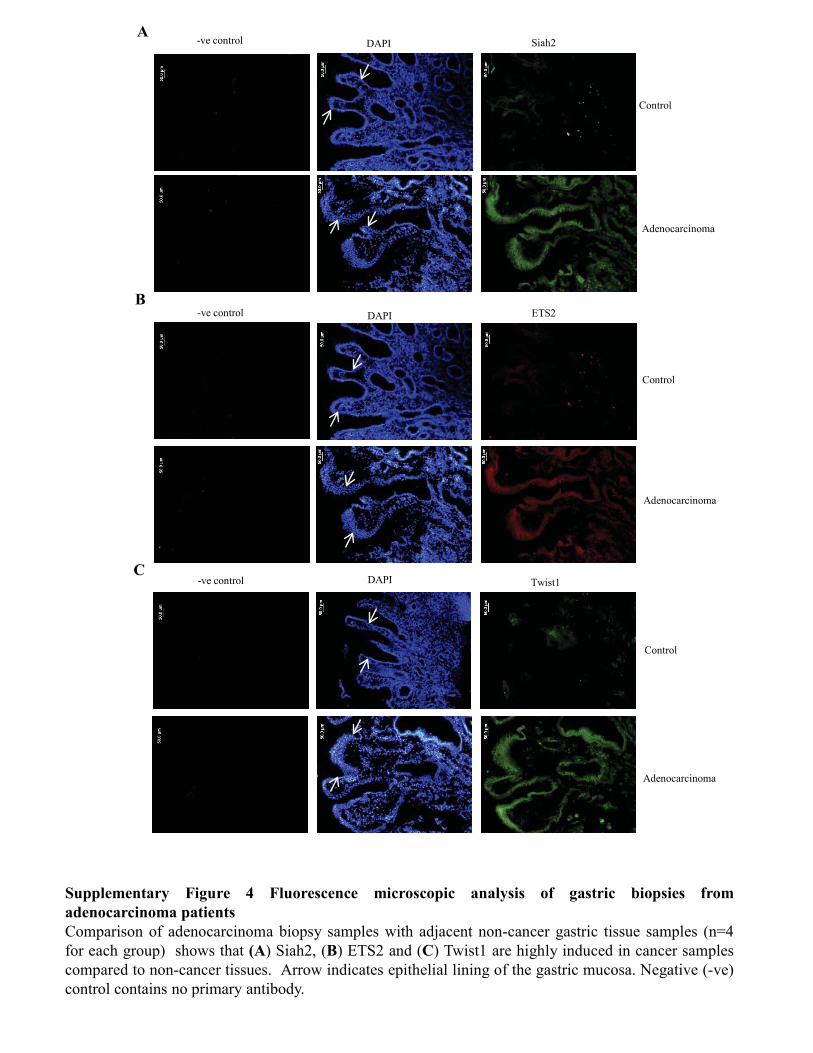
Supplementary Figure 4 Fluorescence microscopic analysis of gastric biopsies fromadenocarcinoma patientsComparison of adenocarcinoma biopsy samples with adjacent non-cancer gastric tissue samples (n=4for each group) shows that (A) Siah2, (B) ETS2 and (C) Twist1 are highly induced in cancer samplescompared to non-cancer tissues. Arrow indicates epithelial lining of the gastric mucosa. Negative (-ve)control contains no primary antibody.
DAPI Twist1
Control
Adenocarcinoma
C-ve control
DAPI ETS2
Control
Adenocarcinoma
B-ve control
DAPI Siah2
Control
Adenocarcinoma
A-ve control
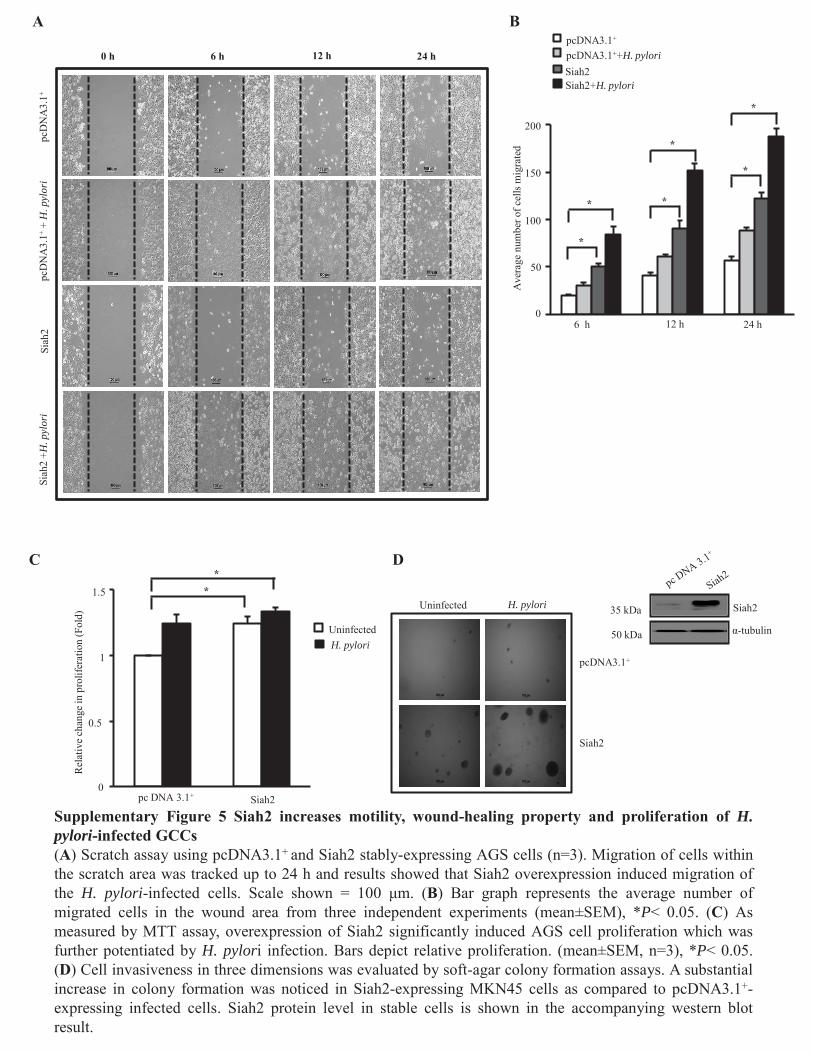
pcDNA3.1+
Siah2
H. pyloriUninfected
D
Siah2
50 kDa
35 kDa
α-tubulin
Supplementary Figure 5 Siah2 increases motility, wound-healing property and proliferation of H.pylori-infected GCCs(A) Scratch assay using pcDNA3.1+ and Siah2 stably-expressing AGS cells (n=3). Migration of cells withinthe scratch area was tracked up to 24 h and results showed that Siah2 overexpression induced migration ofthe H. pylori-infected cells. Scale shown = 100 μm. (B) Bar graph represents the average number ofmigrated cells in the wound area from three independent experiments (mean±SEM), *P< 0.05. (C) Asmeasured by MTT assay, overexpression of Siah2 significantly induced AGS cell proliferation which wasfurther potentiated by H. pylori infection. Bars depict relative proliferation. (mean±SEM, n=3), *P< 0.05.(D) Cell invasiveness in three dimensions was evaluated by soft-agar colony formation assays. A substantialincrease in colony formation was noticed in Siah2-expressing MKN45 cells as compared to pcDNA3.1+-expressing infected cells. Siah2 protein level in stable cells is shown in the accompanying western blotresult.
B
06 h 12 h 24 h
50
100
150
200
Ave
rage
num
ber o
f cel
ls m
igra
ted
pcDNA3.1++H. pyloripcDNA3.1+
Siah2Siah2+H. pylori
*
* *
*
*
*
0
1
0.5
1.5
**
pc DNA 3.1+ Siah2
UninfectedH. pylori
C
Rel
ativ
e ch
ange
in p
rolif
erat
ion
(Fol
d)
Apc
DN
A3.
1+pc
DN
A3.
1++
H.p
ylor
i0 h 6 h 12 h 24 h
Siah
2Si
ah2
+H. p
ylor
i

pcDNA3.1+
pcDNA3.1+
+ H. pylori
ETS2
ETS2 + H. pylori
0 h 6 h 12 h 24 h
pcDNA3.1+
pcDNA3.1+
+ H. pylori
Twist1
Twist1 + H. pylori
0 h 6 h 12 h 24 h
50
6 12 24
100
150
200
250
300
350
400
450
Ave
rage
num
ber o
f cel
ls m
igra
ted
Time (h)
0
**
pcDNA3.1 ++ H. pyloripcDNA3.1+
ETS2ETS2+ H. pylori
**
*
*
*
06 12 24
100
200
300
400
500
600
Time (h)
Ave
rage
num
ber o
f cel
ls m
igra
ted
pcDNA3.1 ++ H. pyloripcDNA3.1+
Twist1Twist1+ H. pylori
*
*
**
*
A
B
Supplementary Figure 6 ETS2 and Twist1 induce wound-healing ability of H. pylori-infected G Cs(A) Scratch assay (n=3) using pcDNA3.1+ and ETS2 stably-expressing AGS cells. Wound healing property or themigration of cells within the scratch area is tracked up to 24 h. Scale shown = 100 . Accompanying bar graphrepresents the average number of migrated cells in the wound from three independent experiments (mean±SEM).*P < 0.05. (B) A representative wound-healing study similar to that shown in Supplementary Fig. 4. is performedusing Twist1-stable cells. Its accompanying bar diagram is also shown (mean±SEM, n=3). *P < 0.05.
*
*
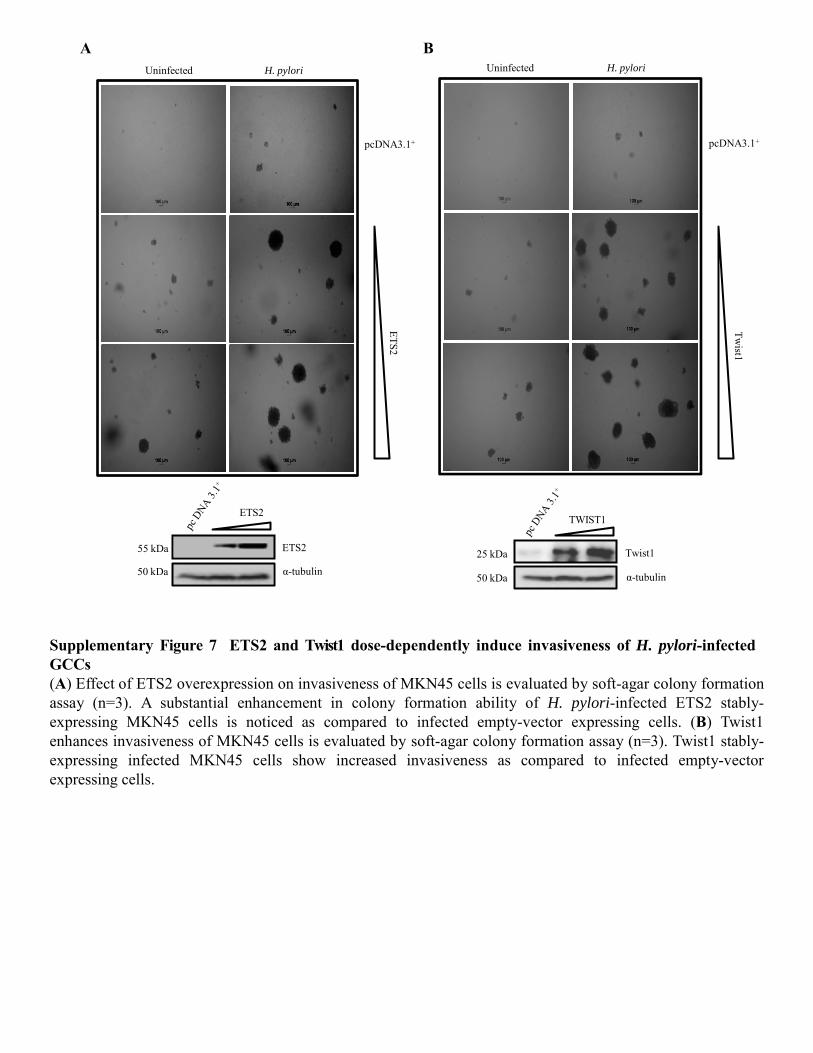
pcDNA3.1+
H. pyloriUninfected
Twist1
50 kDa
25 kDa
-tubulin
TWIST1
pcDNA3.1+
H. pyloriUninfected
ETS255 kDa
-tubulin50 kDa
ETS2
ETS2
Twist1
A B
Supplementary Figure 7 ETS2 and Twist1 dose-dependently induce invasiveness of H. pylori-infectedG Cs(A) Effect of ETS2 overexpression on invasiveness of MKN45 cells is evaluated by soft-agar colony formationassay (n=3). A substantial enhancement in colony formation ability of H. pylori-infected ETS2 stably-expressing MKN45 cells is noticed as compared to infected empty-vector expressing cells. (B) Twist1enhances invasiveness of MKN45 cells is evaluated by soft-agar colony formation assay (n=3). Twist1 stably-expressing infected MKN45 cells show increased invasiveness as compared to infected empty-vectorexpressing cells.
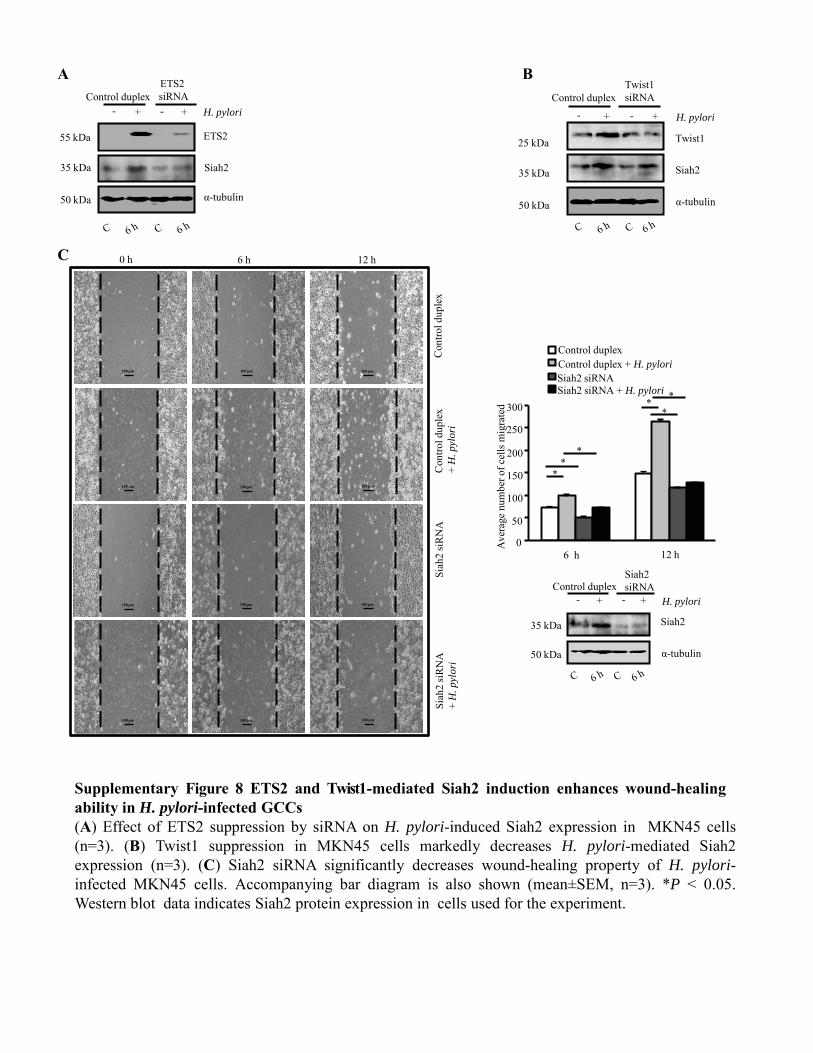
-tubulin
Siah2
ETS2
Control duplex- +-+ H. pylori
50 kDa
35 kDa
55 kDa
ETS2 siRNA
A
-tubulin
Siah2
Twist1
- +-+ H. pylori
50 kDa
35 kDa
25 kDa
Twist1siRNAControl duplex
B
Ave
rage
num
ber o
f cel
ls m
igra
ted
0
50
100
150
200
250
300
6 h 12 h
Control duplex + H. pyloriControl duplex
Siah2 siRNASiah2 siRNA + H. pylori
**
**
*
*
Siah2
- -+ + H. pylori
-tubulin
Siah2siRNAControl duplex
35 kDa
50 kDa
0 h 6 h 12 h
Con
trol d
uple
xC
ontro
l dup
lex
+H
. pyl
ori
Siah
2 si
RN
ASi
ah2
siR
NA
+H
. pyl
ori
C
100 m 100 m 100 m
100 m 100 m 100 m
100 m 100 m 100 m
100 m 100 m 100 m
Supplementary Figure 8 ETS2 and Twist1-mediated Siah2 induction enhances wound-healingability in H. pylori-infected G Cs(A) Effect of ETS2 suppression by siRNA on H. pylori-induced Siah2 expression in MKN45 cells(n=3). (B) Twist1 suppression in MKN45 cells markedly decreases H. pylori-mediated Siah2expression (n=3). (C) Siah2 siRNA significantly decreases wound-healing property of H. pylori-infected MKN45 cells. Accompanying bar diagram is also shown (mean±SEM, n=3). *P < 0.05.Western blot data indicates Siah2 protein expression in cells used for the experiment.


