
i

i
FOREWORD
he primary objective of monetary policy is to promote a low and stable rate of inflation conducive to a balanced and sustainable economic growth. The adoption in January
2002 of the inflation targeting framework for monetary policy was aimed at helping to fulfill this objective.
One of the key features of inflation targeting is greater transparency, which means greater disclosure and communication by the BSP of its policy actions and decisions. This Inflation Report is published by the BSP as part of its transparency mechanisms under inflation targeting. The objectives of this Inflation Report are: (i) to identify the risks to price stability and discuss their implications for monetary policy; and (ii) to document the economic analysis behind the formulation of monetary policy and convey to the public the overall thinking behind the BSP’s decisions on monetary policy. The broad aim is to make monetary policy easier for the public to understand and enable them to better monitor the BSP’s commitment to the inflation target, thereby helping both in anchoring inflation expectations and encouraging informed debate on monetary policy issues.
The government’s target for annual headline inflation under the inflation targeting
framework has been maintained at 4.0 percent ± 1.0 percentage point (ppt) for 2013‐2014. For 2015‐2016, the medium‐term inflation target was set at 3.0 percent ± 1.0 ppt by the Development Budget Coordination Committee (DBCC) to be consistent with the desired disinflation path over the medium term, favorable trends in the structure of inflation, and expected higher capacity of the economy for growth under a low inflation environment.
The report is published on a quarterly basis, presenting a survey of the various factors
affecting inflation. These include recent price and cost developments, inflation expectations, prospects for aggregate demand and output, labor market conditions, monetary and financial market conditions, fiscal developments, and the international environment. A section is devoted to a discussion of monetary policy developments in the most recent, as well as a comprehensive analysis of the BSP’s view of the inflation outlook for the policy horizon.
The Monetary Board approved this Inflation Report at its meeting on 10 April 2014.
AMANDO M. TETANGCO, JR. Governor
28 April 2014
T

ii
List of Acronyms, Abbreviations, and Symbols AE Advanced economyAFF AHFF AMCs
Agriculture, Fishery, and ForestryAgriculture, Hunting, Forestry and Fishing Asset Management Companies
AP Asia PacificAL Auto Loans BAS Bureau of Agricultural StatisticsBES BGC BIR
Business Expectations SurveyBonifacio Global City Bureau of Internal Revenue
BIS Bank for International SettlementsBOC Bureau of Customs BPO Business Process OutsourcingBTr Bureau of the TreasuryCAMPI Chamber of Automotive Manufacturers of the Philippines, Inc. CAR Capital Adequacy RatioCBD Central Business DistrictCCRs Credit Card Receivables CES Consumer Expectations Survey CDS Credit Default SwapsCI Confidence IndexCPI DAA DDA DBCC DOF EIA
Consumer Price Index Deferred Accounting Adjustment Demand Deposit Account Development Budget Coordination Committee Department of Finance Energy Information Administration
EM Emerging Market EMBI ERC
JP Morgan Emerging Market Bond IndexEnergy Regulatory Commission
EU European Union FAO FPI
Food and Agriculture OrganizationFood Price Index
GDP Gross Domestic Product GNI Gross National IncomeGRAM GS
Generation Rate Adjustment MechanismGovernment Securities
ICERA Incremental Currency Exchange Rate AdjustmentIEA International Energy AgencyIMF International Monetary Fund IPP Independent Power ProducerLFS Labor Force SurveyLPG Liquefied Petroleum GasLTFRB Land Transportation Franchising and Regulatory Board

iii
MB Monetary BoardMEM MENA
Multi‐Equation Model Middle East and North Africa
Meralco Manila Electric CompanyMISSI Monthly Integrated Survey of Selected Industries MTP NBQBs
Major Trading PartnerNon‐Bank Financial Institutions with Quasi‐Banking Functions
NCCP National Council for Commuters’ Protection NDA NEDA NEER
Net Domestic AssetsNational Economic and Development Authority Nominal Effective Exchange Rate
NFA Net Foreign Assets; National Food AuthorityNG NGCP
National Government National Grid Corporation of the Philippines
NPC National Power CorporationNPI Net Primary IncomeNPLs Non‐performing loansNSO O&O
National Statistics OfficeOffshoring and Outsourcing
OECD Organization for Economic Cooperation and Development OPEC OF
Organization of the Petroleum Exporting Countries Overseas Filipinos
PBR PCE PMI PSALM
Performance‐Based RatePersonal Consumption Expenditure Purchasing Managers’ Index Power Sector Assets and Liabilities Management Corporation
PSEi Philippine Stock Exchange Composite Index PSIC Philippine Standard Industrial ClassificationRB RDA
Rural BanksReserve Deposit Account
REER Real Effective Exchange RateROP Republic of the PhilippinesRP RR
Repurchase Reserve Requirement
RREL Residential and Real Estate LoansRRP RWA
Reverse Repurchase Risk Weighted Assets
SEM SMS
Single‐Equation ModelShort Message Service
SDA Special Deposit AccountTCS TLP
Transportation, Communications, and StorageTotal Loan Portfolio
U/KBs VAPI VOP
Universal/commercial banks Value of production index Volume of production index
WEO WESM
World Economic Outlook Wholesale Electricity Spot Market

iv
THE MONETARY POLICY OF THE BANGKO SENTRAL NG PILIPINAS
The BSP Mandate The BSP’s main responsibility is to formulate and implement policy in the areas of money, banking and credit, with the primary objective of maintaining stable prices conducive to a balanced and sustainable economic growth in the Philippines. The BSP also aims to promote and preserve monetary stability and the convertibility of the national currency. Monetary Policy Instruments The BSP’s primary monetary policy instrument is its overnight reverse repurchase (RRP) or borrowing rate. Other instruments to implement the desired monetary policy stance to achieve the inflation target include (a) increasing/decreasing the reserve requirement; (b) encouraging/discouraging deposits in the special deposit account (SDA) facility by banks and trust entities of BSP‐supervised financial institutions; (c) adjusting the rediscount rate on loans extended to banking institutions on a short‐term basis against eligible collateral of banks’ borrowers; and (d) outright sales/purchases of the BSP’s holdings of government securities. Policy Target The BSP’s target for monetary policy uses the Consumer Price Index (CPI) or headline inflation rate, which is compiled and released to the public by the National Statistics Office (NSO). The policy target is set by the Development Budget Coordination Committee (DBCC)1 in consultation with the BSP. The inflation target for 2014 was set at 4.0 percent ± 1.0 ppt. For 2015‐2016, the medium‐term inflation target was reduced to 3.0 percent ± 1.0 ppt.2 BSP’s Explanation Clauses These are the predefined set of acceptable circumstances under which an inflation‐targeting central bank may fail to achieve its inflation target. These clauses reflect the fact that there are limits to the effectiveness of monetary policy and that deviations from the inflation target may sometimes occur because of factors beyond the control of the central bank. Under the inflation targeting framework of the BSP, these exemptions include inflation pressures arising from: (a) volatility in the prices of agricultural products; (b) natural calamities or events that affect a major part of the economy; (c) volatility in the prices of oil products; and (d) significant government policy changes that directly affect prices such as changes in the tax structure, incentives, and subsidies.
1 The DBCC, created under Executive Order (E.O.) No. 232 dated 14 May 1970, is an inter‐agency committee tasked primarily to formulate the National Government's fiscal program. It is composed of the Office of the President (OP), Department of Budget and Management (DBM), National Economic and Development Authority (NEDA), and the Department of Finance (DOF). The BSP attends the Committee meetings as a resource agency.
2 The inflation target range for 2015‐2016 was announced on 13 December 2012.

v
The Monetary Board The powers and functions of the BSP, such as the conduct of monetary policy and the supervision over the banking system, are exercised by its Monetary Board, which has seven members appointed by the President of the Philippines. Starting in 2012, the Monetary Board will hold eight (8) monetary policy meetings in a year to review and decide on the stance of monetary policy. Prior to 2012, monetary policy meetings were held every six weeks while prior to July 2006, meetings were held every four weeks during the 2002 – July 2006 period.
Chairman Amando M. Tetangco, Jr. Members Cesar V. Purisima
Alfredo C. Antonio
Ignacio R. Bunye3
Peter B. Favila
Felipe M. Medalla
Armando L. Suratos
The Advisory Committee The Advisory Committee was established as an integral part of the institutional setting for inflation targeting. It is tasked to deliberate, discuss, and make recommendations on monetary policy to the Monetary Board. Like the Monetary Board, the Committee will meet eight times a year (beginning in January 2012) but may also meet between regular meetings, whenever deemed necessary.
Chairman Amando M. Tetangco, Jr.Governor
Members Diwa C. Guinigundo
Deputy Governor Monetary Stability Sector
Nestor A. Espenilla, Jr. Deputy Governor Supervision and Examination Sector
Ma. Cyd N. Tuaño‐Amador
Assistant Governor Monetary Policy Sub‐Sector
Ma. Ramona GDT Santiago Assistant Governor Treasury Department
3 Appointment as Monetary Board member is until 16 February 2014.

vi
2014 SCHEDULE OF MONETARY POLICY MEETINGS, INFLATION REPORT PRESS CONFERENCE AND PUBLICATION OF MB HIGHLIGHTS
Period Advisory
Committee (AC) Meeting
Monetary Board (MB)
Meeting
MB Highlights Publication
Inflation Report (IR) Press Conference
2 0 1 4
Jan 9 (Thursday) 12 Dec 2013 MB meeting
24 (Friday) Fourth Quarter 2013 IR
Feb 3 (Monday) AC Meeting No. 1
6 (Thursday) MB Meeting No. 1
Mar 21 (Friday) AC Meeting No. 2
27 (Thursday) MB Meeting No. 2
6 (Thursday) 6 Feb 2014 MB meeting
Apr 24 (Thursday) 27 Mar 2014 MB meeting
28 (Monday) First Quarter 2014 IR
May 2 (Friday) AC Meeting No. 3
8 (Thursday) MB Meeting No. 3
Jun 13 (Friday) AC Meeting No. 4
19 (Thursday) MB Meeting No. 4
5 (Thursday) 8 May 2014 MB meeting
Jul 28 (Monday) AC Meeting No. 5
31 (Thursday) MB Meeting No. 5
17 (Thursday) 19 Jun 2014 MB meeting
11 (Friday) Second Quarter 2014 IR
Aug 28 (Thursday) 31 Jul 2014 MB meeting
Sep 5 (Friday) AC Meeting No. 6
11 (Thursday) MB Meeting No. 6
Oct 17 (Friday) AC Meeting No. 7
23 (Thursday) MB Meeting No. 7
9 (Thursday) 11 Sep 2014 MB meeting
3 (Friday) Third Quarter 2014 IR
Nov 20 (Thursday) 23 Oct 2014 MB meeting
Dec 5 (Friday) AC Meeting No. 8
11 (Thursday) MB Meeting No. 8
8 Jan 2015 (Thursday) 11 Dec 2014 MB meeting

vii
CONTENTS
Overview 1
I. Inflation and Real Sector Developments 3
Prices 3
Private Sector Economists’ Inflation Forecasts 5
Aggregate Demand and Supply 10
Aggregate Demand 10
Box Article: Decomposing Sources of Economic Growth in the Philippines Other Demand Indicators
12
16 Aggregate Supply 23
Labor Market Conditions 24
II. Monetary and Financial Market Conditions
26
Domestic Liquidity and Credit Conditions 26
Interest Rates 31
Financial Market Conditions
33
Banking System 36
Exchange Rate 39
III. Fiscal Developments IV. External Developments
42 43
V. Monetary Policy Developments
47
VI. Inflation Outlook 48
BSP Inflation Forecasts Risks to the Inflation Outlook
VII. Implications for the Monetary Policy Stance
Summary of Monetary Policy Decisions
48 51 54
56

1
OVERVIEW4
Headline inflation rises on higher food and non‐food inflation. Year‐on‐year (y‐o‐y) headline inflation rate increased to 4.1 percent in Q1 2014 from 3.4 percent in the previous quarter. The resulting year‐to‐date (ytd) inflation rate of 4.1 percent was within the Government’s inflation target range of 4.0 percent ± 1.0 ppt for 2014. The uptick in headline inflation could be attributed to higher food inflation as the prices of most food commodities increased owing to some tightness in the domestic supply conditions. Similarly, higher electricity rates and domestic petroleum prices contributed to increased non‐food inflation. The official core inflation along with two out of three alternative measures of core inflation estimated by the BSP likewise rose in Q1 2014 relative to the rates registered in the previous quarter. The official core inflation was slightly higher at 3.0 percent during the review quarter from 2.9 percent in Q4 2013. The number of items with inflation rates greater than the threshold of 5.0 percent also increased and accounted for a higher proportion of the CPI basket. Domestic demand conditions remain buoyant. The Philippine economy continued to expand at an above‐trend rate in Q4 2013, growing by 6.5 percent to bring the full‐year 2013 GDP growth to 7.2 percent, which is above the Government’s growth target of 6.0–7.0 percent for the year. Output growth was driven by robust household spending, exports, and capital formation (particularly durable equipment) on the expenditure side; and by solid gains in the services sector on the production side. At the same time, higher‐frequency demand indicators continued to show positive readings in the first quarter. Vehicle sales posted strong growth during the quarter, buoyed by brisk consumer demand and attractive financing options offered by industry players. Energy sales also continued to rise, albeit at a slower pace, on account of increased consumption by the industrial and commercial sectors, while capacity utilization in manufacturing is steady above 80 percent. The composite Philippine Purchasing Managers’ Index (PMI) likewise remained firmly above the 50 point‐expansion threshold at 58.2 in February, reflecting increased PMI recorded across all sectors relative to their end‐Q4 2013 levels. Similarly, the outlook of businesses and consumers for the following quarter turned more favorable, supporting the continued strength of aggregate demand in the coming months amid sustained credit growth and ample liquidity in the financial system. The global growth profile is broadly steady. The economic recovery in most advanced economies (AEs) has picked up steadily, while the growth momentum in key emerging economies has moderated over the last few months. In the US, the economy continues to show signs of solidifying growth, supported by strong private consumption and non‐residential investment. The expansion in Japan has also proceeded at a stable pace, aided by accommodative monetary and fiscal policies. At the same time, the ongoing recovery in the euro area has gained traction owing largely to improving domestic demand alongside rising business and consumer confidence. By contrast, a range of indicators point to softening economic momentum in China, while growth conditions in India remain subdued. Going forward, global economic prospects are expected to improve broadly, but the risks to the growth outlook remain tilted to the downside. Increased volatility in financial markets in view of the uncertainty in the pace of the US Federal Reserve’s (US Fed) tapering of its monetary stimulus will be a key source of risks for emerging economies. Meanwhile, global inflation pressures remain broadly subdued. The inflation environment in AEs continues to be benign, as output gaps are expected to stay substantial even with the pickup in activity. However, inflation has risen in some emerging markets (EMs) owing to domestic supply factors.
Local financial markets experience bouts of volatility but regain some stability. Market sentiment during the quarter in review was driven largely by concerns over the extent and duration of US Fed’s
4 The analysis in this report is based on information as of 31 March 2014.

2
tapering of its quantitative easing (QE) measures and potential abrupt adjustments in its policy stance as recovery in the US firms up. Indications of a further economic slowdown in China likewise dampened investor confidence. Nonetheless, markets started to rally by mid‐quarter owing to positive domestic economic reports suggesting sustained resiliency of Philippine macroeconomic fundamentals along with expectations of continued strong corporate earnings. The US Fed pronouncement to scale back stimulus in measured steps further propelled optimism in the local bourse. Philippine sovereign spreads narrowed relative to previous quarter’s average, while the spread on Philippine credit default swaps (CDS) continued to trade lower relative to those of our neighbors in the region. The Philippine Stock Exchange index (PSEi) also began to recover gains lost in the last month of 2013 as the market traded close to the 6,500‐barrier in March. T‐bill auctions during the quarter remained oversubscribed on aggregate, although results reflected investors’ preference for shorter‐dated T‐bills. However, the peso recorded moderate depreciation relative to previous quarter on lingering uncertainty on the external front.
Inflation expectations continue to support the within‐target inflation outlook. Results of the BSP’s survey of private sector economists for March 2014 yielded higher but still broadly within‐target inflation forecasts for 2014‐2015. Analysts expect inflation to rise going forward due largely to factors such as pending electricity rate adjustments, weakening peso, and possible increases in food and oil prices. Results of the March 2014 Consensus Economics inflation forecast survey for the country also showed a higher mean inflation projection for 2014. The BSP maintains key policy rates but adjusts the reserve requirement ratio. The BSP decided to keep its policy interest rates steady during its 3 February and 27 March 2014 monetary policy meetings on the assessment that the future inflation path was likely to stay within the target ranges of 4.0 percent ± 1.0 ppt for 2014 and 3.0 percent ± 1.0 ppt for 2015. At the same time, the MB decided to increase the reserve requirement by one ppt effective on 11 April 2014 to help guard against potential risks to financial stability that could arise from the recent rapid growth in domestic liquidity. Prevailing monetary conditions and inflation dynamics suggest that the space to keep monetary policy settings unchanged is narrowing. Latest baseline projections continue to show average headline inflation settling within the target ranges for 2014 and 2015. However, current assessment of the price environment over the policy horizon indicates that the balance of risks to the inflation outlook remains tilted to the upside, with potential price pressures emanating from pending petitions for adjustments in utility rates and from possible increases in food and oil prices. At the same time, while inflation expectations are still within target, they have trended higher and are moving near the upper end of the target range for 2015. Firm growth dynamics arising from the broad buoyancy of domestic demand also suggest that the economy can accommodate measured adjustments in monetary conditions. Domestic liquidity growth has also remained strong after the full unwinding of the non‐trust account placements in the SDA facility in November with more loanable funds deployed to support domestic economic activity as evident by the robust growth in bank lending. The continued strong liquidity expansion, if sustained, could potentially exert inflationary pressures and contribute to the build‐up of financial stability risks. On the whole, the BSP continues to have monetary policy space to address the challenges that could threaten the inflation objective and stability of the Philippine financial system. Going forward, the BSP will remain guided by its primary objective of maintaining price stability along with safeguarding the resilience of the financial system, and stands ready to deploy appropriate measures as needed to ensure sustainable, non‐inflationary, and inclusive economic growth.

3
I. INFLATION AND REAL SECTOR DEVELOPMENTS
Prices Inflation rises on higher food and non‐food inflation.
0
1
2
3
4
5
6
7
8
2009 2010 2011 2012 2013 2014
in percent
Quarterly Headline Inflation (2006=100)
Food Non‐FoodNon‐Alcoholic Beverage Alcoholic Beverage and TobaccoHeadline
Q1 20144.1 pct
Core inflation also increases.
Alternative Core Inflation MeasuresQuarterly averages of year‐on‐year change
QuarterOfficial Headline Inflation
Official Core
Inflation
Trimmed
Mean 1/
Weighted
Median 2/
Net of Volatile
Items 3/ *2011
Q1
Q2
Q3
Q4
2012
Q1
Q2
Q3
Q4
2013
Q1
Q2
Q3
Q4
2014
Q1
4.6
4.5
5.0
4.8
4.7
3.2
3.1
2.9
3.6
3.0
3.0
3.2
2.7
2.4
3.4
4.1
4.3
4.0
4.3
4.4
4.5
3.7
3.5
3.7
4.1
3.4
2.9
3.8
3.0
2.1
2.9
3.0
3.8
3.3
4.0
4.0
3.8
3.2
3.0
3.1
3.4
3.2
2.5
3.0
2.3
2.1
2.6
3.3
3.1
2.9
3.1
3.2
3.1
3.0
2.6
3.2
3.2
3.0
2.3
2.8
2.3
2.0
2.2
2.6
3.6
3.7
3.7
3.5
3.6
3.4
3.0
3.3
3.9
3.4
3.1
3.9
3.2
2.4
2.9
2.81/ The trimmed mean represents the average inflation rate of the (weighted) middle 70 percent in a lowest
to‐highest ranking of year‐on‐year inflation rates for all CPI components.
2/ The weighted median represents the middle inflation rate (corresponding to a cumulative CPI weight of 50 percent) in a lowest‐to‐highest ranking of year‐on‐year inflation rates.
3/ The net of volatile items method excludes the following items: educational services, fruits and vegetables, personal services, rentals, recreational services, rice, and corn.
r/ Revised.
* The series has been recomputed using a new methodology that is aligned with NSO’s method of computing the official core inflation, which re‐weights remaining items to comprise 100 percent of the core basket after excluding non‐core items. The previous methodology retained the weights of volatile items in the CPI basket while keeping their indices constant at 100.0 from month to month.
Source: NSO, BSP estimates
0
20
40
60
80
100
120
0
10
20
30
40
50
60
70
Q12009
Q2 Q3 Q4 Q12010
Q2 Q3 Q4 Q12011
Q2 Q3 Q4 Q12012
Q2 Q3 Q4 Q12013
Q2 Q3 Q4 Q12014
CPI Items with Inflation Rates Above Threshold
Cumulative Weight (in %) No. of Items Above 5% Threshold (RHS)
27.2 pct
32 items
Headline and Core Inflation Headline inflation increased further to 4.1 percent in Q1 2014 from the quarter‐ago and year‐ago rates of 3.4 percent and 3.2 percent, respectively. The resulting ytd inflation rate of 4.1 percent was within the Government’s inflation target range of 4.0 percent ± 1.0 ppt for 2014. The continued uptick in headline inflation was due to higher food and non‐food inflation. Food inflation increased to 5.9 percent in Q1 2014 owing to some tightness in the domestic supply conditions, while the rise in non‐food inflation to 2.6 percent could be attributed to higher electricity rates and domestic petroleum prices. Core inflation, which excludes some food and energy items to measure underlying price pressures, rose slightly to 3.0 percent in Q1 2014 from 2.9 percent in Q4 2013. Two out of three alternative measures of core inflation estimated by the BSP were also higher in Q1 2014 relative to the rates registered in the previous quarter. In particular, the trimmed mean and weighted median measures went up to 3.3 percent and 2.6 percent, respectively, from the previous quarter’s 2.6 percent and 2.2 percent. By contrast, the net of volatile items measure declined slightly to 2.8 percent from 2.9 percent in Q4 2013.
Similarly, the number of items with inflation rates greater than the threshold of 5.0 percent (the upper end of the 2014 inflation target) increased further to 32 from 27 items in the previous quarter. These items accounted for a higher proportion of the CPI basket at 27.2 percent compared to the quarter‐ago share of 15.0 percent. Grouping the CPI basket into food and non‐food components, the number of food items above the 5.0 percent‐threshold went up to 13 from 11 items in the previous quarter. Similarly, the number of non‐food items with inflation rates higher than the threshold increased to 19 from 16 items in Q4 2013.
4
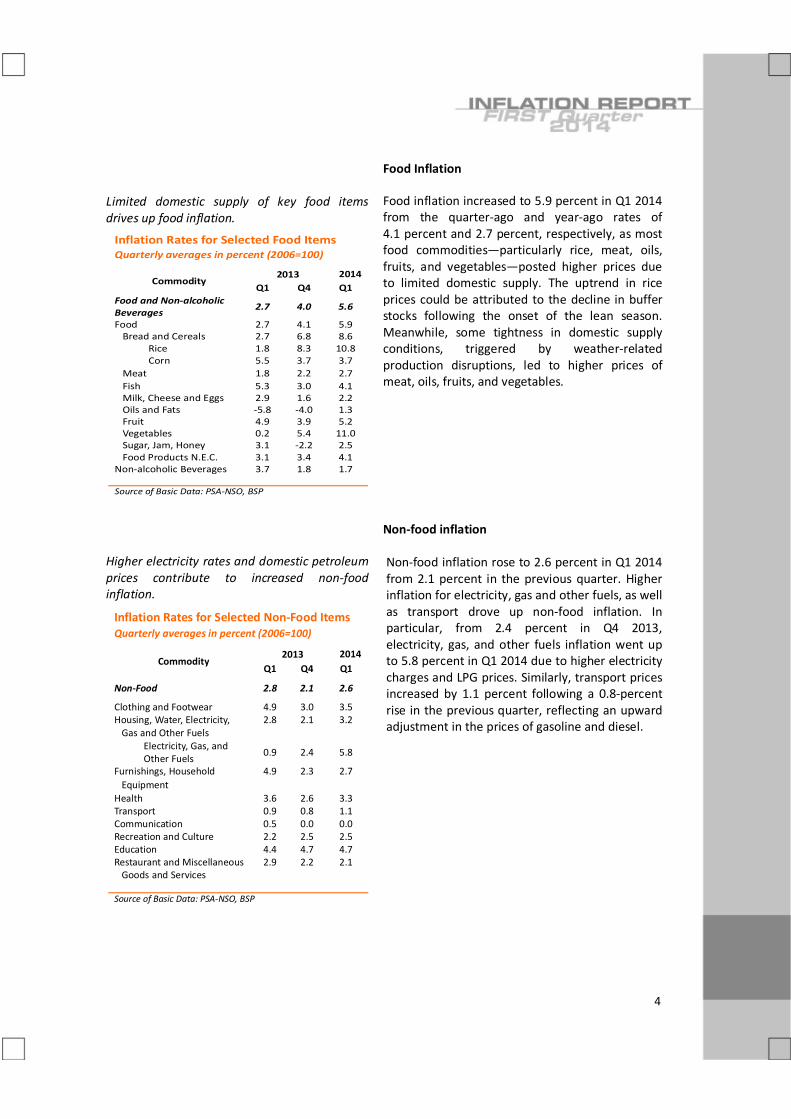
Limited domestic supply of key food items drives up food inflation.
Inflation Rates for Selected Food ItemsQuarterly averages in percent (2006=100)
Commodity2013 2014
Q1 Q4 Q1Food and Non‐alcoholic Beverages
2.7 4.0 5.6
Food 2.7 4.1 5.9Bread and Cereals 2.7 6.8 8.6
Rice 1.8 8.3 10.8Corn 5.5 3.7 3.7
Meat 1.8 2.2 2.7Fish 5.3 3.0 4.1Milk, Cheese and Eggs 2.9 1.6 2.2Oils and Fats ‐5.8 ‐4.0 1.3Fruit 4.9 3.9 5.2Vegetables 0.2 5.4 11.0Sugar, Jam, Honey 3.1 ‐2.2 2.5Food Products N.E.C. 3.1 3.4 4.1
Non‐alcoholic Beverages 3.7 1.8 1.7
Source of Basic Data: PSA‐NSO, BSP
Higher electricity rates and domestic petroleum prices contribute to increased non‐food inflation.
Inflation Rates for Selected Non‐Food ItemsQuarterly averages in percent (2006=100)
Commodity2013 2014
Q1 Q4 Q1
Non‐Food 2.8 2.1 2.6
Clothing and Footwear 4.9 3.0 3.5Housing, Water, Electricity, 2.8 2.1 3.2Gas and Other Fuels
Electricity, Gas, and Other Fuels
0.9 2.4 5.8
Furnishings, Household 4.9 2.3 2.7Equipment
Health 3.6 2.6 3.3Transport 0.9 0.8 1.1Communication 0.5 0.0 0.0Recreation and Culture 2.2 2.5 2.5Education 4.4 4.7 4.7Restaurant and Miscellaneous 2.9 2.2 2.1Goods and Services
Source of Basic Data: PSA‐NSO, BSP
Food Inflation Food inflation increased to 5.9 percent in Q1 2014 from the quarter‐ago and year‐ago rates of 4.1 percent and 2.7 percent, respectively, as most food commodities—particularly rice, meat, oils, fruits, and vegetables—posted higher prices due to limited domestic supply. The uptrend in rice prices could be attributed to the decline in buffer stocks following the onset of the lean season. Meanwhile, some tightness in domestic supply conditions, triggered by weather‐related production disruptions, led to higher prices of meat, oils, fruits, and vegetables. Non‐food inflation Non‐food inflation rose to 2.6 percent in Q1 2014 from 2.1 percent in the previous quarter. Higher inflation for electricity, gas and other fuels, as well as transport drove up non‐food inflation. In particular, from 2.4 percent in Q4 2013, electricity, gas, and other fuels inflation went up to 5.8 percent in Q1 2014 due to higher electricity charges and LPG prices. Similarly, transport prices increased by 1.1 percent following a 0.8‐percent rise in the previous quarter, reflecting an upward adjustment in the prices of gasoline and diesel.

5
Private Sector Economists’ Inflation Forecasts Mean inflation forecasts for 2014 to 2015 are higher.
2.0
2.5
3.0
3.5
4.0
4.5
5.0
5.5
Jan Feb Mar Apr May Jun Jul Aug Sep Oct Nov Dec Jan Feb Mar
2013 2014
2014 20152016 target range
BSP Private Sector Economists' Survey Mean forecast for full year, in percent
2014: 4.1
2015/2016: 3.8
2015 2016Q2 Q3 FY FY FY
1) Al‐Amanah Islamic Bank 3.80 3.60 3.50 3.50 3.502) Asia ING 4.30 4.50 4.40 3.90 ‐3) Banco De Oro 4.00 3.75 3.50 3.50 3.504) Bangkok Bank 4.20 4.10 4.20 3.75 3.755) Bank of China 3.90 3.80 4.10 4.30 4.606) Bank of Commerce 4.10 4.10 4.10 ‐ ‐7) Bank of the Philippine Islands 4.10 3.50 3.90 4.30 4.108) Chinabank 4.20 4.30 4.30 3.30 3.109) CTBC Bank 4.10 4.00 4.20 3.75 3.7510) Deutsche Bank ‐ ‐ 4.30 3.80 ‐11) Eastwest Bank 4.30 4.30 4.35 4.45 4.5012) Global Source 5.00 5.00 4.80 4.00 ‐13) HSBC 4.09 4.50 4.20 4.30 ‐14) JP Morgan 4.20 4.10 4.10 3.70 ‐15) Korea Exchange Bank 2.90 2.90 2.80 2.90 2.9016) Land Bank of the Phils 3.1‐3.4 3.3‐3.6 3.5‐3.8 3.6‐3.9 3.6‐3.917) Maybank 3.90 3.70 3.80 3.20 3.3018) Maybank‐ATR KimEng 3.90 3.60 3.70 3.50 ‐19) Metrobank ‐ ‐ 4.00 4.00 4.0020) Multinat'l Inv. Banc 4.00 3.80 3.80 3.60 ‐21) Mizuho 4.10 4.00 4.10 4.00 4.0022) Nomura 4.50 4.90 4.70 4.20 ‐23) Philippine Equity Partners 4.40 4.40 4.50 4.10 ‐24) RCBC 4.4‐4.6 4.4‐4.7 4.3‐4.5 3.5‐4.0 4.0‐4.525) Robinsons Bank 4.0‐4.25 4.0‐4.25 4.0‐4.5 3.5‐4.0 3.5‐4.026) Security Bank 4.00 3.50 4.30 4.50 3.8027) Standard Chartered Bank 4.20 4.30 3.90 3.50 3.5028) Union Bank 3.80 3.60 4.20 4.20 4.00
Median Forecast 4.1 4.1 4.2 3.8 3.8Mean Forecast 4.1 4.0 4.1 3.8 3.8High 5.0 5.0 4.8 4.5 4.6Low 2.9 2.9 2.8 2.9 2.9Number of observations 26 26 28 27 18
Government Target
Private Sector Forecasts for Inflation, March 2014Annual Percent Change
2014
4.0±1.0 3.0±1.0
0.0
10.0
20.0
30.0
40.0
50.0
60.0
70.0
80.0
90.0
1.0‐2.0 2.1‐3.0 3.1‐4.0 4.1‐5.0 5.1‐6.0 6.1‐7.0
Probability Distribution For Analysts' Inflation Forecasts*2014‐2016
2014 2015 2016
*Probability distributions were averages of those provided by 23 out of 28 respondents.
(Source: BSP Survey)
Results of the BSP’s survey of private sector economists for March 2014 yielded higher mean inflation forecasts for 2014 and 2015 relative to the results in December 2013.5 In particular, the mean inflation forecasts for 2014 and 2015 were higher at 4.1 percent (from 3.9 percent) and 3.8 percent (from 3.6 percent), respectively. Meanwhile, the inflation forecast for 2016 was at 3.8 percent. Analysts expect inflation to rise going forward due largely to pending electricity rate adjustments, weakening peso, and possible increases in food and oil prices. Based on the probability distributions of the forecasts provided by the respondents, a 34.7‐percent chance is ascribed to average inflation for 2014 settling within the 3.1‐4.0 percent range. Meanwhile, there is a 51.7 percent chance that average inflation for 2014 could be within 4.1‐5.0 percent. Similarly, results of the March 2014 Consensus Economics inflation forecast survey for the country showed a higher mean inflation projection for 2014 of 4.2 percent (from 3.9 percent in December 2013).6 Respondents expect inflation to average at 3.9 percent in 2015.
5 There were 28 respondents in the BSP’s survey of private sector economists in March 2014. 6 There were 20 respondents in the Consensus Economics’ survey in March 2014.

6
Results of the Q1 2014 BES indicate more respondents anticipating inflation to increase over the current and following quarter.
Results of the Q1 2014 CES show that consumers expect higher inflation over the next 12 months.
Results of the Business Expectations Survey (BES) for Q1 2014 indicated that respondents who expected inflation to go up in the current and next quarters continued to outnumber those that held the opposite view. Relative to the previous survey, a higher number of respondents expect inflation to move up in the current quarter (from a diffusion index of 25.0 percent to 43.0 percent). Similarly, the number of respondents that expects inflation to increase in the next quarter (from 18.0 percent to 32.0 percent) increased. Meanwhile, consumers project inflation to increase over the next 12 months on the view that the peso would continue to depreciate against the US dollar. In particular, respondents anticipate inflation to edge higher to 8.4 percent in Q1 2014 from 7.0 percent in Q4 2013.
International oil prices ease on rising US crude oil stockpiles.
20
40
60
80
100
120
140
2008 2009 2010 2011 2012 2013 2014 2015
Price in US do
llars per barrel
Spot and Estimated Future Prices of Dubai Crude Oil*
*Futures prices derived using Brent crude futures data.
31 December 2013
31 March 2013
0
Forecasts for 2014 global oil demand are mixed.
Energy Prices The average price of Dubai crude oil declined by 2.2 percent quarter‐on‐quarter (q‐o‐q) in Q1 2014 given rising crude oil supply in the US. According to the US Energy Information Administration, US crude oil output increased by 33,000 barrels a day (or 4.0 percent) to 8.2 million barrels in the week ending 14 March, the highest level since May 1988. The increase in oil production was supported by a combination of horizontal drilling and hydraulic fracturing, or fracking, which unlocked supplies in shale formations in the US. Oil prices also declined on a slightly weaker outlook for oil demand amid signs of slowing Chinese economic growth.7 At the same time, the estimated futures prices of Dubai crude oil, which are based on movements in Brent crude oil futures, in Q1 2014 showed a lower path for 2014‐2015 compared to the estimates in Q4 2013. In March 2014, the US Energy Information Administration (EIA)8 projected global demand for 2014 to increase by 1.2 million barrels a day (mmbd), the same in the previous quarter’s
7 According to China’s National Bureau of Statistics, industrial production during the period January to February 2014 dropped by 1 percent compared to the same period in 2013 to 78.78 million metric tons. 8 EIA, March 2014 Short‐Term Energy Outlook, www.eia.doe.gov

7
Domestic prices of petroleum products decrease.
Domestic Retail Pump Prices (peso/liter)*End‐quarter prices
Quarter Gasoline** Kerosene Diesel LPG
2013
Q1
Q2
Q3
Q4
2014
Q1
51.45
51.95
53.20
55.50
53.65
48.45
50.07
51.12
53.07
50.85
39.85
42.30
42.90
45.45
44.45
40.21
36.83
41.25
49.80
41.56
Q‐o‐Q (1.85) (2.22) (1.00) (8.24)
Y‐o‐Y 2.20 2.40 4.60 1.35
* Average retail pump price for the Big Three oil companies—Caltex, Petron, and Shell, Metro Manila prices only.
** Average price for unleaded gasoline
Source: Department of Energy (DOE)
Power rates decrease due to lower generation charges from WESM and IPPs.
estimate. The Organization of the Petroleum Exporting Countries (OPEC)9 projected global demand for 2014 to increase by 1.1 mmbd, higher compared to the previous quarter’s estimate of 1.0 mmbd. Meanwhile, the IEA10 expected 2014 oil demand to increase by 1.1 mmbd in March 2014, from 1.2 mmbd in December 2013. The bulk of the projected increase in world oil consumption over the next two years is still expected to come from non‐Organization for Economic Cooperation and Development (OECD) regions, particularly China. In Q1 2014, the domestic prices of gasoline, kerosene, diesel, and LPG fell by P1.85 per liter, P2.22 per liter, P1.00 per liter, and P8.24 per liter, respectively, relative to their end‐Q4 2013 levels. Meanwhile, compared to year‐ago levels, the domestic prices of gasoline, kerosene, diesel, and LPG prices went up by P2.20 per liter, P2.40 per liter, P4.60 per liter, and P1.35 per liter, respectively. Power Generation charges in the National Capital Region (NCR) declined in Q1 2014 due to the downward adjustments in power rates contracted by Meralco under its Power Supply Agreements (PSAs) along with lower cost of electricity purchased from individual power producers (IPPs) and the Wholesale Electricity Spot Market (WESM). Power rates at the WESM decreased due
9 OPEC, March 2014Monthly Oil Market Report, www.opec.org 10 IEA, March 2014 Oil Market Report, www.iea.org

8
to moderate demand and the resumption to normal operations of the Malampaya11 natural gas plant as well as other major power plants. Transmission charges and other bill components likewise edged lower during the review quarter. Meralco’s planned rate increase for the December 2013 billing owing to high WESM prices was suspended under the Supreme Court’s (SC) 60‐day temporary restraining order (TRO) issued on 23 December 2013. The TRO was subsequently extended from 23 February to 22 April 2014. However, the Energy Regulatory Commission (ERC) issued an order on 3 March 2014 declaring as void the WESM prices for Luzon during the period 26 October‐25 December 2013 as WESM prices in the supply months of November and December 2013 did not qualify as reasonable, rational, and competitive given the confluence of factors accompanying the tight supply situation in the power market. ERC also ordered Philippine Electric Market Corporation (PEMC) to recalculate the WESM prices during the said supply months. Following the said developments, Meralco’s planned rate adjustments for December 2013 and January 2014 will be lower than their earlier requests. Nonetheless, potential sources of upside pressures on electricity charges remain. Existing petitions for rate increases with the ERC include the following: (1) Meralco’s petitions for the refund of generation over‐/under‐recoveries; (2) Power Sector Assets and Liabilities Management’s (PSALM) petition for True‐Up Adjustments of Fuel and Purchased Power Costs (TAFPPC), Foreign Exchange Related Costs (TAFxA) under the Rules for the Automatic Recovery of Monthly Fuel and Purchased Power Costs and Foreign Exchange Related Costs by the National Power Corporation (NPC), and NPC’s Stranded Debt portion of the UC for CY 2011 and 2012; and (3) the National Grid Corporation of the Philippines’ (NGCP) petitions to recover
11 The Malampaya Deep Water Gas‐to‐Power Project is a joint undertaking of the National Government and the private sector, spearheaded by the Department of Energy, developed and operated by Shell Philippines Exploration B.V. (SPEX) on behalf of the joint venture partners Chevron Malampaya LLC and the PNOC Exploration Corporation. The Malampaya project harnesses natural gas (as an alternative for imported fuel) from the deepwater reservoir northwest of Palawan, which provides 2,700 megawatts of electricity for the country’s domestic and industrial power requirements. Malampaya supplies up to 40 percent of natural gas requirement of the three power plants in Luzon. The plant held its maintenance shutdown from 11 November to 10 December 2013.

9
MWSI rate increases while MWCI rate is unchanged.
connection charges and residual sub‐transmission charges (CC/RSTC) for 2011, 2012, and 2013 and the costs of repair on damages caused by force majeure events such as earthquake, flooding, landslides, and lightning incidents that struck the country in 2011‐2012. Water In Q1 2014, the Metropolitan Waterworks and Sewerage System‐Regulatory Office (MWSS‐RO) reported that the all‐in‐water rate charged by Maynilad Water Services, Inc. (MWSI) increased in February 2014 due to the removal of the refund12 from the foreign currency differential adjustment (FCDA)13 component of the water bill. Meanwhile, the Manila Water Company, Inc. (MWCI) all‐in‐water tariff was maintained.14
12 With MWSI’ partial prepayment of its foreign‐currency denominated loan, MWSI incurred savings in interest which was refunded to its customers by reducing the FCDA component of the water tariff from July 2013 to January 2014. 13 The FCDA is a pass‐through mechanism that accounts for foreign exchange gains or losses arising from the payment of foreign‐denominated concession fees and loans to service expansion and improvement. 14 On 12 September 2013, MWSS‐RO approved the downward adjustments in average basic rates of MWCI at P24.57 and MWSI at P30.28 based on the 2012 average basic rates instead of the two concessionaires’ requests for rate increases covered by their Concession Agreements with the Government. Pending the resolution of the dispute notices filed by the two concessionaires with the International Chamber of Commerce questioning MWSS‐RO’s decision, the basic rates of MWCI and MWSI were maintained at P28.29 per cubic meter and P33.97 per cubic meter, respectively.

10
Aggregate Demand and Supply The Philippine economy continues to expand at an above‐trend rate.
Q4 20137.8 pct
Q4 20136.5 pct
0
2
4
6
8
10
12
Q12009
Q2 Q3 Q4 Q12010
Q2 Q3 Q4 Q12011
Q2 Q3 Q4 Q12012
Q2 Q3 Q4 Q12013
Q2 Q3 Q4
year‐on‐year growth in
percent
GDP and GNI (At Constant Prices)
GDP GNI
Strong household spending, exports, and capital formation (particularly durable equipment) drive output growth.
5.6 pct
5.7 pct
-5.2 pct
‐40
‐30
‐20
‐10
0
10
20
30
40
50
Q12009
Q2 Q3 Q4 Q12010
Q2 Q3 Q4 Q12011
Q2 Q3 Q4 Q12012
Q2 Q3 Q4 Q12013
Q2 Q3 Q4
year‐on‐year growth in
percent in
real terms
GDP‐Expenditure (At Constant Prices)
HH Consumption Govt Spending Capital Formation5.6 pct ‐5.2 pct 5.7 pct
The country’s real gross domestic product (GDP) expanded by 6.5 percent in Q4 2013, bringing the full‐year 2013 GDP growth to 7.2 percent, above the Government’s growth target of 6.0–7.0 percent for the year. On the expenditure side, the expansion was led by household consumption and exports, which contributed 4.2 ppts and 2.4 ppts, respectively, to the output increase. Meanwhile, on the production side, output growth was led by services, contributing 3.6 ppts to real GDP growth. Similarly, gross national income (GNI) increased by 7.8 percent in Q4 2013 on account of higher net primary income (NPI). The NPI accelerated by 15.1 percent, owing to the continued strong inflows of overseas Filipinos’ remittances during the quarter. Full‐year 2013, GNI increased by 7.5 percent. On a seasonally‐adjusted basis, q‐o‐q GDP growth rose by 1.5 percent in Q4 2013 from 1.3 percent (revised) in Q3 2013. Aggregate Demand Household consumption, which accounts for 73.5 percent of the country’s output on the expenditure side, continued to expand at a robust pace of 5.6 percent in Q4 2013, albeit lower relative to its quarter‐ and year‐ago rates of 6.2 percent. The slowdown in household expenditure could be attributed to higher consumer prices, particularly food prices, due largely to tight domestic supply conditions (triggered by weather‐related production disruptions) and holiday season demand. After posting positive growth since Q2 2011, government consumption declined by 5.2 percent in Q4 2013 due to lower disbursements in personnel services and maintenance and other operating expenses.

11
Economic PerformanceAt constant 2000 prices
Growth rate (in percent)
Sector 2012 2013Q4 Q3 Q4
By expenditure itemHousehold consumption 6.2 6.2 5.6Government consumption 9.5 4.6 ‐5.2Capital formation 9.5 15.6 5.7Fixed capital formation 19.7 11.9 7.0
Exports 8.6 12.8 6.4Imports 8.0 16.4 1.9
Source: NSCB
Capital formation posted a slower growth of 5.7 percent in Q4 2013 compared to its quarter‐ and year‐ago rate of 15.6 percent and 9.5 percent, respectively. Investments in construction declined by 0.5 percent after posting favorable growth in the last six quarters. Investments in breeding stock and orchard development continued to fall (‐3.8 percent) for the third consecutive quarter. Meanwhile, changes in inventories posted lower accumulations compared to the previous year, pulling down GDP growth by 0.2 ppt.15 By contrast, higher investments in durable equipment (15.5 percent), buoyed by increased investments in air transport equipment (225.7 percent) and miscellaneous equipment (92.2 percent), helped boost the overall capital formation.
External trade expanded modestly in Q4 2013. Total exports went up by 6.4 percent, lower than the previous quarter’s 13.7 percent increase. Growth in goods exports (6.2 percent) slowed down on account of lower non‐principal exports (‐8.3 percent), while growth in exports of services (7.0 percent) was weakened by the slight contraction in travel (‐0.6 percent). Similarly, total imports recorded a 1.9 percent increase in Q4 2013, lower than the quarter‐ago rate of 16.4 percent. In particular, the weaker growth in goods imports (1.1 percent) reflected the drop in electronic imports (‐39.1 percent), while the decline in miscellaneous import services (‐5.5 percent) held up the expansion in imports of services (4.6 percent).
15 In end‐Q4 2013, total inventories amounted to P22.5 billion compared to P25.9 billion in the previous year.

12
BOX ARTICLE: DECOMPOSING SOURCES OF ECONOMIC GROWTH IN THE PHILIPPINES
The literature on Philippine productivity generally points to significant gains in productivity since the early 2000s. However, prior to this period, productivity growth was tepid, in sharp contrast to the experiences of other economies. For the period 1980‐1990, the Asian countries that posted the highest total factor productivity (TFP) growth rates were experienced by the countries with the highest GDP growth rates, i.e., China, Korea, Taiwan, and Thailand (Kawai, 1994). The initial phase of the much‐heralded East Asian economic growth miracle was characterized by capital accumulation, with total factor productivity growth gaining prominence in the subsequent periods (APO, 2011). During the same period, the Philippines posted negative TFP growth rate, contributing to the relatively slower GDP growth rate (Austria, 1998; Cororaton, 2002). There are a number of empirical findings on why the Philippines failed to ride the wave of economic growth that swept across Asia. Among the reasons cited are protectionist policies, policy inconsistency, macroeconomic instability, and institutional weaknesses in the educational, judicial, and property rights system (Austria, 1998; Balisacan and Hill, 2003; Sicat, 2004; and Alba, 2007). Notwithstanding this prognosis, Cororaton (2002) sees productivity gains stemming from the movement of labor out of agriculture into industry and services. Moreover, key structural reform measures were pursued since the early 1990s. These measures pertain to wide‐ranging areas such as the liberalization of the trade regime and foreign exchange regulations, privatization of key government owned corporations and enhancing competition in the banking system, telecommunications and power industries. With these reforms, there have been productivity gains along with GDP growth stabilization and inflation deceleration. Consistent with this, recent BSP staff estimates indicate an improvement in TFP in recent years. Methodology The approach used in estimating TFP is the standard growth accounting method applied on the Cobb‐Douglas aggregate production function.16 Economic growth was decomposed into those arising from the accumulation of labor and capital, with the remainder attributed to contribution from factor productivity growth. The income share of labor was computed based on the National Accounts of the Philippines’ nominal GDP by factor shares. The share of capital was then residually estimated. The estimates presented in this article update and modify those used by Cororaton (2002), which is the most recent study that focuses on the Philippines. Other studies are cross‐country in coverage that assume uniform shares of capital and labor in production across countries (e.g., Park, 2010); or use TFP estimates that are derived from different assumptions and data transformations (e.g., Llanto, 2012). Since there is no official capital stock series, the data on capital were estimated by applying the perpetual inventory method on 2000‐based real gross fixed capital formation (GFCF), with an assumed capital life span of 20 years (i.e., 5 percent depreciation rate).17 Total labor input, on the
16 The Cobb‐Douglas production function takes the form,
where: = GDP = total factor productivity = capital stock = total employment
α = share of capital in production 1-α = share of labor in production
17 Cororaton (2002) used the 1985‐based real gross capital formation (investment) data starting 1946. He assumed 5 percent rate of depreciation. He also estimated three types of capital: machinery, structure, and others. For machinery, investment in durable

13
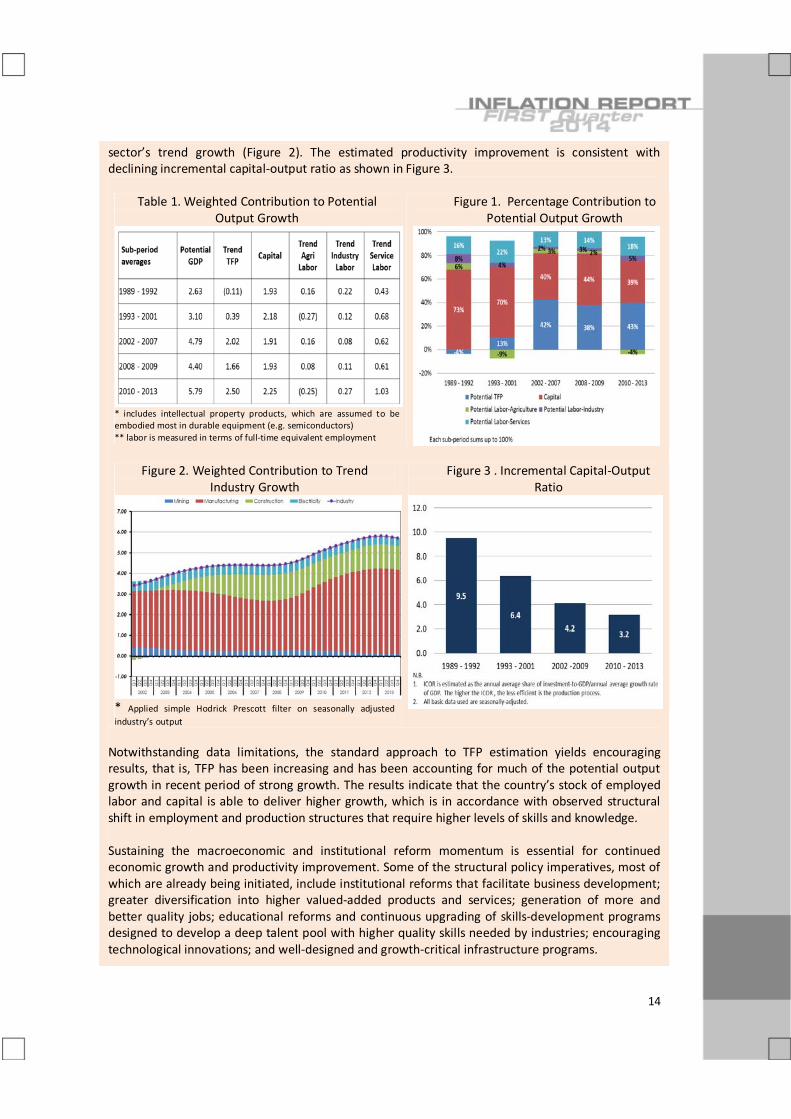
other hand, has been normalized into full‐time equivalent employment but no adjustment for quality has been made.18 Given that GDP growth rate, capital growth rate, employment growth rate, and the factor shares can be calculated from the data, the total factor productivity growth, unadjusted for cyclical component, has been derived residually.19 To remove the component of TFP that moves with the business cycle, HP filter is applied on unadjusted TFP to get a measure of trend TFP.20 Potential labor supply is derived as the sum of trend sectoral employment and trend hours worked. The capital stock series, being an indicator of overall capacity, is treated as the trend stock. Potential output growth is then derived as the weighted sum of trend growth rates of productivity, potential labor supply, and capital stock.21 Results In analyzing how TFP evolves over time, three sub‐periods, 1989 – 1992; 1993 – 2001 and 2002 – 2013 are examined. The 2002‐2013 period is further sub‐divided into pre‐global financial crisis (GFC), 2008‐2009 GFC, and post‐GFC periods. The estimates show that there has been a general improvement in potential output growth over time, characterized by rising trend TFP growth and factors of production. In the late 1980s to 1992, capital has the highest contribution to potential output growth with TFP having a negative contribution. TFP’s contribution turned positive in 1993 – 2001 and steadily increased over time (Table 1). In terms of percentage contribution, TFP contributed the most beginning 2002, followed by capital and labor services, respectively (Figure 1). This is consistent with the estimates in other studies.22 In terms of sectoral labor contribution, agricultural labor contributed least to growth.23 Industrial labor likewise had a declining contribution to potential output growth, although there has been a reversal in the post global financial crisis period. This could be due to the rebound in manufacturing sub‐sector’s weighted contribution to industrial
equipment was used and for structure, investment in construction was used as bases in deriving initial capital stocks. The sub‐component ‘others’ is residually derived.
18 n
Lh
Lti
tin
tt
⎭⎬⎫
⎩⎨⎧
Σ=
=,
,
1*40
where:
tL = full‐time equivalent employment
tih , = mean hours worked per week
40 = average hours worked in full‐time jobs per week
tiL , = total number of workers who reported for work per industry 19 The log differenced form of the Cobb Douglas production function can be represented in dotted small letters,
. Since and are known, TFP growth ( can be derived residually, i.e.,
20 Alternatively, Kalman filter using capacity utilization as the indicator variable can be used. For the estimation made, simple HP filter is used as there is no sectoral or aggregate measure of capacity utilization for the Philippines. The only available measure of capacity utilization is for the manufacturing sub‐sector.
21 Potential GDP growth is estimated as , as in D’Auria et al (2010). Dotted variables with bar denote trend growth rate.
22 Canlas (2009) reproduced in Llanto (2012), pp 23 – 24 and Asian Productivity Organization (2012), p.78 23 Briones (2013) explained that while there has been an increasing trend in agricultural spending over time, the sector continues to
be beset by weak growth, lack of diversification and competitiveness, tepid productivity growth, and persistent poverty among farmers. He traced the dismal performance to “faulty design and execution of agricultural programs.”
14
sector’s trend growth (Figure 2). The estimated productivity improvement is consistent with declining incremental capital‐output ratio as shown in Figure 3.
Table 1. Weighted Contribution to Potential Output Growth
* includes intellectual property products, which are assumed to be embodied most in durable equipment (e.g. semiconductors) ** labor is measured in terms of full‐time equivalent employment
Figure 1. Percentage Contribution to Potential Output Growth
Figure 2. Weighted Contribution to Trend
Industry Growth
* Applied simple Hodrick Prescott filter on seasonally adjusted industry’s output
Figure 3 . Incremental Capital‐Output Ratio
Notwithstanding data limitations, the standard approach to TFP estimation yields encouraging results, that is, TFP has been increasing and has been accounting for much of the potential output growth in recent period of strong growth. The results indicate that the country’s stock of employed labor and capital is able to deliver higher growth, which is in accordance with observed structural shift in employment and production structures that require higher levels of skills and knowledge. Sustaining the macroeconomic and institutional reform momentum is essential for continued economic growth and productivity improvement. Some of the structural policy imperatives, most of which are already being initiated, include institutional reforms that facilitate business development; greater diversification into higher valued‐added products and services; generation of more and better quality jobs; educational reforms and continuous upgrading of skills‐development programs designed to develop a deep talent pool with higher quality skills needed by industries; encouraging technological innovations; and well‐designed and growth‐critical infrastructure programs.

15
References: Asian Productivity Organization (2012). APO Handbook. Austria, Myrna (1998). Productivity Growth in the Philippines after the Industrial Reforms. Philippine Institute for Development Studies. Discussion Paper No. 98‐26. Briones, Roehlano (2013). Impact Assessment of the Agricultural Production Support Services of the Department of Agriculture (DA) on the Income of Poor Farmers/Fisherfolk: Review of the Evidence. Report submitted to the Department of Budget and Management under the auspices of the Philippine Institute for Development Studies (04 March 2013). Cororaton, Caesar (2002). Total Factor Productivity in the Philippines. Philippine Institute for Development Studies. Discussion Paper No. 2002‐01. D’Auria, F., Denis, C., Havik, K., McMorrow, K., Planas, C., Raciborski, R., Röger, W., and Rossi, A. (2010). The Production Function Methodology for Calculating Potential Growth Rates and Output Gaps. Economic Papers 420, European Commission (July 2010). Gerochi, Hope (2002). Returns to Education in the Philippines. Philippine Review of Economics Vol. XXXIX No. 2 December 2002, pp 37‐72. Isaksson, Anders (2007). Determinants of Total Factor Productivity: A Literature Review. Research and Statistics, United Nations Industrial Development Organization Staff WP 02/2007, July 2007 Kawai, Hiroki (1994). International Comparative Analysis of Economic Growth: Trade Liberalization and Productivity. The Developing Economics XXXII‐4 (December 1994). Llanto, Gilberto (2012). Philippine Productivity Dynamics in the Last Five Decades and Determinants of Total Factor Productivity. Philippine Institute for Development Studies. Discussion Paper No. 2012‐11.

16
Recent indicators of activity suggest buoyant domestic demand. Implied land values continue to trend higher.
Other Demand Indicators Output expansion is expected to be sustained over the near term as higher‐frequency demand indicators continued to show positive readings in the first quarter. Vehicle sales posted strong growth during the quarter, buoyed by brisk consumer demand and attractive financing options offered by industry players. Energy sales also continued to rise on account of increased consumption by the industrial and commercial sectors, while capacity utilization in manufacturing is steady above 80 percent. The PMI likewise remained firmly above the 50 point‐expansion threshold in February, reflecting the significantly higher PMI for services. Similarly, the outlook of businesses and consumers for the following quarter turned more favorable, supporting the continued strength of aggregate demand in the coming months. Property Prices Land Values, Metro Manila Data from Colliers International indicated that implied land values24 in the Makati CBD and Ortigas Center increased in Q4 2013 from their quarter‐ and year‐ago levels. Implied land values in the Makati CBD reached P341,505/sq.m. in Q4 2013, higher by 5.9 percent and 17.0 percent relative to the levels recorded in Q3 2013 and Q4 2012, respectively. Similarly, implied land values in the Ortigas Center rose by 2.6 percent q‐o‐q and 8.0 percent y‐o‐y to P144,683/sq.m. Land values in the Makati CBD are presently at about 80.4 percent of their 1997 levels in nominal terms, but only about 36.6 percent of their 1997 levels in real terms. Likewise, land values in the Ortigas Center were lower than their comparable levels in 1997 in both nominal and real terms by about 74.2 percent and 33.8 percent, respectively.
24 In the absence of reported closed transactions, implied land values based on trends are used by Colliers International to monitor prices.

17
Office vacancy rates tighten. Meanwhile, residential vacancy rates rise.
Vacancy Rates, Metro Manila The office vacancy rate in the Makati CBD declined to 2.3 percent in Q4 2013 from the previous quarter’s rate of 2.8 percent. The office vacancy rate in Q4 2013 was also lower than the 3.5 percent recorded a year ago as all office grades experienced increased take‐up. The office vacancy rate is estimated to remain broadly unchanged up to Q4 2014 given pre‐committed lease agreements in incoming new office supply. The residential vacancy rate in the Makati CBD of 11.0 percent in Q4 2013 was higher than the previous quarter’s rate of 10.1 percent and the year‐ago rate of 10.0 percent. Residential vacancy rates rose as tenants for both luxury and other grade segments explored alternative locations such as the Bonifacio Global City (BGC). The residential vacancy rate in the Makati CBD is expected to decrease to the 9.0‐percent range until Q4 2014 due to limited availability of residential units.
Office rental values trend higher.
Rental Values, Metro Manila25 Monthly office rents in the Makati CBD reached P793/sq.m. in Q4 2013, representing an increase of 1.4 percent from the previous quarter.26 Similarly, monthly office rents in the Makati CBD were higher by 10.2 percent relative to Q4 2012. The increase in rental rates was due to the continued take‐up of office space coupled with limited supply in the Makati CBD. Office rental values for premium grade offices in Q4 2013 were slightly above their 1997 levels in nominal terms. In real terms, office rental values were about 46.1 percent of the comparable levels in 1997.
25 Housing rentals account for 13.8 percent of the 2006‐based CPI basket. The NSO only surveys rentals ranging from around P300‐P10,000/month to compute rent inflation. However, the rental values discussed in this section pertain to high‐end rented properties, which may be considered as indicators of wealth and demand. 26 This was computed as the average of the rental values for the Premium, Grade A and Grade B segments. Premium refers to office space with capital values of P75,000/sq.m. and above; Grade A, between P65,000 and P75,000/sq.m.; and Grade B, P65,000/sq.m. and below.

18
Residential rental values continue to increase. Capital values for office and residential buildings are higher.
Monthly rents for prime 3‐bedroom condominium units in the Makati CBD rose to P805/sq.m. in Q4 2013, registering a 0.6‐percent growth from the previous quarter. Likewise, monthly rents for the 3‐bedroom segment were higher by 11.8 percent compared to the year‐ago level. Residential rental values in Q4 2013 were above their 1997 levels in nominal terms but were only about 77.2 percent of their 1997 levels in real terms.
Jones Lang Lasalle estimates showed that average Grade A office rentals in the Makati CBD and BGC reached P9,887/sq.m. per annum in Q4 2013, an increase of 1.3 percent compared to the previous quarter and 4.3 percent compared to the same quarter in 2012. Office rental values continue to be driven primarily by sustained leasing demand from the offshoring and outsourcing (O&O) sector. Traditional office demand from other sectors namely, information technology, consumer goods, and pharmaceuticals, also contributed to the continued take‐up of office space. Capital Values, Metro Manila Capital values27 for office buildings in the Makati CBD were higher in nominal terms than their quarter‐ and year‐ago levels. Grade A office capital values in the Makati CBD rose to P89,593/sq.m., higher by 2.0 percent and by 5.8 percent compared to their quarter‐ and year‐ago levels, respectively. Grade A office capital values in Q4 2013 were also higher than the 1997 levels in nominal terms. Nevertheless, in real terms, office capital values were about 51.4 percent of the comparable levels in 1997. Capital values for luxury residential buildings in Makati CBD were also higher than their quarter‐ and year‐ago levels. Average prices for luxury residential condominium units increased by 2.2 percent q‐o‐q and 14.4 percent y‐o‐y in
27 The capital value represents the probable price that the property would have fetched if sold on the date of the valuation. The valuation includes imputed land and building value.

19
Q4 2013. Residential capital values for luxury residential buildings28 in Q4 2013 were above their 1997 levels in nominal terms. In real terms, residential capital values were about 63.1 percent of the comparable levels in 1997.
Vehicle sales increase on brisk demand. Growth in overall energy sales slows down on lower residential sales.
Vehicle Sales Overall vehicle sales from the Chamber of Automotive Manufacturers of the Philippines (CAMPI)29 posted double‐digit growth in the first two months of Q1 2014. Vehicle sales increased by 21.4 percent y‐o‐y from a 10.2 percent growth recorded in the previous quarter (October‐November 2013). CAMPI attributed the strong sales of the local automotive industry to continued brisk consumer demand coupled with attractive financing options offered by industry players. Passenger car sales grew by 24.0 percent y‐o‐y in Q1 2014 (January‐February), rising to a total of 10,918 units from 8,808 units sold in the same period in 2013. Meanwhile, commercial vehicle sales, which account for 66.4 percent of total vehicle sales, expanded by 20.2 percent in the first two months of Q1 2014. Commercial vehicles sold during the quarter reached 21,552 units from 17,934 units in the same period of 2013. Energy Sales
Meralco’s energy sales for the first two months of Q1 2014 expanded by 1.7 percent, slower than the 2.5 percent growth reported in the same period a year ago. The energy sales from the industrial sector grew at a faster pace of 4.9 percent (from 4.3 percent in Q1 2013). According to Meralco, growth in industrial energy sales was driven by merchandise exports and increased production of the manufacturing sector.
28 In terms of location, luxury residential units are located within the CBD core and have high quality access to/from and have superior visibility from the main avenue. Meanwhile, in terms of general finish, luxury residential units have premium presentation and maintenance. 29 CAMPI represents the local assemblers and manufacturers of vehicle units in the Philippine automotive industry. The following are the active members of CAMPI, (1) Asian Carmakers Corp., (2) CATS Motors, Inc., (3) Columbian Autocar Corp., (4) Honda Cars Philippines, Inc., (5) Isuzu Philippines Corp., (6) Mitsubishi Motors Philippines Corp., (7) Nissan Motor Philippines Corp., (8) Suzuki Philippines Inc., (9) Toyota Motor Philippines Corp., and (10) Universal Motors Corp. As of July 2013, sales from CAMPI accounted for 85 percent of overall vehicle sales that include sales from the Association of Vehicle Importers and Distributors (AVID).

20
‐10
‐5
0
5
10
15
20
Q1 20
09 Q2
Q3
Q4
Q1 20
10 Q2
Q3
Q4
Q1 20
11 Q2
Q3
Q4
Q1 20
12 Q2
Q3
Q4
Q1 20
13 Q2
Q3
Q4
Q1 20
14
in percent
Meralco Energy SalesIn percent
Q1 20141.7 pct
Capacity utilization in manufacturing remains above 80 percent.
65
70
75
80
85
90
2008 2009 2010 2011 2012 2013 2014
Monthly Average Capacity Utilization for ManufacturingIn percent
January 2014 = 83.2
Source: NSO Manufacturing output posts slower growth.
‐35
‐25
‐15
‐5
5
15
25
35
45
2008 2009 2010 2011 2012 2013 2014
in percent
Volume of Production Value of Production
Source: NSO
Volume and Value Indices of Manufacturing Production
January 20147.2 pct
January 20147.3 pct
Commercial sector energy sales also increased by 2.4 percent (but lower than 2.6 percent in Q1 2013) with the real estate and private services sectors as the main contributors. By contrast, residential energy sales declined by 2.6 percent on lower demand due to cooler temperature. Capacity Utilization The average capacity utilization rate in the manufacturing sector was broadly steady in January 2014 at 83.2 percent, based on the NSO’s Monthly Integrated Survey of Selected Industries (MISSI). The proportion of establishments that operated at 80 percent or more was 56.4 percent in January. Volume and Value of Production Preliminary results of MISSI showed that the value of production index (VaPI) grew by 7.3 percent in January 2014, slower compared to the 20.2 percent growth a month ago. The continued expansion in VaPI was driven by the increased in production values of chemical products, furniture and fixtures, tobacco products, publishing and printing, machinery except electrical, textiles, leather products, fabricated metal products, electrical machinery, non‐metallic mineral products, petroleum products, and rubber and plastic products. Likewise, the volume of production index (VoPI) rose by 7.2 percent in January 2014, but slower than the 25.2 percent (revised) figure in the previous month. The growth in production output was attributed to the increased VoPI of the following items: furniture and fixtures, tobacco products, publishing and printing, machinery

21
except electrical, textiles, fabricated metal products, leather products, chemical products, electrical machinery, and non‐metallic mineral products sectors.
Business sentiment for the following quarter remains bullish.
Business Expectations Survey
Index 2013 2014
Q1 Q2 Q3 Q4 Q1
Business Outlook Index
Current Quarter 41.5 54.9 42.8 52.3 37.8
Next Quarter 56.4 46.2 60.0 40.7 50.8
Source: BSP
Consumer outlook for the current and next quarter is favorable.
Business Expectations Survey Results of the BES30 for Q1 2014 showed a less favorable confidence index (CI) for the current quarter, but a more optimistic index for the next quarter. Overall CI for Q1 2014 declined by 14.5 index points to 37.8 percent from 52.3 percent in the previous quarter. However, the next quarter CI rose by 10.1 index points to 50.8 percent from 40.7 percent a quarter ago, indicating a more positive business outlook in Q2 2014. Business outlook in both NCR and AONCR tracked the sentiment of businesses at the national level—less sanguine in Q1 2014, but more positive in the following quarter. The less favorable outlook of respondents for Q1 2014 was due to expectations of seasonal slowdown in business activity and moderation of consumer demand after Christmas; weaker peso that could hurt importers; adverse effects of typhoon Yolanda on crop production and businesses; rising prices of oil and other utilities; strong market competition; and lack of supply of raw materials. The sentiment of businesses in the Philippines mirrored the weak business outlook in Singapore and China, in contrast to the more buoyant outlook of businesses in the United Kingdom, Germany, Hong Kong SAR, India, and New Zealand. Meanwhile, the business outlook in the US and South Korea was steady in Q1 2014. Consumer Expectations Survey Results of the Consumer Expectations Survey31 (CES) showed favorable consumer sentiment for the current quarter, the next quarter, and the year ahead.
30 The Q1 2014 BES was conducted from 9 January ‐20 February 2014 among 1,525 firms nationwide, drawn from SEC’s’ Top 7000 Corp. in 2010 and Business World’s Top 1000 Corporations in 2012. 31 The Q1 2014 CES was conducted during the period 21 January‐3 February 2014 covering 5,870 households, of which 49.6 percent were from the NCR and 50.4 percent from the AONCR.

22
Consumer Expectations SurveyIndex 2013 2014
Q1 Q2 Q3 Q4 Q1
Current Quarter ‐11.2 ‐5.7 ‐7.9 ‐21.3 ‐18.8
Next 3 months 7.8 4.1 5.7 2.8 5.4
Next 12 months 18.5 16.1 15.8 14.1 19.3
Source: BSP
Overall consumer CI in Q1 2014 improved slightly to ‐18.8 percent from ‐21.3 percent in the previous quarter. The modest improvement (though still negative) in consumer outlook during the quarter was attributed to the availability of more jobs, increased number of employed family members, more investment prospects, higher income, stronger business activity, and good harvests. The upbeat sentiment among consumers in the Philippines mirrored the outlook of consumers in Germany, Indonesia, South Korea, and Taiwan. By contrast, the outlook of consumers in Australia, China, Japan, Thailand, and the United States was less optimistic. Meanwhile, the consumer outlook for Q2 2014 and the year ahead was optimistic with the CI at 5.4 percent and 19.3 percent, respectively. The main reasons for the improved sentiments of consumers were expectations of more job opportunities and good weather conditions in the next quarter.
PMI points to sustained expansion in domestic activity.
58.2
61.1
40
45
50
55
60
65
70
75
Jan
Feb
Mar
Apr
May Jun
Jul
Aug
Sep
Oct
Nov Dec Jan
Feb
Mar
Apr
May Jun
Jul
Aug
Sep
Oct
Nov Dec Jan
Feb
Mar
Apr
May Jun
Jul
Aug
Sep
Oct
Nov Dec Jan
Feb
2011 2012 2013 2014
Consolidated PMI Manufacturing Retail/Wholesale Services
Purchasing Managers' Index
55.4
51.6
Purchasing Managers’ Index32 The results of the monthly PMI survey reflects sustained economic expansion in February 2014. The composite PMI remained firmly above the 50‐point threshold at 58.2, higher than the 54.0‐point level recorded in December 2013 and 57.4‐point level posted in the same period in 2013. The higher composite PMI reflected the increased PMI recorded across all sectors—manufacturing, services, and retail and wholesale—in February 2014 relative to December 2013.
32 The PMI for the Philippines is compiled by the Foundation of the Society of Fellows in Supply Management, Inc. (SOFSM), the advocacy arm of PISM.
Source: Philippine Institute of Supply Management (PISM)

23
Export growth rises on higher shipments of manufactures. Exports of GoodsGrowth rate (in percent)
Commodity Group2013
Q3 Q4
Coconut products 18.6 ‐25.2
Sugar and Products 90.6 15.2
Fruits and Vegetables 30.7 ‐2.7
Other Agro‐based products 28.5 58.5
Forest products ‐5.8 10.1
Mineral products 94.2 5.0
Petroleum products 299.6 ‐23.5
Manufactures 1.7 19.4
Special transactions ‐28.8 ‐43.4
Total Exports 8.4 16.1
Source: PSA; BSP Staff Computations Lower imports of capital goods drive down total imports of goods. Imports of GoodsGrowth rate (in percent)
Commodity Group2013
Q3 Q4
Capital Goods 10.6 ‐5.2
Raw Materials & Intermediate Goods
16.7 ‐1.1
Mineral Fuels & Lubricants ‐6.0 ‐2.9
Consumer Goods 2.2 3.5
Special Transactions ‐24.9 7.6
Total Imports 7.6 ‐2.0Source: PSA; BSP Staff Computations
The services sector remains the main driver of output growth on the production side.
External Demand Exports Based on the trade data reported by the Philippine Statistics Authority, exports of goods grew by 16.1 percent in Q4 2013, significantly higher than the 8.4‐percent growth posted in the previous quarter. The improved export performance was driven mainly by higher shipments of manufactures (19.4 percent). Imports Imports of goods declined by 2.0 percent in Q4 2013, a reversal of the 7.6‐percent growth recorded in the previous quarter. The drop in imports can be attributed primarily to lower inward shipments of capital goods (‐5.2 percent) during the quarter. Aggregate Supply The services sector, which comprised 55.3 percent of GDP, continued to increase, albeit at a slower pace of 6.5 percent in Q4 2013 from 7.4 percent in Q3 2013. Notwithstanding the expansion in all sub‐sectors (led by trade and repair of motor vehicles, motorcycles, personal and household goods (7.4 percent)), the slowdown in the services sector was traced largely to the deceleration in the growth of real estate, renting, and business activities, which grew by 6.3 percent in Q4 2013 from 11.7 percent in the previous quarter.

24
1.1 pct
6.5 pct
8.4 pct
‐10
‐5
0
5
10
15
20
Q12009
Q2 Q3 Q4 Q12010
Q2 Q3 Q4 Q12011
Q2 Q3 Q4 Q12012
Q2 Q3 Q4 Q12013
Q2 Q3 Q4
year‐on‐year growth in percent in re
al te
rms
GDP‐Production (At Constant Prices)
Agriculture Industry Services
Economic PerformanceAt constant 2000 pricesGrowth rate (in percent)
Sector 2012 2013Q4 Q3 Q4
By industrial originAgri, Hunting, Forestry & Fishing 4.9 0.3 1.1Agriculture and Forestry 5.2 0.3 2.4Fishing 3.4 0.5 ‐4.4
Industry 8.9 8.3 8.4Mining and quarrying 2.8 4.7 ‐10.4Manufacturing 5.5 9.7 12.3Construction 29.9 4.5 ‐0.8Electricity, gas and water supply 3.4 6.7 2.5
Services 6.5 7.4 6.5Transport., Storage, & Comm. 4.4 6.5 6.2Trade 6.6 6.1 7.4Finance 8.8 12.1 9.9Real estate, Rent, & Bus. Act. 6.5 11.7 6.3Public administration & defense 8.2 2.6 0.5Other services 5.8 4.5 5.4
Source: NSCB
The industry sector maintained its growth momentum at 8.4 percent in Q4 2013. Contributing 2.8 ppts to GDP growth, the expansion in the industry sector was driven primarily by higher manufacturing output (12.3 percent). By contrast, after posting positive growth since Q4 2011, output growth in construction declined by 0.8 percent.
The agriculture, hunting, forestry, and fishery (AHFF) sector continued to recover, growing by 1.1 percent in Q4 2013 from 0.3 percent in the previous quarter. The growth in the AHFF reflected mainly the increase in the agriculture and fishery sub‐sector (2.4 percent) due, in turn, to higher palay output (8.1 percent). The increase was, however, curbed by the output decline in the fishing sub‐sector (‐4.4 percent).
Labor Market Conditions
The unemployment rate rises driven by developments in the NCR.
January 20147.5 pct
January 201419.5 pct
0
5
10
15
20
25
2008 2009 2010 2011 2012 2013 2014
in percent
Unemployment and Underemployment
Unemployment Underemployment
Based on the preliminary results of the January 2014 Labor Force Survey (LFS),33 the unemployment rate was estimated at 7.5 percent, higher than the quarter‐ago and year‐ago rate of 6.5 percent and 7.1 percent, respectively. The number of unemployed persons rose by 7.0 percent y‐o‐y in January 2014 after falling by 5.8 percent in October 2013, driven by developments in the NCR. The NCR recorded the highest unemployment rate due to the in‐migration of individuals from rural areas and from disaster‐stricken areas seeking opportunities for employment.34 Meanwhile, the proportion of
33 The January 2014 LFS excludes data on Region VIII. 34 National Economic Development Authority press release entitled, “NEDA pushes for more job opportunities in provinces near disaster‐stricken areas,” available online at http://www.neda.gov.ph/?p=2685.

25
underemployed to total employed persons decreased to 19.5 percent in January 2014 from 20.7 percent in the same period last year.35 The number of employed persons increased slightly by 0.8 percent y‐o‐y, supported by the increase in employment in the agriculture and services sector, which both contributed 0.3 ppt to total employment growth. Nonetheless, the slowdown in employment growth in the services sector (0.2 percent from 1.6 percent in October 2013) restrained in part the increase in both the agriculture (1.1 percent) and industry (2.1 percent) sectors. In terms of major occupation groups, the y‐o‐y increase in the employment level could be traced largely to the higher number of employed officials of government, and farmers and fishermen.
35 Underemployed persons include all employed persons who express the desire to have additional hours of work in their present job or an additional job, or to have a new job with longer working hours. Visibly underemployed persons are those who work for less than 40 hours during the reference period and want additional hours of work.

26
II. MONETARY AND FINANCIAL MARKET CONDITIONS
Domestic Liquidity and Credit Conditions Domestic liquidity growth remains strong, fueled by robust lending to the private sector. Robust credit activity lends support to the domestic growth momentum.
The growth in money supply or M3 accelerated to 36.4 percent in February 2014 from 32.7 percent in end‐Q4 2013. Money supply continued to expand due to the sustained demand for credit in the domestic economy. Domestic claims rose by 14.3 percent in February, faster than the 11.6‐percent increase at end‐Q4 2013, as bank lending accelerated further. At the same time, net public sector credit grew by 11.9 percent in February, following the 0.1‐percent contraction at the end of the previous quarter, given increased deposits of the National Government (NG), reflecting in part the proceeds from the auction of government securities as well as revenue collections from various agencies. Meanwhile, the growth in net foreign assets (NFA) was slower at 7.5 percent y‐o‐y in February from 10.1 percent in end‐Q4 2013. The BSP’s NFA position improved on the back of robust foreign exchange inflows from remittances and business process outsourcing receipts. The NFA of banks likewise increased as banks’ foreign assets grew at a faster pace relative to the growth in their foreign liabilities. Banks’ foreign assets rose due mainly to the growth in foreign loans and receivables, while banks’ foreign liabilities expanded on account of higher deposits of foreign residents as well as placements made by foreign banks with their local branches. As of February 2014, outstanding loans of commercial banks, net of banks’ reverse repurchase (RRP) placements with the BSP, expanded by 19.4 percent y‐o‐y relative to the 16.4 percent and 14.2 percent growth posted at end‐Q4 2013 and end‐Q1 2013, respectively. The continued expansion of bank lending was driven largely by lending to the following productive sectors: real estate, renting, and business services; electricity, gas and water; wholesale and retail trade; manufacturing; and financial intermediation. Meanwhile, loans for

27
household consumption registered a growth of 9.2 percent as of February 2014, higher than the 8.3 percent increase at end‐Q4 2013 but lower than the 10.9 percent expansion at end‐Q1 2013. Credit Standards
Most respondent banks maintain credit standards for loans to enterprises.
Results of the Q1 2014 Senior Bank Loan Officers’ Survey (SLOS)36 showed that most of the respondent banks maintained their credit standards for loans to both enterprises and households during the quarter based on the modal approach.37 This is the 20th consecutive quarter starting Q2 2009 that most banks reported broadly unchanged credit standards.
The diffusion index (DI) approach,38,39 however, showed a net easing of overall credit standards for loans to enterprises and a net tightening of overall credit standards for household loans in Q1 2014 relative to the previous quarter, with the DI recorded at ‐3.7 percent and 10.0 percent, respectively. In the previous quarter, credit standards for corporate lending were unchanged while credit standards for loans to households showed a slight net tightening using the DI approach. Lending to Enterprises Most banks (88.9 percent of banks that responded to the question) indicated that credit standards for loans to enterprises were kept steady during the quarter using the modal approach. However, based on the DI approach, credit standards for loans to enterprises showed a net easing. Banks that indicated an easing of overall credit standards pointed to a more favorable outlook on the domestic economy and certain industries, which include manufacturing,
36 The survey consists of questions on loan officers’ perceptions relating to the overall credit standards of universal/commercial banks (U/KBs) in the Philippines, as well as to factors affecting the supply of and demand for loans by both enterprises and households. Survey questionnaires were sent to all commercial banks, except for one bank that requested not to be included in the survey since it does not engage in corporate and retail lending. Thirty three banks responded to the current survey representing a response rate of 94.3 percent. As of December 2013, U/KB loans accounted for about 87.0 percent of the banking system’s total outstanding loans. 37 In the modal approach, the results of the survey are analyzed by looking at the option with the highest share of responses. 38 In the diffusion index approach, a positive diffusion index (DI) for credit standards indicates that the proportion of banks that have tightened their credit standards are greater compared to those that eased (“net tightening”), whereas a negative DI for credit standards indicates that more banks have eased their credit standards compared to those that tightened (“net easing”). 39 From Q1 2010 to Q4 2012 survey rounds, the BSP used largely the DI approach in the analysis of survey results. Beginning in Q1 2013, the BSP used both the modal and DI approaches in assessing the results of the survey.

28
2014
Q1 Q2 Q3 Q4 Q1 Q2 Q3 Q4 Q1
Tightened considerably 0.0 0.0 0.0 0.0 0.0 0.0 3.6 3.3 3.7
Tightened somewhat 5.9 3.6 8.0 0.0 0.0 3.4 3.6 3.3 0.0
Remained basi cally unchanged 94.1 92.9 84.0 96.6 90.3 86.2 89.3 86.7 88.9
Eased somewhat 0.0 3.6 8.0 3.4 9.7 10.3 3.6 6.7 7.4
Eased considerably 0.0 0.0 0.0 0.0 0.0 0.0 0.0 0.0 0.0
Total 100.0 100.0 100.0 100.0 100.0 100.0 100.0 100.0 100.0
Diffusion Index for Credit Standards 5.9 0.0 0.0 ‐3.4 ‐9.7 ‐6.9 3.6 0.0 ‐3.7
Weighted Diffusion Index for Credit Standards 2.9 0.0 0.0 ‐1.7 ‐4.8 ‐3.4 3.6 1.7 0.0
Mean 2.9 3.0 3.0 3.0 3.1 3.1 2.9 3.0 3.0
Number of banks responding 17.0 28.0 25.0 29.0 31.0 29.0 28.0 30.0 27.0p g pthat eased (“net tightening”), whereas a negative diffusion index for credit standards indicates that more banks have eased their credit standards compared to those that tightened (“net eas ing”).
General Credit Standards for Loans to Enterprises (Overall)
2012 2013
real estate, renting and business services, and wholesale and retail trade. Respondent banks also cited the improved profitability of their asset portfolios and increased tolerance for risk as key reasons for easing their credit standards. In particular, banks’ responses indicated increased credit line sizes, longer loan maturities (except for micro enterprises), and reduced use of interest rate floors (except for micro enterprises).40 By borrower firm size, overall credit standards for top corporations were unchanged for the third consecutive quarter based on the DI approach. Overall credit standards for large middle‐market enterprises and small and medium enterprises (SMEs) showed a net tightening for the third consecutive quarter, while credit standards for loans to micro enterprises appeared to have eased after six consecutive quarters of net tightening based on the DI approach. For the next quarter, most of the respondent banks still expect credit standards for loans to enterprises to remain unchanged. However, the percentage of banks foreseeing a slight easing of credit standards for loans to businesses was higher compared to those expecting the opposite. A more favorable outlook on domestic economy, expected improvement in the profitability and liquidity of asset portfolio of banks, and improvement in borrowers’ profile were among the reasons behind the expected net easing of credit standards cited by respondent banks.
Most respondent banks maintain credit standards for loans to households.
Lending to Households Using the modal approach, the survey results likewise showed that most of the respondent banks (80.0 percent) continued to report unchanged credit standards for loans extended to households. The DI approach, however, indicated a net tightening of overall credit standards for household loans owing to banks’ reduced tolerance for risk and stricter financial system regulations. In particular, banks’ responses
40 The survey questionnaire identified six specific credit standards: (1) loan margins (price‐based); (2) collateral requirements; (3) loan covenants; (4) size of credit lines; (5) length of loan maturities; and (6) interest rate floors. A loan covenant is an agreement or stipulation laid down in loan contracts, particularly contracts with enterprises, under which the borrower pledges either to take certain action (an affirmative covenant), or to refrain from taking certain action (a negative covenant); this is consequently part of the terms and conditions of the loan. Meanwhile, an interest rate floor refers to a minimum interest rate for loans. Greater use of interest rate floor implies tightening while less use indicates otherwise.

29
2014
Q1 Q2 Q3 Q4 Q1 Q2 Q3 Q4 Q1
Tightened considerably 0.0 0.0 0.0 0.0 0.0 0.0 5.3 4.8 5.0
Tightened somewhat 0.0 0.0 5.9 4.3 4.2 4.8 0.0 4.8 10.0
Remained basically unchanged 100.0 90.0 88.2 87.0 87.5 85.7 84.2 85.7 80.0
Eased somewhat 0.0 10.0 5.9 8.7 8.3 9.5 10.5 4.8 5.0
Eased considerably 0.0 0.0 0.0 0.0 0.0 0.0 0.0 0.0 0.0
Total 100.0 100.0 100.0 100.0 100.0 100.0 100.0 100.0 100.0
Diffusion Index for Credit Standards 0.0 ‐10.0 0.0 ‐4.3 ‐4.2 ‐4.8 ‐5.3 4.8 10.0
Weighted Diffusion Index for Credit Standards 0.0 ‐5.0 0.0 ‐2.2 ‐2.1 ‐2.4 0.0 4.8 7.5
Mean 3.0 3.1 3.0 3.0 3.0 3.0 3.0 2.9 2.9
Number of banks responding 13.0 20.0 17.0 23.0 24.0 21.0 19.0 21.0 20.0
Note: A positive diffusion index for credit standards indicates that more banks have t ightened their credit standards compared to those that eased (“net tightening”), whereas a negative diffusion index for credit s tandards indicates that more banks have eased their credit standards compared to those that tightened (“net eas ing”).
General Credit Standards for Loans to Households (Overall)
2012 2013
Loan demand from both enterprises and households is unchanged.
indicated stricter collateral requirements for housing loans and reduced credit line sizes for auto loans. Most of the respondent banks foresee maintaining their credit standards over the next quarter. However, some banks expect overall credit standards to ease slightly given expectations of an improvement in profitability of banks’ asset portfolio, a more favorable economic outlook, and improved borrowers’ profile, among other things.
Loan demand Responses to the survey question on loan demand indicated that the majority of the respondent banks continue to see unchanged overall demand for loans from both enterprises and households. Using the DI approach, however, a net increase in overall demand41 for loans from both enterprises and households was observed. For loans to businesses, the net increase in loan demand was attributed by banks to higher inventory financing and working capital needs of borrower firms as well as lower interest rates and clients’ improved economic outlook. Meanwhile, the net increase in demand for household loans was due to higher housing investment, lower interest rates, and more attractive financing terms offered by banks. The net increase in loan demand for both business and household loans, based on the DI approach, was reflected in the robust lending activity of banks during the quarter.
Looking ahead, most of the respondent banks expect unchanged loan demand for loans to firms and households over the next quarter. However, a larger proportion of respondents expect demand for loans to increase further in the next quarter relative to those who indicated the opposite. For loans to enterprises, the net increase in demand for loans was attributed by respondent banks to higher inventory and accounts receivable financing needs, increased working capital needs
41 “Diffusion index (DI) for loan demand” refers to the percentage difference between banks reporting an increase in loan demand and banks reporting a decrease. A positive DI for loan demand indicates that more banks reported an increase in loan demand compared to those stating the opposite, whereas a negative DI for loan demand implies that more banks reported a decrease in loan demand compared to those reporting an increase.

30
Credit standards for commercial real estate loans are unchanged.
of borrower firms, and lower interest rates. For loans to households, meanwhile, banks’ more attractive financing terms and higher household consumption were cited by respondent banks as key factors behind the expected increase in loan demand. Special Questions on Commercial Real Estate Loans Most of the respondent banks (84.2 percent) indicated unchanged overall credit standards for commercial real estate loans using the modal approach. However, based on the DI approach, a net tightening of overall credit standards was noted for commercial real estate loans for the seventh consecutive quarter in Q1 2014. The net tightening of overall credit standards for commercial real estate loans was attributed by respondent banks to stricter oversight of banks’ real estate exposure along with banks’ reduced tolerance for risk. In particular, respondent banks reported wider loan margins, reduced credit line sizes, stricter collateral requirements and loan covenants, and lower loan‐to‐value ratios for commercial real estate loans. Demand for commercial real estate loans was also unchanged in Q1 2014 based on the modal approach. A number of banks, however, indicated increased demand for the said type of loan on the back of improved economic outlook of borrowers, more attractive financing terms of banks, and lower interest rates. For the next quarter, most of the respondent banks expect to maintain their credit standards for commercial real estate loans. However, banks that anticipate a tightening of their credit standards outnumbered those expecting the opposite. In terms of demand for this type of loan, although most of the respondent banks anticipate generally steady loan demand, a number of banks are of the view that demand for commercial real estate loans will continue to increase in the next quarter.

31
Interest Rates T‐bill rates in the primary market rise on expectations of higher yields in the US.
0
1
2
3
4
5
Q1 Q2 Q3 Q4 Q1 Q2 Q3 Q4 Q1 Q2 Q3 Q4 Q1 Q2 Q3 Q4 Q1
91‐day T‐bill Rate 182‐day T‐bill Rate 364‐day T‐bill Rate
2011
Treasury Bill Rates
2010 2012
in percent
2013 2014
Secondary market yields are generally higher.
0
1
2
3
4
5
6
3Mo 6Mo 1Yr 2Yr 3yr 4Yr 5Yr 7Yr 10Yr 20Yr 25Yr
Mar 2013 Dec 2013 Mar 2014
Yields of Government Securities in the Secondary Market
Maturity
in percent
Interest rate differentials widen.
Primary Interest Rates In Q1 2014, the average 91‐day, 182‐day, and 364‐day T‐bill rates in the primary market rose to 1.065 percent, 1.40 percent, and 1.540 percent, respectively, from 0.001 percent, 0.046 percent, and 0.227 percent in Q4 2013. T‐bill rates in the primary market edged higher as investors sought higher yields on expectations of increased interest rates in the US as the US Fed continued to wind down its monthly bond‐buying program. Yield Curve The secondary market yield of government securities (GS) rose generally across tenors (except for the 4‐year, 5‐year and 25‐year GS) as of end‐March 2014 relative to the end‐December 2013 levels due largely to sustained concerns over the speed and magnitude of the US Fed’s tapering of its bond‐buying program. Debt paper yields were higher by a range of 0.2 bp (7‐year GS) to 1.4 bps (6‐month GS) compared to end‐December 2013 levels. Meanwhile, the rate for 5‐year and 25‐year GS both declined marginally by 0.01 bp, while the 4‐year GS fell by 0.06 bp. Relative to the end‐March 2013 levels, secondary market yields across all tenors were higher by a range of 0.2 bp (2‐year GS) to 1.6 bps (20‐year GS). Interest Rate Differentials The differentials between domestic and US interest rates, gross and net of tax, turned positive in Q1 2014 relative to the previous quarter. The increase in domestic interest rate amid the decline in foreign interest rates led to positive after tax differentials between the RP 91‐day T‐bill rate and the US 90‐day T‐bill rate and the US 90‐day LIBOR in Q1 2014. The average 91‐day RP T‐bill rate rose q‐o‐q by 106.4 bps to 1.07 percent in Q1 2014. Meanwhile, the average US 90‐day LIBOR and the average US 90‐day T‐bill

32
‐50
0
50
100
150
200
250
300
350
400
450
Q1 Q2 Q3 Q4 Q1 Q2 Q3 Q4 Q1 Q2 Q3 Q4 Q1 Q2 Q3 Q4 Q1
RP 91‐day T‐bill vs. US 90‐day LIBOR (before tax) RP 91‐day T‐bill vs. US 90‐day T‐bill (before tax)
RP 91‐day T‐bill vs. US 90‐day LIBOR (after tax) RP 91‐day T‐bill vs. US 90‐day T‐bill (after tax)
Interest Rate Differentials
2010 2011 2012
qua
rterly ave
rage
s; in basis points
2013 2014
‐1
0
1
2
3
4
5
Q1 Q2 Q3 Q4 Q1 Q2 Q3 Q4 Q1 Q2 Q3 Q4 Q1 Q2 Q3 Q4 Q1
BSP RRP Rate US Federal Funds Target Rate
2010 2011 2012
BSP RRP Rate and US Federal Funds Target Rate
in percent
2013 2014
125
150
175
200
225
250
275
300
325
Q1 Q2 Q3 Q4 Q1 Q2 Q3 Q4 Q1 Q2 Q3 Q4 Q1 Q2 Q3 Q4 Q1
Risk‐Adjusted Differentials
2010 2011 2012
in basis points
2013 2014
Real lending rate declines further.
0
1
2
3
4
5
6
Q1 Q2 Q3 Q4 Q1 Q2 Q3 Q4 Q1 Q2 Q3 Q4 Q1 Q2 Q3 Q4 Q1
2010
Philippines' Real Lending Rate
2011 2012
in percent
2013 2014
rate decreased q‐o‐q by 0.5 bp and 2.3 bps, respectively, to 0.24 percent and 0.05 percent. The domestic interest rate rose on investors’ expectations of higher inflation for the quarter and of sustained reduction in the US Fed’s QE program. Meanwhile, the foreign interest rates declined on the release of disappointing economic reports in the US during the quarter, including the lower US non‐manufacturing and consumer confidence indices n February 2014; lower‐than‐expected new home sales in February 2014; slower manufacturing activity in China as its PMI fell in January 2014. The positive differential between the BSP's policy interest rate (overnight borrowing or RRP rate) and the US federal funds target rate was steady at 325.0 bps as of end‐Q1 2014, reflecting the unchanged policy settings for both central banks. Adjusted for the risk premium,42 the spread between the two policy rates narrowed to 221 bps in end‐March 2014 from 233 bps in end‐December 2013. This development could be traced to the higher risk premium given increased ROP yields. The 10‐year US yield, likewise, rose, although to a lesser extent, following the lower US jobless claims and higher US non‐farm payroll during the quarter, which raises the safe‐haven appeal of US government debt papers. The real lending rate—measured as the difference between the average bank lending rate and inflation—rose to 1.7 percent in March 2014 from 1.3 percent in December 2013. This was due to the 20 bps rise in the average bank lending rate to 5.6 percent in March 2014 from 5.4 percent in December 2013 along with the 20 bps decline in inflation to 3.9 percent from 4.1 percent. The Philippines posted the fourth lowest real lending rate in the sample of 10 Asian countries, with India recording the highest real lending rate at 10.1 percent and Japan the lowest at ‐0.3 percent.
42 The difference between the 10‐year ROP note and the 10‐year US Treasury note is used as proxy for the risk premium.

33
Financial Market Conditions Local financial market conditions are generally stable. Equity trading is dampened by concerns over the continued US Fed QE tapering.
0
1,000
2,000
3,000
4,000
5,000
6,000
7,000
8,000
Q12009
Q2 Q3 Q4 Q12010
Q2 Q3 Q4 Q12011
Q2 Q3 Q4 Q12012
Q2 Q3 Q4 Q12013
Q2 Q3 Q4 Q12014
inde
x po
ints
Quarterly Average PSEi
Q1 20146,196.7
Market sentiment during the quarter in review was influenced largely by concerns over the extent and duration of US Fed’s tapering of its QE measures and potential abrupt adjustments in its policy stance as recovery in the US firms up. Indications of a further economic slowdown in China likewise dampened investor confidence. Nonetheless, markets started to rally by mid‐quarter on account of positive domestic economic news, including the robust Q4 2013 GDP growth and lower February inflation, and expectations of continued strong corporate earnings. The Philippine sovereign spreads narrowed, while the Philippine CDS spread continued to trade lower relative to those of our neighbors in the region. The PSEi also began to recover gains lost in the last month of 2013. However, the peso recorded moderate depreciation relative to previous quarter on lingering uncertainty on the external front. Stock Market The PSEi declined marginally by 0.6 percent q‐o‐q to average 6,196.74 index points in Q1 2014. The market took its cue from disappointing economic developments abroad as well as US Fed’s signals of continuing tapering of its QE measures. Reports of positive economic growth and local corporate earnings in 2013 helped the index recover by the end of the quarter. The local index traded within a narrow band in January, mostly below the 6,000 level, on concerns over high domestic inflation in December, the depreciating peso, and further tapering of the US Fed’s QE program. In February, however, the PSEi began its rally after the announcement of the higher‐than‐expected Philippine GDP growth for 2013, coupled with strong initial corporate earnings reports for 2013 and JP Morgan’s upgrade of Philippine shares from “neutral” to “overweight.” These developments helped offset the impact on market sentiment of signs of a slowing Chinese economy. In early March, the PSEi crossed the 6,500 barrier, boosted by continued reports of strong local

34
Foreign investors turn net buyers. Investors prefer shorter‐dated T‐bills.
0
20
40
60
80
100
120
140
160
180
Q12009
Q2 Q3 Q4 Q12010
Q2 Q3 Q4 Q12011
Q2 Q3 Q4 Q12012
Q2 Q3 Q4 Q12013
Q2 Q3 Q4 Q12014
in b
illio
n pe
sos
Total Oversubscription of T‐bill Auctions
corporate earnings, easing domestic inflation in February, and the inclusion of more Philippine corporations into the FTSE all‐world index. On the latter part of the month, the market succumbed to profit‐taking following the release of fresh batch of disappointing data from China and rising geopolitical tensions in Ukraine. Remarks by Janet Yellen that the US Fed would probably end its bond buying program in Q3 2014 and start raising policy rates six months thereafter and BSP Governor Tetangco’s similarly hawkish tone likewise dampened market confidence. Nevertheless, the PSEi closed at 6,428.71 index points as of end‐March, higher by 0.1 percent m‐o‐m and ytd by 9.1 percent. Total stock market capitalization increased by 5.8 percent to P12.6 trillion relative to the previous quarter, as foreign investors returned to the local bourse after six successive months of net selling. Foreign investors turned net buyers with foreign purchases amounting to P17.5 billion during the quarter. Data from Bloomberg also indicated that the price‐earnings (P/E) ratio of listed issues increased from 17.4X in end‐December to 20.2X in end‐March. At this level, Philippine shares are the second most expensive stocks in the region, next to Indonesia with a P/E of 30.4X. Government Securities Results of the T‐bill auctions conducted in Q1 2014 reflected investors’ preference for 91‐day T‐bills along with limited demand for the 182‐day and 364‐day T‐bills. In all auctions conducted in Q1 2014, the Auction Committee made partial awards of the P20.0‐billion programmed amount as the Committee rejected bids that were higher than the interest rates in the secondary market. Bids for the 182‐day T‐bills were rejected in full during the 6 January and 3 February auctions. Meanwhile, all bids for the 364‐day T‐bills were rejected by the Committee during the 3 February auction. The NG’s favorable cash position allowed it to reject high bids. Tenders for the 182‐day and 364‐day T‐bills were undersubscribed in two of the three auctions conducted during the quarter. On the aggregate

35
Debt spreads reflect mixed signals on risk aversion.
0
100
200
300
400
500
600
700
Q12009
Q2 Q3 Q4 Q12010
Q2 Q3 Q4 Q12011
Q2 Q3 Q4 Q12012
Q2 Q3 Q4 Q12013
Q2 Q3 Q4 Q12014
in b
asis
poi
nts
Quarterly JPMorgan EMBI+ Sovereign Bond Spreads
EMBI+Philippines142 pts
EMBI+Global360 pts
0
100
200
300
400
500
600
700
Q12009
Q2 Q3 Q4 Q12010
Q2 Q3 Q4 Q12011
Q2 Q3 Q4 Q12012
Q2 Q3 Q4 Q12013
Q2 Q3 Q4 Q12014
in basis points
Quarterly Philippine Sovereign 5‐Year CDS Spreads
Philippines Indonesia Thailand Malaysia111 pts 208 pts 146 pts 110 pts
basis, the auctions for the quarter were oversubscribed with total oversubscription amounting to P26.9 billion against the total offered amount of P60.0 billion for the quarter. However, the total oversubscription for the quarter was significantly lower than the P160.7 billion oversubscription in the previous quarter. Sovereign Bond and CDS Spreads The country’s debt spreads showed mixed signals of risk aversion towards the country’s debt papers compared to the previous quarter. The EMBI+Philippine spreads averaged 142 bps, down from the previous quarter’s 150 bps, while CDS spreads widened to an average of 111 bps from 105 bps. Against those of neighboring economies, Philippine CDS traded lower than Indonesia’s average CDS of 208 bps, Thailand’s 146 bps, and Malaysia’s 110 bps. In January, debt spreads climbed on reports of weakening Chinese economy and lingering expectations that the US Fed will continue to cut back stimulus, denting appetite for riskier assets. China’s slowing factory activity in December reinforced views that growth in the world’s second largest economy moderated in the final quarter of 2013. Meanwhile, the “good‐news‐is‐bad‐news” view was seen to drain funds from the region as better economic data in the US further encouraged the US Fed to taper QE measures quickly. As the US Fed prepared (in its January meeting) to unwind more of its asset‐buying program, the market had demanded higher returns on EM assets. Consequently, by end‐January, spreads widened as the US Fed decided to reduce its bond‐buying by another US$10 billion, triggering a flight out of riskier assets. Moreover, anti‐government protests in Ukraine, Thailand, and Turkey likewise dampened market sentiment, contributing further to the widening of debt spreads. In February, widening pressures abated on renewed investors’ preference for EM debt instruments. Recent reports on weak US labor market coupled with a bigger‐than‐expected drop

36
in US home sales have somehow softened the flight‐out‐of‐risky asset trades as expectations on an abrupt US Fed tapering eased. The statement from the new US Fed Chair Janet Yellen, who pledged to maintain her predecessor’s policies of scaling back stimulus in measured steps, also calmed the market and tempered yields of EM bonds from rising. Meanwhile, the faster‐than‐expected recovery in the euro area and China’s higher trade performance also contributed to investors’ positive outlook to the region’s debt papers.
In March, debt spreads continued to fall on the back of easing geopolitical tensions in Ukraine, which prompted a return of risk appetite to high‐yield credit markets, tightening CDS and debt spreads in Asia. In the local front, the lower February inflation was welcome news for the market alongside the strong local corporate earnings report, lifting market sentiment further. However, some widening pressure was seen in the second week of March as lower industrial output and retail sales in China sparked worries about the growth of the world’s second largest economy. Towards the end of the month, debt spreads narrowed owing to speculation of a US rate hike following dovish comments from the US Fed Chairman Yellen, supporting demand for emerging market debt papers.
Banking System Key indicators show sustained resiliency of the banking system.
The Philippine banking system remained sound amid lingering uncertainty in the external environment. Its resource base continued to grow, while asset quality improved steadily. At the same time, capital adequacy ratios (CAR) continued to remain comfortably above the BSP’s and the Bank for International Settlements’ (BIS) minimum requirements. Saving Mobilization Savings and time deposits remained the primary sources of funds for banks. Banks’ total deposits43 as of end‐December 2013 amounted to P6.1 trillion, 36.2 percent higher than its year‐ago
43 This refers to the total peso‐denominated deposits of the banking system.

37
U/KBs account for the largest share in the resource base. Asset quality of Philippine banks improves further.
level of P4.4 trillion. This rapid growth may be attributed to the shift of depositors’ investments from the BSP’s SDA facility to bank deposits owing to the adjustment in the access of trust departments/entities to the BSP SDA facility.44 Savings deposits registered a 32.8 percent growth and continued to account for nearly half of banks’ funding base. Meanwhile, demand deposits expanded y‐o‐y by 34.1 percent, while time deposits increased by 44.2 percent from the year‐ago level. Institutional Developments The total resources of the banking system rose by 8.9 percent to P10.3 trillion as of end‐December 2013 from the quarter‐ and year‐ago levels of P9.5 trillion and P8.4 trillion, respectively. The increase could be traced to the growth in loans, securities and other shares, as well as non‐financial assets. Universal and commercial banks (U/KBs) accounted for more than 90 percent of the total resources of the banking system. The number of banking institutions (head offices) fell to 673 as of end‐December 2013 from the quarter‐ and year‐ago levels of 676 and 696, respectively, indicating continued consolidation of banks, as well as the exit of weaker players in the banking system. By banking classification, banks (head offices) consisted of 36 U/KBs, 71 thrift banks (TBs), and 566 rural banks (RBs). Meanwhile, the operating network (including branches) of the banking system increased to 9,935 in Q4 2013 from 9,720 in Q3 2013 and 9,410 during the same period a year ago, due mainly to the increase in the branches/agencies of U/KBs and TBs. The Philippine banking system’s gross non‐performing loans (GNPL) ratio sustained its downward path, easing to 2.8 percent as of end‐December 201345 from 3.4 percent in
44 Under BSP Memorandum to All Banks/Non‐Bank Financial Institutions dated 17 May 2013, SDA placements of trust departments/entities under the investment management accounts (IMA) must be reduced by at least 30 percent by end‐July 2013 (relative to the outstanding balance as of 31 March 2013) and the remaining balance must be phased out by end‐November 2013. Thus, beginning 1 January 2014, placements of trust departments/entities in the SDA facility must consist only of funds from trust accounts allowed under existing regulations. 45 On 16 October 2012, the BSP amended banks’ reporting standard for NPLs. Beginning with the January 2013 reports, banks have been required to report their “gross” NPLs and their “net” NPLs. Gross NPLs represent the actual level of NPL without any adjustment for loans treated as “loss” and fully provisioned. Net NPLs is just the gross NPLs less specific allowance for credit losses

38
Banks remain adequately capitalized, exceeding prescribed levels set by the BSP and BIS.
end‐December 2012.46 Net NPL ratio also declined to 0.6 percent of TLP from 0.7 percent during the same period in 2012. Banks’ initiatives to improve asset quality along with prudent lending regulations helped bring the GNPL ratio to below its pre‐Asian crisis level of around 3.5 percent. The lower GNPL and NNPL ratios reflected the 5.8 percent (from P143.0 billion to P134.6 billion) and 7.3 percent (from P30.4 billion to P28.2 billion) decline in the levels of GNPLs and NNPLs, respectively, combined with the 15.7 percent expansion in the banking system’s TLP, from P4.2 trillion to P4.9 trillion. In computing for the NNPLs, specific allowances for credit losses47 on TLP are deducted from the GNPLs. The said allowances decreased slightly to P106.4 billion in Q4 2013 from P112.6 billion posted a year ago. Nonetheless, the Philippine banking system’s GNPL ratio of 2.8 percent remained higher compared to Indonesia’s NPL ratio of 1.9 percent, Malaysia’s 1.3 percent, South Korea’s 1.8 percent, and Thailand’s 2.2 percent.48 At the same time, the loan exposure of banks remained adequately covered as the system’s NPL coverage ratio increased to 119.1 percent as of end‐December 2013 from 113.0 percent in end‐December 2012. The higher ratio reflected the banks’ continued compliance with the loan‐loss provisioning requirements of the BSP to ensure adequate buffers against potential credit losses. As of end‐September 2013, the U/KB’s industry CAR stood at 17.5 percent and 18.6 percent on solo and consolidated basis, respectively, both lower than previous year’s 18.0 percent and 19.0 percent. The slight decrease was due to the higher growth of risk weighted assets (RWA) relative to the rise in qualifying capital. Tier 1
on TLP (Circular No. 772, series of 2012).The new reporting standard was driven by the BSP’s intent to be more transparent as it gives a fuller picture of the gross amount of NPLs and the full extent of allowances for probable losses. Under the previous framework, NPLs were reported net of loans considered as “loss” but fully provisioned for. 46 For comparative purposes, the earliest reference period for the banking system’s application of the new reporting standard for GNPL and NNPL ratios is Q1 2013 (Circular No. 772). 47 This type of provisioning applies to loan accounts classified under loans especially mentioned (LEM), substandard‐secured loans, substandard‐unsecured loans, and doubtful accounts and loans considered as loss accounts. 48Sources: Various central bank websites, IMF and financial stability reports, Indonesia (banking system, Oct 2013); Malaysia (banking system, Q4 2013); Thailand (banking system, Q3 2013); and South Korea (banking system, Q3 2012).

39
ratios was at 16.4 percent and 16.5 percent on solo and consolidated basis, respectively. The Philippine banking system’s CAR on a consolidated basis at 18.6 percent was higher than those of Indonesia (18.4 percent), Malaysia (14.3 percent), Thailand (15.7 percent), and South Korea (14.3 percent).49
Exchange Rate The peso weakens on continued uncertainties on the external front.
36
38
40
42
44
46
48
50
Q1 2009 Q2
Q3
Q4
Q1 2010 Q2
Q3
Q4
Q1 2011 Q2
Q3
Q4
Q1 2012 Q2
Q3
Q4
Q1 2013 Q2
Q3
Q4
Q1 2014
Php/US$
Quarterly Peso‐Dollar Rate
Q1 2014P44.87/US$1
The peso averaged P44.87/US$1 in Q1 2014, depreciating by 2.8 percent from the previous quarter’s average of P43.61/US$1.50 On a y‐o‐y basis, the peso depreciated by 9.3 percent from the P40.70/US$1 average in Q1 2013. The lingering uncertainty in the actions of the US Fed regarding its QE program, combined with investor concerns that the economy may be overheating weighed down the peso. In January, the peso weakened to average P44.93/US$1 relative to the previous month’s average of P44.10/US$1 as positive data suggesting the strong recovery of the US economy and comments by some US Fed officials signaling further QE tapering fueled the sell‐off of EM currencies. On 28 February, the exchange rate breached the P45.00/US$1‐barrier, reaching its peak of P45.40/US$1, as investors’ sentiments were dampened by the prospects of continued high Philippine inflation, along with signs of a deeper economic slowdown in China. Nonetheless, the peso slightly recovered in February as it averaged P44.90/US$1 on US Fed’s clarification of its forward guidance51, which helped restore stability in the market. In March, the peso strengthened further to average P44.79/US$1 despite continued pressures in the external front—including the conflict in Ukraine and the announcement by US Fed Chairman Janet Yellen on the timeline for ending the QE and raising policy rates. The above‐target Philippine GDP growth of 7.2 percent in 2013, the sustained
49 Sources: Various central bank websites, IMF and financial stability reports, Indonesia (banking system, October 2013); Thailand (banking system Q4 2013); Malaysia (banking system, Q4 2013); and Korea (banking system, Q3 2013). 50 The reciprocal of the peso‐dollar rates was used to compute for the percentage change. 51 Despite improving unemployment figures, US Fed Chairman Janet Yellen affirmed that broader indicators (other than the unemployment threshold) will be taken into consideration with regard to the pace of tapering and the eventual tightening of monetary policy.

40
Changes in Selected Dollar Rates
Year‐to‐date
Appr./(Depr.), in percent
27 Dec ’13* 31 Mar ‘14**
Philippine peso ‐7.53 ‐0.94
Thai baht (onshore) ‐6.74 0.88
Chinese yuan 2.67 ‐2.69Malaysian ringgit ‐6.98 0.30South Korean won 1.02 ‐1.39Singaporean dollar ‐3.56 0.19New Taiwan dollar ‐2.99 ‐2.15Indonesian rupiah ‐20.22 3.57Japanese yen ‐17.13 2.28
Source: Bloomberg, Reuters and PDEX
• As of 4:00 p.m., 27 December 2013
** As of 4:00 p.m., 31 March 2014
inflows of foreign exchange from OF remittances, foreign portfolio investments, foreign direct investments, and the ample level of the country’s gross international reserves continued to provide broad stability to the peso during the review quarter.52 On a ytd basis, the peso depreciated against the US dollar by 0.94 percent as it closed at P44.82/US$1 on 31 March 2014, moving in tandem with the Chinese yuan, Korean won, and the Taiwanese dollar.53 Meanwhile, volatility, as measured by the coefficient of variation (COV) of the peso’s daily closing rates was lower at 0.01 percent in Q1 2014 compared with 1.1 percent in the previous quarter, reflecting relative stability in financial markets following clarifications from the US Fed of its forward guidance.54
On a real trade‐weighted basis, the peso lost external price competitiveness against the basket of currencies of all major trading partners (MTPs) and trading partners in advanced and developing countries during the review quarter.55 The real effective exchange rate (REER) index of the peso increased q‐o‐q by 2.1 percent, 3.7 percent, and 1.1 percent, vis‐a‐vis the currencies of MTPs, advanced, and developing trading partners, respectively, to reach 86.91 index points, 82.52 index points, and 114.10 index points.56 This developed as the impact of increased inflation differential more than offset the nominal depreciation of the peso vis‐à‐vis trading partners’ currencies.
52 Gross International reserves rose to US$80.3 billion as of end‐February 2014 (preliminary) from US$79.5 billion as of end‐January 2014. 53 Based on the last done deal in the afternoon. 54 The coefficient of variation is computed as the standard deviation of the daily exchange rate divided by the average exchange rates for the period. 55 The Trading Partners Index (TPI) measures the nominal and real effective exchange rates of the peso across the currencies of 14 major trading partners of the Philippines, which includes US, Euro Area, Japan, Australia, China, Singapore, South Korea, Hong Kong, Malaysia, Taiwan, Indonesia, Saudi Arabia, United Arab Emirates, and Thailand. The TPI‐Advanced measures the effective exchange rates of the peso across currencies of trading partners in advanced countries comprising of the US, Japan, Euro Area, and Australia. The TPI‐Developing measures the effective exchange rates of the peso across 10 currencies of partner developing countries which includes China, Singapore, South Korea, Hong Kong, Malaysia, Taiwan, Indonesia, Saudi Arabia, United Arab Emirates, and Thailand. 56 The REER index represents the Nominal Effective Exchange Rate (NEER) index of the peso, adjusted for inflation rate differentials with the countries whose currencies comprise the NEER index basket. A decrease in the REER index indicates some gain in the external price competitiveness of the peso, while a significant increase indicates the opposite. The NEER index, meanwhile, represents the weighted average exchange rate of the peso vis‐à‐vis a basket of foreign currencies.

41
Meanwhile, on a y‐o‐y basis, the peso gained external price competitiveness against the basket of currencies of MTPs and trading partners in advanced and developing countries given the peso’s real depreciation of 4.4 percent, 3.0 percent, and 5.3 percent, respectively. Relative to previous year, the nominal depreciation of the peso offset sufficiently the impact of widening inflation differential.

42
NG posts higher deficit in January 2014. National Government Fiscal PerformanceIn billion pesos
January Growth
(%)2013 2014
Surplus/(Deficit) ‐19.5 ‐34.2 75.0Revenues 138.4 148.8 8.0
Expenditures 157.9 183.0 16.0
*Totals may not add up due to roundingSource: BTR
The fiscal deficit in January 2014 was P34.2 billion, higher than the P19.5 billion deficit incurred during the same period in 2013. Meanwhile, netting out the interest payments in the expenditures, the primary surplus amounted to P22.2 billion, 37.0 percent lower than the level recorded in January 2013. Revenue collections rose by 8.0 percent to P148.8 billion in January 2014 compared to P138.4 billion in the same period in 2013, mainly due to higher collections by the Bureau of Internal Revenue (BIR). The BIR and the Bureau of Customs contributed P104.2 billion and P29.8 billion, respectively, to total revenues, which represent an increase of 10.0 percent and 21.0 percent, respectively, compared to their levels a year ago. By contrast, collections by the Bureau of the Treasury decreased to P7.5 billion from P9.4 billion in the same period in 2013. Revenues from other offices also declined by 25.0 percent to P7.4 billion. Expenditures in January 2014 amounted to P183.0 billion, 16.0 percent higher than the expenditures a year ago. Excluding interest payments, expenditures increased by 23.0 percent to P126.6 billion. Interest payments were also higher by 3.0 percent to reach P56.5 billion.
III. FISCAL DEVELOPMENTS

43
IV. EXTERNAL DEVELOPMENTS Global growth prospects are broadly steady with risks to the outlook on the downside. The outlook for the US economy remains generally upbeat.
The JP Morgan Global All‐Industry Output Index continued to signal an expansion in overall output at 53.0 in February from 54.0 in January. The slight decline in the index reflected a slowdown in services output owing to adverse weather conditions, particularly in the US and Japan. Nonetheless, manufacturing output growth remained relatively robust given solid demand.57 The IMF expects global economic activity to continue to improve going forward, mainly on account of the recovery in AEs. In its January 2014 WEO Update, the IMF projects world output to expand by 3.7 percent in 2014 and by 3.9 percent in 2015. However, the risks to the growth outlook remain tilted to the downside. For emerging economies, increased volatility in financial markets remains a concern in view of the US Fed’s tapering of its monetary stimulus. Combined with domestic sources of weaknesses, uncertainty could result in sharp capital flow reversals and exchange rate adjustments. For AEs, meanwhile, persistent below‐target inflation in these economies could pose a risk to economic activity. Meanwhile, global inflation pressures remain broadly subdued. The inflation environment in AEs continues to be benign, as output gaps are expected to stay substantial even with the pickup in activity. However, inflation has risen in some emerging economies owing to domestic supply factors. Real GDP increased by 2.4 percent q‐o‐q in Q4 2013, slower than the 4.1‐percent expansion recorded in the previous quarter. On a y‐o‐y basis, real GDP grew by 2.5 percent. The deceleration during the quarter reflected the slowdown in private inventory and residential fixed investment as well as a larger decrease in federal, state, and local government spending.58
57 JP Morgan Global Manufacturing & Services PMI, http://www.markiteconomics.com/Survey/PressRelease.mvc/90d6571ed14f442d8ac0a59d7592a77f 58 Bureau of Economic Analysis. http://www.bea.gov/newsreleases/national/gdp/2014/pdf/gdp4q13_2nd.pdf. The second estimate for q‐o‐q GDP growth is also lower than the advance estimate of 3.2 percent released on 30 January 2014.

44
Economic activity in the euro area gains further traction.
The manufacturing PMI rose to 53.2 in February from 51.3 in January, reflecting the faster increase in new orders. Survey respondents were generally upbeat given the solid momentum in the manufacturing industry, although a few noted that adverse weather conditions hampered operations.59 Inflation eased to 1.1 percent in February from 1.6 percent in January due mainly to the decline in the index for energy, particularly gasoline. Meanwhile, the unemployment rate rose slightly to 6.7 percent in February from 6.6 percent in January. Total nonfarm payroll employment increased by 175,000 during the month. Job gains were noted mainly in professional and business services. Consumer confidence remained high during the quarter on the general assessment of improving economic conditions. The Conference Board Consumer Confidence Index rebounded to 82.3 in March from 78.3 in February,60 while the Thomson‐Reuters/University of Michigan Index of Consumer Sentiment was essentially unchanged at 81.6 in February from 81.2 in January.61 Real GDP in the euro area grew by 0.3 percent q‐o‐q in Q4 2013, slightly faster than the 0.1‐percent q‐o‐q expansion in Q3 2013. On a y‐o‐y basis, real GDP expanded by 0.5 percent following a contraction of 0.3 percent in Q3 2013.62 The flash composite PMI for the euro area was broadly steady at 53.2 in March from 53.3 in February. The increase in the PMI was driven by the growth in new business in both the manufacturing and services sectors, signaling a continuing improvement in domestic demand. Activity in most major economies remained robust, with output returning to expansion in
59 Institute for Supply Management, “ February 2014 Manufacturing ISM Report On Business”, 3 March 2014, http://www.ism.ws/ISMReport/MfgROB.cfm 60 “The Conference Board Consumer Confidence Rebounds in March.” 25 March 2014. http://www.conference‐board.org/data/consumerconfidence.cfm 61 “Weather Freezes Confidence in Place.” 28 February 2014. http://press.sca.isr.umich.edu/press/press_release 62 Eurostat news release 34/2014 dated 5 March 2014.

45
The recovery in Japan continues at a steady pace. Latest available Indicators point to subdued economic activity in China.
France. However, the rate of output growth slowed in Germany.63 The European Commission’s Economic Sentiment Indicator for the euro area was broadly unchanged at 101.2 in February from 101.0 in January. Sentiment in construction, services, retail trade, and industry was slightly more positive, while consumer confidence weakened due in part to increased expectations of unemployment. The seasonally adjusted unemployment rate remained high at 12.0 percent in January 2014 for the fourth consecutive month since October 2013.64 Meanwhile, inflation eased further to 0.7 percent in February from 0.8 percent in the previous month.65 Real GDP rose by 0.2 percent q‐o‐q in Q4 2013, matching the pace of expansion in Q3 2013. On a y‐o‐y basis, real GDP growth was faster at 2.6 percent in Q4 2013 compared to 2.3 percent in the previous quarter.66 Moreover, the seasonally adjusted manufacturing PMI continued to indicate solid output growth despite slipping slightly to 55.5 in February from 56.6 in January. New domestic orders strengthened ahead of the increase in sales taxes, while growth in export orders eased modestly.67 Inflation rose to 1.5 percent y‐o‐y in February from 1.4 percent y‐o‐y in January. Meanwhile, the seasonally adjusted unemployment rate held steady at 3.7 percent in January. Real GDP growth eased slightly to 7.7 percent y‐o‐y in Q4 2013 from 7.8 percent in the previous quarter, bringing full‐year growth to 7.7 percent. The seasonally adjusted flash manufacturing PMI likewise softened to its lowest level in eight months at 48.1 in March from 48.5 in February, as output contracted due to the continued weakness in domestic demand.
63 Markit Flash Eurozone Composite PMI, http://www.markiteconomics.com/Survey/PressRelease.mvc/32ff643865a64f0d8b398fa42e9a575d 64 Eurostat news release 30/2014 dated 28 February 2014. 65 Eurostat news release 40/2014 dated 17 March 2014. 66 Second estimates by the Department of National Accounts, Economic and Social Research Institute, Cabinet Office. http://www.esri.cao.go.jp/jp/sna/data/data_list/sokuhou/files/2013/qe134_2/pdf/jikei_1.pdf 67 http://www.markiteconomics.com/Survey/PressRelease.mvc/18431136559044cfbbe099e870c915b5

46
Growth conditions in India remain weak. A number of central banks adjust their monetary policy settings in response to evolving economic conditions.
Inflation likewise declined to 2.0 percent in February from 2.5 percent in January. Inflation was driven by the increase in the prices of food, particularly fresh fruits, aquatic products, and vegetables. Real GDP growth eased to 4.7 percent in Q4 2013 from 4.8 percent in the previous quarter. Meanwhile, the composite PMI rose to 50.3 in February from 49.6 in the previous month, indicating a modest rate of expansion in manufacturing output. However, output in the services sector continued to decline due to lower levels of incoming new work. Inflation decelerated further to 4.7 percent in February from 5.1 percent in January due to the decline in the indices for food products as well as fuel and power. The majority of central banks monitored by the BSP decided to maintain their respective policy rates during the quarter amid broadly benign inflation pressures and a steady pace of economic activity. On 12 March, the Bank of Thailand reduced its key policy rate by 25 bps to 2.0 percent to bolster the Thai economy as prolonged political unrest curbed domestic demand and hurt tourism. By contrast, the Reserve Bank of New Zealand raised its official cash rate by 25 bps to 2.75 percent during its meeting on 13 March, with the aim of ensuring that inflation stays near the 2.0‐percent midpoint target as the economy continued to expand. Meanwhile, on 19 March, the US Fed decided to reduce further the pace of its asset purchases from a total of US$65 billion to US$55 billion per month beginning in April, following earlier pronouncements to reduce bond purchases by US$10 billion each month in January and February 2014. The recent decision was based on the assessment that recent improvements in economic activity and labor market conditions were consistent with the growing underlying strength in the US economy.

47
V. MONETARY POLICY DEVELOPMENTS The BSP keeps key policy rates steady during the quarter...
0
1
2
3
4
5
6
7
Jan 2011 Feb
Mar
Apr
May Jun
Jul
Aug Sep
Oct
Nov
Dec
Jan 2012 Feb
Mar
Apr
May Jun
Jul
Aug Sep
Oct
Nov
Dec
Jan 2013 Feb
Mar
Apr
May Jun
Jul
Aug Sep
Oct
Nov
Dec
Jan 2014 Feb
Mar
in percent
BSP Policy Rates
Overnight RRP Rate Overnight RP rate SDA rate
… but adjusts the reserve requirement for banks.
During its monetary policy meetings on 3 February and 27 March, the BSP decided to maintain its key policy interest rates at 3.50 percent for the overnight borrowing or reverse repurchase (RRP) facility and 5.50 percent for the overnight lending or repurchase (RP) facility. The interest rates on term RRPs, RPs and SDA were also maintained. In deciding to maintain policy rates, the Monetary Board (MB) noted that the future inflation path is likely to stay within the target ranges of 4.0 percent ± 1.0 ppt for 2014 and 3.0 percent ± 1.0 ppt for 2015. Inflation expectations also remained broadly aligned with the target over the policy horizon. At the same time, the MB was of the view that the balance of risks to the inflation outlook continued to be skewed to the upside, with potential price pressures emanating from pending petitions for adjustments in utility rates and from possible increases in food and oil prices. However, the MB decided to raise the reserve requirement of banks by 1 ppt. This adjustment was intended to guard against potential risks to financial stability that could arise from continued strong liquidity growth and rapid credit expansion. The MB concluded that buoyant domestic growth prospects allowed some scope for a measured adjustment in the BSP’s policy instruments amid the ongoing normalization of monetary policy overseas. Going forward, the BSP will continue to monitor emerging price and output conditions and will consider further adjustments in its monetary policy tools as necessary to safeguard price and financial stability.

48
VI. INFLATION OUTLOOK
BSP Inflation Forecasts Results of the BSP’s latest forecasting exercises indicate within‐target inflation over the policy horizon.
The inflation environment is expected to remain manageable against a backdrop of expanding productive capacity of the domestic economy. Emerging baseline forecasts showed within‐target inflation over the medium term. The latest BSP forecasts show that the 2014 and 2015 inflation rates could fall within the target ranges of 4.0 percent ± 1.0 ppt and 3.0 percent ± 1.0 ppt, respectively. Demand Conditions Key demand indicators support the view of continued vigor in domestic real sector activity. Driven by sustained growth in fixed capital formation, steady household spending, and improvement in external trade, domestic output in Q4 2013 registered its eighth consecutive quarter of growth of at least 6.0 percent. The relatively strong fourth quarter GDP expansion occurred amid a series of natural calamities, reflecting the underlying momentum of the domestic economy. This brought the full‐year output growth to 7.2 percent, exceeding the DBCC full‐year target of 6.0 ‐ 7.0 percent. Likewise, other demand indicators support the view of a healthy domestic economy. Production indices for the manufacturing sector suggest continued expansion with more than half of all major manufacturing sectors registering capacity utilization greater than 80 percent. The optimistic outlook for real sector activity has also been reflected in the generally upbeat sentiment of businesses in the country. Results of the latest BSP BES pointed to a bullish quarter‐ahead business outlook owing to expectations of brisker demand during the secondary harvest season, school graduation and enrollment period and summer season, and new construction projects, boosted by rehabilitation efforts after Typhoon Yolanda. Similarly, latest BSP CES indicated improved consumer confidence in the

49
current quarter, which continued to be more favorable in the next quarter due to expectations of more job opportunities and good weather conditions. Supply Conditions Commodity prices have thus far remained manageable. Supply prospects appear to be generally favorable. However, the onset of the lean season in the rice production cycle and geopolitical tensions abroad could pose upside risks to commodity prices. The FAO Cereal Supply and Demand Brief indicates that the outlook for world cereal production for 2014 remains favorable. Prospects for wheat production in the northern hemisphere and maize production in the southern hemisphere appear to be generally robust. Meanwhile, the outlook for rice production remains mixed with Brazil reporting sizeable expansion, while harvest could fall in other South American producers, Sri Lanka and Australia. Ample global cereal stocks should also help moderate food price movements. The global cereal stocks‐to‐use ratio was estimated by FAO at 23.5 percent in 2013, the highest since 2002.68 On the domestic front, the AHFF sector increased by 1.1 percent in Q4 2013, slower than the 4.9 percent expansion in the same quarter a year ago. The slower growth in agricultural output could be attributed to lower production of corn, coconut (including copra), coffee, banana, sugarcane and other crops. In contrast, higher production was recorded for palay, cassava, poultry, pineapple, rubber, mango and livestock. Meanwhile, the fishery subsector contracted by 4.4 percent.69 Looking ahead, the BAS anticipates palay production to increase by 8.5 percent in the first quarter of 2014 from 4.2 million MT in the same period last year. The bulk of the increase in palay production is expected to come from areas affected by typhoons Santi and Yolanda as a result
68 FAO, Cereal Supply and Demand Brief, 28 February 2014, available online at http://www.fao.org 69 PSA, National Accounts of the Philippines, Q4 2013

50
Output gap estimate widens.
of the immediate replanting of damaged areas. For the second quarter of 2014, palay harvest is expected to be higher by 2.1 percent compared to the same period a year ago. This translates to a 5.4 percent increase in the first semester 2014 palay output. Meanwhile, the BAS projects corn output to increase by 6.2 percent and 17.4 percent in the first quarter and the second quarter of 2014, respectively, bringing the first semester corn output growth at 9.8 percent.70 Meanwhile, spot prices of crude oil are lower compared to the previous quarter while future prices follow a similar easing trend. The Energy Information Administration (EIA) expects international oil prices to soften as the projected increase in non‐OPEC supply exceeds estimated growth in world consumption. Nonetheless, the Institute for International Finance (IIF) continues to identify a possible spike in crude oil prices due to supply disruptions as one of its top six risks for the global economy for 2014. The IIF assigns a 10‐percent probability of this risk occurring.71 The balance of demand and supply conditions as captured by the output gap (or the difference between actual and potential output), provides an indication of potential inflationary pressures in the near term. Inflation tends to rise (fall) when demand for goods and services exert pressure on the economy’s ability to produce goods and services, i.e., when the output gap is positive (negative). Based on the latest GDP data, preliminary estimates by the BSP show a higher positive output gap in Q4 2013 relative to the previous quarter, due mainly to expansion in actual output (seasonally‐adjusted) outpacing the growth in potential output during the review period.
70 PSA, Rice and Corn Situation Outlook, January 2014 71 Institute of International Finance (IIF), Global Economic Monitor, February 2014, available at http://www.iif.com

51
Key assumptions used to generate the BSP’s inflation forecasts The BSP's baseline inflation forecasts generated from the BSP’s single equation model (SEM), and the multi‐equation model (MEM) are based on the following assumptions:
1) NG fiscal deficits for 2014 to 2015, which are consistent with the DBCC‐approved estimates;
2) BSP’s overnight RRP rate at 3.5 percent from April 2014 to December 2015;
3) Dubai crude oil price assumptions, the trend of which is consistent with the trend of the futures prices of oil in the international market;
4) Increase in nominal wage of 6.4 percent in October 2014 and 6.0 percent in October 2015;
5) Real GDP growth, which is endogenously‐determined in the BSP’s MEM; and
6) Foreign exchange rate, which is endogenously‐determined in the BSP’s MEM through the purchasing power parity and interest rate parity relationships.
Risks to the Inflation Outlook
The current fan chart suggests that inflation could remain manageable over the policy horizon but upside risks have increased slightly.
The risks to the inflation outlook may be presented graphically through a fan chart. The fan chart depicts the probability of different inflation outcomes based on the central projection (corresponding to the baseline forecast of the BSP) and the risks surrounding the inflation outlook. Compared to the previous report, the latest fan chart presents a downward adjustment in central inflation projections for 2014 and broadly unchanged central forecasts for 2015. The lower inflation path in the latest report could be attributed to the decline in petroleum prices.

52
The risks to the inflation outlook continue to be skewed to the upside. Upside pressures emanate from possible increases in food and oil prices and pending petitions for adjustments in utility rates.
While the central forecasts over the policy horizon have slightly declined, the entire width of the fan chart has shifted up. This reflects the BSP’s assessment of the latest balance of risks to future inflation. Relative to the previous quarter, the fan chart indicates that upside risk to inflation have increased slightly. The BSP’s review of current price trends and risks to future inflation suggests that the risks to future inflation are biased slightly to the upside. This assessment is captured in the latest fan chart by the relatively larger bands above the central projection compared to the bands below. Potential increases in rice prices and increased volatility in oil prices owing to geopolitical tensions alongside pending petitions for power rate adjustments could result into higher inflation than the central forecasts. The onset of the lean season has pushed up nationwide rice prices. Timely importation would be necessary to moderate the observed increase in the rice price. In addition, tensions in Russia and Ukraine could translate to volatility in oil prices. Russia is a large producer and exporter of crude oil and natural gas while Ukraine’s strategic position makes it an important transit point for natural gas supplies to Europe. Thus, a worsening of situation has the potential to generate supply disruptions and large jumps in global oil prices. Although not as high as initially petitioned, Meralco would still implement cost recoveries from the higher generation rates posted in November and December, when power plants implemented maintenance shutdowns. The rate adjustments would be lower than earlier estimates as the ERC has declared that regulated rate would be used for re‐computation subject to the payment of full fuel costs to oil‐based plants. If warranted other distribution utilities are also required to implement the recomputed rates.72 Thus, utility rate adjustments continue to pose upside risk to inflation forecasts.
72 ERC, ERC Voids Nov‐Dec 2013 WESM Prices, 11 March 2014, available online at http://www.erc.gov.ph

53
0
1
2
3
4
5
6
7
8
9
10
Q4 Q1 Q2 Q3 Q4 Q1 Q2 Q3 Q4 Q1 Q2 Q3 Q4
Year‐on‐Year Inflation
2013 2014 2015
As of 12 December 2013 Monetary Board Meeting
As of 27 March 2014 Monetary Board Meeting
The fan chart shows the probability of various outcomes for inflation over the forecast horizon. The darkest band depicts the central projection, which corresponds to the BSP’s baseline inflation forecast. It covers 25 percent of the probability distribution. Each successive pair of bands is drawn to cover a further 25 percent of probability, until 75 percent of the probability distribution is covered. Lastly, the lightest band covers the lower and upper 90 percent of the probability distribution. The bands widen (i.e., “fan out”) as the time frame is extended, indicating increasing uncertainty about outcomes. The band in wire mesh depicts the inflation profile in the previous report. The shaded area, which measures the range of uncertainty, is based on the forecast errors from the past years. In greater detail, it can be enhanced by adjusting the level of skewness of the downside and upside shocks that could affect the inflationary process over the next two years in order to change the balance of the probability area lying above or below the central projection.

54
VII. IMPLICATIONS FOR THE MONETARY POLICY STANCE
The average headline inflation is projected to be within the inflation target range over the policy horizon. Inflation expectations are still within target, but moving near the upper end of the target range for 2015. Domestic demand indicators continue to show positive readings in the first quarter. Prospects for global economic growth have continued to improve, mainly on account of the recovery in advanced economies.
The latest average baseline inflation forecasts show that the 2014 and 2015 inflation rates are likely to settle within the target ranges of 4.0 percent ± 1.0 ppt and 3.0 percent ± 1.0 ppt, respectively. Compared with that from the previous report, the latest fan chart presents a slight downward shift in inflation projections for 2014 and largely unchanged central path for 2015. However, upside risk to the inflation outlook has increased. The balance of risks to the inflation path remains skewed to the upside due mainly to some upside pressures from supply‐related factors. Potential upside pressures are linked to possible increases in food and oil prices and pending petitions for adjustments in utility rates. Results of the BSP’s survey of private sector economists for March 2014 yielded higher but still within‐target inflation forecasts for 2014‐2015 relative to the results in December 2013. Similarly, results of the March 2014 Consensus Economics inflation forecast survey pointed to higher inflation projection for 2014 relative to the December 2013 survey. Furthermore, the inflation forecasts for 2015 are relatively elevated and are nearing the upper‐end of the range. Favorable readings for higher‐frequency demand indicators, including vehicle and energy sales, manufacturing capacity utilization, and PMI, support the view of sustained expansion in domestic economic activity in the near future. Favorable consumer and business sentiment, based on the results of various BSP expectations surveys, is also expected to bolster the growth momentum going forward. The outlook for the US economy remains generally upbeat on robust domestic demand, while economic activity in the euro area and Japan has gained further traction. However, the pace of growth in major emerging markets, particularly in China and India, has remained tepid.

55
Domestic liquidity growth has remained relatively strong after the full unwinding of the non‐trust account placements in the SDA facility in November.
Domestic liquidity growth accelerated to 36.4 percent in February 2014 from 32.7 percent in end‐Q4 2013. Growth in domestic liquidity continued to be strong in recent months with more loanable funds deployed to support domestic economic activity as evident in the robust growth in bank lending. While the inflation forecasts have remained within target, continued strong liquidity expansion, if sustained, could exert inflationary pressures over the policy horizon and contribute to the build‐up of financial stability risks. On balance, the prevailing monetary conditions and inflation dynamics suggest that the space to keep monetary policy settings unchanged is narrowing. Going forward, the BSP will remain guided by its primary objective of maintaining price stability along with safeguarding the resilience of the financial system. The BSP stands ready to deploy appropriate measures as needed to ensure sustainable, non‐inflationary, and inclusive economic growth.

56
SUMMARY OF MONETARY POLICY DECISIONS
EFFECTIVITY DATE LEVELS (IN %)
MONETARY POLICY DECISION RRP OVERNIGHT RP OVERNIGHT
2008 JAN 31 5.00 7.00 The Monetary Board (MB) decided to reduce by 25 basis points (bps) the BSP’s key policy interest rates to 5 percent for the overnight borrowing or reverse repurchase (RRP) facility and 7 percent for the overnight lending or repurchase (RP) facility. The interest rates on term RRPs, RPs, and special deposit accounts (SDAs) were also reduced accordingly. In its assessment of macroeconomic conditions, the MB noted that the latest inflation forecasts indicated that inflation would fall within the 4.0 percent ± 1 percentage point target range in 2008 and the 3.5 ± 1 percentage point target range in 2009.
MAR 13 5.00 7.00 The MB decided to keep the BSP’s key policy interest rates at 5 percent for the overnight borrowing or RRP facility and 7 percent for the overnight lending or RP facility. The MB also decided to implement immediately the following refinements in the SDA facility: (1) the closure of existing windows for the two‐, three‐, and six‐month tenors; and (2) the reduction of the interest rates on the remaining tenors. The interest rates on term RRPs and RPs were also left unchanged.
APR 24 5.00 7.00 The MB kept the BSP’s key policy interest rates at 5.0 percent for the overnight borrowing or RRP facility and 7.0 percent for the overnight lending or RP facility. The interest rates on term RRPs and RPs were also left unchanged.
JUN 5 5.25 7.25 The MB decided to increase by 25 bps the BSP’s key policy interest rates to 5.25 percent for the RRP facility and 7.25 percent for RP facility as emerging baseline forecastsindicate a likely breach of the inflation target for 2008 along with indications that supply‐driven pressures are beginning to feed into demand. Given the early evidence of second‐round effects, the MB recognized the need to act promptly to rein in inflationary expectations. The interest rates on term RRPs, RPs, and SDAs were also increased accordingly.
JUL 17 5.75 7.75 The MB increased by 50 bps the BSP’s key policy interest rates to 5.75 percent for the overnight borrowing or RRP facility and 7.75 percent for the overnight lending or RP facility. The interest rates on term RRPs, RPs, and SDAs were also increased accordingly.
AUG 28 6.00 8.00 The MB increased by 25 bps the BSP’s key policy interest rates to 6.0 percent for the overnight borrowing or reverse repurchase (RRP) facility and 8.0 percent for the overnight lending or repurchase (RP) facility. The interest rates on term RRPs, RPs, and SDAs were also increased accordingly.
OCT 6 6.00 8.00 The MB kept the BSP’s key policy interest rates unchanged at 6.0 percent for RRP facility and 8.0 percent for the RP facility. The interest rates on term RRPs, RPs, and SDAs were also left unchanged.
NOV 6 6.00 8.00 The MB decided to keep the BSP’s key policy interest rates steady at 6 percent for the overnight borrowing or RRP facility and 8 percent for the overnight lending or RP facility. The interest rates on term RRPs, RPs, and SDAs were also left unchanged.
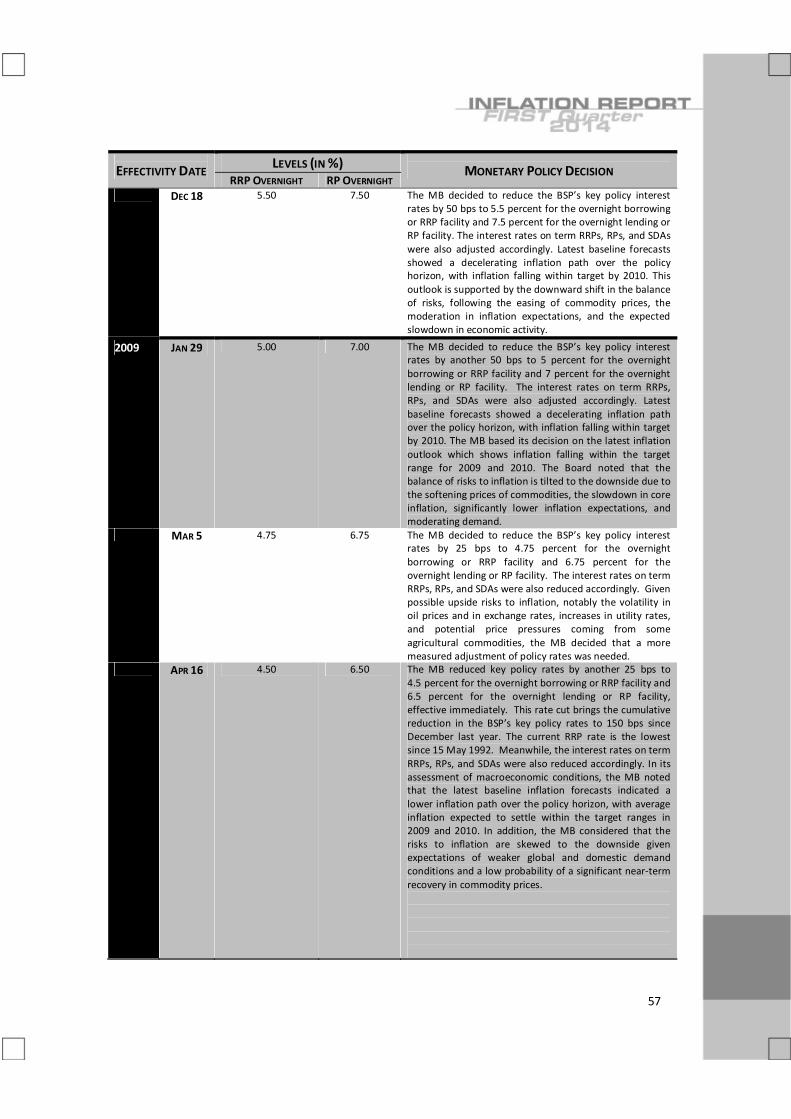
57
EFFECTIVITY DATE LEVELS (IN %)
MONETARY POLICY DECISION RRP OVERNIGHT RP OVERNIGHT
DEC 18 5.50 7.50 The MB decided to reduce the BSP’s key policy interest rates by 50 bps to 5.5 percent for the overnight borrowing or RRP facility and 7.5 percent for the overnight lending or RP facility. The interest rates on term RRPs, RPs, and SDAs were also adjusted accordingly. Latest baseline forecasts showed a decelerating inflation path over the policy horizon, with inflation falling within target by 2010. This outlook is supported by the downward shift in the balance of risks, following the easing of commodity prices, the moderation in inflation expectations, and the expected slowdown in economic activity.
2009 JAN 29 5.00 7.00 The MB decided to reduce the BSP’s key policy interest rates by another 50 bps to 5 percent for the overnight borrowing or RRP facility and 7 percent for the overnight lending or RP facility. The interest rates on term RRPs, RPs, and SDAs were also adjusted accordingly. Latest baseline forecasts showed a decelerating inflation path over the policy horizon, with inflation falling within target by 2010. The MB based its decision on the latest inflation outlook which shows inflation falling within the target range for 2009 and 2010. The Board noted that the balance of risks to inflation is tilted to the downside due to the softening prices of commodities, the slowdown in core inflation, significantly lower inflation expectations, and moderating demand.
MAR 5 4.75 6.75 The MB decided to reduce the BSP’s key policy interest rates by 25 bps to 4.75 percent for the overnight borrowing or RRP facility and 6.75 percent for the overnight lending or RP facility. The interest rates on term RRPs, RPs, and SDAs were also reduced accordingly. Given possible upside risks to inflation, notably the volatility in oil prices and in exchange rates, increases in utility rates, and potential price pressures coming from some agricultural commodities, the MB decided that a more measured adjustment of policy rates was needed.
APR 16 4.50 6.50 The MB reduced key policy rates by another 25 bps to 4.5 percent for the overnight borrowing or RRP facility and 6.5 percent for the overnight lending or RP facility, effective immediately. This rate cut brings the cumulative reduction in the BSP’s key policy rates to 150 bps since December last year. The current RRP rate is the lowest since 15 May 1992. Meanwhile, the interest rates on term RRPs, RPs, and SDAs were also reduced accordingly. In its assessment of macroeconomic conditions, the MB noted that the latest baseline inflation forecasts indicated a lower inflation path over the policy horizon, with average inflation expected to settle within the target ranges in 2009 and 2010. In addition, the MB considered that the risks to inflation are skewed to the downside given expectations of weaker global and domestic demand conditions and a low probability of a significant near‐term recovery in commodity prices.

58
EFFECTIVITY DATE LEVELS (IN %)
MONETARY POLICY DECISION RRP OVERNIGHT RP OVERNIGHT
MAY 28 4.25 6.25 The MB decided to reduce the BSP’s key policy interest rates by another 25 bps to 4.25 percent for the overnight borrowing or RRP facility and 6.25 percent for the overnight lending or RP facility. The interest rates on term RRPs, RPs, and SDAs were also reduced accordingly. Baseline forecasts indicated a lower inflation path over the policy horizon, with average inflation expected to settle within the target ranges in 2009 and 2010. In addition, the Monetary Board considered that, on balance, the risks to inflation are skewed to the downside given expectations of weaker global and domestic demand conditions and a low probability of a significant near‐term recovery in commodity prices.
JUL 9 4.00 6.00 The MB decided to reduce the BSP's key policy interest rates by 25 bps to 4 percent for the overnight borrowing or RRP facility and 6 percent for the overnight lending or RP facility, effective immediately. The interest rates on term RRPs, RPs, and SDAs were reduced accordingly. This is the sixth time since December 2008 that the BSP has cut its policy interest rates.
AUG 20 OCT 1 NOV 5 DEC 17
4.00
6.00
The MB kept key policy rates unchanged at 4 percent for the RRP facility and 6 percent for the overnight lending RP facility. The decision to maintain the monetary policy stance comes after a series of policy rate cuts since December 2008 totaling 200 bps and other liquidity enhancing measures.
2010
JAN 28 MAR 11 APR 22 JUN 3 JUL 15 AUG 26 OCT 7 NOV 18 DEC 29
The MB decided to keep the BSP's key policy interest rates steady at 4 percent for the RRP facility and 6 percent for the RP facility. The interest rates on term RRPs, RPs, and SDAs were also left unchanged.
2011 FEB 10 4.00 6.00 The MB decided to keep the BSP’s key policy interest rates steady at 4 percent for the overnight borrowing or RRP facility and 6 percent for the overnight lending or RP facility. The interest rates on term RRPs, RPs, and SDAs were also left unchanged.
MAR 24 4.25 6.25 The MB decided to increase by 25 bps the BSP’s key policy interest rates to 4.25 percent for the overnight borrowing or RRP facility and 6.25 percent for the overnight lending or RP facility. The interest rates on term RRPs, RPs, and SDAs were also raised accordingly. The MB’s decision was based on signs of stronger and broadening inflation pressures as well as a further upward shift in the balance of inflation risks. International food and oil prices have continued to escalate due to the combination of sustained strong global demand and supply disruptions and constraints.

59
EFFECTIVITY DATE LEVELS (IN %)
MONETARY POLICY DECISION RRP OVERNIGHT RP OVERNIGHT
MAY 5 4.50 6.50 The MB decided to increase the BSP’s key policy interest rates by another 25 bps to 4.5 percent for the overnight borrowing or RRP facility and 6.5 percent for the overnight lending or RP facility. The interest rates on term RRPs, RPs, and SDAs were also raised accordingly. Baseline inflation forecasts continue to suggest that the 3‐5 percent inflation target for 2011 remains at risk, mainly as a result of expected pressures from oil prices.
JUN 16 4.50 6.50 The MB decided to keep policy rates steady at 4.5 percent for the overnight borrowing or RRP facility and 6.5 percent for the overnight lending or RP facility. At the same time, the Board decided to raise the reserve requirement on deposits and deposit substitutes of all banks and non‐banks with quasi‐banking functions by one percentage point effective on Friday, 24 June 2011. The MB's decision to raise the reserve requirement is a preemptive move to counter any additional inflationary pressures from excess liquidity.
JUL 28 4.50 6.50 The MB maintained the BSP's key policy interest rates at 4.5 percent for the overnight borrowing or RRP facility and 6.5 percent for the overnight lending or RP facility. At the same time, the Board increased anew the reserve requirement on deposits and deposit substitutes of all banks and non‐banks with quasi‐banking functions by one percentage point effective on 5 August 2011. The MB's decision to raise the reserve requirement anew is a forward‐looking move to better manage liquidity.
SEP 8 OCT 20 DEC 1
4.50 6.50
The MB decided to keep the overnight policy rates steady. At the same time, the reserve requirement ratios were kept unchanged.
2012 JAN 19
4.25 6.25 The MB decided to reduce the BSP's key policy interest rates by 25 bps to 4.25 percent for the overnight borrowing or RRP facility and 6.25 percent for the overnight lending or RP facility. The interest rates on term RRPs, RPs, and SDAs were also reduced accordingly The MB's decision is based on its assessment that the inflation outlook remains comfortably within the target range, with expectations well‐anchored and as such, allowed some scope for a reduction in policy rates to help boost economic activity and support market confidence.
MAR 1 4.00 6.00 The MB decided to reduce the BSP's key policy interest rates by another 25 bps to 4.0 percent for the overnight borrowing or RRP facility and 6.0 percent for the overnight lending or RP facility. The interest rates on term RRPs, RPs, and SDAs were also reduced accordingly. The MB is of the view that the benign inflation outlook has allowed further scope for a measured reduction in policy rates to support economic activity and reinforce confidence.
APR 19 4.00 6.00 The MB decided to keep the BSP’s key policy interest rates steady at 4 percent for the overnight borrowing or RRP facility and 6 percent for the overnight lending or RP facility. The interest rates on term RRPs, RPs, and SDAs were also left unchanged.

60
EFFECTIVITY DATE LEVELS (IN %)
MONETARY POLICY DECISION RRP OVERNIGHT RP OVERNIGHT
JUN 14 4.00 6.00 The MB decided to keep the BSP’s key policy interest rates steady at 4 percent for the overnight borrowing or RRP facility and 6 percent for the overnight lending or RP facility. The interest rates on term RRPs, RPs, and SDAs were also left unchanged. The MB’s decision was based on its assessment that the inflation environment remains manageable. Baseline forecasts continue to track the lower half of the 3‐5 percent target range for 2012 and 2013, while inflation expectations remain firmly anchored. At the same time, domestic macroeconomic readings have improved significantly in Q1 2012.
JUL 26 3.75 5.75 The MB decided to reduce the BSP’s key policy interest rates by 25 bps to 3.75 percent for the overnight borrowing or RRP facility and 5.75 percent for the overnight lending or RP facility. The interest rates on term RRPs, RPs, and SDAs were also reduced accordingly. This is the third time in 2012 that the BSP has cut its policy rates. The MB’s decision was based on its assessment that price pressures have been receding, with risks to the inflation outlook slightly skewed to the downside. Baseline forecasts indicate that inflation is likely to settle within the lower half of the 3‐5 percent target for 2012 and 2013, as pressures on global commodity prices are seen to continue to abate amid weaker global growth prospects. At the same time, the MB is of the view that prospects for global economic activity are likely to remain weak.
SEP 13 3.75 5.75 The MB decided to keep the BSP’s key policy interest rates steady at 3.75 percent for the overnight borrowing or RRP facility and 5.75 percent for the overnight lending or RP facility. The interest rates on term RRPs, RPs, and SDAs were also left unchanged. The MB’s decision was based on its assessment that the inflation environment remains benign, with the risks to the inflation outlook appearing to be broadly balanced.
OCT 25 3.50 5.50 The MB decided to reduce the BSP’s key policy interest rates by 25 bps to 3.50 percent for the overnight borrowing or RRP facility and 5.50 percent for the overnight lending or RP facility. The interest rates on term RRPs, RPs, and SDAs were also reduced accordingly. This is the fourth time in 2012 that the BSP has cut its policy rates. The MB’s decision was based on its assessment that the inflation environment continued to be benign with latest baseline forecasts indicating that the future inflation path will remain within target for 2012‐2014. A rate cut would also be consistent with a symmetric response to the risk of below‐target inflation.
DEC 13 3.50 5.50 The MB decided to keep the BSP’s key policy interest rates steady at 3.50 percent for the overnight borrowing or RRP facility and 5.50 percent for the overnight lending or RP facility. The interest rates on term RRPs, RPs, and SDAs were also left unchanged. The MB’s decision was based on its assessment that current monetary settings remained appropriate, as the cumulative 100‐basis‐point reduction in policy rates in 2012 continued to work its way through the economy.

61
EFFECTIVITY DATE LEVELS (IN %)
MONETARY POLICY DECISION RRP OVERNIGHT RP OVERNIGHT
2013 JAN 24 3.50 5.50 The MB decided to keep the BSP’s key policy interest rates steady at 3.50 percent for the overnight borrowing or RRP facility and 5.50 percent for the overnight lending or RP facility. The interest rates on term RRPs and RPs were also maintained accordingly. The reserve requirement ratios were kept steady as well. At the same time, the MB decided to set the interest rates on the SDA facility at 3.00 percent regardless of tenor, effective immediately, consistent with the BSP’s continuing efforts to fine‐tune the operation of its monetary policy tools.
MAR 14 3.50 5.50 The MB decided to keep the BSP’s key policy interest rates steady at 3.50 percent for the overnight borrowing or RRP facility and 5.50 percent for the overnight lending or RP facility. The interest rate on the RRP was also set at 3.50 percent regardless of tenor. Following its previous decision to rationalize the SDA facility in January 2013, the MB further reduced the interest rates on the SDA facility by 50 bps to 2.50 percent across all tenors effective immediately.
APR 25 3.50 5.50 The MB decided to keep the BSP’s key policy interest rates steady at 3.50 percent for the overnight borrowing or RRP facility and 5.50 percent for the overnight lending or RP facility. The interest rate on the RRP was also set at 3.50 percent regardless of tenor. Meanwhile, the SDA rate was further reduced by 50 basis points to 2.0 percent across all tenors.
JUN 13 3.50 5.50 The MB decided to keep the BSP’s key policy interest rates steady at 3.50 percent for the overnight borrowing or RRP facility and 5.50 percent for the overnight lending or RP facility. The interest rates on term RRPs, RPs, and SDA were also maintained.
JUL 25 3.50 5.50 The MB decided to keep the BSP’s key policy interest rates steady at 3.50 percent for the overnight borrowing or RRP facility and 5.50 percent for the overnight lending or RP facility. The interest rates on term RRPs, RPs, and SDA were also maintained.
SEP 12 3.50 5.50 The MB decided to keep the BSP’s key policy interest rates steady at 3.50 percent for the overnight borrowing or RRP facility and 5.50 percent for the overnight lending or RP facility. The interest rates on term RRPs, RPs, and SDA were also maintained.
OCT 24 3.50 5.50 The MB decided to keep the BSP’s key policy interest rates steady at 3.50 percent for the overnight borrowing or RRP facility and 5.50 percent for the overnight lending or RP facility. The interest rates on term RRPs, RPs, and SDA were also maintained.
DEC 12 3.50 5.50 The MB decided to keep the BSP’s key policy interest rates steady at 3.50 percent for the overnight borrowing or RRP facility and 5.50 percent for the overnight lending or RP facility. The interest rates on term RRPs, RPs, and SDA were also maintained.

62
EFFECTIVITY DATE LEVELS (IN %)
MONETARY POLICY DECISION RRP OVERNIGHT RP OVERNIGHT
2014 FEB 6 3.50 5.50 The MB decided to keep the BSP’s key policy interest rates steady at 3.50 percent for the overnight borrowing or RRP facility and 5.50 percent for the overnight lending or RP facility. The interest rates on term RRPs, RPs, and SDA were also maintained.
MAR 27 3.50 5.50 The MB decided to keep the BSP’s key policy interest rates steady at 3.50 percent for the overnight borrowing or RRP facility and 5.50 percent for the overnight lending or RP facility. The interest rates on term RRPs, RPs, and SDA were also maintained. Meanwhile, the MB decided to increase the reserve requirement by one percentage point effective on 11 April 2014.

The BSP Inflation Report is published every quarter by the Bangko Sentral ng Pilipinas. The report is available as a complete document in pdf format, together with other general information about inflation targeting and the monetary policy of the BSP, on the BSP’s website:
www.bsp.gov.ph/monetary/inflation.asp If you wish to receive an electronic copy of the latest BSP Inflation Report, please send an e‐mail to [email protected]. The BSP also welcomes feedback from readers on the contents of the Inflation Report as well as suggestions on how to improve the presentation. Please send comments and suggestions to the following addresses:
By post: BSP Inflation Report
c/o Department of Economic Research Bangko Sentral ng Pilipinas
A. Mabini Street, Malate, Manila Philippines 1004
By e‐mail: [email protected]


