consumer finance survey - bangko sentral ng pilipinas · consumer finance survey 2014 a survey...
TRANSCRIPT
Consumer Finance Survey
A survey conducted by the
Department of Economic Statistics Bangko Sentral ng Pilipinas
Manila, Philippines
www.bsp.gov.ph
TABLE OF CONTENTS
I. About the Survey . . . . . . . . . . . . . . . . . . . . . . . . . . . . . . . . . . . . . . . . . . . . . . . . . . . . . . . . 2
II. Key Findings . . . . . . . . . . . . . . . . . . . . . . . . . . . . . . . . . . . . . . . . . . . . . . . . . . . . . . . . . . . 3
A. Demographic Characteristics. . . . . . . . . . . . . . . . . . . . . . . . . . . . . . . . . . . . . . .
B. Assets and Liabilities . . . . . . . . . . . . . . . . . . . . . . . . . . . . . . . . . . . . . . . . . . . . .
1. Respondent’s Residence . . . . . . . . . . . . . . . . . . . . . . . . . . . . . . . . . . . . . . .
2. Other Real Property Ownership (Apart from Respondent’s Residence). .
3. Ownership of Vehicles and Other Non-Financial Assets . . . . . . . . . . . . .
4. Financial Assets . . . . . . . . . . . . . . . . . . . . . . . . . . . . . . . . . . . . . . . . . . . . . .
5. Insurance and Pension . . . . . . . . . . . . . . . . . . . . . . . . . . . . . . . . . . . . . . . .
6. Inheritance . . . . . . . . . . . . . . . . . . . . . . . . . . . . . . . . . . . . . . . . . . . . . . . . . .
7. Credit Cards and Other Loans . . . . . . . . . . . . . . . . . . . . . . . . . . . . . . . . . . .
C. Income and Expenditures . . . . . . . . . . . . . . . . . . . . . . . . . . . . . . . . . . . . . . . . .
1. Work and Income of Respondents and Spouses. . . . . . . . . . . . . . . . . . . . .
2. Businesses Including Self-Employed . . . . . . . . . . . . . . . . . . . . . . . . . . . . . .
3. Total Income. . . . . . . . . . . . . . . . . . . . . . . . . . . . . . . . . . . . . . . . . . . . . . . . .
4. Expenditures . . . . . . . . . . . . . . . . . . . . . . . . . . . . . . . . . . . . . . . . . . . . . . . . .
D. Preferences and Behaviors . . . . . . . . . . . . . . . . . . . . . . . . . . . . . . . . . . . . . . . .
E. Respondents’ Profile . . . . . . . . . . . . . . . . . . . . . . . . . . . . . . . . . . . . . . . . . . . . . .
3
6
7
12
14
19
23
25
26
28
28
31
33
33
35
36
III. Policy Implications and Recommendations . . . . . . . . . . . . . . . . . . . . . . . . . . . . . . . . . . 37
IV. Statistical Tables . . . . . . . . . . . . . . . . . . . . . . . . . . . . . . . . . . . . . . . . . . . . . . . . . . . . . . . .
A. Demographic Characteristics. . . . . . . . . . . . . . . . . . . . . . . . . . . . . . . . . . . . . . .
B. Assets and Liabilities . . . . . . . . . . . . . . . . . . . . . . . . . . . . . . . . . . . . . . . . . . . . .
1. Respondent’s Residence . . . . . . . . . . . . . . . . . . . . . . . . . . . . . . . . . . . . . . .
2. Other Real Property Ownership (Apart from Respondent’s Residence). .
3. Ownership of Vehicles and Other Non-Financial Assets . . . . . . . . . . . . .
4. Financial Assets . . . . . . . . . . . . . . . . . . . . . . . . . . . . . . . . . . . . . . . . . . . . . .
5. Insurance and Pension . . . . . . . . . . . . . . . . . . . . . . . . . . . . . . . . . . . . . . . .
6. Inheritance . . . . . . . . . . . . . . . . . . . . . . . . . . . . . . . . . . . . . . . . . . . . . . . . . .
7. Credit Cards and Other Loans . . . . . . . . . . . . . . . . . . . . . . . . . . . . . . . . . . .
C. Income and Expenditures . . . . . . . . . . . . . . . . . . . . . . . . . . . . . . . . . . . . . . . . . .
1. Work and Income of Respondents and Spouses . . . . . . . . . . . . . . . . . . . .
2. Businesses Including Self-Employed . . . . . . . . . . . . . . . . . . . . . . . . . . . . . .
3. Total Income . . . . . . . . . . . . . . . . . . . . . . . . . . . . . . . . . . . . . . . . . . . . . . . . .
4. Expenditures . . . . . . . . . . . . . . . . . . . . . . . . . . . . . . . . . . . . . . . . . . . . . . . . .
D. Preferences and Behaviors . . . . . . . . . . . . . . . . . . . . . . . . . . . . . . . . . . . . . . . .
E. Respondents’ Profile . . . . . . . . . . . . . . . . . . . . . . . . . . . . . . . . . . . . . . . . . . . . . .
38
39
39
43
44
49
53
56
56
59
62
67
70
71
78
79
C o n s u m e r F i n a n c e S u r v e y 2 0 1 4
A survey conducted by the
Department of Economic Statistics Bangko Sentral ng Pilipinas
Manila, Philippines
www.bsp.gov.ph
Page 2
I. About the survey
The Consumer Finance Survey (CFS) is a nationwide quadrennial survey on consumer finances among
Filipino households. The CFS generates data on the financial conditions of households, including what
they own (financial and non-financial assets) as well as from whom and how much they borrow (sources
of credit and level of indebtedness). It also generates data on the income, spending and insurance
coverage of households.
The 2014 CFS has a sample size of 18,000 households covering all regions in the country, except Leyte
province (displaced due to typhoon Yolanda) and Autonomous Region in Muslim Mindanao (ARMM). By
contrast, the inaugural 2009 CFS consisted of a smaller sample size of 10,520 households covering
Regions 1, 7 and 11 only. The bigger sample size for the 2014 survey is more representative of the
financial conditions of households in the country. The domains of the survey are National Capital Region
(NCR) and Areas Outside NCR (AONCR). The survey made use of the 2003 Master Sample (MS2003) of
the Philippine Statistics Authority (PSA). The MS2003 uses a two-stage sampling with stratification at
the Primary Sampling Unit (PSU) level. In the first stage, households were stratified in terms of
Enumeration Areas (EA)/Barangays. Random samples of EAs were drawn in each region with probability
proportional to the size (i.e., total number of households) of the EA. In the second sampling stage,
random samples of 12 households for NCR and 16 for AONCR were selected from each of the sample
EAs.
The PSA, through its Survey Review and Clearance System, gave the clearance to conduct the CFS after
their review of the CFS survey design and questionnaire. To encourage participation in the survey, a
letter signed by the BSP Governor was sent to each of the sample households, informing them of the
CFS and its objectives, inviting them to participate in the CFS and assuring them of the confidentiality of
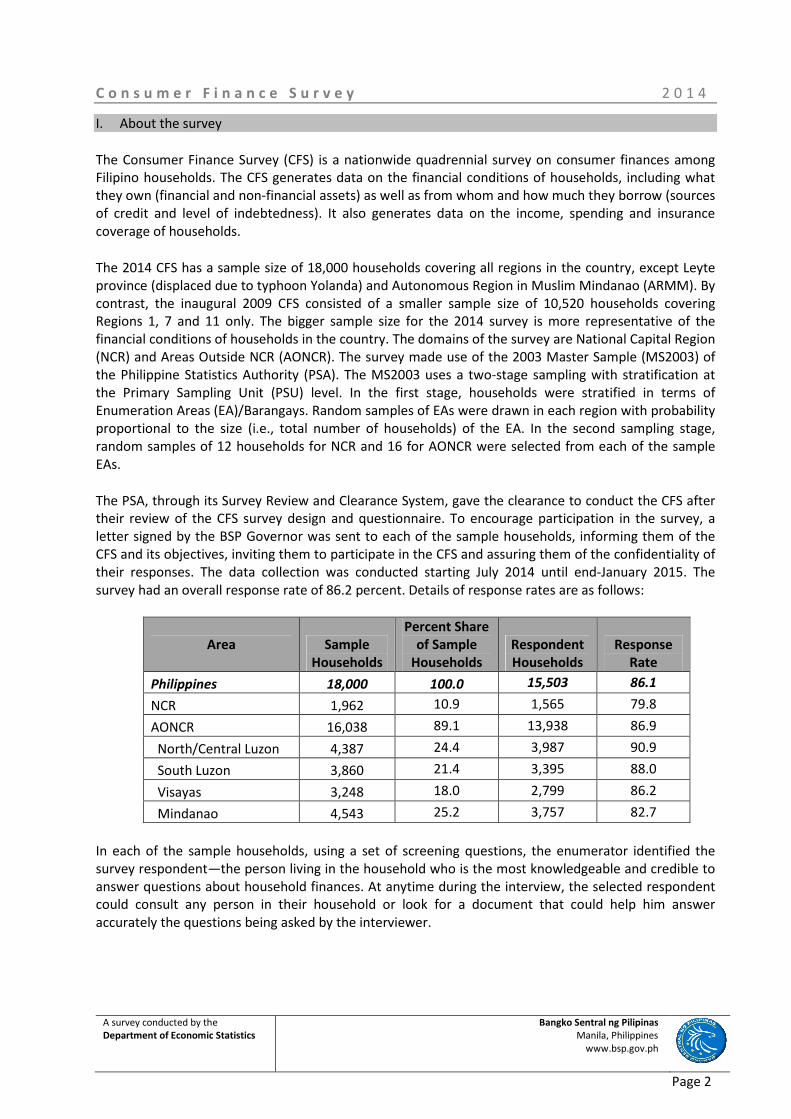
their responses. The data collection was conducted starting July 2014 until end-January 2015. The
survey had an overall response rate of 86.2 percent. Details of response rates are as follows:
Area Sample
Households
Percent Share
of Sample
Households
Respondent
Households
Response
Rate
Philippines 18,000 100.0 15,503 86.1
NCR 1,962 10.9 1,565 79.8
AONCR 16,038 89.1 13,938 86.9
North/Central Luzon 4,387 24.4 3,987 90.9
South Luzon 3,860 21.4 3,395 88.0
Visayas 3,248 18.0 2,799 86.2
Mindanao 4,543 25.2 3,757 82.7
In each of the sample households, using a set of screening questions, the enumerator identified the
survey respondent―the person living in the household who is the most knowledgeable and credible to
answer questions about household finances. At anytime during the interview, the selected respondent
could consult any person in their household or look for a document that could help him answer
accurately the questions being asked by the interviewer.
C o n s u m e r F i n a n c e S u r v e y 2 0 1 4
A survey conducted by the
Department of Economic Statistics Bangko Sentral ng Pilipinas
Manila, Philippines
www.bsp.gov.ph
Page 3
The CFS generally followed the PSA’s definition of household membership.1 Data on demographic
characteristics of sample households covered all the members of the household. For assets and
liabilities as well as income and expenditures of the household, only the Primary Economic Unit (PEU)
within the household was covered. The PEU consists of the survey respondent, his/her spouse (if any),
and other members of the household whose finances are interdependent with the respondent and/or
the spouse. Finances of other members of the household such as those of hired help, boarders, and
financially independent household members were not included.2 In the survey report, the term
“household” refers to the sample household.
Data on work, income and expenditures of households were for full year 2013 (the calendar year
preceding the survey) while the data pertaining to demographics, assets and liabilities, and preferences
and behaviors were reckoned on the date the household was interviewed (i.e., within the period from
July 2014 to end-January 2015).
Considering the differences in coverage of the 2009 and 2014 CFS, changes in the survey results
between the two periods were analyzed for comparative survey areas i.e., NCR and Regions 1, 7, and
11 in AONCR only.
The CFS questionnaire was translated in five dialects with the most number of respondents: Tagalog,
Ilonggo, Visayan, Bicolano and Ilocano, with English translation for each question. Questionnaires
translated in local dialects are back-translated to ensure that the translations and the essence of the
questions are consistent. Taylor Nelson Sofres (TNS), a research agency based in the Philippines which
provides consulting services in market research and household surveys, was contracted by the BSP to
perform the data collection, enumeration and data encoding of the results. They used the door-to-door
and face-to-face interview method in their data collection. Statistical tables of the CFS were generated
using Stata and SPSS software.
II. Key Findings
A. Demographic Characteristics
The age composition of
household members
indicates a significant
increase in the labor force
for the next ten years...
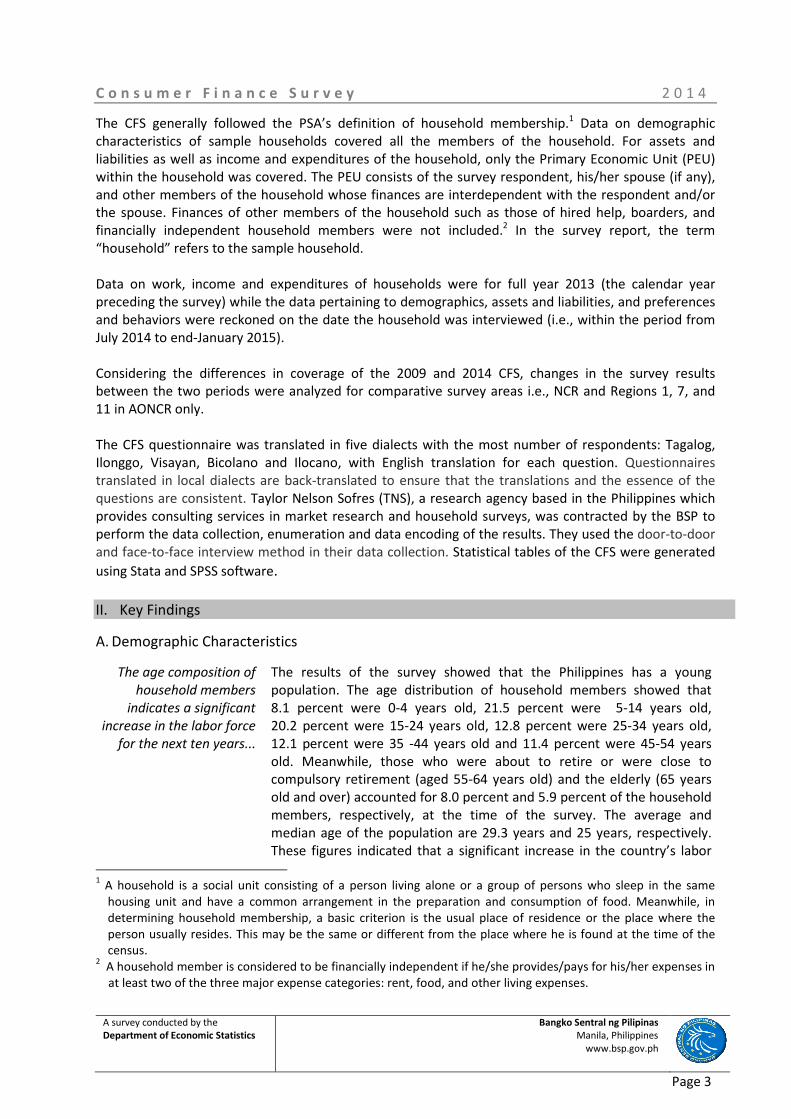
The results of the survey showed that the Philippines has a young
population. The age distribution of household members showed that
8.1 percent were 0-4 years old, 21.5 percent were 5-14 years old,
20.2 percent were 15-24 years old, 12.8 percent were 25-34 years old,
12.1 percent were 35 -44 years old and 11.4 percent were 45-54 years
old. Meanwhile, those who were about to retire or were close to
compulsory retirement (aged 55-64 years old) and the elderly (65 years
old and over) accounted for 8.0 percent and 5.9 percent of the household
members, respectively, at the time of the survey. The average and
median age of the population are 29.3 years and 25 years, respectively.
These figures indicated that a significant increase in the country’s labor
1 A household is a social unit consisting of a person living alone or a group of persons who sleep in the same
housing unit and have a common arrangement in the preparation and consumption of food. Meanwhile, in
determining household membership, a basic criterion is the usual place of residence or the place where the
person usually resides. This may be the same or different from the place where he is found at the time of the
census. 2 A household member is considered to be financially independent if he/she provides/pays for his/her expenses in
at least two of the three major expense categories: rent, food, and other living expenses.
C o n s u m e r F i n a n c e S u r v e y 2 0 1 4
A survey conducted by the
Department of Economic Statistics Bangko Sentral ng Pilipinas
Manila, Philippines
www.bsp.gov.ph
Page 4
force could be expected considering that a much bigger number of young
people will enter the labor force every year compared to the number of
older people who leave the labor force working age group. The age
dependency ratio was estimated at 0.55, translating to about two
working age household members for every one non-working age
household member.3 This broad age profile was observed in both NCR
and AONCR.
...that could contribute to
higher economic growth.
For the next ten years, favorable demographic dividends are expected as a
relatively young labor force could propel domestic demand that could help
accelerate the country’s economic growth.
However, compared to the 2009 CFS results, a slight aging of the population
was observed. In the NCR, the percentage of households aged 55 and over
increased to 13.9 percent compared to 11.1 percent in the 2009 CFS. For
Regions 1, 7, and 11, the percentage of households for the said age group
also increased to 14.7 percent from 13.5 percent in the 2009 survey.
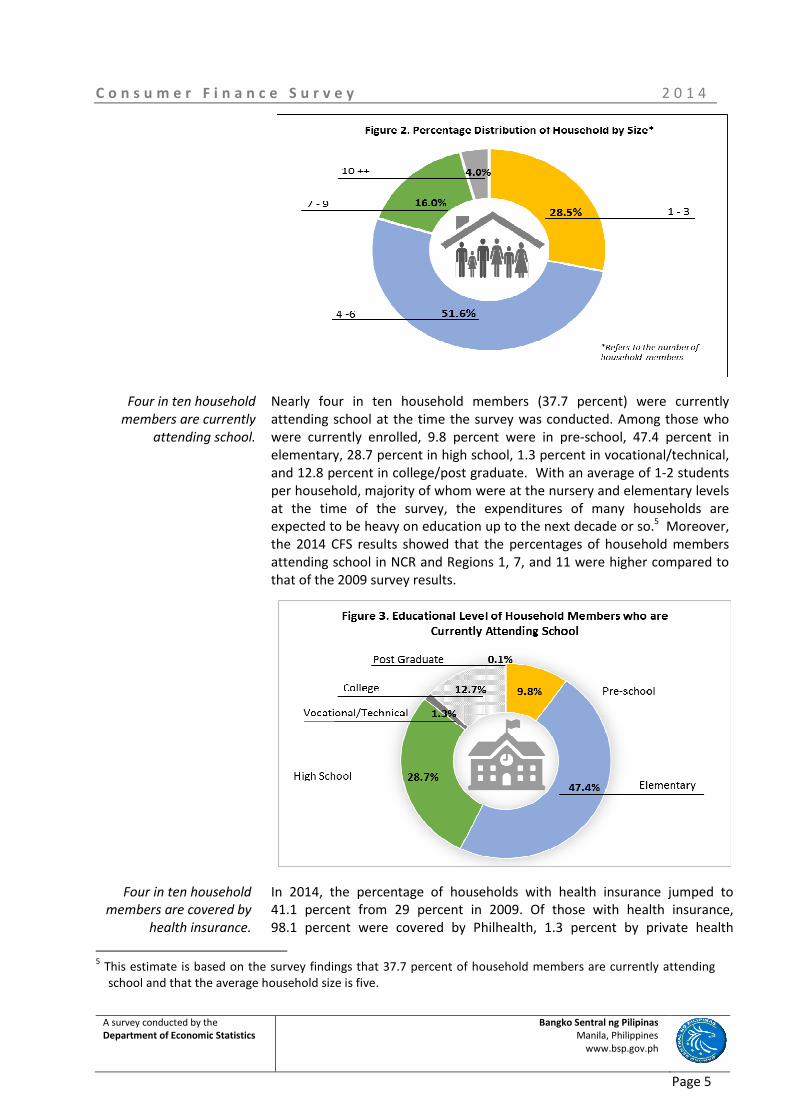
The average number of
household members is five.
The average household size was 5 members, with more than half
(51.6 percent) of the respondents reporting a household size of
4-6 household members, 28.5 percent with 1-3 members, and 20 percent
with 7 or more household members. Looking at the composition of
household members in relation to the respondent, 81 percent were
immediate family members and 18.5 percent consisted of other relatives,
indicating that extended family increased the average household size by
almost one.4 The same average household size was observed in the
2009 CFS.
3 The age dependency ratio equals the sum of the population of the non-working age groups (0-14 years old and
65 years old and over) divided by the population of the working age group (15-64 years old). This measures the
number of non-working age household members being supported per one working age member. 4 Immediate family members consist of the respondent, spouse, and their children.
C o n s u m e r F i n a n c e S u r v e y 2 0 1 4
A survey conducted by the
Department of Economic Statistics Bangko Sentral ng Pilipinas
Manila, Philippines
www.bsp.gov.ph
Page 5
Four in ten household
members are currently
attending school.
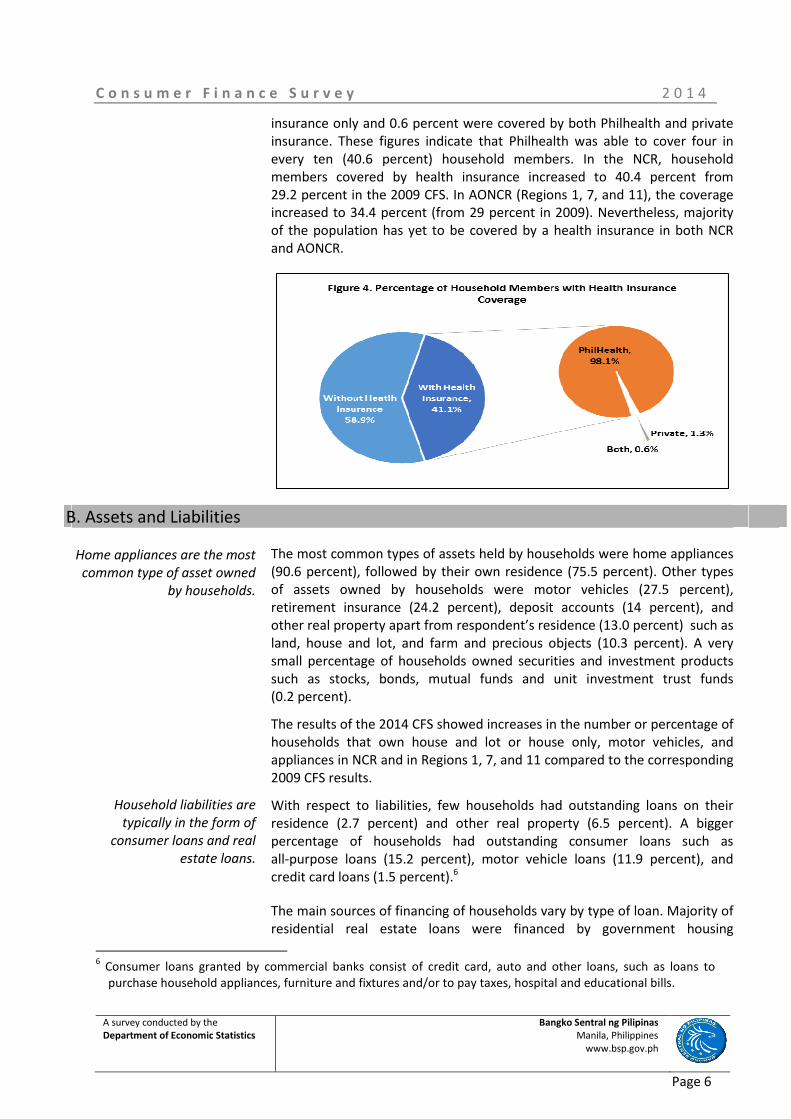
Nearly four in ten household members (37.7 percent) were currently
attending school at the time the survey was conducted. Among those who
were currently enrolled, 9.8 percent were in pre-school, 47.4 percent in
elementary, 28.7 percent in high school, 1.3 percent in vocational/technical,
and 12.8 percent in college/post graduate. With an average of 1-2 students
per household, majority of whom were at the nursery and elementary levels
at the time of the survey, the expenditures of many households are
expected to be heavy on education up to the next decade or so.5 Moreover,
the 2014 CFS results showed that the percentages of household members
attending school in NCR and Regions 1, 7, and 11 were higher compared to
that of the 2009 survey results.
Four in ten household
members are covered by
health insurance.
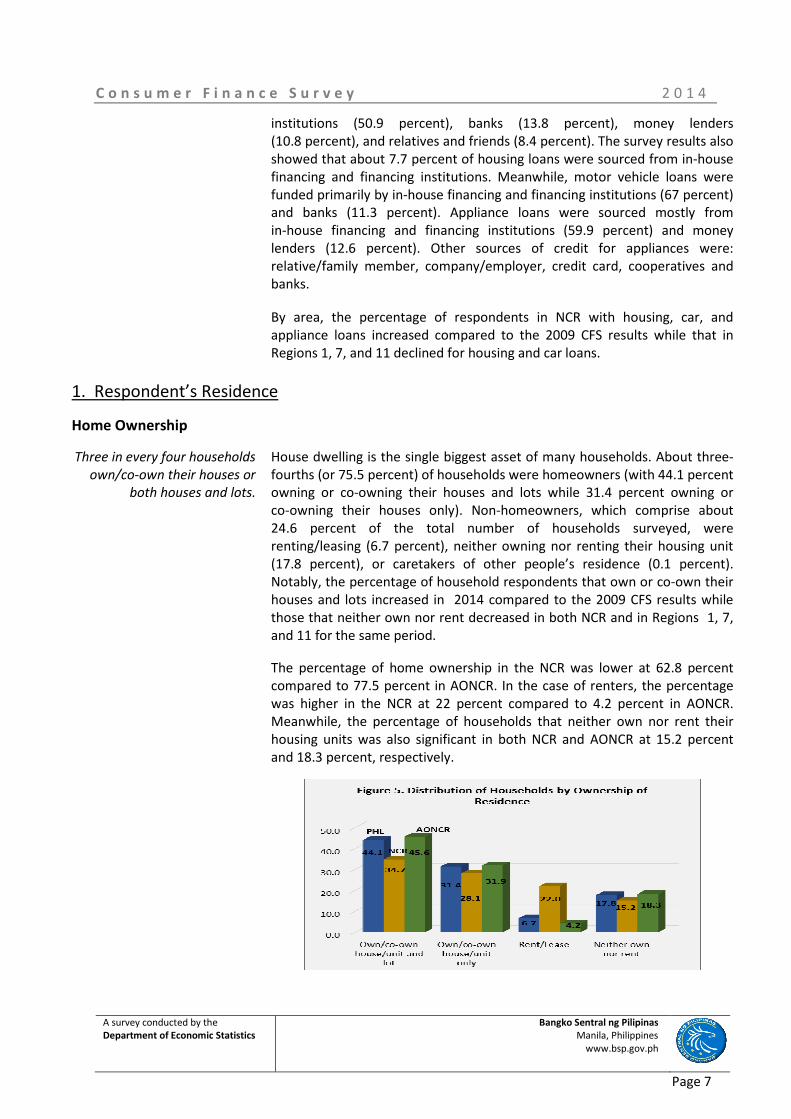
In 2014, the percentage of households with health insurance jumped to
41.1 percent from 29 percent in 2009. Of those with health insurance,
98.1 percent were covered by Philhealth, 1.3 percent by private health
5 This estimate is based on the survey findings that 37.7 percent of household members are currently attending
school and that the average household size is five.
C o n s u m e r F i n a n c e S u r v e y 2 0 1 4
A survey conducted by the
Department of Economic Statistics Bangko Sentral ng Pilipinas
Manila, Philippines
www.bsp.gov.ph
Page 6
insurance only and 0.6 percent were covered by both Philhealth and private
insurance. These figures indicate that Philhealth was able to cover four in
every ten (40.6 percent) household members. In the NCR, household
members covered by health insurance increased to 40.4 percent from
29.2 percent in the 2009 CFS. In AONCR (Regions 1, 7, and 11), the coverage
increased to 34.4 percent (from 29 percent in 2009). Nevertheless, majority
of the population has yet to be covered by a health insurance in both NCR
and AONCR.
B. Assets and Liabilities
Home appliances are the most
common type of asset owned
by households.
Household liabilities are
typically in the form of
consumer loans and real
estate loans.
The most common types of assets held by households were home appliances
(90.6 percent), followed by their own residence (75.5 percent). Other types
of assets owned by households were motor vehicles (27.5 percent),
retirement insurance (24.2 percent), deposit accounts (14 percent), and
other real property apart from respondent’s residence (13.0 percent) such as
land, house and lot, and farm and precious objects (10.3 percent). A very
small percentage of households owned securities and investment products
such as stocks, bonds, mutual funds and unit investment trust funds
(0.2 percent).
The results of the 2014 CFS showed increases in the number or percentage of
households that own house and lot or house only, motor vehicles, and
appliances in NCR and in Regions 1, 7, and 11 compared to the corresponding
2009 CFS results.
With respect to liabilities, few households had outstanding loans on their
residence (2.7 percent) and other real property (6.5 percent). A bigger
percentage of households had outstanding consumer loans such as
all-purpose loans (15.2 percent), motor vehicle loans (11.9 percent), and
credit card loans (1.5 percent).6
The main sources of financing of households vary by type of loan. Majority of
residential real estate loans were financed by government housing
6 Consumer loans granted by commercial banks consist of credit card, auto and other loans, such as loans to
purchase household appliances, furniture and fixtures and/or to pay taxes, hospital and educational bills.
C o n s u m e r F i n a n c e S u r v e y 2 0 1 4
A survey conducted by the
Department of Economic Statistics Bangko Sentral ng Pilipinas
Manila, Philippines
www.bsp.gov.ph
Page 7
institutions (50.9 percent), banks (13.8 percent), money lenders
(10.8 percent), and relatives and friends (8.4 percent). The survey results also
showed that about 7.7 percent of housing loans were sourced from in-house
financing and financing institutions. Meanwhile, motor vehicle loans were
funded primarily by in-house financing and financing institutions (67 percent)
and banks (11.3 percent). Appliance loans were sourced mostly from
in-house financing and financing institutions (59.9 percent) and money
lenders (12.6 percent). Other sources of credit for appliances were:
relative/family member, company/employer, credit card, cooperatives and
banks. By area, the percentage of respondents in NCR with housing, car, and
appliance loans increased compared to the 2009 CFS results while that in
Regions 1, 7, and 11 declined for housing and car loans.
1. Respondent’s Residence
Home Ownership
Three in every four households
own/co-own their houses or
both houses and lots.
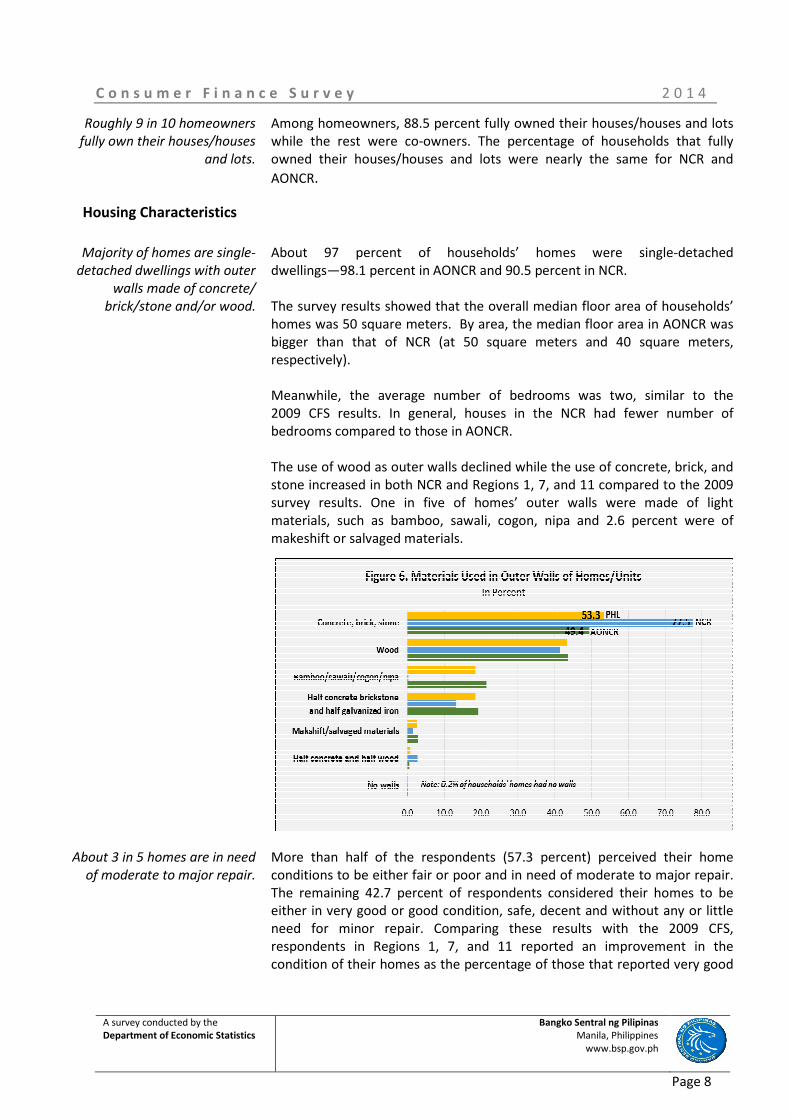
House dwelling is the single biggest asset of many households. About three-
fourths (or 75.5 percent) of households were homeowners (with 44.1 percent
owning or co-owning their houses and lots while 31.4 percent owning or
co-owning their houses only). Non-homeowners, which comprise about
24.6 percent of the total number of households surveyed, were
renting/leasing (6.7 percent), neither owning nor renting their housing unit
(17.8 percent), or caretakers of other people’s residence (0.1 percent).
Notably, the percentage of household respondents that own or co-own their
houses and lots increased in 2014 compared to the 2009 CFS results while
those that neither own nor rent decreased in both NCR and in Regions 1, 7,
and 11 for the same period.
The percentage of home ownership in the NCR was lower at 62.8 percent
compared to 77.5 percent in AONCR. In the case of renters, the percentage
was higher in the NCR at 22 percent compared to 4.2 percent in AONCR.
Meanwhile, the percentage of households that neither own nor rent their
housing units was also significant in both NCR and AONCR at 15.2 percent
and 18.3 percent, respectively.
C o n s u m e r F i n a n c e S u r v e y 2 0 1 4
A survey conducted by the
Department of Economic Statistics Bangko Sentral ng Pilipinas
Manila, Philippines
www.bsp.gov.ph
Page 8
Roughly 9 in 10 homeowners
fully own their houses/houses
and lots.
Among homeowners, 88.5 percent fully owned their houses/houses and lots
while the rest were co-owners. The percentage of households that fully
owned their houses/houses and lots were nearly the same for NCR and
AONCR.
Housing Characteristics
Majority of homes are single-
detached dwellings with outer
walls made of concrete/
brick/stone and/or wood.
About 97 percent of households’ homes were single-detached
dwellings―98.1 percent in AONCR and 90.5 percent in NCR.
The survey results showed that the overall median floor area of households’
homes was 50 square meters. By area, the median floor area in AONCR was
bigger than that of NCR (at 50 square meters and 40 square meters,
respectively).
Meanwhile, the average number of bedrooms was two, similar to the
2009 CFS results. In general, houses in the NCR had fewer number of
bedrooms compared to those in AONCR.
The use of wood as outer walls declined while the use of concrete, brick, and
stone increased in both NCR and Regions 1, 7, and 11 compared to the 2009
survey results. One in five of homes’ outer walls were made of light
materials, such as bamboo, sawali, cogon, nipa and 2.6 percent were of
makeshift or salvaged materials.
About 3 in 5 homes are in need
of moderate to major repair.
More than half of the respondents (57.3 percent) perceived their home
conditions to be either fair or poor and in need of moderate to major repair.
The remaining 42.7 percent of respondents considered their homes to be
either in very good or good condition, safe, decent and without any or little
need for minor repair. Comparing these results with the 2009 CFS,
respondents in Regions 1, 7, and 11 reported an improvement in the
condition of their homes as the percentage of those that reported very good
C o n s u m e r F i n a n c e S u r v e y 2 0 1 4
A survey conducted by the
Department of Economic Statistics Bangko Sentral ng Pilipinas
Manila, Philippines
www.bsp.gov.ph
Page 9
and good housing conditions increased while the percentage of those that
have fair or poor housing conditions decreased. The reverse was reported by
NCR respondents.
Housing Cost
About 4 in 5 respondents think
that the cost of buying/renting
their homes is not expensive.
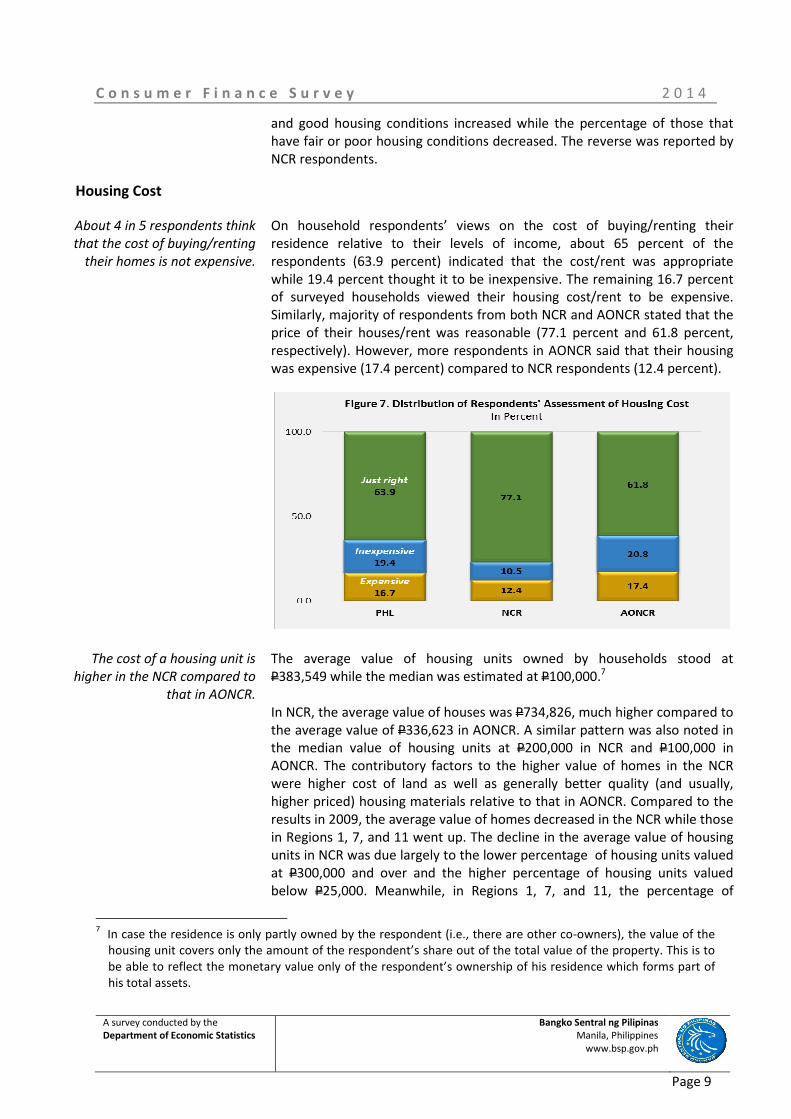
On household respondents’ views on the cost of buying/renting their
residence relative to their levels of income, about 65 percent of the
respondents (63.9 percent) indicated that the cost/rent was appropriate
while 19.4 percent thought it to be inexpensive. The remaining 16.7 percent
of surveyed households viewed their housing cost/rent to be expensive.
Similarly, majority of respondents from both NCR and AONCR stated that the
price of their houses/rent was reasonable (77.1 percent and 61.8 percent,
respectively). However, more respondents in AONCR said that their housing
was expensive (17.4 percent) compared to NCR respondents (12.4 percent).
The cost of a housing unit is
higher in the NCR compared to
that in AONCR.
The average value of housing units owned by households stood at
P383,549 while the median was estimated at P100,000.7
In NCR, the average value of houses was P734,826, much higher compared to
the average value of P336,623 in AONCR. A similar pattern was also noted in
the median value of housing units at P200,000 in NCR and P100,000 in
AONCR. The contributory factors to the higher value of homes in the NCR
were higher cost of land as well as generally better quality (and usually,
higher priced) housing materials relative to that in AONCR. Compared to the
results in 2009, the average value of homes decreased in the NCR while those
in Regions 1, 7, and 11 went up. The decline in the average value of housing
units in NCR was due largely to the lower percentage of housing units valued
at P300,000 and over and the higher percentage of housing units valued
below P25,000. Meanwhile, in Regions 1, 7, and 11, the percentage of
7 In case the residence is only partly owned by the respondent (i.e., there are other co-owners), the value of the
housing unit covers only the amount of the respondent’s share out of the total value of the property. This is to
be able to reflect the monetary value only of the respondent’s ownership of his residence which forms part of
his total assets.
C o n s u m e r F i n a n c e S u r v e y 2 0 1 4
A survey conducted by the
Department of Economic Statistics Bangko Sentral ng Pilipinas
Manila, Philippines
www.bsp.gov.ph
Page 10
respondents with housing units valued at P50,000 to P300,000 increased.
These results could reflect the assessment of the quality of housing units of
the respondents in NCR and AONCR.
Housing Loans and Mode of Acquisition of Respondent’s Residence
Housing is generally acquired
by households either through
purchase in cash or
inheritance...
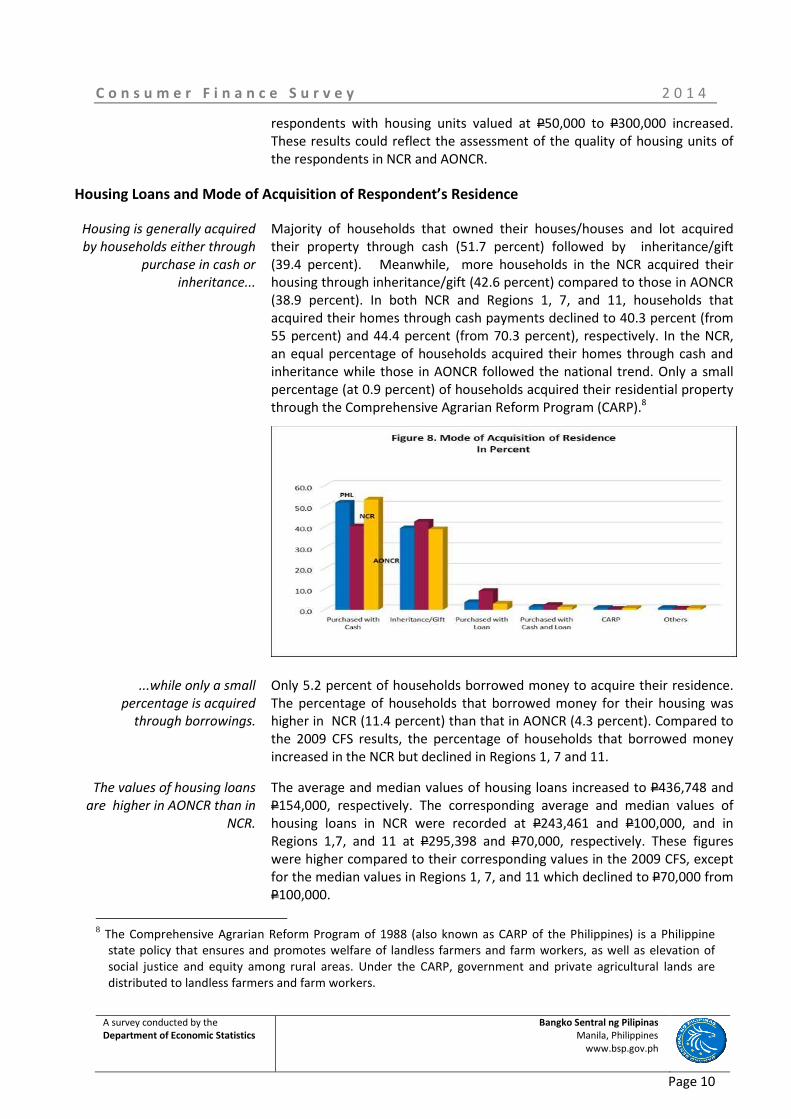
Majority of households that owned their houses/houses and lot acquired
their property through cash (51.7 percent) followed by inheritance/gift
(39.4 percent). Meanwhile, more households in the NCR acquired their
housing through inheritance/gift (42.6 percent) compared to those in AONCR
(38.9 percent). In both NCR and Regions 1, 7, and 11, households that
acquired their homes through cash payments declined to 40.3 percent (from
55 percent) and 44.4 percent (from 70.3 percent), respectively. In the NCR,
an equal percentage of households acquired their homes through cash and
inheritance while those in AONCR followed the national trend. Only a small
percentage (at 0.9 percent) of households acquired their residential property
through the Comprehensive Agrarian Reform Program (CARP).8
...while only a small
percentage is acquired
through borrowings.
Only 5.2 percent of households borrowed money to acquire their residence.
The percentage of households that borrowed money for their housing was
higher in NCR (11.4 percent) than that in AONCR (4.3 percent). Compared to
the 2009 CFS results, the percentage of households that borrowed money
increased in the NCR but declined in Regions 1, 7 and 11.
The values of housing loans
are higher in AONCR than in
NCR.
The average and median values of housing loans increased to P436,748 and
P154,000, respectively. The corresponding average and median values of
housing loans in NCR were recorded at P243,461 and P100,000, and in
Regions 1,7, and 11 at P295,398 and P70,000, respectively. These figures
were higher compared to their corresponding values in the 2009 CFS, except
for the median values in Regions 1, 7, and 11 which declined to P70,000 from
P100,000.
8 The Comprehensive Agrarian Reform Program of 1988 (also known as CARP of the Philippines) is a Philippine
state policy that ensures and promotes welfare of landless farmers and farm workers, as well as elevation of
social justice and equity among rural areas. Under the CARP, government and private agricultural lands are
distributed to landless farmers and farm workers.
C o n s u m e r F i n a n c e S u r v e y 2 0 1 4
A survey conducted by the
Department of Economic Statistics Bangko Sentral ng Pilipinas
Manila, Philippines
www.bsp.gov.ph
Page 11
The primary source of housing
loans is Pag-IBIG in AONCR,
and the National Housing
Authority (NHA) in NCR.
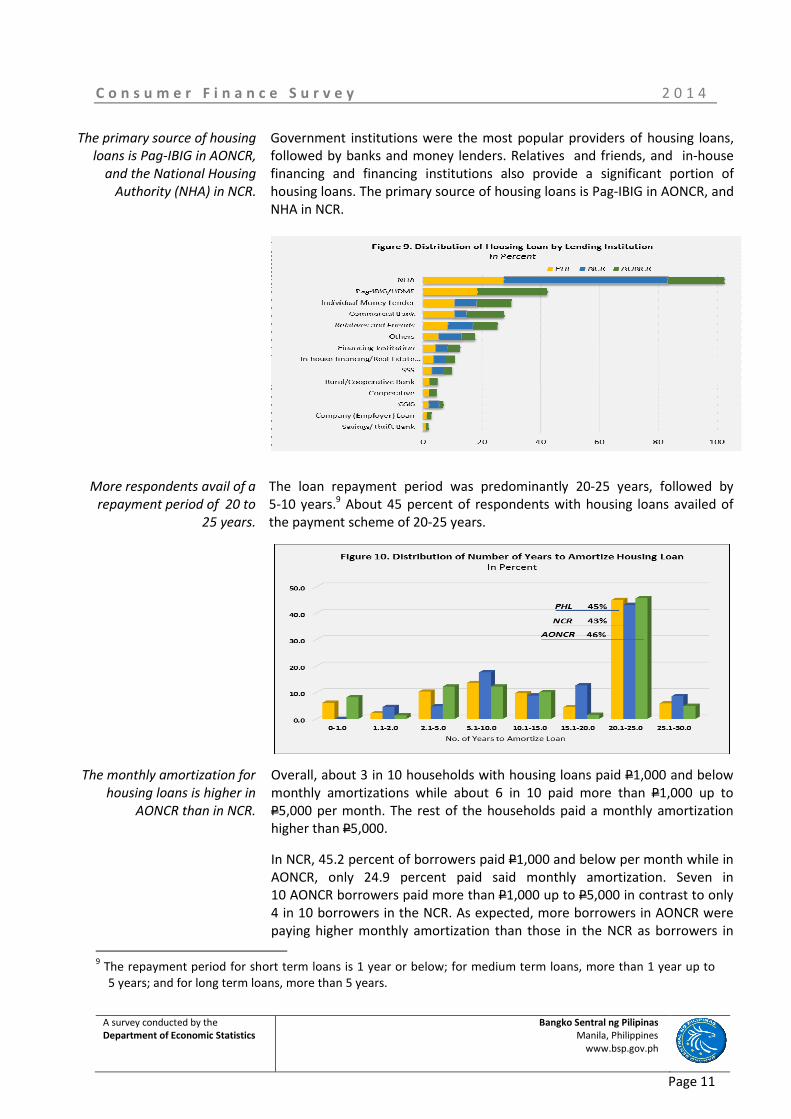
Government institutions were the most popular providers of housing loans,
followed by banks and money lenders. Relatives and friends, and in-house
financing and financing institutions also provide a significant portion of
housing loans. The primary source of housing loans is Pag-IBIG in AONCR, and
NHA in NCR.
More respondents avail of a
repayment period of 20 to
25 years.
The loan repayment period was predominantly 20-25 years, followed by
5-10 years.9 About 45 percent of respondents with housing loans availed of
the payment scheme of 20-25 years.
The monthly amortization for
housing loans is higher in
AONCR than in NCR.
Overall, about 3 in 10 households with housing loans paid P1,000 and below
monthly amortizations while about 6 in 10 paid more than P1,000 up to
P5,000 per month. The rest of the households paid a monthly amortization
higher than P5,000.
In NCR, 45.2 percent of borrowers paid P1,000 and below per month while in
AONCR, only 24.9 percent paid said monthly amortization. Seven in
10 AONCR borrowers paid more than P1,000 up to P5,000 in contrast to only
4 in 10 borrowers in the NCR. As expected, more borrowers in AONCR were
paying higher monthly amortization than those in the NCR as borrowers in
9 The repayment period for short term loans is 1 year or below; for medium term loans, more than 1 year up to
5 years; and for long term loans, more than 5 years.
C o n s u m e r F i n a n c e S u r v e y 2 0 1 4
A survey conducted by the
Department of Economic Statistics Bangko Sentral ng Pilipinas
Manila, Philippines
www.bsp.gov.ph
Page 12
AONCR generally had bigger loans compared to respondents in NCR.
Moreover, majority of housing loans in NCR were low cost housing projects
of the NHA whereas in AONCR, housing loans were mostly borrowed from
Pag-IBIG, SSS and GSIS with bigger loanable amounts and higher value.
One in two households pay an
annual interest rate of
10 percent or
lower on housing loans.
In terms of lending rates, 50.8 percent of the households (with loans) paid
an annual interest rate of 10 percent and below on their housing loans. The
average rates on housing loans in NCR was lower at 9 percent compared to
14.5 percent in AONCR, while median rates were the same for both areas at
6 percent.
A small percentage of
households have outstanding
loans on their residential
property.
About 3 in 100 households (2.7 percent) had an outstanding loan on their
residential property. In NCR, the percentage was higher at 6.1 percent
compared to 2.2 percent in AONCR.
Nearly 6 in 10 households with
outstanding housing loans pay
ahead or on schedule.
More than half of households with outstanding loans (55.9 percent) paid
their monthly amortization either ahead of or on schedule, while the rest
were behind schedule. A bigger percentage of households in NCR paid their
loans on time or ahead of schedule compared to those in AONCR.
Notably, there was a marked improvement from the 2009 CFS in the
percentage of households that paid their housing loan amortizations ahead
of/on schedule. In NCR, 67.4 percent reported paying their amortizations
ahead of/on schedule in 2014 compared to 44.7 percent in 2009. The same
was observed for Regions 1, 7 and 11 (at 78.5 percent in 2014 from
55 percent in 2009).
Among households whose loan
payments are behind schedule,
about 2 in 5 are behind
schedule by more than
1 year.
Among households whose loan payments were behind schedule, less than
half or about 40.8 percent were in default.10
Of these, 29.9 percent were in
default by one to five years while 11 percent were in default by more than
5 years. Compared to the 2009 CFS results, the percentage of loan payments
in default declined in 2014 in NCR as well as in Regions 1, 7, and 11.
2. Other Real Property Ownership (Apart from Respondent’s Residence)
Other Real Property Ownership by Type and Use
One in eight households owns
other real property apart from
their residence…
About 13 percent of households owned other real property (aside from their
residence) in 2014. Of these, 83.5 percent owned one other real property,
13.2 percent owned two, and 3.4 percent owned three or more. The
percentage of households in AONCR that owned other real property was
slightly higher compared to that in NCR.
10
Default loans in this survey are those for which amortization payments are behind schedule by more than one
year. However, the BSP defines non-performing loans (NPLs) as those with unpaid quarterly, semi-annual and
annual installments, 30 days or more after due date and loans with unpaid monthly installment for three or
more months. The non-repayment period of NPLs is thus much shorter compared to the survey’s definition of a
default loan.
C o n s u m e r F i n a n c e S u r v e y 2 0 1 4
A survey conducted by the
Department of Economic Statistics Bangko Sentral ng Pilipinas
Manila, Philippines
www.bsp.gov.ph
Page 13
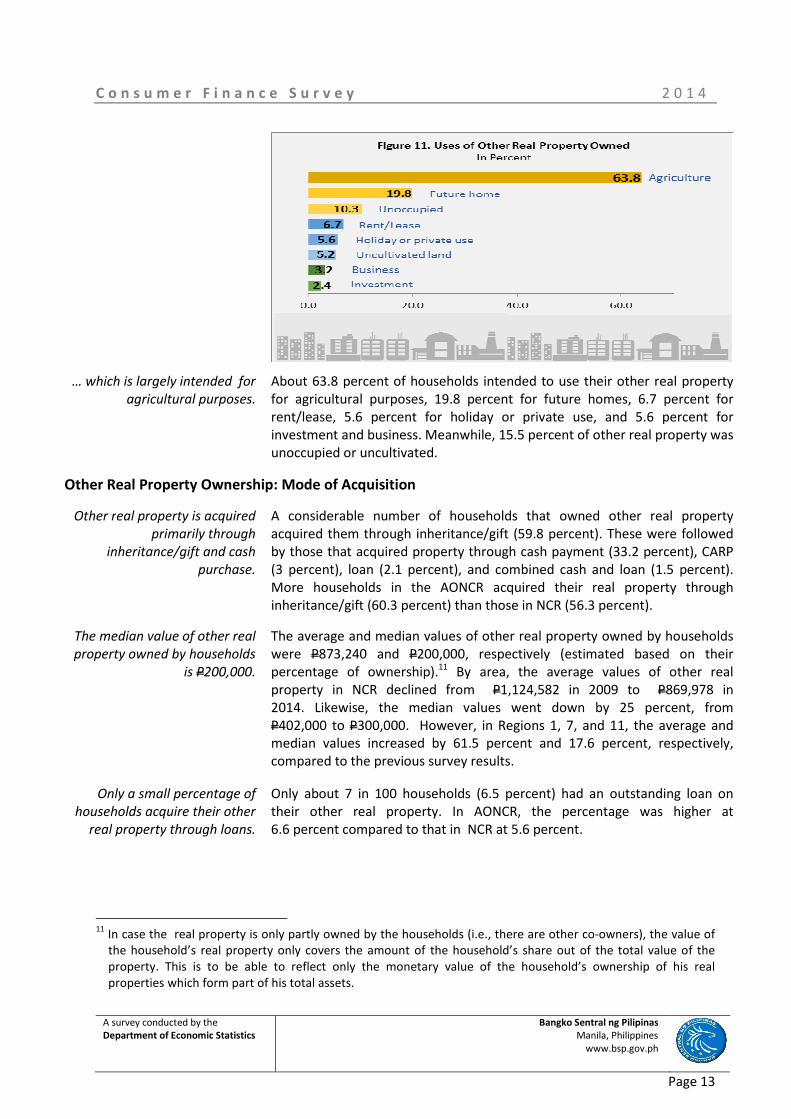
… which is largely intended for
agricultural purposes.
About 63.8 percent of households intended to use their other real property
for agricultural purposes, 19.8 percent for future homes, 6.7 percent for
rent/lease, 5.6 percent for holiday or private use, and 5.6 percent for
investment and business. Meanwhile, 15.5 percent of other real property was
unoccupied or uncultivated.
Other Real Property Ownership: Mode of Acquisition
Other real property is acquired
primarily through
inheritance/gift and cash
purchase.
A considerable number of households that owned other real property
acquired them through inheritance/gift (59.8 percent). These were followed
by those that acquired property through cash payment (33.2 percent), CARP
(3 percent), loan (2.1 percent), and combined cash and loan (1.5 percent).
More households in the AONCR acquired their real property through
inheritance/gift (60.3 percent) than those in NCR (56.3 percent).
The median value of other real
property owned by households
is P200,000.
The average and median values of other real property owned by households
were P873,240 and P200,000, respectively (estimated based on their
percentage of ownership).11
By area, the average values of other real
property in NCR declined from P1,124,582 in 2009 to P869,978 in
2014. Likewise, the median values went down by 25 percent, from
P402,000 to P300,000. However, in Regions 1, 7, and 11, the average and
median values increased by 61.5 percent and 17.6 percent, respectively,
compared to the previous survey results.
Only a small percentage of
households acquire their other
real property through loans.
Only about 7 in 100 households (6.5 percent) had an outstanding loan on
their other real property. In AONCR, the percentage was higher at
6.6 percent compared to that in NCR at 5.6 percent.
11
In case the real property is only partly owned by the households (i.e., there are other co-owners), the value of
the household’s real property only covers the amount of the household’s share out of the total value of the
property. This is to be able to reflect only the monetary value of the household’s ownership of his real
properties which form part of his total assets.
C o n s u m e r F i n a n c e S u r v e y 2 0 1 4
A survey conducted by the
Department of Economic Statistics Bangko Sentral ng Pilipinas
Manila, Philippines
www.bsp.gov.ph
Page 14
The primary sources of other
real property loans in AONCR
are relatives and friends.
Relatives and friends were the most popular providers of other real property
loans, followed by money lenders and banks.12
They were also the main
providers of other real property loans in AONCR while NHA, Pag-IBIG/HDMF,
financing institutions and GSIS were the most common loan providers in
NCR.
3. Ownership of Vehicles and Other Non-Financial Assets
Vehicles
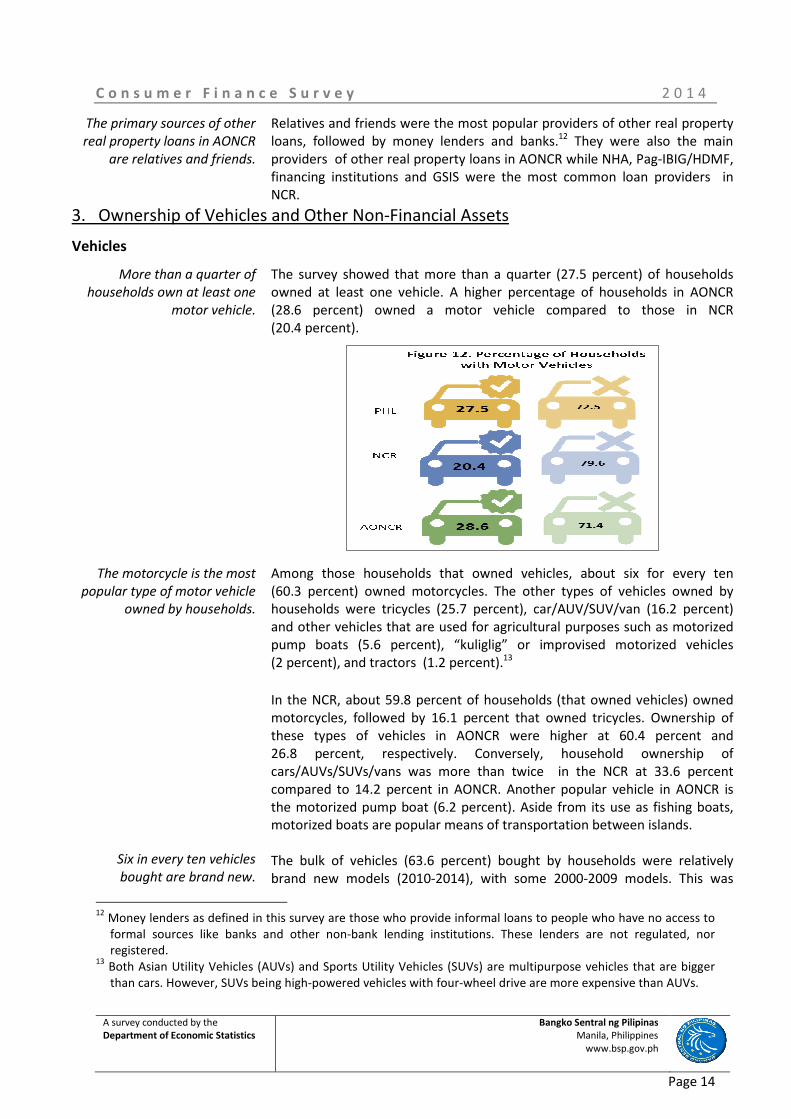
More than a quarter of
households own at least one
motor vehicle.
The survey showed that more than a quarter (27.5 percent) of households
owned at least one vehicle. A higher percentage of households in AONCR
(28.6 percent) owned a motor vehicle compared to those in NCR
(20.4 percent).
The motorcycle is the most
popular type of motor vehicle
owned by households.
Six in every ten vehicles
bought are brand new.
Among those households that owned vehicles, about six for every ten
(60.3 percent) owned motorcycles. The other types of vehicles owned by
households were tricycles (25.7 percent), car/AUV/SUV/van (16.2 percent)
and other vehicles that are used for agricultural purposes such as motorized
pump boats (5.6 percent), “kuliglig” or improvised motorized vehicles
(2 percent), and tractors (1.2 percent).13
In the NCR, about 59.8 percent of households (that owned vehicles) owned
motorcycles, followed by 16.1 percent that owned tricycles. Ownership of
these types of vehicles in AONCR were higher at 60.4 percent and
26.8 percent, respectively. Conversely, household ownership of
cars/AUVs/SUVs/vans was more than twice in the NCR at 33.6 percent
compared to 14.2 percent in AONCR. Another popular vehicle in AONCR is
the motorized pump boat (6.2 percent). Aside from its use as fishing boats,
motorized boats are popular means of transportation between islands.
The bulk of vehicles (63.6 percent) bought by households were relatively
brand new models (2010-2014), with some 2000-2009 models. This was
12
Money lenders as defined in this survey are those who provide informal loans to people who have no access to
formal sources like banks and other non-bank lending institutions. These lenders are not regulated, nor
registered. 13
Both Asian Utility Vehicles (AUVs) and Sports Utility Vehicles (SUVs) are multipurpose vehicles that are bigger
than cars. However, SUVs being high-powered vehicles with four-wheel drive are more expensive than AUVs.
C o n s u m e r F i n a n c e S u r v e y 2 0 1 4
A survey conducted by the
Department of Economic Statistics Bangko Sentral ng Pilipinas
Manila, Philippines
www.bsp.gov.ph
Page 15
observed in both NCR and AONCR. The percentage of households that bought
new models increased to 64.4 percent (from 53.7 percent in the previous CFS
results) in NCR and 62.7 percent (from 58.6 percent in 2009) in
Regions 1, 7, and 11.
Vehicles bought are primarily
for personal use.
Vehicles bought by households were largely for personal use (80.4 percent).
Some households (9.1 percent) bought vehicles for hire/rent to generate
income while 9.6 percent of households purchased vehicles for both personal
and business use. Utilization of vehicles in both NCR and AONCR broadly
followed the national pattern.
The estimated median
monthly income from vehicles
for hire is P4,350.
The average monthly income derived from vehicles for hire was
P5,962.3 with a median income of P4,350. These were lower compared to
the 2009 CFS results. This could be due to the higher number of motorcycles
and lower number of cars/UAVS/SUVs/vans owned and for hire recorded in
the 2014 CFS.
The average value of vehicles owned by households (if sold at the time of the
survey) was P71,188.90, with a median of P30,000. The average and median
values of vehicles were much higher in the NCR given the bigger percentage
of ownership of cars/AUVs/SUVs/vans compared to that in AONCR.
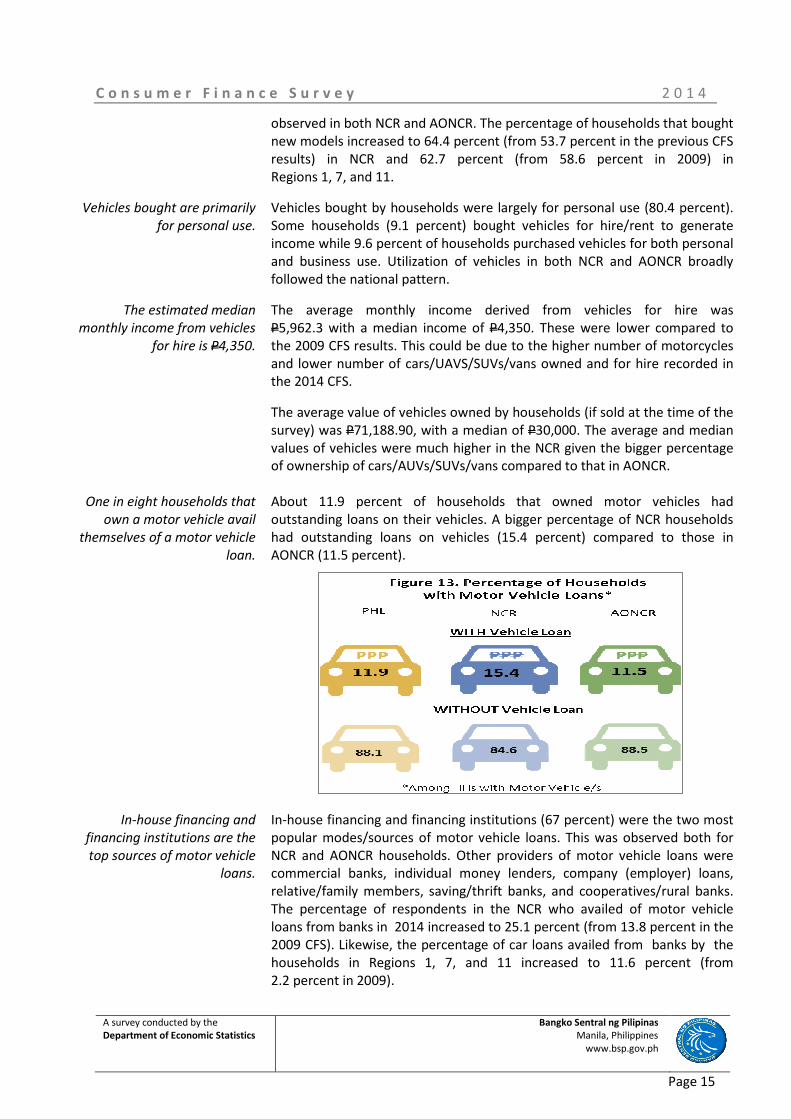
One in eight households that
own a motor vehicle avail
themselves of a motor vehicle
loan.
About 11.9 percent of households that owned motor vehicles had
outstanding loans on their vehicles. A bigger percentage of NCR households
had outstanding loans on vehicles (15.4 percent) compared to those in
AONCR (11.5 percent).
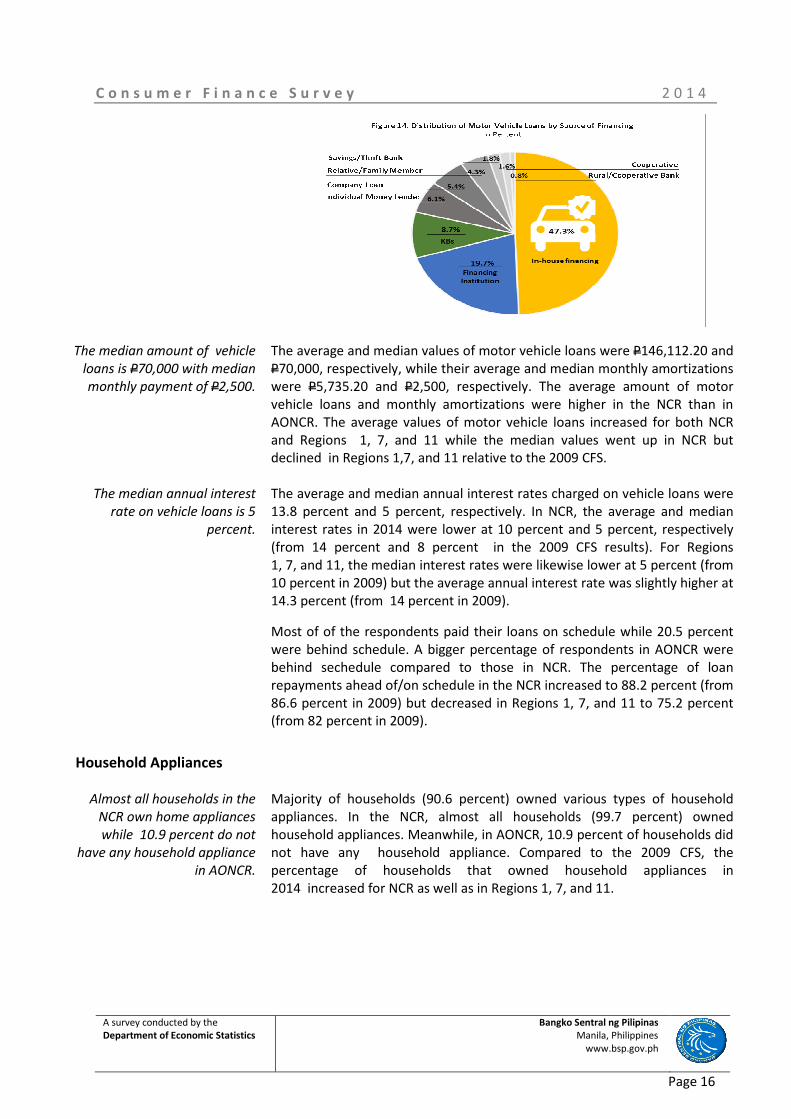
In-house financing and
financing institutions are the
top sources of motor vehicle
loans.
In-house financing and financing institutions (67 percent) were the two most
popular modes/sources of motor vehicle loans. This was observed both for
NCR and AONCR households. Other providers of motor vehicle loans were
commercial banks, individual money lenders, company (employer) loans,
relative/family members, saving/thrift banks, and cooperatives/rural banks.
The percentage of respondents in the NCR who availed of motor vehicle
loans from banks in 2014 increased to 25.1 percent (from 13.8 percent in the
2009 CFS). Likewise, the percentage of car loans availed from banks by the
households in Regions 1, 7, and 11 increased to 11.6 percent (from
2.2 percent in 2009).
C o n s u m e r F i n a n c e S u r v e y 2 0 1 4
A survey conducted by the
Department of Economic Statistics Bangko Sentral ng Pilipinas
Manila, Philippines
www.bsp.gov.ph
Page 16
The median amount of vehicle
loans is P70,000 with median
monthly payment of P2,500.
The average and median values of motor vehicle loans were P146,112.20 and
P70,000, respectively, while their average and median monthly amortizations
were P5,735.20 and P2,500, respectively. The average amount of motor
vehicle loans and monthly amortizations were higher in the NCR than in
AONCR. The average values of motor vehicle loans increased for both NCR
and Regions 1, 7, and 11 while the median values went up in NCR but
declined in Regions 1,7, and 11 relative to the 2009 CFS.
The median annual interest
rate on vehicle loans is 5
percent.
The average and median annual interest rates charged on vehicle loans were
13.8 percent and 5 percent, respectively. In NCR, the average and median
interest rates in 2014 were lower at 10 percent and 5 percent, respectively
(from 14 percent and 8 percent in the 2009 CFS results). For Regions
1, 7, and 11, the median interest rates were likewise lower at 5 percent (from
10 percent in 2009) but the average annual interest rate was slightly higher at
14.3 percent (from 14 percent in 2009).
Most of of the respondents paid their loans on schedule while 20.5 percent
were behind schedule. A bigger percentage of respondents in AONCR were
behind sechedule compared to those in NCR. The percentage of loan
repayments ahead of/on schedule in the NCR increased to 88.2 percent (from
86.6 percent in 2009) but decreased in Regions 1, 7, and 11 to 75.2 percent
(from 82 percent in 2009).
Household Appliances
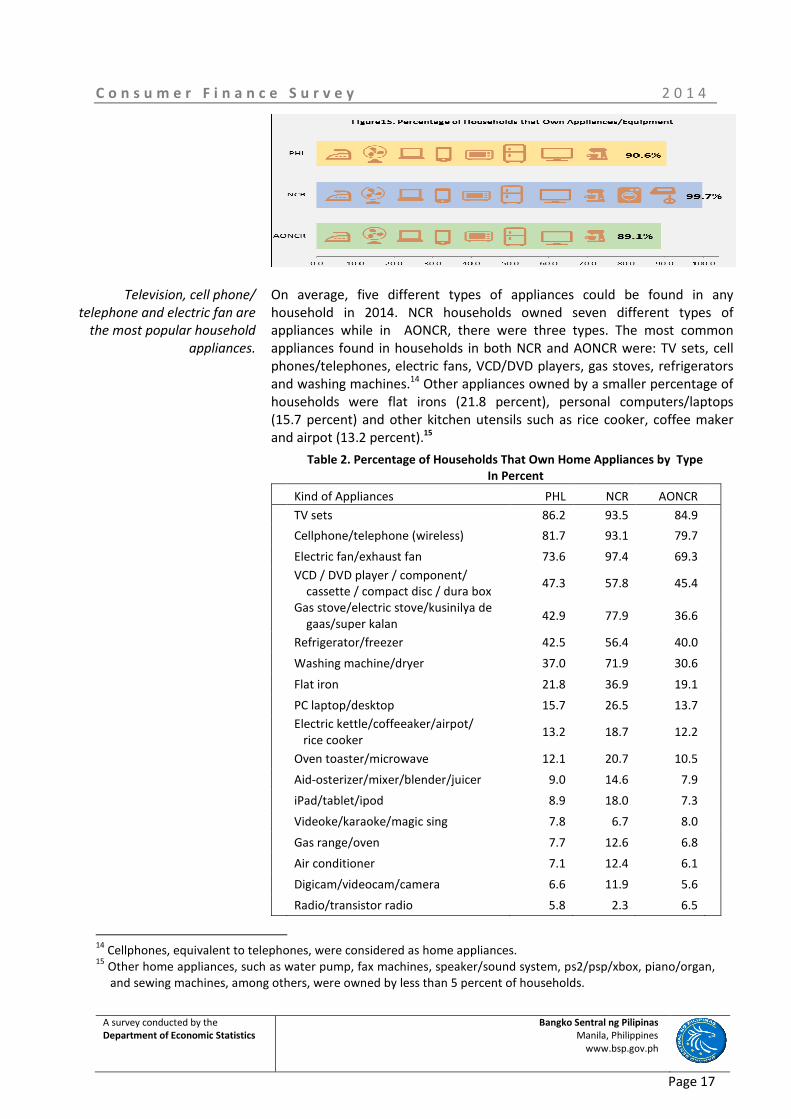
Almost all households in the
NCR own home appliances
while 10.9 percent do not
have any household appliance
in AONCR.
Majority of households (90.6 percent) owned various types of household
appliances. In the NCR, almost all households (99.7 percent) owned
household appliances. Meanwhile, in AONCR, 10.9 percent of households did
not have any household appliance. Compared to the 2009 CFS, the
percentage of households that owned household appliances in
2014 increased for NCR as well as in Regions 1, 7, and 11.
C o n s u m e r F i n a n c e S u r v e y 2 0 1 4
A survey conducted by the
Department of Economic Statistics Bangko Sentral ng Pilipinas
Manila, Philippines
www.bsp.gov.ph
Page 17
Television, cell phone/
telephone and electric fan are
the most popular household
appliances.
On average, five different types of appliances could be found in any
household in 2014. NCR households owned seven different types of
appliances while in AONCR, there were three types. The most common
appliances found in households in both NCR and AONCR were: TV sets, cell
phones/telephones, electric fans, VCD/DVD players, gas stoves, refrigerators
and washing machines.14
Other appliances owned by a smaller percentage of
households were flat irons (21.8 percent), personal computers/laptops
(15.7 percent) and other kitchen utensils such as rice cooker, coffee maker
and airpot (13.2 percent).15
Table 2. Percentage of Households That Own Home Appliances by Type
In Percent
Kind of Appliances PHL NCR AONCR
TV sets 86.2 93.5 84.9
Cellphone/telephone (wireless) 81.7 93.1 79.7
Electric fan/exhaust fan 73.6 97.4 69.3
VCD / DVD player / component/
cassette / compact disc / dura box 47.3 57.8 45.4
Gas stove/electric stove/kusinilya de
gaas/super kalan 42.9 77.9 36.6
Refrigerator/freezer 42.5 56.4 40.0
Washing machine/dryer 37.0 71.9 30.6
Flat iron 21.8 36.9 19.1
PC laptop/desktop 15.7 26.5 13.7
Electric kettle/coffeeaker/airpot/
rice cooker 13.2 18.7 12.2
Oven toaster/microwave 12.1 20.7 10.5
Aid-osterizer/mixer/blender/juicer 9.0 14.6 7.9
iPad/tablet/ipod 8.9 18.0 7.3
Videoke/karaoke/magic sing 7.8 6.7 8.0
Gas range/oven 7.7 12.6 6.8
Air conditioner 7.1 12.4 6.1
Digicam/videocam/camera 6.6 11.9 5.6
Radio/transistor radio 5.8 2.3 6.5
14
Cellphones, equivalent to telephones, were considered as home appliances. 15
Other home appliances, such as water pump, fax machines, speaker/sound system, ps2/psp/xbox, piano/organ,
and sewing machines, among others, were owned by less than 5 percent of households.
C o n s u m e r F i n a n c e S u r v e y 2 0 1 4
A survey conducted by the
Department of Economic Statistics Bangko Sentral ng Pilipinas
Manila, Philippines
www.bsp.gov.ph
Page 18
Home Appliance Loans
Most households do not have
an appliance loan.
Very few households had an appliance loan. This holds true for both NCR and
AONCR, with only 1.3 percent and 1.6 percent of households, respectively,
reporting that they had an outstanding home appliance loan.
Home appliance loans are
obtained mainly through
in-house financing in AONCR
and through individual money
lenders in NCR.
Among those who had outstanding loans on household appliances, the top
three sources of home appliance loans were in-house financing/financing
institutions and individual money lenders. Other major sources of home
appliance loans were family members, commercial banks and credit card
companies.
Table 3. Distribution of Loan Provider for Home Appliances (In Percent)
PHL NCR AONCR
In-house financing 39.2 10.0 43.5
Financing institution 20.7 13.9 21.7
Individual money lender 12.6 23.8 10.9
Relative / family member 5.1 10.1 4.4
Company (employer) loan 4.9 0.0 5.7
Credit card company 4.2 18.9 2.1
Cooperative 3.7 4.4 3.6
Commercial bank 3.2 14.2 1.6
Savings/thrift Bank 2.0 0.0 2.2
SSS 1.0 4.8 0.5
Rural/cooperative bank 0.9 0.0 1.0
GSIS 0.4 0.0 0.4
Don't know 0.4 0.0 0.5
Refused 1.7 0.0 1.9
Ownership of Precious Objects16
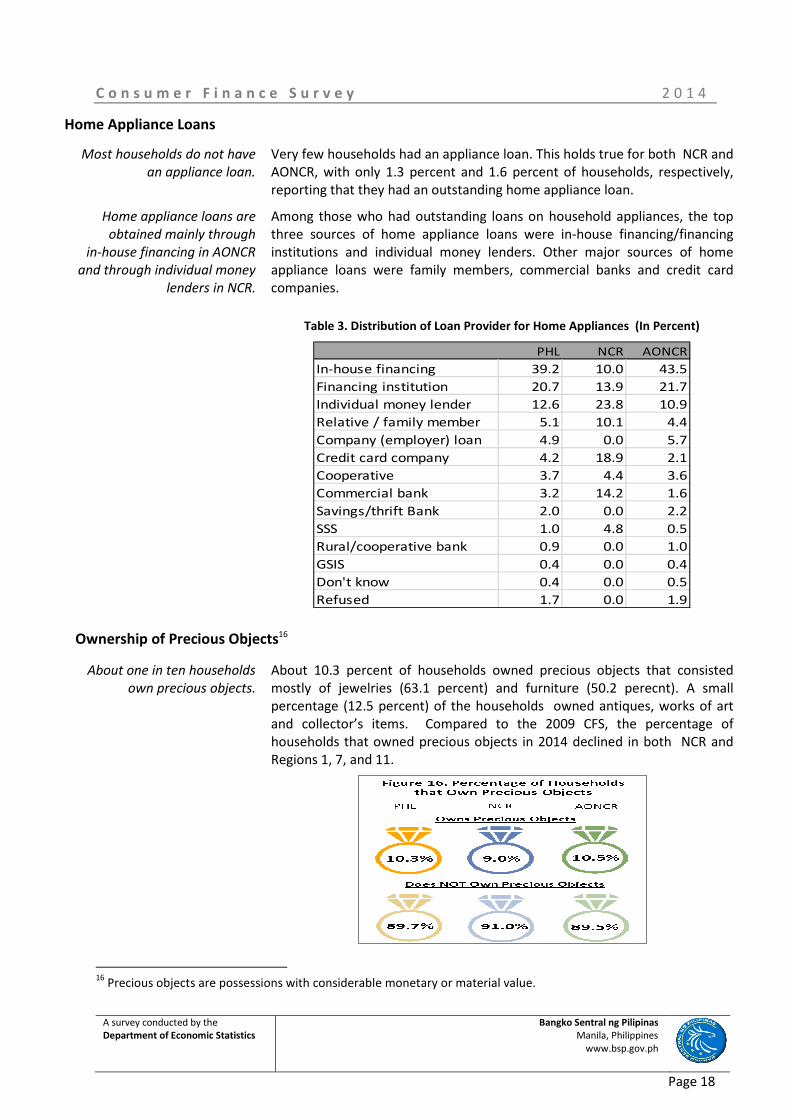
About one in ten households
own precious objects.
About 10.3 percent of households owned precious objects that consisted
mostly of jewelries (63.1 percent) and furniture (50.2 perecnt). A small
percentage (12.5 percent) of the households owned antiques, works of art
and collector’s items. Compared to the 2009 CFS, the percentage of
households that owned precious objects in 2014 declined in both NCR and
Regions 1, 7, and 11.
16
Precious objects are possessions with considerable monetary or material value.
C o n s u m e r F i n a n c e S u r v e y 2 0 1 4
A survey conducted by the
Department of Economic Statistics Bangko Sentral ng Pilipinas
Manila, Philippines
www.bsp.gov.ph
Page 19
Antiques are the most
valuable precious objects
owned by households.
The highest estimated average and median values among precious objects
were those of antiques at P59,396.90 and P10,000, respectively. The second
highest average value pertained to jewelries (P25,396.80), followed by works
of art (P23,176.70) and furnitures (P13,762.30).
4. Financial Assets
Deposit/Cash Accounts
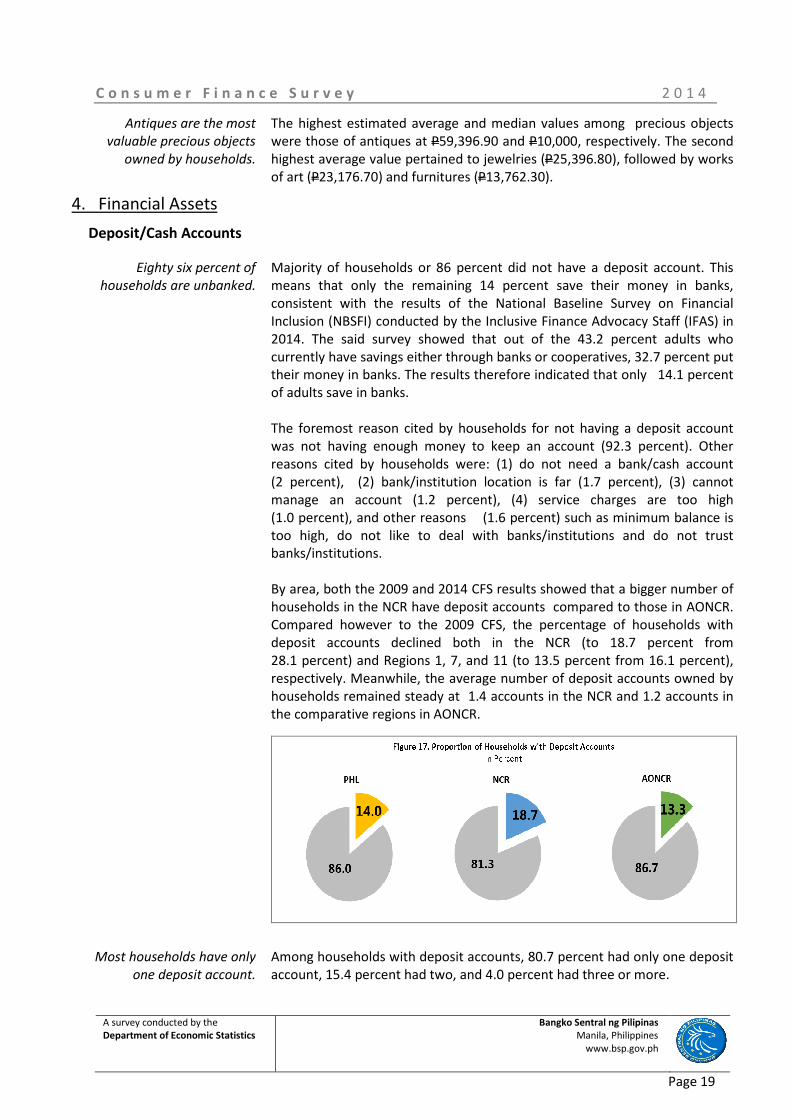
Eighty six percent of
households are unbanked.
Majority of households or 86 percent did not have a deposit account. This
means that only the remaining 14 percent save their money in banks,
consistent with the results of the National Baseline Survey on Financial
Inclusion (NBSFI) conducted by the Inclusive Finance Advocacy Staff (IFAS) in
2014. The said survey showed that out of the 43.2 percent adults who
currently have savings either through banks or cooperatives, 32.7 percent put
their money in banks. The results therefore indicated that only 14.1 percent
of adults save in banks.
The foremost reason cited by households for not having a deposit account
was not having enough money to keep an account (92.3 percent). Other
reasons cited by households were: (1) do not need a bank/cash account
(2 percent), (2) bank/institution location is far (1.7 percent), (3) cannot
manage an account (1.2 percent), (4) service charges are too high
(1.0 percent), and other reasons (1.6 percent) such as minimum balance is
too high, do not like to deal with banks/institutions and do not trust
banks/institutions.
By area, both the 2009 and 2014 CFS results showed that a bigger number of
households in the NCR have deposit accounts compared to those in AONCR.
Compared however to the 2009 CFS, the percentage of households with
deposit accounts declined both in the NCR (to 18.7 percent from
28.1 percent) and Regions 1, 7, and 11 (to 13.5 percent from 16.1 percent),
respectively. Meanwhile, the average number of deposit accounts owned by
households remained steady at 1.4 accounts in the NCR and 1.2 accounts in
the comparative regions in AONCR.
Most households have only
one deposit account.
Among households with deposit accounts, 80.7 percent had only one deposit
account, 15.4 percent had two, and 4.0 percent had three or more.
C o n s u m e r F i n a n c e S u r v e y 2 0 1 4
A survey conducted by the
Department of Economic Statistics Bangko Sentral ng Pilipinas
Manila, Philippines
www.bsp.gov.ph
Page 20
A small percentage of deposit
accounts are in foreign
currency.
Nearly all (99.5 percent) of the deposit accounts were maintained in the
country. Only 0.5 percent of bank accounts were in the US (0.2 percent), and
other countries such as Saudi Arabia, New Zealand and Norway (0.4 percent).
For deposit accounts in the Philippines, 99.4 percent were in pesos,
0.4 percent were in US Dollars and the remaining 0.3 percent were in other
foreign currencies.17
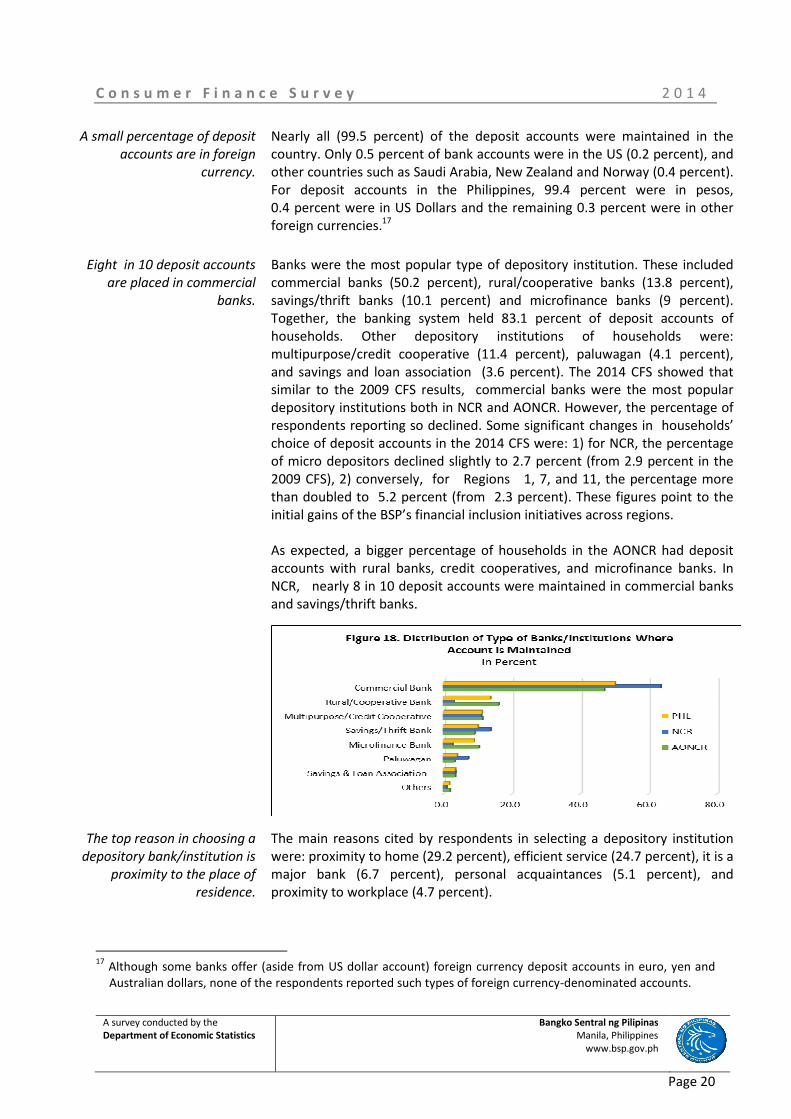
Eight in 10 deposit accounts
are placed in commercial
banks.
Banks were the most popular type of depository institution. These included
commercial banks (50.2 percent), rural/cooperative banks (13.8 percent),
savings/thrift banks (10.1 percent) and microfinance banks (9 percent).
Together, the banking system held 83.1 percent of deposit accounts of
households. Other depository institutions of households were:
multipurpose/credit cooperative (11.4 percent), paluwagan (4.1 percent),
and savings and loan association (3.6 percent). The 2014 CFS showed that
similar to the 2009 CFS results, commercial banks were the most popular
depository institutions both in NCR and AONCR. However, the percentage of
respondents reporting so declined. Some significant changes in households’
choice of deposit accounts in the 2014 CFS were: 1) for NCR, the percentage
of micro depositors declined slightly to 2.7 percent (from 2.9 percent in the
2009 CFS), 2) conversely, for Regions 1, 7, and 11, the percentage more
than doubled to 5.2 percent (from 2.3 percent). These figures point to the
initial gains of the BSP’s financial inclusion initiatives across regions.
As expected, a bigger percentage of households in the AONCR had deposit
accounts with rural banks, credit cooperatives, and microfinance banks. In
NCR, nearly 8 in 10 deposit accounts were maintained in commercial banks
and savings/thrift banks.
The top reason in choosing a
depository bank/institution is
proximity to the place of
residence.
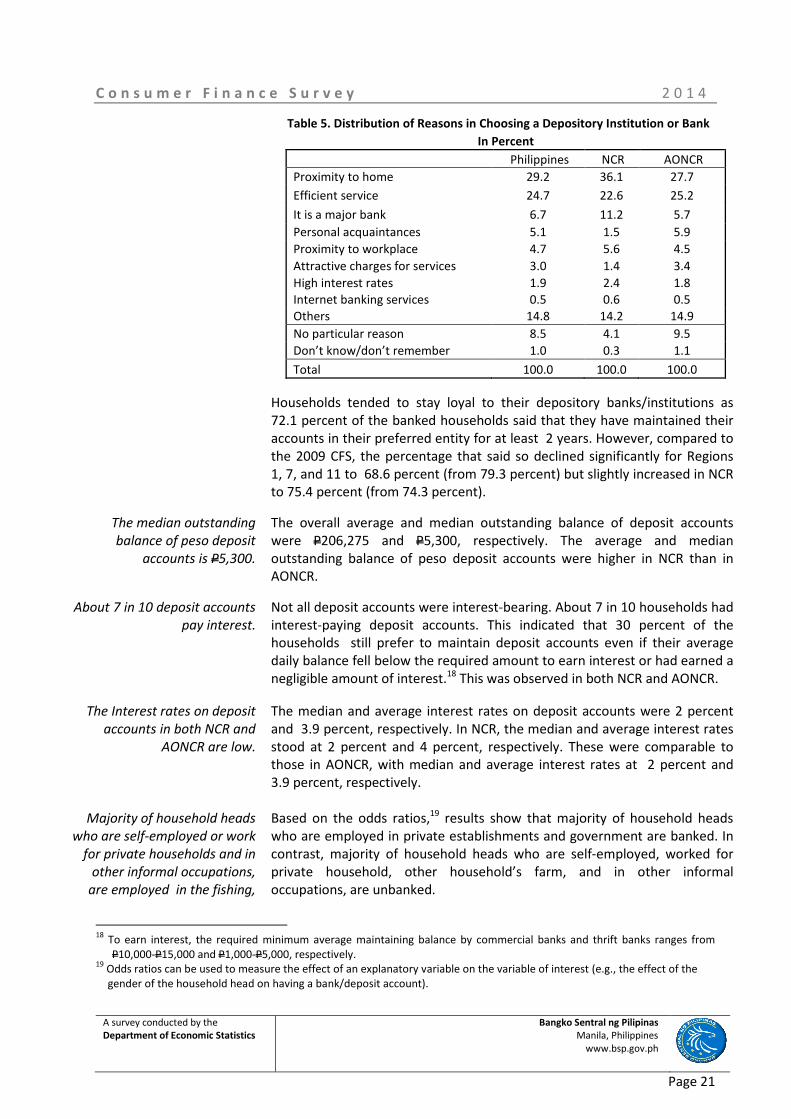
The main reasons cited by respondents in selecting a depository institution
were: proximity to home (29.2 percent), efficient service (24.7 percent), it is a
major bank (6.7 percent), personal acquaintances (5.1 percent), and
proximity to workplace (4.7 percent).
17
Although some banks offer (aside from US dollar account) foreign currency deposit accounts in euro, yen and
Australian dollars, none of the respondents reported such types of foreign currency-denominated accounts.
C o n s u m e r F i n a n c e S u r v e y 2 0 1 4
A survey conducted by the
Department of Economic Statistics Bangko Sentral ng Pilipinas
Manila, Philippines
www.bsp.gov.ph
Page 21
Table 5. Distribution of Reasons in Choosing a Depository Institution or Bank
In Percent
Philippines NCR AONCR
Proximity to home 29.2 36.1 27.7
Efficient service 24.7 22.6 25.2
It is a major bank 6.7 11.2 5.7
Personal acquaintances 5.1 1.5 5.9
Proximity to workplace 4.7 5.6 4.5
Attractive charges for services 3.0 1.4 3.4
High interest rates 1.9 2.4 1.8
Internet banking services 0.5 0.6 0.5
Others 14.8 14.2 14.9
No particular reason 8.5 4.1 9.5
Don’t know/don’t remember 1.0 0.3 1.1
Total 100.0 100.0 100.0
Households tended to stay loyal to their depository banks/institutions as
72.1 percent of the banked households said that they have maintained their
accounts in their preferred entity for at least 2 years. However, compared to
the 2009 CFS, the percentage that said so declined significantly for Regions
1, 7, and 11 to 68.6 percent (from 79.3 percent) but slightly increased in NCR
to 75.4 percent (from 74.3 percent).
The median outstanding
balance of peso deposit
accounts is P5,300.
The overall average and median outstanding balance of deposit accounts
were P206,275 and P5,300, respectively. The average and median
outstanding balance of peso deposit accounts were higher in NCR than in
AONCR.
About 7 in 10 deposit accounts
pay interest.
Not all deposit accounts were interest-bearing. About 7 in 10 households had
interest-paying deposit accounts. This indicated that 30 percent of the
households still prefer to maintain deposit accounts even if their average
daily balance fell below the required amount to earn interest or had earned a
negligible amount of interest.18
This was observed in both NCR and AONCR.
The Interest rates on deposit
accounts in both NCR and
AONCR are low.
Majority of household heads
who are self-employed or work
for private households and in
other informal occupations,
are employed in the fishing,
The median and average interest rates on deposit accounts were 2 percent
and 3.9 percent, respectively. In NCR, the median and average interest rates
stood at 2 percent and 4 percent, respectively. These were comparable to
those in AONCR, with median and average interest rates at 2 percent and
3.9 percent, respectively.
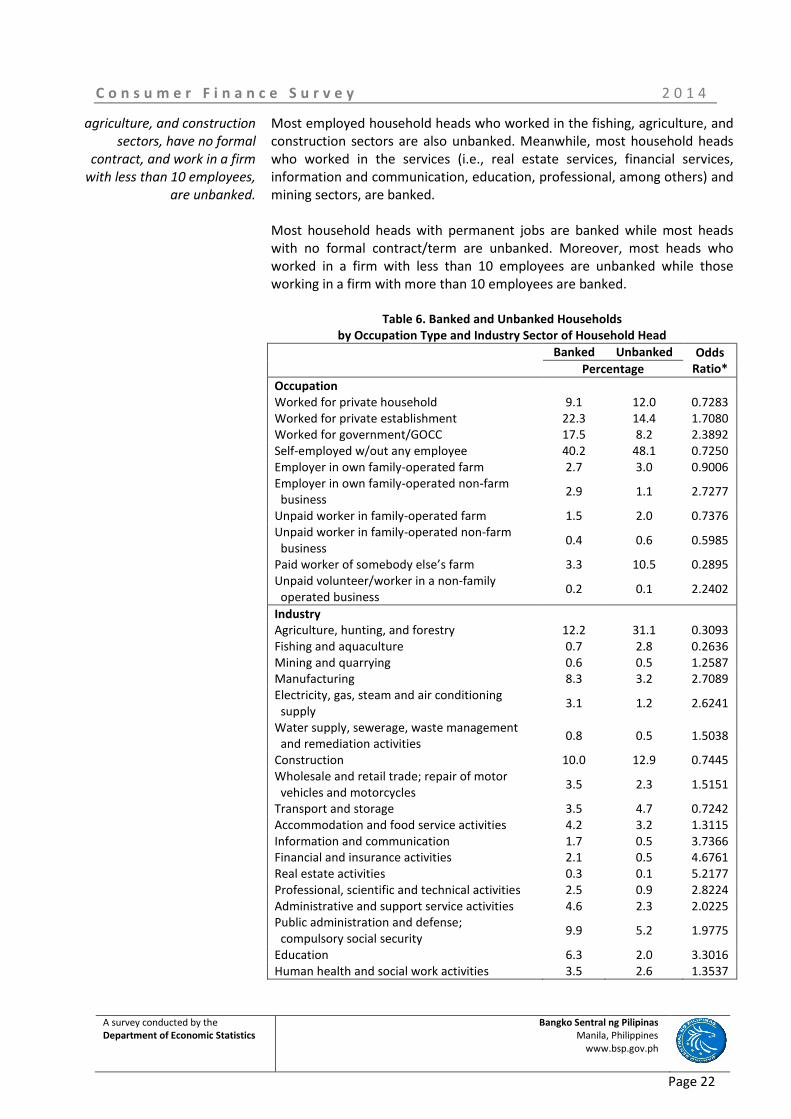
Based on the odds ratios,19
results show that majority of household heads
who are employed in private establishments and government are banked. In
contrast, majority of household heads who are self-employed, worked for
private household, other household’s farm, and in other informal
occupations, are unbanked.
18
To earn interest, the required minimum average maintaining balance by commercial banks and thrift banks ranges from
P10,000-P15,000 and P1,000-P5,000, respectively. 19
Odds ratios can be used to measure the effect of an explanatory variable on the variable of interest (e.g., the effect of the
gender of the household head on having a bank/deposit account).
C o n s u m e r F i n a n c e S u r v e y 2 0 1 4
A survey conducted by the
Department of Economic Statistics Bangko Sentral ng Pilipinas
Manila, Philippines
www.bsp.gov.ph
Page 22
agriculture, and construction
sectors, have no formal
contract, and work in a firm
with less than 10 employees,
are unbanked.
Most employed household heads who worked in the fishing, agriculture, and
construction sectors are also unbanked. Meanwhile, most household heads
who worked in the services (i.e., real estate services, financial services,
information and communication, education, professional, among others) and
mining sectors, are banked.
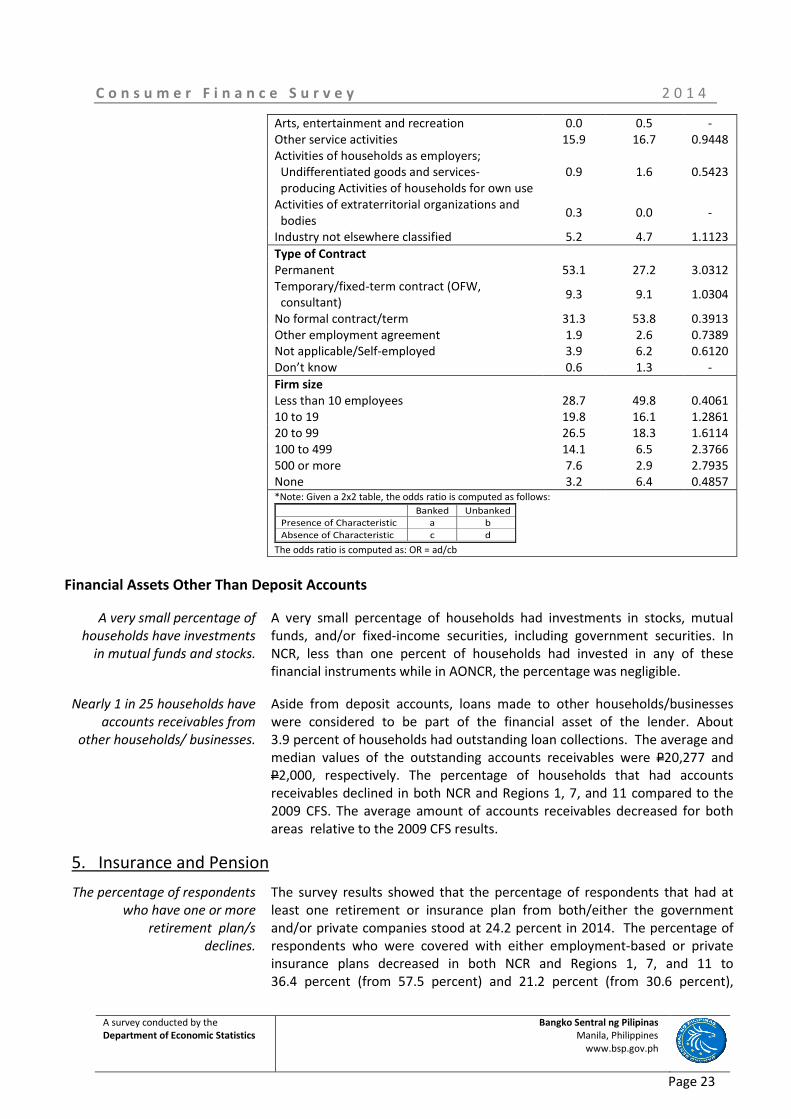
Most household heads with permanent jobs are banked while most heads
with no formal contract/term are unbanked. Moreover, most heads who
worked in a firm with less than 10 employees are unbanked while those
working in a firm with more than 10 employees are banked.
Table 6. Banked and Unbanked Households
by Occupation Type and Industry Sector of Household Head
Banked Unbanked Odds
Ratio* Percentage
Occupation
Worked for private household 9.1 12.0 0.7283
Worked for private establishment 22.3 14.4 1.7080
Worked for government/GOCC 17.5 8.2 2.3892
Self-employed w/out any employee 40.2 48.1 0.7250
Employer in own family-operated farm 2.7 3.0 0.9006
Employer in own family-operated non-farm
business 2.9 1.1 2.7277
Unpaid worker in family-operated farm 1.5 2.0 0.7376
Unpaid worker in family-operated non-farm
business 0.4 0.6 0.5985
Paid worker of somebody else’s farm 3.3 10.5 0.2895
Unpaid volunteer/worker in a non-family
operated business 0.2 0.1 2.2402
Industry
Agriculture, hunting, and forestry 12.2 31.1 0.3093
Fishing and aquaculture 0.7 2.8 0.2636
Mining and quarrying 0.6 0.5 1.2587
Manufacturing 8.3 3.2 2.7089
Electricity, gas, steam and air conditioning
supply 3.1 1.2 2.6241
Water supply, sewerage, waste management
and remediation activities 0.8 0.5 1.5038
Construction 10.0 12.9 0.7445
Wholesale and retail trade; repair of motor
vehicles and motorcycles 3.5 2.3 1.5151
Transport and storage 3.5 4.7 0.7242
Accommodation and food service activities 4.2 3.2 1.3115
Information and communication 1.7 0.5 3.7366
Financial and insurance activities 2.1 0.5 4.6761
Real estate activities 0.3 0.1 5.2177
Professional, scientific and technical activities 2.5 0.9 2.8224
Administrative and support service activities 4.6 2.3 2.0225
Public administration and defense;
compulsory social security 9.9 5.2 1.9775
Education 6.3 2.0 3.3016
Human health and social work activities 3.5 2.6 1.3537
C o n s u m e r F i n a n c e S u r v e y 2 0 1 4
A survey conducted by the
Department of Economic Statistics Bangko Sentral ng Pilipinas
Manila, Philippines
www.bsp.gov.ph
Page 23
Arts, entertainment and recreation 0.0 0.5 -
Other service activities 15.9 16.7 0.9448
Activities of households as employers;
Undifferentiated goods and services-
producing Activities of households for own use
0.9 1.6 0.5423
Activities of extraterritorial organizations and
bodies 0.3 0.0 -
Industry not elsewhere classified 5.2 4.7 1.1123
Type of Contract
Permanent 53.1 27.2 3.0312
Temporary/fixed-term contract (OFW,
consultant) 9.3 9.1 1.0304
No formal contract/term 31.3 53.8 0.3913
Other employment agreement 1.9 2.6 0.7389
Not applicable/Self-employed 3.9 6.2 0.6120
Don’t know 0.6 1.3 -
Firm size
Less than 10 employees 28.7 49.8 0.4061
10 to 19 19.8 16.1 1.2861
20 to 99 26.5 18.3 1.6114
100 to 499 14.1 6.5 2.3766
500 or more 7.6 2.9 2.7935
None 3.2 6.4 0.4857 *Note: Given a 2x2 table, the odds ratio is computed as follows:
Banked Unbanked
Presence of Characteristic a b
Absence of Characteristic c d
The odds ratio is computed as: OR = ad/cb
Financial Assets Other Than Deposit Accounts
A very small percentage of
households have investments
in mutual funds and stocks.
A very small percentage of households had investments in stocks, mutual
funds, and/or fixed-income securities, including government securities. In
NCR, less than one percent of households had invested in any of these
financial instruments while in AONCR, the percentage was negligible.
Nearly 1 in 25 households have
accounts receivables from
other households/ businesses.
Aside from deposit accounts, loans made to other households/businesses
were considered to be part of the financial asset of the lender. About
3.9 percent of households had outstanding loan collections. The average and
median values of the outstanding accounts receivables were P20,277 and
P2,000, respectively. The percentage of households that had accounts
receivables declined in both NCR and Regions 1, 7, and 11 compared to the
2009 CFS. The average amount of accounts receivables decreased for both
areas relative to the 2009 CFS results.
5. Insurance and Pension
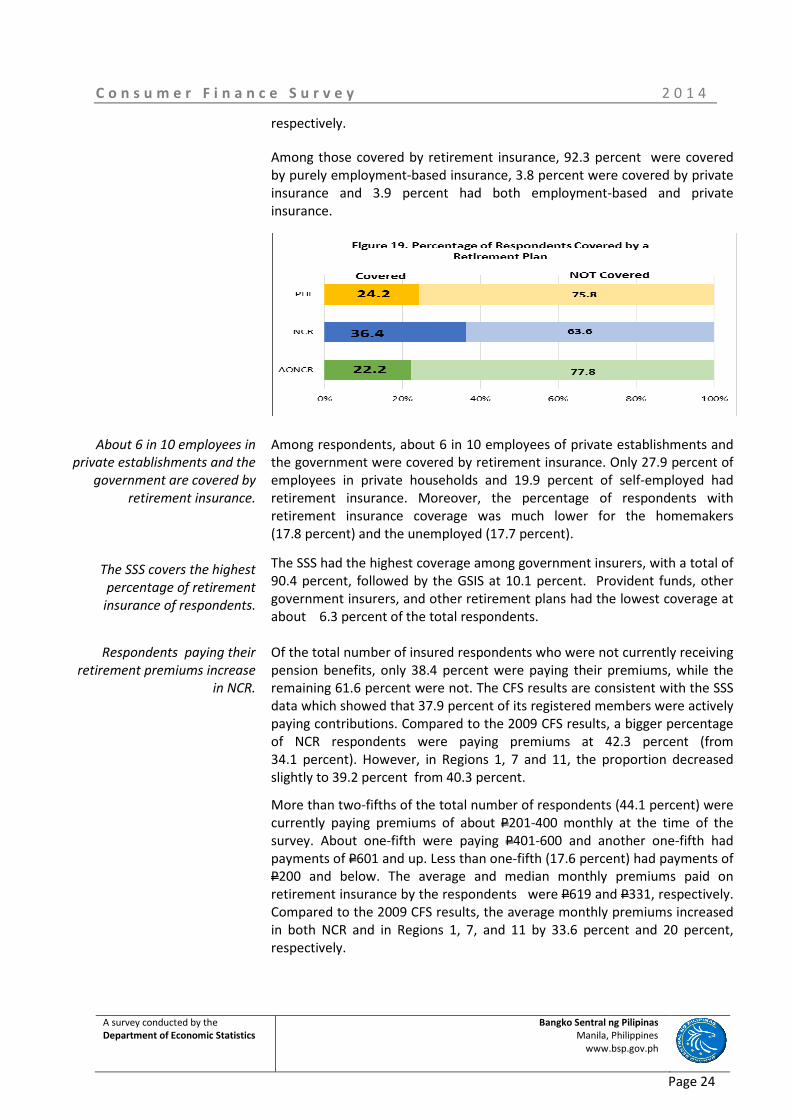
The percentage of respondents
who have one or more
retirement plan/s
declines.
The survey results showed that the percentage of respondents that had at
least one retirement or insurance plan from both/either the government
and/or private companies stood at 24.2 percent in 2014. The percentage of
respondents who were covered with either employment-based or private
insurance plans decreased in both NCR and Regions 1, 7, and 11 to
36.4 percent (from 57.5 percent) and 21.2 percent (from 30.6 percent),
C o n s u m e r F i n a n c e S u r v e y 2 0 1 4
A survey conducted by the
Department of Economic Statistics Bangko Sentral ng Pilipinas
Manila, Philippines
www.bsp.gov.ph
Page 24
respectively.
Among those covered by retirement insurance, 92.3 percent were covered
by purely employment-based insurance, 3.8 percent were covered by private
insurance and 3.9 percent had both employment-based and private
insurance.
About 6 in 10 employees in
private establishments and the
government are covered by
retirement insurance.
The SSS covers the highest
percentage of retirement
insurance of respondents.
Among respondents, about 6 in 10 employees of private establishments and
the government were covered by retirement insurance. Only 27.9 percent of
employees in private households and 19.9 percent of self-employed had
retirement insurance. Moreover, the percentage of respondents with
retirement insurance coverage was much lower for the homemakers
(17.8 percent) and the unemployed (17.7 percent).
The SSS had the highest coverage among government insurers, with a total of
90.4 percent, followed by the GSIS at 10.1 percent. Provident funds, other
government insurers, and other retirement plans had the lowest coverage at
about 6.3 percent of the total respondents.
Respondents paying their
retirement premiums increase
in NCR.
Of the total number of insured respondents who were not currently receiving
pension benefits, only 38.4 percent were paying their premiums, while the
remaining 61.6 percent were not. The CFS results are consistent with the SSS
data which showed that 37.9 percent of its registered members were actively
paying contributions. Compared to the 2009 CFS results, a bigger percentage
of NCR respondents were paying premiums at 42.3 percent (from
34.1 percent). However, in Regions 1, 7 and 11, the proportion decreased
slightly to 39.2 percent from 40.3 percent.
More than two-fifths of the total number of respondents (44.1 percent) were
currently paying premiums of about P201-400 monthly at the time of the
survey. About one-fifth were paying P401-600 and another one-fifth had
payments of P601 and up. Less than one-fifth (17.6 percent) had payments of
P200 and below. The average and median monthly premiums paid on
retirement insurance by the respondents were P619 and P331, respectively.
Compared to the 2009 CFS results, the average monthly premiums increased
in both NCR and in Regions 1, 7, and 11 by 33.6 percent and 20 percent,
respectively.
C o n s u m e r F i n a n c e S u r v e y 2 0 1 4
A survey conducted by the
Department of Economic Statistics Bangko Sentral ng Pilipinas
Manila, Philippines
www.bsp.gov.ph
Page 25
The percentage of
respondents’ spouses who
have one
or more retirement
plans declines to
27.1 percent.
The percentage of respondents’ spouses who had at least one retirement or
insurance plan from both/either the government and/or private companies
declined to 27.1 percent in 2014 from 44.9 percent in 2009. The same trend
was evident in both the NCR and AONCR as the percentage of respondents’
spouses who were covered with either employment-based or private
insurance plans dropped to 41.7 percent from 62.4 percent in NCR and to
22.5 percent from 31.4 percent in Regions 1, 7 and 11.
Among respondents’ spouses employed in private establishments and the
government, about 6 in 10 are covered by retirement insurance. About
36.6 percent of respondents’ spouses employed in private households had
retirement insurance. Retirement insurance coverage among respondents’
spouses who are homemakers and unemployed were lower at 14.3 percent
and 16.1 percent, respectively.
The SSS covers the highest
percentage of retirement
insurance of respondents’
spouses.
Among respondents’ spouses, the SSS had the highest coverage among
government insurers with a total of 91.9 percent. This was followed by the
GSIS at 9 percent, and provident funds and other government insurers
accounting for 5.6 percent of the total respondents’ spouses covered by
insurance.
Almost half of respondents’
spouses are paying premiums
of about P201-400 monthly.
Forty-seven percent of the respondents’ spouses were currently paying
premiums of about P201-400 monthly at the time of the survey while
19.5 percent were paying P200 and below. About 19 percent were paying
P401-600 while 14.9 percent had payments of P600 and above. The average
and median monthly premiums paid by the respondents’ spouses through
employment-based insurers were P612 and P330, respectively. Compared to
the 2009 CFS, the average monthly premiums of respondents’ spouses
increased by 38 percent in NCR and 60.8 percent in Regions 1, 7, and 11.
6. Inheritance
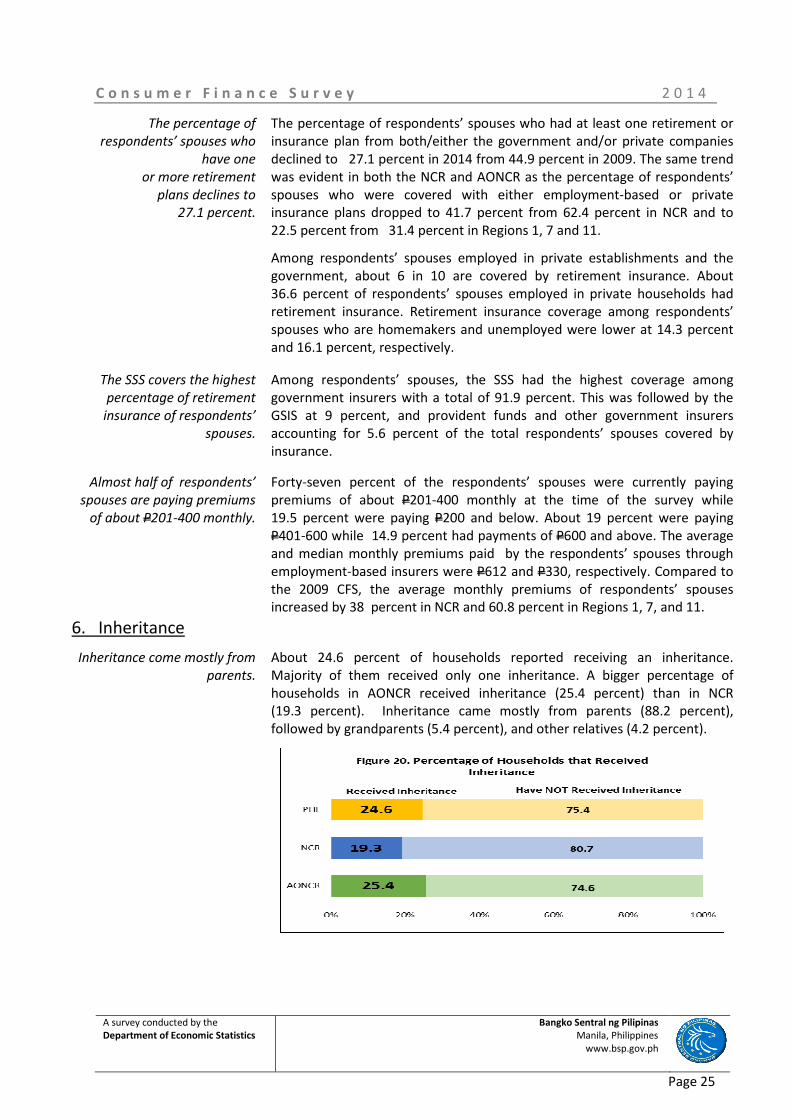
Inheritance come mostly from
parents.
About 24.6 percent of households reported receiving an inheritance.
Majority of them received only one inheritance. A bigger percentage of
households in AONCR received inheritance (25.4 percent) than in NCR
(19.3 percent). Inheritance came mostly from parents (88.2 percent),
followed by grandparents (5.4 percent), and other relatives (4.2 percent).
C o n s u m e r F i n a n c e S u r v e y 2 0 1 4
A survey conducted by the
Department of Economic Statistics Bangko Sentral ng Pilipinas
Manila, Philippines
www.bsp.gov.ph
Page 26
The most common inheritance
received is in the form of land,
farm, and house.
The most common inheritance received was real estate such as land or farm
(58.0 percent), and houses, condominiums, and townhouses (30.4 percent).
Households also received inheritance in the form of house and lot
(9.9 percent), cash (1.9 percent) and others (0.9 percent). Inheritance
received by both NCR and AONCR households followed the national pattern.
7. Credit Cards and Other Loans
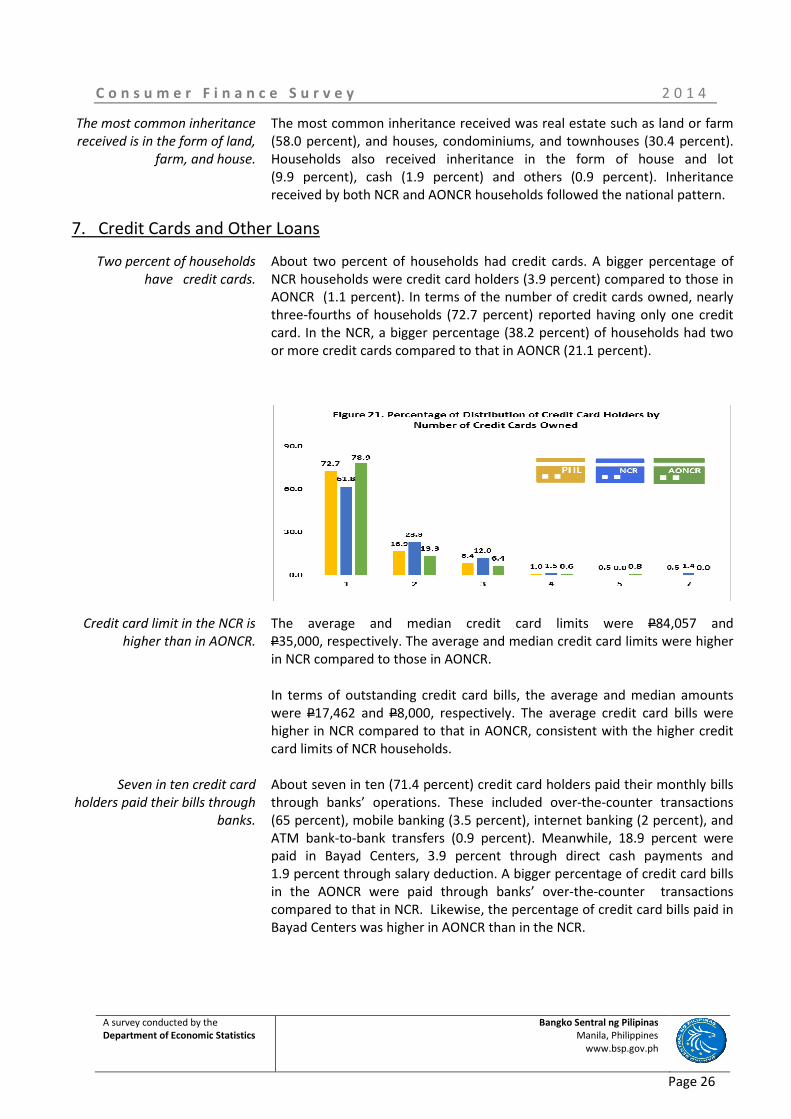
Two percent of households
have credit cards.
About two percent of households had credit cards. A bigger percentage of
NCR households were credit card holders (3.9 percent) compared to those in
AONCR (1.1 percent). In terms of the number of credit cards owned, nearly
three-fourths of households (72.7 percent) reported having only one credit
card. In the NCR, a bigger percentage (38.2 percent) of households had two
or more credit cards compared to that in AONCR (21.1 percent).
Credit card limit in the NCR is
higher than in AONCR.
The average and median credit card limits were P84,057 and
P35,000, respectively. The average and median credit card limits were higher
in NCR compared to those in AONCR.
Seven in ten credit card
holders paid their bills through
banks.
In terms of outstanding credit card bills, the average and median amounts
were P17,462 and P8,000, respectively. The average credit card bills were
higher in NCR compared to that in AONCR, consistent with the higher credit
card limits of NCR households.
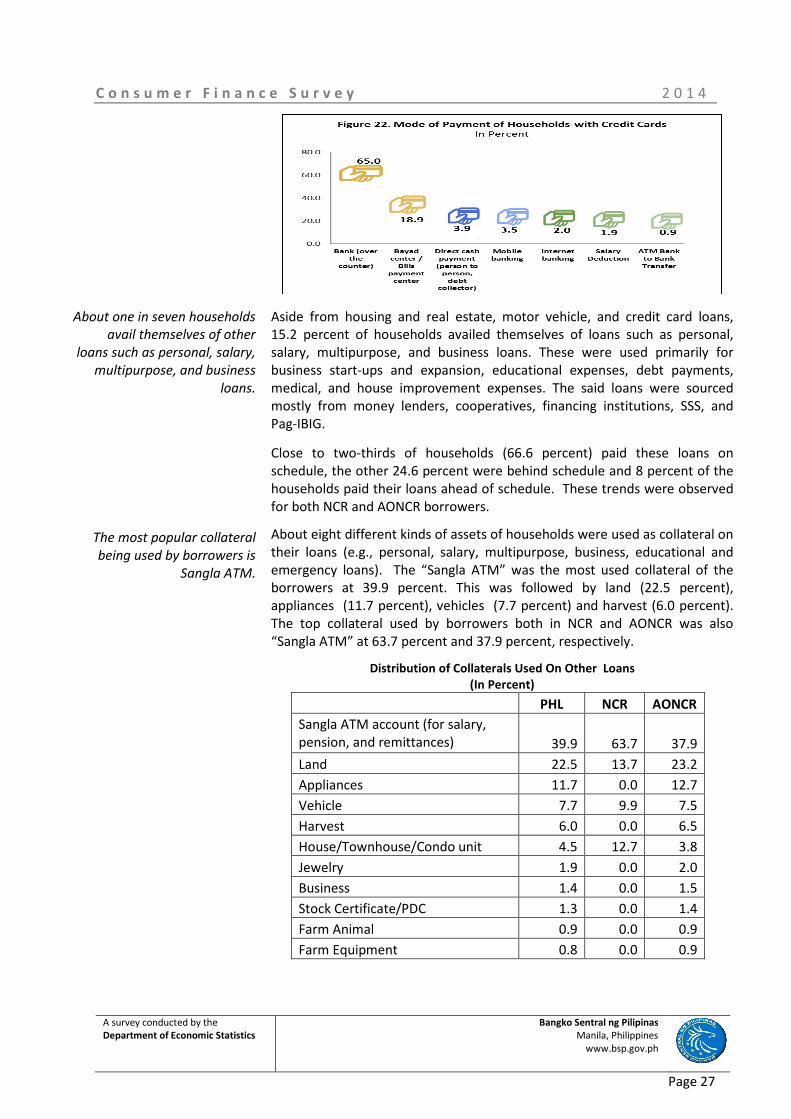
About seven in ten (71.4 percent) credit card holders paid their monthly bills
through banks’ operations. These included over-the-counter transactions
(65 percent), mobile banking (3.5 percent), internet banking (2 percent), and
ATM bank-to-bank transfers (0.9 percent). Meanwhile, 18.9 percent were
paid in Bayad Centers, 3.9 percent through direct cash payments and
1.9 percent through salary deduction. A bigger percentage of credit card bills
in the AONCR were paid through banks’ over-the-counter transactions
compared to that in NCR. Likewise, the percentage of credit card bills paid in
Bayad Centers was higher in AONCR than in the NCR.
C o n s u m e r F i n a n c e S u r v e y 2 0 1 4
A survey conducted by the
Department of Economic Statistics Bangko Sentral ng Pilipinas
Manila, Philippines
www.bsp.gov.ph
Page 27
About one in seven households
avail themselves of other
loans such as personal, salary,
multipurpose, and business
loans.
Aside from housing and real estate, motor vehicle, and credit card loans,
15.2 percent of households availed themselves of loans such as personal,
salary, multipurpose, and business loans. These were used primarily for
business start-ups and expansion, educational expenses, debt payments,
medical, and house improvement expenses. The said loans were sourced
mostly from money lenders, cooperatives, financing institutions, SSS, and
Pag-IBIG.
The most popular collateral
being used by borrowers is
Sangla ATM.
Close to two-thirds of households (66.6 percent) paid these loans on
schedule, the other 24.6 percent were behind schedule and 8 percent of the
households paid their loans ahead of schedule. These trends were observed
for both NCR and AONCR borrowers.
About eight different kinds of assets of households were used as collateral on
their loans (e.g., personal, salary, multipurpose, business, educational and
emergency loans). The “Sangla ATM” was the most used collateral of the
borrowers at 39.9 percent. This was followed by land (22.5 percent),
appliances (11.7 percent), vehicles (7.7 percent) and harvest (6.0 percent).
The top collateral used by borrowers both in NCR and AONCR was also
“Sangla ATM” at 63.7 percent and 37.9 percent, respectively.
Distribution of Collaterals Used On Other Loans
(In Percent)
PHL NCR AONCR
Sangla ATM account (for salary,
pension, and remittances) 39.9 63.7 37.9
Land 22.5 13.7 23.2
Appliances 11.7 0.0 12.7
Vehicle 7.7 9.9 7.5
Harvest 6.0 0.0 6.5
House/Townhouse/Condo unit 4.5 12.7 3.8
Jewelry 1.9 0.0 2.0
Business 1.4 0.0 1.5
Stock Certificate/PDC 1.3 0.0 1.4
Farm Animal 0.9 0.0 0.9
Farm Equipment 0.8 0.0 0.9
C o n s u m e r F i n a n c e S u r v e y 2 0 1 4
A survey conducted by the
Department of Economic Statistics Bangko Sentral ng Pilipinas
Manila, Philippines
www.bsp.gov.ph
Page 28
C. Income and Expenditures
The main sources of household
income are wages and
salaries.
Food and beverage consumed
at home is the main household
expenditure.
More than half (50.5 percent) of the respondents’ household income came
from wages and salaries. Other sources of household income were
businesses including self-employment (18.1 percent), financial assistance
from government (13.5 percent), financial assistance from abroad
(13.2 percent) and financial assistance from other households (10 percent).20
Food and beverages consumed at home accounted for 42.7 percent of the
annual household expenditures. This was followed by rent (12.2 percent),
regular transportation (9 percent), education (6.5 percent), food and
beverage consumed outside the home (6.4 percent), electricity (6.2 percent),
medicine and medical services (3.7 percent), utilities such as gas and water
(3.1 percent), communication (3.1 percent), house repairs and maintenance
(2.5 percent), clothing (1.2 percent), travel and recreation, celebration during
special occasions, and purchase of furniture and appliances at 0.8 percent
each,21
and household help services (0.6 percent).
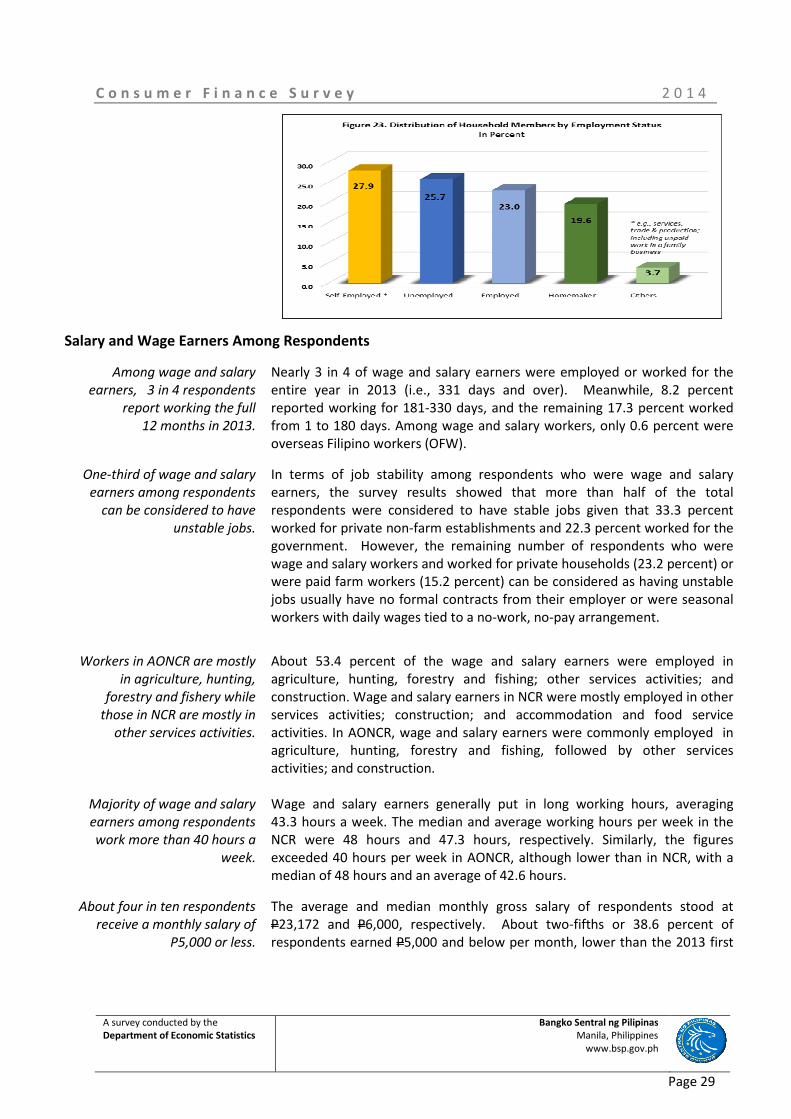
1. Work and Income
Work and Income of Respondent
More than 50 percent of
respondents are working.
About 50.5 percent of respondents were working and reported the following
as their work status: self-employed (27.9 percent), employee or wage and
salary worker (22.1 percent), employer of a business (0.5 percent) and other
such as OFW (0.2 percent), farmer (0.1 percent) and labourer (0.1 percent)
Homemakers accounted for 19.6 percent, while a significant proportion of
respondents were unemployed (25.0 percent).22
Other respondents were
retired employees, permanently disabled persons and students (2.7 percent,
0.7 percent, and 0.5 percent, respectively). The higher percentage of
respondents that reported their status to be unemployed relative to the
PSA’s official unemployment figures can be attributed to the
“underemployed” respondents who considered themselves as unemployed
during the survey.23
Most respondents who were working had only one type of job (96 percent),
while 3.9 percent held two types of jobs, e.g., the respondent worked both as
an employee and as self-employed in a farm or business.
20
The total adds up to more than 100 percent inasmuch as some households had multiple sources of income. 21
Rent included imputed rental values for residences owned by households. 22
The unemployment and underemployment rates recorded by the PSA in the last quarter of 2013 and first
quarter of 2014 were 24.4 percent and 27 percent, respectively. 23
Based on PSA’s definition, underemployed persons include all employed persons who expressed the desire to
have additional hours of work in their present job or an additional job, or to have a new job with longer working
hours. Visibly underemployed persons are those who work for less than 40 hours during the reference period
and want additional hours of work.
C o n s u m e r F i n a n c e S u r v e y 2 0 1 4
A survey conducted by the
Department of Economic Statistics Bangko Sentral ng Pilipinas
Manila, Philippines
www.bsp.gov.ph
Page 29
Salary and Wage Earners Among Respondents
Among wage and salary
earners, 3 in 4 respondents
report working the full
12 months in 2013.
Nearly 3 in 4 of wage and salary earners were employed or worked for the
entire year in 2013 (i.e., 331 days and over). Meanwhile, 8.2 percent
reported working for 181-330 days, and the remaining 17.3 percent worked
from 1 to 180 days. Among wage and salary workers, only 0.6 percent were
overseas Filipino workers (OFW).
One-third of wage and salary
earners among respondents
can be considered to have
unstable jobs.
In terms of job stability among respondents who were wage and salary
earners, the survey results showed that more than half of the total
respondents were considered to have stable jobs given that 33.3 percent
worked for private non-farm establishments and 22.3 percent worked for the
government. However, the remaining number of respondents who were
wage and salary workers and worked for private households (23.2 percent) or
were paid farm workers (15.2 percent) can be considered as having unstable
jobs usually have no formal contracts from their employer or were seasonal
workers with daily wages tied to a no-work, no-pay arrangement.
Workers in AONCR are mostly
in agriculture, hunting,
forestry and fishery while
those in NCR are mostly in
other services activities.
About 53.4 percent of the wage and salary earners were employed in
agriculture, hunting, forestry and fishing; other services activities; and
construction. Wage and salary earners in NCR were mostly employed in other
services activities; construction; and accommodation and food service
activities. In AONCR, wage and salary earners were commonly employed in
agriculture, hunting, forestry and fishing, followed by other services
activities; and construction.
Majority of wage and salary
earners among respondents
work more than 40 hours a
week.
Wage and salary earners generally put in long working hours, averaging
43.3 hours a week. The median and average working hours per week in the
NCR were 48 hours and 47.3 hours, respectively. Similarly, the figures
exceeded 40 hours per week in AONCR, although lower than in NCR, with a
median of 48 hours and an average of 42.6 hours.
About four in ten respondents
receive a monthly salary of
P5,000 or less.
The average and median monthly gross salary of respondents stood at
P23,172 and P6,000, respectively. About two-fifths or 38.6 percent of
respondents earned P5,000 and below per month, lower than the 2013 first
C o n s u m e r F i n a n c e S u r v e y 2 0 1 4
A survey conducted by the
Department of Economic Statistics Bangko Sentral ng Pilipinas
Manila, Philippines
www.bsp.gov.ph
Page 30
semester food poverty line estimate of the PSA.24
In the NCR, the median monthly gross salary of respondents was higher
compared to those in AONCR. Nearly one-fifth (20.9 percent) of respondents
in the NCR and 41.5 percent of respondents in AONCR earned P5,000 and
below per month in 2014.
Work and Income of Respondent’s Spouse
Majority of respondents’
spouses are working.
About 91.1 percent of respondents’ spouses were working and reported the
following as their work status: employee or wage and salary worker
(52 percent), self-employed (35.6 percent), and employer of a business
(0.5 percent).
Most respondents’ spouses had only one type of job (96 percent) while
4 percent held two or three types of jobs.
Most respondents’ spouses
reported working the full
12 months in 2013.
About 8 in 10 of wage and salary earners among respondents’ spouses
reported working for the entire year in 2013 (i.e., 331 days and over).
Meanwhile, 6.6 percent reported working for 181-330 days, and the
remaining 12.9 percent worked from 1 to 180 days.
Nearly three-fifths of
respondents’ spouses who are
wage and salary earners have
stable jobs.
Close to three-fifths (58.9 percent) of respondents’ spouses can be
considered to have stable jobs given that 45.4 percent worked for private
non-farm establishments and 13.5 percent worked for the government.
Meanwhile, 36.9 percent of the spouses who worked for private households
(25.7 percent) or were paid farm workers (11.2 percent) were considered
having unstable jobs that were mostly seasonal work and offered little or no
job security.
Respondents’ spouses mainly worked in other service activities; agriculture,
hunting, forestry and fishery; and construction. In the NCR, majority of the
respondents’ spouses worked in other service activities; construction;
transport and storage; manufacturing; and other industry (not elsewhere
classified) sectors. In the AONCR, they were mostly in agriculture, hunting,
forestry and fishery; other service activities and construction.
Majority of wage and salary
earners among respondents’
spouses work more than 40
hours a week.
Like the survey respondents, wage and salary earners among respondents’
spouses put in long working hours, with average and median working hours
per week of 46.9 hours and 48 hours, respectively. The average and median
working hours per week in the NCR were 50.3 hours and 48 hours,
respectively. Similarly, for AONCR, the figures also exceeded 40 hours per
week with a median and average of 48 hours and 46.3 hours, respectively.
Less than one-third of
respondents’ spouses earn
P5,000 and below per month.
The median monthly gross salary of respondents’ spouses stood at P9,000 in
2013. About 26.2 percent of respondents’ spouses earned P5,000 and below
per month. In the NCR, the median monthly gross salary of respondents’
24 Based on official Philippine Poverty Statistics released by the PSA from the results of the Annual Poverty Indicators Survey (APIS) during the
first semester of 2013, a family of five needed P5,590 monthly income to meet the family’s basic food needs and at least P8,022 monthly
income to the meet basic food and non-food needs.
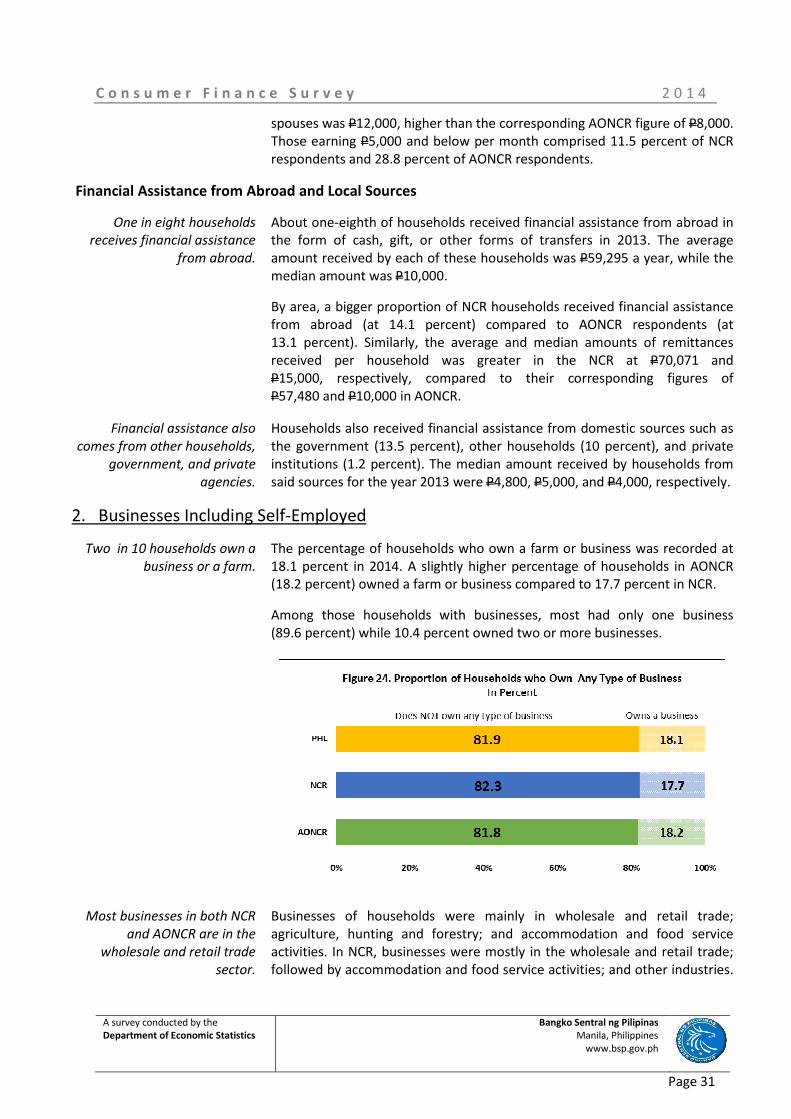
C o n s u m e r F i n a n c e S u r v e y 2 0 1 4
A survey conducted by the
Department of Economic Statistics Bangko Sentral ng Pilipinas
Manila, Philippines
www.bsp.gov.ph
Page 31
spouses was P12,000, higher than the corresponding AONCR figure of P8,000.
Those earning P5,000 and below per month comprised 11.5 percent of NCR
respondents and 28.8 percent of AONCR respondents.
Financial Assistance from Abroad and Local Sources
One in eight households
receives financial assistance
from abroad.
About one-eighth of households received financial assistance from abroad in
the form of cash, gift, or other forms of transfers in 2013. The average
amount received by each of these households was P59,295 a year, while the
median amount was P10,000.
By area, a bigger proportion of NCR households received financial assistance
from abroad (at 14.1 percent) compared to AONCR respondents (at
13.1 percent). Similarly, the average and median amounts of remittances
received per household was greater in the NCR at P70,071 and
P15,000, respectively, compared to their corresponding figures of
P57,480 and P10,000 in AONCR.
Financial assistance also
comes from other households,
government, and private
agencies.
Households also received financial assistance from domestic sources such as
the government (13.5 percent), other households (10 percent), and private
institutions (1.2 percent). The median amount received by households from
said sources for the year 2013 were P4,800, P5,000, and P4,000, respectively.
2. Businesses Including Self-Employed
Two in 10 households own a
business or a farm.
The percentage of households who own a farm or business was recorded at
18.1 percent in 2014. A slightly higher percentage of households in AONCR
(18.2 percent) owned a farm or business compared to 17.7 percent in NCR.
Among those households with businesses, most had only one business
(89.6 percent) while 10.4 percent owned two or more businesses.
Most businesses in both NCR
and AONCR are in the
wholesale and retail trade
sector.
Businesses of households were mainly in wholesale and retail trade;
agriculture, hunting and forestry; and accommodation and food service
activities. In NCR, businesses were mostly in the wholesale and retail trade;
followed by accommodation and food service activities; and other industries.
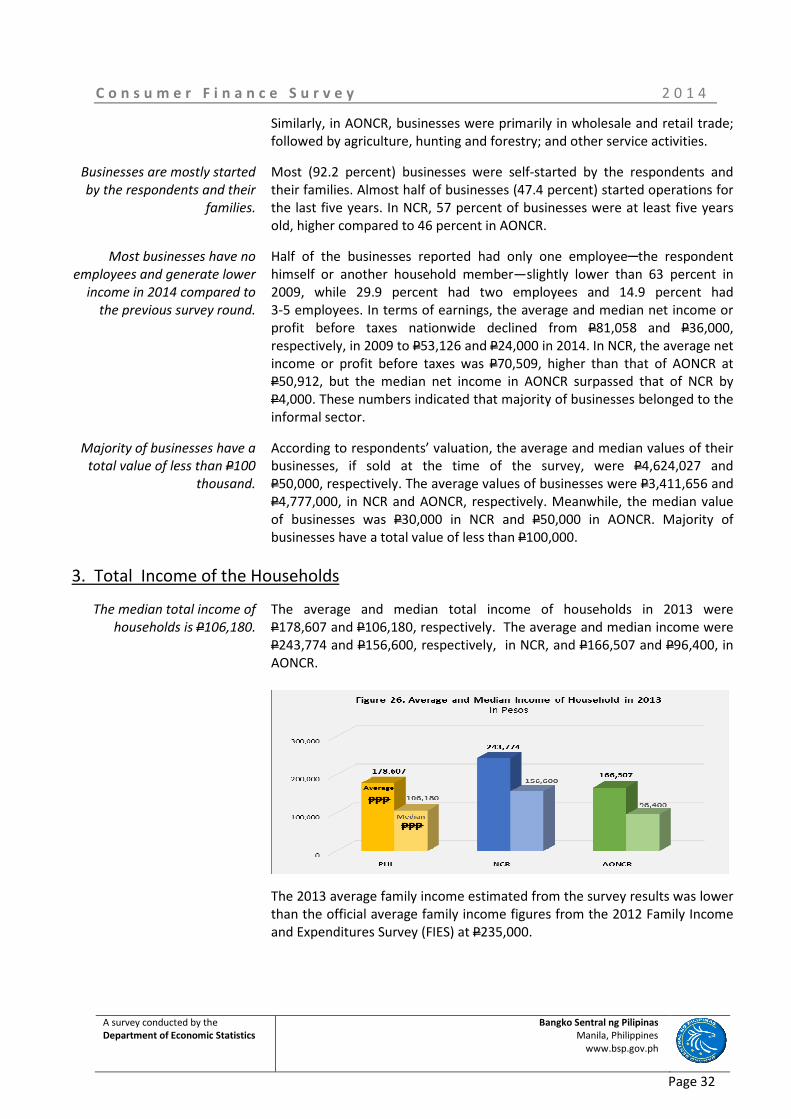
C o n s u m e r F i n a n c e S u r v e y 2 0 1 4
A survey conducted by the
Department of Economic Statistics Bangko Sentral ng Pilipinas
Manila, Philippines
www.bsp.gov.ph
Page 32
Similarly, in AONCR, businesses were primarily in wholesale and retail trade;
followed by agriculture, hunting and forestry; and other service activities.
Businesses are mostly started
by the respondents and their
families.
Most (92.2 percent) businesses were self-started by the respondents and
their families. Almost half of businesses (47.4 percent) started operations for
the last five years. In NCR, 57 percent of businesses were at least five years
old, higher compared to 46 percent in AONCR.
Most businesses have no
employees and generate lower
income in 2014 compared to
the previous survey round.
Half of the businesses reported had only one employee─the respondent
himself or another household member―slightly lower than 63 percent in
2009, while 29.9 percent had two employees and 14.9 percent had
3-5 employees. In terms of earnings, the average and median net income or
profit before taxes nationwide declined from P81,058 and P36,000,
respectively, in 2009 to P53,126 and P24,000 in 2014. In NCR, the average net
income or profit before taxes was P70,509, higher than that of AONCR at
P50,912, but the median net income in AONCR surpassed that of NCR by
P4,000. These numbers indicated that majority of businesses belonged to the
informal sector.
Majority of businesses have a
total value of less than P100
thousand.
According to respondents’ valuation, the average and median values of their
businesses, if sold at the time of the survey, were P4,624,027 and
P50,000, respectively. The average values of businesses were P3,411,656 and
P4,777,000, in NCR and AONCR, respectively. Meanwhile, the median value
of businesses was P30,000 in NCR and P50,000 in AONCR. Majority of
businesses have a total value of less than P100,000.
3. Total Income of the Households
The median total income of
households is P106,180.
The average and median total income of households in 2013 were
P178,607 and P106,180, respectively. The average and median income were
P243,774 and P156,600, respectively, in NCR, and P166,507 and P96,400, in
AONCR.
The 2013 average family income estimated from the survey results was lower
than the official average family income figures from the 2012 Family Income
and Expenditures Survey (FIES) at P235,000.
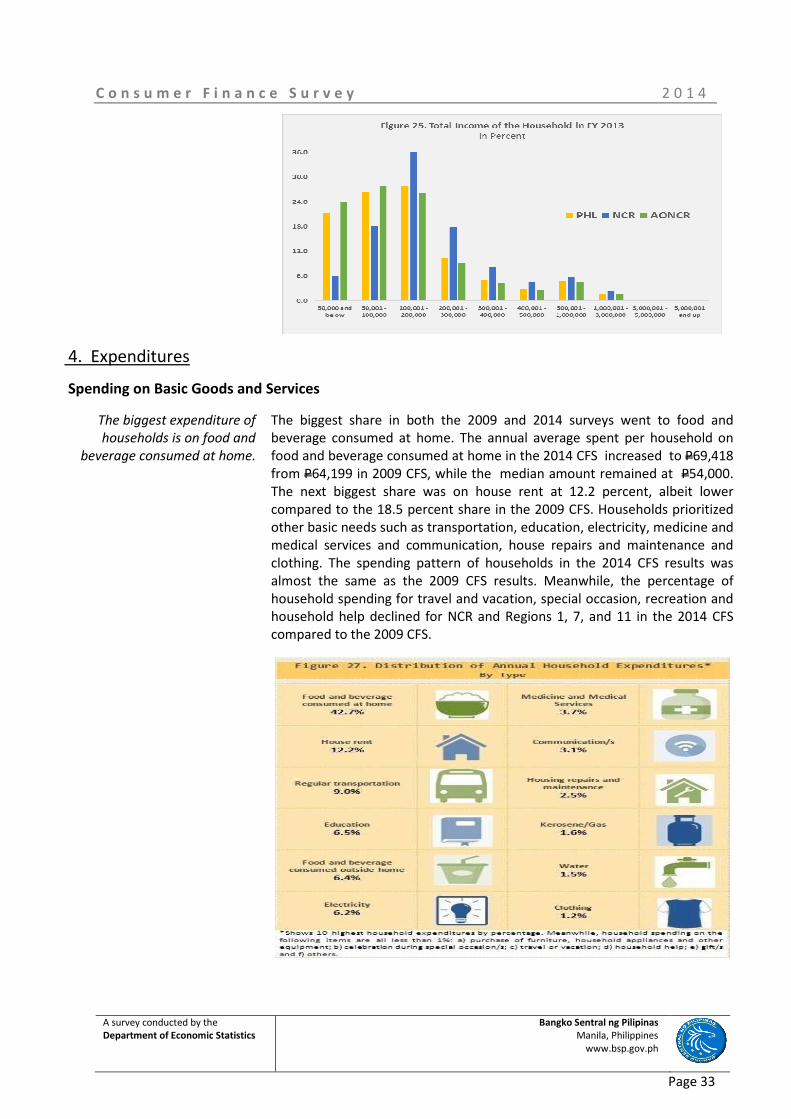
C o n s u m e r F i n a n c e S u r v e y 2 0 1 4
A survey conducted by the
Department of Economic Statistics Bangko Sentral ng Pilipinas
Manila, Philippines
www.bsp.gov.ph
Page 33
4. Expenditures Spending on Basic Goods and Services
The biggest expenditure of
households is on food and
beverage consumed at home.
The biggest share in both the 2009 and 2014 surveys went to food and
beverage consumed at home. The annual average spent per household on
food and beverage consumed at home in the 2014 CFS increased to P69,418
from P64,199 in 2009 CFS, while the median amount remained at P54,000.
The next biggest share was on house rent at 12.2 percent, albeit lower
compared to the 18.5 percent share in the 2009 CFS. Households prioritized
other basic needs such as transportation, education, electricity, medicine and
medical services and communication, house repairs and maintenance and
clothing. The spending pattern of households in the 2014 CFS results was
almost the same as the 2009 CFS results. Meanwhile, the percentage of
household spending for travel and vacation, special occasion, recreation and
household help declined for NCR and Regions 1, 7, and 11 in the 2014 CFS
compared to the 2009 CFS.
C o n s u m e r F i n a n c e S u r v e y 2 0 1 4
A survey conducted by the
Department of Economic Statistics Bangko Sentral ng Pilipinas
Manila, Philippines
www.bsp.gov.ph
Page 34
Spending on Recreation, Travel, House Repairs and Appliances, and Household Help Services
One in four households spend
money for recreation and
household appliances.
One in four households (24.0 percent) reported spending for recreational
activities in 2013, with an average (median) annual expense of
P1,449 (P500). Similarly, 24.9 percent of households bought furniture or
household appliances with an average (median) cost of P5,456 (P1,500). For
house repairs and maintenance, 22.1 percent of households spent an average
(median) amount of P18,427 (P3,000). A smaller number of households
(12.9 percent) spent P7,783 (P3,000) for travel or vacation while only
3.7 percent of households spent an average (median) amount of
P25,152 (P12,000) for household help services (including helpers, drivers,
cooks, and gardeners) in 2013.
Spending for Special Occasions and Gifts
Nine in ten households spend
for special occasions.
Nearly all survey respondents (93.0 percent) to the 2014 CFS reported
spending for special occasions, with average (median) expense of P3,732
(P2,000). About one for every five respondents spent for gifts, with an
average (median) amount of P2,662 (P1,000).
Unspent Income and Emergency Money
About one-third of households
spend more than their income.
About one-third or 33 percent of households reported that they spent more
than their household income, lower compared to the previous survey results.
Comparable figures among NCR respondents showed that only 28.2 percent
of respondents reported spending more than their income in 2013, lower
compared to 45.7 percent in 2008. Likewise in Regions 1, 7, and 11,
34.4 percent reported spending more than their income in 2013, lower
relative to 42.3 percent in 2008. Meanwhile, more than half (61.0 percent)
spent as much as their income in 2013 and a small percentage (6 percent)
reported that they spent less than their income for the same period. The
average unspent income in 2013 was P20,696, while the median was
P2,000. Unspent income was generally higher in the NCR compared to that in
AONCR.
Nearly 5 in 10 households do
not have any cash on hand for
emergency.
Almost 50 percent of households (46.7 percent) reported not holding any
cash on hand for emergency and unexpected expenses. For those who had
cash on hand for emergency, the average and median amounts of cash
holdings were P3,964 and P1,000, respectively.
D. Preferences and Behaviours
Respondents are inclined
towards saving and display
good sense in the use of their
extra money.
The percentage of respondents with inclination towards saving money and
putting it in the bank (if they have surplus money) increased. The increase
was more pronounced in the NCR at 60.5 percent (from 51.8 percent in the
2009 survey) than in AONCR (for Regions 1, 7, and 11) at 32.9 percent (from
29.4 percent). Those who preferred to save cash at home remained broadly
steady at 38 percent. The improvement in respondents' preference to save in
banks could be due to their perception that it is safer to keep money in the
bank.
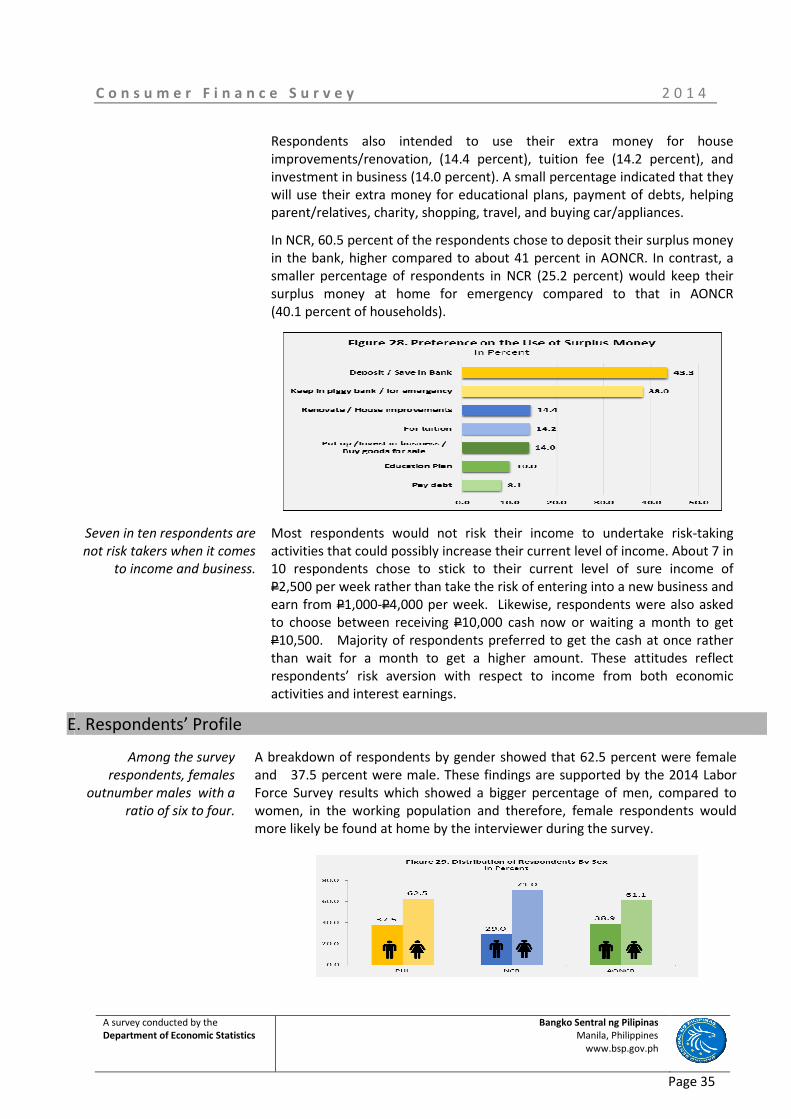
C o n s u m e r F i n a n c e S u r v e y 2 0 1 4
A survey conducted by the
Department of Economic Statistics Bangko Sentral ng Pilipinas
Manila, Philippines
www.bsp.gov.ph
Page 35
Respondents also intended to use their extra money for house
improvements/renovation, (14.4 percent), tuition fee (14.2 percent), and
investment in business (14.0 percent). A small percentage indicated that they
will use their extra money for educational plans, payment of debts, helping
parent/relatives, charity, shopping, travel, and buying car/appliances.
In NCR, 60.5 percent of the respondents chose to deposit their surplus money
in the bank, higher compared to about 41 percent in AONCR. In contrast, a
smaller percentage of respondents in NCR (25.2 percent) would keep their
surplus money at home for emergency compared to that in AONCR
(40.1 percent of households).
Seven in ten respondents are
not risk takers when it comes
to income and business.
Most respondents would not risk their income to undertake risk-taking
activities that could possibly increase their current level of income. About 7 in
10 respondents chose to stick to their current level of sure income of
P2,500 per week rather than take the risk of entering into a new business and
earn from P1,000-P4,000 per week. Likewise, respondents were also asked
to choose between receiving P10,000 cash now or waiting a month to get
P10,500. Majority of respondents preferred to get the cash at once rather
than wait for a month to get a higher amount. These attitudes reflect
respondents’ risk aversion with respect to income from both economic
activities and interest earnings.
E. Respondents’ Profile
Among the survey
respondents, females
outnumber males with a
ratio of six to four.
A breakdown of respondents by gender showed that 62.5 percent were female
and 37.5 percent were male. These findings are supported by the 2014 Labor
Force Survey results which showed a bigger percentage of men, compared to
women, in the working population and therefore, female respondents would
more likely be found at home by the interviewer during the survey.
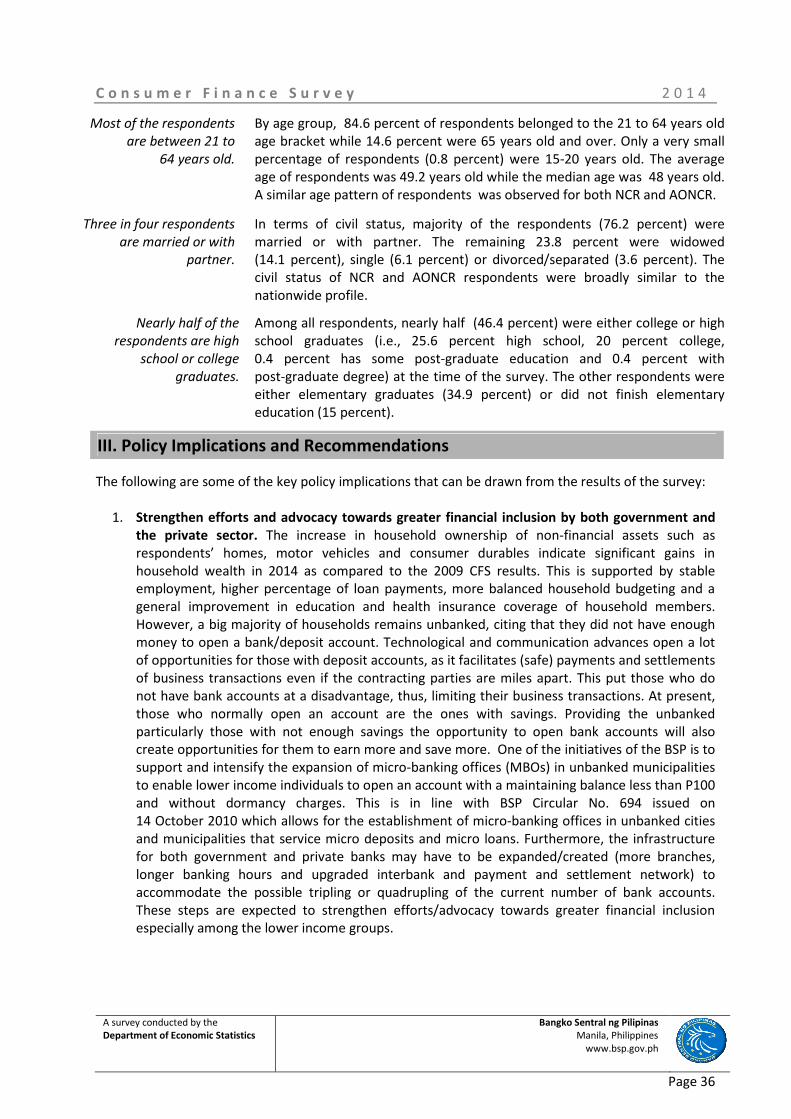
C o n s u m e r F i n a n c e S u r v e y 2 0 1 4
A survey conducted by the
Department of Economic Statistics Bangko Sentral ng Pilipinas
Manila, Philippines
www.bsp.gov.ph
Page 36
Most of the respondents
are between 21 to
64 years old.
By age group, 84.6 percent of respondents belonged to the 21 to 64 years old
age bracket while 14.6 percent were 65 years old and over. Only a very small
percentage of respondents (0.8 percent) were 15-20 years old. The average
age of respondents was 49.2 years old while the median age was 48 years old.
A similar age pattern of respondents was observed for both NCR and AONCR.
Three in four respondents
are married or with
partner.
In terms of civil status, majority of the respondents (76.2 percent) were
married or with partner. The remaining 23.8 percent were widowed
(14.1 percent), single (6.1 percent) or divorced/separated (3.6 percent). The
civil status of NCR and AONCR respondents were broadly similar to the
nationwide profile.
Nearly half of the
respondents are high
school or college
graduates.
Among all respondents, nearly half (46.4 percent) were either college or high
school graduates (i.e., 25.6 percent high school, 20 percent college,
0.4 percent has some post-graduate education and 0.4 percent with
post-graduate degree) at the time of the survey. The other respondents were
either elementary graduates (34.9 percent) or did not finish elementary
education (15 percent).
III. Policy Implications and Recommendations
The following are some of the key policy implications that can be drawn from the results of the survey:
1. Strengthen efforts and advocacy towards greater financial inclusion by both government and
the private sector. The increase in household ownership of non-financial assets such as
respondents’ homes, motor vehicles and consumer durables indicate significant gains in
household wealth in 2014 as compared to the 2009 CFS results. This is supported by stable
employment, higher percentage of loan payments, more balanced household budgeting and a
general improvement in education and health insurance coverage of household members.
However, a big majority of households remains unbanked, citing that they did not have enough
money to open a bank/deposit account. Technological and communication advances open a lot
of opportunities for those with deposit accounts, as it facilitates (safe) payments and settlements
of business transactions even if the contracting parties are miles apart. This put those who do
not have bank accounts at a disadvantage, thus, limiting their business transactions. At present,
those who normally open an account are the ones with savings. Providing the unbanked
particularly those with not enough savings the opportunity to open bank accounts will also
create opportunities for them to earn more and save more. One of the initiatives of the BSP is to
support and intensify the expansion of micro-banking offices (MBOs) in unbanked municipalities
to enable lower income individuals to open an account with a maintaining balance less than P100
and without dormancy charges. This is in line with BSP Circular No. 694 issued on
14 October 2010 which allows for the establishment of micro-banking offices in unbanked cities
and municipalities that service micro deposits and micro loans. Furthermore, the infrastructure
for both government and private banks may have to be expanded/created (more branches,
longer banking hours and upgraded interbank and payment and settlement network) to
accommodate the possible tripling or quadrupling of the current number of bank accounts.
These steps are expected to strengthen efforts/advocacy towards greater financial inclusion
especially among the lower income groups.
C o n s u m e r F i n a n c e S u r v e y 2 0 1 4
A survey conducted by the
Department of Economic Statistics Bangko Sentral ng Pilipinas
Manila, Philippines
www.bsp.gov.ph
Page 37
2. Expand government retirement programs/policies to cover more working and non-working
Filipinos. At present, a significant percentage of employees working in government and the
private sector are not covered by retirement insurance. Moreover, for those who worked for
private households and the self-employed as well as among homemakers and the unemployed, a
bigger percentage is not covered. In view of this, the current retirement programs will have to be
expanded to be able to increase retirement insurance coverage across employment status. More
affordable retirement insurance programs may be formulated to enable those working for
MSMEs, private households, the self-employed and homemakers to be covered by a retirement
insurance.
3. Increase financial education campaigns for employers and employees in MSMEs and private
households, in sectors lagging behind in financial inclusion, and institutionalize financial
education in the country’s school system from elementary to college. There is need to expand
and intensify the financial education campaigns on the importance of savings and in opening
deposit accounts among employers and employees in MSMEs and the self-employed/workers
with no permanent employment in the lagging sectors such as those in agriculture, hunting and
forestry, fishing, and construction. This is to be able to reach out to a big majority of the
country’s working class and to encourage them to develop the culture of saving, especially to
their children. Moreover, institutionalization of financial education in the country’s school system
will provide formal learning and deepen understanding for the entire population. To date, the
BSP has already partnered with DepED to include in the grade school curriculum lessons in
savings, money management, and entrepreneurship through 3 entry subjects (Social Studies,
Values Education, and Home Economics). This initiative could be extended to the K-12 program,
particularly senior high school to include knowledge on various savings and investments
instruments such as government and corporate bonds, time deposits, stock market, and mutual
funds.
4. There is a need to also include in the government’s financial education programs the
importance of retirement insurance and regular/timely payment of premiums to national
pension and retirement funds among household members. The benefits of joining the national
insurance and pension system and the regular payment of premium should likewise be
incorporated in the government’s financial education programs, such as the BSP-EFLP. One
retirement fund that is about to be launched by the BSP (which could be included in the EFLP) is
the Personal Equity Retirement Account (PERA) which could be beneficial to all Filipinos aged 18
years old and above with income from employment, business or other sources. Under the PERA,
Filipinos can invest up to P100,000 (P200,000 for OFW) per unit for a maximum of 5 units and the
investment and earnings could be distributed to the contributor/investor upon reaching age 55.
C o n s u m e r F i n a n c e S u r v e y 2 0 1 4
A survey conducted by the
Department of Economic Statistics Bangko Sentral ng Pilipinas
Manila, Philippines
www.bsp.gov.ph
Page 38
5. There is a need to monitor credit granted through “shadow banking” transactions and the
possible regulatory and supervisory infrastructure to monitor system-wide risk exposure to
particular sectors without reducing credit opportunities for consumers.
Considering that most households that borrowed money did so from non-bank
institutions/companies, particularly in-house financing, non-bank government institutions
and money lenders, banks may have the incentive to take advantage of the regulatory
arbitrage by increasing their exposure to shadow banks.25
As the economy continues to expand,
lending activities of non-banks, particularly lending institutions, could increase significantly,
underscoring the need to look into the potential risks of overexposures to certain sectors, like
real estate as well as the financial soundness of loan practices and transactions of non-banks.
Moreover, the linkage and degree of exposure of banks to non-bank institutions (financial and
non-financial institutions) which provide in-house financing has to be measured and monitored
regularly so that the appropriate/timely mechanism and policies could be crafted and put in
place to effectively manage credit risks. A recent memorandum of agreement (MOA) was signed
by the members of the Financial Stability Coordination Council, comprising of the BSP,
Department of Finance (DOF), Insurance Commission (IC), Philippine Deposit Insurance
Corporation (PDIC), and Securities and Exchange Commission (SEC), with the Housing and Land
Use Regulatory Board (HLURB). The MOA will facilitate information sharing among the agencies
as a proactive initiative of the Council to better understand the interconnectedness and to
mitigate the build-up of systemic risks in the financial system. With this MOA, the BSP could now
request the support of the HLURB in collecting data from non-bank financial and non-financial
institutions who are engaged in construction, selling, and lending activities in the real estate
sector for monitoring the total debt exposure of the financial system to the real estate sector as
well as their lending practices to safeguard risks arising from overexposure and unsound loan
transactions.
25
Shadow banks can be defined as financial intermediaries that conduct maturity, credit, and liquidity
transformation without explicit access to central bank liquidity or public sector credit guarantees. Examples of
shadow banks include finance companies, asset-backed commercial paper (ABCP) conduits, structured
investment vehicles (SIVs), credit hedge funds, money market mutual funds, securities lenders, limited-
purpose finance companies (LPFCs), and the government-sponsored enterprises (GSEs) (see Pozsar et al. 2012,
“Shadow Banking”, Federal Reserve Bank Staff Paper).
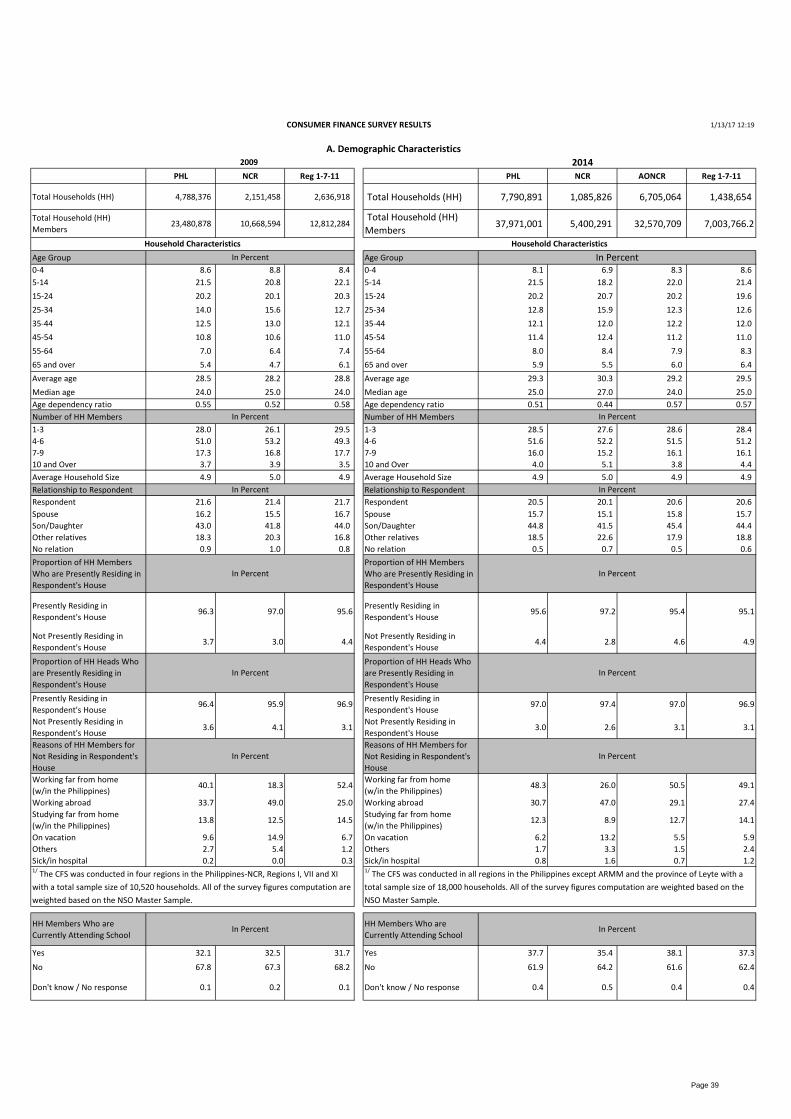
1/13/17 12:19
PHL NCR Reg 1-7-11 PHL NCR AONCR Reg 1-7-11
Total Households (HH) 4,788,376 2,151,458 2,636,918 Total Households (HH) 7,790,891 1,085,826 6,705,064 1,438,654
Total Household (HH)
Members23,480,878 10,668,594 12,812,284
Total Household (HH)
Members 37,971,001 5,400,291 32,570,709 7,003,766.2
Age Group Age Group
0-4 8.6 8.8 8.4 0-4 8.1 6.9 8.3 8.6
5-14 21.5 20.8 22.1 5-14 21.5 18.2 22.0 21.4
15-24 20.2 20.1 20.3 15-24 20.2 20.7 20.2 19.6
25-34 14.0 15.6 12.7 25-34 12.8 15.9 12.3 12.6
35-44 12.5 13.0 12.1 35-44 12.1 12.0 12.2 12.0
45-54 10.8 10.6 11.0 45-54 11.4 12.4 11.2 11.0
55-64 7.0 6.4 7.4 55-64 8.0 8.4 7.9 8.3
65 and over 5.4 4.7 6.1 65 and over 5.9 5.5 6.0 6.4
Average age 28.5 28.2 28.8 Average age 29.3 30.3 29.2 29.5
Median age 24.0 25.0 24.0 Median age 25.0 27.0 24.0 25.0
Age dependency ratio 0.55 0.52 0.58 Age dependency ratio 0.51 0.44 0.57 0.57
Number of HH Members Number of HH Members
1-3 28.0 26.1 29.5 1-3 28.5 27.6 28.6 28.4
4-6 51.0 53.2 49.3 4-6 51.6 52.2 51.5 51.2
7-9 17.3 16.8 17.7 7-9 16.0 15.2 16.1 16.1
10 and Over 3.7 3.9 3.5 10 and Over 4.0 5.1 3.8 4.4
Average Household Size 4.9 5.0 4.9 Average Household Size 4.9 5.0 4.9 4.9
Relationship to Respondent Relationship to Respondent
Respondent 21.6 21.4 21.7 Respondent 20.5 20.1 20.6 20.6
Spouse 16.2 15.5 16.7 Spouse 15.7 15.1 15.8 15.7
Son/Daughter 43.0 41.8 44.0 Son/Daughter 44.8 41.5 45.4 44.4
Other relatives 18.3 20.3 16.8 Other relatives 18.5 22.6 17.9 18.8
No relation 0.9 1.0 0.8 No relation 0.5 0.7 0.5 0.6
Proportion of HH Members
Who are Presently Residing in
Respondent's House
Proportion of HH Members
Who are Presently Residing in
Respondent's House
Presently Residing in
Respondent's House 96.3 97.0 95.6
Presently Residing in
Respondent's House 95.6 97.2 95.4 95.1
Not Presently Residing in
Respondent's House 3.7 3.0 4.4
Not Presently Residing in
Respondent's House 4.4 2.8 4.6 4.9
Proportion of HH Heads Who
are Presently Residing in
Respondent's House
Proportion of HH Heads Who
are Presently Residing in
Respondent's House
Presently Residing in
Respondent's House 96.4 95.9 96.9
Presently Residing in
Respondent's House 97.0 97.4 97.0 96.9
Not Presently Residing in
Respondent's House 3.6 4.1 3.1
Not Presently Residing in
Respondent's House 3.0 2.6 3.1 3.1
Reasons of HH Members for
Not Residing in Respondent's
House
Reasons of HH Members for
Not Residing in Respondent's
House
Working far from home
(w/in the Philippines) 40.1 18.3 52.4
Working far from home
(w/in the Philippines) 48.3 26.0 50.5 49.1
Working abroad 33.7 49.0 25.0 Working abroad 30.7 47.0 29.1 27.4
Studying far from home
(w/in the Philippines) 13.8 12.5 14.5
Studying far from home
(w/in the Philippines) 12.3 8.9 12.7 14.1
On vacation 9.6 14.9 6.7 On vacation 6.2 13.2 5.5 5.9
Others 2.7 5.4 1.2 Others 1.7 3.3 1.5 2.4
Sick/in hospital 0.2 0.0 0.3 Sick/in hospital 0.8 1.6 0.7 1.2
HH Members Who are
Currently Attending School
HH Members Who are
Currently Attending School
Yes 32.1 32.5 31.7 Yes 37.7 35.4 38.1 37.3
No 67.8 67.3 68.2 No 61.9 64.2 61.6 62.4
Don't know / No response 0.1 0.2 0.1 Don't know / No response 0.4 0.5 0.4 0.4
Household Characteristics
In Percent
In Percent
In Percent
In Percent
1/ The CFS was conducted in all regions in the Philippines except ARMM and the province of Leyte with a
total sample size of 18,000 households. All of the survey figures computation are weighted based on the
NSO Master Sample.
In Percent
In Percent
CONSUMER FINANCE SURVEY RESULTS
A. Demographic Characteristics
2009 2014
In Percent
In PercentIn Percent
Household Characteristics
In Percent
1/ The CFS was conducted in four regions in the Philippines-NCR, Regions I, VII and XI
with a total sample size of 10,520 households. All of the survey figures computation are
weighted based on the NSO Master Sample.
In Percent
In Percent
In Percent
In Percent
Page 39
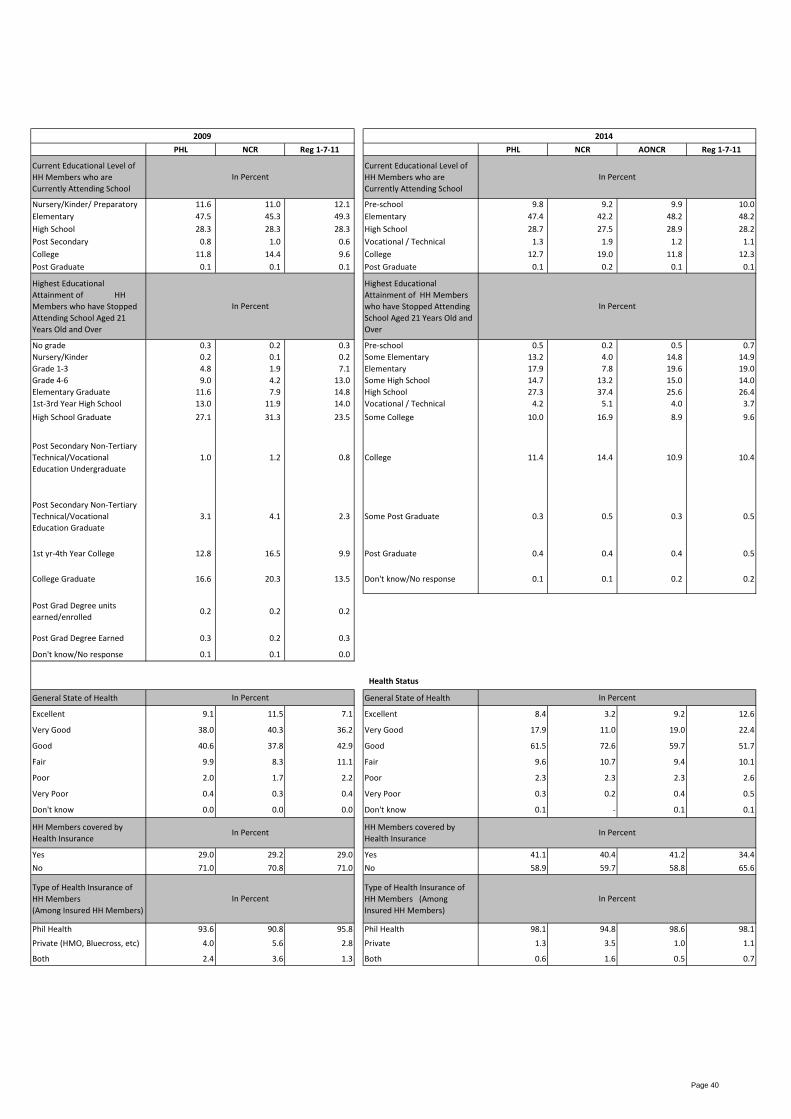
2009 2014
PHL NCR Reg 1-7-11 PHL NCR AONCR Reg 1-7-11
Current Educational Level of
HH Members who are
Currently Attending School
Current Educational Level of
HH Members who are
Currently Attending School
Nursery/Kinder/ Preparatory 11.6 11.0 12.1 Pre-school 9.8 9.2 9.9 10.0
Elementary 47.5 45.3 49.3 Elementary 47.4 42.2 48.2 48.2
High School 28.3 28.3 28.3 High School 28.7 27.5 28.9 28.2
Post Secondary 0.8 1.0 0.6 Vocational / Technical 1.3 1.9 1.2 1.1
College 11.8 14.4 9.6 College 12.7 19.0 11.8 12.3
Post Graduate 0.1 0.1 0.1 Post Graduate 0.1 0.2 0.1 0.1
Highest Educational
Attainment of HH
Members who have Stopped
Attending School Aged 21
Years Old and Over
Highest Educational
Attainment of HH Members
who have Stopped Attending
School Aged 21 Years Old and
Over
No grade 0.3 0.2 0.3 Pre-school 0.5 0.2 0.5 0.7
Nursery/Kinder 0.2 0.1 0.2 Some Elementary 13.2 4.0 14.8 14.9
Grade 1-3 4.8 1.9 7.1 Elementary 17.9 7.8 19.6 19.0
Grade 4-6 9.0 4.2 13.0 Some High School 14.7 13.2 15.0 14.0
Elementary Graduate 11.6 7.9 14.8 High School 27.3 37.4 25.6 26.4
1st-3rd Year High School 13.0 11.9 14.0 Vocational / Technical 4.2 5.1 4.0 3.7
High School Graduate 27.1 31.3 23.5 Some College 10.0 16.9 8.9 9.6
Post Secondary Non-Tertiary
Technical/Vocational
Education Undergraduate
1.0 1.2 0.8 College 11.4 14.4 10.9 10.4
Post Secondary Non-Tertiary
Technical/Vocational
Education Graduate
3.1 4.1 2.3 Some Post Graduate 0.3 0.5 0.3 0.5
1st yr-4th Year College 12.8 16.5 9.9 Post Graduate 0.4 0.4 0.4 0.5
College Graduate 16.6 20.3 13.5 Don't know/No response 0.1 0.1 0.2 0.2
Post Grad Degree units
earned/enrolled0.2 0.2 0.2
Post Grad Degree Earned 0.3 0.2 0.3
Don't know/No response 0.1 0.1 0.0
General State of Health General State of Health
Excellent 9.1 11.5 7.1 Excellent 8.4 3.2 9.2 12.6
Very Good 38.0 40.3 36.2 Very Good 17.9 11.0 19.0 22.4
Good 40.6 37.8 42.9 Good 61.5 72.6 59.7 51.7
Fair 9.9 8.3 11.1 Fair 9.6 10.7 9.4 10.1
Poor 2.0 1.7 2.2 Poor 2.3 2.3 2.3 2.6
Very Poor 0.4 0.3 0.4 Very Poor 0.3 0.2 0.4 0.5
Don't know 0.0 0.0 0.0 Don't know 0.1 - 0.1 0.1
HH Members covered by
Health Insurance
HH Members covered by
Health Insurance
Yes 29.0 29.2 29.0 Yes 41.1 40.4 41.2 34.4
No 71.0 70.8 71.0 No 58.9 59.7 58.8 65.6
Type of Health Insurance of
HH Members
(Among Insured HH Members)
Type of Health Insurance of
HH Members (Among
Insured HH Members)
Phil Health 93.6 90.8 95.8 Phil Health 98.1 94.8 98.6 98.1
Private (HMO, Bluecross, etc) 4.0 5.6 2.8 Private 1.3 3.5 1.0 1.1
Both 2.4 3.6 1.3 Both 0.6 1.6 0.5 0.7
In Percent
In Percent
In Percent
In Percent
Health Status
In PercentIn Percent
In Percent
In Percent
In Percent
In Percent
Page 40
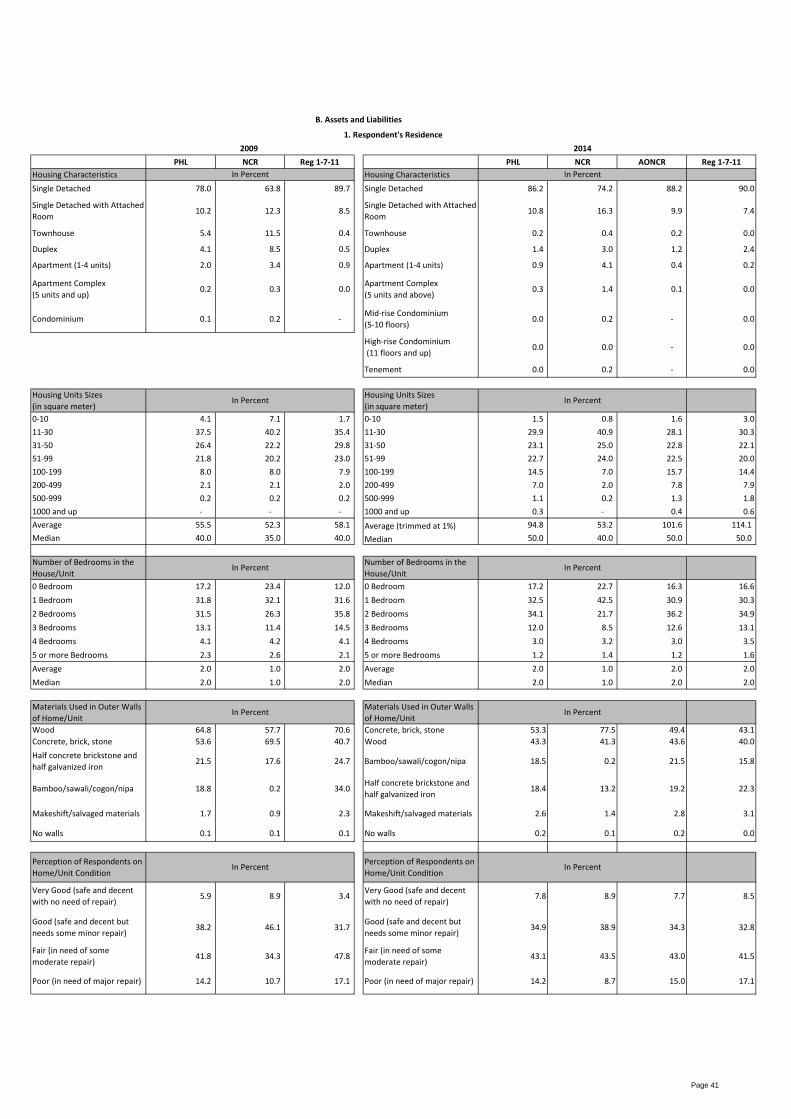
PHL NCR Reg 1-7-11 PHL NCR AONCR Reg 1-7-11
Housing Characteristics Housing Characteristics
Single Detached 78.0 63.8 89.7 Single Detached 86.2 74.2 88.2 90.0
Single Detached with Attached
Room10.2 12.3 8.5
Single Detached with Attached
Room10.8 16.3 9.9 7.4
Townhouse 5.4 11.5 0.4 Townhouse 0.2 0.4 0.2 0.0
Duplex 4.1 8.5 0.5 Duplex 1.4 3.0 1.2 2.4
Apartment (1-4 units) 2.0 3.4 0.9 Apartment (1-4 units) 0.9 4.1 0.4 0.2
Apartment Complex
(5 units and up)0.2 0.3 0.0
Apartment Complex
(5 units and above)0.3 1.4 0.1 0.0
Condominium 0.1 0.2 - Mid-rise Condominium
(5-10 floors)0.0 0.2 - 0.0
High-rise Condominium
(11 floors and up)0.0 0.0 - 0.0
Tenement 0.0 0.2 - 0.0
Housing Units Sizes
(in square meter)
Housing Units Sizes
(in square meter)
0-10 4.1 7.1 1.7 0-10 1.5 0.8 1.6 3.0
11-30 37.5 40.2 35.4 11-30 29.9 40.9 28.1 30.3
31-50 26.4 22.2 29.8 31-50 23.1 25.0 22.8 22.1
51-99 21.8 20.2 23.0 51-99 22.7 24.0 22.5 20.0
100-199 8.0 8.0 7.9 100-199 14.5 7.0 15.7 14.4
200-499 2.1 2.1 2.0 200-499 7.0 2.0 7.8 7.9
500-999 0.2 0.2 0.2 500-999 1.1 0.2 1.3 1.8
1000 and up - - - 1000 and up 0.3 - 0.4 0.6
Average 55.5 52.3 58.1 Average (trimmed at 1%) 94.8 53.2 101.6 114.1
Median 40.0 35.0 40.0 Median 50.0 40.0 50.0 50.0
Number of Bedrooms in the
House/Unit
Number of Bedrooms in the
House/Unit
0 Bedroom 17.2 23.4 12.0 0 Bedroom 17.2 22.7 16.3 16.6
1 Bedroom 31.8 32.1 31.6 1 Bedroom 32.5 42.5 30.9 30.3
2 Bedrooms 31.5 26.3 35.8 2 Bedrooms 34.1 21.7 36.2 34.9
3 Bedrooms 13.1 11.4 14.5 3 Bedrooms 12.0 8.5 12.6 13.1
4 Bedrooms 4.1 4.2 4.1 4 Bedrooms 3.0 3.2 3.0 3.5
5 or more Bedrooms 2.3 2.6 2.1 5 or more Bedrooms 1.2 1.4 1.2 1.6
Average 2.0 1.0 2.0 Average 2.0 1.0 2.0 2.0
Median 2.0 1.0 2.0 Median 2.0 1.0 2.0 2.0
Materials Used in Outer Walls
of Home/Unit
Materials Used in Outer Walls
of Home/Unit
Wood 64.8 57.7 70.6 Concrete, brick, stone 53.3 77.5 49.4 43.1
Concrete, brick, stone 53.6 69.5 40.7 Wood 43.3 41.3 43.6 40.0
Half concrete brickstone and
half galvanized iron21.5 17.6 24.7 Bamboo/sawali/cogon/nipa 18.5 0.2 21.5 15.8
Bamboo/sawali/cogon/nipa 18.8 0.2 34.0 Half concrete brickstone and
half galvanized iron18.4 13.2 19.2 22.3
Makeshift/salvaged materials 1.7 0.9 2.3 Makeshift/salvaged materials 2.6 1.4 2.8 3.1
No walls 0.1 0.1 0.1 No walls 0.2 0.1 0.2 0.0
Perception of Respondents on
Home/Unit Condition
Perception of Respondents on
Home/Unit Condition
Very Good (safe and decent
with no need of repair)5.9 8.9 3.4
Very Good (safe and decent
with no need of repair)7.8 8.9 7.7 8.5
Good (safe and decent but
needs some minor repair)38.2 46.1 31.7
Good (safe and decent but
needs some minor repair)34.9 38.9 34.3 32.8
Fair (in need of some
moderate repair)41.8 34.3 47.8
Fair (in need of some
moderate repair)43.1 43.5 43.0 41.5
Poor (in need of major repair) 14.2 10.7 17.1 Poor (in need of major repair) 14.2 8.7 15.0 17.1
2014
In Percent
In Percent
In Percent
In Percent
2009
In Percent
B. Assets and Liabilities
In Percent
In Percent
In Percent
1. Respondent's Residence
In Percent
In Percent
Page 41
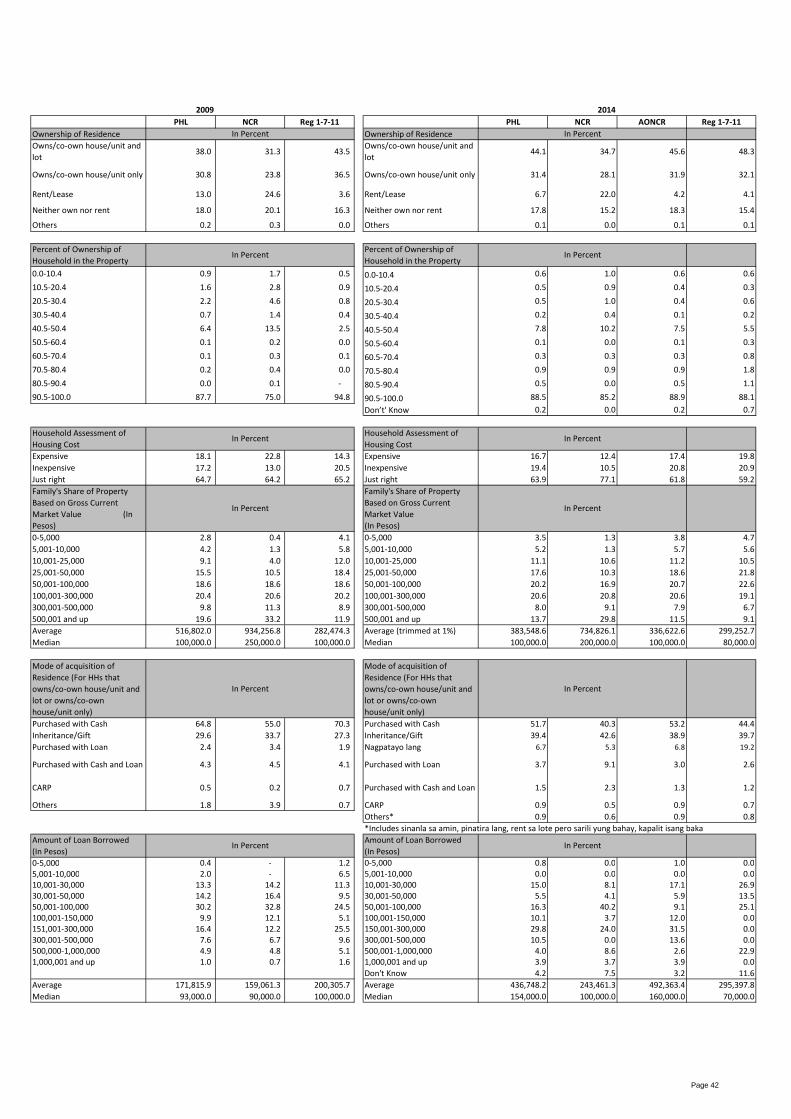
2009 2014
PHL NCR Reg 1-7-11 PHL NCR AONCR Reg 1-7-11
Ownership of Residence Ownership of Residence
Owns/co-own house/unit and
lot38.0 31.3 43.5
Owns/co-own house/unit and
lot44.1 34.7 45.6 48.3
Owns/co-own house/unit only 30.8 23.8 36.5 Owns/co-own house/unit only 31.4 28.1 31.9 32.1
Rent/Lease 13.0 24.6 3.6 Rent/Lease 6.7 22.0 4.2 4.1
Neither own nor rent 18.0 20.1 16.3 Neither own nor rent 17.8 15.2 18.3 15.4
Others 0.2 0.3 0.0 Others 0.1 0.0 0.1 0.1
Percent of Ownership of
Household in the Property
Percent of Ownership of
Household in the Property
0.0-10.4 0.9 1.7 0.5 0.0-10.4 0.6 1.0 0.6 0.6
10.5-20.4 1.6 2.8 0.9 10.5-20.4 0.5 0.9 0.4 0.3
20.5-30.4 2.2 4.6 0.8 20.5-30.4 0.5 1.0 0.4 0.6
30.5-40.4 0.7 1.4 0.4 30.5-40.4 0.2 0.4 0.1 0.2
40.5-50.4 6.4 13.5 2.5 40.5-50.4 7.8 10.2 7.5 5.5
50.5-60.4 0.1 0.2 0.0 50.5-60.4 0.1 0.0 0.1 0.3
60.5-70.4 0.1 0.3 0.1 60.5-70.4 0.3 0.3 0.3 0.8
70.5-80.4 0.2 0.4 0.0 70.5-80.4 0.9 0.9 0.9 1.8
80.5-90.4 0.0 0.1 - 80.5-90.4 0.5 0.0 0.5 1.1
90.5-100.0 87.7 75.0 94.8 90.5-100.0 88.5 85.2 88.9 88.1
Don’t' Know 0.2 0.0 0.2 0.7
Household Assessment of
Housing Cost
Household Assessment of
Housing Cost
Expensive 18.1 22.8 14.3 Expensive 16.7 12.4 17.4 19.8
Inexpensive 17.2 13.0 20.5 Inexpensive 19.4 10.5 20.8 20.9
Just right 64.7 64.2 65.2 Just right 63.9 77.1 61.8 59.2
Family's Share of Property
Based on Gross Current
Market Value (In
Pesos)
Family's Share of Property
Based on Gross Current
Market Value
(In Pesos)
0-5,000 2.8 0.4 4.1 0-5,000 3.5 1.3 3.8 4.7
5,001-10,000 4.2 1.3 5.8 5,001-10,000 5.2 1.3 5.7 5.6
10,001-25,000 9.1 4.0 12.0 10,001-25,000 11.1 10.6 11.2 10.5
25,001-50,000 15.5 10.5 18.4 25,001-50,000 17.6 10.3 18.6 21.8
50,001-100,000 18.6 18.6 18.6 50,001-100,000 20.2 16.9 20.7 22.6
100,001-300,000 20.4 20.6 20.2 100,001-300,000 20.6 20.8 20.6 19.1
300,001-500,000 9.8 11.3 8.9 300,001-500,000 8.0 9.1 7.9 6.7
500,001 and up 19.6 33.2 11.9 500,001 and up 13.7 29.8 11.5 9.1
Average 516,802.0 934,256.8 282,474.3 Average (trimmed at 1%) 383,548.6 734,826.1 336,622.6 299,252.7
Median 100,000.0 250,000.0 100,000.0 Median 100,000.0 200,000.0 100,000.0 80,000.0
Mode of acquisition of
Residence (For HHs that
owns/co-own house/unit and
lot or owns/co-own
house/unit only)
Mode of acquisition of
Residence (For HHs that
owns/co-own house/unit and
lot or owns/co-own
house/unit only)
Purchased with Cash 64.8 55.0 70.3 Purchased with Cash 51.7 40.3 53.2 44.4
Inheritance/Gift 29.6 33.7 27.3 Inheritance/Gift 39.4 42.6 38.9 39.7
Purchased with Loan 2.4 3.4 1.9 Nagpatayo lang 6.7 5.3 6.8 19.2
Purchased with Cash and Loan 4.3 4.5 4.1 Purchased with Loan 3.7 9.1 3.0 2.6
CARP 0.5 0.2 0.7 Purchased with Cash and Loan 1.5 2.3 1.3 1.2
Others 1.8 3.9 0.7 CARP 0.9 0.5 0.9 0.7
Others* 0.9 0.6 0.9 0.8
*Includes sinanla sa amin, pinatira lang, rent sa lote pero sarili yung bahay, kapalit isang baka
Amount of Loan Borrowed
(In Pesos)
Amount of Loan Borrowed
(In Pesos)
0-5,000 0.4 - 1.2 0-5,000 0.8 0.0 1.0 0.0
5,001-10,000 2.0 - 6.5 5,001-10,000 0.0 0.0 0.0 0.0
10,001-30,000 13.3 14.2 11.3 10,001-30,000 15.0 8.1 17.1 26.9
30,001-50,000 14.2 16.4 9.5 30,001-50,000 5.5 4.1 5.9 13.5
50,001-100,000 30.2 32.8 24.5 50,001-100,000 16.3 40.2 9.1 25.1
100,001-150,000 9.9 12.1 5.1 100,001-150,000 10.1 3.7 12.0 0.0
151,001-300,000 16.4 12.2 25.5 150,001-300,000 29.8 24.0 31.5 0.0
300,001-500,000 7.6 6.7 9.6 300,001-500,000 10.5 0.0 13.6 0.0
500,000-1,000,000 4.9 4.8 5.1 500,001-1,000,000 4.0 8.6 2.6 22.9
1,000,001 and up 1.0 0.7 1.6 1,000,001 and up 3.9 3.7 3.9 0.0
Don't Know 4.2 7.5 3.2 11.6
Average 171,815.9 159,061.3 200,305.7 Average 436,748.2 243,461.3 492,363.4 295,397.8
Median 93,000.0 90,000.0 100,000.0 Median 154,000.0 100,000.0 160,000.0 70,000.0
In Percent
In Percent
In Percent
In Percent
In Percent
In Percent
In Percent
In Percent
In Percent
In Percent
In Percent
In Percent
Page 42
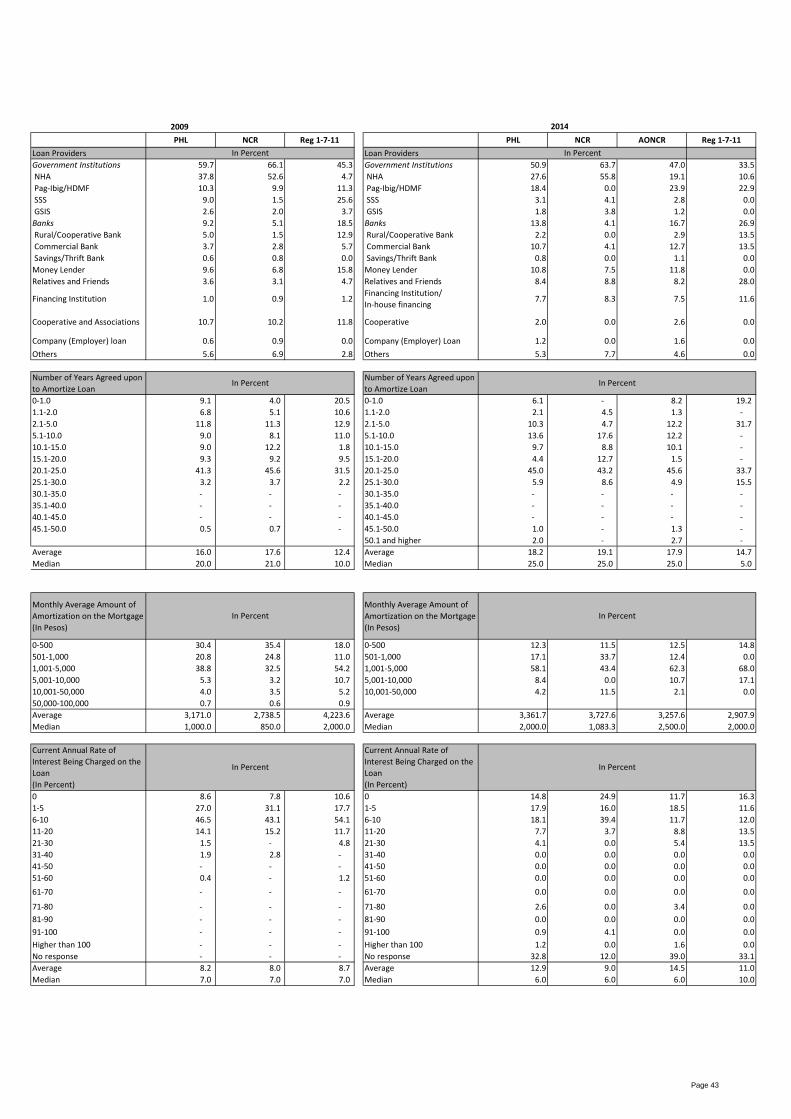
2009
PHL NCR Reg 1-7-11 PHL NCR AONCR Reg 1-7-11
Loan Providers Loan Providers
Government Institutions 59.7 66.1 45.3 Government Institutions 50.9 63.7 47.0 33.5
NHA 37.8 52.6 4.7 NHA 27.6 55.8 19.1 10.6
Pag-Ibig/HDMF 10.3 9.9 11.3 Pag-Ibig/HDMF 18.4 0.0 23.9 22.9
SSS 9.0 1.5 25.6 SSS 3.1 4.1 2.8 0.0
GSIS 2.6 2.0 3.7 GSIS 1.8 3.8 1.2 0.0
Banks 9.2 5.1 18.5 Banks 13.8 4.1 16.7 26.9
Rural/Cooperative Bank 5.0 1.5 12.9 Rural/Cooperative Bank 2.2 0.0 2.9 13.5
Commercial Bank 3.7 2.8 5.7 Commercial Bank 10.7 4.1 12.7 13.5
Savings/Thrift Bank 0.6 0.8 0.0 Savings/Thrift Bank 0.8 0.0 1.1 0.0
Money Lender 9.6 6.8 15.8 Money Lender 10.8 7.5 11.8 0.0
Relatives and Friends 3.6 3.1 4.7 Relatives and Friends 8.4 8.8 8.2 28.0
Financing Institution 1.0 0.9 1.2Financing Institution/
In-house financing7.7 8.3 7.5 11.6
Cooperative and Associations 10.7 10.2 11.8 Cooperative 2.0 0.0 2.6 0.0
Company (Employer) loan 0.6 0.9 0.0 Company (Employer) Loan 1.2 0.0 1.6 0.0
Others 5.6 6.9 2.8 Others 5.3 7.7 4.6 0.0
Number of Years Agreed upon
to Amortize Loan
Number of Years Agreed upon
to Amortize Loan
0-1.0 9.1 4.0 20.5 0-1.0 6.1 - 8.2 19.2
1.1-2.0 6.8 5.1 10.6 1.1-2.0 2.1 4.5 1.3 -
2.1-5.0 11.8 11.3 12.9 2.1-5.0 10.3 4.7 12.2 31.7
5.1-10.0 9.0 8.1 11.0 5.1-10.0 13.6 17.6 12.2 -
10.1-15.0 9.0 12.2 1.8 10.1-15.0 9.7 8.8 10.1 -
15.1-20.0 9.3 9.2 9.5 15.1-20.0 4.4 12.7 1.5 -
20.1-25.0 41.3 45.6 31.5 20.1-25.0 45.0 43.2 45.6 33.7
25.1-30.0 3.2 3.7 2.2 25.1-30.0 5.9 8.6 4.9 15.5
30.1-35.0 - - - 30.1-35.0 - - - -
35.1-40.0 - - - 35.1-40.0 - - - -
40.1-45.0 - - - 40.1-45.0 - - - -
45.1-50.0 0.5 0.7 - 45.1-50.0 1.0 - 1.3 -
50.1 and higher 2.0 - 2.7 -
Average 16.0 17.6 12.4 Average 18.2 19.1 17.9 14.7
Median 20.0 21.0 10.0 Median 25.0 25.0 25.0 5.0
Monthly Average Amount of
Amortization on the Mortgage
(In Pesos)
Monthly Average Amount of
Amortization on the Mortgage
(In Pesos)
0-500 30.4 35.4 18.0 0-500 12.3 11.5 12.5 14.8
501-1,000 20.8 24.8 11.0 501-1,000 17.1 33.7 12.4 0.0
1,001-5,000 38.8 32.5 54.2 1,001-5,000 58.1 43.4 62.3 68.0
5,001-10,000 5.3 3.2 10.7 5,001-10,000 8.4 0.0 10.7 17.1
10,001-50,000 4.0 3.5 5.2 10,001-50,000 4.2 11.5 2.1 0.0
50,000-100,000 0.7 0.6 0.9
Average 3,171.0 2,738.5 4,223.6 Average 3,361.7 3,727.6 3,257.6 2,907.9
Median 1,000.0 850.0 2,000.0 Median 2,000.0 1,083.3 2,500.0 2,000.0
Current Annual Rate of
Interest Being Charged on the
Loan
(In Percent)
Current Annual Rate of
Interest Being Charged on the
Loan
(In Percent)
0 8.6 7.8 10.6 0 14.8 24.9 11.7 16.3
1-5 27.0 31.1 17.7 1-5 17.9 16.0 18.5 11.6
6-10 46.5 43.1 54.1 6-10 18.1 39.4 11.7 12.0
11-20 14.1 15.2 11.7 11-20 7.7 3.7 8.8 13.5
21-30 1.5 - 4.8 21-30 4.1 0.0 5.4 13.5
31-40 1.9 2.8 - 31-40 0.0 0.0 0.0 0.0
41-50 - - - 41-50 0.0 0.0 0.0 0.0
51-60 0.4 - 1.2 51-60 0.0 0.0 0.0 0.0
61-70 - - - 61-70 0.0 0.0 0.0 0.0
71-80 - - - 71-80 2.6 0.0 3.4 0.0
81-90 - - - 81-90 0.0 0.0 0.0 0.0
91-100 - - - 91-100 0.9 4.1 0.0 0.0
Higher than 100 - - - Higher than 100 1.2 0.0 1.6 0.0
No response - - - No response 32.8 12.0 39.0 33.1
Average 8.2 8.0 8.7 Average 12.9 9.0 14.5 11.0
Median 7.0 7.0 7.0 Median 6.0 6.0 6.0 10.0
2014
In Percent
In Percent
In Percent
In Percent
In PercentIn Percent
In Percent
In Percent
Page 43
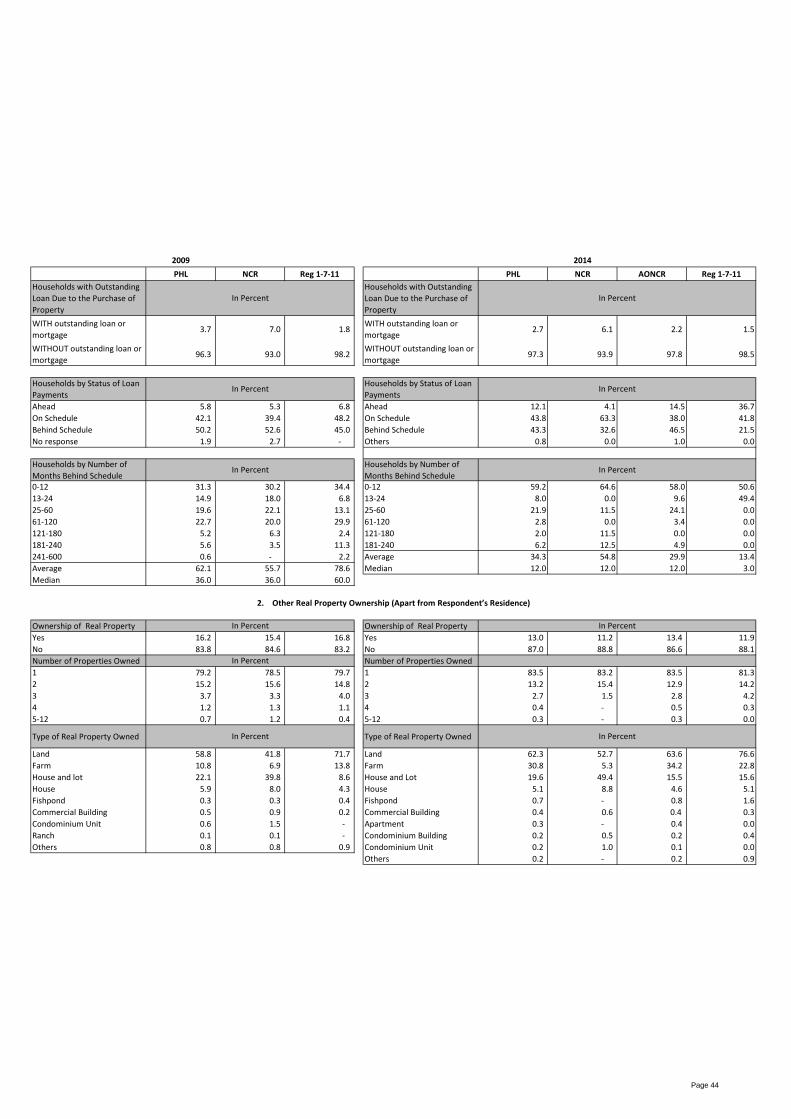
2009 2014
PHL NCR Reg 1-7-11 PHL NCR AONCR Reg 1-7-11
Households with Outstanding
Loan Due to the Purchase of
Property
Households with Outstanding
Loan Due to the Purchase of
Property
WITH outstanding loan or
mortgage 3.7 7.0 1.8
WITH outstanding loan or
mortgage 2.7 6.1 2.2 1.5
WITHOUT outstanding loan or
mortgage 96.3 93.0 98.2
WITHOUT outstanding loan or
mortgage 97.3 93.9 97.8 98.5
Households by Status of Loan
Payments
Households by Status of Loan
Payments
Ahead 5.8 5.3 6.8 Ahead 12.1 4.1 14.5 36.7
On Schedule 42.1 39.4 48.2 On Schedule 43.8 63.3 38.0 41.8
Behind Schedule 50.2 52.6 45.0 Behind Schedule 43.3 32.6 46.5 21.5
No response 1.9 2.7 - Others 0.8 0.0 1.0 0.0
Households by Number of
Months Behind Schedule
Households by Number of
Months Behind Schedule
0-12 31.3 30.2 34.4 0-12 59.2 64.6 58.0 50.6
13-24 14.9 18.0 6.8 13-24 8.0 0.0 9.6 49.4
25-60 19.6 22.1 13.1 25-60 21.9 11.5 24.1 0.0
61-120 22.7 20.0 29.9 61-120 2.8 0.0 3.4 0.0
121-180 5.2 6.3 2.4 121-180 2.0 11.5 0.0 0.0
181-240 5.6 3.5 11.3 181-240 6.2 12.5 4.9 0.0
241-600 0.6 - 2.2 Average 34.3 54.8 29.9 13.4
Average 62.1 55.7 78.6 Median 12.0 12.0 12.0 3.0
Median 36.0 36.0 60.0
Ownership of Real Property Ownership of Real Property
Yes 16.2 15.4 16.8 Yes 13.0 11.2 13.4 11.9
No 83.8 84.6 83.2 No 87.0 88.8 86.6 88.1
Number of Properties Owned Number of Properties Owned
1 79.2 78.5 79.7 1 83.5 83.2 83.5 81.3
2 15.2 15.6 14.8 2 13.2 15.4 12.9 14.2
3 3.7 3.3 4.0 3 2.7 1.5 2.8 4.2
4 1.2 1.3 1.1 4 0.4 - 0.5 0.3
5-12 0.7 1.2 0.4 5-12 0.3 - 0.3 0.0
Type of Real Property Owned Type of Real Property Owned
Land 58.8 41.8 71.7 Land 62.3 52.7 63.6 76.6
Farm 10.8 6.9 13.8 Farm 30.8 5.3 34.2 22.8
House and lot 22.1 39.8 8.6 House and Lot 19.6 49.4 15.5 15.6
House 5.9 8.0 4.3 House 5.1 8.8 4.6 5.1
Fishpond 0.3 0.3 0.4 Fishpond 0.7 - 0.8 1.6
Commercial Building 0.5 0.9 0.2 Commercial Building 0.4 0.6 0.4 0.3
Condominium Unit 0.6 1.5 - Apartment 0.3 - 0.4 0.0
Ranch 0.1 0.1 - Condominium Building 0.2 0.5 0.2 0.4
Others 0.8 0.8 0.9 Condominium Unit 0.2 1.0 0.1 0.0
Others 0.2 - 0.2 0.9
In Percent
In Percent
In Percent
In Percent
2. Other Real Property Ownership (Apart from Respondent’s Residence)
In Percent
In Percent
In Percent
In Percent
In Percent
In Percent
In Percent
Page 44
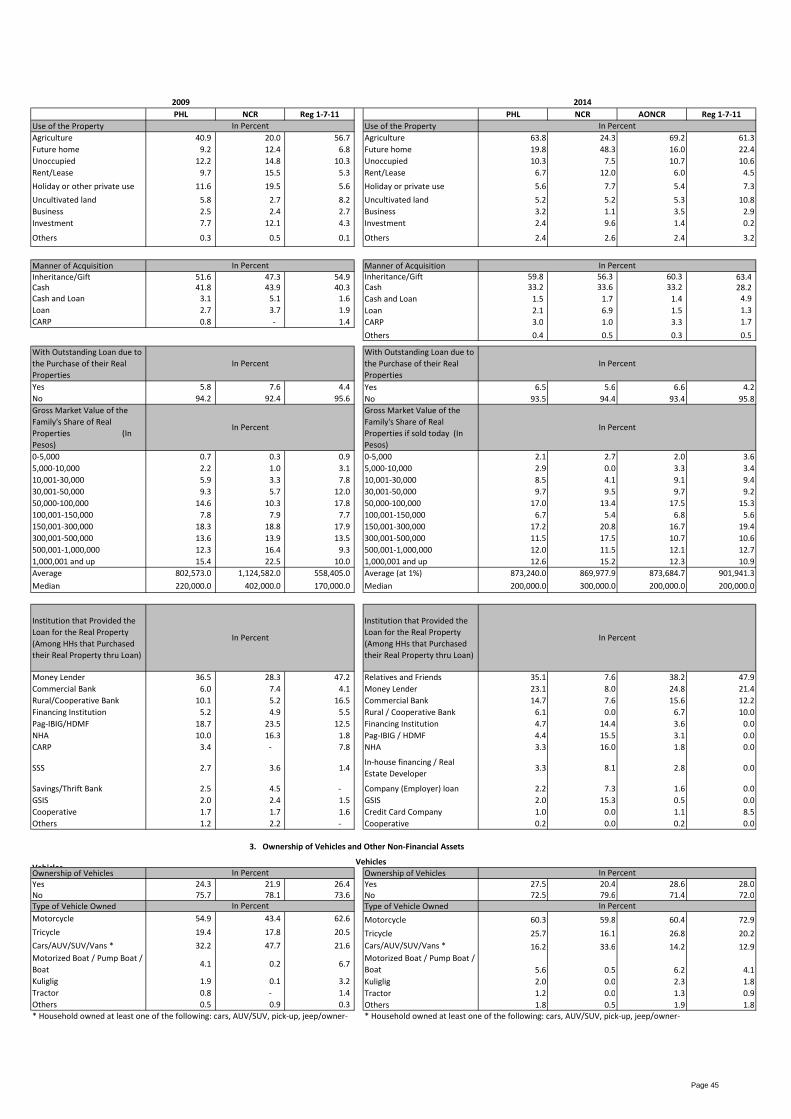
2009 2014
PHL NCR Reg 1-7-11 PHL NCR AONCR Reg 1-7-11
Use of the Property Use of the Property
Agriculture 40.9 20.0 56.7 Agriculture 63.8 24.3 69.2 61.3
Future home 9.2 12.4 6.8 Future home 19.8 48.3 16.0 22.4
Unoccupied 12.2 14.8 10.3 Unoccupied 10.3 7.5 10.7 10.6
Rent/Lease 9.7 15.5 5.3 Rent/Lease 6.7 12.0 6.0 4.5
Holiday or other private use 11.6 19.5 5.6 Holiday or private use 5.6 7.7 5.4 7.3
Uncultivated land 5.8 2.7 8.2 Uncultivated land 5.2 5.2 5.3 10.8
Business 2.5 2.4 2.7 Business 3.2 1.1 3.5 2.9
Investment 7.7 12.1 4.3 Investment 2.4 9.6 1.4 0.2
Others 0.3 0.5 0.1 Others 2.4 2.6 2.4 3.2
Manner of Acquisition Manner of Acquisition
Inheritance/Gift 51.6 47.3 54.9 Inheritance/Gift 59.8 56.3 60.3 63.4
Cash 41.8 43.9 40.3 Cash 33.2 33.6 33.2 28.2
Cash and Loan 3.1 5.1 1.6 Cash and Loan 1.5 1.7 1.4 4.9
Loan 2.7 3.7 1.9 Loan 2.1 6.9 1.5 1.3
CARP 0.8 - 1.4 CARP 3.0 1.0 3.3 1.7
Others 0.4 0.5 0.3 0.5
With Outstanding Loan due to
the Purchase of their Real
Properties
With Outstanding Loan due to
the Purchase of their Real
Properties
Yes 5.8 7.6 4.4 Yes 6.5 5.6 6.6 4.2
No 94.2 92.4 95.6 No 93.5 94.4 93.4 95.8
Gross Market Value of the
Family's Share of Real
Properties (In
Pesos)
Gross Market Value of the
Family's Share of Real
Properties if sold today (In
Pesos)
0-5,000 0.7 0.3 0.9 0-5,000 2.1 2.7 2.0 3.6
5,000-10,000 2.2 1.0 3.1 5,000-10,000 2.9 0.0 3.3 3.4
10,001-30,000 5.9 3.3 7.8 10,001-30,000 8.5 4.1 9.1 9.4
30,001-50,000 9.3 5.7 12.0 30,001-50,000 9.7 9.5 9.7 9.2
50,000-100,000 14.6 10.3 17.8 50,000-100,000 17.0 13.4 17.5 15.3
100,001-150,000 7.8 7.9 7.7 100,001-150,000 6.7 5.4 6.8 5.6
150,001-300,000 18.3 18.8 17.9 150,001-300,000 17.2 20.8 16.7 19.4
300,001-500,000 13.6 13.9 13.5 300,001-500,000 11.5 17.5 10.7 10.6
500,001-1,000,000 12.3 16.4 9.3 500,001-1,000,000 12.0 11.5 12.1 12.7
1,000,001 and up 15.4 22.5 10.0 1,000,001 and up 12.6 15.2 12.3 10.9
Average 802,573.0 1,124,582.0 558,405.0 Average (at 1%) 873,240.0 869,977.9 873,684.7 901,941.3
Median 220,000.0 402,000.0 170,000.0 Median 200,000.0 300,000.0 200,000.0 200,000.0
Institution that Provided the
Loan for the Real Property
(Among HHs that Purchased
their Real Property thru Loan)
Institution that Provided the
Loan for the Real Property
(Among HHs that Purchased
their Real Property thru Loan)
Money Lender 36.5 28.3 47.2 Relatives and Friends 35.1 7.6 38.2 47.9
Commercial Bank 6.0 7.4 4.1 Money Lender 23.1 8.0 24.8 21.4
Rural/Cooperative Bank 10.1 5.2 16.5 Commercial Bank 14.7 7.6 15.6 12.2
Financing Institution 5.2 4.9 5.5 Rural / Cooperative Bank 6.1 0.0 6.7 10.0
Pag-IBIG/HDMF 18.7 23.5 12.5 Financing Institution 4.7 14.4 3.6 0.0
NHA 10.0 16.3 1.8 Pag-IBIG / HDMF 4.4 15.5 3.1 0.0
CARP 3.4 - 7.8 NHA 3.3 16.0 1.8 0.0
SSS 2.7 3.6 1.4 In-house financing / Real
Estate Developer3.3 8.1 2.8 0.0
Savings/Thrift Bank 2.5 4.5 - Company (Employer) loan 2.2 7.3 1.6 0.0
GSIS 2.0 2.4 1.5 GSIS 2.0 15.3 0.5 0.0
Cooperative 1.7 1.7 1.6 Credit Card Company 1.0 0.0 1.1 8.5
Others 1.2 2.2 - Cooperative 0.2 0.0 0.2 0.0
VehiclesVehicles
Ownership of Vehicles Ownership of Vehicles
Yes 24.3 21.9 26.4 Yes 27.5 20.4 28.6 28.0
No 75.7 78.1 73.6 No 72.5 79.6 71.4 72.0
Type of Vehicle Owned Type of Vehicle Owned
Motorcycle 54.9 43.4 62.6 Motorcycle 60.3 59.8 60.4 72.9
Tricycle 19.4 17.8 20.5 Tricycle 25.7 16.1 26.8 20.2
Cars/AUV/SUV/Vans * 32.2 47.7 21.6 Cars/AUV/SUV/Vans * 16.2 33.6 14.2 12.9
Motorized Boat / Pump Boat /
Boat4.1 0.2 6.7
Motorized Boat / Pump Boat /
Boat 5.6 0.5 6.2 4.1
Kuliglig 1.9 0.1 3.2 Kuliglig 2.0 0.0 2.3 1.8
Tractor 0.8 - 1.4 Tractor 1.2 0.0 1.3 0.9
Others 0.5 0.9 0.3 Others 1.8 0.5 1.9 1.8
* Household owned at least one of the following: cars, AUV/SUV, pick-up, jeep/owner-
In Percent In Percent
* Household owned at least one of the following: cars, AUV/SUV, pick-up, jeep/owner-
In Percent
In Percent
In Percent
In Percent
3. Ownership of Vehicles and Other Non-Financial Assets
In Percent
In Percent
In Percent
In Percent
In Percent
In Percent
In Percent
In Percent
Page 45
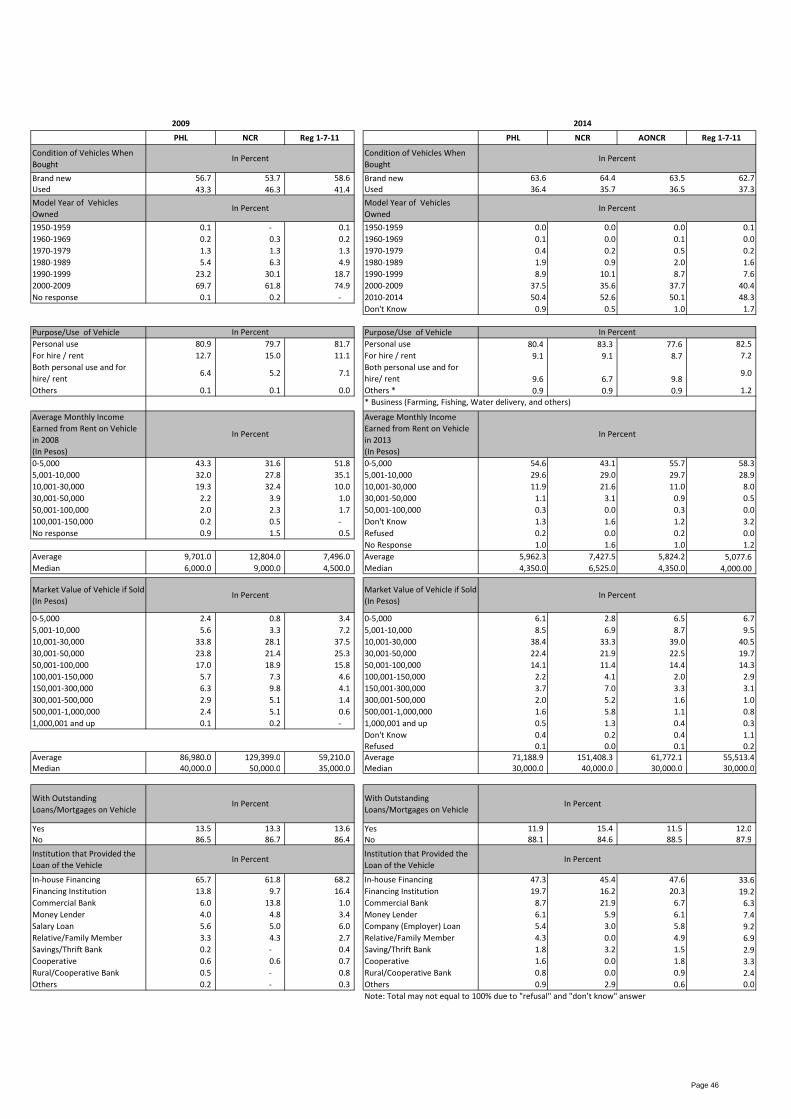
2009 2014
PHL NCR Reg 1-7-11 PHL NCR AONCR Reg 1-7-11
Condition of Vehicles When
Bought
Condition of Vehicles When
Bought
Brand new 56.7 53.7 58.6 Brand new 63.6 64.4 63.5 62.7
Used 43.3 46.3 41.4 Used 36.4 35.7 36.5 37.3
Model Year of Vehicles
Owned
Model Year of Vehicles
Owned
1950-1959 0.1 - 0.1 1950-1959 0.0 0.0 0.0 0.1
1960-1969 0.2 0.3 0.2 1960-1969 0.1 0.0 0.1 0.0
1970-1979 1.3 1.3 1.3 1970-1979 0.4 0.2 0.5 0.2
1980-1989 5.4 6.3 4.9 1980-1989 1.9 0.9 2.0 1.6
1990-1999 23.2 30.1 18.7 1990-1999 8.9 10.1 8.7 7.6
2000-2009 69.7 61.8 74.9 2000-2009 37.5 35.6 37.7 40.4
No response 0.1 0.2 - 2010-2014 50.4 52.6 50.1 48.3
Don't Know 0.9 0.5 1.0 1.7
Purpose/Use of Vehicle Purpose/Use of Vehicle
Personal use 80.9 79.7 81.7 Personal use 80.4 83.3 77.6 82.5
For hire / rent 12.7 15.0 11.1 For hire / rent 9.1 9.1 8.7 7.2
Both personal use and for
hire/ rent6.4 5.2 7.1
Both personal use and for
hire/ rent 9.6 6.7 9.8 9.0
Others 0.1 0.1 0.0 Others * 0.9 0.9 0.9 1.2
Average Monthly Income
Earned from Rent on Vehicle
in 2008
(In Pesos)
Average Monthly Income
Earned from Rent on Vehicle
in 2013
(In Pesos)
0-5,000 43.3 31.6 51.8 0-5,000 54.6 43.1 55.7 58.3
5,001-10,000 32.0 27.8 35.1 5,001-10,000 29.6 29.0 29.7 28.9
10,001-30,000 19.3 32.4 10.0 10,001-30,000 11.9 21.6 11.0 8.0
30,001-50,000 2.2 3.9 1.0 30,001-50,000 1.1 3.1 0.9 0.5
50,001-100,000 2.0 2.3 1.7 50,001-100,000 0.3 0.0 0.3 0.0
100,001-150,000 0.2 0.5 - Don't Know 1.3 1.6 1.2 3.2
No response 0.9 1.5 0.5 Refused 0.2 0.0 0.2 0.0
No Response 1.0 1.6 1.0 1.2
Average 9,701.0 12,804.0 7,496.0 Average 5,962.3 7,427.5 5,824.2 5,077.6
Median 6,000.0 9,000.0 4,500.0 Median 4,350.0 6,525.0 4,350.0 4,000.00
Market Value of Vehicle if Sold
(In Pesos)
Market Value of Vehicle if Sold
(In Pesos)
0-5,000 2.4 0.8 3.4 0-5,000 6.1 2.8 6.5 6.7
5,001-10,000 5.6 3.3 7.2 5,001-10,000 8.5 6.9 8.7 9.5
10,001-30,000 33.8 28.1 37.5 10,001-30,000 38.4 33.3 39.0 40.5
30,001-50,000 23.8 21.4 25.3 30,001-50,000 22.4 21.9 22.5 19.7
50,001-100,000 17.0 18.9 15.8 50,001-100,000 14.1 11.4 14.4 14.3
100,001-150,000 5.7 7.3 4.6 100,001-150,000 2.2 4.1 2.0 2.9
150,001-300,000 6.3 9.8 4.1 150,001-300,000 3.7 7.0 3.3 3.1
300,001-500,000 2.9 5.1 1.4 300,001-500,000 2.0 5.2 1.6 1.0
500,001-1,000,000 2.4 5.1 0.6 500,001-1,000,000 1.6 5.8 1.1 0.8
1,000,001 and up 0.1 0.2 - 1,000,001 and up 0.5 1.3 0.4 0.3
Don't Know 0.4 0.2 0.4 1.1
Refused 0.1 0.0 0.1 0.2
Average 86,980.0 129,399.0 59,210.0 Average 71,188.9 151,408.3 61,772.1 55,513.4
Median 40,000.0 50,000.0 35,000.0 Median 30,000.0 40,000.0 30,000.0 30,000.0
With Outstanding
Loans/Mortgages on Vehicle
With Outstanding
Loans/Mortgages on Vehicle
Yes 13.5 13.3 13.6 Yes 11.9 15.4 11.5 12.0
No 86.5 86.7 86.4 No 88.1 84.6 88.5 87.9
Institution that Provided the
Loan of the Vehicle
Institution that Provided the
Loan of the Vehicle
In-house Financing 65.7 61.8 68.2 In-house Financing 47.3 45.4 47.6 33.6
Financing Institution 13.8 9.7 16.4 Financing Institution 19.7 16.2 20.3 19.2
Commercial Bank 6.0 13.8 1.0 Commercial Bank 8.7 21.9 6.7 6.3
Money Lender 4.0 4.8 3.4 Money Lender 6.1 5.9 6.1 7.4
Salary Loan 5.6 5.0 6.0 Company (Employer) Loan 5.4 3.0 5.8 9.2
Relative/Family Member 3.3 4.3 2.7 Relative/Family Member 4.3 0.0 4.9 6.9
Savings/Thrift Bank 0.2 - 0.4 Saving/Thrift Bank 1.8 3.2 1.5 2.9
Cooperative 0.6 0.6 0.7 Cooperative 1.6 0.0 1.8 3.3
Rural/Cooperative Bank 0.5 - 0.8 Rural/Cooperative Bank 0.8 0.0 0.9 2.4
Others 0.2 - 0.3 Others 0.9 2.9 0.6 0.0
Note: Total may not equal to 100% due to "refusal" and "don’t know" answer
* Business (Farming, Fishing, Water delivery, and others)
In PercentIn Percent
In Percent
In Percent
In Percent
In Percent
In Percent
In Percent In Percent
In Percent In Percent
In Percent
In Percent
In Percent
Page 46
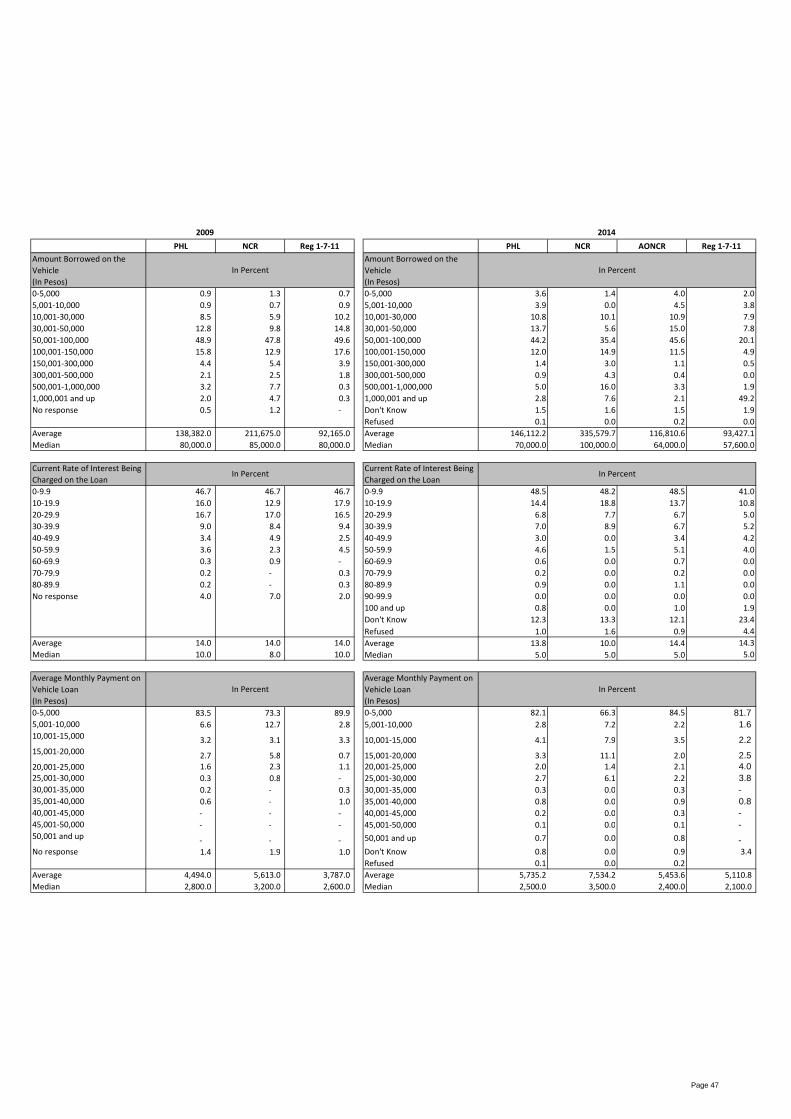
2009 2014
PHL NCR Reg 1-7-11 PHL NCR AONCR Reg 1-7-11
Amount Borrowed on the
Vehicle
(In Pesos)
Amount Borrowed on the
Vehicle
(In Pesos)
0-5,000 0.9 1.3 0.7 0-5,000 3.6 1.4 4.0 2.0
5,001-10,000 0.9 0.7 0.9 5,001-10,000 3.9 0.0 4.5 3.8
10,001-30,000 8.5 5.9 10.2 10,001-30,000 10.8 10.1 10.9 7.9
30,001-50,000 12.8 9.8 14.8 30,001-50,000 13.7 5.6 15.0 7.8
50,001-100,000 48.9 47.8 49.6 50,001-100,000 44.2 35.4 45.6 20.1
100,001-150,000 15.8 12.9 17.6 100,001-150,000 12.0 14.9 11.5 4.9
150,001-300,000 4.4 5.4 3.9 150,001-300,000 1.4 3.0 1.1 0.5
300,001-500,000 2.1 2.5 1.8 300,001-500,000 0.9 4.3 0.4 0.0
500,001-1,000,000 3.2 7.7 0.3 500,001-1,000,000 5.0 16.0 3.3 1.9
1,000,001 and up 2.0 4.7 0.3 1,000,001 and up 2.8 7.6 2.1 49.2
No response 0.5 1.2 - Don't Know 1.5 1.6 1.5 1.9
Refused 0.1 0.0 0.2 0.0
Average 138,382.0 211,675.0 92,165.0 Average 146,112.2 335,579.7 116,810.6 93,427.1
Median 80,000.0 85,000.0 80,000.0 Median 70,000.0 100,000.0 64,000.0 57,600.0
Current Rate of Interest Being
Charged on the Loan
Current Rate of Interest Being
Charged on the Loan
0-9.9 46.7 46.7 46.7 0-9.9 48.5 48.2 48.5 41.0
10-19.9 16.0 12.9 17.9 10-19.9 14.4 18.8 13.7 10.8
20-29.9 16.7 17.0 16.5 20-29.9 6.8 7.7 6.7 5.0
30-39.9 9.0 8.4 9.4 30-39.9 7.0 8.9 6.7 5.2
40-49.9 3.4 4.9 2.5 40-49.9 3.0 0.0 3.4 4.2
50-59.9 3.6 2.3 4.5 50-59.9 4.6 1.5 5.1 4.0
60-69.9 0.3 0.9 - 60-69.9 0.6 0.0 0.7 0.0
70-79.9 0.2 - 0.3 70-79.9 0.2 0.0 0.2 0.0
80-89.9 0.2 - 0.3 80-89.9 0.9 0.0 1.1 0.0
No response 4.0 7.0 2.0 90-99.9 0.0 0.0 0.0 0.0
100 and up 0.8 0.0 1.0 1.9
Don't Know 12.3 13.3 12.1 23.4
Refused 1.0 1.6 0.9 4.4
Average 14.0 14.0 14.0 Average 13.8 10.0 14.4 14.3
Median 10.0 8.0 10.0 Median 5.0 5.0 5.0 5.0
Average Monthly Payment on
Vehicle Loan
(In Pesos)
Average Monthly Payment on
Vehicle Loan
(In Pesos)
0-5,000 83.5 73.3 89.9 0-5,000 82.1 66.3 84.5 81.7 5,001-10,000 6.6 12.7 2.8 5,001-10,000 2.8 7.2 2.2 1.6 10,001-15,000
3.2 3.1 3.3 10,001-15,000 4.1 7.9 3.5 2.2 15,001-20,000
2.7 5.8 0.7 15,001-20,000 3.3 11.1 2.0 2.5 20,001-25,000 1.6 2.3 1.1 20,001-25,000 2.0 1.4 2.1 4.0 25,001-30,000 0.3 0.8 - 25,001-30,000 2.7 6.1 2.2 3.8 30,001-35,000 0.2 - 0.3 30,001-35,000 0.3 0.0 0.3 - 35,001-40,000 0.6 - 1.0 35,001-40,000 0.8 0.0 0.9 0.8 40,001-45,000 - - - 40,001-45,000 0.2 0.0 0.3 - 45,001-50,000 - - - 45,001-50,000 0.1 0.0 0.1 - 50,001 and up
- - - 50,001 and up 0.7 0.0 0.8 - No response 1.4 1.9 1.0 Don't Know 0.8 0.0 0.9 3.4
Refused 0.1 0.0 0.2
Average 4,494.0 5,613.0 3,787.0 Average 5,735.2 7,534.2 5,453.6 5,110.8
Median 2,800.0 3,200.0 2,600.0 Median 2,500.0 3,500.0 2,400.0 2,100.0
In Percent In Percent
In Percent
In Percent
In Percent
In Percent
Page 47
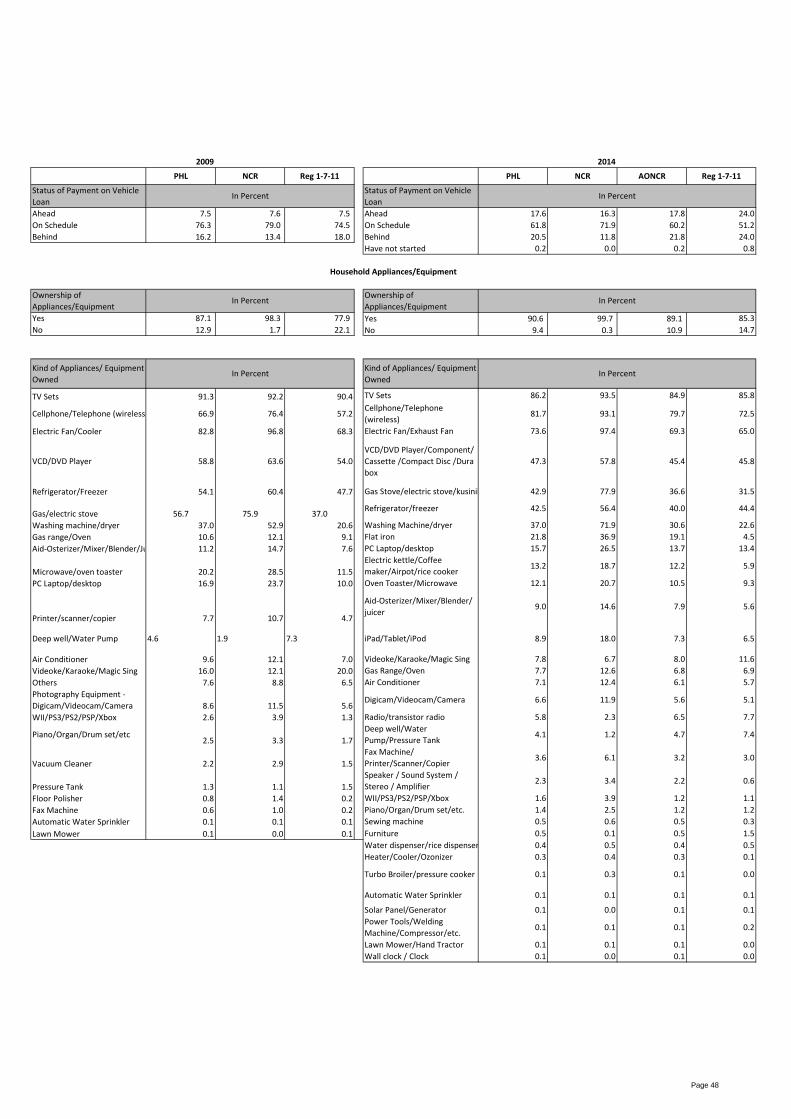
2009 2014
PHL NCR Reg 1-7-11 PHL NCR AONCR Reg 1-7-11
Status of Payment on Vehicle
Loan
Status of Payment on Vehicle
Loan
Ahead 7.5 7.6 7.5 Ahead 17.6 16.3 17.8 24.0
On Schedule 76.3 79.0 74.5 On Schedule 61.8 71.9 60.2 51.2
Behind 16.2 13.4 18.0 Behind 20.5 11.8 21.8 24.0
Have not started 0.2 0.0 0.2 0.8
Ownership of
Appliances/Equipment
Ownership of
Appliances/Equipment
Yes 87.1 98.3 77.9 Yes 90.6 99.7 89.1 85.3
No 12.9 1.7 22.1 No 9.4 0.3 10.9 14.7
Kind of Appliances/ Equipment
Owned
Kind of Appliances/ Equipment
Owned
TV Sets 91.3 92.2 90.4 TV Sets 86.2 93.5 84.9 85.8
Cellphone/Telephone (wireless) 66.9 76.4 57.2Cellphone/Telephone
(wireless)81.7 93.1 79.7 72.5
Electric Fan/Cooler 82.8 96.8 68.3 Electric Fan/Exhaust Fan 73.6 97.4 69.3 65.0
VCD/DVD Player 58.8 63.6 54.0
VCD/DVD Player/Component/
Cassette /Compact Disc /Dura
box
47.3 57.8 45.4 45.8
Refrigerator/Freezer 54.1 60.4 47.7 Gas Stove/electric stove/kusinilya de gaas/super kalan42.9 77.9 36.6 31.5
Gas/electric stove 56.7 75.9 37.0Refrigerator/freezer 42.5 56.4 40.0 44.4
Washing machine/dryer 37.0 52.9 20.6 Washing Machine/dryer 37.0 71.9 30.6 22.6
Gas range/Oven 10.6 12.1 9.1 Flat iron 21.8 36.9 19.1 4.5
Aid-Osterizer/Mixer/Blender/Juicer 11.2 14.7 7.6 PC Laptop/desktop 15.7 26.5 13.7 13.4
Microwave/oven toaster 20.2 28.5 11.5
Electric kettle/Coffee
maker/Airpot/rice cooker13.2 18.7 12.2 5.9
PC Laptop/desktop 16.9 23.7 10.0 Oven Toaster/Microwave 12.1 20.7 10.5 9.3
Printer/scanner/copier 7.7 10.7 4.7
Aid-Osterizer/Mixer/Blender/
juicer9.0 14.6 7.9 5.6
Deep well/Water Pump 4.6 1.9 7.3 iPad/Tablet/iPod 8.9 18.0 7.3 6.5
Air Conditioner 9.6 12.1 7.0 Videoke/Karaoke/Magic Sing 7.8 6.7 8.0 11.6
Videoke/Karaoke/Magic Sing 16.0 12.1 20.0 Gas Range/Oven 7.7 12.6 6.8 6.9
Others 7.6 8.8 6.5 Air Conditioner 7.1 12.4 6.1 5.7
Photography Equipment -
Digicam/Videocam/Camera 8.6 11.5 5.6Digicam/Videocam/Camera 6.6 11.9 5.6 5.1
WII/PS3/PS2/PSP/Xbox 2.6 3.9 1.3 Radio/transistor radio 5.8 2.3 6.5 7.7
Piano/Organ/Drum set/etc2.5 3.3 1.7
Deep well/Water
Pump/Pressure Tank4.1 1.2 4.7 7.4
Vacuum Cleaner 2.2 2.9 1.5
Fax Machine/
Printer/Scanner/Copier3.6 6.1 3.2 3.0
Pressure Tank 1.3 1.1 1.5
Speaker / Sound System /
Stereo / Amplifier2.3 3.4 2.2 0.6
Floor Polisher 0.8 1.4 0.2 WII/PS3/PS2/PSP/Xbox 1.6 3.9 1.2 1.1
Fax Machine 0.6 1.0 0.2 Piano/Organ/Drum set/etc. 1.4 2.5 1.2 1.2
Automatic Water Sprinkler 0.1 0.1 0.1 Sewing machine 0.5 0.6 0.5 0.3
Lawn Mower 0.1 0.0 0.1 Furniture 0.5 0.1 0.5 1.5
Water dispenser/rice dispenser 0.4 0.5 0.4 0.5
Heater/Cooler/Ozonizer 0.3 0.4 0.3 0.1
Turbo Broiler/pressure cooker 0.1 0.3 0.1 0.0
Automatic Water Sprinkler 0.1 0.1 0.1 0.1
Solar Panel/Generator 0.1 0.0 0.1 0.1
Power Tools/Welding
Machine/Compressor/etc.0.1 0.1 0.1 0.2
Lawn Mower/Hand Tractor 0.1 0.1 0.1 0.0
Wall clock / Clock 0.1 0.0 0.1 0.0
In Percent
In Percent
In Percent
In Percent
Household Appliances/Equipment
In Percent
In Percent
Page 48
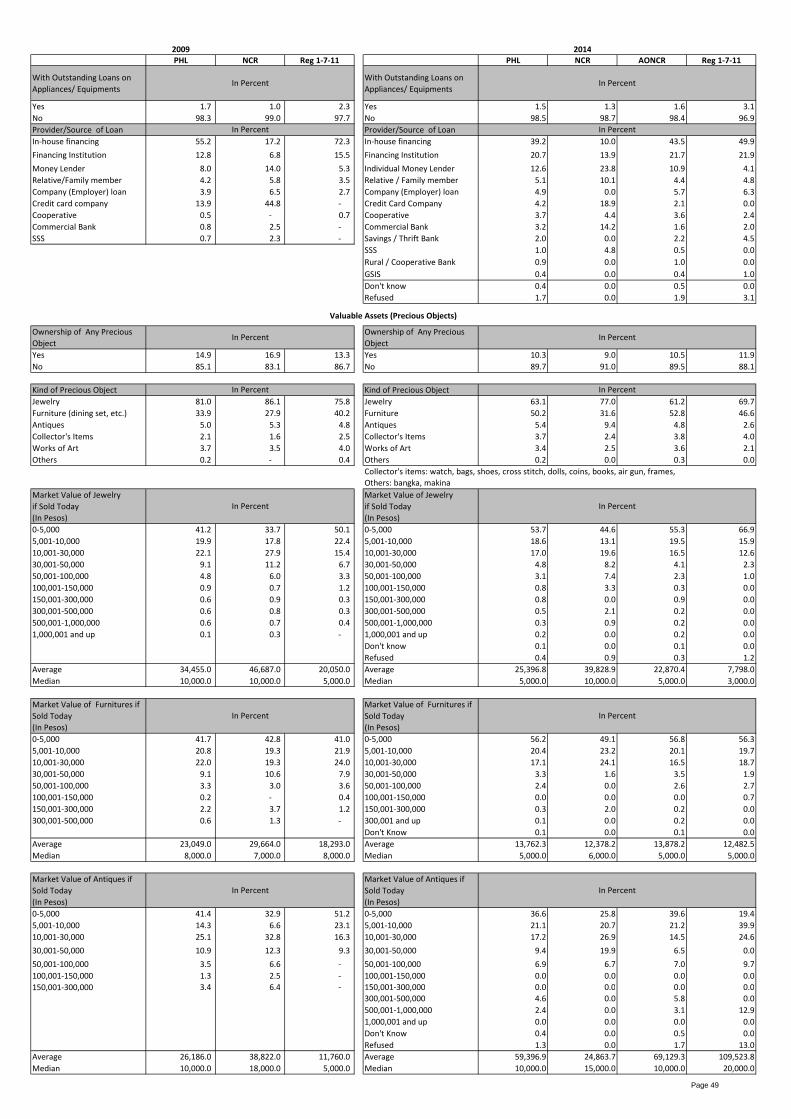
2009 2014
PHL NCR Reg 1-7-11 PHL NCR AONCR Reg 1-7-11
With Outstanding Loans on
Appliances/ Equipments
With Outstanding Loans on
Appliances/ Equipments
Yes 1.7 1.0 2.3 Yes 1.5 1.3 1.6 3.1
No 98.3 99.0 97.7 No 98.5 98.7 98.4 96.9
Provider/Source of Loan Provider/Source of Loan
In-house financing 55.2 17.2 72.3 In-house financing 39.2 10.0 43.5 49.9
Financing Institution 12.8 6.8 15.5 Financing Institution 20.7 13.9 21.7 21.9
Money Lender 8.0 14.0 5.3 Individual Money Lender 12.6 23.8 10.9 4.1
Relative/Family member 4.2 5.8 3.5 Relative / Family member 5.1 10.1 4.4 4.8
Company (Employer) loan 3.9 6.5 2.7 Company (Employer) loan 4.9 0.0 5.7 6.3
Credit card company 13.9 44.8 - Credit Card Company 4.2 18.9 2.1 0.0
Cooperative 0.5 - 0.7 Cooperative 3.7 4.4 3.6 2.4
Commercial Bank 0.8 2.5 - Commercial Bank 3.2 14.2 1.6 2.0
SSS 0.7 2.3 - Savings / Thrift Bank 2.0 0.0 2.2 4.5
SSS 1.0 4.8 0.5 0.0
Rural / Cooperative Bank 0.9 0.0 1.0 0.0
GSIS 0.4 0.0 0.4 1.0
Don't know 0.4 0.0 0.5 0.0
Refused 1.7 0.0 1.9 3.1
Ownership of Any Precious
Object
Ownership of Any Precious
Object
Yes 14.9 16.9 13.3 Yes 10.3 9.0 10.5 11.9
No 85.1 83.1 86.7 No 89.7 91.0 89.5 88.1
Kind of Precious Object Kind of Precious Object
Jewelry 81.0 86.1 75.8 Jewelry 63.1 77.0 61.2 69.7
Furniture (dining set, etc.) 33.9 27.9 40.2 Furniture 50.2 31.6 52.8 46.6
Antiques 5.0 5.3 4.8 Antiques 5.4 9.4 4.8 2.6
Collector's Items 2.1 1.6 2.5 Collector's Items 3.7 2.4 3.8 4.0
Works of Art 3.7 3.5 4.0 Works of Art 3.4 2.5 3.6 2.1
Others 0.2 - 0.4 Others 0.2 0.0 0.3 0.0
Market Value of Jewelry
if Sold Today
(In Pesos)
Market Value of Jewelry
if Sold Today
(In Pesos)
0-5,000 41.2 33.7 50.1 0-5,000 53.7 44.6 55.3 66.9
5,001-10,000 19.9 17.8 22.4 5,001-10,000 18.6 13.1 19.5 15.9
10,001-30,000 22.1 27.9 15.4 10,001-30,000 17.0 19.6 16.5 12.6
30,001-50,000 9.1 11.2 6.7 30,001-50,000 4.8 8.2 4.1 2.3
50,001-100,000 4.8 6.0 3.3 50,001-100,000 3.1 7.4 2.3 1.0
100,001-150,000 0.9 0.7 1.2 100,001-150,000 0.8 3.3 0.3 0.0
150,001-300,000 0.6 0.9 0.3 150,001-300,000 0.8 0.0 0.9 0.0
300,001-500,000 0.6 0.8 0.3 300,001-500,000 0.5 2.1 0.2 0.0
500,001-1,000,000 0.6 0.7 0.4 500,001-1,000,000 0.3 0.9 0.2 0.0
1,000,001 and up 0.1 0.3 - 1,000,001 and up 0.2 0.0 0.2 0.0
Don't know 0.1 0.0 0.1 0.0
Refused 0.4 0.9 0.3 1.2
Average 34,455.0 46,687.0 20,050.0 Average 25,396.8 39,828.9 22,870.4 7,798.0
Median 10,000.0 10,000.0 5,000.0 Median 5,000.0 10,000.0 5,000.0 3,000.0
Market Value of Furnitures if
Sold Today
(In Pesos)
Market Value of Furnitures if
Sold Today
(In Pesos)
0-5,000 41.7 42.8 41.0 0-5,000 56.2 49.1 56.8 56.3
5,001-10,000 20.8 19.3 21.9 5,001-10,000 20.4 23.2 20.1 19.7
10,001-30,000 22.0 19.3 24.0 10,001-30,000 17.1 24.1 16.5 18.7
30,001-50,000 9.1 10.6 7.9 30,001-50,000 3.3 1.6 3.5 1.9
50,001-100,000 3.3 3.0 3.6 50,001-100,000 2.4 0.0 2.6 2.7
100,001-150,000 0.2 - 0.4 100,001-150,000 0.0 0.0 0.0 0.7
150,001-300,000 2.2 3.7 1.2 150,001-300,000 0.3 2.0 0.2 0.0
300,001-500,000 0.6 1.3 - 300,001 and up 0.1 0.0 0.2 0.0
Don't Know 0.1 0.0 0.1 0.0
Average 23,049.0 29,664.0 18,293.0 Average 13,762.3 12,378.2 13,878.2 12,482.5
Median 8,000.0 7,000.0 8,000.0 Median 5,000.0 6,000.0 5,000.0 5,000.0
Market Value of Antiques if
Sold Today
(In Pesos)
Market Value of Antiques if
Sold Today
(In Pesos)
0-5,000 41.4 32.9 51.2 0-5,000 36.6 25.8 39.6 19.4
5,001-10,000 14.3 6.6 23.1 5,001-10,000 21.1 20.7 21.2 39.9
10,001-30,000 25.1 32.8 16.3 10,001-30,000 17.2 26.9 14.5 24.6
30,001-50,000 10.9 12.3 9.3 30,001-50,000 9.4 19.9 6.5 0.0
50,001-100,000 3.5 6.6 - 50,001-100,000 6.9 6.7 7.0 9.7
100,001-150,000 1.3 2.5 - 100,001-150,000 0.0 0.0 0.0 0.0
150,001-300,000 3.4 6.4 - 150,001-300,000 0.0 0.0 0.0 0.0
300,001-500,000 4.6 0.0 5.8 0.0
500,001-1,000,000 2.4 0.0 3.1 12.9
1,000,001 and up 0.0 0.0 0.0 0.0
Don't Know 0.4 0.0 0.5 0.0
Refused 1.3 0.0 1.7 13.0
Average 26,186.0 38,822.0 11,760.0 Average 59,396.9 24,863.7 69,129.3 109,523.8
Median 10,000.0 18,000.0 5,000.0 Median 10,000.0 15,000.0 10,000.0 20,000.0
In Percent
Collector's items: watch, bags, shoes, cross stitch, dolls, coins, books, air gun, frames,
Others: bangka, makina
In Percent
In Percent
In Percent
In Percent
In Percent
In Percent
In Percent
In Percent
In Percent
In Percent
In Percent
Valuable Assets (Precious Objects)
In Percent
In Percent
Page 49
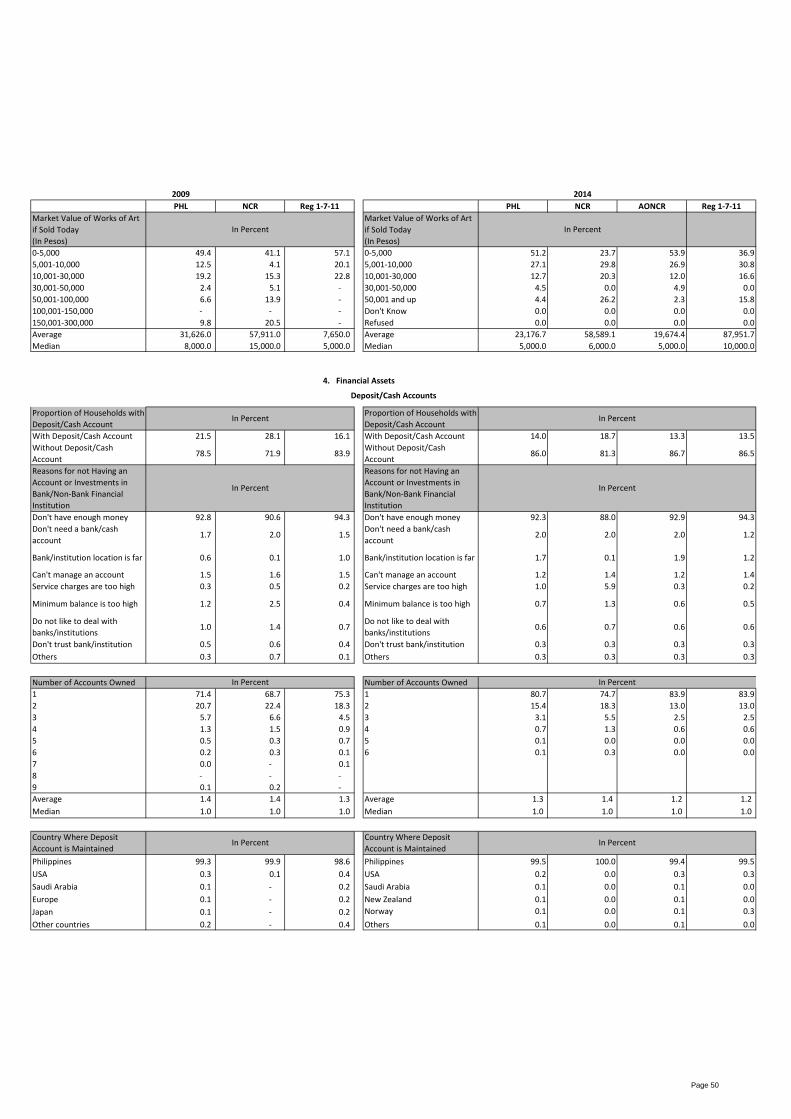
2009 2014
PHL NCR Reg 1-7-11 PHL NCR AONCR Reg 1-7-11
Market Value of Works of Art
if Sold Today
(In Pesos)
Market Value of Works of Art
if Sold Today
(In Pesos)
0-5,000 49.4 41.1 57.1 0-5,000 51.2 23.7 53.9 36.9
5,001-10,000 12.5 4.1 20.1 5,001-10,000 27.1 29.8 26.9 30.8
10,001-30,000 19.2 15.3 22.8 10,001-30,000 12.7 20.3 12.0 16.6
30,001-50,000 2.4 5.1 - 30,001-50,000 4.5 0.0 4.9 0.0
50,001-100,000 6.6 13.9 - 50,001 and up 4.4 26.2 2.3 15.8
100,001-150,000 - - - Don't Know 0.0 0.0 0.0 0.0
150,001-300,000 9.8 20.5 - Refused 0.0 0.0 0.0 0.0
Average 31,626.0 57,911.0 7,650.0 Average 23,176.7 58,589.1 19,674.4 87,951.7
Median 8,000.0 15,000.0 5,000.0 Median 5,000.0 6,000.0 5,000.0 10,000.0
Proportion of Households with
Deposit/Cash Account
Proportion of Households with
Deposit/Cash Account
With Deposit/Cash Account 21.5 28.1 16.1 With Deposit/Cash Account 14.0 18.7 13.3 13.5
Without Deposit/Cash
Account78.5 71.9 83.9
Without Deposit/Cash
Account86.0 81.3 86.7 86.5
Reasons for not Having an
Account or Investments in
Bank/Non-Bank Financial
Institution
Reasons for not Having an
Account or Investments in
Bank/Non-Bank Financial
Institution
Don't have enough money 92.8 90.6 94.3 Don't have enough money 92.3 88.0 92.9 94.3
Don't need a bank/cash
account1.7 2.0 1.5
Don't need a bank/cash
account2.0 2.0 2.0 1.2
Bank/institution location is far 0.6 0.1 1.0 Bank/institution location is far 1.7 0.1 1.9 1.2
Can't manage an account 1.5 1.6 1.5 Can't manage an account 1.2 1.4 1.2 1.4
Service charges are too high 0.3 0.5 0.2 Service charges are too high 1.0 5.9 0.3 0.2
Minimum balance is too high 1.2 2.5 0.4 Minimum balance is too high 0.7 1.3 0.6 0.5
Do not like to deal with
banks/institutions1.0 1.4 0.7
Do not like to deal with
banks/institutions0.6 0.7 0.6 0.6
Don't trust bank/institution 0.5 0.6 0.4 Don't trust bank/institution 0.3 0.3 0.3 0.3
Others 0.3 0.7 0.1 Others 0.3 0.3 0.3 0.3
Number of Accounts Owned Number of Accounts Owned
1 71.4 68.7 75.3 1 80.7 74.7 83.9 83.9
2 20.7 22.4 18.3 2 15.4 18.3 13.0 13.0
3 5.7 6.6 4.5 3 3.1 5.5 2.5 2.5
4 1.3 1.5 0.9 4 0.7 1.3 0.6 0.6
5 0.5 0.3 0.7 5 0.1 0.0 0.0 0.0
6 0.2 0.3 0.1 6 0.1 0.3 0.0 0.0
7 0.0 - 0.1
8 - - -
9 0.1 0.2 -
Average 1.4 1.4 1.3 Average 1.3 1.4 1.2 1.2
Median 1.0 1.0 1.0 Median 1.0 1.0 1.0 1.0
Country Where Deposit
Account is Maintained
Country Where Deposit
Account is Maintained
Philippines 99.3 99.9 98.6 Philippines 99.5 100.0 99.4 99.5
USA 0.3 0.1 0.4 USA 0.2 0.0 0.3 0.3
Saudi Arabia 0.1 - 0.2 Saudi Arabia 0.1 0.0 0.1 0.0
Europe 0.1 - 0.2 New Zealand 0.1 0.0 0.1 0.0
Japan 0.1 - 0.2 Norway 0.1 0.0 0.1 0.3
Other countries 0.2 - 0.4 Others 0.1 0.0 0.1 0.0
In Percent
Deposit/Cash Accounts
In Percent
In PercentIn Percent
In PercentIn Percent
In Percent
In Percent
4. Financial Assets
In Percent
In Percent
Page 50
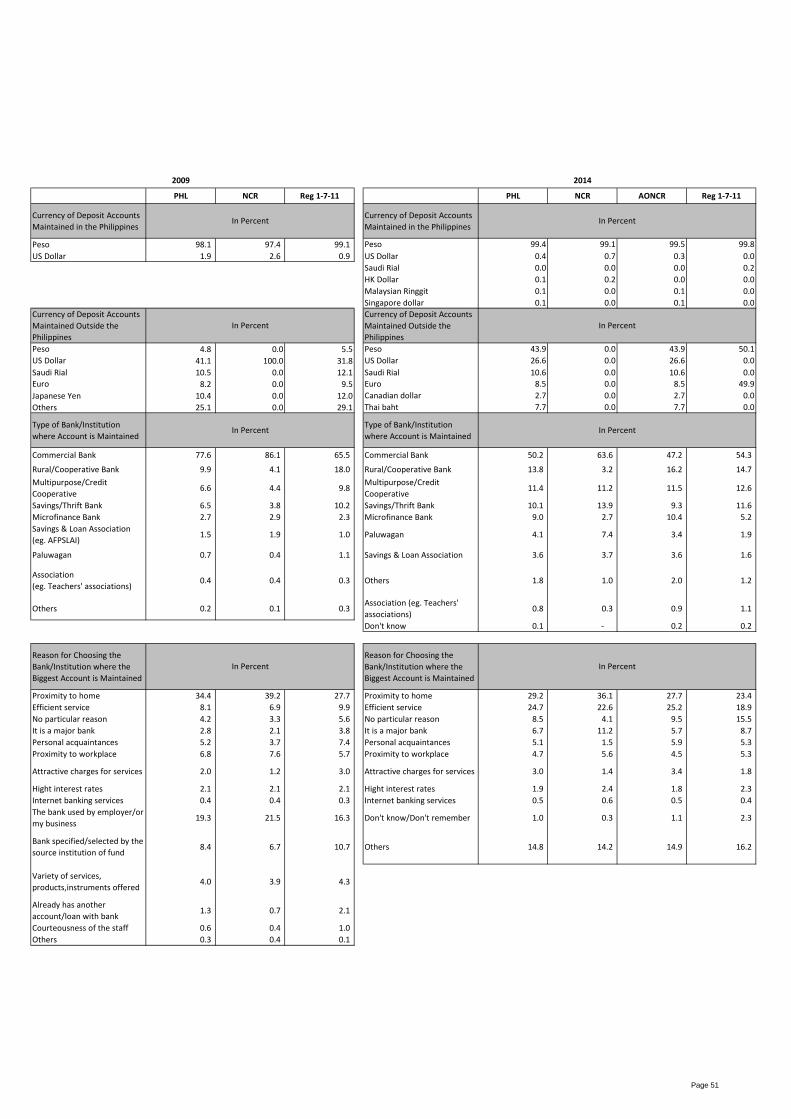
2009 2014
PHL NCR Reg 1-7-11 PHL NCR AONCR Reg 1-7-11
Currency of Deposit Accounts
Maintained in the Philippines
Currency of Deposit Accounts
Maintained in the Philippines
Peso 98.1 97.4 99.1 Peso 99.4 99.1 99.5 99.8
US Dollar 1.9 2.6 0.9 US Dollar 0.4 0.7 0.3 0.0
Saudi Rial 0.0 0.0 0.0 0.2
HK Dollar 0.1 0.2 0.0 0.0
Malaysian Ringgit 0.1 0.0 0.1 0.0
Singapore dollar 0.1 0.0 0.1 0.0
Currency of Deposit Accounts
Maintained Outside the
Philippines
Currency of Deposit Accounts
Maintained Outside the
Philippines
Peso 4.8 0.0 5.5 Peso 43.9 0.0 43.9 50.1
US Dollar 41.1 100.0 31.8 US Dollar 26.6 0.0 26.6 0.0
Saudi Rial 10.5 0.0 12.1 Saudi Rial 10.6 0.0 10.6 0.0
Euro 8.2 0.0 9.5 Euro 8.5 0.0 8.5 49.9
Japanese Yen 10.4 0.0 12.0 Canadian dollar 2.7 0.0 2.7 0.0
Others 25.1 0.0 29.1 Thai baht 7.7 0.0 7.7 0.0
Type of Bank/Institution
where Account is Maintained
Type of Bank/Institution
where Account is Maintained
Commercial Bank 77.6 86.1 65.5 Commercial Bank 50.2 63.6 47.2 54.3
Rural/Cooperative Bank 9.9 4.1 18.0 Rural/Cooperative Bank 13.8 3.2 16.2 14.7
Multipurpose/Credit
Cooperative6.6 4.4 9.8
Multipurpose/Credit
Cooperative11.4 11.2 11.5 12.6
Savings/Thrift Bank 6.5 3.8 10.2 Savings/Thrift Bank 10.1 13.9 9.3 11.6
Microfinance Bank 2.7 2.9 2.3 Microfinance Bank 9.0 2.7 10.4 5.2
Savings & Loan Association
(eg. AFPSLAI)1.5 1.9 1.0 Paluwagan 4.1 7.4 3.4 1.9
Paluwagan 0.7 0.4 1.1 Savings & Loan Association (eg. AFPSLAI)3.6 3.7 3.6 1.6
Association
(eg. Teachers' associations)0.4 0.4 0.3 Others 1.8 1.0 2.0 1.2
Others 0.2 0.1 0.3 Association (eg. Teachers'
associations)0.8 0.3 0.9 1.1
Don't know 0.1 - 0.2 0.2
Reason for Choosing the
Bank/Institution where the
Biggest Account is Maintained
Reason for Choosing the
Bank/Institution where the
Biggest Account is Maintained
Proximity to home 34.4 39.2 27.7 Proximity to home 29.2 36.1 27.7 23.4
Efficient service 8.1 6.9 9.9 Efficient service 24.7 22.6 25.2 18.9
No particular reason 4.2 3.3 5.6 No particular reason 8.5 4.1 9.5 15.5
It is a major bank 2.8 2.1 3.8 It is a major bank 6.7 11.2 5.7 8.7
Personal acquaintances 5.2 3.7 7.4 Personal acquaintances 5.1 1.5 5.9 5.3
Proximity to workplace 6.8 7.6 5.7 Proximity to workplace 4.7 5.6 4.5 5.3
Attractive charges for services 2.0 1.2 3.0 Attractive charges for services 3.0 1.4 3.4 1.8
Hight interest rates 2.1 2.1 2.1 Hight interest rates 1.9 2.4 1.8 2.3
Internet banking services 0.4 0.4 0.3 Internet banking services 0.5 0.6 0.5 0.4
The bank used by employer/or
my business19.3 21.5 16.3 Don't know/Don't remember 1.0 0.3 1.1 2.3
Bank specified/selected by the
source institution of fund8.4 6.7 10.7 Others 14.8 14.2 14.9 16.2
Variety of services,
products,instruments offered4.0 3.9 4.3
Already has another
account/loan with bank1.3 0.7 2.1
Courteousness of the staff 0.6 0.4 1.0
Others 0.3 0.4 0.1
In Percent
In PercentIn Percent
In Percent
In PercentIn Percent
In Percent
In Percent
Page 51
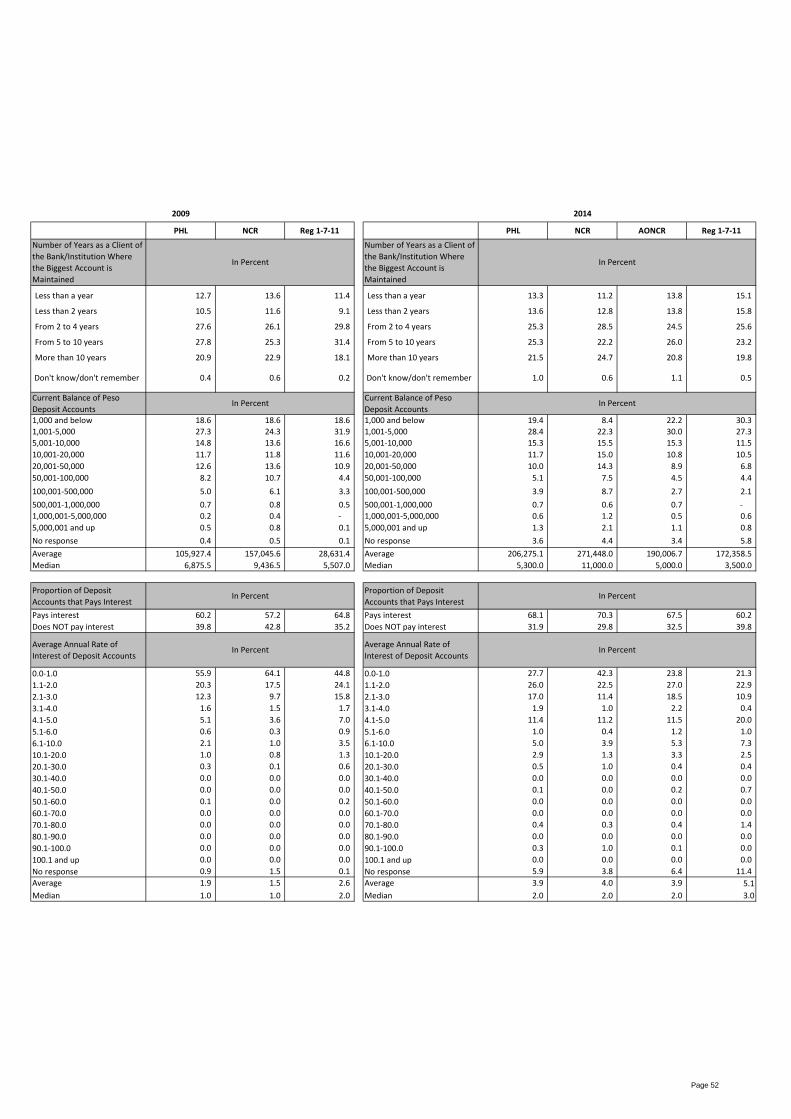
2009 2014
PHL NCR Reg 1-7-11 PHL NCR AONCR Reg 1-7-11
Number of Years as a Client of
the Bank/Institution Where
the Biggest Account is
Maintained
Number of Years as a Client of
the Bank/Institution Where
the Biggest Account is
Maintained
Less than a year 12.7 13.6 11.4 Less than a year 13.3 11.2 13.8 15.1
Less than 2 years 10.5 11.6 9.1 Less than 2 years 13.6 12.8 13.8 15.8
From 2 to 4 years 27.6 26.1 29.8 From 2 to 4 years 25.3 28.5 24.5 25.6
From 5 to 10 years 27.8 25.3 31.4 From 5 to 10 years 25.3 22.2 26.0 23.2
More than 10 years 20.9 22.9 18.1 More than 10 years 21.5 24.7 20.8 19.8
Don't know/don't remember 0.4 0.6 0.2 Don't know/don't remember 1.0 0.6 1.1 0.5
Current Balance of Peso
Deposit Accounts
Current Balance of Peso
Deposit Accounts
1,000 and below 18.6 18.6 18.6 1,000 and below 19.4 8.4 22.2 30.3
1,001-5,000 27.3 24.3 31.9 1,001-5,000 28.4 22.3 30.0 27.3
5,001-10,000 14.8 13.6 16.6 5,001-10,000 15.3 15.5 15.3 11.5
10,001-20,000 11.7 11.8 11.6 10,001-20,000 11.7 15.0 10.8 10.5
20,001-50,000 12.6 13.6 10.9 20,001-50,000 10.0 14.3 8.9 6.8
50,001-100,000 8.2 10.7 4.4 50,001-100,000 5.1 7.5 4.5 4.4
100,001-500,000 5.0 6.1 3.3 100,001-500,000 3.9 8.7 2.7 2.1
500,001-1,000,000 0.7 0.8 0.5 500,001-1,000,000 0.7 0.6 0.7 -
1,000,001-5,000,000 0.2 0.4 - 1,000,001-5,000,000 0.6 1.2 0.5 0.6
5,000,001 and up 0.5 0.8 0.1 5,000,001 and up 1.3 2.1 1.1 0.8
No response 0.4 0.5 0.1 No response 3.6 4.4 3.4 5.8
Average 105,927.4 157,045.6 28,631.4 Average 206,275.1 271,448.0 190,006.7 172,358.5
Median 6,875.5 9,436.5 5,507.0 Median 5,300.0 11,000.0 5,000.0 3,500.0
Proportion of Deposit
Accounts that Pays Interest
Proportion of Deposit
Accounts that Pays Interest
Pays interest 60.2 57.2 64.8 Pays interest 68.1 70.3 67.5 60.2
Does NOT pay interest 39.8 42.8 35.2 Does NOT pay interest 31.9 29.8 32.5 39.8
Average Annual Rate of
Interest of Deposit Accounts
Average Annual Rate of
Interest of Deposit Accounts
0.0-1.0 55.9 64.1 44.8 0.0-1.0 27.7 42.3 23.8 21.3
1.1-2.0 20.3 17.5 24.1 1.1-2.0 26.0 22.5 27.0 22.9
2.1-3.0 12.3 9.7 15.8 2.1-3.0 17.0 11.4 18.5 10.9
3.1-4.0 1.6 1.5 1.7 3.1-4.0 1.9 1.0 2.2 0.4
4.1-5.0 5.1 3.6 7.0 4.1-5.0 11.4 11.2 11.5 20.0
5.1-6.0 0.6 0.3 0.9 5.1-6.0 1.0 0.4 1.2 1.0
6.1-10.0 2.1 1.0 3.5 6.1-10.0 5.0 3.9 5.3 7.3
10.1-20.0 1.0 0.8 1.3 10.1-20.0 2.9 1.3 3.3 2.5
20.1-30.0 0.3 0.1 0.6 20.1-30.0 0.5 1.0 0.4 0.4
30.1-40.0 0.0 0.0 0.0 30.1-40.0 0.0 0.0 0.0 0.0
40.1-50.0 0.0 0.0 0.0 40.1-50.0 0.1 0.0 0.2 0.7
50.1-60.0 0.1 0.0 0.2 50.1-60.0 0.0 0.0 0.0 0.0
60.1-70.0 0.0 0.0 0.0 60.1-70.0 0.0 0.0 0.0 0.0
70.1-80.0 0.0 0.0 0.0 70.1-80.0 0.4 0.3 0.4 1.4
80.1-90.0 0.0 0.0 0.0 80.1-90.0 0.0 0.0 0.0 0.0
90.1-100.0 0.0 0.0 0.0 90.1-100.0 0.3 1.0 0.1 0.0
100.1 and up 0.0 0.0 0.0 100.1 and up 0.0 0.0 0.0 0.0
No response 0.9 1.5 0.1 No response 5.9 3.8 6.4 11.4
Average 1.9 1.5 2.6 Average 3.9 4.0 3.9 5.1
Median 1.0 1.0 2.0 Median 2.0 2.0 2.0 3.0
In Percent
In Percent
In Percent
In Percent
In PercentIn Percent
In Percent
In Percent
Page 52
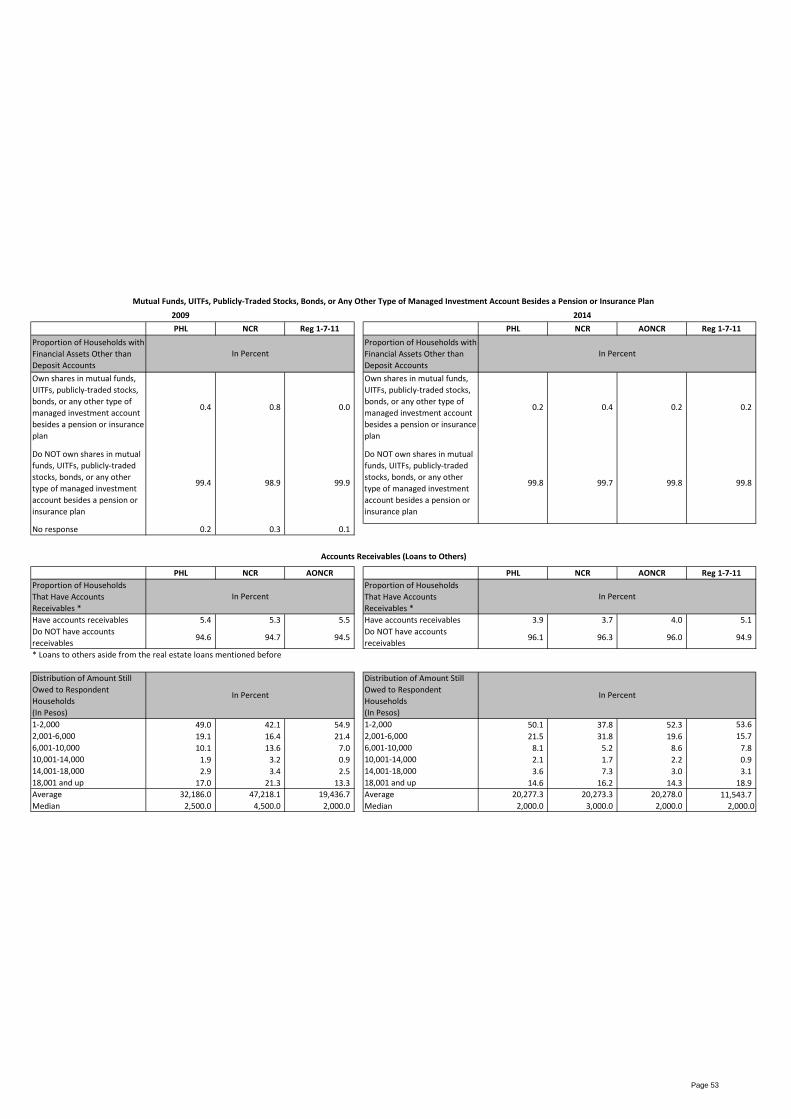
2009 2014
PHL NCR Reg 1-7-11 PHL NCR AONCR Reg 1-7-11
Proportion of Households with
Financial Assets Other than
Deposit Accounts
Proportion of Households with
Financial Assets Other than
Deposit Accounts
Own shares in mutual funds,
UITFs, publicly-traded stocks,
bonds, or any other type of
managed investment account
besides a pension or insurance
plan
0.4 0.8 0.0
Own shares in mutual funds,
UITFs, publicly-traded stocks,
bonds, or any other type of
managed investment account
besides a pension or insurance
plan
0.2 0.4 0.2 0.2
Do NOT own shares in mutual
funds, UITFs, publicly-traded
stocks, bonds, or any other
type of managed investment
account besides a pension or
insurance plan
99.4 98.9 99.9
Do NOT own shares in mutual
funds, UITFs, publicly-traded
stocks, bonds, or any other
type of managed investment
account besides a pension or
insurance plan
99.8 99.7 99.8 99.8
No response 0.2 0.3 0.1
PHL NCR AONCR PHL NCR AONCR Reg 1-7-11
Proportion of Households
That Have Accounts
Receivables *
Proportion of Households
That Have Accounts
Receivables *
Have accounts receivables 5.4 5.3 5.5 Have accounts receivables 3.9 3.7 4.0 5.1
Do NOT have accounts
receivables94.6 94.7 94.5
Do NOT have accounts
receivables96.1 96.3 96.0 94.9
* Loans to others aside from the real estate loans mentioned before
Distribution of Amount Still
Owed to Respondent
Households
(In Pesos)
Distribution of Amount Still
Owed to Respondent
Households
(In Pesos)
1-2,000 49.0 42.1 54.9 1-2,000 50.1 37.8 52.3 53.6
2,001-6,000 19.1 16.4 21.4 2,001-6,000 21.5 31.8 19.6 15.7
6,001-10,000 10.1 13.6 7.0 6,001-10,000 8.1 5.2 8.6 7.8
10,001-14,000 1.9 3.2 0.9 10,001-14,000 2.1 1.7 2.2 0.9
14,001-18,000 2.9 3.4 2.5 14,001-18,000 3.6 7.3 3.0 3.1
18,001 and up 17.0 21.3 13.3 18,001 and up 14.6 16.2 14.3 18.9
Average 32,186.0 47,218.1 19,436.7 Average 20,277.3 20,273.3 20,278.0 11,543.7
Median 2,500.0 4,500.0 2,000.0 Median 2,000.0 3,000.0 2,000.0 2,000.0
Accounts Receivables (Loans to Others)
Mutual Funds, UITFs, Publicly-Traded Stocks, Bonds, or Any Other Type of Managed Investment Account Besides a Pension or Insurance Plan
In Percent
In Percent
In Percent
In PercentIn Percent
In Percent
Page 53
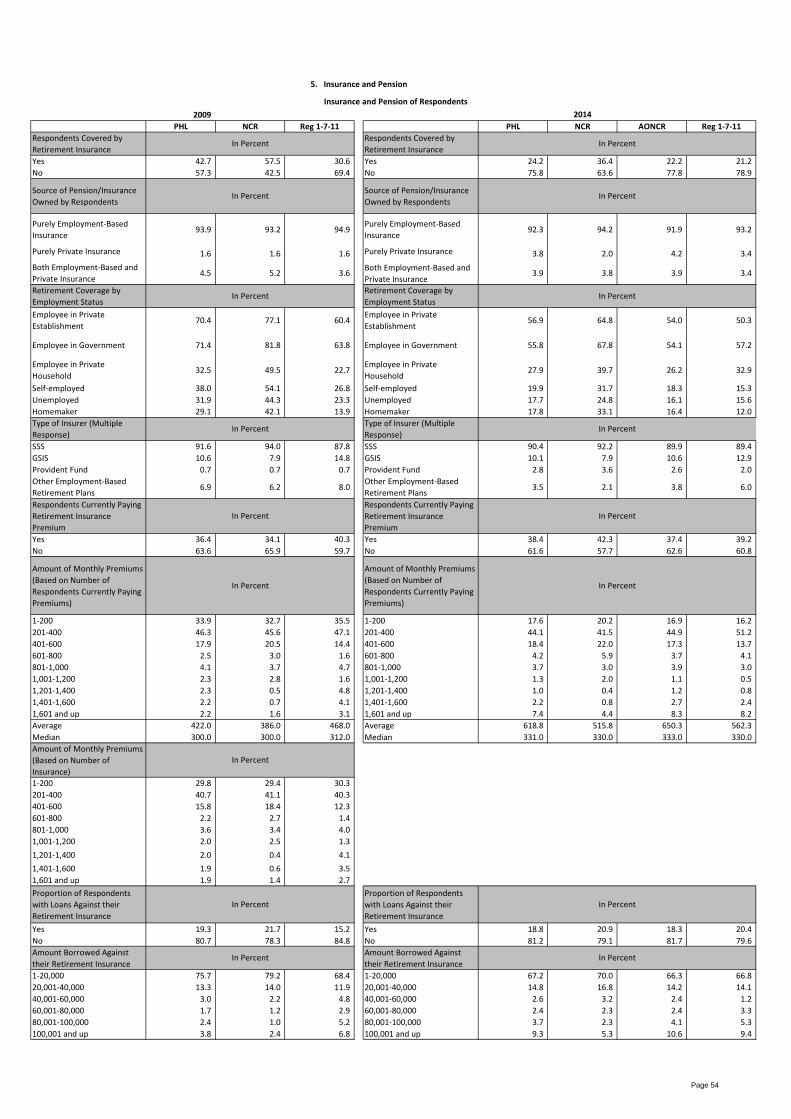
2009
PHL NCR Reg 1-7-11 PHL NCR AONCR Reg 1-7-11
Respondents Covered by
Retirement Insurance
Respondents Covered by
Retirement Insurance
Yes 42.7 57.5 30.6 Yes 24.2 36.4 22.2 21.2
No 57.3 42.5 69.4 No 75.8 63.6 77.8 78.9
Source of Pension/Insurance
Owned by Respondents
Source of Pension/Insurance
Owned by Respondents
Purely Employment-Based
Insurance93.9 93.2 94.9
Purely Employment-Based
Insurance92.3 94.2 91.9 93.2
Purely Private Insurance 1.6 1.6 1.6 Purely Private Insurance 3.8 2.0 4.2 3.4
Both Employment-Based and
Private Insurance4.5 5.2 3.6
Both Employment-Based and
Private Insurance3.9 3.8 3.9 3.4
Retirement Coverage by
Employment Status
Retirement Coverage by
Employment Status
Employee in Private
Establishment70.4 77.1 60.4
Employee in Private
Establishment56.9 64.8 54.0 50.3
Employee in Government 71.4 81.8 63.8 Employee in Government 55.8 67.8 54.1 57.2
Employee in Private
Household32.5 49.5 22.7
Employee in Private
Household27.9 39.7 26.2 32.9
Self-employed 38.0 54.1 26.8 Self-employed 19.9 31.7 18.3 15.3
Unemployed 31.9 44.3 23.3 Unemployed 17.7 24.8 16.1 15.6
Homemaker 29.1 42.1 13.9 Homemaker 17.8 33.1 16.4 12.0
Type of Insurer (Multiple
Response)
Type of Insurer (Multiple
Response)
SSS 91.6 94.0 87.8 SSS 90.4 92.2 89.9 89.4
GSIS 10.6 7.9 14.8 GSIS 10.1 7.9 10.6 12.9
Provident Fund 0.7 0.7 0.7 Provident Fund 2.8 3.6 2.6 2.0
Other Employment-Based
Retirement Plans6.9 6.2 8.0
Other Employment-Based
Retirement Plans3.5 2.1 3.8 6.0
Respondents Currently Paying
Retirement Insurance
Premium
Respondents Currently Paying
Retirement Insurance
Premium
Yes 36.4 34.1 40.3 Yes 38.4 42.3 37.4 39.2
No 63.6 65.9 59.7 No 61.6 57.7 62.6 60.8
Amount of Monthly Premiums
(Based on Number of
Respondents Currently Paying
Premiums)
Amount of Monthly Premiums
(Based on Number of
Respondents Currently Paying
Premiums)
1-200 33.9 32.7 35.5 1-200 17.6 20.2 16.9 16.2
201-400 46.3 45.6 47.1 201-400 44.1 41.5 44.9 51.2
401-600 17.9 20.5 14.4 401-600 18.4 22.0 17.3 13.7
601-800 2.5 3.0 1.6 601-800 4.2 5.9 3.7 4.1
801-1,000 4.1 3.7 4.7 801-1,000 3.7 3.0 3.9 3.0
1,001-1,200 2.3 2.8 1.6 1,001-1,200 1.3 2.0 1.1 0.5
1,201-1,400 2.3 0.5 4.8 1,201-1,400 1.0 0.4 1.2 0.8
1,401-1,600 2.2 0.7 4.1 1,401-1,600 2.2 0.8 2.7 2.4
1,601 and up 2.2 1.6 3.1 1,601 and up 7.4 4.4 8.3 8.2
Average 422.0 386.0 468.0 Average 618.8 515.8 650.3 562.3
Median 300.0 300.0 312.0 Median 331.0 330.0 333.0 330.0
Amount of Monthly Premiums
(Based on Number of
Insurance)
1-200 29.8 29.4 30.3
201-400 40.7 41.1 40.3
401-600 15.8 18.4 12.3
601-800 2.2 2.7 1.4
801-1,000 3.6 3.4 4.0
1,001-1,200 2.0 2.5 1.3
1,201-1,400 2.0 0.4 4.1
1,401-1,600 1.9 0.6 3.5
1,601 and up 1.9 1.4 2.7
Proportion of Respondents
with Loans Against their
Retirement Insurance
Proportion of Respondents
with Loans Against their
Retirement Insurance
Yes 19.3 21.7 15.2 Yes 18.8 20.9 18.3 20.4
No 80.7 78.3 84.8 No 81.2 79.1 81.7 79.6
Amount Borrowed Against
their Retirement Insurance
Amount Borrowed Against
their Retirement Insurance
1-20,000 75.7 79.2 68.4 1-20,000 67.2 70.0 66.3 66.8
20,001-40,000 13.3 14.0 11.9 20,001-40,000 14.8 16.8 14.2 14.1
40,001-60,000 3.0 2.2 4.8 40,001-60,000 2.6 3.2 2.4 1.2
60,001-80,000 1.7 1.2 2.9 60,001-80,000 2.4 2.3 2.4 3.3
80,001-100,000 2.4 1.0 5.2 80,001-100,000 3.7 2.3 4.1 5.3
100,001 and up 3.8 2.4 6.8 100,001 and up 9.3 5.3 10.6 9.4
2014
Insurance and Pension of Respondents
5. Insurance and Pension
In Percent
In Percent In Percent
In Percent In Percent
In Percent
In Percent
In Percent
In Percent
In Percent
In Percent
In Percent
In Percent
In Percent
In Percent
In Percent
In Percent
Page 54
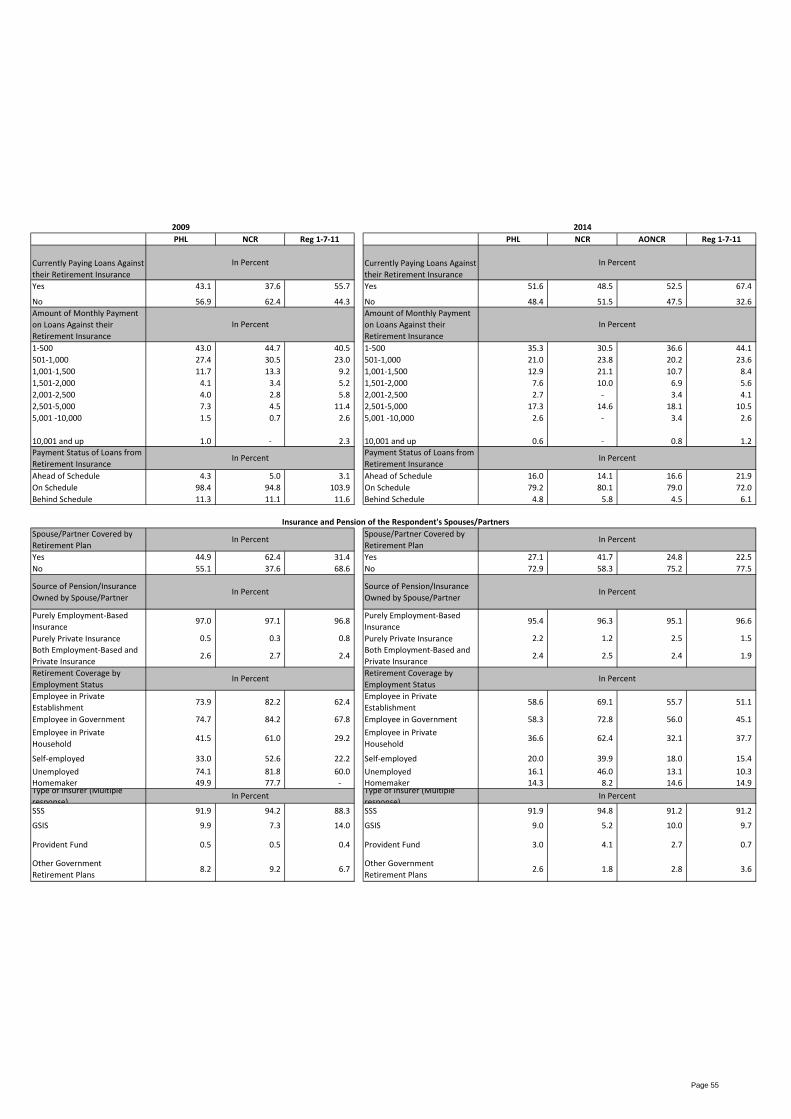
2009 2014
PHL NCR Reg 1-7-11 PHL NCR AONCR Reg 1-7-11
Currently Paying Loans Against
their Retirement Insurance
Currently Paying Loans Against
their Retirement Insurance
Yes 43.1 37.6 55.7 Yes 51.6 48.5 52.5 67.4
No 56.9 62.4 44.3 No 48.4 51.5 47.5 32.6
Amount of Monthly Payment
on Loans Against their
Retirement Insurance
Amount of Monthly Payment
on Loans Against their
Retirement Insurance
1-500 43.0 44.7 40.5 1-500 35.3 30.5 36.6 44.1
501-1,000 27.4 30.5 23.0 501-1,000 21.0 23.8 20.2 23.6
1,001-1,500 11.7 13.3 9.2 1,001-1,500 12.9 21.1 10.7 8.4
1,501-2,000 4.1 3.4 5.2 1,501-2,000 7.6 10.0 6.9 5.6
2,001-2,500 4.0 2.8 5.8 2,001-2,500 2.7 - 3.4 4.1
2,501-5,000 7.3 4.5 11.4 2,501-5,000 17.3 14.6 18.1 10.5
5,001 -10,000 1.5 0.7 2.6 5,001 -10,000 2.6 - 3.4 2.6
10,001 and up 1.0 - 2.3 10,001 and up 0.6 - 0.8 1.2
Payment Status of Loans from
Retirement Insurance
Payment Status of Loans from
Retirement Insurance
Ahead of Schedule 4.3 5.0 3.1 Ahead of Schedule 16.0 14.1 16.6 21.9
On Schedule 98.4 94.8 103.9 On Schedule 79.2 80.1 79.0 72.0
Behind Schedule 11.3 11.1 11.6 Behind Schedule 4.8 5.8 4.5 6.1
Spouse/Partner Covered by
Retirement Plan
Spouse/Partner Covered by
Retirement Plan
Yes 44.9 62.4 31.4 Yes 27.1 41.7 24.8 22.5
No 55.1 37.6 68.6 No 72.9 58.3 75.2 77.5
Source of Pension/Insurance
Owned by Spouse/Partner
Source of Pension/Insurance
Owned by Spouse/Partner
Purely Employment-Based
Insurance97.0 97.1 96.8
Purely Employment-Based
Insurance95.4 96.3 95.1 96.6
Purely Private Insurance 0.5 0.3 0.8 Purely Private Insurance 2.2 1.2 2.5 1.5
Both Employment-Based and
Private Insurance2.6 2.7 2.4
Both Employment-Based and
Private Insurance2.4 2.5 2.4 1.9
Retirement Coverage by
Employment Status
Retirement Coverage by
Employment Status
Employee in Private
Establishment73.9 82.2 62.4
Employee in Private
Establishment58.6 69.1 55.7 51.1
Employee in Government 74.7 84.2 67.8 Employee in Government 58.3 72.8 56.0 45.1
Employee in Private
Household41.5 61.0 29.2
Employee in Private
Household36.6 62.4 32.1 37.7
Self-employed 33.0 52.6 22.2 Self-employed 20.0 39.9 18.0 15.4
Unemployed 74.1 81.8 60.0 Unemployed 16.1 46.0 13.1 10.3
Homemaker 49.9 77.7 - Homemaker 14.3 8.2 14.6 14.9 Type of Insurer (Multiple
response)
Type of Insurer (Multiple
response)SSS 91.9 94.2 88.3 SSS 91.9 94.8 91.2 91.2
GSIS 9.9 7.3 14.0 GSIS 9.0 5.2 10.0 9.7
Provident Fund 0.5 0.5 0.4 Provident Fund 3.0 4.1 2.7 0.7
Other Government
Retirement Plans8.2 9.2 6.7
Other Government
Retirement Plans2.6 1.8 2.8 3.6
In Percent
In Percent In Percent
Insurance and Pension of the Respondent's Spouses/Partners
In Percent
In Percent
In Percent
In Percent
In Percent
In Percent
In Percent
In Percent
In Percent
In Percent
In Percent
Page 55
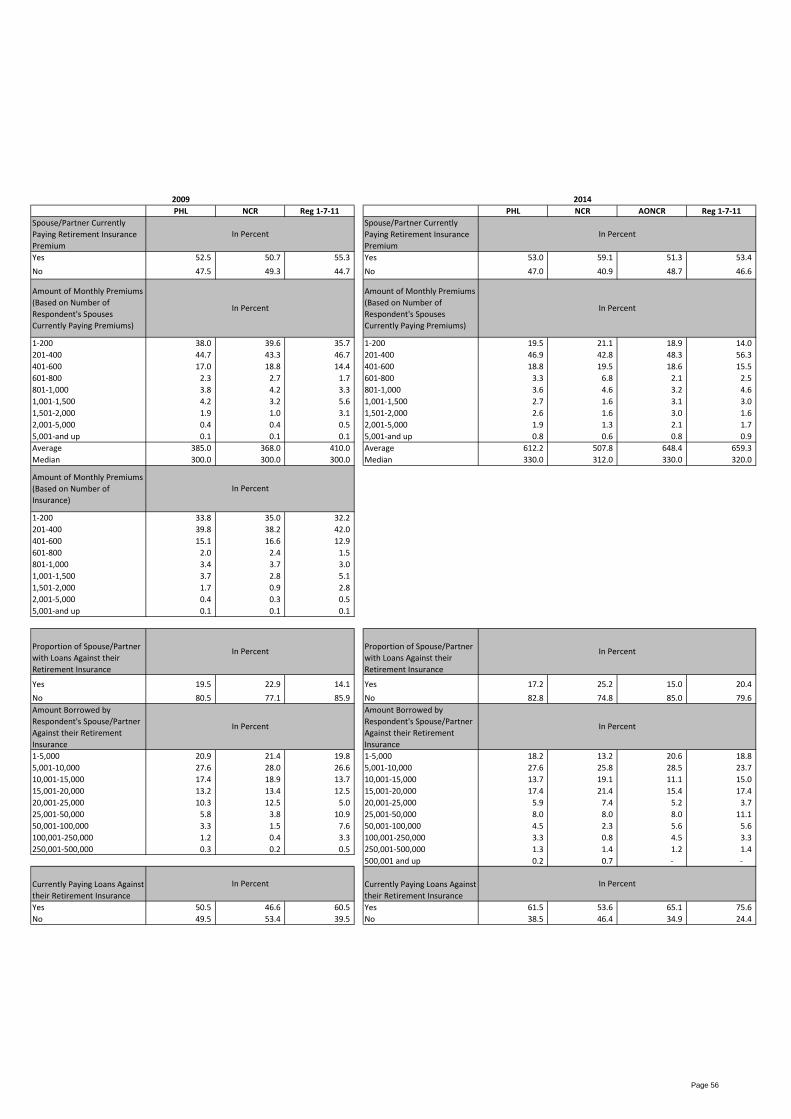
2009 2014
PHL NCR Reg 1-7-11 PHL NCR AONCR Reg 1-7-11
Spouse/Partner Currently
Paying Retirement Insurance
Premium
Spouse/Partner Currently
Paying Retirement Insurance
Premium
Yes 52.5 50.7 55.3 Yes 53.0 59.1 51.3 53.4
No 47.5 49.3 44.7 No 47.0 40.9 48.7 46.6
Amount of Monthly Premiums
(Based on Number of
Respondent's Spouses
Currently Paying Premiums)
Amount of Monthly Premiums
(Based on Number of
Respondent's Spouses
Currently Paying Premiums)
1-200 38.0 39.6 35.7 1-200 19.5 21.1 18.9 14.0
201-400 44.7 43.3 46.7 201-400 46.9 42.8 48.3 56.3
401-600 17.0 18.8 14.4 401-600 18.8 19.5 18.6 15.5
601-800 2.3 2.7 1.7 601-800 3.3 6.8 2.1 2.5
801-1,000 3.8 4.2 3.3 801-1,000 3.6 4.6 3.2 4.6
1,001-1,500 4.2 3.2 5.6 1,001-1,500 2.7 1.6 3.1 3.0
1,501-2,000 1.9 1.0 3.1 1,501-2,000 2.6 1.6 3.0 1.6
2,001-5,000 0.4 0.4 0.5 2,001-5,000 1.9 1.3 2.1 1.7
5,001-and up 0.1 0.1 0.1 5,001-and up 0.8 0.6 0.8 0.9
Average 385.0 368.0 410.0 Average 612.2 507.8 648.4 659.3
Median 300.0 300.0 300.0 Median 330.0 312.0 330.0 320.0
Amount of Monthly Premiums
(Based on Number of
Insurance)
1-200 33.8 35.0 32.2
201-400 39.8 38.2 42.0
401-600 15.1 16.6 12.9
601-800 2.0 2.4 1.5
801-1,000 3.4 3.7 3.0
1,001-1,500 3.7 2.8 5.1
1,501-2,000 1.7 0.9 2.8
2,001-5,000 0.4 0.3 0.5
5,001-and up 0.1 0.1 0.1
Proportion of Spouse/Partner
with Loans Against their
Retirement Insurance
Proportion of Spouse/Partner
with Loans Against their
Retirement Insurance
Yes 19.5 22.9 14.1 Yes 17.2 25.2 15.0 20.4
No 80.5 77.1 85.9 No 82.8 74.8 85.0 79.6
Amount Borrowed by
Respondent's Spouse/Partner
Against their Retirement
Insurance
Amount Borrowed by
Respondent's Spouse/Partner
Against their Retirement
Insurance
1-5,000 20.9 21.4 19.8 1-5,000 18.2 13.2 20.6 18.8
5,001-10,000 27.6 28.0 26.6 5,001-10,000 27.6 25.8 28.5 23.7
10,001-15,000 17.4 18.9 13.7 10,001-15,000 13.7 19.1 11.1 15.0
15,001-20,000 13.2 13.4 12.5 15,001-20,000 17.4 21.4 15.4 17.4
20,001-25,000 10.3 12.5 5.0 20,001-25,000 5.9 7.4 5.2 3.7
25,001-50,000 5.8 3.8 10.9 25,001-50,000 8.0 8.0 8.0 11.1
50,001-100,000 3.3 1.5 7.6 50,001-100,000 4.5 2.3 5.6 5.6
100,001-250,000 1.2 0.4 3.3 100,001-250,000 3.3 0.8 4.5 3.3
250,001-500,000 0.3 0.2 0.5 250,001-500,000 1.3 1.4 1.2 1.4
500,001 and up 0.2 0.7 - -
Currently Paying Loans Against
their Retirement Insurance
Currently Paying Loans Against
their Retirement Insurance
Yes 50.5 46.6 60.5 Yes 61.5 53.6 65.1 75.6
No 49.5 53.4 39.5 No 38.5 46.4 34.9 24.4
In Percent
In Percent
In Percent
In Percent
In Percent
In Percent In Percent
In Percent
In Percent
In Percent
In Percent
Page 56
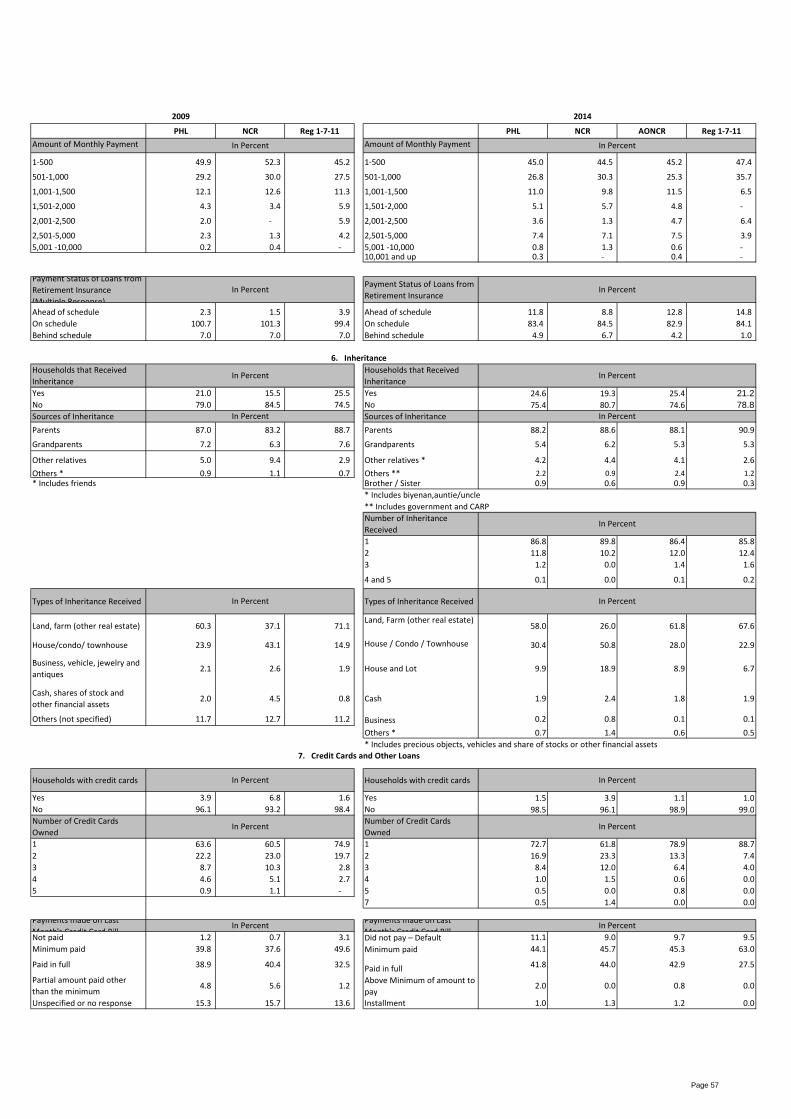
2009 2014
PHL NCR Reg 1-7-11 PHL NCR AONCR Reg 1-7-11
Amount of Monthly Payment
of on Loans Against their
Amount of Monthly Payment
of on Loans Against their 1-500 49.9 52.3 45.2 1-500 45.0 44.5 45.2 47.4
501-1,000 29.2 30.0 27.5 501-1,000 26.8 30.3 25.3 35.7
1,001-1,500 12.1 12.6 11.3 1,001-1,500 11.0 9.8 11.5 6.5
1,501-2,000 4.3 3.4 5.9 1,501-2,000 5.1 5.7 4.8 -
2,001-2,500 2.0 - 5.9 2,001-2,500 3.6 1.3 4.7 6.4
2,501-5,000 2.3 1.3 4.2 2,501-5,000 7.4 7.1 7.5 3.9
5,001 -10,000 0.2 0.4 - 5,001 -10,000 0.8 1.3 0.6 - 10,001 and up 0.3 - 0.4 -
Payment Status of Loans from
Retirement Insurance
(Multiple Response)
Payment Status of Loans from
Retirement Insurance
Ahead of schedule 2.3 1.5 3.9 Ahead of schedule 11.8 8.8 12.8 14.8
On schedule 100.7 101.3 99.4 On schedule 83.4 84.5 82.9 84.1
Behind schedule 7.0 7.0 7.0 Behind schedule 4.9 6.7 4.2 1.0
Households that Received
Inheritance
Households that Received
Inheritance
Yes 21.0 15.5 25.5 Yes 24.6 19.3 25.4 21.2No 79.0 84.5 74.5 No 75.4 80.7 74.6 78.8Sources of Inheritance Sources of Inheritance
Parents 87.0 83.2 88.7 Parents 88.2 88.6 88.1 90.9
Grandparents 7.2 6.3 7.6 Grandparents 5.4 6.2 5.3 5.3
Other relatives 5.0 9.4 2.9 Other relatives * 4.2 4.4 4.1 2.6
Others * 0.9 1.1 0.7 Others ** 2.2 0.9 2.4 1.2
* Includes friends Brother / Sister 0.9 0.6 0.9 0.3
* Includes biyenan,auntie/uncle
** Includes government and CARP
Number of Inheritance
Received
1 86.8 89.8 86.4 85.8
2 11.8 10.2 12.0 12.4
3 1.2 0.0 1.4 1.6
4 and 5 0.1 0.0 0.1 0.2
Types of Inheritance Received Types of Inheritance Received
Land, farm (other real estate) 60.3 37.1 71.1 Land, Farm (other real estate)
58.0 26.0 61.8 67.6
House/condo/ townhouse 23.9 43.1 14.9 House / Condo / Townhouse 30.4 50.8 28.0 22.9
Business, vehicle, jewelry and
antiques2.1 2.6 1.9 House and Lot 9.9 18.9 8.9 6.7
Cash, shares of stock and
other financial assets2.0 4.5 0.8 Cash 1.9 2.4 1.8 1.9
Others (not specified) 11.7 12.7 11.2 Business 0.2 0.8 0.1 0.1
Others * 0.7 1.4 0.6 0.5
* Includes precious objects, vehicles and share of stocks or other financial assets
Households with credit cards Households with credit cards
Yes 3.9 6.8 1.6 Yes 1.5 3.9 1.1 1.0
No 96.1 93.2 98.4 No 98.5 96.1 98.9 99.0
Number of Credit Cards
Owned
Number of Credit Cards
Owned
1 63.6 60.5 74.9 1 72.7 61.8 78.9 88.7
2 22.2 23.0 19.7 2 16.9 23.3 13.3 7.4
3 8.7 10.3 2.8 3 8.4 12.0 6.4 4.0
4 4.6 5.1 2.7 4 1.0 1.5 0.6 0.0
5 0.9 1.1 - 5 0.5 0.0 0.8 0.0
7 0.5 1.4 0.0 0.0
Payments made on Last
Month's Credit Card Bill
Payments made on Last
Month's Credit Card BillNot paid 1.2 0.7 3.1 Did not pay – Default 11.1 9.0 9.7 9.5
Minimum paid 39.8 37.6 49.6 Minimum paid 44.1 45.7 45.3 63.0
Paid in full 38.9 40.4 32.5 Paid in full
41.8 44.0 42.9 27.5
Partial amount paid other
than the minimum4.8 5.6 1.2
Above Minimum of amount to
pay2.0 0.0 0.8 0.0
Unspecified or no response 15.3 15.7 13.6 Installment 1.0 1.3 1.2 0.0
In Percent
In Percent In Percent
In Percent
In Percent
In Percent
In Percent
In Percent
In Percent
In Percent
In Percent
In Percent
In Percent
In Percent
In Percent
6. Inheritance
In Percent
In Percent
7. Credit Cards and Other Loans
Page 57
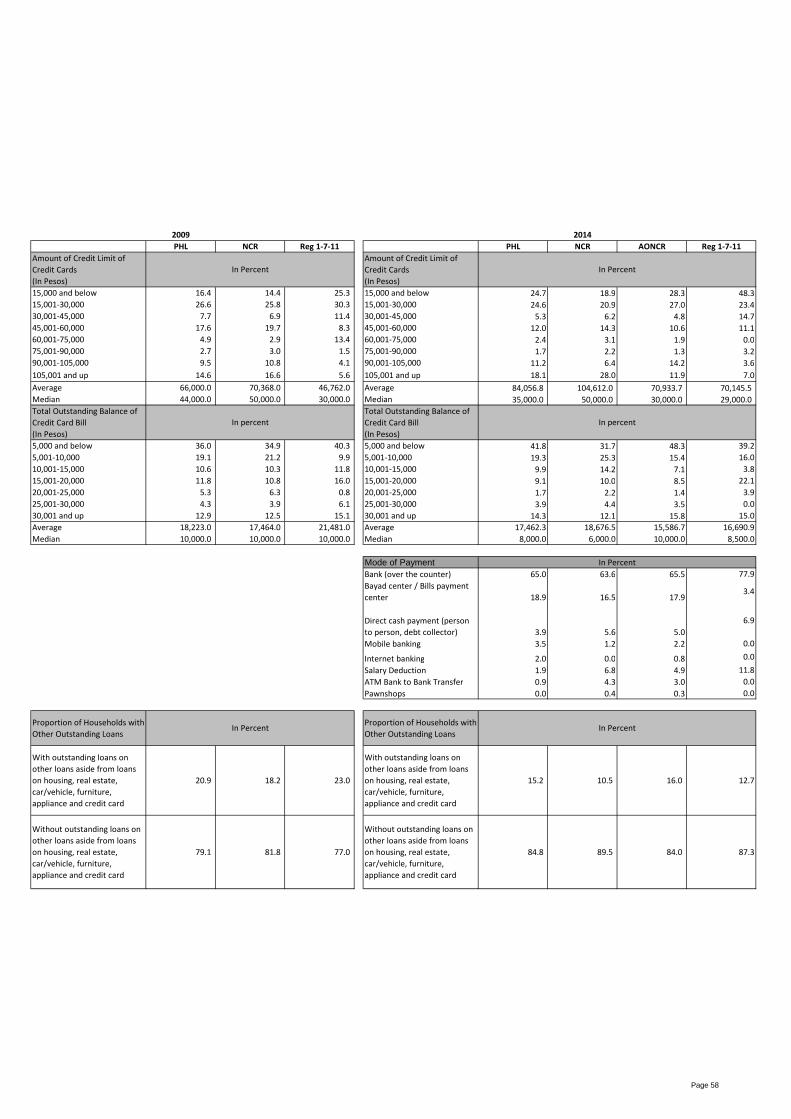
2009 2014
PHL NCR Reg 1-7-11 PHL NCR AONCR Reg 1-7-11
Amount of Credit Limit of
Credit Cards
(In Pesos)
Amount of Credit Limit of
Credit Cards
(In Pesos)
15,000 and below 16.4 14.4 25.3 15,000 and below 24.7 18.9 28.3 48.3
15,001-30,000 26.6 25.8 30.3 15,001-30,000 24.6 20.9 27.0 23.4
30,001-45,000 7.7 6.9 11.4 30,001-45,000 5.3 6.2 4.8 14.7
45,001-60,000 17.6 19.7 8.3 45,001-60,000 12.0 14.3 10.6 11.1
60,001-75,000 4.9 2.9 13.4 60,001-75,000 2.4 3.1 1.9 0.0
75,001-90,000 2.7 3.0 1.5 75,001-90,000 1.7 2.2 1.3 3.2
90,001-105,000 9.5 10.8 4.1 90,001-105,000 11.2 6.4 14.2 3.6
105,001 and up 14.6 16.6 5.6 105,001 and up 18.1 28.0 11.9 7.0
Average 66,000.0 70,368.0 46,762.0 Average 84,056.8 104,612.0 70,933.7 70,145.5
Median 44,000.0 50,000.0 30,000.0 Median 35,000.0 50,000.0 30,000.0 29,000.0
Total Outstanding Balance of
Credit Card Bill
(In Pesos)
Total Outstanding Balance of
Credit Card Bill
(In Pesos)
5,000 and below 36.0 34.9 40.3 5,000 and below 41.8 31.7 48.3 39.2
5,001-10,000 19.1 21.2 9.9 5,001-10,000 19.3 25.3 15.4 16.0
10,001-15,000 10.6 10.3 11.8 10,001-15,000 9.9 14.2 7.1 3.8
15,001-20,000 11.8 10.8 16.0 15,001-20,000 9.1 10.0 8.5 22.1
20,001-25,000 5.3 6.3 0.8 20,001-25,000 1.7 2.2 1.4 3.9
25,001-30,000 4.3 3.9 6.1 25,001-30,000 3.9 4.4 3.5 0.0
30,001 and up 12.9 12.5 15.1 30,001 and up 14.3 12.1 15.8 15.0
Average 18,223.0 17,464.0 21,481.0 Average 17,462.3 18,676.5 15,586.7 16,690.9
Median 10,000.0 10,000.0 10,000.0 Median 8,000.0 6,000.0 10,000.0 8,500.0
Mode of PaymentBank (over the counter) 65.0 63.6 65.5 77.9
Bayad center / Bills payment
center 18.9 16.5 17.93.4
Direct cash payment (person
to person, debt collector) 3.9 5.6 5.0
6.9
Mobile banking 3.5 1.2 2.2 0.0
Internet banking 2.0 0.0 0.8 0.0
Salary Deduction 1.9 6.8 4.9 11.8
ATM Bank to Bank Transfer 0.9 4.3 3.0 0.0
Pawnshops 0.0 0.4 0.3 0.0
Proportion of Households with
Other Outstanding Loans
Proportion of Households with
Other Outstanding Loans
With outstanding loans on
other loans aside from loans
on housing, real estate,
car/vehicle, furniture,
appliance and credit card
20.9 18.2 23.0
With outstanding loans on
other loans aside from loans
on housing, real estate,
car/vehicle, furniture,
appliance and credit card
15.2 10.5 16.0 12.7
Without outstanding loans on
other loans aside from loans
on housing, real estate,
car/vehicle, furniture,
appliance and credit card
79.1 81.8 77.0
Without outstanding loans on
other loans aside from loans
on housing, real estate,
car/vehicle, furniture,
appliance and credit card
84.8 89.5 84.0 87.3
In Percent
In percentIn percent
In Percent
In Percent In Percent
In Percent
Page 58
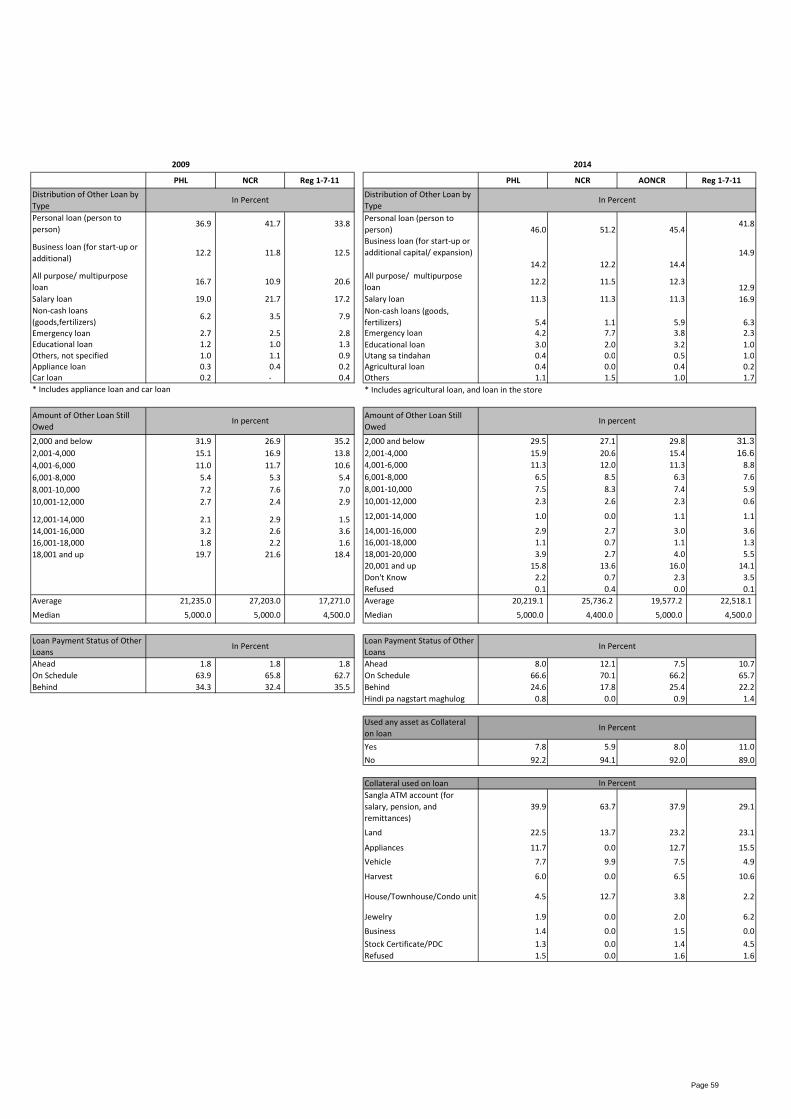
2009 2014
PHL NCR Reg 1-7-11 PHL NCR AONCR Reg 1-7-11
Distribution of Other Loan by
Type
Distribution of Other Loan by
Type
Personal loan (person to
person)36.9 41.7 33.8
Personal loan (person to
person) 46.0 51.2 45.441.8
Business loan (for start-up or
additional)12.2 11.8 12.5
Business loan (for start-up or
additional capital/ expansion)
14.2 12.2 14.4
14.9
All purpose/ multipurpose
loan16.7 10.9 20.6
All purpose/ multipurpose
loan12.2 11.5 12.3
12.9
Salary loan 19.0 21.7 17.2 Salary loan 11.3 11.3 11.3 16.9
Non-cash loans
(goods,fertilizers)6.2 3.5 7.9
Non-cash loans (goods,
fertilizers) 5.4 1.1 5.9 6.3
Emergency loan 2.7 2.5 2.8 Emergency loan 4.2 7.7 3.8 2.3
Educational loan 1.2 1.0 1.3 Educational loan 3.0 2.0 3.2 1.0
Others, not specified 1.0 1.1 0.9 Utang sa tindahan 0.4 0.0 0.5 1.0
Appliance loan 0.3 0.4 0.2 Agricultural loan 0.4 0.0 0.4 0.2
Car loan 0.2 - 0.4 Others 1.1 1.5 1.0 1.7
* Includes appliance loan and car loan * Includes agricultural loan, and loan in the store
Amount of Other Loan Still
Owed
Amount of Other Loan Still
Owed
2,000 and below 31.9 26.9 35.2 2,000 and below 29.5 27.1 29.8 31.32,001-4,000 15.1 16.9 13.8 2,001-4,000 15.9 20.6 15.4 16.64,001-6,000 11.0 11.7 10.6 4,001-6,000 11.3 12.0 11.3 8.8
6,001-8,000 5.4 5.3 5.4 6,001-8,000 6.5 8.5 6.3 7.6
8,001-10,000 7.2 7.6 7.0 8,001-10,000 7.5 8.3 7.4 5.9
10,001-12,000 2.7 2.4 2.9 10,001-12,000 2.3 2.6 2.3 0.6
12,001-14,000 2.1 2.9 1.5 12,001-14,000 1.0 0.0 1.1 1.1
14,001-16,000 3.2 2.6 3.6 14,001-16,000 2.9 2.7 3.0 3.6
16,001-18,000 1.8 2.2 1.6 16,001-18,000 1.1 0.7 1.1 1.3
18,001 and up 19.7 21.6 18.4 18,001-20,000 3.9 2.7 4.0 5.5
20,001 and up 15.8 13.6 16.0 14.1
Don't Know 2.2 0.7 2.3 3.5
Refused 0.1 0.4 0.0 0.1
Average 21,235.0 27,203.0 17,271.0 Average 20,219.1 25,736.2 19,577.2 22,518.1
Median 5,000.0 5,000.0 4,500.0 Median 5,000.0 4,400.0 5,000.0 4,500.0
Loan Payment Status of Other
Loans
Loan Payment Status of Other
Loans
Ahead 1.8 1.8 1.8 Ahead 8.0 12.1 7.5 10.7
On Schedule 63.9 65.8 62.7 On Schedule 66.6 70.1 66.2 65.7
Behind 34.3 32.4 35.5 Behind 24.6 17.8 25.4 22.2
Hindi pa nagstart maghulog 0.8 0.0 0.9 1.4
Used any asset as Collateral
on loan
Yes 7.8 5.9 8.0 11.0
No 92.2 94.1 92.0 89.0
Collateral used on loan
Sangla ATM account (for
salary, pension, and
remittances)
39.9 63.7 37.9 29.1
Land 22.5 13.7 23.2 23.1
Appliances 11.7 0.0 12.7 15.5
Vehicle 7.7 9.9 7.5 4.9
Harvest 6.0 0.0 6.5 10.6
House/Townhouse/Condo unit 4.5 12.7 3.8 2.2
Jewelry 1.9 0.0 2.0 6.2
Business 1.4 0.0 1.5 0.0
Stock Certificate/PDC 1.3 0.0 1.4 4.5
Refused 1.5 0.0 1.6 1.6
In percent
In Percent
In Percent In Percent
In percent
In Percent
In Percent
In Percent
Page 59
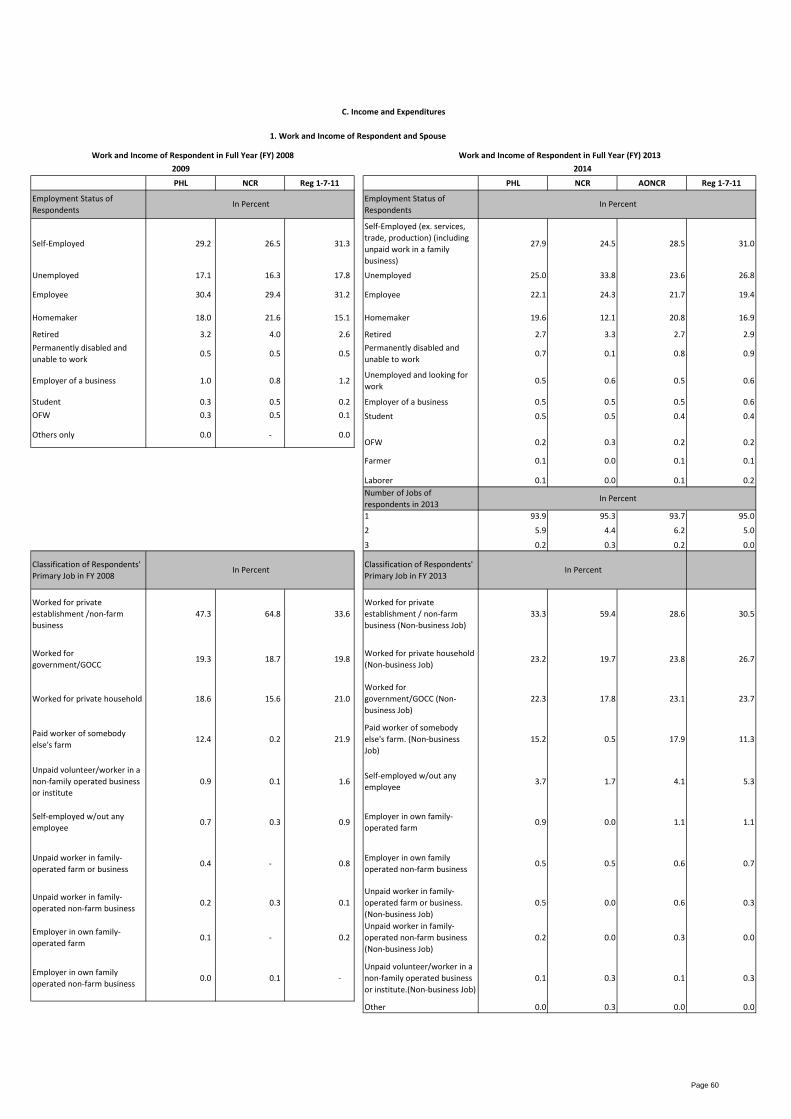
2009 2014
PHL NCR Reg 1-7-11 PHL NCR AONCR Reg 1-7-11
Employment Status of
Respondents
Employment Status of
Respondents
Self-Employed 29.2 26.5 31.3
Self-Employed (ex. services,
trade, production) (including
unpaid work in a family
business)
27.9 24.5 28.5 31.0
Unemployed 17.1 16.3 17.8 Unemployed 25.0 33.8 23.6 26.8
Employee 30.4 29.4 31.2 Employee 22.1 24.3 21.7 19.4
Homemaker 18.0 21.6 15.1 Homemaker 19.6 12.1 20.8 16.9
Retired 3.2 4.0 2.6 Retired 2.7 3.3 2.7 2.9
Permanently disabled and
unable to work0.5 0.5 0.5
Permanently disabled and
unable to work0.7 0.1 0.8 0.9
Employer of a business 1.0 0.8 1.2 Unemployed and looking for
work0.5 0.6 0.5 0.6
Student 0.3 0.5 0.2 Employer of a business 0.5 0.5 0.5 0.6
OFW 0.3 0.5 0.1 Student 0.5 0.5 0.4 0.4
Others only 0.0 - 0.0 OFW 0.2 0.3 0.2 0.2
Farmer 0.1 0.0 0.1 0.1
Laborer 0.1 0.0 0.1 0.2
Number of Jobs of
respondents in 2013
1 93.9 95.3 93.7 95.0
2 5.9 4.4 6.2 5.0
3 0.2 0.3 0.2 0.0
Classification of Respondents'
Primary Job in FY 2008
Classification of Respondents'
Primary Job in FY 2013
Worked for private
establishment /non-farm
business
47.3 64.8 33.6
Worked for private
establishment / non-farm
business (Non-business Job)
33.3 59.4 28.6 30.5
Worked for
government/GOCC19.3 18.7 19.8
Worked for private household
(Non-business Job)23.2 19.7 23.8 26.7
Worked for private household 18.6 15.6 21.0
Worked for
government/GOCC (Non-
business Job)
22.3 17.8 23.1 23.7
Paid worker of somebody
else's farm12.4 0.2 21.9
Paid worker of somebody
else's farm. (Non-business
Job)
15.2 0.5 17.9 11.3
Unpaid volunteer/worker in a
non-family operated business
or institute
0.9 0.1 1.6 Self-employed w/out any
employee3.7 1.7 4.1 5.3
Self-employed w/out any
employee0.7 0.3 0.9
Employer in own family-
operated farm0.9 0.0 1.1 1.1
Unpaid worker in family-
operated farm or business0.4 - 0.8
Employer in own family
operated non-farm business0.5 0.5 0.6 0.7
Unpaid worker in family-
operated non-farm business0.2 0.3 0.1
Unpaid worker in family-
operated farm or business.
(Non-business Job)
0.5 0.0 0.6 0.3
Employer in own family-
operated farm0.1 - 0.2
Unpaid worker in family-
operated non-farm business
(Non-business Job)
0.2 0.0 0.3 0.0
Employer in own family
operated non-farm business0.0 0.1 -
Unpaid volunteer/worker in a
non-family operated business
or institute.(Non-business Job)
0.1 0.3 0.1 0.3
Other 0.0 0.3 0.0 0.0
Work and Income of Respondent in Full Year (FY) 2013
C. Income and Expenditures
In Percent
In Percent
In Percent In Percent
In Percent
Work and Income of Respondent in Full Year (FY) 2008
1. Work and Income of Respondent and Spouse
Page 60
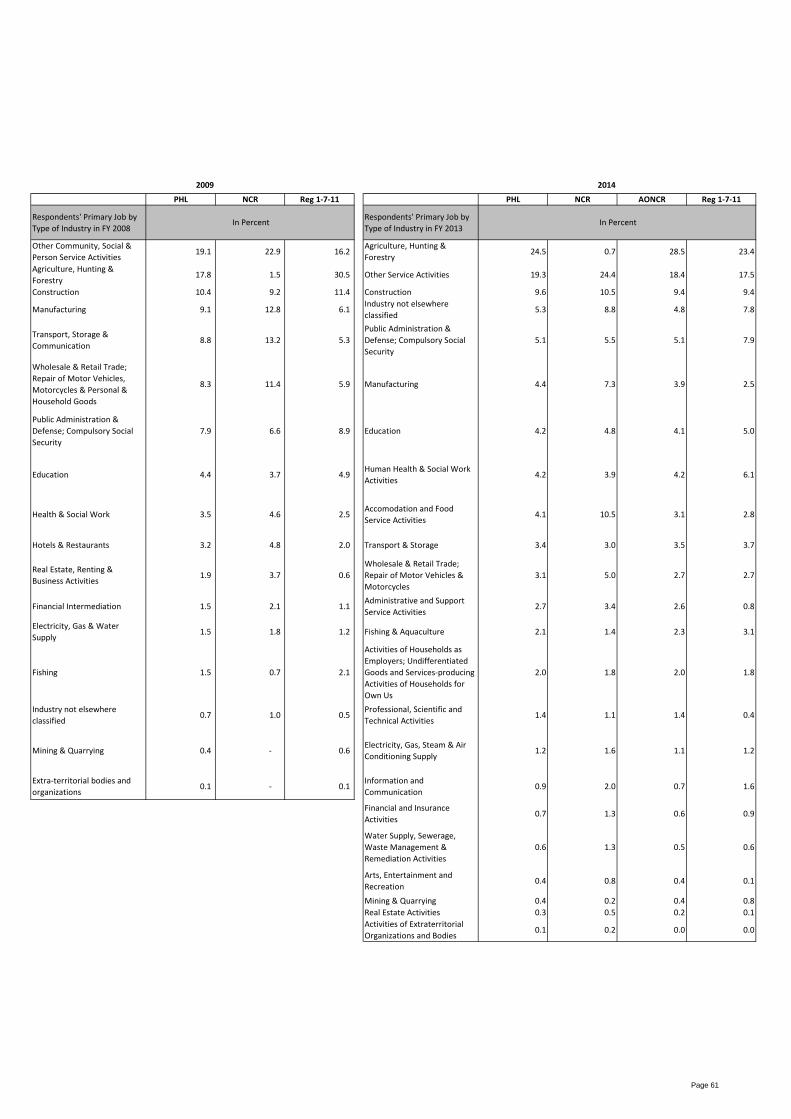
2009 2014
PHL NCR Reg 1-7-11 PHL NCR AONCR Reg 1-7-11
Respondents' Primary Job by
Type of Industry in FY 2008
Respondents' Primary Job by
Type of Industry in FY 2013
Other Community, Social &
Person Service Activities19.1 22.9 16.2
Agriculture, Hunting &
Forestry24.5 0.7 28.5 23.4
Agriculture, Hunting &
Forestry17.8 1.5 30.5 Other Service Activities 19.3 24.4 18.4 17.5
Construction 10.4 9.2 11.4 Construction 9.6 10.5 9.4 9.4
Manufacturing 9.1 12.8 6.1 Industry not elsewhere
classified5.3 8.8 4.8 7.8
Transport, Storage &
Communication8.8 13.2 5.3
Public Administration &
Defense; Compulsory Social
Security
5.1 5.5 5.1 7.9
Wholesale & Retail Trade;
Repair of Motor Vehicles,
Motorcycles & Personal &
Household Goods
8.3 11.4 5.9 Manufacturing 4.4 7.3 3.9 2.5
Public Administration &
Defense; Compulsory Social
Security
7.9 6.6 8.9 Education 4.2 4.8 4.1 5.0
Education 4.4 3.7 4.9 Human Health & Social Work
Activities4.2 3.9 4.2 6.1
Health & Social Work 3.5 4.6 2.5 Accomodation and Food
Service Activities4.1 10.5 3.1 2.8
Hotels & Restaurants 3.2 4.8 2.0 Transport & Storage 3.4 3.0 3.5 3.7
Real Estate, Renting &
Business Activities1.9 3.7 0.6
Wholesale & Retail Trade;
Repair of Motor Vehicles &
Motorcycles
3.1 5.0 2.7 2.7
Financial Intermediation 1.5 2.1 1.1 Administrative and Support
Service Activities2.7 3.4 2.6 0.8
Electricity, Gas & Water
Supply1.5 1.8 1.2 Fishing & Aquaculture 2.1 1.4 2.3 3.1
Fishing 1.5 0.7 2.1
Activities of Households as
Employers; Undifferentiated
Goods and Services-producing
Activities of Households for
Own Us
2.0 1.8 2.0 1.8
Industry not elsewhere
classified0.7 1.0 0.5
Professional, Scientific and
Technical Activities1.4 1.1 1.4 0.4
Mining & Quarrying 0.4 - 0.6 Electricity, Gas, Steam & Air
Conditioning Supply1.2 1.6 1.1 1.2
Extra-territorial bodies and
organizations0.1 - 0.1
Information and
Communication0.9 2.0 0.7 1.6
Financial and Insurance
Activities0.7 1.3 0.6 0.9
Water Supply, Sewerage,
Waste Management &
Remediation Activities
0.6 1.3 0.5 0.6
Arts, Entertainment and
Recreation0.4 0.8 0.4 0.1
Mining & Quarrying 0.4 0.2 0.4 0.8
Real Estate Activities 0.3 0.5 0.2 0.1
Activities of Extraterritorial
Organizations and Bodies0.1 0.2 0.0 0.0
In Percent In Percent
Page 61
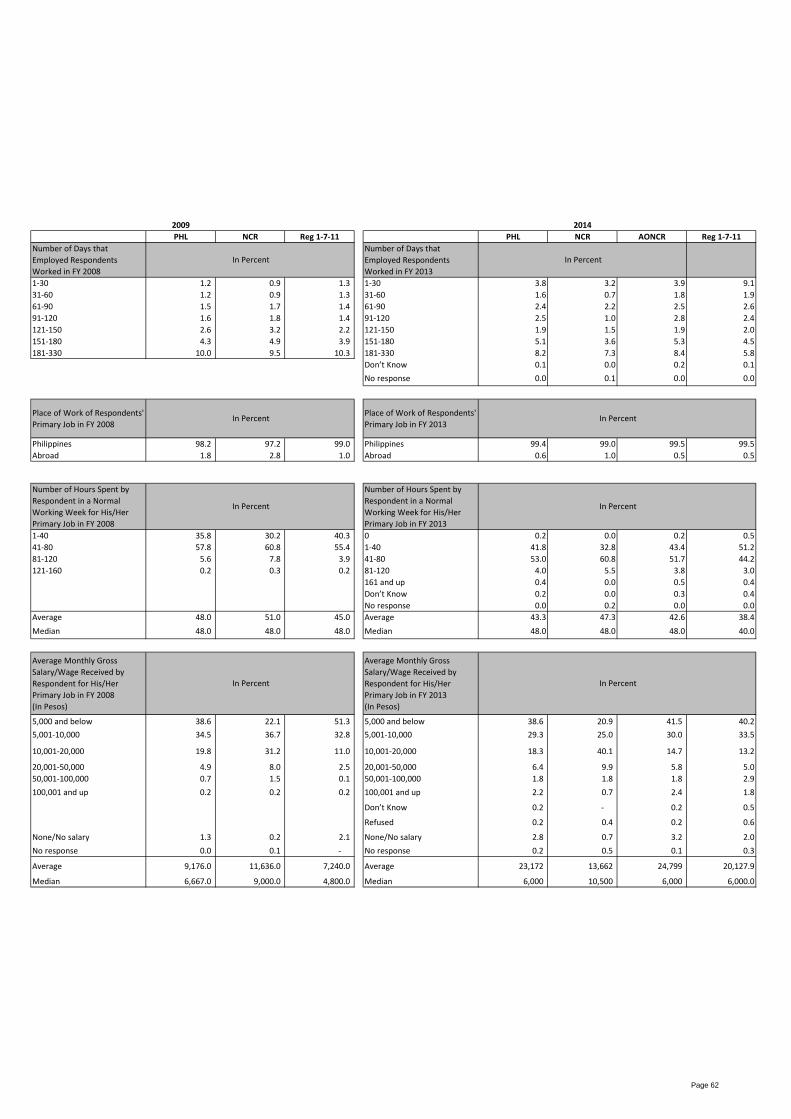
2009 2014
PHL NCR Reg 1-7-11 PHL NCR AONCR Reg 1-7-11
Number of Days that
Employed Respondents
Worked in FY 2008
Number of Days that
Employed Respondents
Worked in FY 2013
1-30 1.2 0.9 1.3 1-30 3.8 3.2 3.9 9.1
31-60 1.2 0.9 1.3 31-60 1.6 0.7 1.8 1.9
61-90 1.5 1.7 1.4 61-90 2.4 2.2 2.5 2.6
91-120 1.6 1.8 1.4 91-120 2.5 1.0 2.8 2.4
121-150 2.6 3.2 2.2 121-150 1.9 1.5 1.9 2.0
151-180 4.3 4.9 3.9 151-180 5.1 3.6 5.3 4.5
181-330 10.0 9.5 10.3 181-330 8.2 7.3 8.4 5.8
Don’t Know 0.1 0.0 0.2 0.1
No response 0.0 0.1 0.0 0.0
Place of Work of Respondents'
Primary Job in FY 2008
Place of Work of Respondents'
Primary Job in FY 2013
Philippines 98.2 97.2 99.0 Philippines 99.4 99.0 99.5 99.5
Abroad 1.8 2.8 1.0 Abroad 0.6 1.0 0.5 0.5
Number of Hours Spent by
Respondent in a Normal
Working Week for His/Her
Primary Job in FY 2008
Number of Hours Spent by
Respondent in a Normal
Working Week for His/Her
Primary Job in FY 2013
1-40 35.8 30.2 40.3 0 0.2 0.0 0.2 0.5
41-80 57.8 60.8 55.4 1-40 41.8 32.8 43.4 51.2
81-120 5.6 7.8 3.9 41-80 53.0 60.8 51.7 44.2
121-160 0.2 0.3 0.2 81-120 4.0 5.5 3.8 3.0
161 and up 0.4 0.0 0.5 0.4
Don’t Know 0.2 0.0 0.3 0.4
No response 0.0 0.2 0.0 0.0
Average 48.0 51.0 45.0 Average 43.3 47.3 42.6 38.4
Median 48.0 48.0 48.0 Median 48.0 48.0 48.0 40.0
Average Monthly Gross
Salary/Wage Received by
Respondent for His/Her
Primary Job in FY 2008
(In Pesos)
Average Monthly Gross
Salary/Wage Received by
Respondent for His/Her
Primary Job in FY 2013
(In Pesos)
5,000 and below 38.6 22.1 51.3 5,000 and below 38.6 20.9 41.5 40.2
5,001-10,000 34.5 36.7 32.8 5,001-10,000 29.3 25.0 30.0 33.5
10,001-20,000 19.8 31.2 11.0 10,001-20,000 18.3 40.1 14.7 13.2
20,001-50,000 4.9 8.0 2.5 20,001-50,000 6.4 9.9 5.8 5.0
50,001-100,000 0.7 1.5 0.1 50,001-100,000 1.8 1.8 1.8 2.9
100,001 and up 0.2 0.2 0.2 100,001 and up 2.2 0.7 2.4 1.8
Don’t Know 0.2 - 0.2 0.5
Refused 0.2 0.4 0.2 0.6
None/No salary 1.3 0.2 2.1 None/No salary 2.8 0.7 3.2 2.0
No response 0.0 0.1 - No response 0.2 0.5 0.1 0.3
Average 9,176.0 11,636.0 7,240.0 Average 23,172 13,662 24,799 20,127.9
Median 6,667.0 9,000.0 4,800.0 Median 6,000 10,500 6,000 6,000.0
In Percent
In Percent
In Percent In Percent
In Percent In Percent
In Percent
In Percent
Page 62
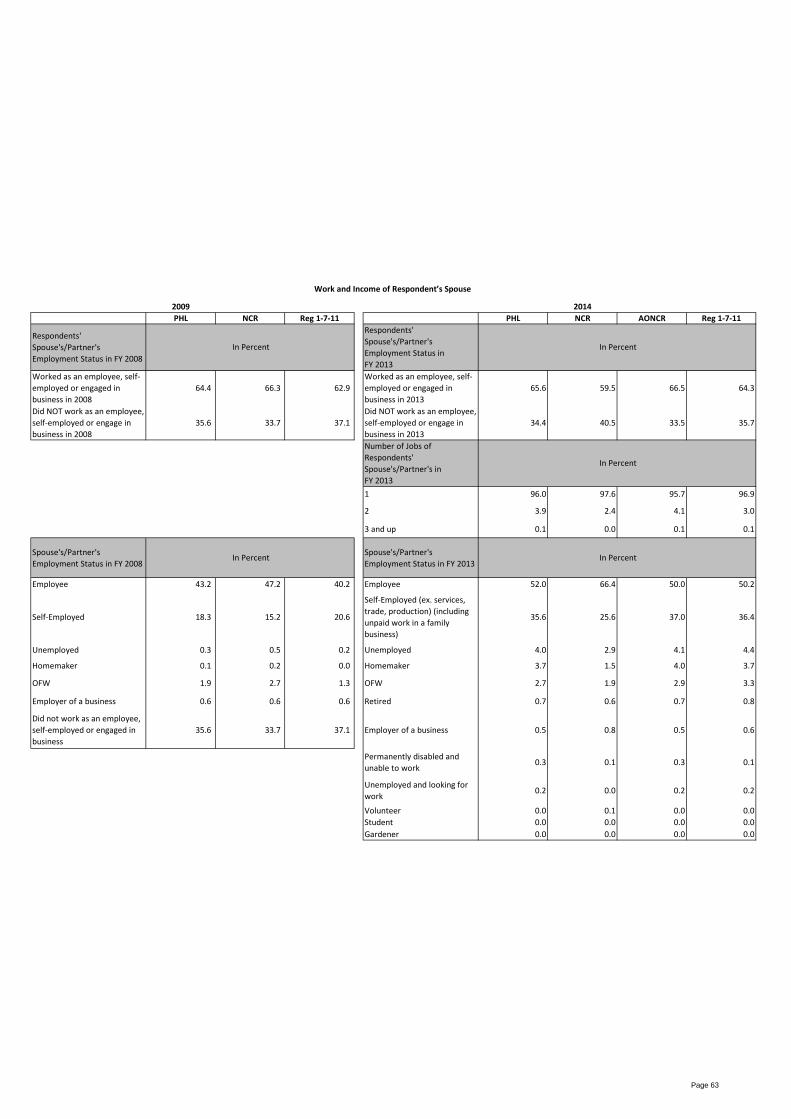
2009 2014
PHL NCR Reg 1-7-11 PHL NCR AONCR Reg 1-7-11
Respondents'
Spouse's/Partner's
Employment Status in FY 2008
Respondents'
Spouse's/Partner's
Employment Status in
FY 2013
Worked as an employee, self-
employed or engaged in
business in 2008
64.4 66.3 62.9
Worked as an employee, self-
employed or engaged in
business in 2013
65.6 59.5 66.5 64.3
Did NOT work as an employee,
self-employed or engage in
business in 2008
35.6 33.7 37.1
Did NOT work as an employee,
self-employed or engage in
business in 2013
34.4 40.5 33.5 35.7
Number of Jobs of
Respondents'
Spouse's/Partner's in
FY 2013
1 96.0 97.6 95.7 96.9
2 3.9 2.4 4.1 3.0
3 and up 0.1 0.0 0.1 0.1
Spouse's/Partner's
Employment Status in FY 2008
Spouse's/Partner's
Employment Status in FY 2013
Employee 43.2 47.2 40.2 Employee 52.0 66.4 50.0 50.2
Self-Employed 18.3 15.2 20.6
Self-Employed (ex. services,
trade, production) (including
unpaid work in a family
business)
35.6 25.6 37.0 36.4
Unemployed 0.3 0.5 0.2 Unemployed 4.0 2.9 4.1 4.4
Homemaker 0.1 0.2 0.0 Homemaker 3.7 1.5 4.0 3.7
OFW 1.9 2.7 1.3 OFW 2.7 1.9 2.9 3.3
Employer of a business 0.6 0.6 0.6 Retired 0.7 0.6 0.7 0.8
Did not work as an employee,
self-employed or engaged in
business
35.6 33.7 37.1 Employer of a business 0.5 0.8 0.5 0.6
Permanently disabled and
unable to work0.3 0.1 0.3 0.1
Unemployed and looking for
work0.2 0.0 0.2 0.2
Volunteer 0.0 0.1 0.0 0.0
Student 0.0 0.0 0.0 0.0
Gardener 0.0 0.0 0.0 0.0
Work and Income of Respondent’s Spouse
In Percent
In Percent
In Percent In Percent
In Percent
Page 63
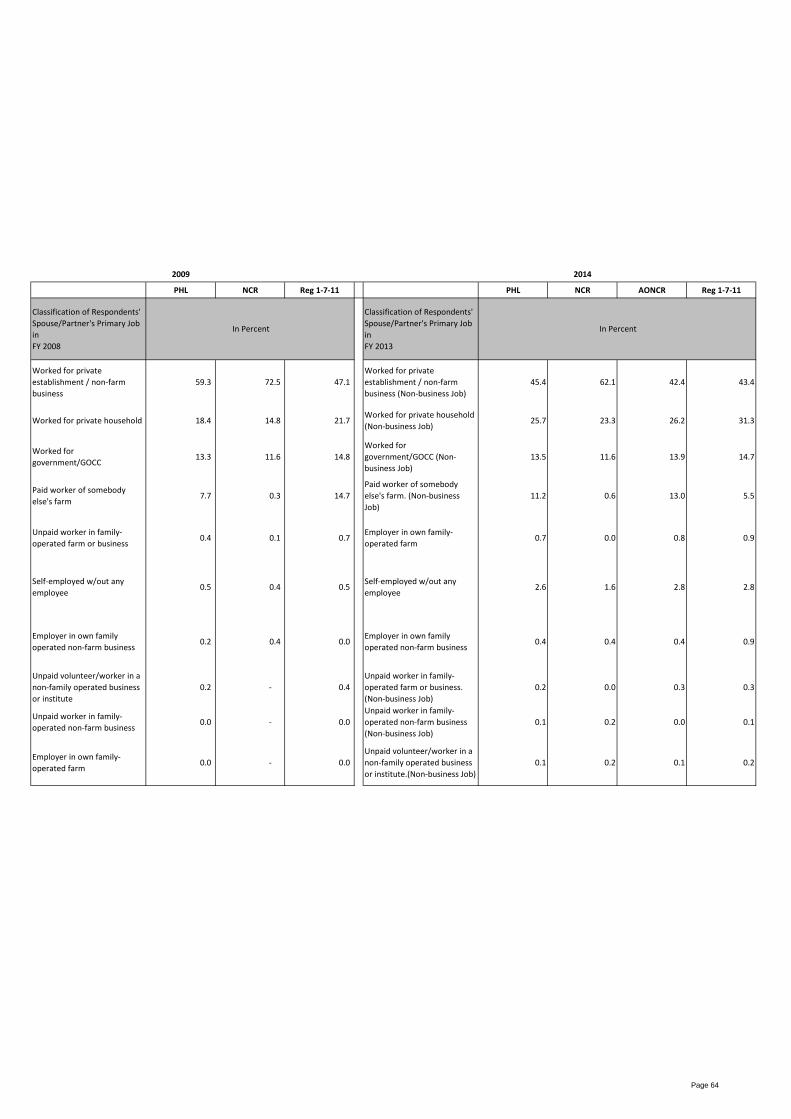
2009 2014
PHL NCR Reg 1-7-11 PHL NCR AONCR Reg 1-7-11
Classification of Respondents'
Spouse/Partner's Primary Job
in
FY 2008
Classification of Respondents'
Spouse/Partner's Primary Job
in
FY 2013
Worked for private
establishment / non-farm
business
59.3 72.5 47.1
Worked for private
establishment / non-farm
business (Non-business Job)
45.4 62.1 42.4 43.4
Worked for private household 18.4 14.8 21.7 Worked for private household
(Non-business Job)25.7 23.3 26.2 31.3
Worked for
government/GOCC13.3 11.6 14.8
Worked for
government/GOCC (Non-
business Job)
13.5 11.6 13.9 14.7
Paid worker of somebody
else's farm7.7 0.3 14.7
Paid worker of somebody
else's farm. (Non-business
Job)
11.2 0.6 13.0 5.5
Unpaid worker in family-
operated farm or business0.4 0.1 0.7
Employer in own family-
operated farm0.7 0.0 0.8 0.9
Self-employed w/out any
employee0.5 0.4 0.5
Self-employed w/out any
employee2.6 1.6 2.8 2.8
Employer in own family
operated non-farm business0.2 0.4 0.0
Employer in own family
operated non-farm business0.4 0.4 0.4 0.9
Unpaid volunteer/worker in a
non-family operated business
or institute
0.2 - 0.4
Unpaid worker in family-
operated farm or business.
(Non-business Job)
0.2 0.0 0.3 0.3
Unpaid worker in family-
operated non-farm business0.0 - 0.0
Unpaid worker in family-
operated non-farm business
(Non-business Job)
0.1 0.2 0.0 0.1
Employer in own family-
operated farm0.0 - 0.0
Unpaid volunteer/worker in a
non-family operated business
or institute.(Non-business Job)
0.1 0.2 0.1 0.2
In Percent In Percent
Page 64
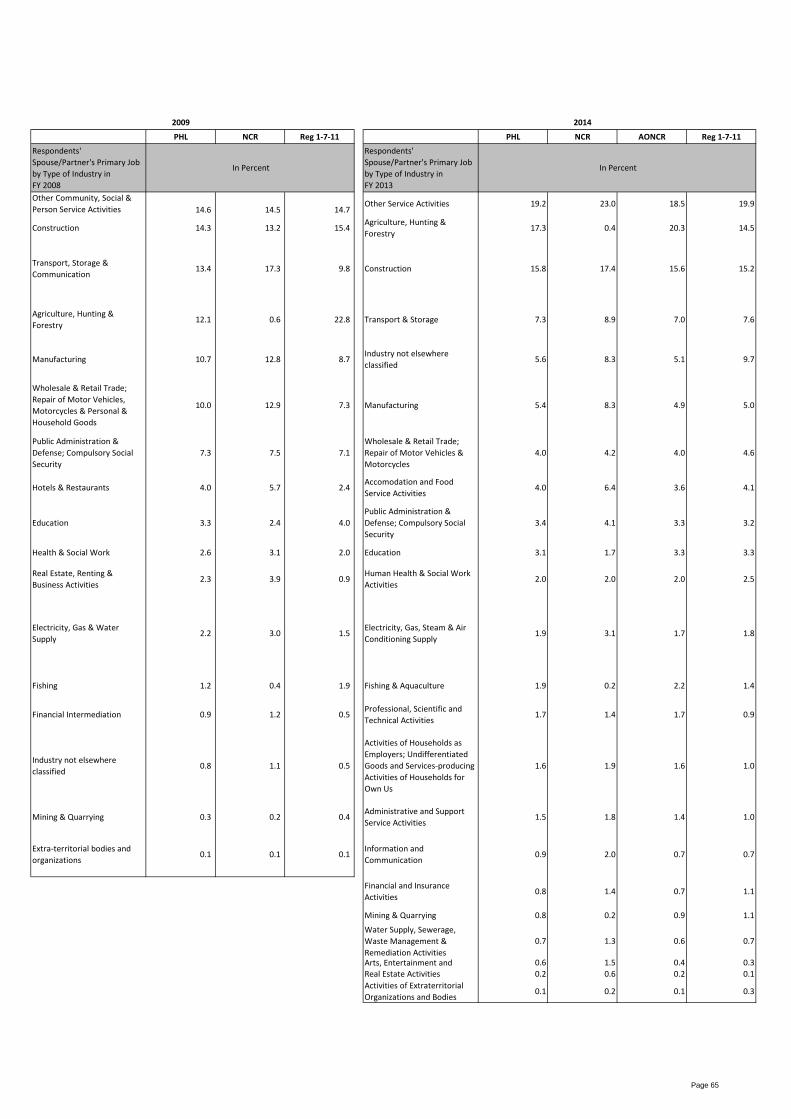
2009 2014
PHL NCR Reg 1-7-11 PHL NCR AONCR Reg 1-7-11
Respondents'
Spouse/Partner's Primary Job
by Type of Industry in
FY 2008
Respondents'
Spouse/Partner's Primary Job
by Type of Industry in
FY 2013
Other Community, Social &
Person Service Activities 14.6 14.5 14.7 Other Service Activities 19.2 23.0 18.5 19.9
Construction 14.3 13.2 15.4 Agriculture, Hunting &
Forestry17.3 0.4 20.3 14.5
Transport, Storage &
Communication13.4 17.3 9.8 Construction 15.8 17.4 15.6 15.2
Agriculture, Hunting &
Forestry12.1 0.6 22.8 Transport & Storage 7.3 8.9 7.0 7.6
Manufacturing 10.7 12.8 8.7 Industry not elsewhere
classified5.6 8.3 5.1 9.7
Wholesale & Retail Trade;
Repair of Motor Vehicles,
Motorcycles & Personal &
Household Goods
10.0 12.9 7.3 Manufacturing 5.4 8.3 4.9 5.0
Public Administration &
Defense; Compulsory Social
Security
7.3 7.5 7.1
Wholesale & Retail Trade;
Repair of Motor Vehicles &
Motorcycles
4.0 4.2 4.0 4.6
Hotels & Restaurants 4.0 5.7 2.4 Accomodation and Food
Service Activities4.0 6.4 3.6 4.1
Education 3.3 2.4 4.0
Public Administration &
Defense; Compulsory Social
Security
3.4 4.1 3.3 3.2
Health & Social Work 2.6 3.1 2.0 Education 3.1 1.7 3.3 3.3
Real Estate, Renting &
Business Activities2.3 3.9 0.9
Human Health & Social Work
Activities2.0 2.0 2.0 2.5
Electricity, Gas & Water
Supply2.2 3.0 1.5
Electricity, Gas, Steam & Air
Conditioning Supply1.9 3.1 1.7 1.8
Fishing 1.2 0.4 1.9 Fishing & Aquaculture 1.9 0.2 2.2 1.4
Financial Intermediation 0.9 1.2 0.5 Professional, Scientific and
Technical Activities1.7 1.4 1.7 0.9
Industry not elsewhere
classified0.8 1.1 0.5
Activities of Households as
Employers; Undifferentiated
Goods and Services-producing
Activities of Households for
Own Us
1.6 1.9 1.6 1.0
Mining & Quarrying 0.3 0.2 0.4 Administrative and Support
Service Activities1.5 1.8 1.4 1.0
Extra-territorial bodies and
organizations0.1 0.1 0.1
Information and
Communication0.9 2.0 0.7 0.7
Financial and Insurance
Activities0.8 1.4 0.7 1.1
Mining & Quarrying 0.8 0.2 0.9 1.1
Water Supply, Sewerage,
Waste Management &
Remediation Activities
0.7 1.3 0.6 0.7
Arts, Entertainment and 0.6 1.5 0.4 0.3
Real Estate Activities 0.2 0.6 0.2 0.1
Activities of Extraterritorial
Organizations and Bodies0.1 0.2 0.1 0.3
In Percent In Percent
Page 65
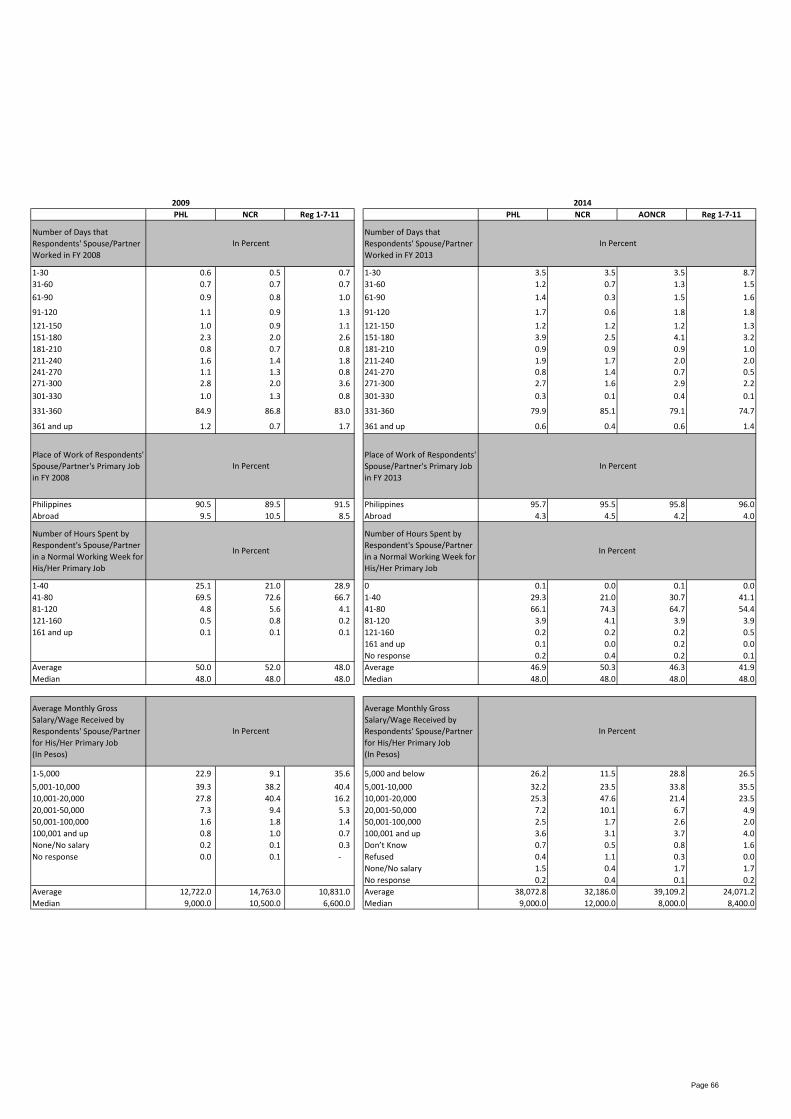
2009 2014
PHL NCR Reg 1-7-11 PHL NCR AONCR Reg 1-7-11
Number of Days that
Respondents' Spouse/Partner
Worked in FY 2008
Number of Days that
Respondents' Spouse/Partner
Worked in FY 2013
1-30 0.6 0.5 0.7 1-30 3.5 3.5 3.5 8.7
31-60 0.7 0.7 0.7 31-60 1.2 0.7 1.3 1.5
61-90 0.9 0.8 1.0 61-90 1.4 0.3 1.5 1.6
91-120 1.1 0.9 1.3 91-120 1.7 0.6 1.8 1.8
121-150 1.0 0.9 1.1 121-150 1.2 1.2 1.2 1.3
151-180 2.3 2.0 2.6 151-180 3.9 2.5 4.1 3.2
181-210 0.8 0.7 0.8 181-210 0.9 0.9 0.9 1.0
211-240 1.6 1.4 1.8 211-240 1.9 1.7 2.0 2.0
241-270 1.1 1.3 0.8 241-270 0.8 1.4 0.7 0.5
271-300 2.8 2.0 3.6 271-300 2.7 1.6 2.9 2.2
301-330 1.0 1.3 0.8 301-330 0.3 0.1 0.4 0.1
331-360 84.9 86.8 83.0 331-360 79.9 85.1 79.1 74.7
361 and up 1.2 0.7 1.7 361 and up 0.6 0.4 0.6 1.4
Place of Work of Respondents'
Spouse/Partner's Primary Job
in FY 2008
Place of Work of Respondents'
Spouse/Partner's Primary Job
in FY 2013
Philippines 90.5 89.5 91.5 Philippines 95.7 95.5 95.8 96.0
Abroad 9.5 10.5 8.5 Abroad 4.3 4.5 4.2 4.0
Number of Hours Spent by
Respondent's Spouse/Partner
in a Normal Working Week for
His/Her Primary Job
Number of Hours Spent by
Respondent's Spouse/Partner
in a Normal Working Week for
His/Her Primary Job
1-40 25.1 21.0 28.9 0 0.1 0.0 0.1 0.0
41-80 69.5 72.6 66.7 1-40 29.3 21.0 30.7 41.1
81-120 4.8 5.6 4.1 41-80 66.1 74.3 64.7 54.4
121-160 0.5 0.8 0.2 81-120 3.9 4.1 3.9 3.9
161 and up 0.1 0.1 0.1 121-160 0.2 0.2 0.2 0.5
161 and up 0.1 0.0 0.2 0.0
No response 0.2 0.4 0.2 0.1
Average 50.0 52.0 48.0 Average 46.9 50.3 46.3 41.9
Median 48.0 48.0 48.0 Median 48.0 48.0 48.0 48.0
Average Monthly Gross
Salary/Wage Received by
Respondents' Spouse/Partner
for His/Her Primary Job
(In Pesos)
Average Monthly Gross
Salary/Wage Received by
Respondents' Spouse/Partner
for His/Her Primary Job
(In Pesos)
1-5,000 22.9 9.1 35.6 5,000 and below 26.2 11.5 28.8 26.5
5,001-10,000 39.3 38.2 40.4 5,001-10,000 32.2 23.5 33.8 35.5
10,001-20,000 27.8 40.4 16.2 10,001-20,000 25.3 47.6 21.4 23.5
20,001-50,000 7.3 9.4 5.3 20,001-50,000 7.2 10.1 6.7 4.9
50,001-100,000 1.6 1.8 1.4 50,001-100,000 2.5 1.7 2.6 2.0
100,001 and up 0.8 1.0 0.7 100,001 and up 3.6 3.1 3.7 4.0
None/No salary 0.2 0.1 0.3 Don’t Know 0.7 0.5 0.8 1.6
No response 0.0 0.1 - Refused 0.4 1.1 0.3 0.0
None/No salary 1.5 0.4 1.7 1.7
No response 0.2 0.4 0.1 0.2
Average 12,722.0 14,763.0 10,831.0 Average 38,072.8 32,186.0 39,109.2 24,071.2
Median 9,000.0 10,500.0 6,600.0 Median 9,000.0 12,000.0 8,000.0 8,400.0
In Percent
In Percent
In Percent
In Percent
In Percent
In Percent
In Percent
In Percent
Page 66
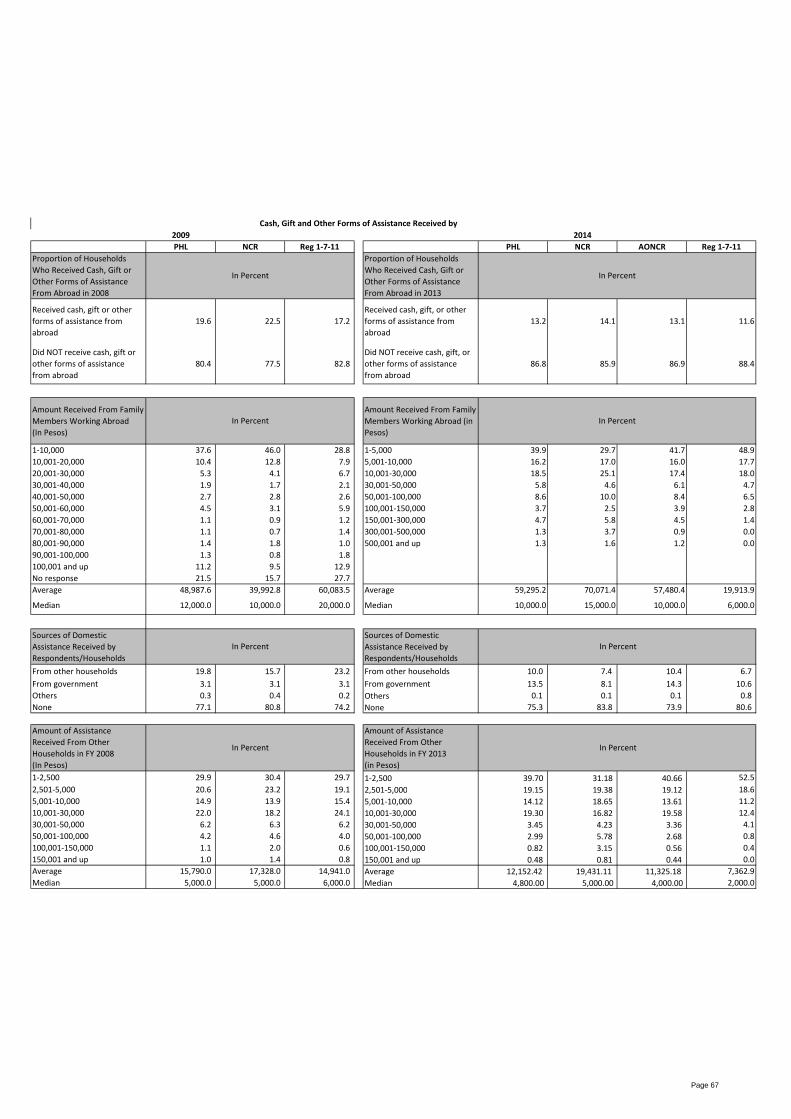
2009 2014
PHL NCR Reg 1-7-11 PHL NCR AONCR Reg 1-7-11
Proportion of Households
Who Received Cash, Gift or
Other Forms of Assistance
From Abroad in 2008
Proportion of Households
Who Received Cash, Gift or
Other Forms of Assistance
From Abroad in 2013
Received cash, gift or other
forms of assistance from
abroad
19.6 22.5 17.2
Received cash, gift, or other
forms of assistance from
abroad
13.2 14.1 13.1 11.6
Did NOT receive cash, gift or
other forms of assistance
from abroad
80.4 77.5 82.8
Did NOT receive cash, gift, or
other forms of assistance
from abroad
86.8 85.9 86.9 88.4
Amount Received From Family
Members Working Abroad
(In Pesos)
Amount Received From Family
Members Working Abroad (in
Pesos)
1-10,000 37.6 46.0 28.8 1-5,000 39.9 29.7 41.7 48.9
10,001-20,000 10.4 12.8 7.9 5,001-10,000 16.2 17.0 16.0 17.7
20,001-30,000 5.3 4.1 6.7 10,001-30,000 18.5 25.1 17.4 18.0
30,001-40,000 1.9 1.7 2.1 30,001-50,000 5.8 4.6 6.1 4.7
40,001-50,000 2.7 2.8 2.6 50,001-100,000 8.6 10.0 8.4 6.5
50,001-60,000 4.5 3.1 5.9 100,001-150,000 3.7 2.5 3.9 2.8
60,001-70,000 1.1 0.9 1.2 150,001-300,000 4.7 5.8 4.5 1.4
70,001-80,000 1.1 0.7 1.4 300,001-500,000 1.3 3.7 0.9 0.0
80,001-90,000 1.4 1.8 1.0 500,001 and up 1.3 1.6 1.2 0.0
90,001-100,000 1.3 0.8 1.8
100,001 and up 11.2 9.5 12.9
No response 21.5 15.7 27.7
Average 48,987.6 39,992.8 60,083.5 Average 59,295.2 70,071.4 57,480.4 19,913.9
Median 12,000.0 10,000.0 20,000.0 Median 10,000.0 15,000.0 10,000.0 6,000.0
Sources of Domestic
Assistance Received by
Respondents/Households
Sources of Domestic
Assistance Received by
Respondents/Households
From other households 19.8 15.7 23.2 From other households 10.0 7.4 10.4 6.7
From government 3.1 3.1 3.1 From government 13.5 8.1 14.3 10.6
Others 0.3 0.4 0.2 Others 0.1 0.1 0.1 0.8
None 77.1 80.8 74.2 None 75.3 83.8 73.9 80.6
Amount of Assistance
Received From Other
Households in FY 2008
(In Pesos)
Amount of Assistance
Received From Other
Households in FY 2013
(in Pesos)
1-2,500 29.9 30.4 29.7 1-2,500 39.70 31.18 40.66 52.5
2,501-5,000 20.6 23.2 19.1 2,501-5,000 19.15 19.38 19.12 18.6
5,001-10,000 14.9 13.9 15.4 5,001-10,000 14.12 18.65 13.61 11.2
10,001-30,000 22.0 18.2 24.1 10,001-30,000 19.30 16.82 19.58 12.4
30,001-50,000 6.2 6.3 6.2 30,001-50,000 3.45 4.23 3.36 4.1
50,001-100,000 4.2 4.6 4.0 50,001-100,000 2.99 5.78 2.68 0.8
100,001-150,000 1.1 2.0 0.6 100,001-150,000 0.82 3.15 0.56 0.4
150,001 and up 1.0 1.4 0.8 150,001 and up 0.48 0.81 0.44 0.0
Average 15,790.0 17,328.0 14,941.0 Average 12,152.42 19,431.11 11,325.18 7,362.9
Median 5,000.0 5,000.0 6,000.0 Median 4,800.00 5,000.00 4,000.00 2,000.0
In Percent
In Percent
Cash, Gift and Other Forms of Assistance Received by
In Percent
In PercentIn Percent
In Percent
In Percent In Percent
Page 67
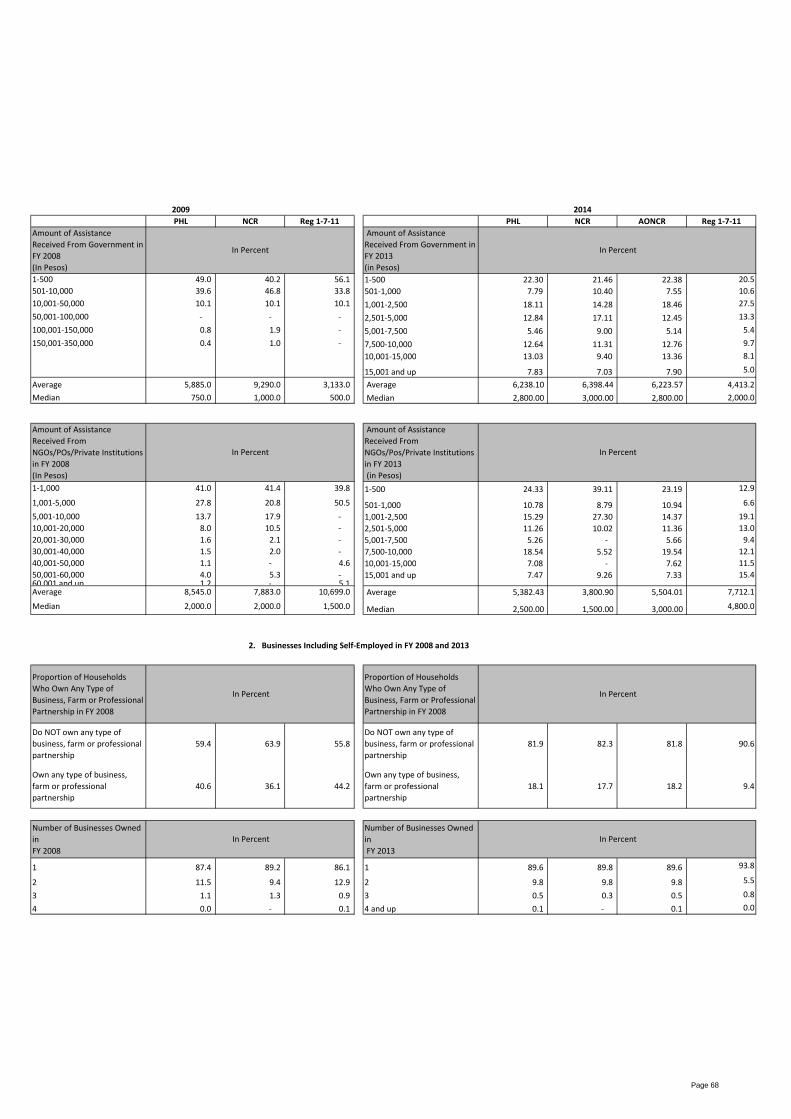
2009 2014
PHL NCR Reg 1-7-11 PHL NCR AONCR Reg 1-7-11
Amount of Assistance
Received From Government in
FY 2008
(In Pesos)
Amount of Assistance
Received From Government in
FY 2013
(in Pesos)
1-500 49.0 40.2 56.1 1-500 22.30 21.46 22.38 20.5
501-10,000 39.6 46.8 33.8 501-1,000 7.79 10.40 7.55 10.6
10,001-50,000 10.1 10.1 10.1 1,001-2,500 18.11 14.28 18.46 27.5
50,001-100,000 - - - 2,501-5,000 12.84 17.11 12.45 13.3
100,001-150,000 0.8 1.9 - 5,001-7,500 5.46 9.00 5.14 5.4
150,001-350,000 0.4 1.0 - 7,500-10,000 12.64 11.31 12.76 9.7
10,001-15,000 13.03 9.40 13.36 8.1
15,001 and up 7.83 7.03 7.90 5.0
Average 5,885.0 9,290.0 3,133.0 Average 6,238.10 6,398.44 6,223.57 4,413.2
Median 750.0 1,000.0 500.0 Median 2,800.00 3,000.00 2,800.00 2,000.0
Amount of Assistance
Received From
NGOs/POs/Private Institutions
in FY 2008
(In Pesos)
Amount of Assistance
Received From
NGOs/Pos/Private Institutions
in FY 2013
(in Pesos)
1-1,000 41.0 41.4 39.8 1-500 24.33 39.11 23.19 12.9
1,001-5,000 27.8 20.8 50.5 501-1,000 10.78 8.79 10.94 6.6
5,001-10,000 13.7 17.9 - 1,001-2,500 15.29 27.30 14.37 19.1
10,001-20,000 8.0 10.5 - 2,501-5,000 11.26 10.02 11.36 13.0
20,001-30,000 1.6 2.1 - 5,001-7,500 5.26 - 5.66 9.4
30,001-40,000 1.5 2.0 - 7,500-10,000 18.54 5.52 19.54 12.1
40,001-50,000 1.1 - 4.6 10,001-15,000 7.08 - 7.62 11.5
50,001-60,000 4.0 5.3 - 15,001 and up 7.47 9.26 7.33 15.460,001 and up 1.2 - 5.1 Average 8,545.0 7,883.0 10,699.0 Average 5,382.43 3,800.90 5,504.01 7,712.1
Median 2,000.0 2,000.0 1,500.0 Median 2,500.00 1,500.00 3,000.00 4,800.0
Proportion of Households
Who Own Any Type of
Business, Farm or Professional
Partnership in FY 2008
Proportion of Households
Who Own Any Type of
Business, Farm or Professional
Partnership in FY 2008
Do NOT own any type of
business, farm or professional
partnership
59.4 63.9 55.8
Do NOT own any type of
business, farm or professional
partnership
81.9 82.3 81.8 90.6
Own any type of business,
farm or professional
partnership
40.6 36.1 44.2
Own any type of business,
farm or professional
partnership
18.1 17.7 18.2 9.4
Number of Businesses Owned
in
FY 2008
Number of Businesses Owned
in
FY 2013
1 87.4 89.2 86.1 1 89.6 89.8 89.6 93.8
2 11.5 9.4 12.9 2 9.8 9.8 9.8 5.5
3 1.1 1.3 0.9 3 0.5 0.3 0.5 0.8
4 0.0 - 0.1 4 and up 0.1 - 0.1 0.0
In Percent
In Percent
2. Businesses Including Self-Employed in FY 2008 and 2013
In Percent
In Percent
In Percent
In Percent
In Percent
In Percent
Page 68
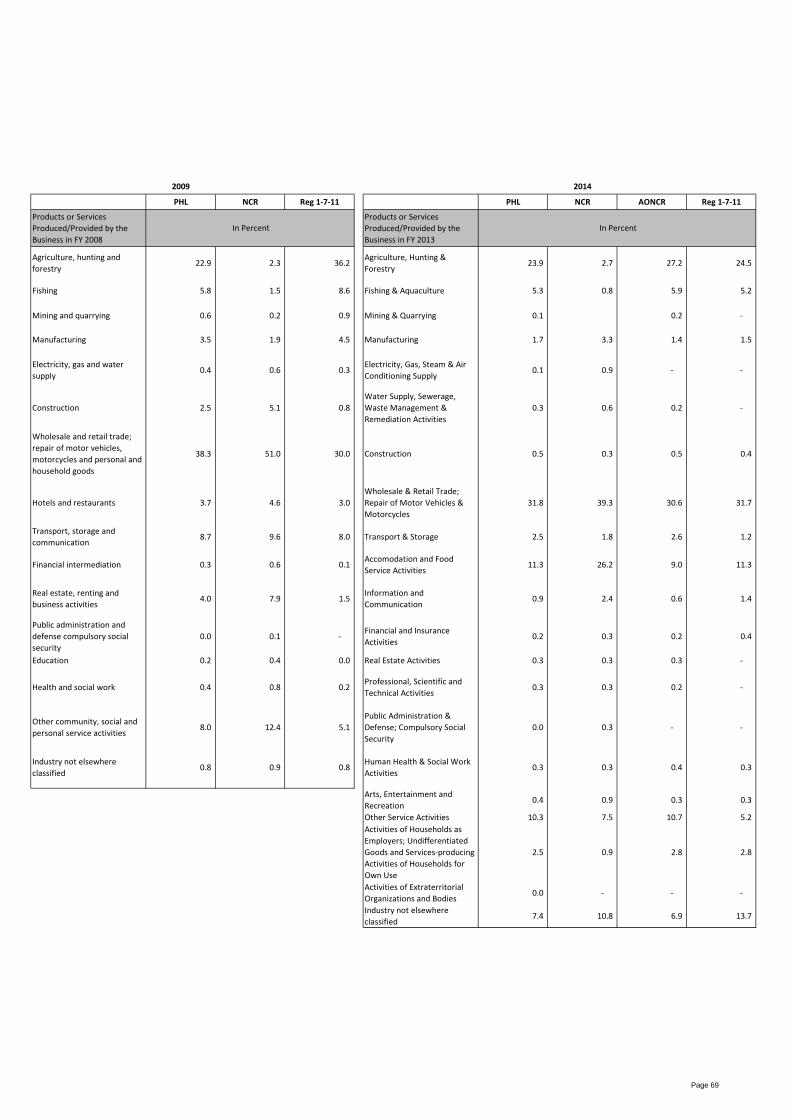
2009 2014
PHL NCR Reg 1-7-11 PHL NCR AONCR Reg 1-7-11
Products or Services
Produced/Provided by the
Business in FY 2008
Products or Services
Produced/Provided by the
Business in FY 2013
Agriculture, hunting and
forestry22.9 2.3 36.2
Agriculture, Hunting &
Forestry23.9 2.7 27.2 24.5
Fishing 5.8 1.5 8.6 Fishing & Aquaculture 5.3 0.8 5.9 5.2
Mining and quarrying 0.6 0.2 0.9 Mining & Quarrying 0.1 0.2 -
Manufacturing 3.5 1.9 4.5 Manufacturing 1.7 3.3 1.4 1.5
Electricity, gas and water
supply0.4 0.6 0.3
Electricity, Gas, Steam & Air
Conditioning Supply0.1 0.9 - -
Construction 2.5 5.1 0.8
Water Supply, Sewerage,
Waste Management &
Remediation Activities
0.3 0.6 0.2 -
Wholesale and retail trade;
repair of motor vehicles,
motorcycles and personal and
household goods
38.3 51.0 30.0 Construction 0.5 0.3 0.5 0.4
Hotels and restaurants 3.7 4.6 3.0
Wholesale & Retail Trade;
Repair of Motor Vehicles &
Motorcycles
31.8 39.3 30.6 31.7
Transport, storage and
communication8.7 9.6 8.0 Transport & Storage 2.5 1.8 2.6 1.2
Financial intermediation 0.3 0.6 0.1 Accomodation and Food
Service Activities11.3 26.2 9.0 11.3
Real estate, renting and
business activities4.0 7.9 1.5
Information and
Communication0.9 2.4 0.6 1.4
Public administration and
defense compulsory social
security
0.0 0.1 - Financial and Insurance
Activities0.2 0.3 0.2 0.4
Education 0.2 0.4 0.0 Real Estate Activities 0.3 0.3 0.3 -
Health and social work 0.4 0.8 0.2 Professional, Scientific and
Technical Activities0.3 0.3 0.2 -
Other community, social and
personal service activities8.0 12.4 5.1
Public Administration &
Defense; Compulsory Social
Security
0.0 0.3 - -
Industry not elsewhere
classified0.8 0.9 0.8
Human Health & Social Work
Activities0.3 0.3 0.4 0.3
Arts, Entertainment and
Recreation0.4 0.9 0.3 0.3
Other Service Activities 10.3 7.5 10.7 5.2
Activities of Households as
Employers; Undifferentiated
Goods and Services-producing
Activities of Households for
Own Use
2.5 0.9 2.8 2.8
Activities of Extraterritorial
Organizations and Bodies0.0 - - -
Industry not elsewhere
classified7.4 10.8 6.9 13.7
In Percent In Percent
Page 69
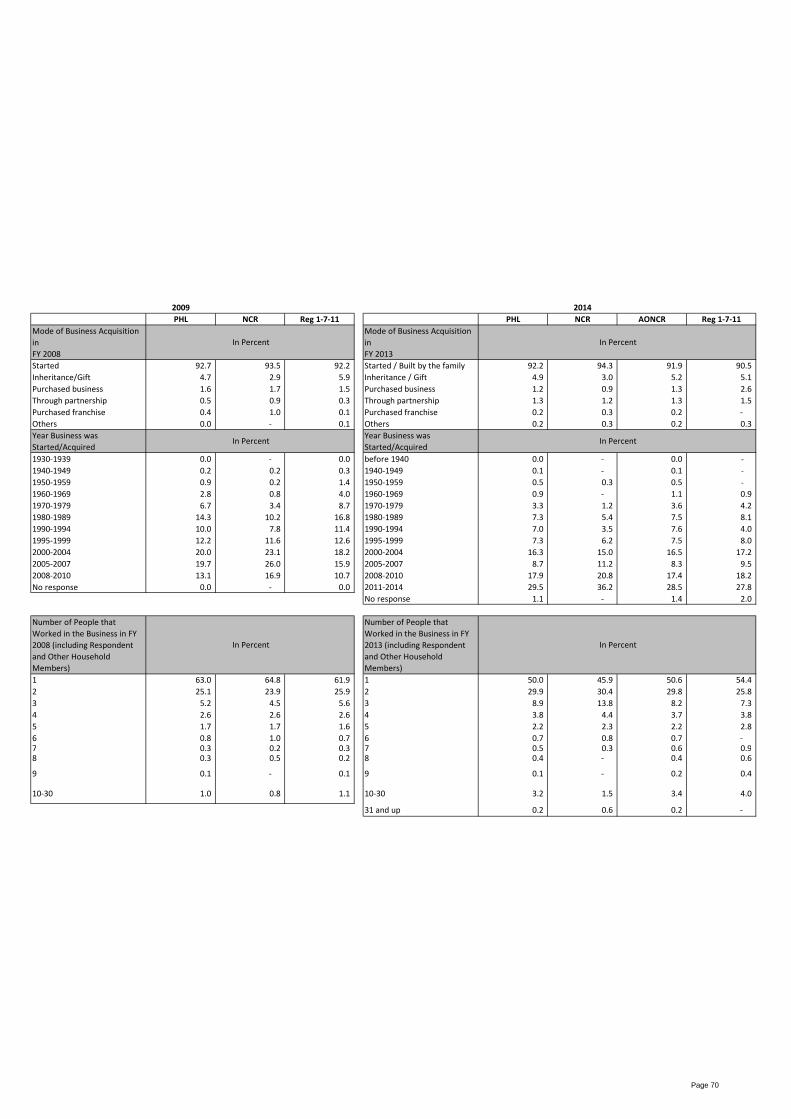
2009 2014
PHL NCR Reg 1-7-11 PHL NCR AONCR Reg 1-7-11
Mode of Business Acquisition
in
FY 2008
Mode of Business Acquisition
in
FY 2013
Started 92.7 93.5 92.2 Started / Built by the family 92.2 94.3 91.9 90.5
Inheritance/Gift 4.7 2.9 5.9 Inheritance / Gift 4.9 3.0 5.2 5.1
Purchased business 1.6 1.7 1.5 Purchased business 1.2 0.9 1.3 2.6
Through partnership 0.5 0.9 0.3 Through partnership 1.3 1.2 1.3 1.5
Purchased franchise 0.4 1.0 0.1 Purchased franchise 0.2 0.3 0.2 -
Others 0.0 - 0.1 Others 0.2 0.3 0.2 0.3
Year Business was
Started/Acquired
Year Business was
Started/Acquired
1930-1939 0.0 - 0.0 before 1940 0.0 - 0.0 -
1940-1949 0.2 0.2 0.3 1940-1949 0.1 - 0.1 -
1950-1959 0.9 0.2 1.4 1950-1959 0.5 0.3 0.5 -
1960-1969 2.8 0.8 4.0 1960-1969 0.9 - 1.1 0.9
1970-1979 6.7 3.4 8.7 1970-1979 3.3 1.2 3.6 4.2
1980-1989 14.3 10.2 16.8 1980-1989 7.3 5.4 7.5 8.1
1990-1994 10.0 7.8 11.4 1990-1994 7.0 3.5 7.6 4.0
1995-1999 12.2 11.6 12.6 1995-1999 7.3 6.2 7.5 8.0
2000-2004 20.0 23.1 18.2 2000-2004 16.3 15.0 16.5 17.2
2005-2007 19.7 26.0 15.9 2005-2007 8.7 11.2 8.3 9.5
2008-2010 13.1 16.9 10.7 2008-2010 17.9 20.8 17.4 18.2
No response 0.0 - 0.0 2011-2014 29.5 36.2 28.5 27.8
No response 1.1 - 1.4 2.0
Number of People that
Worked in the Business in FY
2008 (including Respondent
and Other Household
Members)
Number of People that
Worked in the Business in FY
2013 (including Respondent
and Other Household
Members)
1 63.0 64.8 61.9 1 50.0 45.9 50.6 54.4
2 25.1 23.9 25.9 2 29.9 30.4 29.8 25.8
3 5.2 4.5 5.6 3 8.9 13.8 8.2 7.3
4 2.6 2.6 2.6 4 3.8 4.4 3.7 3.8
5 1.7 1.7 1.6 5 2.2 2.3 2.2 2.8
6 0.8 1.0 0.7 6 0.7 0.8 0.7 -
7 0.3 0.2 0.3 7 0.5 0.3 0.6 0.9 8 0.3 0.5 0.2 8 0.4 - 0.4 0.6
9 0.1 - 0.1 9 0.1 - 0.2 0.4
10-30 1.0 0.8 1.1 10-30 3.2 1.5 3.4 4.0
31 and up 0.2 0.6 0.2 -
In Percent
In Percent
In Percent
In Percent
In Percent
In Percent
Page 70
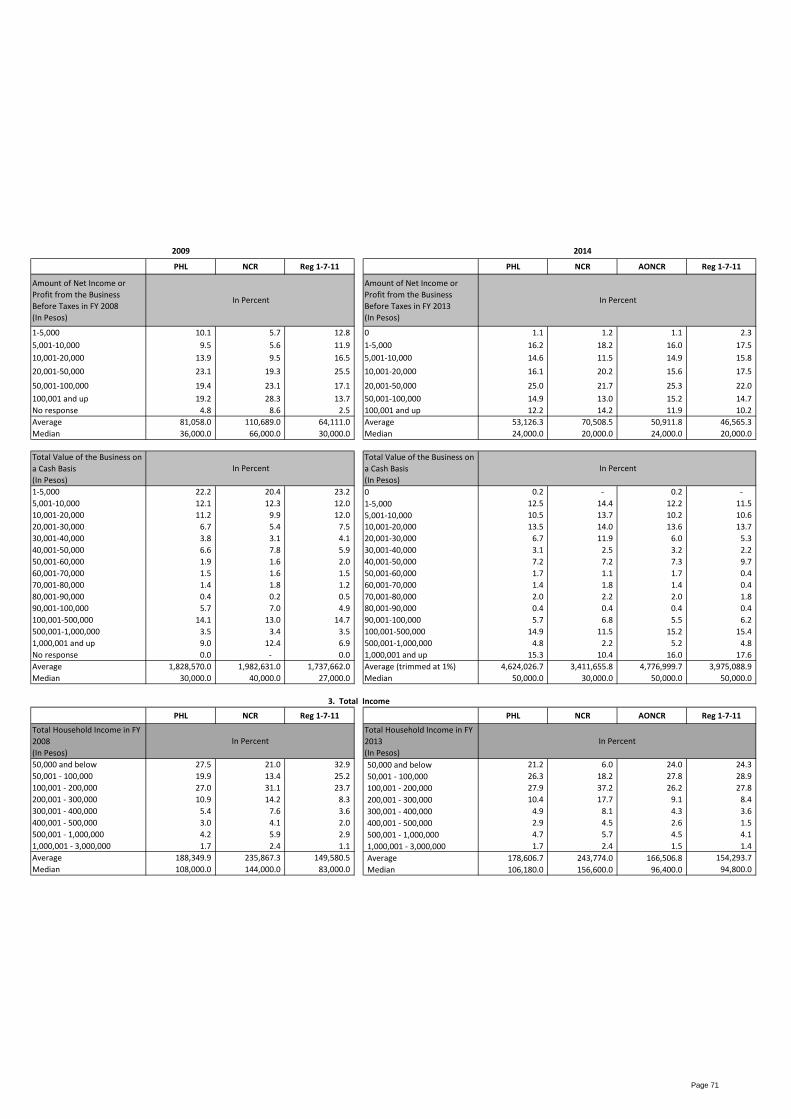
2009 2014
PHL NCR Reg 1-7-11 PHL NCR AONCR Reg 1-7-11
Amount of Net Income or
Profit from the Business
Before Taxes in FY 2008
(In Pesos)
Amount of Net Income or
Profit from the Business
Before Taxes in FY 2013
(In Pesos)
1-5,000 10.1 5.7 12.8 0 1.1 1.2 1.1 2.3
5,001-10,000 9.5 5.6 11.9 1-5,000 16.2 18.2 16.0 17.5
10,001-20,000 13.9 9.5 16.5 5,001-10,000 14.6 11.5 14.9 15.8
20,001-50,000 23.1 19.3 25.5 10,001-20,000 16.1 20.2 15.6 17.5
50,001-100,000 19.4 23.1 17.1 20,001-50,000 25.0 21.7 25.3 22.0
100,001 and up 19.2 28.3 13.7 50,001-100,000 14.9 13.0 15.2 14.7
No response 4.8 8.6 2.5 100,001 and up 12.2 14.2 11.9 10.2
Average 81,058.0 110,689.0 64,111.0 Average 53,126.3 70,508.5 50,911.8 46,565.3
Median 36,000.0 66,000.0 30,000.0 Median 24,000.0 20,000.0 24,000.0 20,000.0
Total Value of the Business on
a Cash Basis
(In Pesos)
Total Value of the Business on
a Cash Basis
(In Pesos)
1-5,000 22.2 20.4 23.2 0 0.2 - 0.2 -
5,001-10,000 12.1 12.3 12.0 1-5,000 12.5 14.4 12.2 11.5
10,001-20,000 11.2 9.9 12.0 5,001-10,000 10.5 13.7 10.2 10.6
20,001-30,000 6.7 5.4 7.5 10,001-20,000 13.5 14.0 13.6 13.7
30,001-40,000 3.8 3.1 4.1 20,001-30,000 6.7 11.9 6.0 5.3
40,001-50,000 6.6 7.8 5.9 30,001-40,000 3.1 2.5 3.2 2.2
50,001-60,000 1.9 1.6 2.0 40,001-50,000 7.2 7.2 7.3 9.7
60,001-70,000 1.5 1.6 1.5 50,001-60,000 1.7 1.1 1.7 0.4
70,001-80,000 1.4 1.8 1.2 60,001-70,000 1.4 1.8 1.4 0.4
80,001-90,000 0.4 0.2 0.5 70,001-80,000 2.0 2.2 2.0 1.8
90,001-100,000 5.7 7.0 4.9 80,001-90,000 0.4 0.4 0.4 0.4
100,001-500,000 14.1 13.0 14.7 90,001-100,000 5.7 6.8 5.5 6.2
500,001-1,000,000 3.5 3.4 3.5 100,001-500,000 14.9 11.5 15.2 15.4
1,000,001 and up 9.0 12.4 6.9 500,001-1,000,000 4.8 2.2 5.2 4.8
No response 0.0 - 0.0 1,000,001 and up 15.3 10.4 16.0 17.6
Average 1,828,570.0 1,982,631.0 1,737,662.0 Average (trimmed at 1%) 4,624,026.7 3,411,655.8 4,776,999.7 3,975,088.9
Median 30,000.0 40,000.0 27,000.0 Median 50,000.0 30,000.0 50,000.0 50,000.0
PHL NCR Reg 1-7-11 PHL NCR AONCR Reg 1-7-11
Total Household Income in FY
2008
(In Pesos)
Total Household Income in FY
2013
(In Pesos)
50,000 and below 27.5 21.0 32.9 50,000 and below 21.2 6.0 24.0 24.3
50,001 - 100,000 19.9 13.4 25.2 50,001 - 100,000 26.3 18.2 27.8 28.9
100,001 - 200,000 27.0 31.1 23.7 100,001 - 200,000 27.9 37.2 26.2 27.8
200,001 - 300,000 10.9 14.2 8.3 200,001 - 300,000 10.4 17.7 9.1 8.4
300,001 - 400,000 5.4 7.6 3.6 300,001 - 400,000 4.9 8.1 4.3 3.6
400,001 - 500,000 3.0 4.1 2.0 400,001 - 500,000 2.9 4.5 2.6 1.5
500,001 - 1,000,000 4.2 5.9 2.9 500,001 - 1,000,000 4.7 5.7 4.5 4.1
1,000,001 - 3,000,000 1.7 2.4 1.1 1,000,001 - 3,000,000 1.7 2.4 1.5 1.4
Average 188,349.9 235,867.3 149,580.5 Average 178,606.7 243,774.0 166,506.8 154,293.7
Median 108,000.0 144,000.0 83,000.0 Median 106,180.0 156,600.0 96,400.0 94,800.0
In Percent
In Percent
In Percent
In Percent
3. Total Income
In Percent
In Percent
Page 71
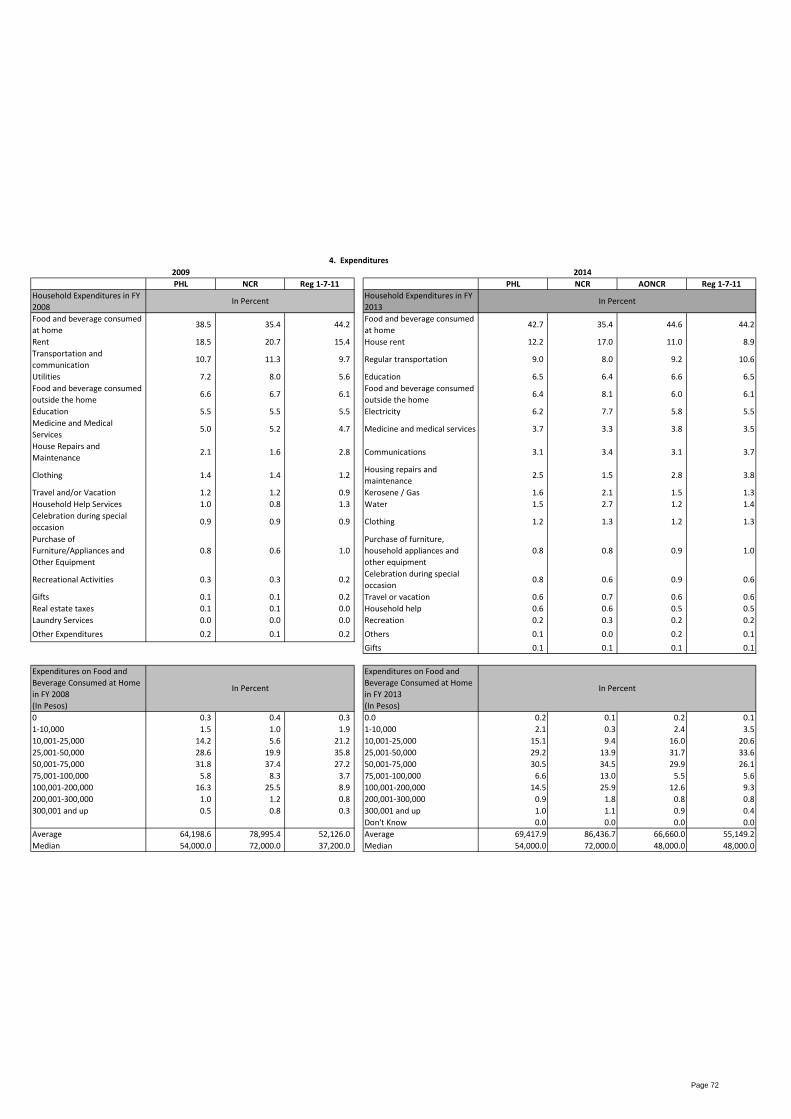
2009 2014
PHL NCR Reg 1-7-11 PHL NCR AONCR Reg 1-7-11
Household Expenditures in FY
2008
Household Expenditures in FY
2013
Food and beverage consumed
at home38.5 35.4 44.2
Food and beverage consumed
at home42.7 35.4 44.6 44.2
Rent 18.5 20.7 15.4 House rent 12.2 17.0 11.0 8.9
Transportation and
communication10.7 11.3 9.7 Regular transportation 9.0 8.0 9.2 10.6
Utilities 7.2 8.0 5.6 Education 6.5 6.4 6.6 6.5
Food and beverage consumed
outside the home6.6 6.7 6.1
Food and beverage consumed
outside the home6.4 8.1 6.0 6.1
Education 5.5 5.5 5.5 Electricity 6.2 7.7 5.8 5.5
Medicine and Medical
Services5.0 5.2 4.7 Medicine and medical services 3.7 3.3 3.8 3.5
House Repairs and
Maintenance2.1 1.6 2.8 Communications 3.1 3.4 3.1 3.7
Clothing 1.4 1.4 1.2 Housing repairs and
maintenance2.5 1.5 2.8 3.8
Travel and/or Vacation 1.2 1.2 0.9 Kerosene / Gas 1.6 2.1 1.5 1.3
Household Help Services 1.0 0.8 1.3 Water 1.5 2.7 1.2 1.4
Celebration during special
occasion0.9 0.9 0.9 Clothing 1.2 1.3 1.2 1.3
Purchase of
Furniture/Appliances and
Other Equipment
0.8 0.6 1.0
Purchase of furniture,
household appliances and
other equipment
0.8 0.8 0.9 1.0
Recreational Activities 0.3 0.3 0.2 Celebration during special
occasion0.8 0.6 0.9 0.6
Gifts 0.1 0.1 0.2 Travel or vacation 0.6 0.7 0.6 0.6
Real estate taxes 0.1 0.1 0.0 Household help 0.6 0.6 0.5 0.5
Laundry Services 0.0 0.0 0.0 Recreation 0.2 0.3 0.2 0.2
Other Expenditures 0.2 0.1 0.2 Others 0.1 0.0 0.2 0.1
Gifts 0.1 0.1 0.1 0.1
Expenditures on Food and
Beverage Consumed at Home
in FY 2008
(In Pesos)
Expenditures on Food and
Beverage Consumed at Home
in FY 2013
(In Pesos)
0 0.3 0.4 0.3 0.0 0.2 0.1 0.2 0.1
1-10,000 1.5 1.0 1.9 1-10,000 2.1 0.3 2.4 3.5
10,001-25,000 14.2 5.6 21.2 10,001-25,000 15.1 9.4 16.0 20.6
25,001-50,000 28.6 19.9 35.8 25,001-50,000 29.2 13.9 31.7 33.6
50,001-75,000 31.8 37.4 27.2 50,001-75,000 30.5 34.5 29.9 26.1
75,001-100,000 5.8 8.3 3.7 75,001-100,000 6.6 13.0 5.5 5.6
100,001-200,000 16.3 25.5 8.9 100,001-200,000 14.5 25.9 12.6 9.3
200,001-300,000 1.0 1.2 0.8 200,001-300,000 0.9 1.8 0.8 0.8
300,001 and up 0.5 0.8 0.3 300,001 and up 1.0 1.1 0.9 0.4
Don't Know 0.0 0.0 0.0 0.0
Average 64,198.6 78,995.4 52,126.0 Average 69,417.9 86,436.7 66,660.0 55,149.2
Median 54,000.0 72,000.0 37,200.0 Median 54,000.0 72,000.0 48,000.0 48,000.0
4. Expenditures
In Percent In Percent
In PercentIn Percent
Page 72
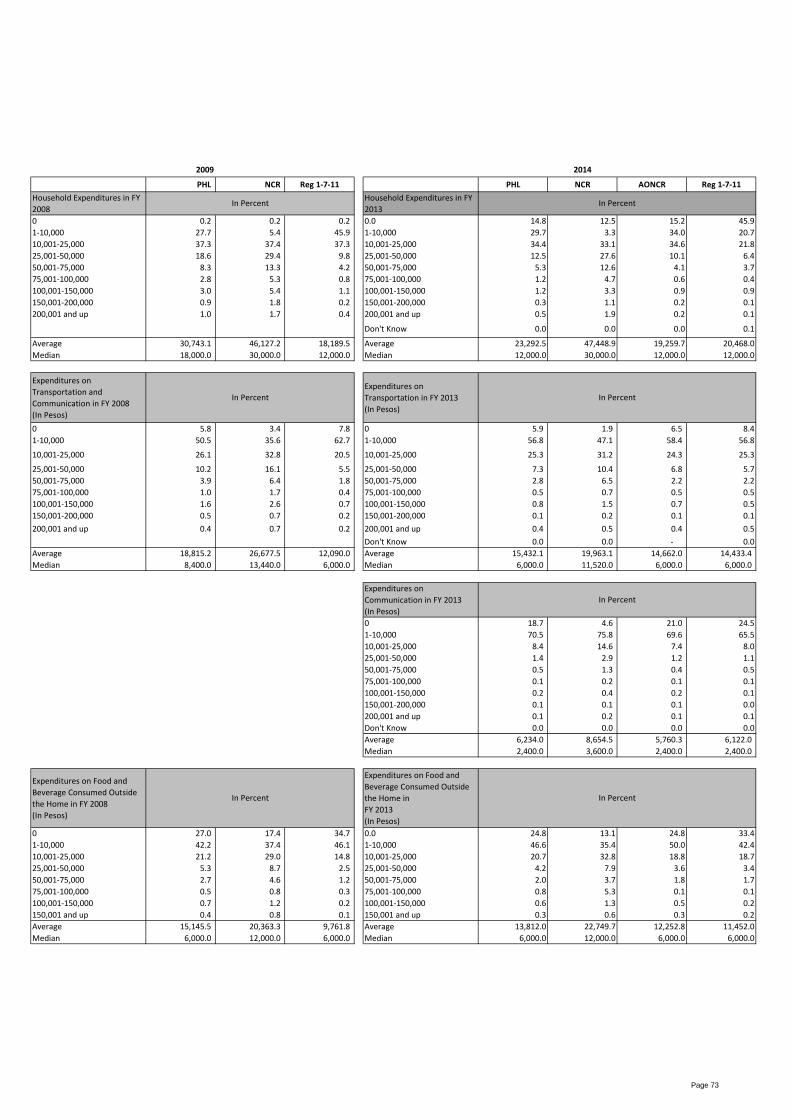
2009 2014
PHL NCR Reg 1-7-11 PHL NCR AONCR Reg 1-7-11
Household Expenditures in FY
2008
Household Expenditures in FY
2013
0 0.2 0.2 0.2 0.0 14.8 12.5 15.2 45.9
1-10,000 27.7 5.4 45.9 1-10,000 29.7 3.3 34.0 20.7
10,001-25,000 37.3 37.4 37.3 10,001-25,000 34.4 33.1 34.6 21.8
25,001-50,000 18.6 29.4 9.8 25,001-50,000 12.5 27.6 10.1 6.4
50,001-75,000 8.3 13.3 4.2 50,001-75,000 5.3 12.6 4.1 3.7
75,001-100,000 2.8 5.3 0.8 75,001-100,000 1.2 4.7 0.6 0.4
100,001-150,000 3.0 5.4 1.1 100,001-150,000 1.2 3.3 0.9 0.9
150,001-200,000 0.9 1.8 0.2 150,001-200,000 0.3 1.1 0.2 0.1
200,001 and up 1.0 1.7 0.4 200,001 and up 0.5 1.9 0.2 0.1
Don't Know 0.0 0.0 0.0 0.1
Average 30,743.1 46,127.2 18,189.5 Average 23,292.5 47,448.9 19,259.7 20,468.0
Median 18,000.0 30,000.0 12,000.0 Median 12,000.0 30,000.0 12,000.0 12,000.0
Expenditures on
Transportation and
Communication in FY 2008
(In Pesos)
Expenditures on
Transportation in FY 2013
(In Pesos)
0 5.8 3.4 7.8 0 5.9 1.9 6.5 8.4
1-10,000 50.5 35.6 62.7 1-10,000 56.8 47.1 58.4 56.8
10,001-25,000 26.1 32.8 20.5 10,001-25,000 25.3 31.2 24.3 25.3
25,001-50,000 10.2 16.1 5.5 25,001-50,000 7.3 10.4 6.8 5.7
50,001-75,000 3.9 6.4 1.8 50,001-75,000 2.8 6.5 2.2 2.2
75,001-100,000 1.0 1.7 0.4 75,001-100,000 0.5 0.7 0.5 0.5
100,001-150,000 1.6 2.6 0.7 100,001-150,000 0.8 1.5 0.7 0.5
150,001-200,000 0.5 0.7 0.2 150,001-200,000 0.1 0.2 0.1 0.1
200,001 and up 0.4 0.7 0.2 200,001 and up 0.4 0.5 0.4 0.5
Don't Know 0.0 0.0 - 0.0
Average 18,815.2 26,677.5 12,090.0 Average 15,432.1 19,963.1 14,662.0 14,433.4
Median 8,400.0 13,440.0 6,000.0 Median 6,000.0 11,520.0 6,000.0 6,000.0
Expenditures on
Communication in FY 2013
(In Pesos)
0 18.7 4.6 21.0 24.5
1-10,000 70.5 75.8 69.6 65.5
10,001-25,000 8.4 14.6 7.4 8.0
25,001-50,000 1.4 2.9 1.2 1.1
50,001-75,000 0.5 1.3 0.4 0.5
75,001-100,000 0.1 0.2 0.1 0.1
100,001-150,000 0.2 0.4 0.2 0.1
150,001-200,000 0.1 0.1 0.1 0.0
200,001 and up 0.1 0.2 0.1 0.1
Don't Know 0.0 0.0 0.0 0.0
Average 6,234.0 8,654.5 5,760.3 6,122.0
Median 2,400.0 3,600.0 2,400.0 2,400.0
Expenditures on Food and
Beverage Consumed Outside
the Home in FY 2008
(In Pesos)
Expenditures on Food and
Beverage Consumed Outside
the Home in
FY 2013
(In Pesos)
0 27.0 17.4 34.7 0.0 24.8 13.1 24.8 33.4
1-10,000 42.2 37.4 46.1 1-10,000 46.6 35.4 50.0 42.4
10,001-25,000 21.2 29.0 14.8 10,001-25,000 20.7 32.8 18.8 18.7
25,001-50,000 5.3 8.7 2.5 25,001-50,000 4.2 7.9 3.6 3.4
50,001-75,000 2.7 4.6 1.2 50,001-75,000 2.0 3.7 1.8 1.7
75,001-100,000 0.5 0.8 0.3 75,001-100,000 0.8 5.3 0.1 0.1
100,001-150,000 0.7 1.2 0.2 100,001-150,000 0.6 1.3 0.5 0.2
150,001 and up 0.4 0.8 0.1 150,001 and up 0.3 0.6 0.3 0.2
Average 15,145.5 20,363.3 9,761.8 Average 13,812.0 22,749.7 12,252.8 11,452.0
Median 6,000.0 12,000.0 6,000.0 Median 6,000.0 12,000.0 6,000.0 6,000.0
In Percent In Percent
In Percent
In Percent
In Percent
In Percent
In Percent
Page 73
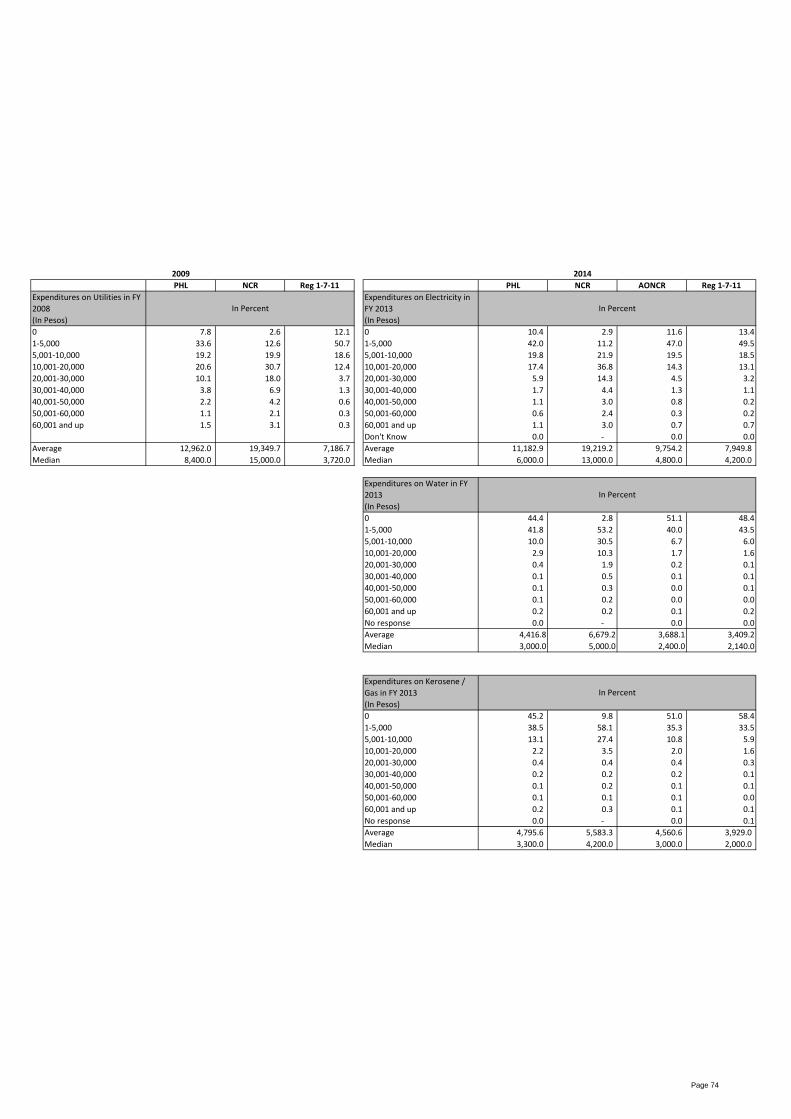
2009 2014
PHL NCR Reg 1-7-11 PHL NCR AONCR Reg 1-7-11
Expenditures on Utilities in FY
2008
(In Pesos)
Expenditures on Electricity in
FY 2013
(In Pesos)
0 7.8 2.6 12.1 0 10.4 2.9 11.6 13.4
1-5,000 33.6 12.6 50.7 1-5,000 42.0 11.2 47.0 49.5
5,001-10,000 19.2 19.9 18.6 5,001-10,000 19.8 21.9 19.5 18.5
10,001-20,000 20.6 30.7 12.4 10,001-20,000 17.4 36.8 14.3 13.1
20,001-30,000 10.1 18.0 3.7 20,001-30,000 5.9 14.3 4.5 3.2
30,001-40,000 3.8 6.9 1.3 30,001-40,000 1.7 4.4 1.3 1.1
40,001-50,000 2.2 4.2 0.6 40,001-50,000 1.1 3.0 0.8 0.2
50,001-60,000 1.1 2.1 0.3 50,001-60,000 0.6 2.4 0.3 0.2
60,001 and up 1.5 3.1 0.3 60,001 and up 1.1 3.0 0.7 0.7
Don't Know 0.0 - 0.0 0.0
Average 12,962.0 19,349.7 7,186.7 Average 11,182.9 19,219.2 9,754.2 7,949.8
Median 8,400.0 15,000.0 3,720.0 Median 6,000.0 13,000.0 4,800.0 4,200.0
Expenditures on Water in FY
2013
(In Pesos)
0 44.4 2.8 51.1 48.4
1-5,000 41.8 53.2 40.0 43.5
5,001-10,000 10.0 30.5 6.7 6.0
10,001-20,000 2.9 10.3 1.7 1.6
20,001-30,000 0.4 1.9 0.2 0.1
30,001-40,000 0.1 0.5 0.1 0.1
40,001-50,000 0.1 0.3 0.0 0.1
50,001-60,000 0.1 0.2 0.0 0.0
60,001 and up 0.2 0.2 0.1 0.2
No response 0.0 - 0.0 0.0
Average 4,416.8 6,679.2 3,688.1 3,409.2
Median 3,000.0 5,000.0 2,400.0 2,140.0
Expenditures on Kerosene /
Gas in FY 2013
(In Pesos)
0 45.2 9.8 51.0 58.4
1-5,000 38.5 58.1 35.3 33.5
5,001-10,000 13.1 27.4 10.8 5.9
10,001-20,000 2.2 3.5 2.0 1.6
20,001-30,000 0.4 0.4 0.4 0.3
30,001-40,000 0.2 0.2 0.2 0.1
40,001-50,000 0.1 0.2 0.1 0.1
50,001-60,000 0.1 0.1 0.1 0.0
60,001 and up 0.2 0.3 0.1 0.1
No response 0.0 - 0.0 0.1
Average 4,795.6 5,583.3 4,560.6 3,929.0
Median 3,300.0 4,200.0 3,000.0 2,000.0
In Percent
In Percent
In Percent
In Percent
Page 74
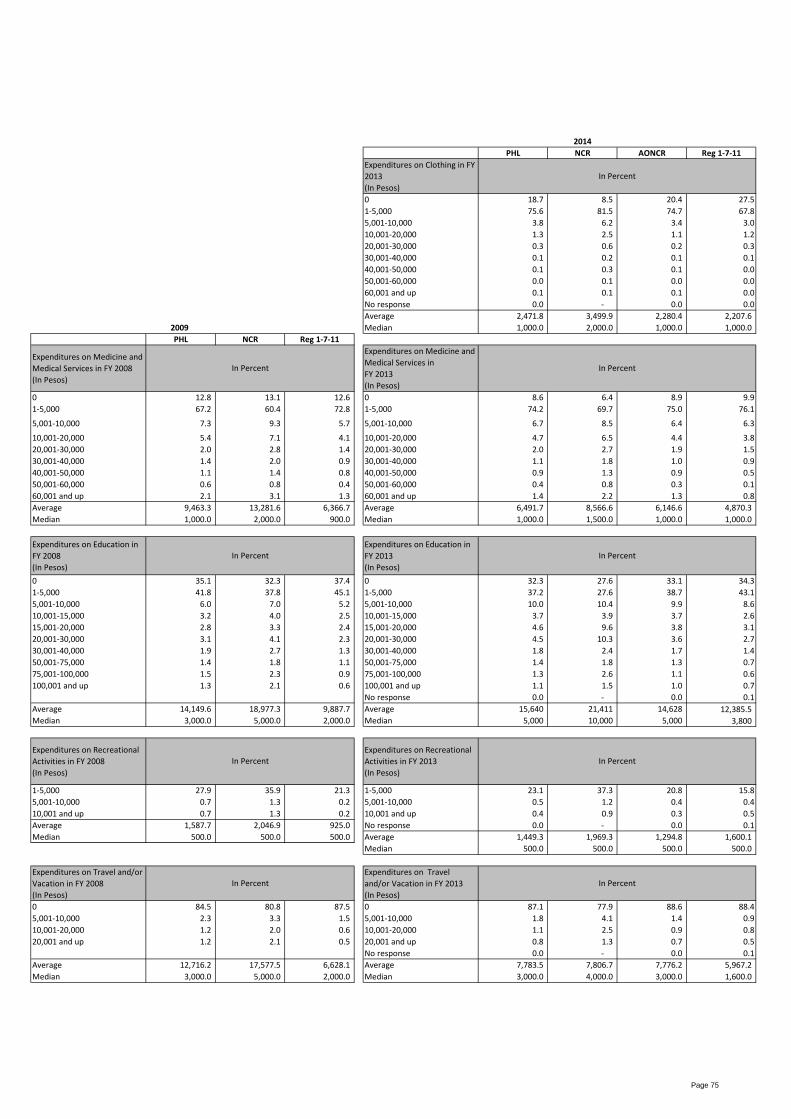
2014
PHL NCR AONCR Reg 1-7-11
Expenditures on Clothing in FY
2013
(In Pesos)
0 18.7 8.5 20.4 27.5
1-5,000 75.6 81.5 74.7 67.8
5,001-10,000 3.8 6.2 3.4 3.0
10,001-20,000 1.3 2.5 1.1 1.2
20,001-30,000 0.3 0.6 0.2 0.3
30,001-40,000 0.1 0.2 0.1 0.1
40,001-50,000 0.1 0.3 0.1 0.0
50,001-60,000 0.0 0.1 0.0 0.0
60,001 and up 0.1 0.1 0.1 0.0
No response 0.0 - 0.0 0.0
Average 2,471.8 3,499.9 2,280.4 2,207.6
2009 Median 1,000.0 2,000.0 1,000.0 1,000.0
PHL NCR Reg 1-7-11
Expenditures on Medicine and
Medical Services in FY 2008
(In Pesos)
Expenditures on Medicine and
Medical Services in
FY 2013
(In Pesos)
0 12.8 13.1 12.6 0 8.6 6.4 8.9 9.9
1-5,000 67.2 60.4 72.8 1-5,000 74.2 69.7 75.0 76.1
5,001-10,000 7.3 9.3 5.7 5,001-10,000 6.7 8.5 6.4 6.3
10,001-20,000 5.4 7.1 4.1 10,001-20,000 4.7 6.5 4.4 3.8
20,001-30,000 2.0 2.8 1.4 20,001-30,000 2.0 2.7 1.9 1.5
30,001-40,000 1.4 2.0 0.9 30,001-40,000 1.1 1.8 1.0 0.9
40,001-50,000 1.1 1.4 0.8 40,001-50,000 0.9 1.3 0.9 0.5
50,001-60,000 0.6 0.8 0.4 50,001-60,000 0.4 0.8 0.3 0.1
60,001 and up 2.1 3.1 1.3 60,001 and up 1.4 2.2 1.3 0.8
Average 9,463.3 13,281.6 6,366.7 Average 6,491.7 8,566.6 6,146.6 4,870.3
Median 1,000.0 2,000.0 900.0 Median 1,000.0 1,500.0 1,000.0 1,000.0
Expenditures on Education in
FY 2008
(In Pesos)
Expenditures on Education in
FY 2013
(In Pesos)
0 35.1 32.3 37.4 0 32.3 27.6 33.1 34.3
1-5,000 41.8 37.8 45.1 1-5,000 37.2 27.6 38.7 43.1
5,001-10,000 6.0 7.0 5.2 5,001-10,000 10.0 10.4 9.9 8.6
10,001-15,000 3.2 4.0 2.5 10,001-15,000 3.7 3.9 3.7 2.6
15,001-20,000 2.8 3.3 2.4 15,001-20,000 4.6 9.6 3.8 3.1
20,001-30,000 3.1 4.1 2.3 20,001-30,000 4.5 10.3 3.6 2.7
30,001-40,000 1.9 2.7 1.3 30,001-40,000 1.8 2.4 1.7 1.4
50,001-75,000 1.4 1.8 1.1 50,001-75,000 1.4 1.8 1.3 0.7
75,001-100,000 1.5 2.3 0.9 75,001-100,000 1.3 2.6 1.1 0.6
100,001 and up 1.3 2.1 0.6 100,001 and up 1.1 1.5 1.0 0.7
No response 0.0 - 0.0 0.1
Average 14,149.6 18,977.3 9,887.7 Average 15,640 21,411 14,628 12,385.5
Median 3,000.0 5,000.0 2,000.0 Median 5,000 10,000 5,000 3,800
Expenditures on Recreational
Activities in FY 2008
(In Pesos)
Expenditures on Recreational
Activities in FY 2013
(In Pesos)
1-5,000 27.9 35.9 21.3 1-5,000 23.1 37.3 20.8 15.8
5,001-10,000 0.7 1.3 0.2 5,001-10,000 0.5 1.2 0.4 0.4
10,001 and up 0.7 1.3 0.2 10,001 and up 0.4 0.9 0.3 0.5
Average 1,587.7 2,046.9 925.0 No response 0.0 - 0.0 0.1
Median 500.0 500.0 500.0 Average 1,449.3 1,969.3 1,294.8 1,600.1
Median 500.0 500.0 500.0 500.0
Expenditures on Travel and/or
Vacation in FY 2008
(In Pesos)
Expenditures on Travel
and/or Vacation in FY 2013
(In Pesos)
0 84.5 80.8 87.5 0 87.1 77.9 88.6 88.4
5,001-10,000 2.3 3.3 1.5 5,001-10,000 1.8 4.1 1.4 0.9
10,001-20,000 1.2 2.0 0.6 10,001-20,000 1.1 2.5 0.9 0.8
20,001 and up 1.2 2.1 0.5 20,001 and up 0.8 1.3 0.7 0.5
No response 0.0 - 0.0 0.1
Average 12,716.2 17,577.5 6,628.1 Average 7,783.5 7,806.7 7,776.2 5,967.2
Median 3,000.0 5,000.0 2,000.0 Median 3,000.0 4,000.0 3,000.0 1,600.0
In Percent
In Percent
In Percent
In Percent
In Percent
In Percent
In Percent
In Percent
In Percent
Page 75
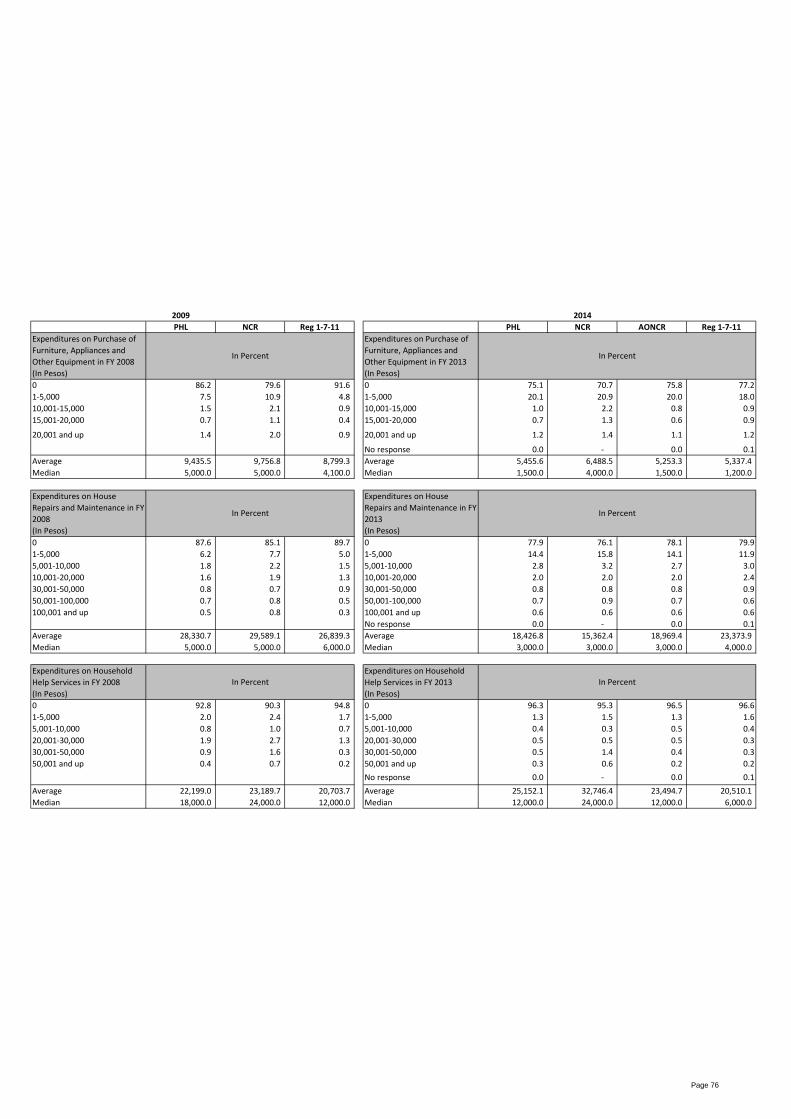
2009 2014
PHL NCR Reg 1-7-11 PHL NCR AONCR Reg 1-7-11
Expenditures on Purchase of
Furniture, Appliances and
Other Equipment in FY 2008
(In Pesos)
Expenditures on Purchase of
Furniture, Appliances and
Other Equipment in FY 2013
(In Pesos)
0 86.2 79.6 91.6 0 75.1 70.7 75.8 77.2
1-5,000 7.5 10.9 4.8 1-5,000 20.1 20.9 20.0 18.0
10,001-15,000 1.5 2.1 0.9 10,001-15,000 1.0 2.2 0.8 0.9
15,001-20,000 0.7 1.1 0.4 15,001-20,000 0.7 1.3 0.6 0.9
20,001 and up 1.4 2.0 0.9 20,001 and up 1.2 1.4 1.1 1.2
No response 0.0 - 0.0 0.1
Average 9,435.5 9,756.8 8,799.3 Average 5,455.6 6,488.5 5,253.3 5,337.4
Median 5,000.0 5,000.0 4,100.0 Median 1,500.0 4,000.0 1,500.0 1,200.0
Expenditures on House
Repairs and Maintenance in FY
2008
(In Pesos)
Expenditures on House
Repairs and Maintenance in FY
2013
(In Pesos)
0 87.6 85.1 89.7 0 77.9 76.1 78.1 79.9
1-5,000 6.2 7.7 5.0 1-5,000 14.4 15.8 14.1 11.9
5,001-10,000 1.8 2.2 1.5 5,001-10,000 2.8 3.2 2.7 3.0
10,001-20,000 1.6 1.9 1.3 10,001-20,000 2.0 2.0 2.0 2.4
30,001-50,000 0.8 0.7 0.9 30,001-50,000 0.8 0.8 0.8 0.9
50,001-100,000 0.7 0.8 0.5 50,001-100,000 0.7 0.9 0.7 0.6
100,001 and up 0.5 0.8 0.3 100,001 and up 0.6 0.6 0.6 0.6
No response 0.0 - 0.0 0.1
Average 28,330.7 29,589.1 26,839.3 Average 18,426.8 15,362.4 18,969.4 23,373.9
Median 5,000.0 5,000.0 6,000.0 Median 3,000.0 3,000.0 3,000.0 4,000.0
Expenditures on Household
Help Services in FY 2008
(In Pesos)
Expenditures on Household
Help Services in FY 2013
(In Pesos)
0 92.8 90.3 94.8 0 96.3 95.3 96.5 96.6
1-5,000 2.0 2.4 1.7 1-5,000 1.3 1.5 1.3 1.6
5,001-10,000 0.8 1.0 0.7 5,001-10,000 0.4 0.3 0.5 0.4
20,001-30,000 1.9 2.7 1.3 20,001-30,000 0.5 0.5 0.5 0.3
30,001-50,000 0.9 1.6 0.3 30,001-50,000 0.5 1.4 0.4 0.3
50,001 and up 0.4 0.7 0.2 50,001 and up 0.3 0.6 0.2 0.2
No response 0.0 - 0.0 0.1
Average 22,199.0 23,189.7 20,703.7 Average 25,152.1 32,746.4 23,494.7 20,510.1
Median 18,000.0 24,000.0 12,000.0 Median 12,000.0 24,000.0 12,000.0 6,000.0
In Percent
In Percent
In Percent In Percent
In Percent
In Percent
Page 76
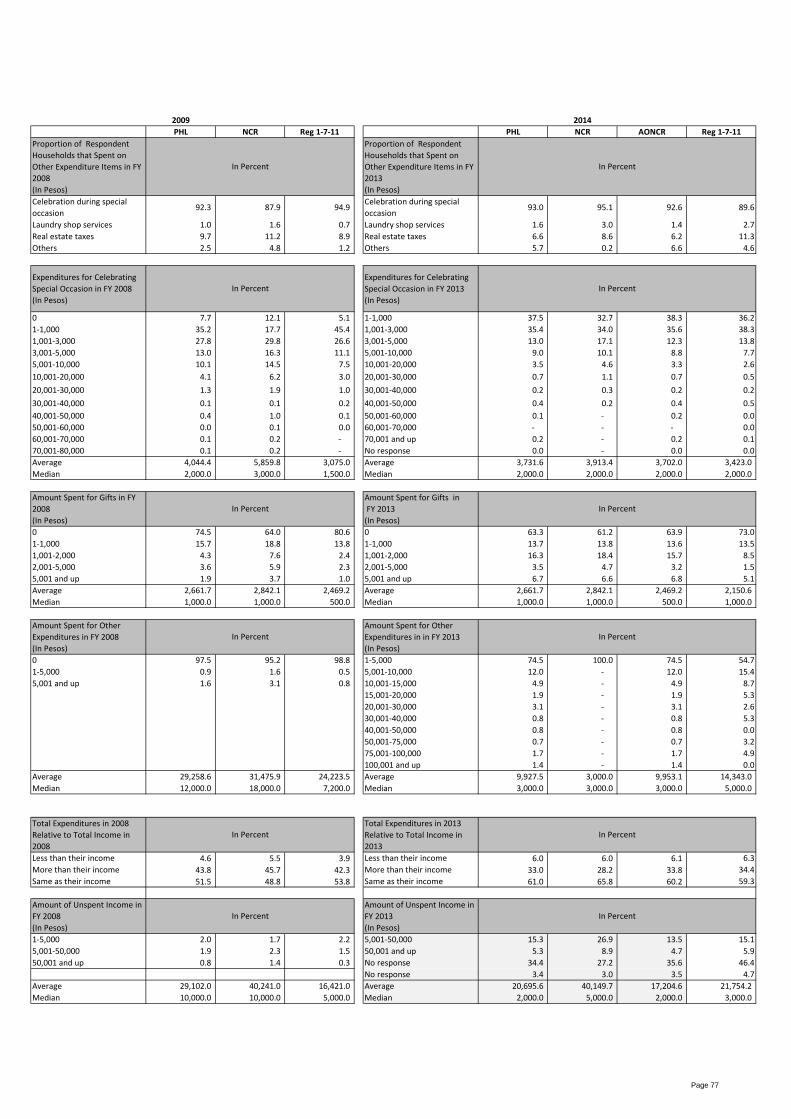
2009 2014
PHL NCR Reg 1-7-11 PHL NCR AONCR Reg 1-7-11
Proportion of Respondent
Households that Spent on
Other Expenditure Items in FY
2008
(In Pesos)
Proportion of Respondent
Households that Spent on
Other Expenditure Items in FY
2013
(In Pesos)
Celebration during special
occasion92.3 87.9 94.9
Celebration during special
occasion93.0 95.1 92.6 89.6
Laundry shop services 1.0 1.6 0.7 Laundry shop services 1.6 3.0 1.4 2.7
Real estate taxes 9.7 11.2 8.9 Real estate taxes 6.6 8.6 6.2 11.3
Others 2.5 4.8 1.2 Others 5.7 0.2 6.6 4.6
Expenditures for Celebrating
Special Occasion in FY 2008
(In Pesos)
Expenditures for Celebrating
Special Occasion in FY 2013
(In Pesos)
0 7.7 12.1 5.1 1-1,000 37.5 32.7 38.3 36.2
1-1,000 35.2 17.7 45.4 1,001-3,000 35.4 34.0 35.6 38.3
1,001-3,000 27.8 29.8 26.6 3,001-5,000 13.0 17.1 12.3 13.8
3,001-5,000 13.0 16.3 11.1 5,001-10,000 9.0 10.1 8.8 7.7
5,001-10,000 10.1 14.5 7.5 10,001-20,000 3.5 4.6 3.3 2.6
10,001-20,000 4.1 6.2 3.0 20,001-30,000 0.7 1.1 0.7 0.5
20,001-30,000 1.3 1.9 1.0 30,001-40,000 0.2 0.3 0.2 0.2
30,001-40,000 0.1 0.1 0.2 40,001-50,000 0.4 0.2 0.4 0.5
40,001-50,000 0.4 1.0 0.1 50,001-60,000 0.1 - 0.2 0.0
50,001-60,000 0.0 0.1 0.0 60,001-70,000 - - - 0.0
60,001-70,000 0.1 0.2 - 70,001 and up 0.2 - 0.2 0.1
70,001-80,000 0.1 0.2 - No response 0.0 - 0.0 0.0
Average 4,044.4 5,859.8 3,075.0 Average 3,731.6 3,913.4 3,702.0 3,423.0
Median 2,000.0 3,000.0 1,500.0 Median 2,000.0 2,000.0 2,000.0 2,000.0
Amount Spent for Gifts in FY
2008
(In Pesos)
Amount Spent for Gifts in
FY 2013
(In Pesos)
0 74.5 64.0 80.6 0 63.3 61.2 63.9 73.0
1-1,000 15.7 18.8 13.8 1-1,000 13.7 13.8 13.6 13.5
1,001-2,000 4.3 7.6 2.4 1,001-2,000 16.3 18.4 15.7 8.5
2,001-5,000 3.6 5.9 2.3 2,001-5,000 3.5 4.7 3.2 1.5
5,001 and up 1.9 3.7 1.0 5,001 and up 6.7 6.6 6.8 5.1
Average 2,661.7 2,842.1 2,469.2 Average 2,661.7 2,842.1 2,469.2 2,150.6
Median 1,000.0 1,000.0 500.0 Median 1,000.0 1,000.0 500.0 1,000.0
Amount Spent for Other
Expenditures in FY 2008
(In Pesos)
Amount Spent for Other
Expenditures in in FY 2013
(In Pesos)
0 97.5 95.2 98.8 1-5,000 74.5 100.0 74.5 54.7
1-5,000 0.9 1.6 0.5 5,001-10,000 12.0 - 12.0 15.4
5,001 and up 1.6 3.1 0.8 10,001-15,000 4.9 - 4.9 8.7
15,001-20,000 1.9 - 1.9 5.3
20,001-30,000 3.1 - 3.1 2.6
30,001-40,000 0.8 - 0.8 5.3
40,001-50,000 0.8 - 0.8 0.0
50,001-75,000 0.7 - 0.7 3.2
75,001-100,000 1.7 - 1.7 4.9
100,001 and up 1.4 - 1.4 0.0
Average 29,258.6 31,475.9 24,223.5 Average 9,927.5 3,000.0 9,953.1 14,343.0
Median 12,000.0 18,000.0 7,200.0 Median 3,000.0 3,000.0 3,000.0 5,000.0
Total Expenditures in 2008
Relative to Total Income in
2008
Total Expenditures in 2013
Relative to Total Income in
2013
Less than their income 4.6 5.5 3.9 Less than their income 6.0 6.0 6.1 6.3
More than their income 43.8 45.7 42.3 More than their income 33.0 28.2 33.8 34.4
Same as their income 51.5 48.8 53.8 Same as their income 61.0 65.8 60.2 59.3
Amount of Unspent Income in
FY 2008
(In Pesos)
Amount of Unspent Income in
FY 2013
(In Pesos)
1-5,000 2.0 1.7 2.2 5,001-50,000 15.3 26.9 13.5 15.1
5,001-50,000 1.9 2.3 1.5 50,001 and up 5.3 8.9 4.7 5.9
50,001 and up 0.8 1.4 0.3 No response 34.4 27.2 35.6 46.4
No response 3.4 3.0 3.5 4.7
Average 29,102.0 40,241.0 16,421.0 Average 20,695.6 40,149.7 17,204.6 21,754.2
Median 10,000.0 10,000.0 5,000.0 Median 2,000.0 5,000.0 2,000.0 3,000.0
In Percent
In Percent
In Percent
In Percent
In Percent
In Percent
In Percent
In Percent
In Percent
In Percent
In Percent
In Percent
Page 77
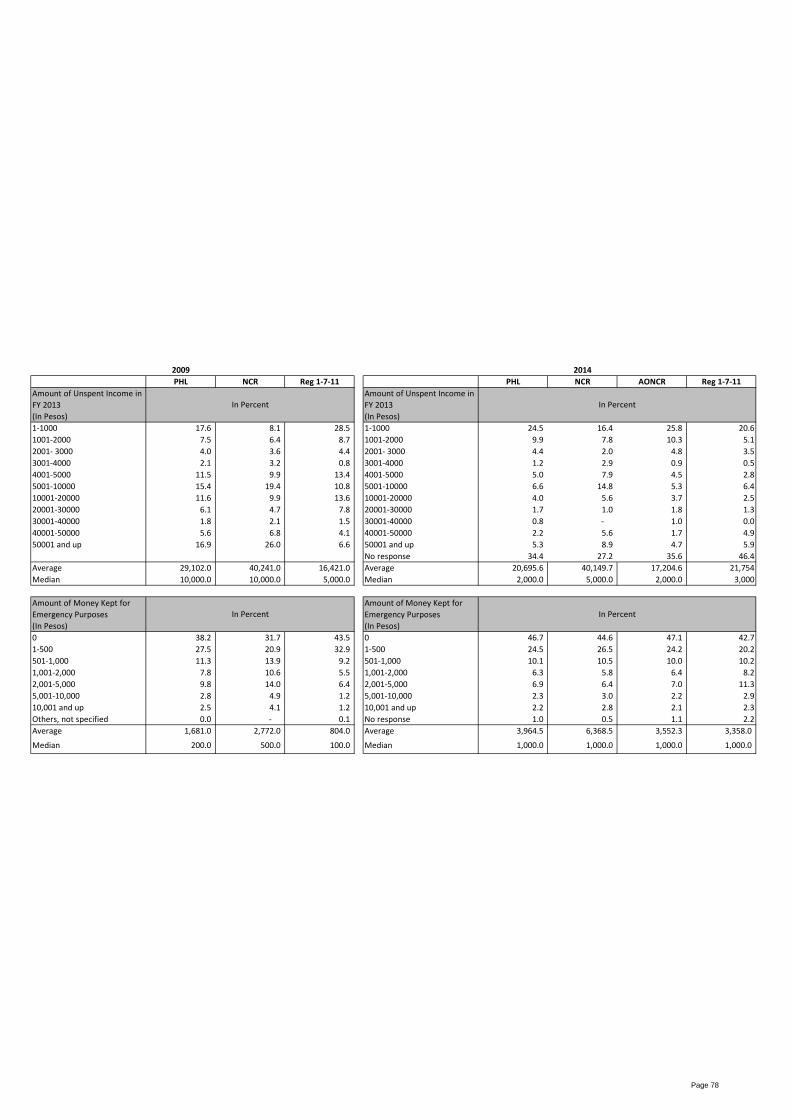
2009 2014
PHL NCR Reg 1-7-11 PHL NCR AONCR Reg 1-7-11
Amount of Unspent Income in
FY 2013
(In Pesos)
Amount of Unspent Income in
FY 2013
(In Pesos)
1-1000 17.6 8.1 28.5 1-1000 24.5 16.4 25.8 20.6
1001-2000 7.5 6.4 8.7 1001-2000 9.9 7.8 10.3 5.1
2001- 3000 4.0 3.6 4.4 2001- 3000 4.4 2.0 4.8 3.5
3001-4000 2.1 3.2 0.8 3001-4000 1.2 2.9 0.9 0.5
4001-5000 11.5 9.9 13.4 4001-5000 5.0 7.9 4.5 2.8
5001-10000 15.4 19.4 10.8 5001-10000 6.6 14.8 5.3 6.4
10001-20000 11.6 9.9 13.6 10001-20000 4.0 5.6 3.7 2.5
20001-30000 6.1 4.7 7.8 20001-30000 1.7 1.0 1.8 1.3
30001-40000 1.8 2.1 1.5 30001-40000 0.8 - 1.0 0.0
40001-50000 5.6 6.8 4.1 40001-50000 2.2 5.6 1.7 4.9
50001 and up 16.9 26.0 6.6 50001 and up 5.3 8.9 4.7 5.9
No response 34.4 27.2 35.6 46.4
Average 29,102.0 40,241.0 16,421.0 Average 20,695.6 40,149.7 17,204.6 21,754
Median 10,000.0 10,000.0 5,000.0 Median 2,000.0 5,000.0 2,000.0 3,000
Amount of Money Kept for
Emergency Purposes
(In Pesos)
Amount of Money Kept for
Emergency Purposes
(In Pesos)
0 38.2 31.7 43.5 0 46.7 44.6 47.1 42.7
1-500 27.5 20.9 32.9 1-500 24.5 26.5 24.2 20.2
501-1,000 11.3 13.9 9.2 501-1,000 10.1 10.5 10.0 10.2
1,001-2,000 7.8 10.6 5.5 1,001-2,000 6.3 5.8 6.4 8.2
2,001-5,000 9.8 14.0 6.4 2,001-5,000 6.9 6.4 7.0 11.3
5,001-10,000 2.8 4.9 1.2 5,001-10,000 2.3 3.0 2.2 2.9
10,001 and up 2.5 4.1 1.2 10,001 and up 2.2 2.8 2.1 2.3
Others, not specified 0.0 - 0.1 No response 1.0 0.5 1.1 2.2
Average 1,681.0 2,772.0 804.0 Average 3,964.5 6,368.5 3,552.3 3,358.0
Median 200.0 500.0 100.0 Median 1,000.0 1,000.0 1,000.0 1,000.0
In Percent
In Percent In Percent
In Percent
Page 78
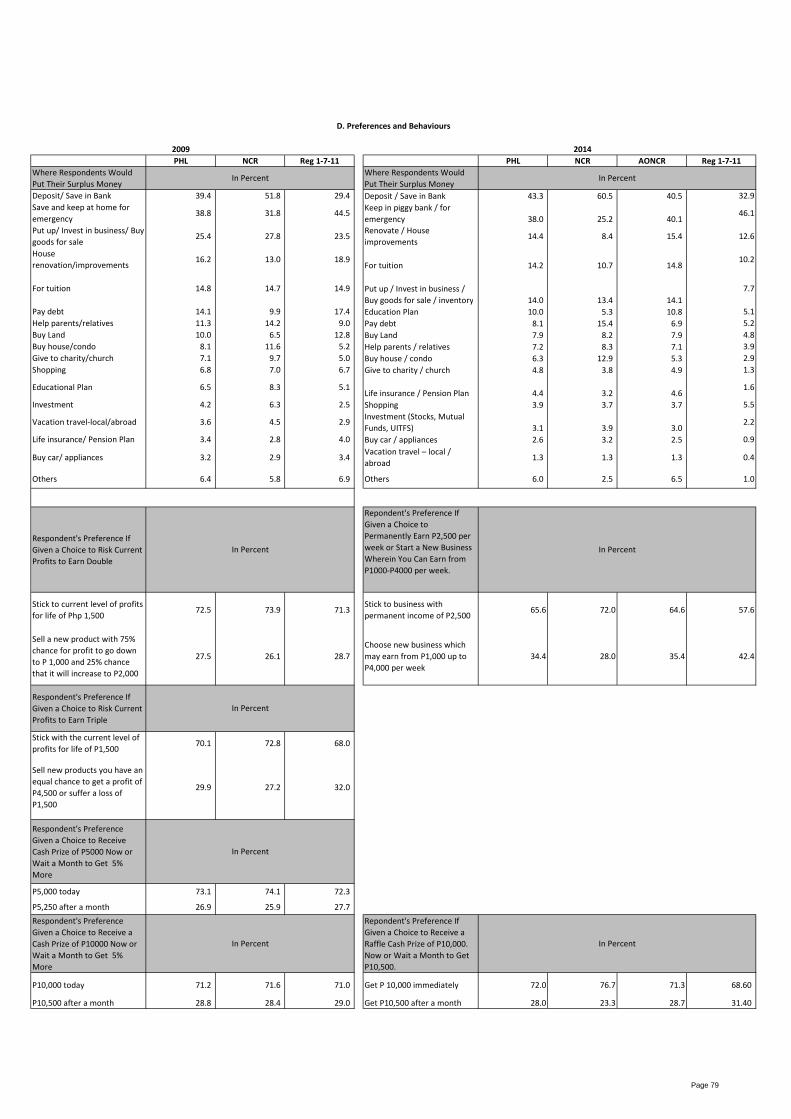
2009 2014
PHL NCR Reg 1-7-11 PHL NCR AONCR Reg 1-7-11
Where Respondents Would
Put Their Surplus Money
Where Respondents Would
Put Their Surplus Money
Deposit/ Save in Bank 39.4 51.8 29.4 Deposit / Save in Bank 43.3 60.5 40.5 32.9
Save and keep at home for
emergency38.8 31.8 44.5
Keep in piggy bank / for
emergency 38.0 25.2 40.146.1
Put up/ Invest in business/ Buy
goods for sale25.4 27.8 23.5
Renovate / House
improvements14.4 8.4 15.4 12.6
House
renovation/improvements16.2 13.0 18.9
For tuition 14.2 10.7 14.810.2
For tuition 14.8 14.7 14.9 Put up / Invest in business /
Buy goods for sale / inventory 14.0 13.4 14.1
7.7
Pay debt 14.1 9.9 17.4 Education Plan 10.0 5.3 10.8 5.1
Help parents/relatives 11.3 14.2 9.0 Pay debt 8.1 15.4 6.9 5.2
Buy Land 10.0 6.5 12.8 Buy Land 7.9 8.2 7.9 4.8
Buy house/condo 8.1 11.6 5.2 Help parents / relatives 7.2 8.3 7.1 3.9
Give to charity/church 7.1 9.7 5.0 Buy house / condo 6.3 12.9 5.3 2.9
Shopping 6.8 7.0 6.7 Give to charity / church 4.8 3.8 4.9 1.3
Educational Plan 6.5 8.3 5.1 Life insurance / Pension Plan 4.4 3.2 4.6
1.6
Investment 4.2 6.3 2.5 Shopping 3.9 3.7 3.7 5.5
Vacation travel-local/abroad 3.6 4.5 2.9 Investment (Stocks, Mutual
Funds, UITFS) 3.1 3.9 3.02.2
Life insurance/ Pension Plan 3.4 2.8 4.0 Buy car / appliances 2.6 3.2 2.5 0.9
Buy car/ appliances 3.2 2.9 3.4 Vacation travel – local /
abroad1.3 1.3 1.3 0.4
Others 6.4 5.8 6.9 Others 6.0 2.5 6.5 1.0
Respondent's Preference If
Given a Choice to Risk Current
Profits to Earn Double
Repondent's Preference If
Given a Choice to
Permanently Earn P2,500 per
week or Start a New Business
Wherein You Can Earn from
P1000-P4000 per week.
Stick to current level of profits
for life of Php 1,50072.5 73.9 71.3
Stick to business with
permanent income of P2,50065.6 72.0 64.6 57.6
Sell a new product with 75%
chance for profit to go down
to P 1,000 and 25% chance
that it will increase to P2,000
27.5 26.1 28.7
Choose new business which
may earn from P1,000 up to
P4,000 per week
34.4 28.0 35.4 42.4
Respondent's Preference If
Given a Choice to Risk Current
Profits to Earn Triple
Stick with the current level of
profits for life of P1,50070.1 72.8 68.0
Sell new products you have an
equal chance to get a profit of
P4,500 or suffer a loss of
P1,500
29.9 27.2 32.0
Respondent's Preference
Given a Choice to Receive
Cash Prize of P5000 Now or
Wait a Month to Get 5%
More
P5,000 today 73.1 74.1 72.3
P5,250 after a month 26.9 25.9 27.7
Respondent's Preference
Given a Choice to Receive a
Cash Prize of P10000 Now or
Wait a Month to Get 5%
More
Repondent's Preference If
Given a Choice to Receive a
Raffle Cash Prize of P10,000.
Now or Wait a Month to Get
P10,500.
P10,000 today 71.2 71.6 71.0 Get P 10,000 immediately 72.0 76.7 71.3 68.60
P10,500 after a month 28.8 28.4 29.0 Get P10,500 after a month 28.0 23.3 28.7 31.40
In Percent
In Percent
In Percent
In PercentIn Percent
In PercentIn Percent
In Percent
D. Preferences and Behaviours
Page 79
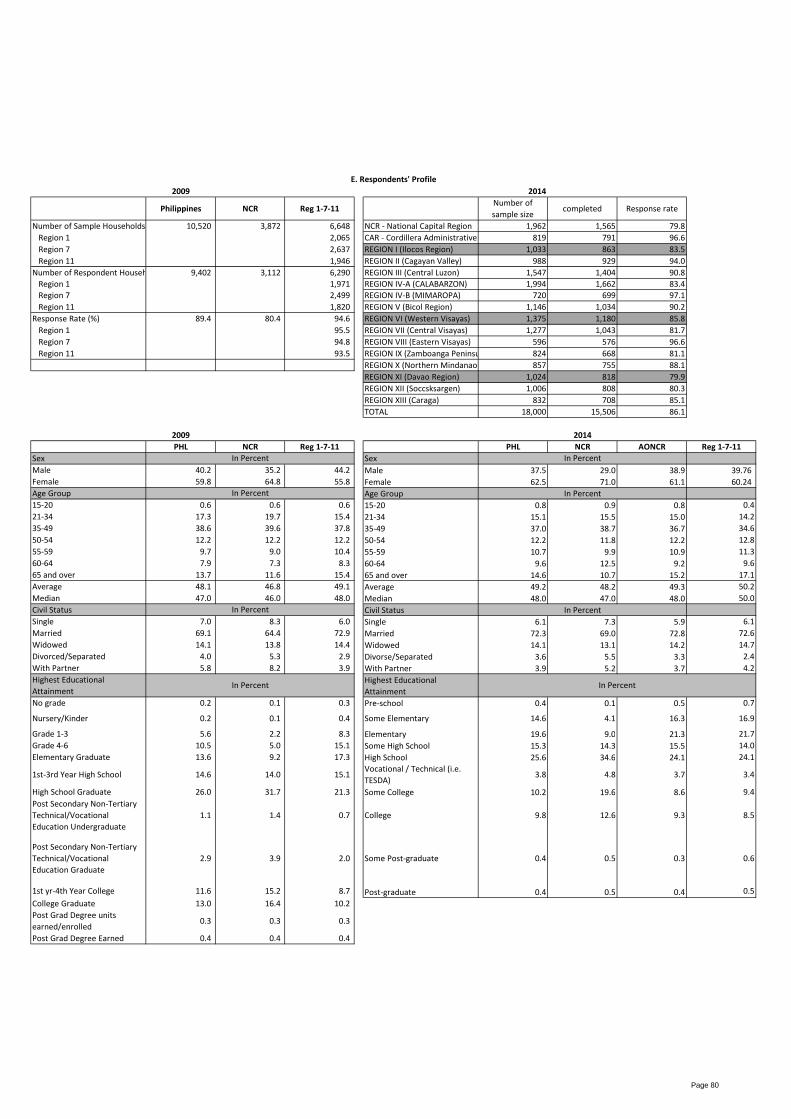
2009 2014
Philippines NCR Reg 1-7-11Number of
sample sizecompleted Response rate
Number of Sample Households 10,520 3,872 6,648 NCR - National Capital Region 1,962 1,565 79.8
Region 1 2,065 CAR - Cordillera Administrative Region 819 791 96.6
Region 7 2,637 REGION I (Ilocos Region) 1,033 863 83.5
Region 11 1,946 REGION II (Cagayan Valley) 988 929 94.0
Number of Respondent Households 9,402 3,112 6,290 REGION III (Central Luzon) 1,547 1,404 90.8
Region 1 1,971 REGION IV-A (CALABARZON) 1,994 1,662 83.4
Region 7 2,499 REGION IV-B (MIMAROPA) 720 699 97.1
Region 11 1,820 REGION V (Bicol Region) 1,146 1,034 90.2
Response Rate (%) 89.4 80.4 94.6 REGION VI (Western Visayas) 1,375 1,180 85.8
Region 1 95.5 REGION VII (Central Visayas) 1,277 1,043 81.7
Region 7 94.8 REGION VIII (Eastern Visayas) 596 576 96.6
Region 11 93.5 REGION IX (Zamboanga Peninsula) 824 668 81.1
REGION X (Northern Mindanao) 857 755 88.1
REGION XI (Davao Region) 1,024 818 79.9
REGION XII (Soccsksargen) 1,006 808 80.3
REGION XIII (Caraga) 832 708 85.1
TOTAL 18,000 15,506 86.1
2009 2014
PHL NCR Reg 1-7-11 PHL NCR AONCR Reg 1-7-11
Sex Sex
Male 40.2 35.2 44.2 Male 37.5 29.0 38.9 39.76
Female 59.8 64.8 55.8 Female 62.5 71.0 61.1 60.24
Age Group Age Group
15-20 0.6 0.6 0.6 15-20 0.8 0.9 0.8 0.4
21-34 17.3 19.7 15.4 21-34 15.1 15.5 15.0 14.2
35-49 38.6 39.6 37.8 35-49 37.0 38.7 36.7 34.6
50-54 12.2 12.2 12.2 50-54 12.2 11.8 12.2 12.8
55-59 9.7 9.0 10.4 55-59 10.7 9.9 10.9 11.3
60-64 7.9 7.3 8.3 60-64 9.6 12.5 9.2 9.6
65 and over 13.7 11.6 15.4 65 and over 14.6 10.7 15.2 17.1
Average 48.1 46.8 49.1 Average 49.2 48.2 49.3 50.2
Median 47.0 46.0 48.0 Median 48.0 47.0 48.0 50.0
Civil Status Civil Status
Single 7.0 8.3 6.0 Single 6.1 7.3 5.9 6.1
Married 69.1 64.4 72.9 Married 72.3 69.0 72.8 72.6
Widowed 14.1 13.8 14.4 Widowed 14.1 13.1 14.2 14.7
Divorced/Separated 4.0 5.3 2.9 Divorse/Separated 3.6 5.5 3.3 2.4
With Partner 5.8 8.2 3.9 With Partner 3.9 5.2 3.7 4.2
Highest Educational
Attainment
Highest Educational
Attainment
No grade 0.2 0.1 0.3 Pre-school 0.4 0.1 0.5 0.7
Nursery/Kinder 0.2 0.1 0.4 Some Elementary 14.6 4.1 16.3 16.9
Grade 1-3 5.6 2.2 8.3 Elementary 19.6 9.0 21.3 21.7
Grade 4-6 10.5 5.0 15.1 Some High School 15.3 14.3 15.5 14.0
Elementary Graduate 13.6 9.2 17.3 High School 25.6 34.6 24.1 24.1
1st-3rd Year High School 14.6 14.0 15.1 Vocational / Technical (i.e.
TESDA)3.8 4.8 3.7 3.4
High School Graduate 26.0 31.7 21.3 Some College 10.2 19.6 8.6 9.4
Post Secondary Non-Tertiary
Technical/Vocational
Education Undergraduate
1.1 1.4 0.7 College 9.8 12.6 9.3 8.5
Post Secondary Non-Tertiary
Technical/Vocational
Education Graduate
2.9 3.9 2.0 Some Post-graduate 0.4 0.5 0.3 0.6
1st yr-4th Year College 11.6 15.2 8.7 Post-graduate 0.4 0.5 0.4 0.5
College Graduate 13.0 16.4 10.2
Post Grad Degree units
earned/enrolled0.3 0.3 0.3
Post Grad Degree Earned 0.4 0.4 0.4
E. Respondents' Profile
In Percent
In Percent
In Percent
In Percent
In Percent
In Percent
In Percent
In Percent
Page 80