
PROVIDING LOW-CARBON ELECTRICITY SOLUTIONS TO BRAZIL
André SALGADOAREVA South America Director
Conference LAS/ANS – Thursday, 22nd of June 2016
2016 LAS/ANS SYMPOSIUM 2
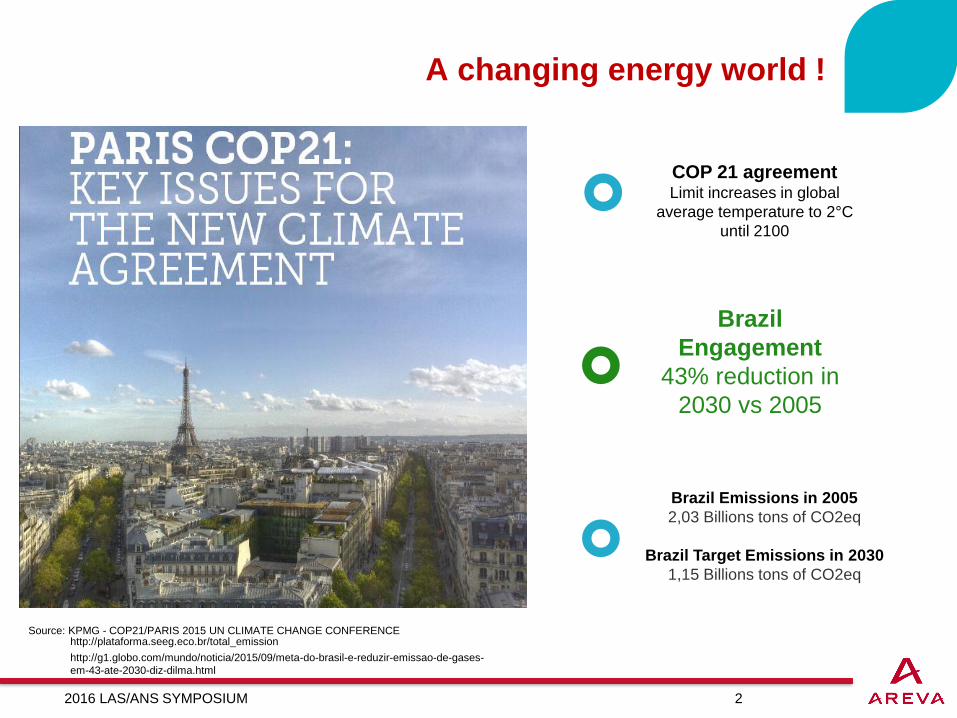
COP 21 agreementLimit increases in global
average temperature to 2°C
until 2100
A changing energy world !
Brazil
Engagement
43% reduction in
2030 vs 2005
Brazil Emissions in 2005
2,03 Billions tons of CO2eq
Brazil Target Emissions in 2030
1,15 Billions tons of CO2eq
Source: KPMG - COP21/PARIS 2015 UN CLIMATE CHANGE CONFERENCE
http://g1.globo.com/mundo/noticia/2015/09/meta-do-brasil-e-reduzir-emissao-de-gases-
em-43-ate-2030-diz-dilma.html
http://plataforma.seeg.eco.br/total_emission

2016 LAS/ANS SYMPOSIUM 3
Challenge
Electricity demand will double until 2030
TWh
Source: MME
Share of the
Renewable
sources
Non RenewablesRenewables
2016 LAS/ANS SYMPOSIUM 4
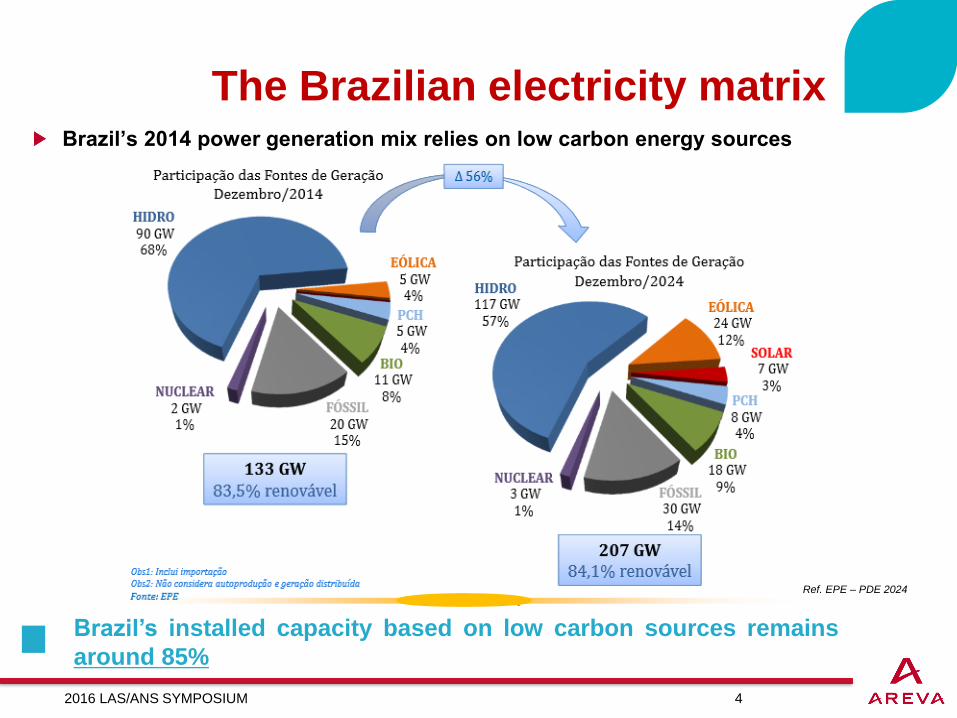
The Brazilian electricity matrixBrazil’s 2014 power generation mix relies on low carbon energy sources
Ref. EPE – PDE 2024
Brazil’s installed capacity based on low carbon sources remains
around 85%

2016 LAS/ANS SYMPOSIUM 5
NeverthelessThe Brazilian energy mix profile is transforming
Source. Data consolidated from EPE, MME
What does it imply:
Brazil energy matrix profile
Shows the reduction of the storage capacity,
Possibility of larger intermittence (mainly due to
wind and small hydro NPP),
Growing challenges in the operation and
dispatching of the national electrical system.
Difficulty to forecast water affluence,

2016 LAS/ANS SYMPOSIUM 6
Situation of the Brazilian Energy Matrix concerning CO2 emissions in 2015
Electricity production in 2015 (GWh)
Increased participation of thermal power plants were based on CO2
emitting sources.
Source: Consolidated data from MME, EPE

2016 LAS/ANS SYMPOSIUM 7
Hydro-energetic conditions between 2010 and 2015
Source: ONS - Gesel
The country had no choice but to turn-on its back-up thermal plants to avoid
energy shortage. But at which costs ?
Minimum
value:
15,8% (nov/14 and Jan/15)
Rigorous hydroenergetic
conditions during the rainy period
2013-2014 and 2014-2015
Full dispatching of thermal
generation was kept as part of the
prioritization policy to keep the
storage of the plants with large
storage capacity
From august-15, due to the better conditions
between february to july and with a forecast of a
normal dry season, the decreasing of ThG
dispatching has been decided.
2016 LAS/ANS SYMPOSIUM 8
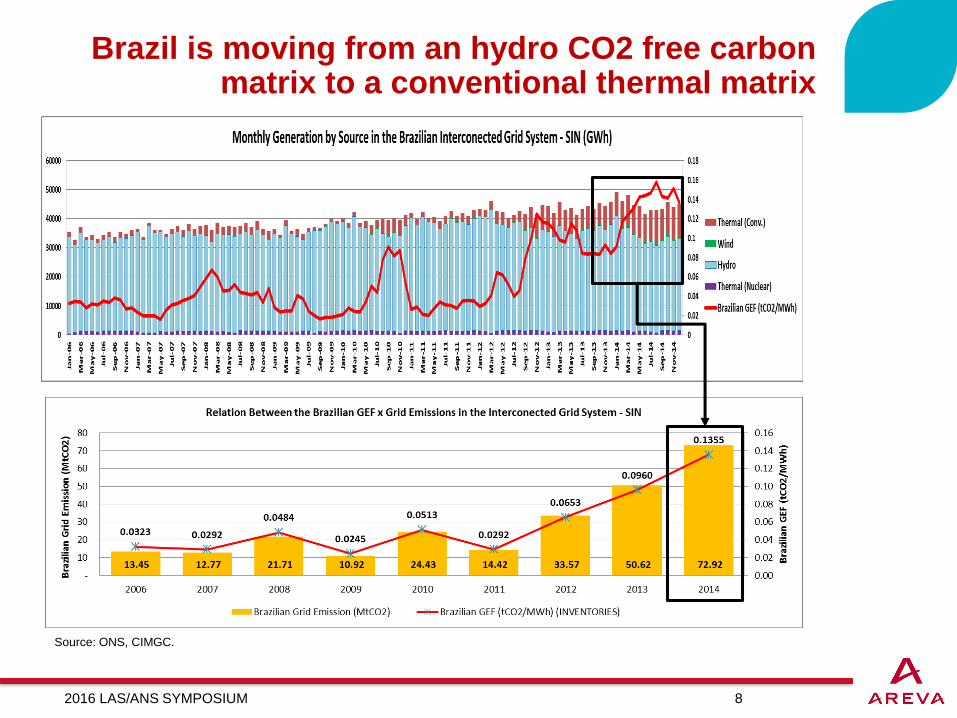
Source: ONS, CIMGC.
Brazil is moving from an hydro CO2 free carbon matrix to a conventional thermal matrix

2016 LAS/ANS SYMPOSIUM 9
…translated into a very high costs for the industry and population
Operation of the Thermal plants in the short term
Availability of thermal generation in MWmed
Thermal generation of the SIN
Source: ONS - FIRJAN
In 2015, Brazil was ranked as the country with the highest electricity cost
for the industry. Above India, Italy and Colombia.

2016 LAS/ANS SYMPOSIUM 10
What do we need ?
Generation Planning :
Security of supply
Afordable prices
Diversity
Distributed generation
(reduce transmission losses)
Low CO2 emissions
Fosters the Industrial and
Social development
2016 LAS/ANS SYMPOSIUM 11
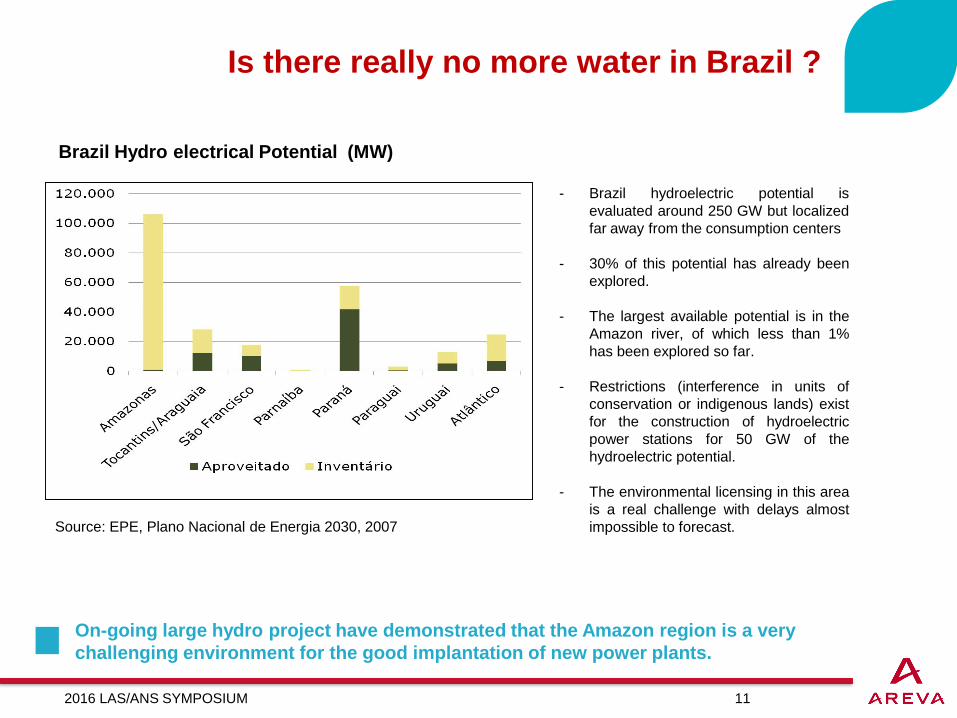
Is there really no more water in Brazil ?
Brazil Hydro electrical Potential (MW)
- Brazil hydroelectric potential is
evaluated around 250 GW but localized
far away from the consumption centers
- 30% of this potential has already been
explored.
- The largest available potential is in the
Amazon river, of which less than 1%
has been explored so far.
- Restrictions (interference in units of
conservation or indigenous lands) exist
for the construction of hydroelectric
power stations for 50 GW of the
hydroelectric potential.
- The environmental licensing in this area
is a real challenge with delays almost
impossible to forecast.Source: EPE, Plano Nacional de Energia 2030, 2007
On-going large hydro project have demonstrated that the Amazon region is a very
challenging environment for the good implantation of new power plants.

2016 LAS/ANS SYMPOSIUM 12
0
50
100
150
200
250
0 3 6 9 12 15 18 21 24
Low carbon Thermal solutionssupporting hydro based model
Stock (% of the monthly production)
Hydro Production
Demand
Total production
BRAZIL POWER GROWTHThermal to support electricity demand raise
Expansion challenge by 2024:
Forecast of additional 7,3 GW of new installed capacity per year.
Wind/Solar: Additional 26 GW until 2024;
Biomass: 7GW of new capacity in biomass projects to produce electricity by 2024.
Fossil: 10GW additional capacity;
Nuclear energy: Additional 1,4 GW (Angra 3);
0
50
100
150
200
250
0 3 6 9 12 15 18 21 24
En
erg
y S
cale
(G
Wh
-arb
itra
ry
scale
)
Months
Hydro based model
Stock (% of the monthly production)Hydro ProductionDemand
Demand covered by hydro
0
50
100
150
200
250
0 3 6 9 12 15 18 21 24
Hydro based model with drought
Stock (% of the monthly production)
Hydro Production
Demand
Demand covered by hydro Demand Covered by Hydro
Demand covered by thermal
Drought impactDemand covered by other
sources

2016 LAS/ANS SYMPOSIUM 13
What are Brazil thermal options to maintain low GHG emissions development ?
NUCLEAR
Uranium
12 gC02eq/kWh
GAS
Gas
490 gC02eq/kWh
OIL
Oil
733 gC02eq/kWh
COAL
Lignite
820 gC02eq/kWh
Cane Bagasse
BIO-
ENERGY
Tops and leaves
230 gC02eq/kWh
2016 LAS/ANS SYMPOSIUM 14
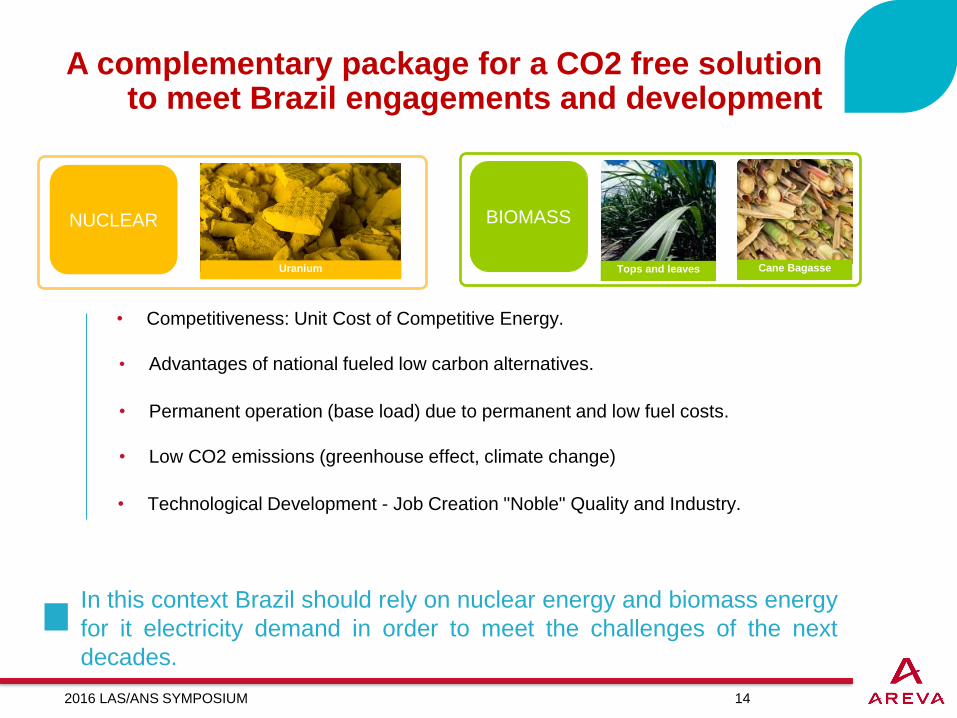
A complementary package for a CO2 free solution to meet Brazil engagements and development
Cane Bagasse
BIOMASS
Tops and leaves
NUCLEAR
Uranium
In this context Brazil should rely on nuclear energy and biomass energy
for it electricity demand in order to meet the challenges of the next
decades.
• Advantages of national fueled low carbon alternatives.
• Competitiveness: Unit Cost of Competitive Energy.
• Permanent operation (base load) due to permanent and low fuel costs.
• Low CO2 emissions (greenhouse effect, climate change)
• Technological Development - Job Creation "Noble" Quality and Industry.
2016 LAS/ANS SYMPOSIUM 15
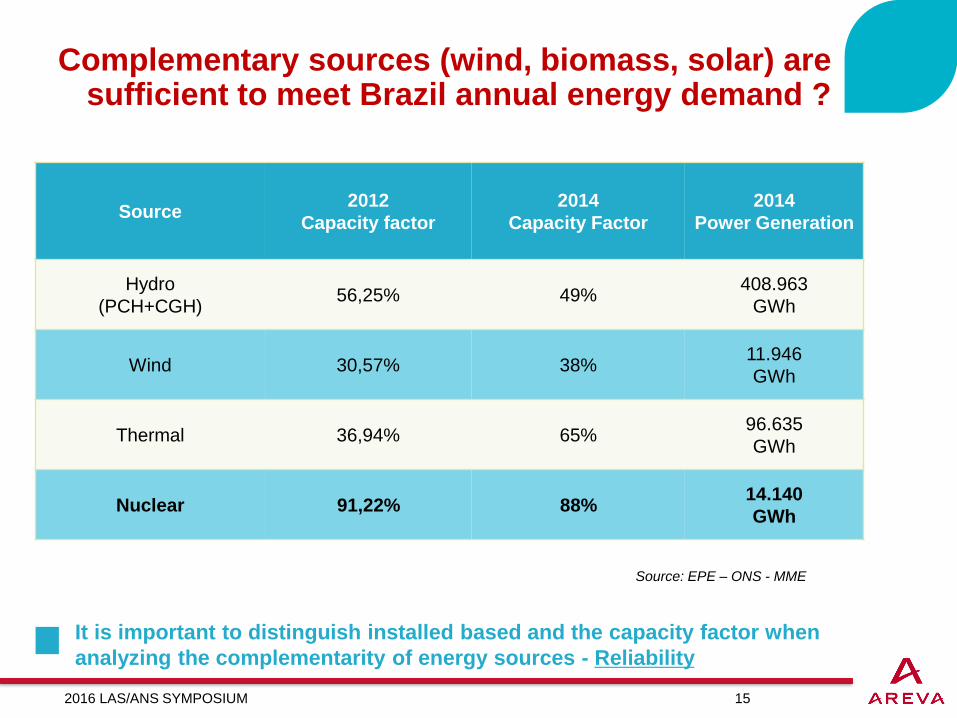
Source2012
Capacity factor
2014
Capacity Factor
2014
Power Generation
Hydro
(PCH+CGH)56,25% 49%
408.963
GWh
Wind 30,57% 38%11.946
GWh
Thermal 36,94% 65%96.635
GWh
Nuclear 91,22% 88%14.140
GWh
Complementary sources (wind, biomass, solar) are sufficient to meet Brazil annual energy demand ?
Source: EPE – ONS - MME
It is important to distinguish installed based and the capacity factor when
analyzing the complementarity of energy sources - Reliability

2016 LAS/ANS SYMPOSIUM 16
Part of the response could be find from an environmental approach…
It is clear that nuclear energy compared to other thermal options has
the lowest environmental impact if not zero impact.

2016 LAS/ANS SYMPOSIUM 17
Another part of the response from an cost approach…
In this context, the energy produced by nuclear power stations would be
competitive and continuous on the long term, balancing the offer to the market.
Source: XERFI – Nuclear Groups – World 2016

2016 LAS/ANS SYMPOSIUM 18
Nuclear power contributes to low price of electricity
Affordable Prices

2016 LAS/ANS SYMPOSIUM 19
Nuclear fuel costs are stable and predictable, over 60 years
Low Dependence on Fuel Prices
2016 LAS/ANS SYMPOSIUM 20
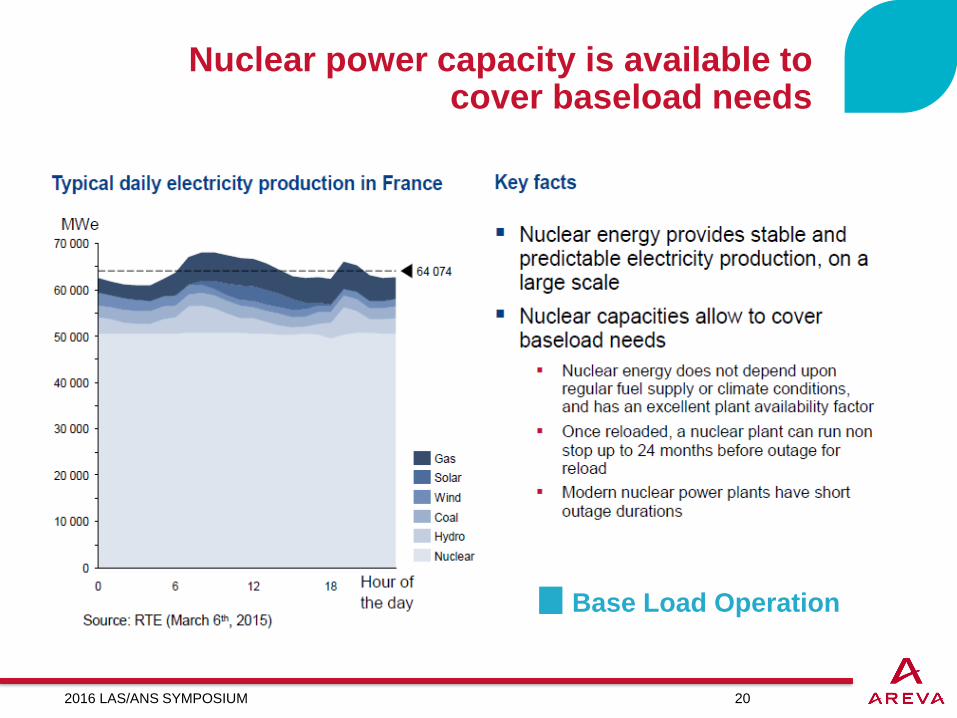
Nuclear power capacity is available to cover baseload needs
Base Load Operation

2016 LAS/ANS SYMPOSIUM 21
Nuclear energy contributes to security of supply
Security of Supply

2016 LAS/ANS SYMPOSIUM 22
Nuclear power contributes positively to the countryeconomic growth and balance of trade
Fosters Industrial and Social Development
2016 LAS/ANS SYMPOSIUM 23
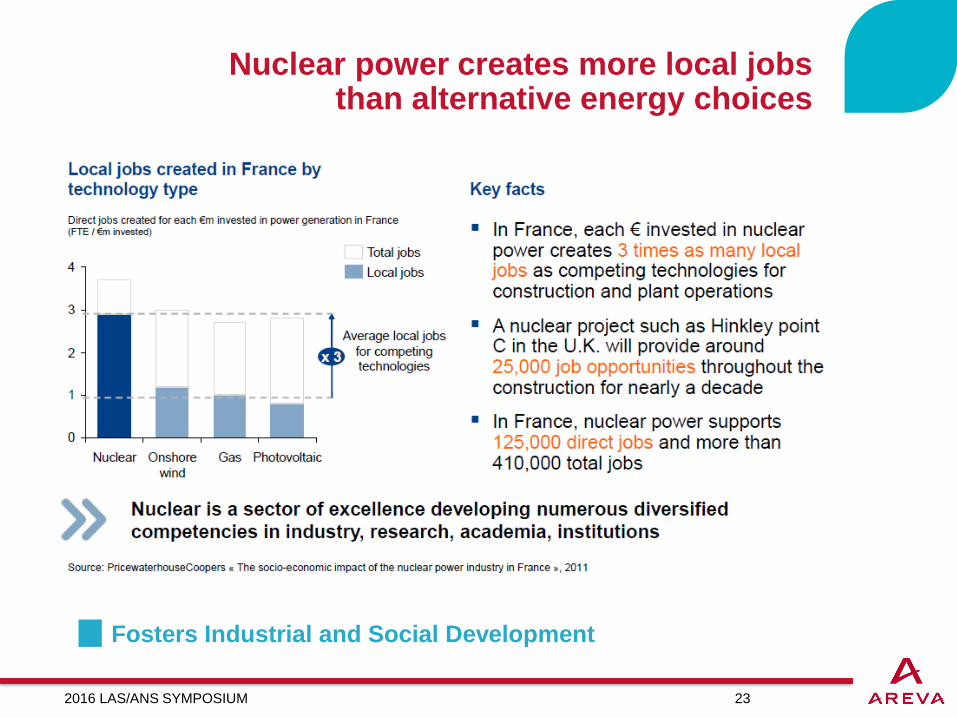
Nuclear power creates more local jobs than alternative energy choices
Fosters Industrial and Social Development

2016 LAS/ANS SYMPOSIUM 24
Nuclear brings high value at the country and local level…
A complete range of benefits for the
country Keys facts
A nuclear project in a country and in a
region has numerous benefits: Economic growth
Employment rise
Additional fiscal revenue
The high-technology know-how of
nuclear companies contributes to their
competitiveness in other
markets/businesses
Nuclear development includes also: Dynamic R&D
Strengthened specialized training
solutions development of related
infrastructures (road, railway, services)
Development of local services (schools,
sport equipment, accommodations)

2016 LAS/ANS SYMPOSIUM 25
Nuclear safety is driven by International Organizations, promoting the highest safety
standards
2016 LAS/ANS SYMPOSIUM 26
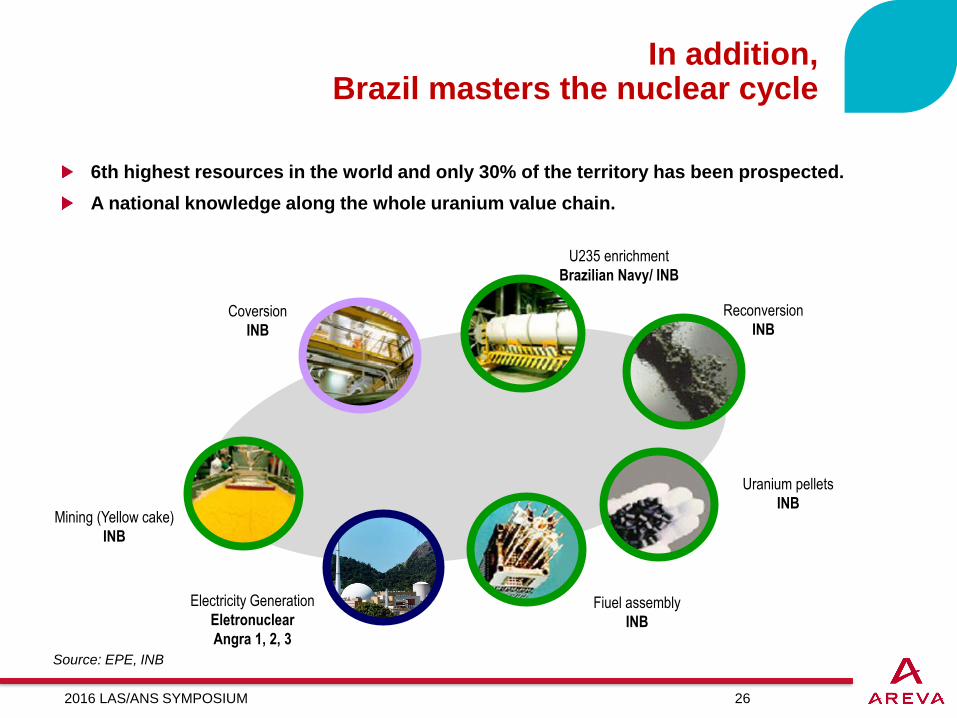
In addition, Brazil masters the nuclear cycle
Source: EPE, INB
6th highest resources in the world and only 30% of the territory has been prospected.
A national knowledge along the whole uranium value chain.
Coversion
INB
U235 enrichment
Brazilian Navy/ INB
Fiuel assembly
INB
Mining (Yellow cake)
INB
Reconversion
INB
Uranium pellets
INB
Electricity Generation
Eletronuclear
Angra 1, 2, 3

2016 LAS/ANS SYMPOSIUM 27
A portfolio of safe and high-performance Gen 3 reactors to better address utilities’ needs
Main
Technical Data
Thermal power
Net power
Thermal efficiency
Target design availability
Operation cycle length
Collective dose
Design service life
Number of loops
I&C
4,590 MWth
1,650 MWe
37%
92%
up to 24 months
<0.5 manSievert/yr
60 yrs
4
Full digital
3,150 MWth
1,100 MWe
37%
92%
up to 24 months
<0.5 manSievert/yr
60 yrs
3
Full digital
PWR PWR

2016 LAS/ANS SYMPOSIUM 28
AREVA Projects and Nuclear New builds Perspectives
The world continues to build Nuclear Plants – 66 NPPs Under Construction**4 EPR Reactor Units Under Construction.
Flamanville 3
Olkiluoto 3
Taishan 1&2
New Build under constructions
2016 LAS/ANS SYMPOSIUM 29
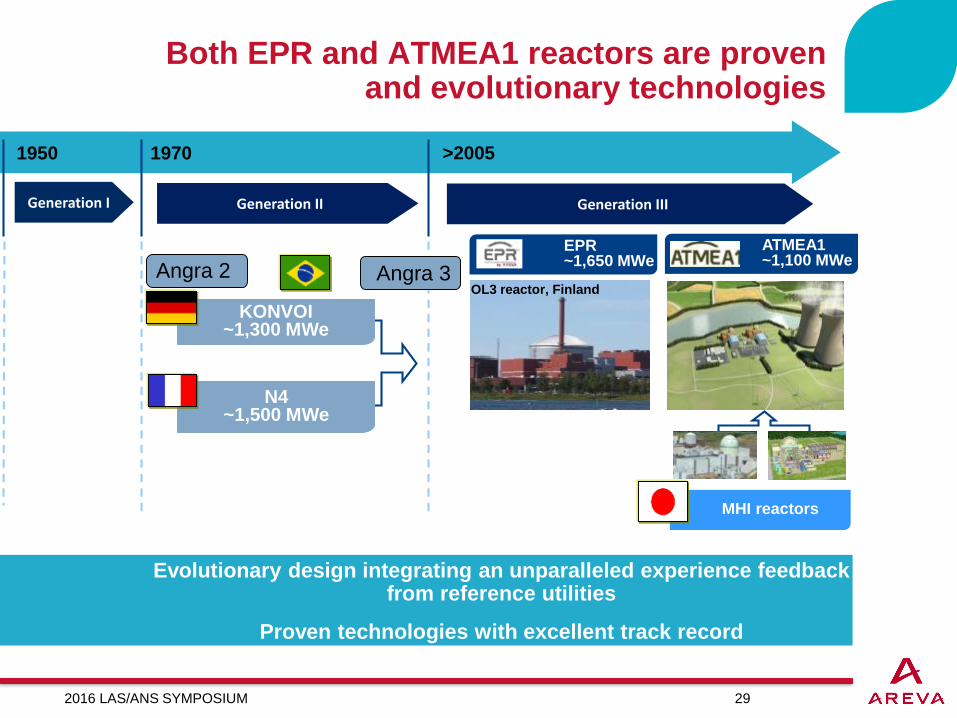
Generation IIIGeneration I Generation II
1950 1970 >2005
EPR~1,650 MWe
OL3 reactor, Finland
ATMEA1~1,100 MWe
MHI reactors
Evolutionary design integrating an unparalleled experience feedback from reference utilities
Proven technologies with excellent track record
Angra 2
KONVOI~1,300 MWe
N4~1,500 MWe
Both EPR and ATMEA1 reactors are proven and evolutionary technologies
Angra 3
2016 LAS/ANS SYMPOSIUM 30
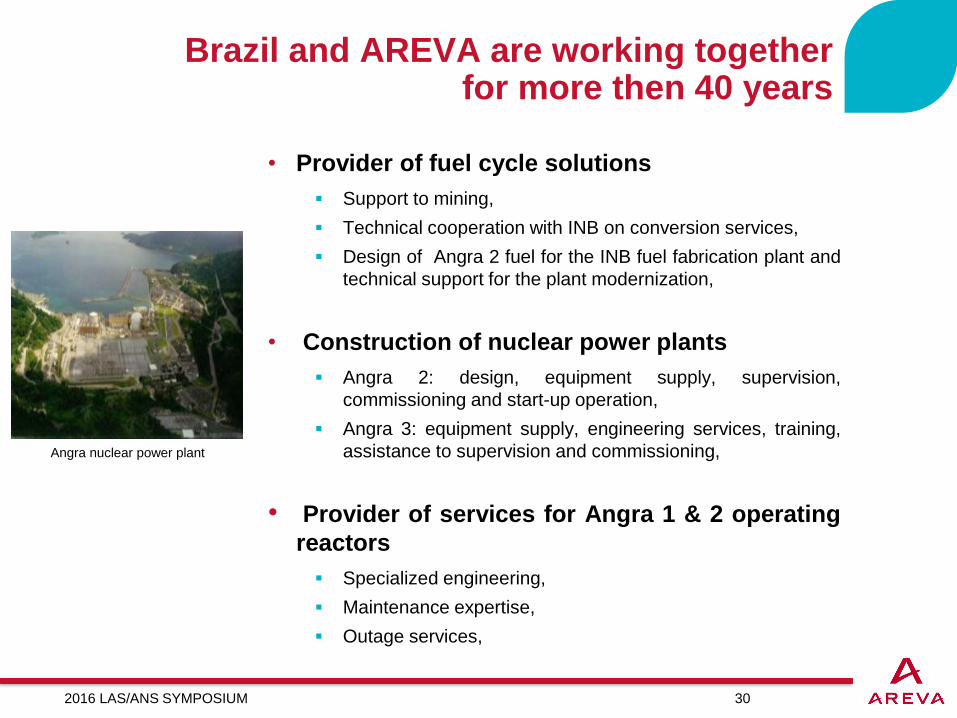
Brazil and AREVA are working together for more then 40 years
• Provider of fuel cycle solutions
Support to mining,
Technical cooperation with INB on conversion services,
Design of Angra 2 fuel for the INB fuel fabrication plant and
technical support for the plant modernization,
• Construction of nuclear power plants
Angra 2: design, equipment supply, supervision,
commissioning and start-up operation,
Angra 3: equipment supply, engineering services, training,
assistance to supervision and commissioning,
• Provider of services for Angra 1 & 2 operating
reactors
Specialized engineering,
Maintenance expertise,
Outage services,
Angra nuclear power plant

2016 LAS/ANS SYMPOSIUM 31
Real life experience : Brazil
Renewing a long-standing partnership
for greater self-reliance
1975
Fleet program for
8 reactors
NUCLEP : Heavy
component
manufacturing plant
construction
Fuel Fabrication
Technology Transfer
Joint companies
created for technology
transfers
Brazil starts
producing
Uranium2004
AREVA along with
NUCLEP manufactures
2 replacement steam
generators for ANGRA 1
1975
ST
AR
T
1976 20011980 1982
AREVA Track Record in Technology Transfer and Localization worldwide
1988
INB created for Mining.
Yellow cake and Fuel
production
2016 LAS/ANS SYMPOSIUM 32
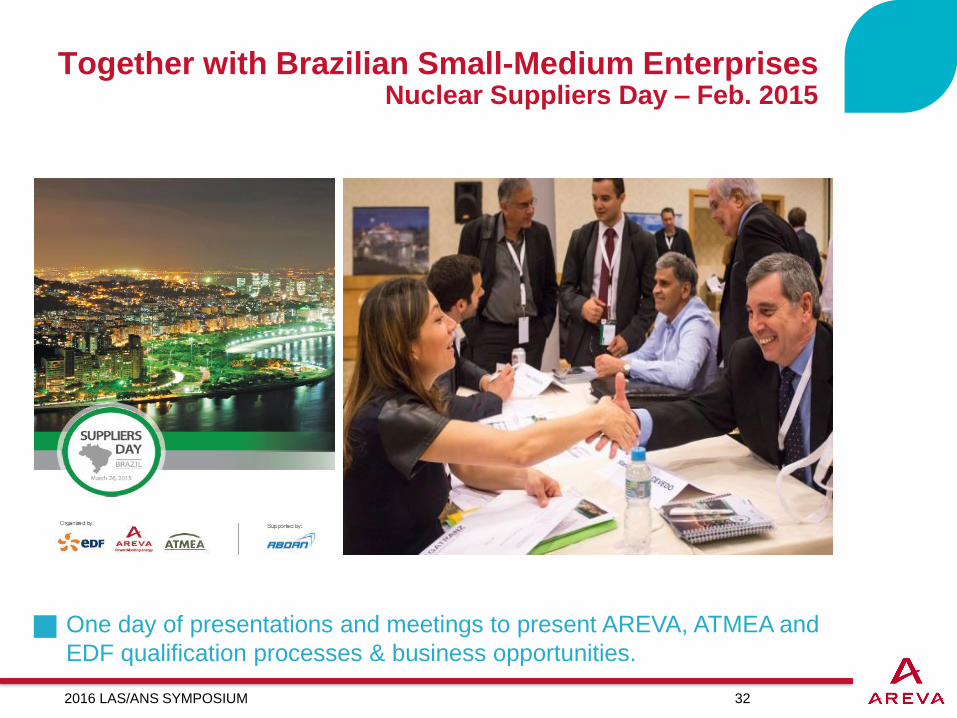
Together with Brazilian Small-Medium EnterprisesNuclear Suppliers Day – Feb. 2015
One day of presentations and meetings to present AREVA, ATMEA and
EDF qualification processes & business opportunities.

2016 LAS/ANS SYMPOSIUM 33
Supporting the Brazilian Nuclear programFrench Nuclear Pavillon at the INAC 2015
Presentation of France expertise and support to the Brazilian nuclear
program during the INAC 2015.

2016 LAS/ANS SYMPOSIUM 34
The importance of the Public Acceptanceand the education
MASTER CLASS ATMEA-UFRJ 23-26 de junio de 2015
MoU AREVA-COPPETEC19 de junio de 2015
In 2016
2 Brazilian students in
internship at AREVA and
ATMEA

2016 LAS/ANS SYMPOSIUM 35
Access to France’s experience in
stakeholder involvement and public
acceptance in nuclear
EDF and AREVA
nuclear sitesNuclear Power Plants under
constructionNuclear Power Plants in
operation
Advanced nuclear
research centers
Participation in the World
Nuclear Exhibition 2016
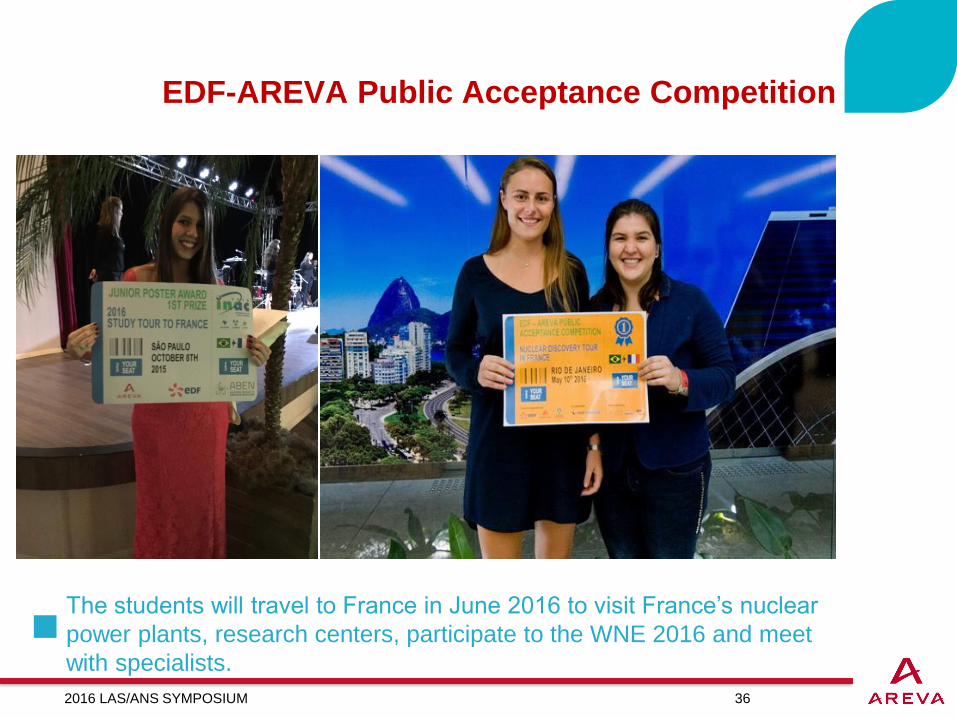
Competition that brought 100 students on the question of public acceptance in Brazil in partnership with the UFRJ, ABDAN, ABEN, FGV Energia and the SEEN student association.
The EDF-AREVA Public Acceptance Competition
2016 LAS/ANS SYMPOSIUM 36
EDF-AREVA Public Acceptance Competition
The students will travel to France in June 2016 to visit France’s nuclear
power plants, research centers, participate to the WNE 2016 and meet
with specialists.


