Download - PRIME Summer School_ Madrid_DPalomares

8/4/2019 PRIME Summer School_ Madrid_DPalomares
http://slidepdf.com/reader/full/prime-summer-school-madriddpalomares 1/18
INSTITUTE OF INNOVATION AND KNOWLEDGE MANAGEMENT – INGENIO (CSIC-UPV)
DAVINIA PALOMARES-MONTERO([email protected]
)ADELA GARCÍA-ARACIL([email protected]
)
http://www.ingenio.upv.es
PRIME Summer School onThe current challenges of European Higher Education.
Trends towards the University of the Future15th to 18th September 08, Madrid, Spain
TRADE-OFFS OF SPANISH PUBLIC UNIVERSITIESMISSIONS: TEACHING, RESEARCH AND “THIRD
MISSION”

8/4/2019 PRIME Summer School_ Madrid_DPalomares
http://slidepdf.com/reader/full/prime-summer-school-madriddpalomares 2/18
I N S T I T U T O D E G E S T I Ó N D E L A
I N N O V A C I Ó N Y D E L C O N O C I M I E N T O
2
SPANISH HIGHER EDUCATION SYSTEM.SPANISH HIGHER EDUCATION SYSTEM. Year foundation.Year foundation.

8/4/2019 PRIME Summer School_ Madrid_DPalomares
http://slidepdf.com/reader/full/prime-summer-school-madriddpalomares 3/18
I N S T I T U T O D E G E S T I Ó N D E L A
I N N O V A C I Ó N Y D E L C O N O C I M I E N T O
3
SPANISH HIGHER EDUCATION SYSTEM.SPANISH HIGHER EDUCATION SYSTEM. Trends of enrolled students.Trends of enrolled students.
0
250000
500000
750000
1000000
1250000
1500000
1750000
1994 1995 1996 1997 1998 1999 2000 2001 2002 2003 2004
Public Universities Private Universities All Universities

8/4/2019 PRIME Summer School_ Madrid_DPalomares
http://slidepdf.com/reader/full/prime-summer-school-madriddpalomares 4/18
I N S T I T U T
O D E G E S T I Ó N D E L A
I N N O V A C I Ó N Y D E L C
O N O C I M I E N T O
4
-10%
0%
10%
20%
30%
40%
50%
1994 1995 1996 1997 1998 1999 2000 2001 2002 2003 2004
Students Academic Tech&Adm
SPANISH HIGHER EDUCATION SYSTEM.SPANISH HIGHER EDUCATION SYSTEM. Variation of enrolled students and staff.Variation of enrolled students and staff.

8/4/2019 PRIME Summer School_ Madrid_DPalomares
http://slidepdf.com/reader/full/prime-summer-school-madriddpalomares 5/18
I N S T I T U T
O D E G E S T I Ó N D E L A
I N N O V A C I Ó N Y D E L C
O N O C I M I E N T O
5
SPANISH HIGHER EDUCATION SYSTEM.SPANISH HIGHER EDUCATION SYSTEM. Evolution of publications andEvolution of publications andacademic staff.academic staff.
0
10000
20000
30000
40000
50000
60000
70000
80000
90000
1994 1995 1996 1997 1998 1999 2000 2001 2002 2003 2004
0,00
0,05
0,10
0,15
0,20
0,25
0,30
Academic staff Publications Ratio
8/4/2019 PRIME Summer School_ Madrid_DPalomares
http://slidepdf.com/reader/full/prime-summer-school-madriddpalomares 6/18
I N S T I T U T
O D E G E S T I Ó N D E L A
I N N O V A C I Ó N Y D E L C
O N O C I M I E N T O
6
RESEARCH QUESTIONRESEARCH QUESTION
1. To assess the productivity and trade-off betweenteaching, research and knowledge transfer in Spanish
public universities from 2002 to 2004.
2. To analyze teaching, research and knowledgetransfer quality for showing how Spanish HigherEducation System is developing their missions.

8/4/2019 PRIME Summer School_ Madrid_DPalomares
http://slidepdf.com/reader/full/prime-summer-school-madriddpalomares 7/18
I N S T I T U T
O D E G E S T I Ó N D E L A
I N N O V A C I Ó N Y D E L C
O N O C I M I E N T O
7
1. PRODUCTIVITY ANALYSIS1. PRODUCTIVITY ANALYSIS
• Malmquist output-oriented productivity index to decompose the totalproductivity change into:
• technological (or technical) change
• technical efficiency change (which is formed by “pure” efficiencychange and “scale” efficiency change).
• We assume constant returns-to-scale to start with.
• Annual observations of 47 Spanish public universities (DMUs areuniversities).
• Studied period: 2002-2004.
METHODOLOGY
SOURCE OF DATA
• The data set used in productivity analysis was collected as part of theAQUAMETH project supported by the 6th FP.

8/4/2019 PRIME Summer School_ Madrid_DPalomares
http://slidepdf.com/reader/full/prime-summer-school-madriddpalomares 8/18
I N S T I T U T
O D E G E S T I Ó N D E L A
I N N O V A C I Ó N Y D E L C
O N O C I M I E N T O
8
• 3 OUTPUTS
- Graduate students (proxy to measure education)- Publications (proxy to measure research)- Applied research (€) (proxy to measure knowledge transfer)
• 3 INPUTS
– Total expenditure (€)
– Academic staff
– Technical & administrative staff
• 3 MODELS – “Teaching-model” (only graduates are included)
– “Research-model” (only publications are included)
– “Knowledge transfer-model” (only applied research is included)
1. PRODUCTIVITY ANALYSIS1. PRODUCTIVITY ANALYSIS
VARIABLES

8/4/2019 PRIME Summer School_ Madrid_DPalomares
http://slidepdf.com/reader/full/prime-summer-school-madriddpalomares 9/18
I N S T I T U T
O D E G E S T I Ó N D E L A
I N N O V A C I Ó N Y D E L C
O N O C I M I E N T O
9
1. PRODUCTIVITY ANALYSIS1. PRODUCTIVITY ANALYSIS
RESULTS (A)
Malmquist index productivity by year, 2002-2004.
3.220.8-6.6-8.5-14.53.6-4.00.77.27.9-5.6-4.1-0.9-0.7-1.6All
years
3.323.5-9.4-7.7-16.3-3.4-9.6-1.18.06.8-15.0-38.112.821.737.32004
12.933.3-6.7-9.3-15.39.3-4.04.78.913.9-6.06.5-6.2-6.0-11.82003
-5.76.9-3.8-8.4-11.85.21.9-1.34.63.35.133.6-8.0-14.4-21.32002
MPSPTEMPSPTEMPSPTE
Knowledge Transfer ModelResearch ModelTeaching ModelYear /index
M = productivity change over the period
E = technical efficiency change (catching-up)
PT = “pure” technical efficiency
S = scale efficiency
P = technological change (frontier shift)
8/4/2019 PRIME Summer School_ Madrid_DPalomares
http://slidepdf.com/reader/full/prime-summer-school-madriddpalomares 10/18
I N S T I T U T
O D E G E S T I Ó N D E L A
I N N O V A C I Ó N Y D E L C
O N O C I M I E N T O
10
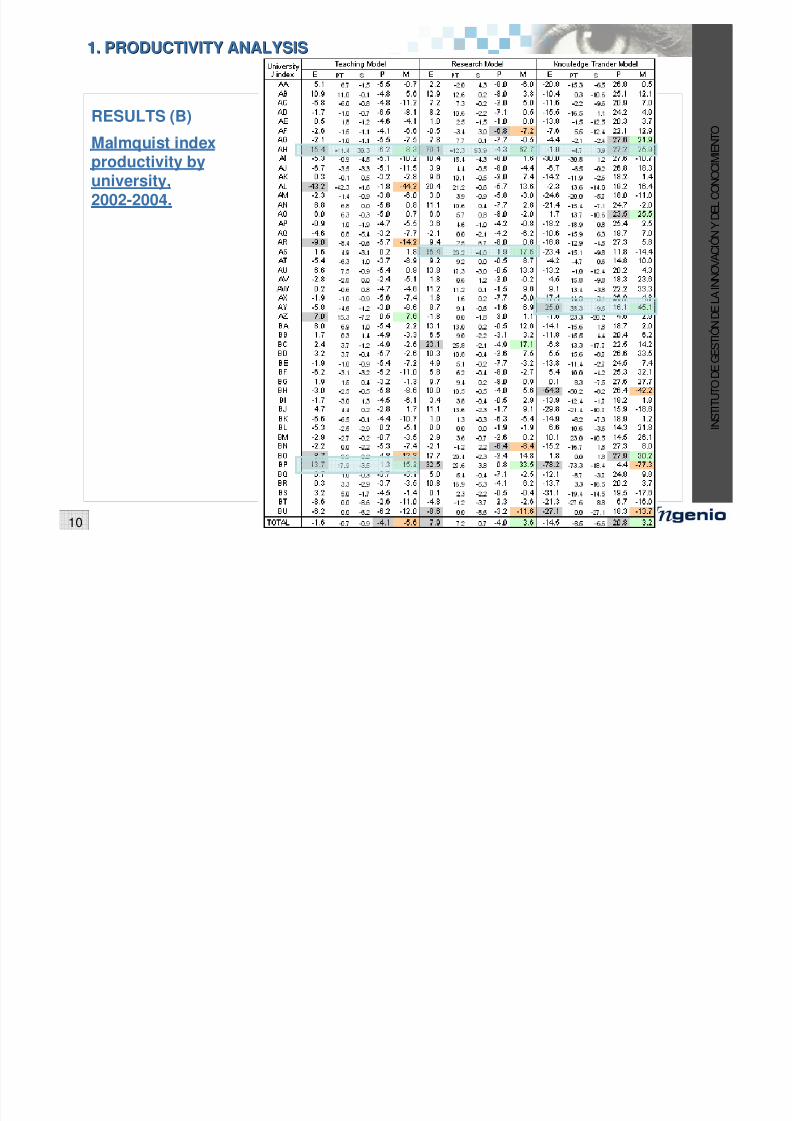
1. PRODUCTIVITY ANALYSIS1. PRODUCTIVITY ANALYSIS
RESULTS (B)
Malmquist indexproductivity byuniversity,
2002-2004.

8/4/2019 PRIME Summer School_ Madrid_DPalomares
http://slidepdf.com/reader/full/prime-summer-school-madriddpalomares 11/18
I N S T I T U T
O D E G E S T I Ó N D E L A
I N N O V A C I Ó N Y D E L C
O N O C I M I E N T O
11
2. QUALITY ANALYSIS2. QUALITY ANALYSIS
SOURCE OF DATA
• REFLEX: a major representative survey comparing the study
programme of European higher education graduates. It was fundedby the 6th FP.
• 15 countries: Austria, Finland, France, Germany, Italy, theNetherlands, Norway, Spain and the UK plus Belgium-Flanders,Czech Republic, Portugal, Switzerland, Japan and Estonia .
• Carried out in 2005 (graduates surveyed 5 years after graduation)
• Almost 40,000 answers (3,000 for each country)

8/4/2019 PRIME Summer School_ Madrid_DPalomares
http://slidepdf.com/reader/full/prime-summer-school-madriddpalomares 12/18
I N S T I T U T
O D E G E S T I Ó N D E L A
I N N O V A C I Ó N Y D E L C
O N O C I M I E N T O
12
2. QUALITY ANALYSIS2. QUALITY ANALYSIS
VARIABLES
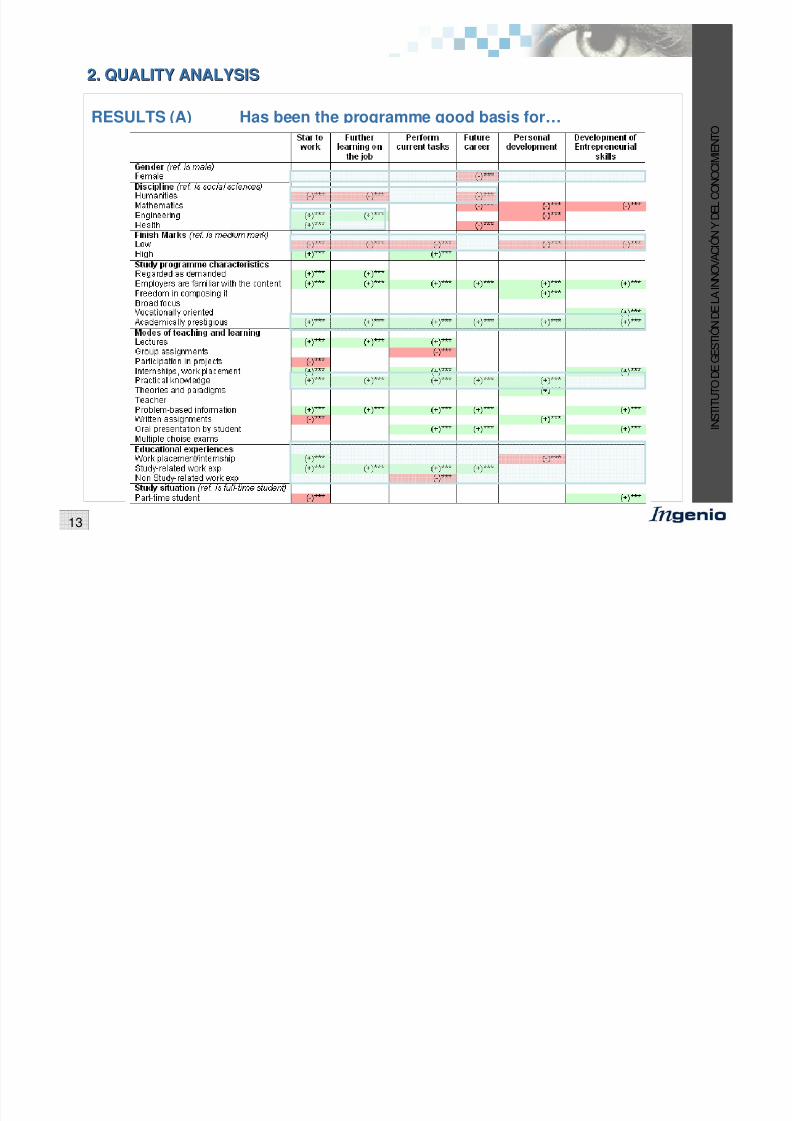
- Teaching model: To what extent has your programme been a good basis for …?(from (1) “Not at all” to (5) “to a very high extent” )
- Research model: Do you play a role in introducing innovations in your
organization? (scale (1) “Yes” to (2) “No” )
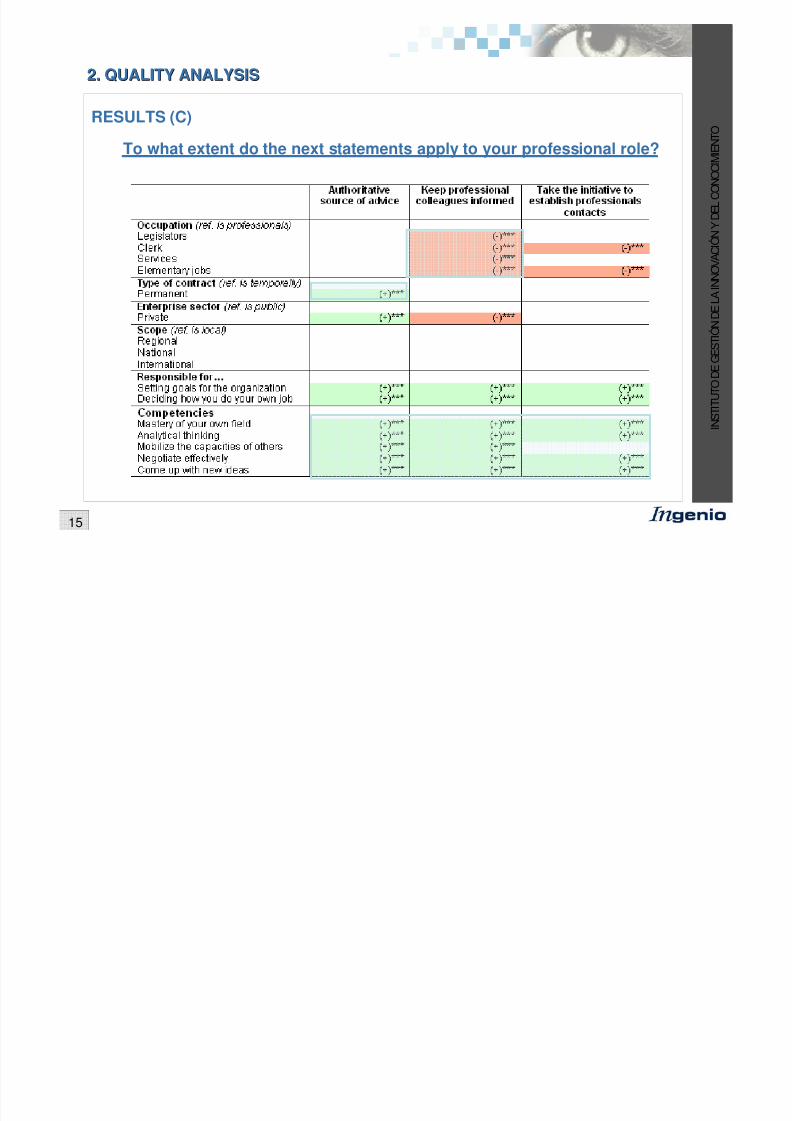
- Knowledge Transfer model: To what extent do some statements apply to your
professional role?(from (1) “Not at all” to (5) “to a very high extent” )
- Gender, Disciplines, Average grade, Description of the programme, Modes of
teaching, Part-time students, Internships and work experience during higher
education, Others type of study, Occupations, Competencies, Firm sector, Extensionof innovation in organizations, Forefront or adopting innovation, Type of contract,
Scope of firms, Responsibilities.
• DEPENDENT VARIABLES
• INDEPENDENT VARIABLES
• We have applied (ordered) probit regression.
METHODOLOGY
8/4/2019 PRIME Summer School_ Madrid_DPalomares
http://slidepdf.com/reader/full/prime-summer-school-madriddpalomares 13/18
I N S T I T U T
O D E G E S T I Ó N D E L A
I N N O V A C I Ó N Y D E L C
O N O C I M I E N T O
13
2. QUALITY ANALYSIS2. QUALITY ANALYSIS
Has been the programme good basis for…RESULTS (A)
8/4/2019 PRIME Summer School_ Madrid_DPalomares
http://slidepdf.com/reader/full/prime-summer-school-madriddpalomares 14/18
I N S T I T U T
O D E G E S T I Ó N D E L A
I N N O V A C I Ó N Y D E L C
O N O C I M I E N T O
14
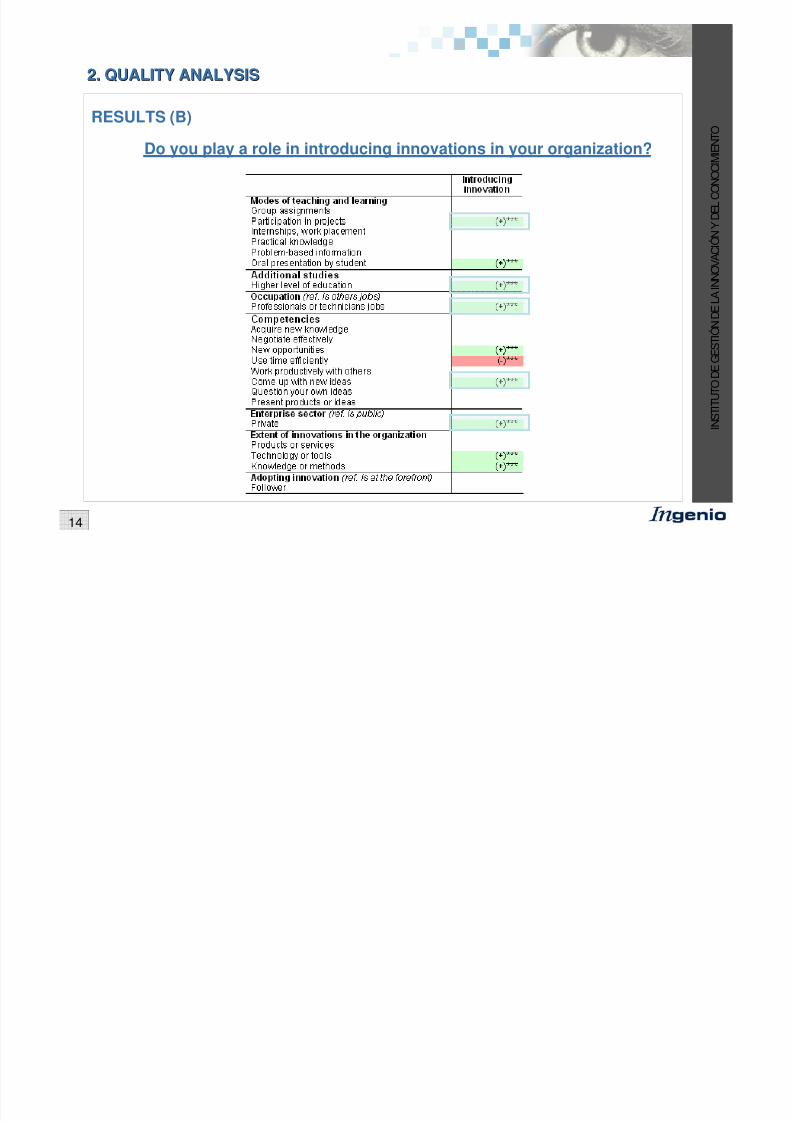
2. QUALITY ANALYSIS2. QUALITY ANALYSIS
RESULTS (B)
Do you play a role in introducing innovations in your organization?
8/4/2019 PRIME Summer School_ Madrid_DPalomares
http://slidepdf.com/reader/full/prime-summer-school-madriddpalomares 15/18
I N S T I T U T
O D E G E S T I Ó N D E L A
I N N O V A C I Ó N Y D E L C
O N O C I M I E N T O
15
2. QUALITY ANALYSIS2. QUALITY ANALYSIS
RESULTS (C)
To what extent do the next statements apply to your professional role?
8/4/2019 PRIME Summer School_ Madrid_DPalomares
http://slidepdf.com/reader/full/prime-summer-school-madriddpalomares 16/18
I N S T I T U T
O D E G E S T I Ó N D E L A
I N N O V A C I Ó N Y D E L C
O N O C I M I E N T O
16
CONCLUSIONSCONCLUSIONS
- There are differences between models:
• Teaching model: decrease in technical efficiency and technological change.
• Research model: efficiency improvements.• Knowledge transfer model: technological progress.
- Most productivity growth was associated with improvements in research andknowledge transfer than teaching.
- Programmes in engineering and health, academically prestigious and oriented topractical knowledge are better for starting work, for further learning on the job.
- Graduates who have additional studies, who have a professional job in a privatesector and who are creative are introducing more innovations in their organizationsthan those who do not.
- Graduates who have entrepreneurial skills and who have a permanent contract play a
role in transferring knowledge from universities to enterprises.
QUALITY ANALYSIS
PRODUCTIVITY ANALYSIS

8/4/2019 PRIME Summer School_ Madrid_DPalomares
http://slidepdf.com/reader/full/prime-summer-school-madriddpalomares 17/18
I N S T I T U T
O D E G E S T I Ó N D E L A
I N N O V A C I Ó N Y D E L C
O N O C I M I E N T O
17
FURTHER RESEARCHFURTHER RESEARCH
- Additional specifications of university productivity should be examined: size, age,knowledge area, regional differences, comparison between public and privatesuniversities, etc…
- It would be interesting to apply a conditional robust nonparametric approach to domore detail interpretations
- To improve the quality analysis considering others independent variables and
comparing the results at European level.
SUGGESTIONS AND COMMENTS ARE WELCOME !

8/4/2019 PRIME Summer School_ Madrid_DPalomares
http://slidepdf.com/reader/full/prime-summer-school-madriddpalomares 18/18
www.ingenio.upv.es
INSTITUTE OF INNOVATION AND KNOWLEDGE MANAGEMENT – INGENIO (CSIC-UPV)
Thank you very much for your attention


