School of Public Health & Health Sciences, Department of Biostatistics and Epidemiology
Katherine W. Reeves, PhD, MPH Associate Professor
Department of Biostatistics and Epidemiology
University of Massachusetts Amherst
WHI Cancer SIG
June 20, 2016
Predictors of Vasomotor Symptoms among Breast Cancer Survivors

2 School of Public Health & Health Sciences, Department of Biostatistics and Epidemiology
Background on Vasomotor Symptoms (VMS)
Include hot flashes and night sweats
Common side effect of breast cancer treatments
Negative effects on treatment adherence, quality of life
Related to elevated BMI and metabolic syndrome (MetS) among women transitioning through menopause
Unclear what, if any, personal and/or behavioral characteristics predict VMS following breast cancer treatment
3 School of Public Health & Health Sciences, Department of Biostatistics and Epidemiology
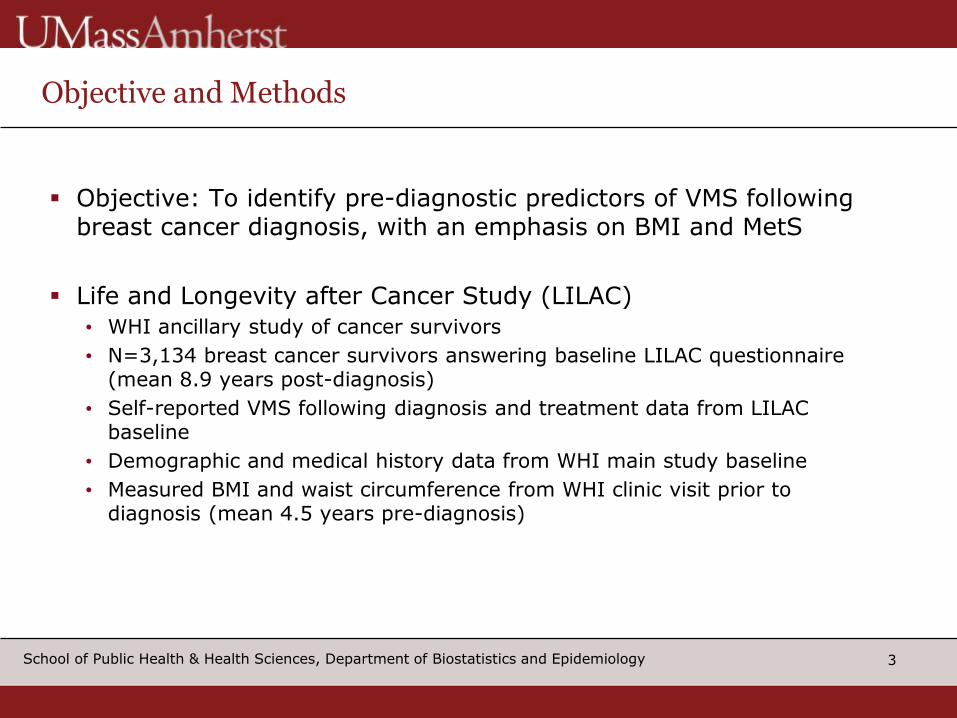
Objective and Methods
Objective: To identify pre-diagnostic predictors of VMS following breast cancer diagnosis, with an emphasis on BMI and MetS
Life and Longevity after Cancer Study (LILAC)
• WHI ancillary study of cancer survivors
• N=3,134 breast cancer survivors answering baseline LILAC questionnaire (mean 8.9 years post-diagnosis)
• Self-reported VMS following diagnosis and treatment data from LILAC baseline
• Demographic and medical history data from WHI main study baseline
• Measured BMI and waist circumference from WHI clinic visit prior to diagnosis (mean 4.5 years pre-diagnosis)
4 School of Public Health & Health Sciences, Department of Biostatistics and Epidemiology
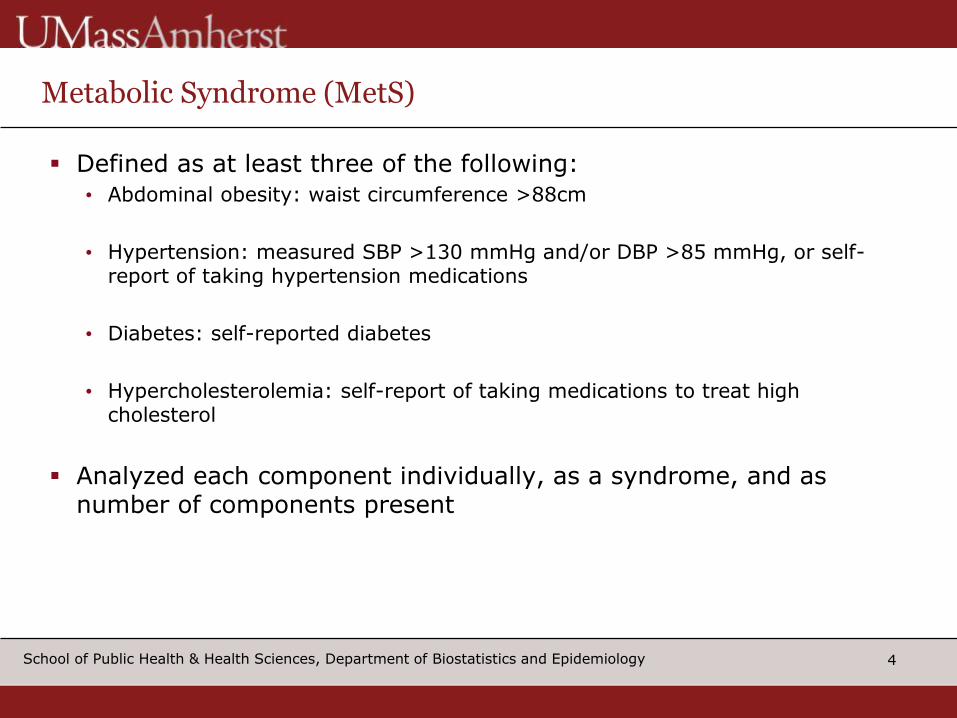
Metabolic Syndrome (MetS)
Defined as at least three of the following:
• Abdominal obesity: waist circumference >88cm
• Hypertension: measured SBP >130 mmHg and/or DBP >85 mmHg, or self-report of taking hypertension medications
• Diabetes: self-reported diabetes
• Hypercholesterolemia: self-report of taking medications to treat high cholesterol
Analyzed each component individually, as a syndrome, and as number of components present
5 School of Public Health & Health Sciences, Department of Biostatistics and Epidemiology
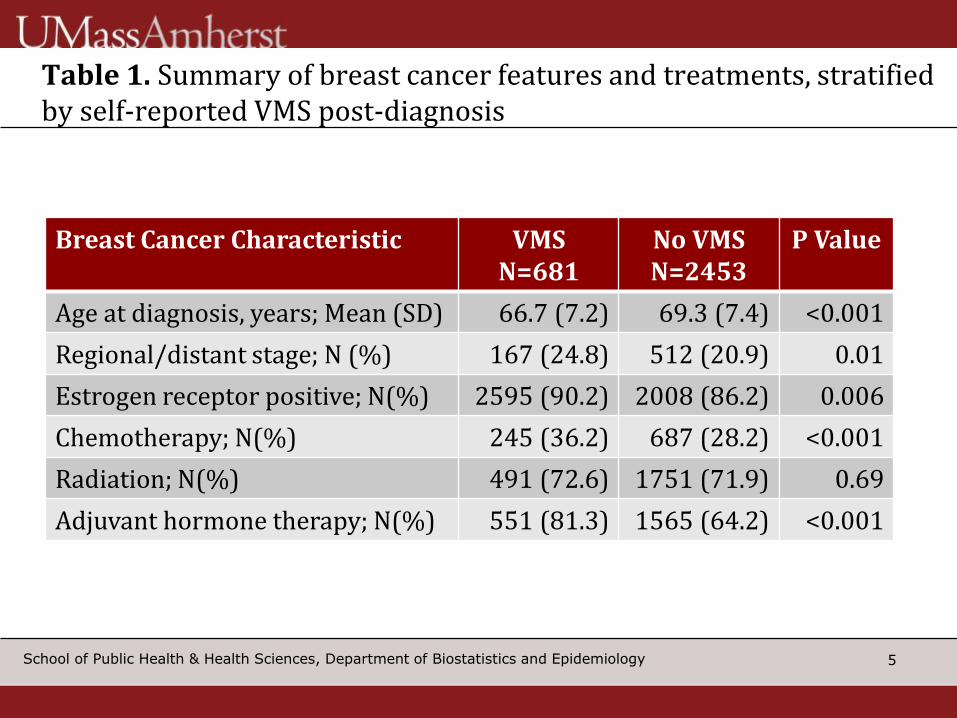
Table 1. Summary of breast cancer features and treatments, stratified by self-reported VMS post-diagnosis
Breast Cancer Characteristic VMS N=681
No VMS N=2453
P Value
Age at diagnosis, years; Mean (SD) 66.7 (7.2) 69.3 (7.4) <0.001
Regional/distant stage; N (%) 167 (24.8) 512 (20.9) 0.01
Estrogen receptor positive; N(%) 2595 (90.2) 2008 (86.2) 0.006
Chemotherapy; N(%) 245 (36.2) 687 (28.2) <0.001
Radiation; N(%) 491 (72.6) 1751 (71.9) 0.69
Adjuvant hormone therapy; N(%) 551 (81.3) 1565 (64.2) <0.001
6 School of Public Health & Health Sciences, Department of Biostatistics and Epidemiology
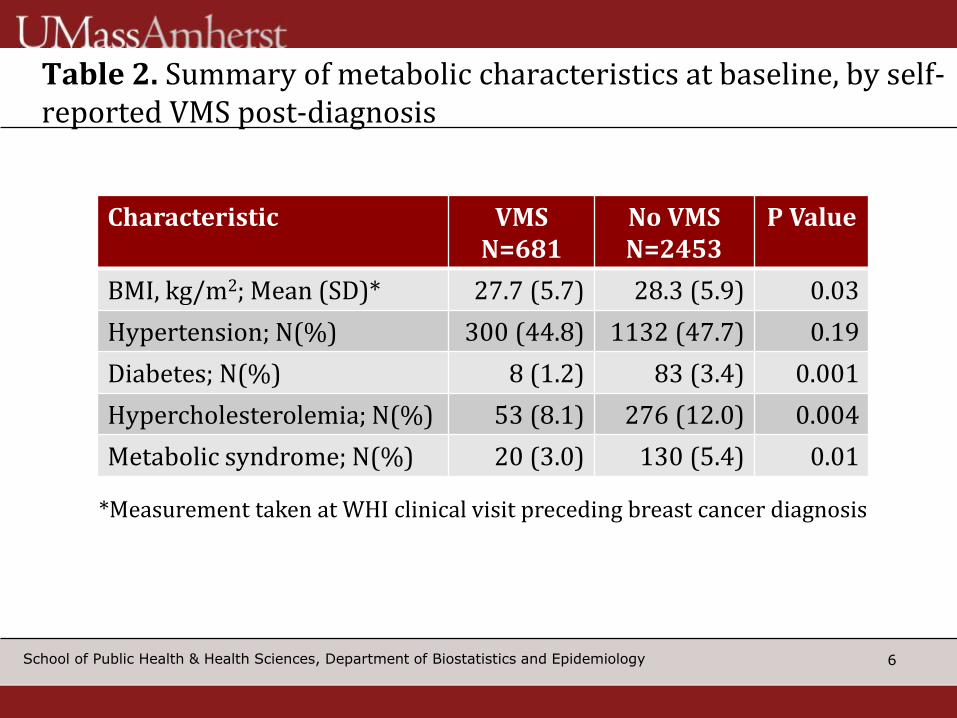
Table 2. Summary of metabolic characteristics at baseline, by self-reported VMS post-diagnosis
Characteristic VMS N=681
No VMS N=2453
P Value
BMI, kg/m2; Mean (SD)* 27.7 (5.7) 28.3 (5.9) 0.03
Hypertension; N(%) 300 (44.8) 1132 (47.7) 0.19
Diabetes; N(%) 8 (1.2) 83 (3.4) 0.001
Hypercholesterolemia; N(%) 53 (8.1) 276 (12.0) 0.004
Metabolic syndrome; N(%) 20 (3.0) 130 (5.4) 0.01
*Measurement taken at WHI clinical visit preceding breast cancer diagnosis
7 School of Public Health & Health Sciences, Department of Biostatistics and Epidemiology
0
0.2
0.4
0.6
0.8
1
1.2
1.4
1.6
Od
ds
Rat
io
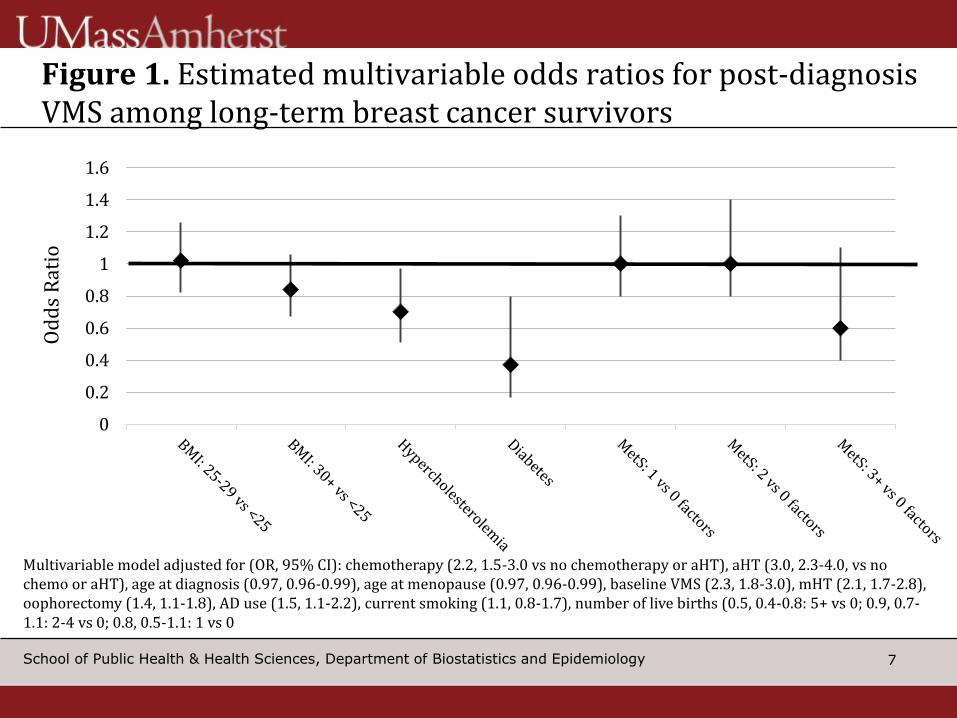
Multivariable model adjusted for (OR, 95% CI): chemotherapy (2.2, 1.5-3.0 vs no chemotherapy or aHT), aHT (3.0, 2.3-4.0, vs no chemo or aHT), age at diagnosis (0.97, 0.96-0.99), age at menopause (0.97, 0.96-0.99), baseline VMS (2.3, 1.8-3.0), mHT (2.1, 1.7-2.8), oophorectomy (1.4, 1.1-1.8), AD use (1.5, 1.1-2.2), current smoking (1.1, 0.8-1.7), number of live births (0.5, 0.4-0.8: 5+ vs 0; 0.9, 0.7-1.1: 2-4 vs 0; 0.8, 0.5-1.1: 1 vs 0
Figure 1. Estimated multivariable odds ratios for post-diagnosis VMS among long-term breast cancer survivors
8 School of Public Health & Health Sciences, Department of Biostatistics and Epidemiology
Potential Limitations: Misclassification of BMI
Measurements taken mean 4.5 yrs (SD 3.9 yrs) before diagnosis
Similar results when restricted to BMI measurements ≤ 2 yrs pre-diagnosis (N=1144)
Similar results using annual self-reported BMI
9 School of Public Health & Health Sciences, Department of Biostatistics and Epidemiology
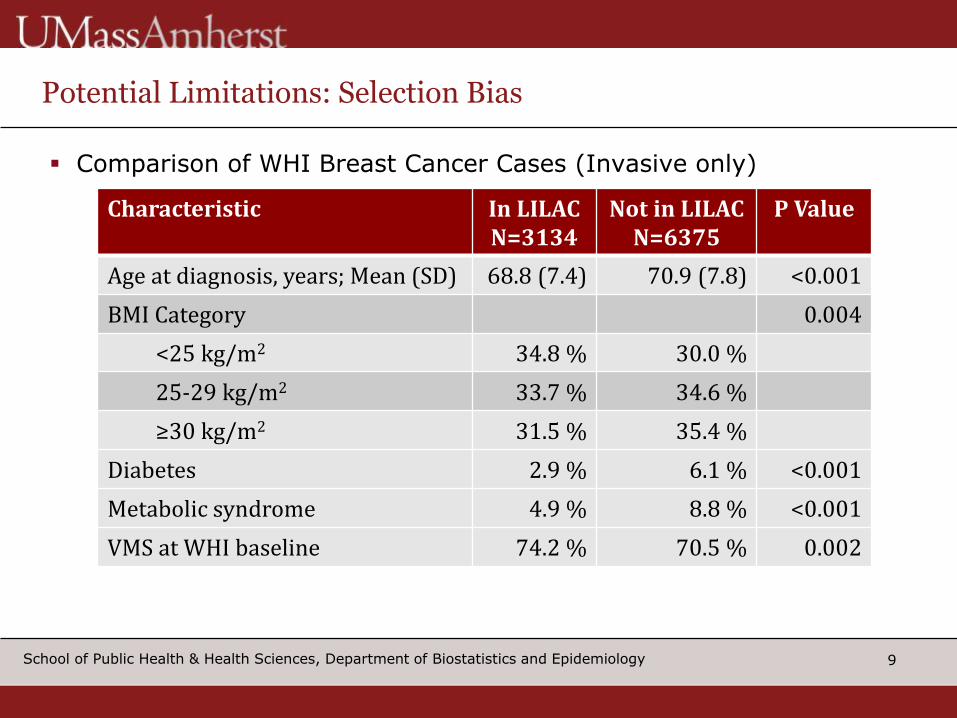
Potential Limitations: Selection Bias
Comparison of WHI Breast Cancer Cases (Invasive only)
Characteristic In LILAC N=3134
Not in LILAC N=6375
P Value
Age at diagnosis, years; Mean (SD) 68.8 (7.4) 70.9 (7.8) <0.001
BMI Category 0.004
<25 kg/m2 34.8 % 30.0 %
25-29 kg/m2 33.7 % 34.6 %
≥30 kg/m2 31.5 % 35.4 %
Diabetes 2.9 % 6.1 % <0.001
Metabolic syndrome 4.9 % 8.8 % <0.001
VMS at WHI baseline 74.2 % 70.5 % 0.002
10 School of Public Health & Health Sciences, Department of Biostatistics and Epidemiology
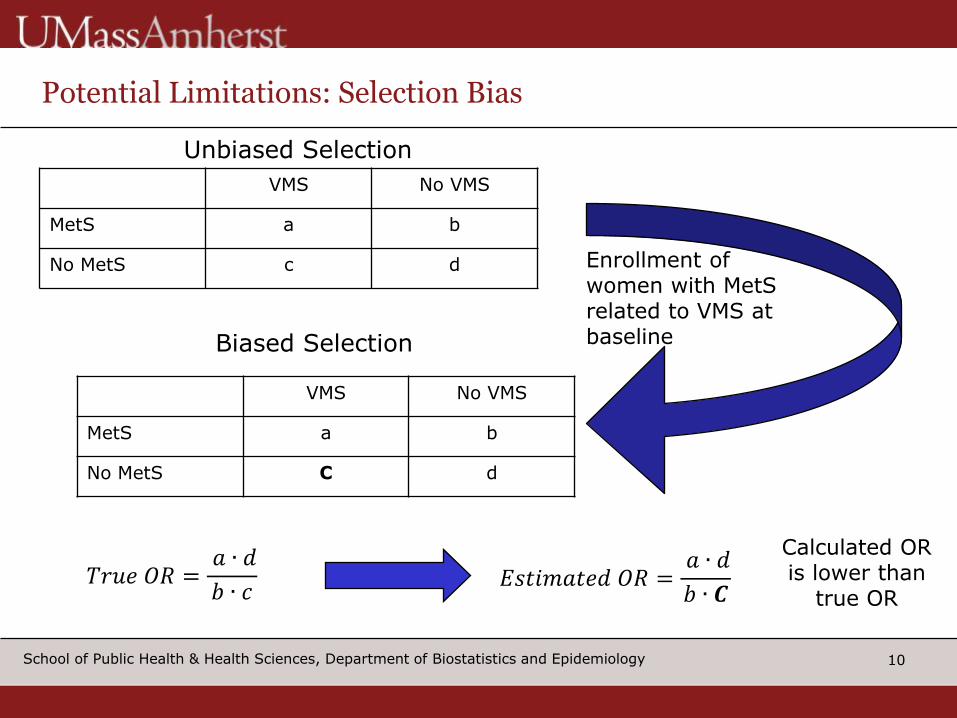
Potential Limitations: Selection Bias
VMS No VMS
MetS a b
No MetS c d
VMS No VMS
MetS a b
No MetS C d
Unbiased Selection
Biased Selection
Enrollment of women with MetS related to VMS at baseline
𝑇𝑟𝑢𝑒 𝑂𝑅 = 𝑎 ∙ 𝑑
𝑏 ∙ 𝑐 𝐸𝑠𝑡𝑖𝑚𝑎𝑡𝑒𝑑 𝑂𝑅 =
𝑎 ∙ 𝑑
𝑏 ∙ 𝑪
Calculated OR is lower than
true OR
11 School of Public Health & Health Sciences, Department of Biostatistics and Epidemiology
Conclusions
Pre-diagnositic BMI and MetS may not be associated with VMS post-diagnosis
Chemotherapy and adjuvant therapy strongest predictors of VMS post-diagnosis
Plan to further evaluate effects of possible selection bias
Important to identify factors that predispose women to VMS post-diagnosis; may help clinicians counsel patients and treat VMS to avoid negative QOL effects and treatment discontinuation


