Predicting the Next Planned Gift
Josh BirkholzBentz Whaley Flessner

Bright Spots
2
Plan
Setting the stage Introducing Predictive Analytics. How is it accomplished? Just One Statistical Principle:
Randomized Testing Bringing Analytics In-House
3

Setting the stage
4

Fundraising Has Three Primary Business Processes
Base DevelopmentOne-to-many strategies of engagement
Major/Planned Gift DevelopmentOne-to-one high ROI strategies
Prospect DevelopmentConversion from base to major

6
Market ResearchIdentification with screening and modeling
Prospect ResearchQualification with data
Field ResearchDiscovery / qualification
through interaction
Plan Strategy
Solicitation
Stewardship Cultivation
Major GiftFundraising
Cycle
Prospect Development has Three Stages Feeding Major and Planned Gift Cultivation

Effective Prospect Development for Planned Giving
Identifies prospects meeting the criteria planned gift donors.- Traditional characteristics- Characteristics unique to your organizations
Works with fundraisers to develop strategies for aligning the prospects with the institution for a philanthropic partnership.

Characteristics
Assumptions Consistent donors Old donors Donors with appreciated
assets
8
Observations Assumptions generally
accurate for most institutions.
Other common characteristics from our research:
Legacy families Multiple property
owners Employment in
education and public service
Donor loyalty Positive donor
experience
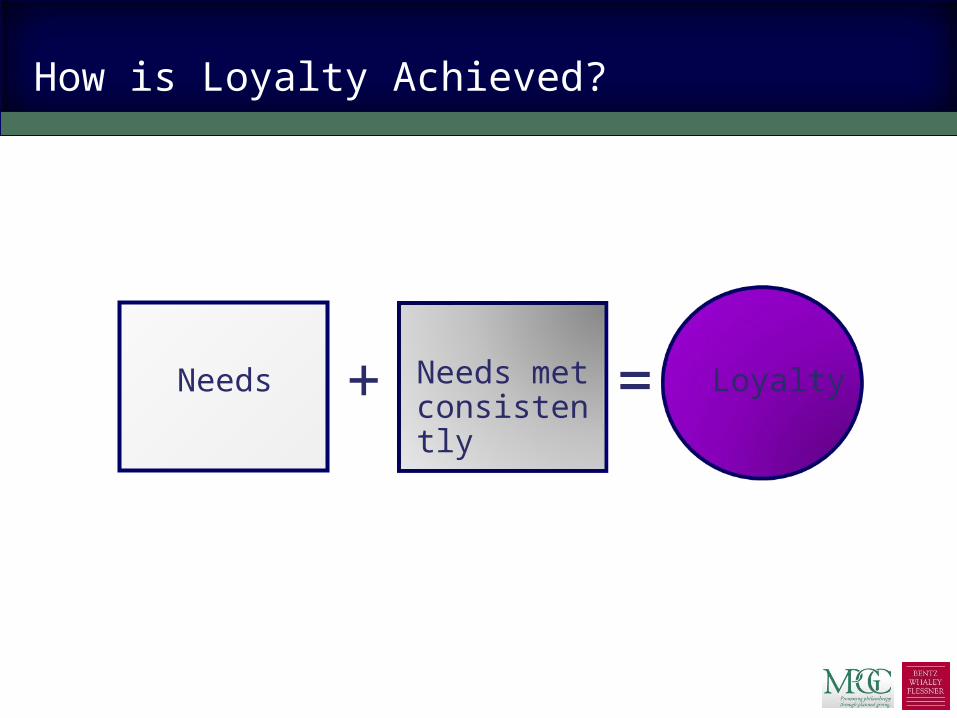
How is Loyalty Achieved?
Needs Needs met consistently
Loyalty+ =
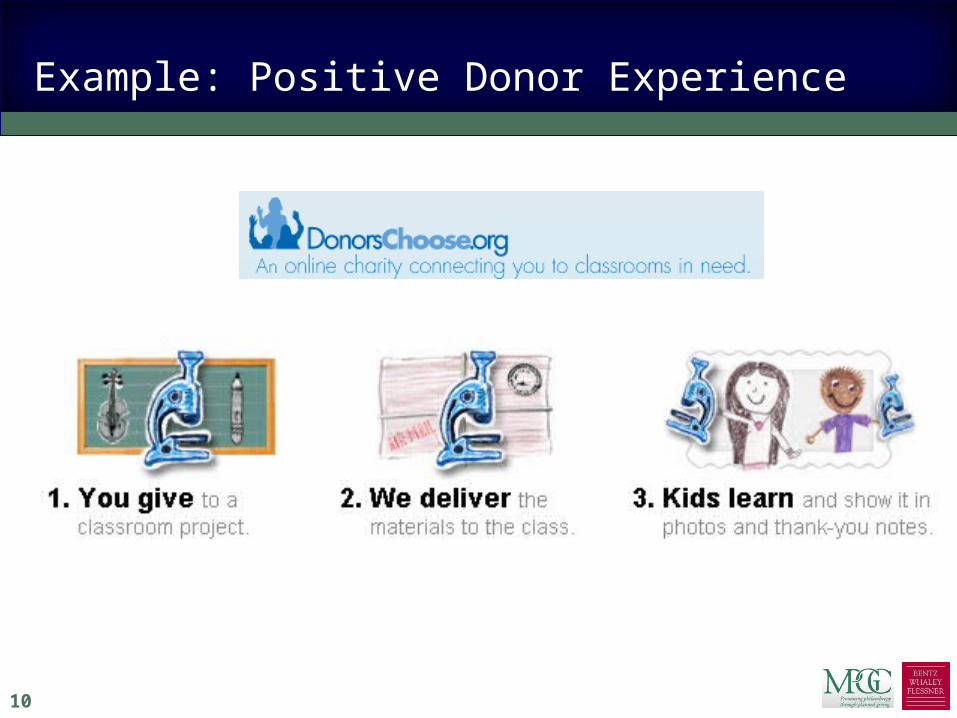
Example: Positive Donor Experience
10

Introducing Predictive Analytics
11

What Is Meant by “Analytics?”
Analytics describes the statistical tools and strategies for: Analyzing constituencies. Building models to predict
constituent behaviors. Evaluating program performance
using relevant metrics. Projecting future program
performance.
12
Analyzing Constituencies
Identifying core constituent groups. Defining their characteristics. Understanding their motivations.
13
Applications
Portfolio optimization.
Segmentation strategies.
Event programming.
Data Mining and Predictive Modeling:What Is “Data Mining?”
Using statistics to identify patterns in data. Comparing characteristics
of people or things doing a behavior with people or things not doing the behavior.
14
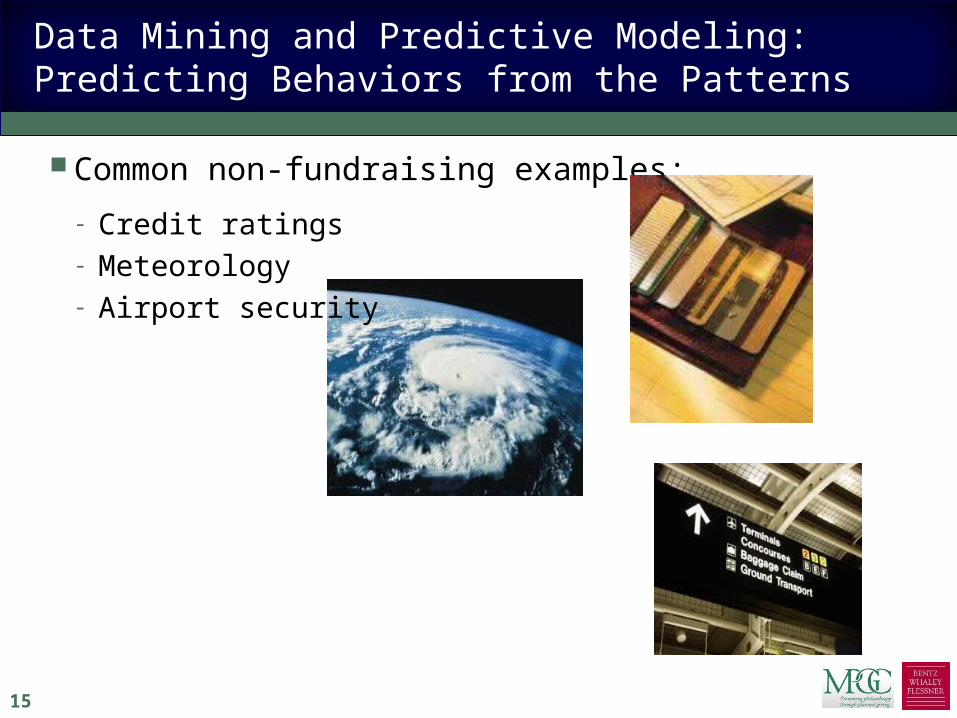
Data Mining and Predictive Modeling: Predicting Behaviors from the Patterns
15
Common non-fundraising examples:
- Credit ratings- Meteorology- Airport security

Modeling Can Predict Many Things
Major, planned, and annual giving
Program or department models. (giving to fine arts, capital needs, scholarships, patient care, etc.)
16
Membership likelihood Season ticket
subscriptions Alumni affinity Channel preferences
(mail, phone, email) Next gift amounts Loyalty scoring with
precise weightings
Effective for Planned Giving:
Your constituents compared to
Your success stories using
Your data to identify
Your unique opportunity
17
How is it accomplished?
18

Method
Understand your goals before you begin.
Gather your data. Included demographics, giving, research, and screening data.
Prepare the data for modeling.
Model. Evaluate the results
against existing donors and prospects.
Score the file and implement the results.
19

Common Score Format (Fractional ranking displayed)
Planned Giving Rank Label
Planned Giving Score
Minimum Maximum
0 Lower 50% 4 5001 Top 50% 500 7502 Top 25% 750 9003 Top 10% 900 9504 Top 5% 950 9755 Top 2.5% 975 9906 Top 1% 990 9957 Top 0.5% 995 9978 Top 0.25% 998 9999 Top 0.1% 999 1,00020
All records have a ranking and a 0–1,000 score.

Evaluate by Comparing Scores to Actual PG Donors
21
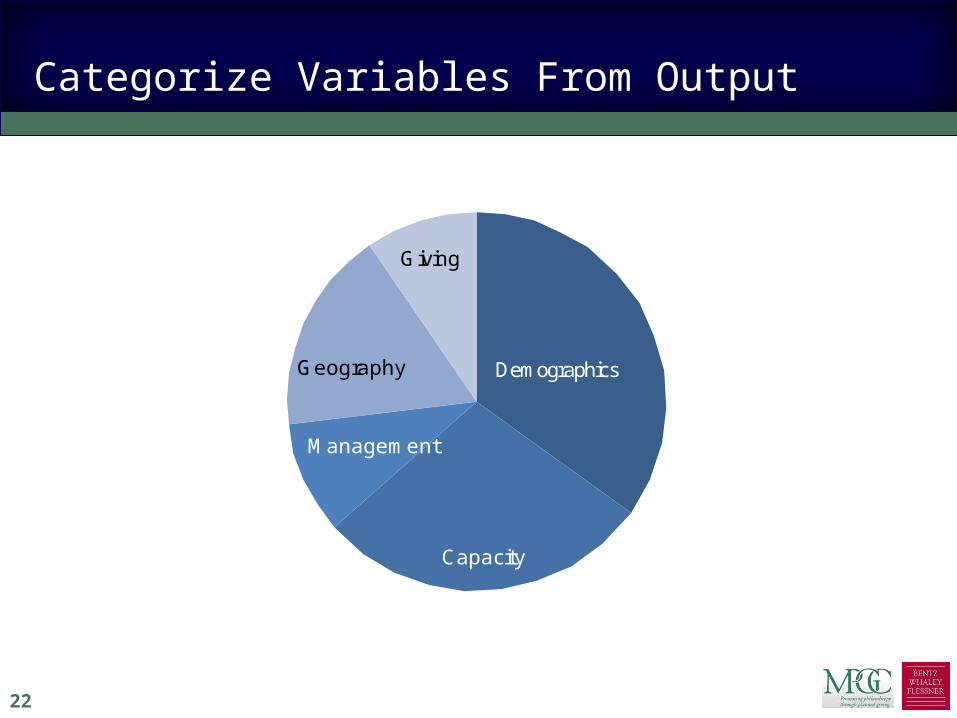
Categorize Variables From Output
Demographics
Capacity
Management
Geography
Giving
22
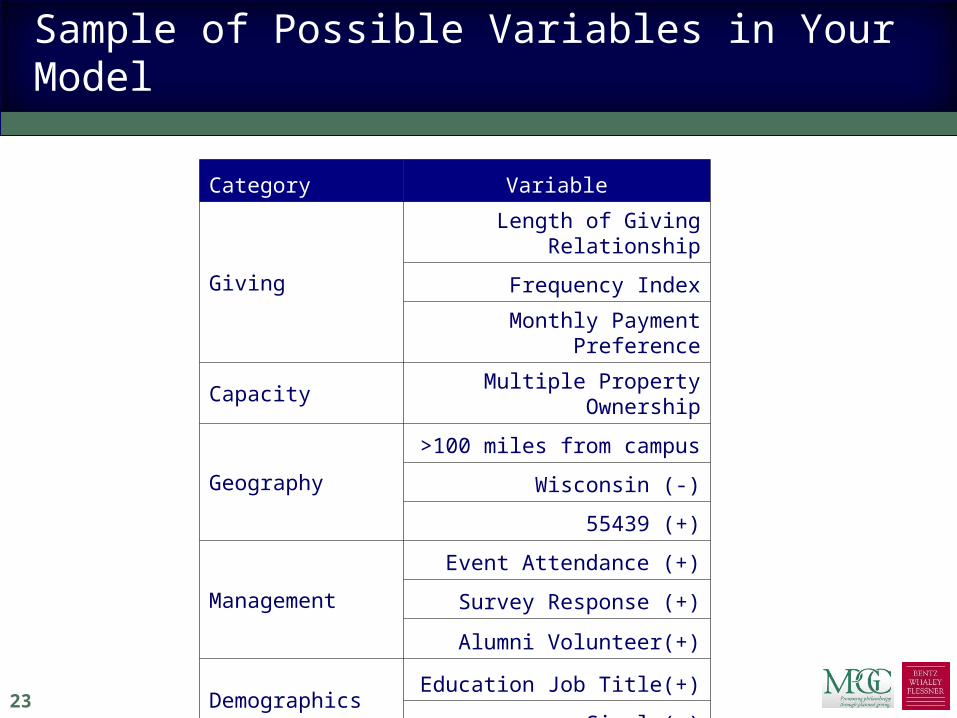
Sample of Possible Variables in Your Model
Category Variable
Giving
Length of Giving Relationship
Frequency Index
Monthly Payment Preference
Capacity Multiple Property
Ownership
Geography
>100 miles from campus
Wisconsin (-)
55439 (+)
Management
Event Attendance (+)
Survey Response (+)
Alumni Volunteer(+)
DemographicsEducation Job Title(+)
Single(+)23
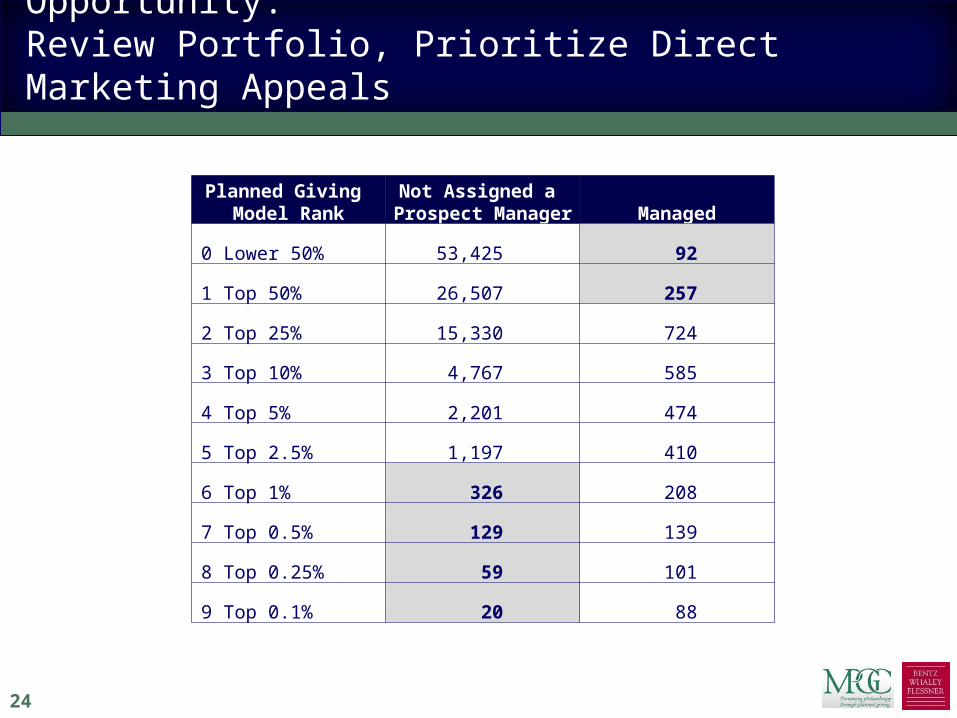
Opportunity: Review Portfolio, Prioritize Direct Marketing Appeals
24
Planned Giving Model Rank
Not Assigned a Prospect Manager Managed
0 Lower 50% 53,425 92
1 Top 50% 26,507 257
2 Top 25% 15,330 724
3 Top 10% 4,767 585
4 Top 5% 2,201 474
5 Top 2.5% 1,197 410
6 Top 1% 326 208
7 Top 0.5% 129 139
8 Top 0.25% 59 101
9 Top 0.1% 20 88

Examples: Successful Implementation
25
New planned giving director.
Prepared new prospect list.
Felt it was a “stacked deck.”
Program needed jump-start.
Purchased predictive models.
Aggressively marketed and discovered new names.
Had best planned giving year in history.

Just One Statistical Principle:Random Testing
26

Drawing Planned Giving Donors Out of a Hat
Imagine a hat with 130 slips of paper.
About 31% of the slips have the words “planned giving donor” written on them.
If you draw a slip out of the hat, approximately 1 in 3 will be a PG donor.
For most organizations, planned giving donors represent a far lesser portion (<5%).

Can We Improve This Ratio?
We could survey our actual planned giving donors asking: How would you describe yourself?
- A blue slip of paper- A green slip of paper- A yellow slip of paper

Survey ResultsNow Which Slip of Paper Will You Select?

If You Choose Blue…
Will you draw a planned giving donor on average 1 out of 2 times?

The Answer: Unknown
There is not enough information. You do not know the distribution of the random
population.
31
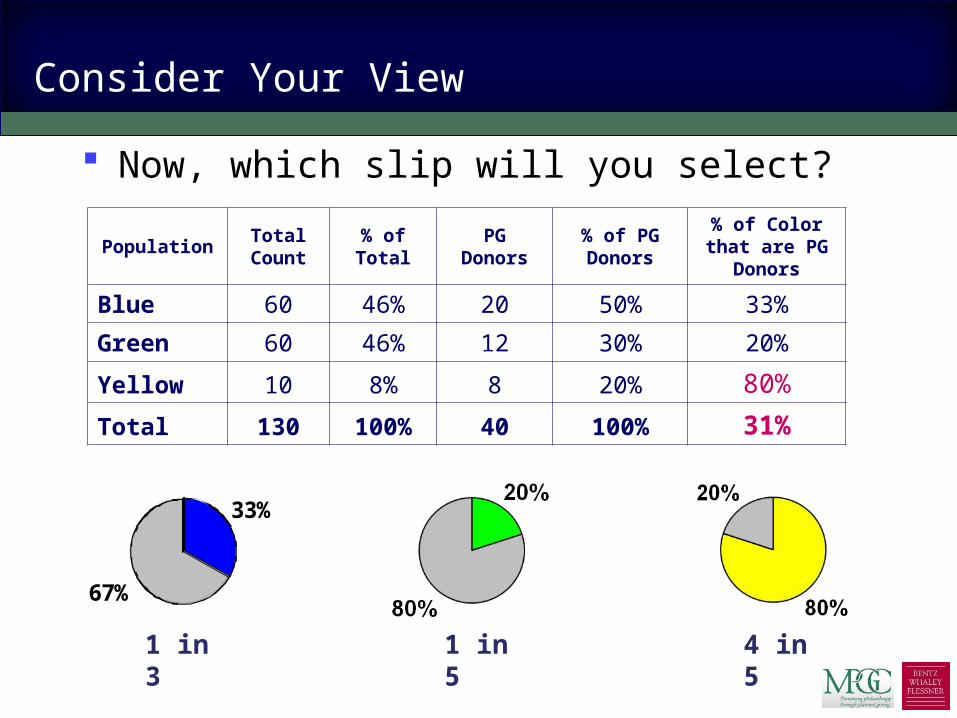
PopulationTotal Count
% of Total
PG Donors
% of PG Donors
% of Color that are PG
Donors
Blue 60 46% 20 50% 33%
Green 60 46% 12 30% 20%
Yellow 10 8% 8 20% 80%
Total 130 100% 40 100% 31%
33%
67%
Now, which slip will you select?
1 in 3
1 in 5
4 in 5
Consider Your View

Principle
Common characteristics may not be distinguishing characteristics.
How populations are different (target vs. random) is more interesting statistically and predictive than common characteristics of a target group.
33
Bringing Data Mining In-House
34
Bringing Data Mining In-House
More and more organizations have in-house data mining capacity, from large shops to small shops.
Large shops generally have dedicated staff.
Small shops have developed the skill sets in research, advancement services, or annual giving.
35

36
Making the Case
Gather references of peers and aspirant peers. Build a cross-functional project team. Start with short-term projects—specific appeals.
- Communicate goals before the project.- Communicate the success after the project.
Educational and research institutions:- Explore on-campus knowledge resources (economics,
statistics, business departments).- Explore on-campus software resources.
Statistics Software
SPSS- My personal preference- User friendly for expert and novice alike- Large network of other researchers using SPSS
SAS- Very powerful for large data sets- Needed for regulatory testing
(not necessary in fundraising)- Good network of researchers using SAS
DataDesk- Object-oriented format easy to understand- Excellent for exploratory analysis- Large network of other researchers using DataDesk
37
Training
Software training courses Conferences and users
groups Learning through
outsourcing (you are buying methodology as well as analysis)
Onsite consulting Campus resources
38
39
Learn Through Outsourcing
Many organizations outsource their analytics; benefits include: Expert analysis. Opportunity to learn from their methodology. High level of service over the short term.

40
Developing In-House Capacities
It is not hard to learn. Analytics is becoming part of the constituent
relations and admissions skill set. Nobody knows your data like you do. Ability to create multiple models and analysis—not to
be restricted by costs.

Final Thoughts
41

When You Leave Today, Remember:
Start with your bright spots. Build a prospecting plan
around your characteristics. Consider predictive analytics
to identify and prioritize your list.
Comparing PG donors to random donors is more valuable than summarizing common PG donor characteristics.
Whether you outsource or build analytics in-house, analytics is within your reach.
42

89646:JMB:abl:050410.
7251 Ohms Lane Minneapolis, Minnesota 55439
ph: 952-921-0111 fax: [email protected] www.donorcast.com
Joshua BirkholzPrincipal, Bentz Whaley Flessner
Founder of DonorCast
Questions?


