
1
Gennum and the Gennum logo are trademarks of the Gennum Corporation.
PAM-8 and PAM-16 Optical Receivers for 2km 100G Links with a 4dB loss budget.
Presenter: Francois Tremblay
Contributor: Alan Tipper10th March 2012
2
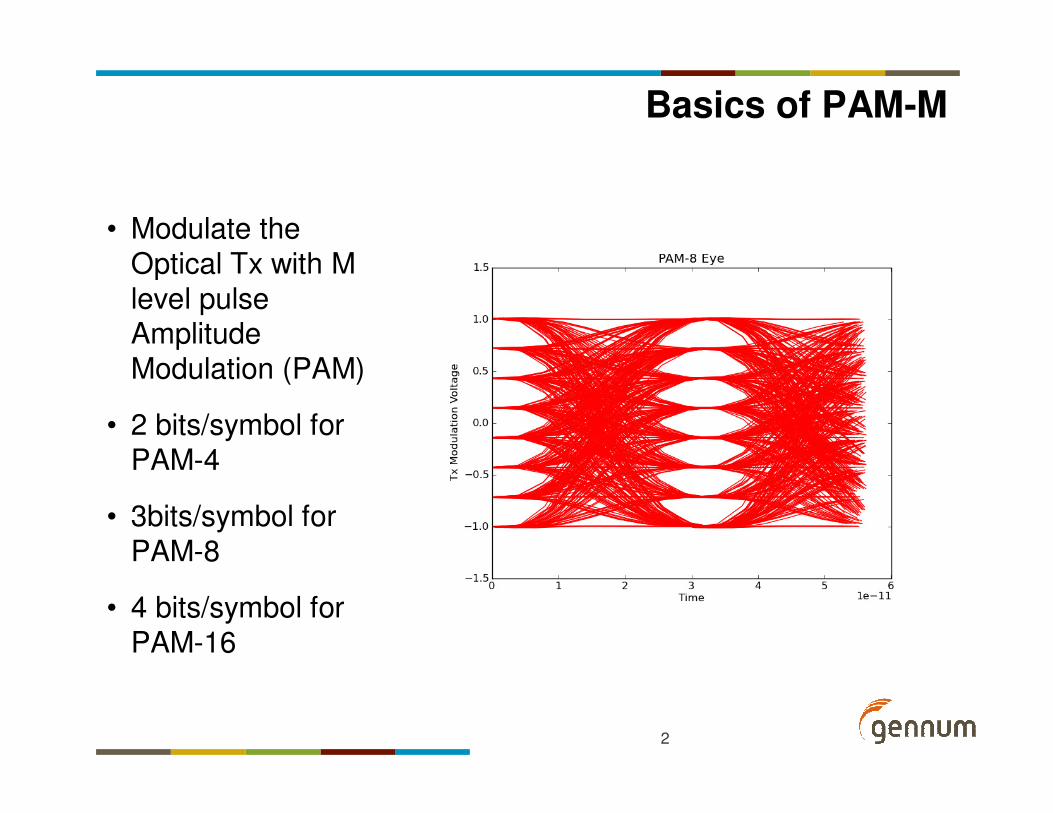
Basics of PAM-M
• Modulate the Optical Tx with M level pulse Amplitude Modulation (PAM)
• 2 bits/symbol for PAM-4
• 3bits/symbol for PAM-8
• 4 bits/symbol for PAM-16

3
Rx Error Probability Calculation (1)
∫∞
2/),0(
1
ddvN
Mσ ∫
∞
2/),0(
1
ddvN
Mσ
Normalised PDF of PAM-8 Received Signal
0
0.2
0.4
0.6
0.8
1
1.2
0 1 2 3 4 5 6 7 8
Normalised Input Current
No
rmali
sed
Pro
bab
ilit
y
Den
sit
y
∫∞
2/),0(
2
ddvN
MσFor levels 1 to M-2 the error probability is:
For levels 0 and M-1 the error probability is: ∫∞
2/),0(
1
ddvN
Mσ
)22
(1
),0(1
22/ σ
σd
erfcM
MdvN
M
M
d
−=
−∫
∞
Hence the total error probability is:
d
N(mean, standard deviation) is the standard Gaussian PDF
RMS noise = σσσσ
4
Rx Error Probability Calculation (2)
1
2
1
1
−+
−>=<
ME
Esd
)1
1
)1(2(
1
+
−
−
><−=
E
E
M
serfc
M
MPE
σ
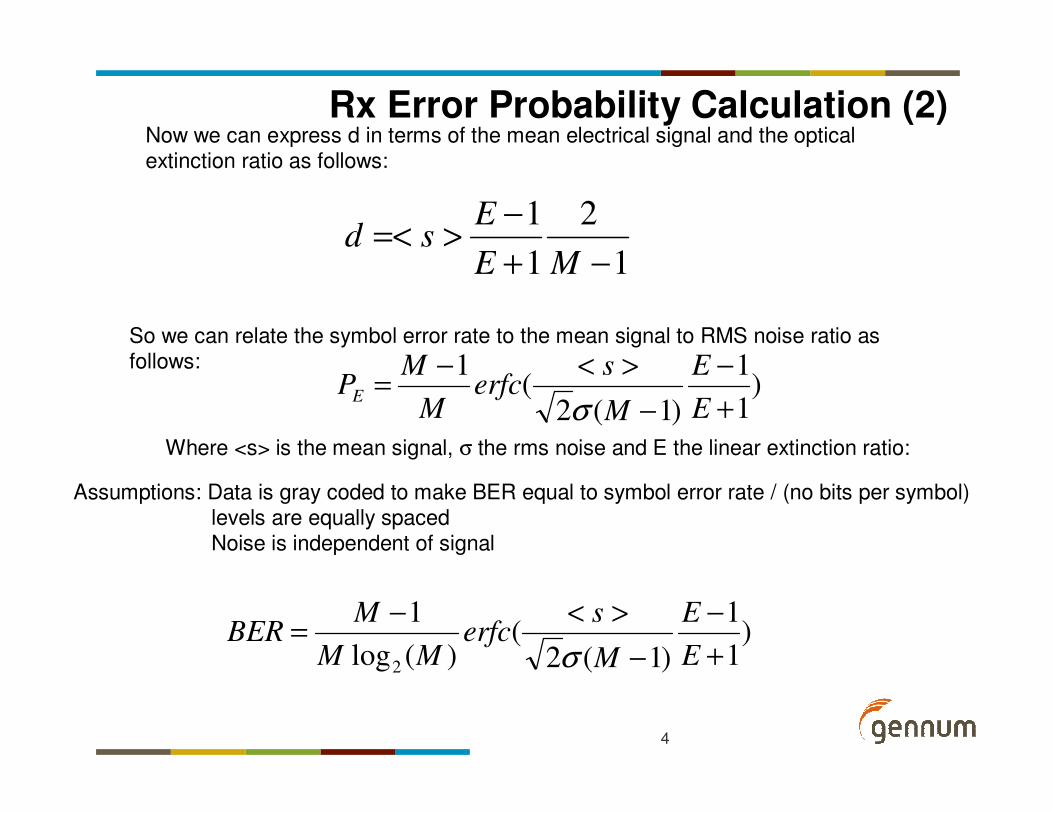
Now we can express d in terms of the mean electrical signal and the optical extinction ratio as follows:
So we can relate the symbol error rate to the mean signal to RMS noise ratio as follows:
Where <s> is the mean signal, σ the rms noise and E the linear extinction ratio:
Assumptions: Data is gray coded to make BER equal to symbol error rate / (no bits per symbol)levels are equally spacedNoise is independent of signal
)1
1
)1(2(
)(log
1
2 +
−
−
><−=
E
E
M
serfc
MM
MBER
σ
5
Time Domain Numerical Model
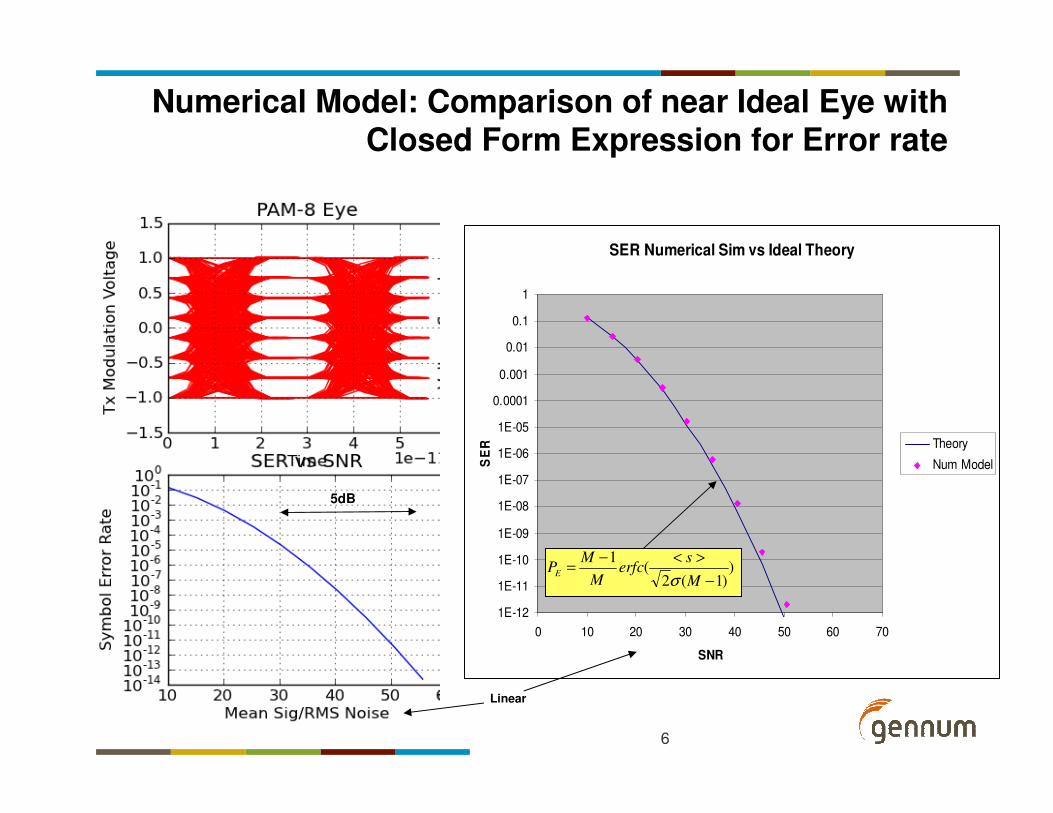
• To investigate the effect of non linearity and other pulse distortions it is necessary to do a symbol by symbol numerical model. This has been implemented in a Matlab-Simulink like environment (Python/SciPy)
• A long data pattern is sampled at eye centre using a CDR triggered off the zero crossings of the PAM input signal. The M-1 slicing thresholds are distributed evenly between the measured Max and Min voltages of the data signal.
• The vector distances between each sample and the M-1 thresholds are calculated and then the probability of crossing the adjacent thresholds due to added Gaussian noise is computed. The error probability is then averaged over the pattern length
6
Numerical Model: Comparison of near Ideal Eye with Closed Form Expression for Error rate
SER Numerical Sim vs Ideal Theory
1E-12
1E-11
1E-10
1E-09
1E-08
1E-07
1E-06
1E-05
0.0001
0.001
0.01
0.1
1
0 10 20 30 40 50 60 70
SNR
SE
R Theory
Num Model
))1(2
(1
−
><−=
M
serfc
M
MPE
σ
Linear
5dB
7
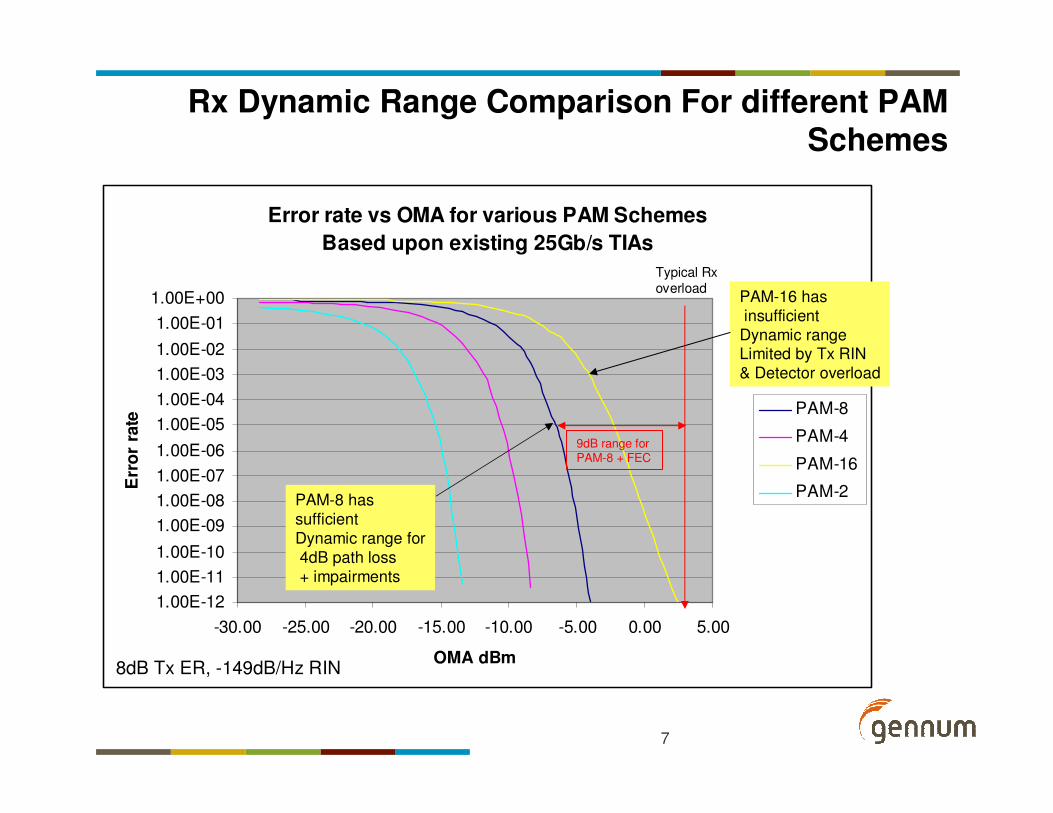
Rx Dynamic Range Comparison For different PAM Schemes
Error rate vs OMA for various PAM Schemes
Based upon existing 25Gb/s TIAs
1.00E-12
1.00E-11
1.00E-10
1.00E-09
1.00E-08
1.00E-07
1.00E-06
1.00E-05
1.00E-04
1.00E-03
1.00E-02
1.00E-01
1.00E+00
-30.00 -25.00 -20.00 -15.00 -10.00 -5.00 0.00 5.00
OMA dBm
Err
or
rate
PAM-8
PAM-4
PAM-16
PAM-2
Typical Rx overload
9dB range for PAM-8 + FEC
8dB Tx ER, -149dB/Hz RIN
PAM-16 has
insufficient
Dynamic rangeLimited by Tx RIN
& Detector overload
PAM-8 has
sufficient
Dynamic range for
4dB path loss
+ impairments
8
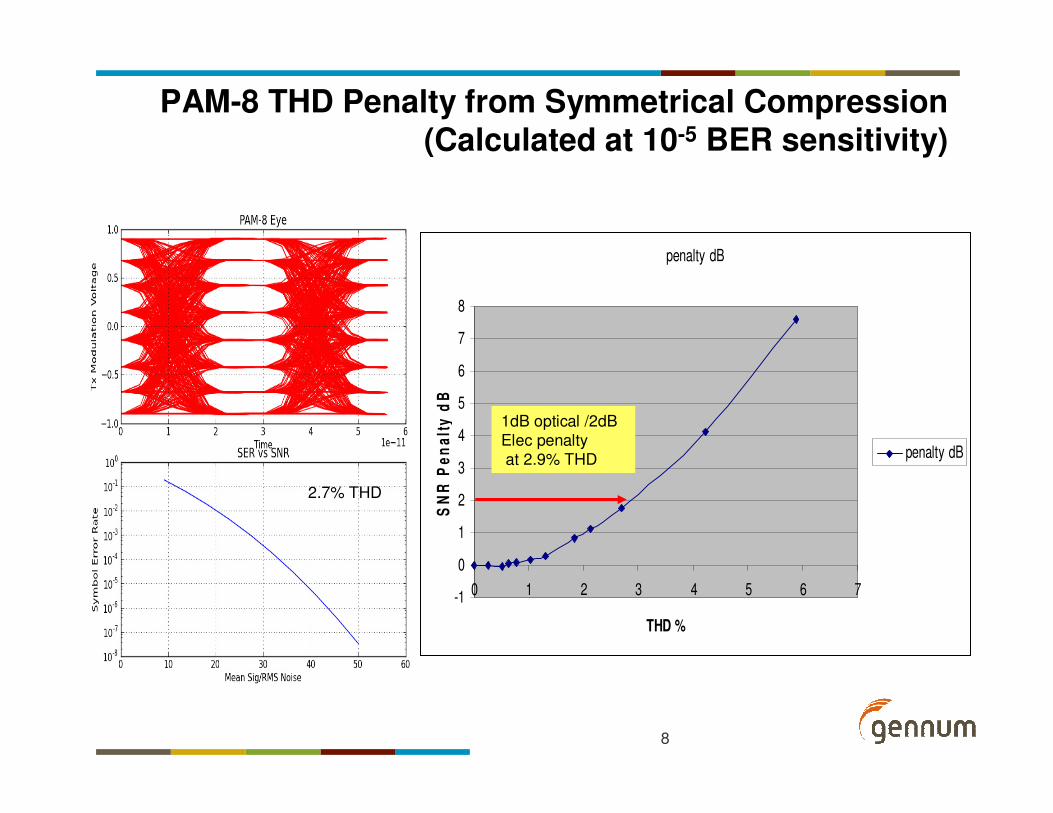
PAM-8 THD Penalty from Symmetrical Compression(Calculated at 10-5 BER sensitivity)
penalty dB
-1
0
1
2
3
4
5
6
7
8
0 1 2 3 4 5 6 7
THD %
SN
R P
en
alt
y d
Bpenalty dB
1dB optical /2dB
Elec penalty
at 2.9% THD
2.7% THD

9
-1
0
1
2
3
4
5
6
7
8
0 1 2 3 4 5 6 7
THD %
SN
R P
en
alt
y d
B
PAM-8
PAM-16
PAM-8 vs PAM-16 Simulated THD Penalty
1dB optical /2dB
Elec penalty
at 1.9% THD for
PAM-16, 2.9%
for PAM-8
OIF 5% THD Spec for100G Coherent RXUsing balanced linear TIAs
PAM-8 and PAM-16 Receivers will need strict linearity specificationsPAM-16s small dynamic range will be further eroded by linearity constraints
10
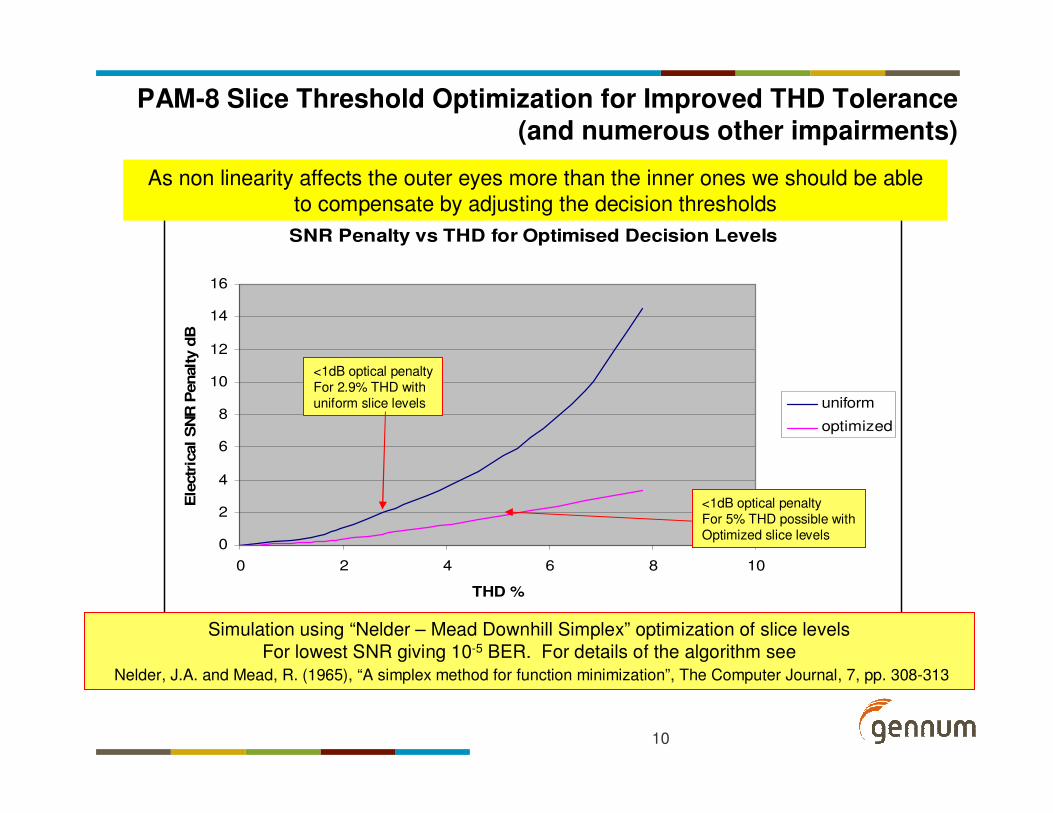
PAM-8 Slice Threshold Optimization for Improved THD Tolerance
(and numerous other impairments)
SNR Penalty vs THD for Optimised Decision Levels
0
2
4
6
8
10
12
14
16
0 2 4 6 8 10
THD %
Ele
ctr
ical S
NR
Penalty d
B
uniform
optimized
Simulation using “Nelder – Mead Downhill Simplex” optimization of slice levels
For lowest SNR giving 10-5 BER. For details of the algorithm see
Nelder, J.A. and Mead, R. (1965), “A simplex method for function minimization”, The Computer Journal, 7, pp. 308-313
<1dB optical penaltyFor 5% THD possible withOptimized slice levels
As non linearity affects the outer eyes more than the inner ones we should be able
to compensate by adjusting the decision thresholds
<1dB optical penaltyFor 2.9% THD withuniform slice levels

11
Simulated Optimized Decision Levels vs THD
Optimum Decision Levels vs THD
-1.14
-0.86
-0.57
-0.29
0.00
0.29
0.57
0.86
1.14
-1 0 1 2 3 4 5 6 7 8 9
THD %
Decis
ion
level/
peak d
ata
eye a
mp
litu
de
D0
D1
D2
D3
D4
D5
D6
+1.0
-1.0
8 Level Data Eye
7 Decision Thresholds
12
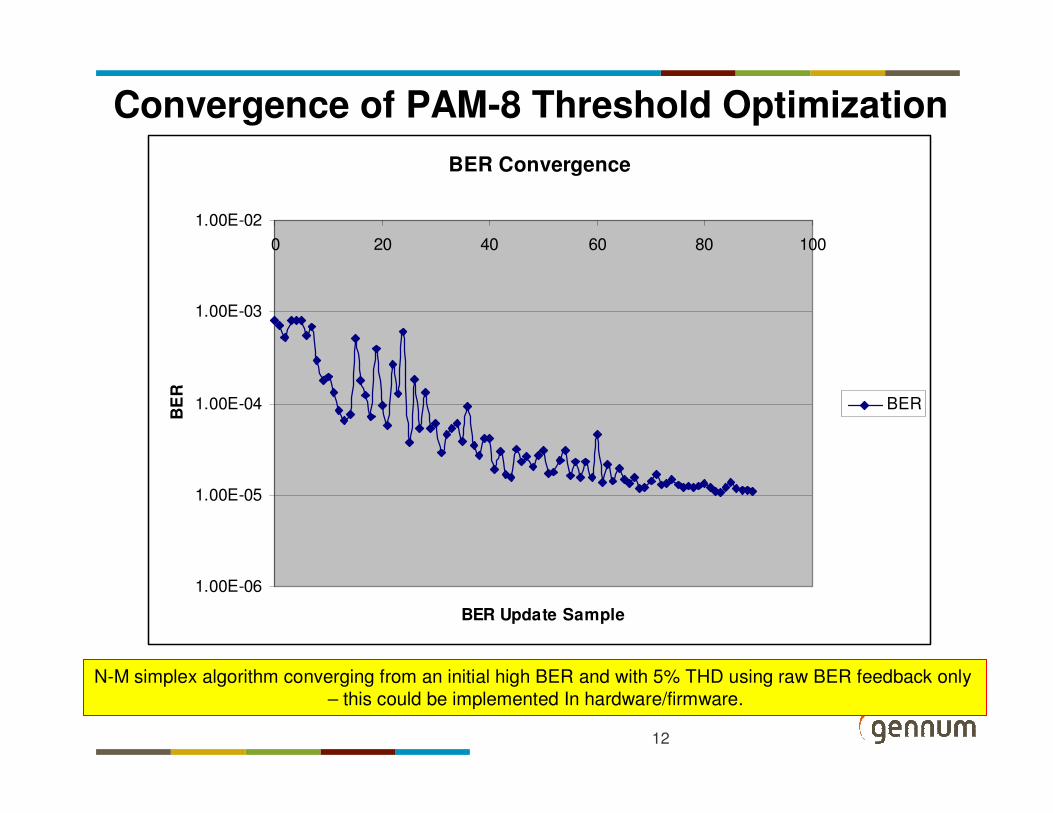
Convergence of PAM-8 Threshold Optimization
BER Convergence
1.00E-06
1.00E-05
1.00E-04
1.00E-03
1.00E-02
0 20 40 60 80 100
BER Update Sample
BE
R
BER
N-M simplex algorithm converging from an initial high BER and with 5% THD using raw BER feedback only
– this could be implemented In hardware/firmware.
13
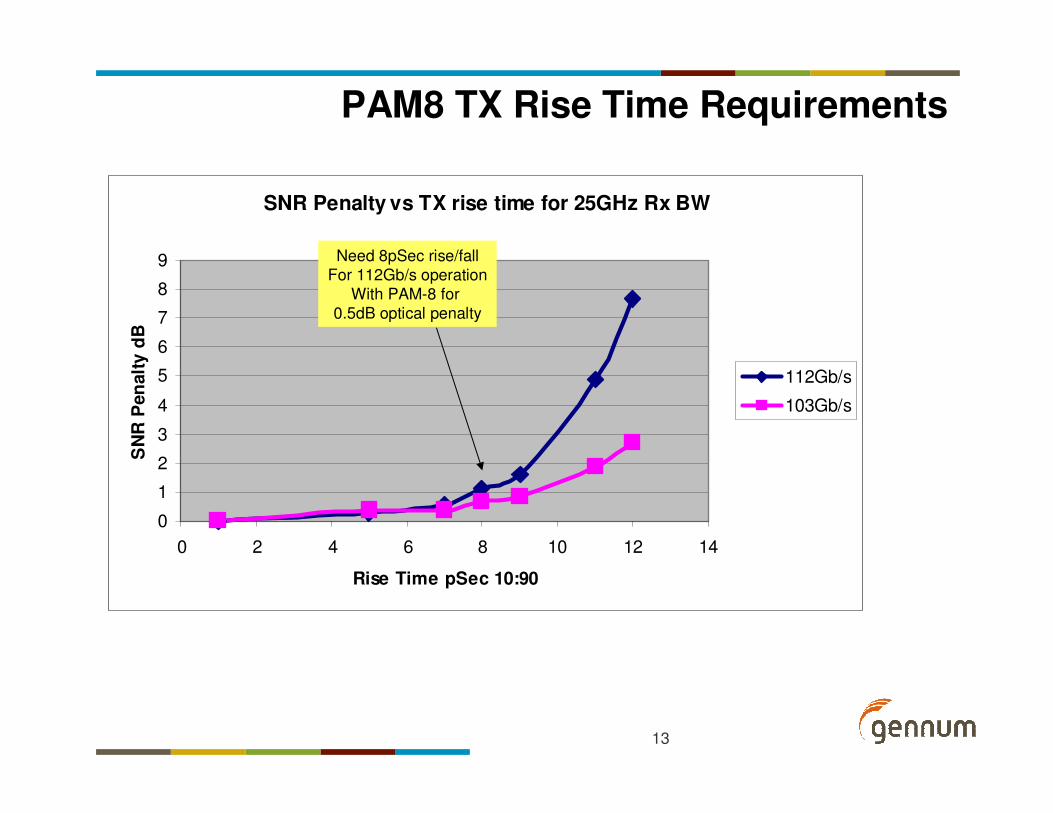
PAM8 TX Rise Time Requirements
SNR Penalty vs TX rise time for 25GHz Rx BW
0
1
2
3
4
5
6
7
8
9
0 2 4 6 8 10 12 14
Rise Time pSec 10:90
SN
R P
en
alt
y d
B
112Gb/s
103Gb/s
Need 8pSec rise/fall
For 112Gb/s operation
With PAM-8 for
0.5dB optical penalty

14
Rx Bandwidth Simulations112Gb/s Data
ISI Penalty for Different Rx Bandwidths
for 4pS & 8 pS Tx rise time (10:90)
-0.5
0
0.5
1
1.5
2
2.5
20 25 30 35 40 45 50
Rx 3dB Bandwidth GHz
Ele
ctr
ical
ISI
Pen
alt
y d
B
8pS Tr:Tf
4pS tr:tf
15
Conclusions
• PAM-16 without FEC requires a high SNR that is incompatible with practical optical
receiver overload limits. With FEC the dynamic range is improved but not enough to budget for 4dB path loss and 3-4 dB of impairment margin.
• PAM-8 without FEC is similarly too restrictive on dynamic range but PAM-8 with FEC seems capable of working with a reasonable loss budget.
• PAM-8 would need to achieve <3% max THD for 1dB optical penalty and PAM-16
would need <2%. These represent challenging targets particularly given the need to operate at high peak-peak photocurrents to maintain adequate SNR.
• Adaptive threshold approaches need to be used to relieved distortion requirements to realistic 5% range.
• Operation at 112Gb/s with an 8pS rise time Tx requires Rx bandwidths of the 30-35GHz. Improvement over current 25G modulator rise times (12pS) will be necessary.
• Further work:- Model development to establish realistic budget numbers. This must include Tx
imperfections (nonlinearity, phase response) and the Rx CDR & demux plus any equalization.
- Dual PAM4 approaches

16
Should we consider “dual PAM4”?
• PAM16- Simple implementation (no gearbox, simple clocking)
- Optical system does not support the approach
• PAM8- Optical system can support it but it is challenging (more power,
cost)
- Increased complexity, gearbox required, optical symbol rate is
higher than electrical bit rate (power, cost)
• “dual PAM4”- I&Q require coherent receiver
- Dual polarization requires good separation
- Dual laser may be a reasonable compromise

17
• Additional Material
18
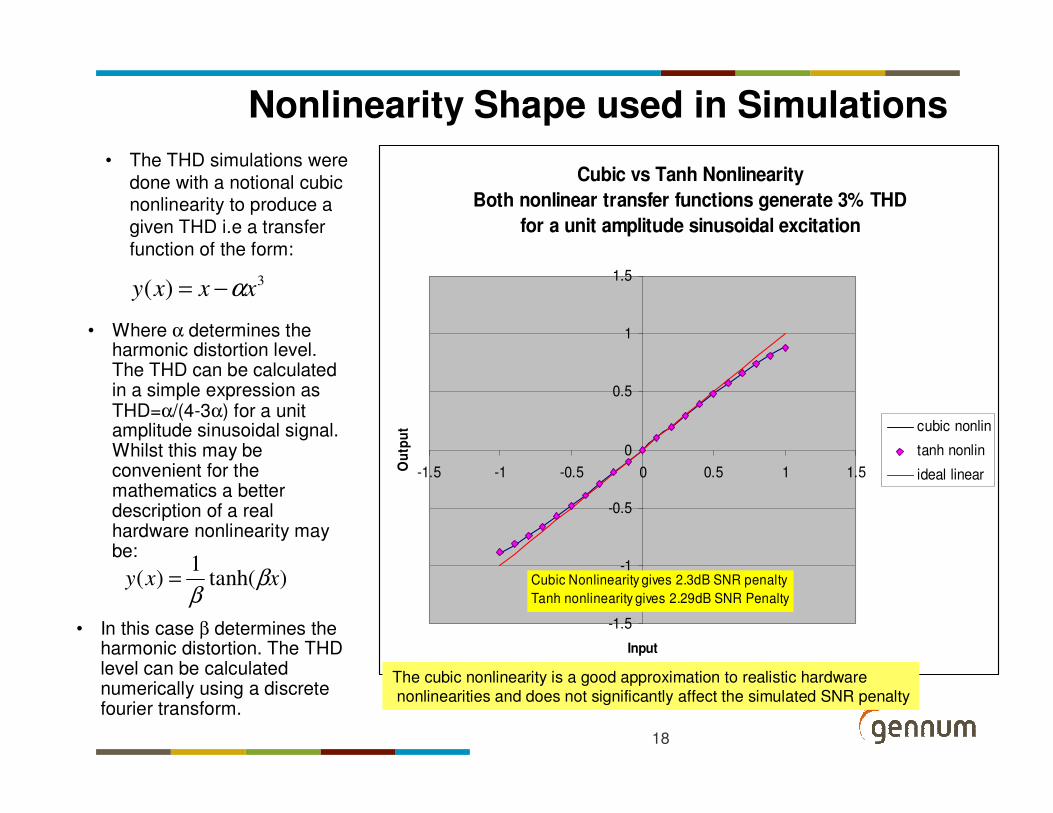
Nonlinearity Shape used in Simulations
• The THD simulations were
done with a notional cubic nonlinearity to produce a
given THD i.e a transfer
function of the form:
3)( xxxy α−=
• Where α determines the harmonic distortion level. The THD can be calculated in a simple expression as THD=α/(4-3α) for a unit amplitude sinusoidal signal. Whilst this may be convenient for the mathematics a better description of a real hardware nonlinearity may be:
)tanh(1
)( xxy ββ
=
• In this case β determines the harmonic distortion. The THD level can be calculated numerically using a discrete fourier transform.
Cubic vs Tanh Nonlinearity
Both nonlinear transfer functions generate 3% THD
for a unit amplitude sinusoidal excitation
-1.5
-1
-0.5
0
0.5
1
1.5
-1.5 -1 -0.5 0 0.5 1 1.5
Input
Ou
tpu
t cubic nonlin
tanh nonlin
ideal linear
Cubic Nonlinearity gives 2.3dB SNR penalty
Tanh nonlinearity gives 2.29dB SNR Penalty
The cubic nonlinearity is a good approximation to realistic hardware
nonlinearities and does not significantly affect the simulated SNR penalty


