Faculty of Bioscience Engineering
Academic year 2012 – 2013
OZONATION OF BIOLOGICALLY TREATED LANDFILL LEACHATE
VIOLET ATIENO OLOIBIRI
Promotors: Prof. Dr. Ir. Stijn Van Hulle
Prof. Dr. Ir. Kristof Demeestere
Tutor: ing. Michael Chys
Master’s dissertation submitted in partial fulfillment of the requirements for the degree of Master of Environmental Sanitation.
i | P a g e
Copyright
The author and the promoters give the permission to use this thesis for consultation and to copy parts
of it for personal use. Every other use is subject to the copyright laws; more specifically the source must
be extensively specified when using results from this thesis.
Ghent, August 23rd 2013
Promotor Promotor Author,
Prof. Dr. ir. Stijn Van Hulle Prof. Dr. ir. Kristof Demeestere Violet Atieno Oloibiri
ii | P a g e
Dedication
To my dad Tobias Okech Oloibiri and mum Margaret Akinyi.
iii | P a g e
Acknowledgement Mak koni amak kocha – Luo proverb
I thank God for the strong people I have met during this research/study whose support and guidance are
invaluable.
I sincerely thank my promoters Prof. Stijn Van Hulle and Prof. Kristof Demeestere for introducing me to
one of the most interesting yet compex research topics. Your patience, mentorship and critical
assessment has made me a better scholar and researcher. My gratitude goes to my tutors Michael Chys
and Leendert Vergeynst for their tutelage and insightfull suggestions which made this thesis better.
Special thank to Sylvie Bauwens and Veerle Lambert; because of your firm direction and counsel I have
made it. To my collegues Gizeshwork, Yahui and Soknet thank you for the wonderful life lessons you
have taught me.
Am indebted to my parents -Tobias Okech and Margaret Akinyi - who gave up their dreams so that I can
achieve mine. I can never repay you. My heartfelt gratitude goes to my Belgian parents for their
encouragement and support. Finally, to my fiancé Mathieu Van Lancker thank you for your support and
kindness.
Violet Atieno Oloibiri
August 2013
iv | P a g e
Table of contents
COPYRIGHT ........................................................................................................................................ I
DEDICATION ..................................................................................................................................... II
ACKNOWLEDGEMENT ...................................................................................................................... III
TABLE OF CONTENTS ........................................................................................................................ IV
LIST OF FIGURES .............................................................................................................................. VII
LIST OF TABLES .............................................................................................................................. VIII
ABREVIATIONS AND NOTATIONS ...................................................................................................... IX
ABSTRACT ......................................................................................................................................... X
CHAPTER 1: INTRODUCTION ...............................................................................................................1
1.1. BACKGROUND AND JUSTIFICATION .........................................................................................1
CHAPTER 2: LITERATURE REVIEW .......................................................................................................5
2.1. LANDFILLING AND LANDFILL LEACHATE ...................................................................................5
2.1.1. Organic characteristics of landfill leachate ................................................................................... 6
2.1.2. Inorganic components of landfill leachate ................................................................................... 7
2.1.3. Overall leachate composition ....................................................................................................... 8
2.2. TREATMENT OF LANDFILL LEACHATE .......................................................................................9
2.2.1. Conventional techniques .............................................................................................................. 9 2.2.1.1. Recycling ................................................................................................................................... 9 2.2.1.2. Combined treatment with municipal waste water ................................................................... 9 2.2.1.3. Biological treatment ................................................................................................................ 10 2.2.1.4. Physical – chemical methods .................................................................................................. 14
2.2.2. Advanced techniques .................................................................................................................. 16 2.2.2.1. Membrane techniques ............................................................................................................ 16 2.2.2.2. Advanced oxidation processes ................................................................................................ 18
v | P a g e
2.3. EMERGING ORGANIC COMPOUNDS IN LANDFILL LEACHATE ................................................... 24
2.3.1. Pharmaceuticals in landfill leachate ........................................................................................... 25
2.3.2. Pesticides in landfill leachate ...................................................................................................... 28
2.3.3 Analytical techniques to measure organic micropollutants in landfill leachate ............................. 31
CHAPTER 3: SCOPE .......................................................................................................................... 33
CHAPTER 4: MATERIALS AND METHODS .......................................................................................... 34
4.1. SAMPLING OF LANDFILL LEACHATE ........................................................................................ 34
4.2. OZONATION OF BIOLOGICALLY TREATED LANDFILL LEACHATE ............................................... 34
4.2.1. Standardization of the indigo method to measure dissolved ozone using the iodometric reference method ....................................................................................................................................... 34
4.2.1.1 Chemicals ................................................................................................................................ 34 4.2.1.2. Standardization of the indigo method to measure ozone in the leachate matrix ................. 34
4.2.2 Ozonation experiments ................................................................................................................... 36
4.3. MASS SPECTROMETRY BASED ANALYSIS OF EMERGING ORGANIC MICROPOLLUTANTS IN LANDFILL LEACHATE ......................................................................................................................... 37
4.3.1 Solid-phase extraction (SPE) ........................................................................................................... 40
4.3.2. Target analysis using magnetic sector mass spectrometry (AmberLAB facilities) ...................... 41
4.3.3. Screening analysis using Orbitrap mass spectrometry ............................................................... 41
CHAPTER 5: RESULTS AND DISCUSSION............................................................................................. 43
5.1 CHARACTERIZATION OF THE LANDFILL LEACHATE AFTER BIOLOGICAL TREATMENT ................ 43
5.1.1. Measurement of physical-chemical parameters ........................................................................ 43
5.1.2. Emerging organic micro-pollutants: target analysis of pharmaceutical residues....................... 44
5.2. OZONATION OF BIOLOGICALLY TREATED LANDFILL LEACHATE ............................................... 46
5.2.1. Effect of flow rate and generator capacity on the ozonation process .................................. 46
5.2.2. The effect of time on ozonation efficiency ......................................................................... 49
vi | P a g e
5.2.3. The effect of initial COD concentration on ozonation efficiency .......................................... 50 5.2.3.1. COD removal with time ........................................................................................................... 50 5.2.3.2. UV254 absorbance reduction with time ................................................................................. 51 5.2.3.3. Ozone in gas and liquid phase................................................................................................. 52 5.2.3.4. Ozone utilization ..................................................................................................................... 53
5.2.4 The effect of starting pH on ozonation efficiency ................................................................... 54 5.2.4.1. COD removal with time ........................................................................................................... 55 5.2.4.2. UV254 absorbance reduction with time ................................................................................. 56 5.2.4.3. Ozone in gas and liquid phase................................................................................................. 56 5.2.4.4. Ozone utilization ..................................................................................................................... 57
5.2.5. Biodegradability of ozonated landfill leachate .................................................................... 58
5.3. BEHAVIOR OF MICRO-POLLUTANTS DURING LEACHATE OZONATION: SCREENING OF SUSPECTED MICRO-POLLUTANTS BEFORE AND AFTER OZONATION BY FULL-SPECTRUM HIGH-RESOLUTION MASS SPECTROMETRY ................................................................................................. 60
CHAPTER 6:CONCLUSIONS AND RECOMENDATIONS ......................................................................... 65
6.1. CONCLUSION ........................................................................................................................ 65
6.2. RECOMMENDATIONS ............................................................................................................ 66
REFERENCES .................................................................................................................................... 67
vii | P a g e
List of figures Figure 1: Bird’s eye view of the IMOG landfill site in Moen. ........................................................................ 1
Figure 2:IMOG's landfill leachate treatment plant. ...................................................................................... 3
Figure 3:Phases of a landfill showing variation in gas and leachate quality with age. ............................... 6
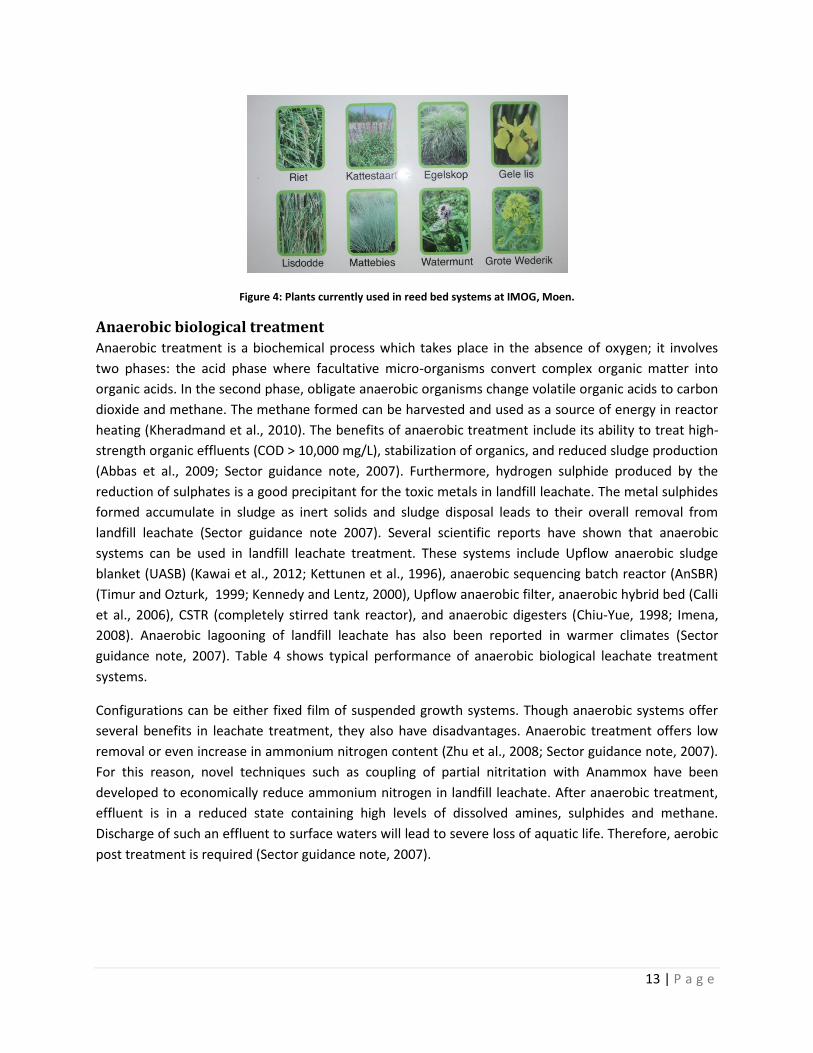
Figure 4: Plants currently used in reed bed systems at IMOG, Moen. ....................................................... 13
Figure 5: Membrane types and potential particles that can be removed. ................................................. 17
Figure 6: Effect of pH on COD removal during Fenton oxidation. .............................................................. 19
Figure 7: COD removal efficiency of photocatalysis with irradiation at 1400–1960 μW/cm2. .................. 21
Figure 8:Removal of dissolved organic carbon, UV 254 absorbance and polyphenols in landfill leachate 21
Figure 9: Corona discharge ozone generator .............................................................................................. 22
Figure 10: Oxidation pathways during ozonation of leachate. ................................................................... 22
Figure 11: Pathways of pharmaceutical fate from household to the environment ................................... 26
Figure 12: Preferred disposal methods for pharmaceuticals in the UK ...................................................... 27
Figure 13: Consumption of pesticides in the mid 1990’s ............................................................................ 29
Figure 14: Calibration curve for dissolved ozone in buffer solution. .......................................................... 35
Figure 15: Ozonation reactor and experimental set-up. ............................................................................ 36
Figure 16: SPE extraction using the Vacmaster-10 device. ......................................................................... 40
Figure 17: mg Supplied Ozone per L leachate as a function of time, gas flow rate and generator capacity.
.................................................................................................................................................................... 48
Figure 18: Procentual reduction of COD as a function of time, gas flow rate and generator capacity ...... 48
Figure 19: Procentual reduction of UV254 as a function of time, gas flow rate and generator capacity. . 49
Figure 20: Reduction in COD concentration and UV254 absorbance as a function of time. .................... 50
Figure 21: Procentual reduction of COD as a function of initial COD concentration and time ................ 51
Figure 22: Procentual UV 254 reduction as a function of initial COD concentration and time. ................. 51
Figure 23: Evolution of the ozone off gas concentration with time during ozonation at various initial COD
concentrations ............................................................................................................................................ 52
Figure 24: Evolution of dissolved ozone concentration as a function of time and initial COD
concentration .............................................................................................................................................. 53
Figure 25: COD removal as a function of ozone consumed and initial COD concentration. ...................... 53
Figure 26: Ozone utilization as a function of initial COD concentration..................................................... 54
Figure 27: pH evolution during ozonation of landfill leachate 2 as a function of time. ............................. 54
Figure 28: Absolute COD reduction as a function of starting pH and time. ............................................... 55
Figure 29: Absolute UV254 reduction in landfill leachate as a function of starting pH and time. ............. 56
Figure 30: Evolution of the ozone off gas concentration with time at various pH . ................................... 57
Figure 31: Evolution of dissolved ozone concentration as a function of time and starting pH. ................. 57
Figure 32: COD removal as a function of ozone consumed at various pH. ................................................ 57
Figure 33: Ozone utilization as a function of starting pH. .......................................................................... 58
Figure 34: Absolute BOD5 produced as a function of initial COD concentration ........................................ 59
Figure 35: BOD5/COD as a function of initial COD concentration .............................................................. 59
Figure 36: Absolute BOD5 production and BOD5/COD at various initial pH after 60 minutes of ozonation.
.................................................................................................................................................................... 60
viii | P a g e
Figure 37: Three step procedure used in the identification of compounds detected by Orbitrap mass
spectrometry. .............................................................................................................................................. 61
Figure 38: Obtained isotopic pattern and calculated isotopic pattern of chloridazon. ............................ 62
Figure 39: Obtained isotopic pattern and calculated isotopic pattern of phenazon. ............................... 62
List of tables Table 1: Summarized information on the landfill and green composting site (IMOG). ............................... 2
Table 2: Classification of landfill leachate according to age ......................................................................... 8
Table 3: Typical performance of attached growth biological treatment systems. ..................................... 12
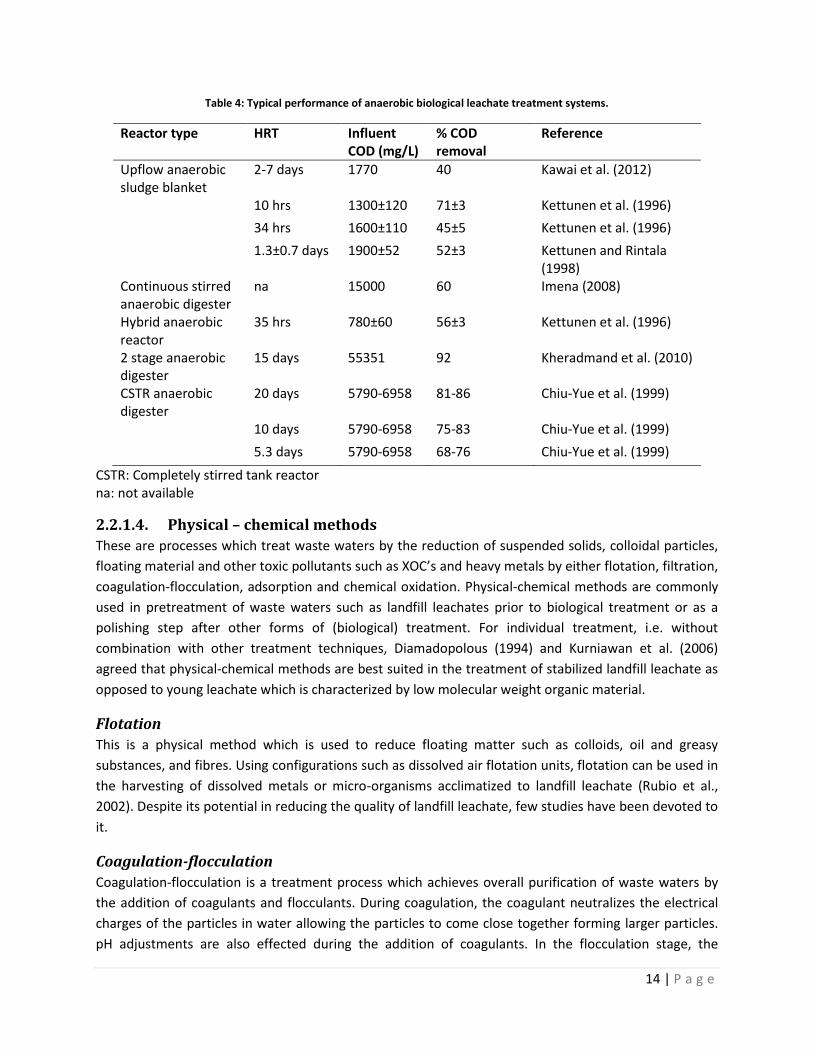
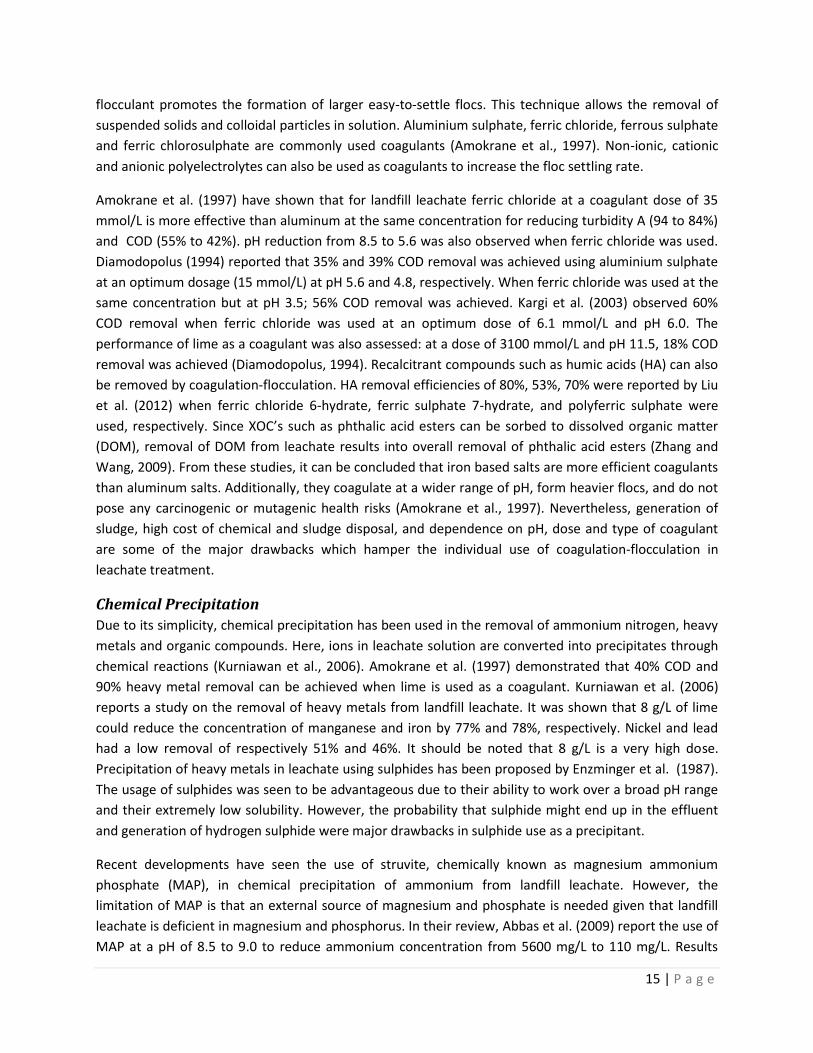
Table 4: Typical performance of anaerobic biological leachate treatment systems. ................................. 14
Table 5: Oxidation potential of some oxidizing agents. .............................................................................. 19
Table 6: Efficiency of Fenton oxidation in the treatment of landfill leachate ............................................ 20
Table 7: Efficiency of ozonation in the treatment of landfill leachate. ...................................................... 24
Table 8: Detected pharmaceuticals in landfill leachate. ............................................................................. 28
Table 9: Detected pesticides in landfill leachate ........................................................................................ 30
Table 10: List of pharmaceuticals analyzed during target analysis using magnetic sector mass
spectrometry. .............................................................................................................................................. 38
Table 11: List of screened suspect compounds. ......................................................................................... 42
Table 12: Landfill leachate characterization. .............................................................................................. 43
Table 13: Pharmaceutical compounds detected in biologically treated leachate. ..................................... 44
Table 14: Resulting ozone concentrations in the inlet gas flow depending on flow rate and generator
capacity. ...................................................................................................................................................... 47
Table 15: Total amount of ozone consumed per litre of leachate during ozonation at various leachate
pH. ............................................................................................................................................................... 55
Table 16: Compounds detected using Orbitrap Mass Spectrometry. ........................................................ 64
ix | P a g e
Abreviations and notations IMOG: Intergemeentelijke Maatschappij voor Openbare Gezondheid in Zuid-West-Vlaanderen
BOD5: Biological Oxygen Demand
COD: Chemical Oxygen Demand
UV254: Ultra Violet absorbance at 254 nm
MSW: Municipal Solid Waste
SBR: Sequential Batch Reactor
TCOD: Total Chemical Oxygen Demand
DOM: Dissolved Organic Matter
HRT: Hydraulic Retention Time
XOC: Xenobiotic Organic Substances
ANR: Autotrophic Nitrogen Removal
AOP: Advanced Oxidation Processes
PIT: Potassium Indigo Trisulphonate
API: Active Pharmaceutical Ingredients
PEG: Polyethylene Glycol
SPE: Solid-Phase Extraction
MS: Mass Spectrometry
HPLC: High-Performance Liquid Chromatography
NSAID: Non-Steroidal Anti-Inflammatory Drugs
S/N: Signal-To-Noise Ratio
XIC: Extracted Ion Chromatograms
TIC: Total Ion Chromatogram
IsP: Obtained Isotopic Pattern
tR: Chromatographic Retention Time
x | P a g e
Abstract
Biological waste water treatment techniques encounter serious limitations in the treatment of landfill
leachate. These include the inability to biodegrade recalcitrant organic matter or certain xenobiotic
organic compounds such as pharmaceuticals and pesticides. Eventually, this burdens consecutive steps
or can cause pollution to surface waters upon discharge due to the high background concentrations. For
this reason, the use of ozonation was proposed as a post treatment step to biological treatment.
To obtain a better understanding of the factors influencing the efficiency of ozonation, the role of
starting pH, initial COD concentration, inlet gas flow rate and ozone generator capacity were
investigated. The influence of each factor at various conditions was assessed according to the COD
concentration and UV254 absorbance reduction, ozone consumption and utilization, and BOD5
generation.
The results indicate that higher flow rates and ozone generating capacity (1000 ml/min – 100%) are able
to reduce the COD concentration and UV254 absorbance by 27% and 58%, respectively, after 60
minutes of ozonation. High COD concentration (44%) and UV254 absorbance (77%) reduction was
observed at a 112 mg/L initial COD concentration due to the presence of less organic matter for
oxidation. In comparison, only 4% COD and 26 % UV254 reduction was achieved at an initial COD of
1846 mg/L. Ozone utilization as a function of initial COD concentration ranged between 0.23-0.48 mg
COD removed per mg ozone consumed. The amount of BOD5 produced after 60 minutes of ozonation
increased with higher initial COD concentration, leading to a general increase in BOD5/COD of the
leachate. The process was the most efficient at alkaline conditions. Up to 200 mg/L COD was removed at
pH 10 compared to 50 mg/L at neutral pH 7 within the same ozonation time. At all pH conditions, the
biodegradability of the leachate increased during ozonation.
The occurence of 43 multi-class pharmaceuticals in biologically treated leachate was investigated by
carrying out quantitative target analysis using SPE followed by HPLC coupled with a high resolution
magnetic sector mass spectrometer. The results enabled the quantification of 3 of these target
compounds: metronidazole (121 ng/L), sulfamethazine (94 ng/L) and diclofenac (48 ng/L).
Carbamazepine and five other compounds were also detected but could not be quantified (3 ≤ S/N ratio
< 10). Apart from this target analysis, a broader suspect screening towards the presence of organic
micropollutants in biologically treated and ozonated leachate was performed using HPLC coupled to a
high resolution orbitrap mass spectrometer. Based on a developed identification decision tree,
sulfamethazine, carbamazepine and amoxicillin were unequivocally identified in biologically treated
landfill leachate; a clear indication that they were present in the leachate samples. The herbicide
chloridazon was probably identified, while phenazone and naproxen were only indicatively identified.
Ozonation of biological leachate resulted in the removal (towards a concentration below the detection
limit) of amoxicillin, sulfamethazine, carbamazepine, phenazon and naproxen. The peak area of
chloridazon was reduced by about 75% after 60 min of ozonation, and the peak area of metronidazole
increased with further ozonation.
xi | P a g e
Overall, the results obtained in this work show that better ozonation is achieved at higher flow rates of
the ozone containing gas, at alkaline pH, and at low initial COD concentrations in the landfill leachate.
Additionally, landfill leachate indicated to be a significant source of micropollutants that cannot be
ignored. Though ozonation can oxidize some of these pollutants, further research is still required to
better understand their behaviour.
1 | P a g e
CHAPTER 1
INTRODUCTION
1.1. Background and Justification Sustainable waste management has been a concern for many cities around the world. This situation is
not any different in Belgium where municipalities are responsible for the waste generated by their
inhabitants. The cooperation of several municipalities has seen the creation of public companies which
undertake waste management on behalf of the municipalities. However, even as these companies
endeavor to achieve sustainable waste management, stringent environmental legislations have been
imposed to maintain or improve environmental integrity. Subsequently, these companies have to adopt
advanced technological methods to ensure these regulations are upheld.
One such inter-municipal co-operation is the “Intergemeentelijke Maatschappij voor Openbare
Gezondheid in Zuid-West-Vlaanderen”, in short IMOG. It consists of 11 municipalities and is located in
the south-west region of Flanders. IMOG is mandated to provide sustainable waste management
services to more than 229,000 inhabitants of these municipalities. To accomplish this, IMOG runs two
sites: one located in Moen and the other in Harelbeke. The company’s main activities include
incineration and sorting of plastic bottles and flasks, metal packaging, drinks cartons (PMD) and paper
cardboards, which are done at the Harelbeke site, and green composting, landfilling and leachate
treatment which take place at Moen. The aforementioned activities are done to promote material
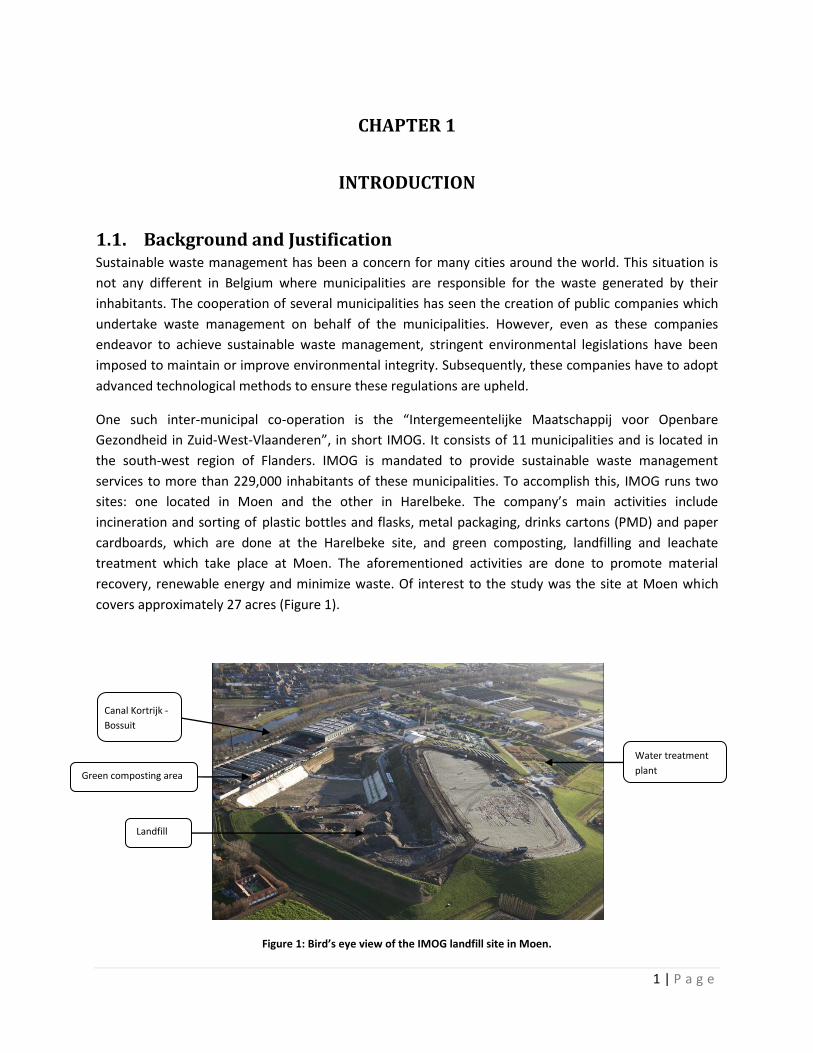
recovery, renewable energy and minimize waste. Of interest to the study was the site at Moen which
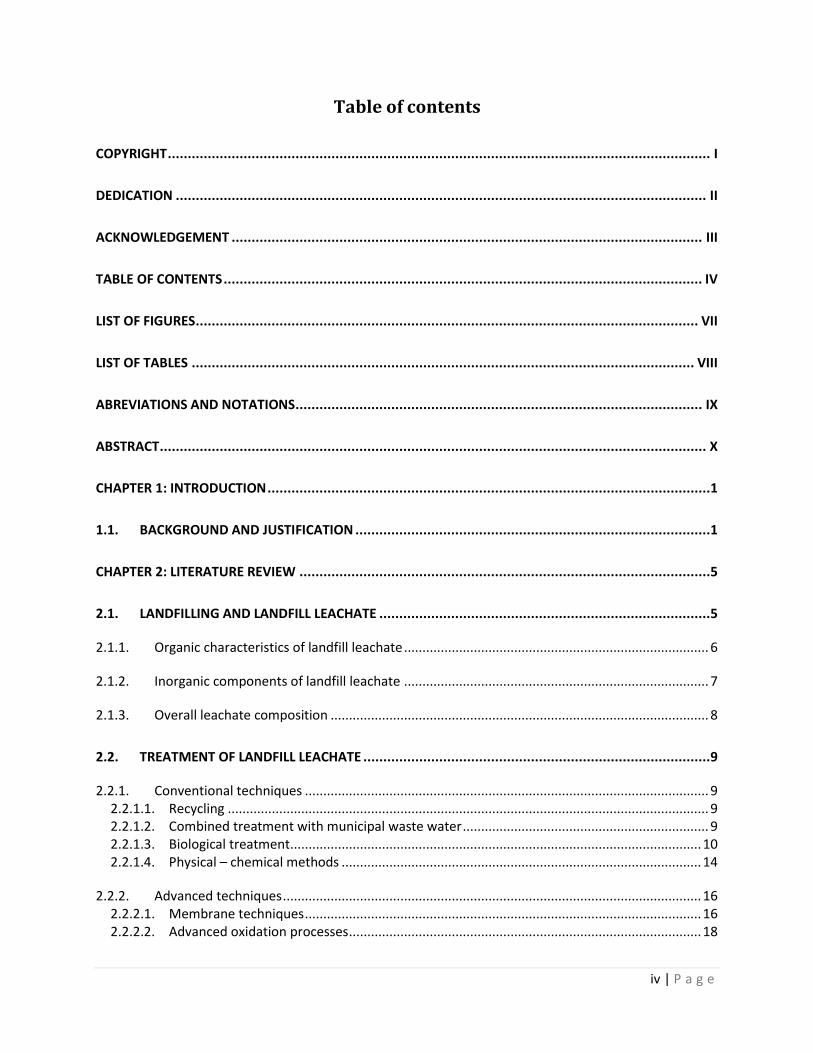
covers approximately 27 acres (Figure 1).
Figure 1: Bird’s eye view of the IMOG landfill site in Moen.
Green composting area
Landfill
Canal Kortrijk -
Bossuit
Water treatment
plant
2 | P a g e
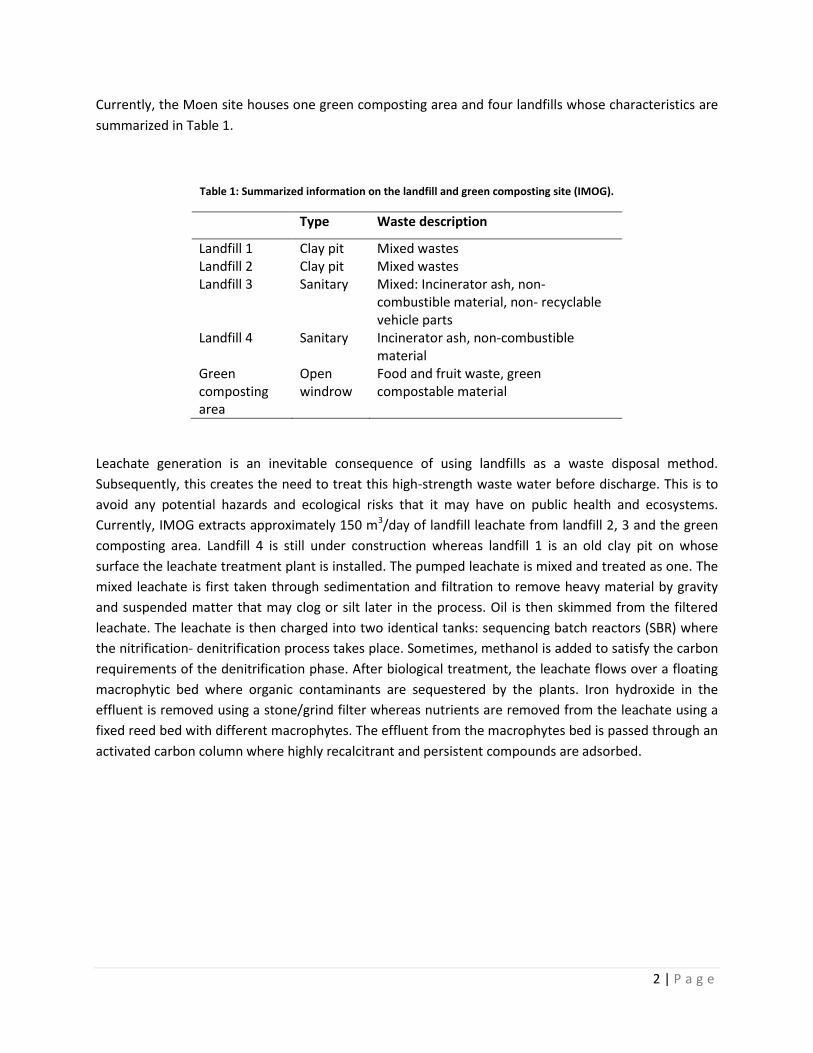
Currently, the Moen site houses one green composting area and four landfills whose characteristics are
summarized in Table 1.
Table 1: Summarized information on the landfill and green composting site (IMOG).
Type Waste description
Landfill 1 Clay pit Mixed wastes Landfill 2 Clay pit Mixed wastes Landfill 3 Sanitary Mixed: Incinerator ash, non-
combustible material, non- recyclable vehicle parts
Landfill 4 Sanitary Incinerator ash, non-combustible material
Green composting area
Open windrow
Food and fruit waste, green compostable material
Leachate generation is an inevitable consequence of using landfills as a waste disposal method.
Subsequently, this creates the need to treat this high-strength waste water before discharge. This is to
avoid any potential hazards and ecological risks that it may have on public health and ecosystems.
Currently, IMOG extracts approximately 150 m3/day of landfill leachate from landfill 2, 3 and the green
composting area. Landfill 4 is still under construction whereas landfill 1 is an old clay pit on whose
surface the leachate treatment plant is installed. The pumped leachate is mixed and treated as one. The
mixed leachate is first taken through sedimentation and filtration to remove heavy material by gravity
and suspended matter that may clog or silt later in the process. Oil is then skimmed from the filtered
leachate. The leachate is then charged into two identical tanks: sequencing batch reactors (SBR) where
the nitrification- denitrification process takes place. Sometimes, methanol is added to satisfy the carbon
requirements of the denitrification phase. After biological treatment, the leachate flows over a floating
macrophytic bed where organic contaminants are sequestered by the plants. Iron hydroxide in the
effluent is removed using a stone/grind filter whereas nutrients are removed from the leachate using a
fixed reed bed with different macrophytes. The effluent from the macrophytes bed is passed through an
activated carbon column where highly recalcitrant and persistent compounds are adsorbed.
3 | P a g e
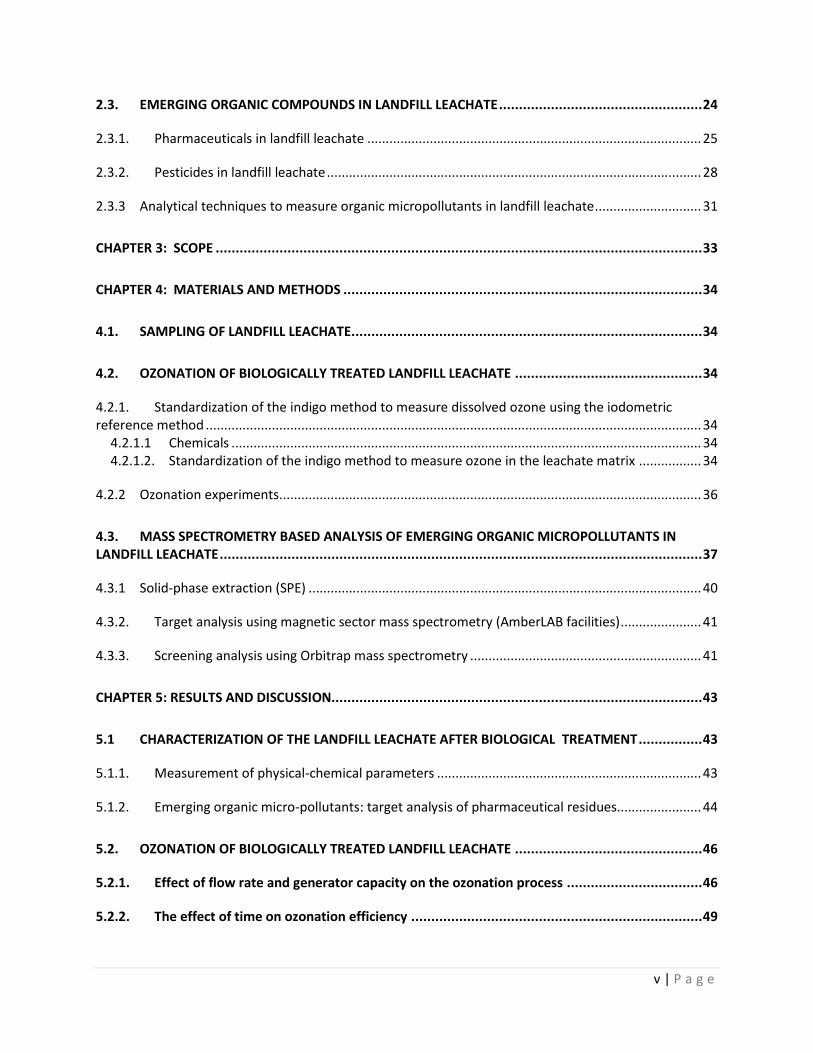
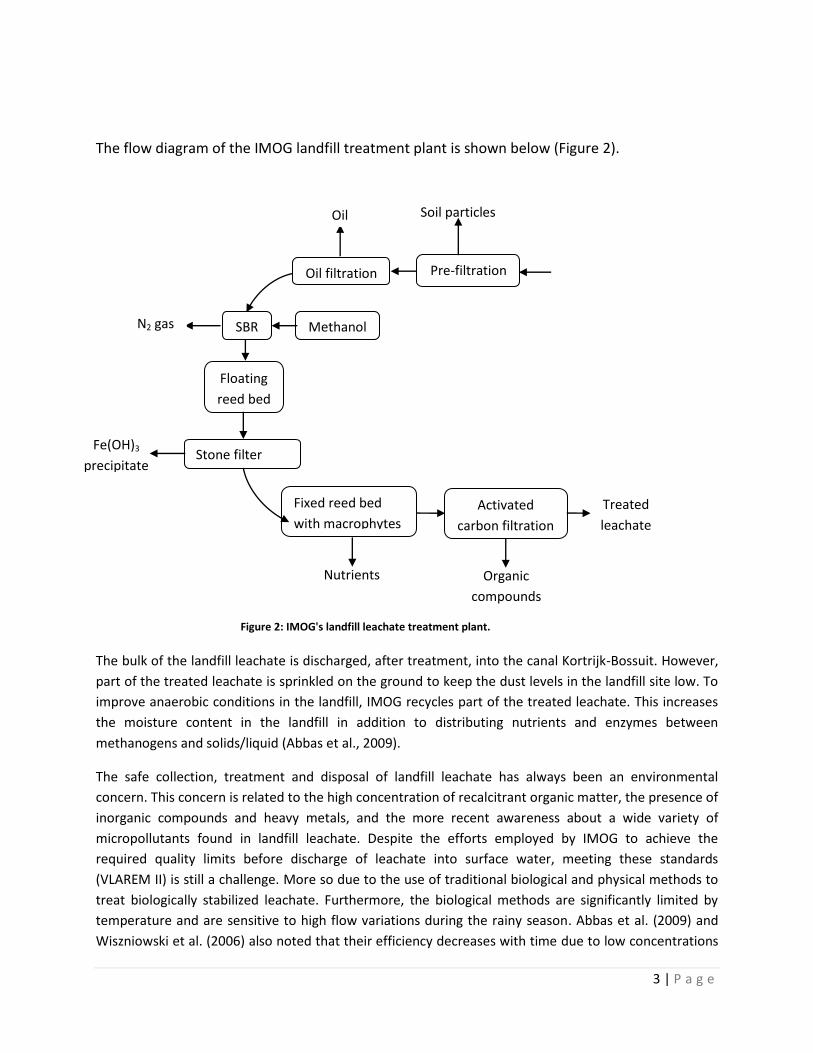
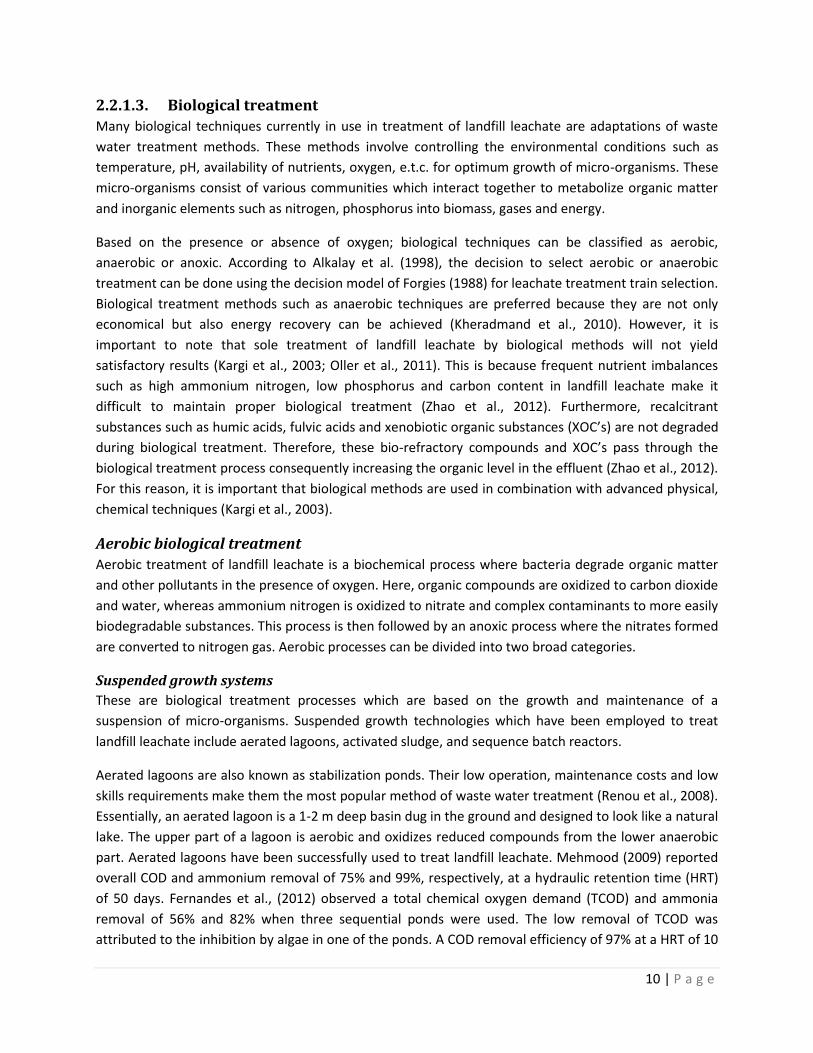
The flow diagram of the IMOG landfill treatment plant is shown below (Figure 2).
The bulk of the landfill leachate is discharged, after treatment, into the canal Kortrijk-Bossuit. However,
part of the treated leachate is sprinkled on the ground to keep the dust levels in the landfill site low. To
improve anaerobic conditions in the landfill, IMOG recycles part of the treated leachate. This increases
the moisture content in the landfill in addition to distributing nutrients and enzymes between
methanogens and solids/liquid (Abbas et al., 2009).
The safe collection, treatment and disposal of landfill leachate has always been an environmental
concern. This concern is related to the high concentration of recalcitrant organic matter, the presence of
inorganic compounds and heavy metals, and the more recent awareness about a wide variety of
micropollutants found in landfill leachate. Despite the efforts employed by IMOG to achieve the
required quality limits before discharge of leachate into surface water, meeting these standards
(VLAREM II) is still a challenge. More so due to the use of traditional biological and physical methods to
treat biologically stabilized leachate. Furthermore, the biological methods are significantly limited by
temperature and are sensitive to high flow variations during the rainy season. Abbas et al. (2009) and
Wiszniowski et al. (2006) also noted that their efficiency decreases with time due to low concentrations
Treated
leachate
Nutrients
Fixed reed bed
with macrophytes
Pre-filtration
Soil particles
Floating
reed bed
Stone filter
Oil filtration
SBR
Activated
carbon filtration
Oil
N2 gas
Fe(OH)3
precipitate
Organic
compounds
Methanol
Figure 2: IMOG's landfill leachate treatment plant.
4 | P a g e
of biodegradable organics and high concentration of recalcitrant compounds which are abundant in old
landfill leachate. Low efficiency results in high operating costs due to addition of methanol as a carbon
source and increased usage of activated carbon due to short breakthrough time.
Recent studies have also shown landfills as significant sources of new and emerging pollutants, e.g.
pharmaceuticals and personal care products, pesticides, which are present at nano- and microgram per
liter levels (Huset et al., 2011; Eggen et al., 2010; Benfenati et al., 2003; Benfenati et al., 1999). Most of
these pollutants are biorecalcitrant and are not completely removed by biological techniques of waste
water treatment (Seredynska-Sobecka et al., 2005). Moreover, some of these organic pollutants inhibit
the micro-organisms used (Monserrat and Damia, 2000). Due to their unique chemical and physical
characteristics, these emerging pollutants have been reported in landfill leachate and consequently in
environmental matrices. Huset et al. (2011) also noted that leachate recirculation promotes high in-situ
moisture contents. This can lead to contaminant redissolution; hence increasing their concentration in
leachate. These emerging pollutants are persistent in the environment and have adverse effects on the
aquatic environment and human health (Kurniawan et al., 2006; Seredynska-Sobecka et al., 2005).
The search for improved methods for landfill leachate treatment has led to the increased interest in
advanced technologies such as autotrophic nitrogen removal (ANR) and advanced oxidation processes
(AOP’s) (Deng, 2009) to treat mature leachate. These two types of technology are known to promote
conversion of reduced nitrogen to their highest stable state and to improve the degradation of
recalcitrant organic compounds, respectively (Wei et al., 2010). For instance, 97% of the organic matter
could be removed using a combination of H2O2/O3 as oxidants (Wei et al., 2010). Apart from its potential
to degrade the bulk organic matter, also the possibility to convert biorecalcitrant micropollutants into
more biodegradable compounds and low operation variations make AOP’s promising techniques in
landfill leachate treatment. Use of AOP’s in treatment of biologically stabilized landfill leachate could
improve IMOG’s and other companies’ adherence to stipulated and future environmental legislations
Therefore, this study will focus on (i) the treatment of landfill leachate using advanced oxidation
processes to reduce organic constituents, and (ii) the use of advanced chemical analytical techniques to
investigate the presence of potential organic micropollutants in biologically and chemically treated
landfill leachate.
5 | P a g e
CHAPTER 2
LITERATURE REVIEW
2.1. Landfilling and Landfill Leachate Landfilling is still the most common mode of waste disposal especially in developing countries. Up to
95% of municipal solid waste (MSW) generated in the world is landfilled (Wei et al., 2010). Almost 80 –
90% of MSW produced each year in Kenya is landfilled (Chandaria, 2013). In developed countries such as
USA; over 50% MSW is landfilled annually (Deng, 2009). In contrast, according to a United Nations waste
management report in 2006, the Flemish region of Belgium landfilled 15% of industrial waste which is
approximately 3 million tones.
The preference of landfilling over other waste disposal methods such as incineration is because it is
argued to be economical, less polluting and safe. Moreover, methods such as incineration produce 10-
20% residues which must be landfilled (Abbas et al., 2009). Landfills are further overused due to the
disposal of municipal biosolids which contain a variety of chemicals among them fluorochemicals,
pharmaceuticals, personal care products, pesticides, e.t.c (Huset et al., 2011).
Landfills are considered anaerobic ecosystems with a history of waste disposal (Huset et al., 2011). As
the waste in the landfill decomposes a combination of physical, biological and chemical reactions lead to
the generation of landfill leachate and landfill gas with varying characteristics.
According to Abdoli et al. (2012) and Deng, (2009), landfill leachate is high-strength waste water
generated when waste moisture and rain water percolate through the landfill after the water content of
the solid waste is well above the field capacity. The classification of this high-strength waste water as an
input of environmental pollution in ground water, surface water, and landfill environment is because of
its characteristics. These include: high concentration of biodegradable and non-biodegradable organic
matter with humic substances being an important group, ammonium nitrogen, inorganic salts and heavy
metals, and organic micropollutants (Muhammad et al., 2010). These characteristics are influenced by
factors such as age of landfill, waste type and composition, precipitation (Wei et al., 2010), site
hydrology, landfill design and operation, cover design, waste compaction, and interaction of the
leachate with the environment (Muhammad et al., 2010). In addition to the above factors, Kjeldsen et
al. (2002) argued that leachate sampling methods and sample handling routines can also influence
leachate characteristics. This was illustrated by a variation in concentration of heavy metals with varying
concentration of colloidal matter. The variation in concentration of colloidal matter was achieved by
varying the pumping rate at the collection point. Currently, no standard protocols for sampling, filtration
and storage of leachate are available.
6 | P a g e
Time (Years)
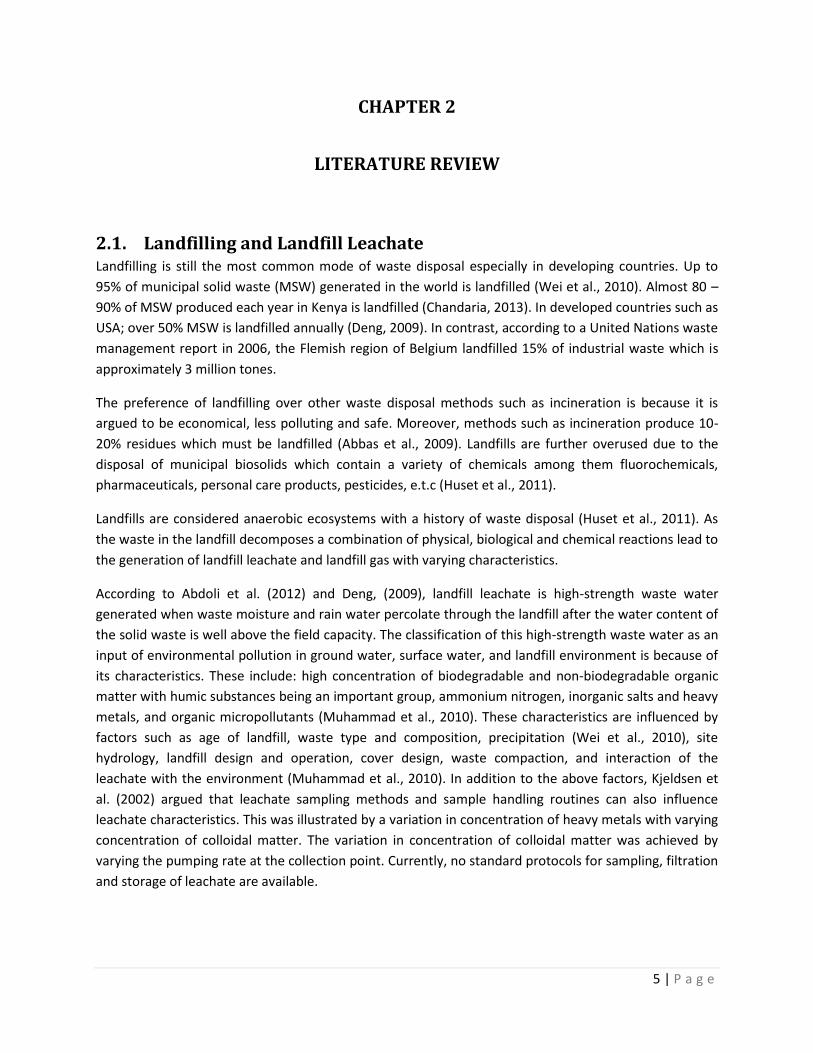
2.1.1. Organic characteristics of landfill leachate Biodegradable organic constituents such as carbohydrates, lipids, cellulosic material e.t.c present in
landfill waste are decomposed in a series of four major phases. These include: the aerobic phase,
anaerobic acid phase, initial and stable methanogenic phase, and methane oxidation (Figure 3). The air
intrusion, carbon dioxide and soil air stages are theoretical and speculative as reported by Kjeldsen et al.
(2002).
Figure 3:Phases of a landfill showing variation in gas (top) and leachate (down) quality with age (Kjeldsen et al., 2002).
In the aerobic phase, aerobic bacteria consume oxygen while degrading complex carbohydrates,
proteins, lipids and other biodegradable compounds present in organic matter. During this phase
nitrogen gas is produced, but this decreases with time. On the other hand, carbon dioxide concentration
increases due to bacterial respiration. The aerobic phase can last for several days or months depending
on the amount of oxygen available. During this phase, waste is considered to be below field capacity.
Hence, leachate produced is due to the release of moisture and short circuiting of precipitation through
the waste (Kjeldsen et al., 2002).
In the anaerobic phase, products of the aerobic phase are converted into acetic, lactic and formic acids
and finally to carbon dioxide and hydrogen gas. Due to acid formation, the pH in the landfill decreases
hence increasing the solubility of certain compounds e.g. nitrogen and phosphorus (Agency for Toxic
Substances, 2012). Additionally, the highest biological oxygen demand (BOD5) and chemical oxygen
demand (COD) are measured in the leachate during this phase (Kjeldsen et al., 2002).
7 | P a g e
The initial methanogenic phase is marked by an increase in pH to almost neutrality. The acids that
accumulated during the anaerobic phase are converted to carbon dioxide and methane by
methanogenic bacteria. The consumption of acids in particular carboxylic acid also leads to reduced
BOD5/COD ratios. The stable methanogenic stage starts when the generation and composition of landfill
gas is constant. Here, methane concentration is the highest whereas the COD value is the lowest.
Furthermore, the BOD5/COD ratio also decreases as the amount of carboxylic acid reduces (Kjeldsen et
al., 2002). Stable methane gas production can last up to 20 years (Kjeldsen et al., 2002; Agency for Toxic
Substances, 2012).
The methane oxidation phase is marked by the consumption of methane by methanotrophic bacteria.
This eventually leads to the decrease in percentage volume of methane in the landfill.
Young landfill leachate is characterized by high COD and BOD5/COD, indicating a high biodegradability of
organic compounds. Additionally, low pH, moderate concentration of ammonium nitrogen and high
percentage of low molecular weight (MW) organic fractions (volatile fatty acids - VFA) indicate young
leachate (Deng, 2009). On the contrary, mature leachate formed in the methanogenic phase is highly
rich in ammonium nitrogen due to the hydrolysis and fermentation of compounds containing nitrogen.
Low COD and BOD5/COD, coupled with a high TOC/COD ratio indicate a mature leachate that is
stabilized by biochemical processes and is devoid of readily available energy sources for microbial
growth. High MW organic fractions e.g. humic substances are also predominant in mature leachate. As
the leachate continues to age, the molecular size of these humic substances increases (Deng, 2009).
2.1.2. Inorganic components of landfill leachate Landfill leachate contains a variety of inorganic compounds. These include the major ions assessed in
water quality such as Na+, Ca2+, K+, Mg2+, Cl-, HCO3-, NO2
-, NO3- , SO4
2-. Heavy metals such as Pb, Fe, Mn,
Cu, Ni, Cr, Cd have also been reported in landfill leachate (Kjeldsen et al., 2002). Though treated as a
nutrient, ammonia is one of the most important inorganic components.
As with organic components of landfill leachate, the concentration of certain inorganic ions varies with
age. In biologically stabilized leachate, the concentration of cations of Ca, Mg, Fe, Mn is low due to high
pH which enhance sorption and precipitation processes whereas that of sulphates is low due to its
biological reduction to sulphides (Christensen et al., 2001). Conversely, the concentration of species such
as Na+, K+, and Cl- is not affected by stabilization processes in the landfill. Heavy metals are present in
landfill leachate due to their release from consumer goods such as batteries and/or due to co-diposal
practices in landfills approximately 30 years ago (IMOG). During the acid formation stage, the amount of
dissolved heavy metals is high due to the acidic pH (Aucott, 2006). Other studies have also shown that
heavy metals are less likely to leave the landfill environment because they are tightly sorbed by organic
matter which has a high cation exchange capacity (Aucott, 2006).
The inorganic fraction of leachate is important more so because it affects ground and surface water
quality during discharge. Furthermore, it controls redox reactions in the environment besides affecting
the attenuation of heavy metals (Christensen et al., 2001). Initially, the inorganic fraction of landfill
leachate was presumed to have no effect on leachate treatment methodologies. Investigations by Deng
8 | P a g e
et al. (2012) show, however, that SO42- and especially Cl- inhibit Fenton oxidation. Inhibition occurs by
scavenging of OH radicals and prevention of Fe3+ regeneration by complexation with Fe2+.
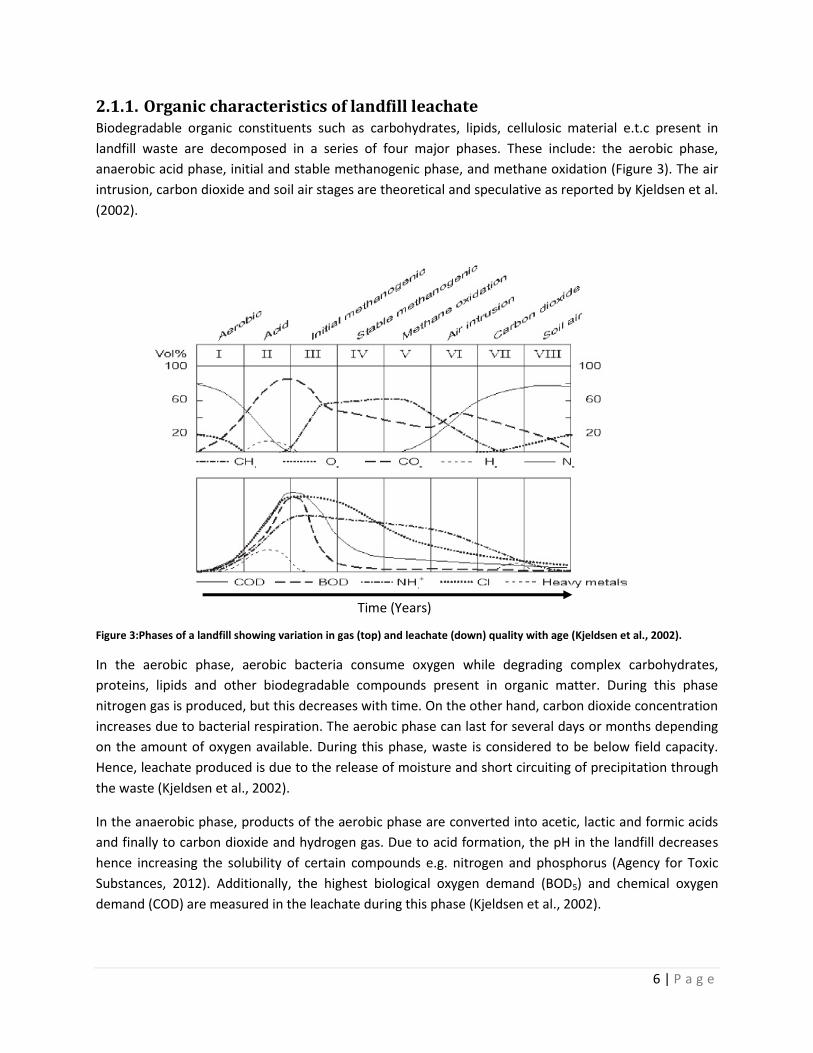
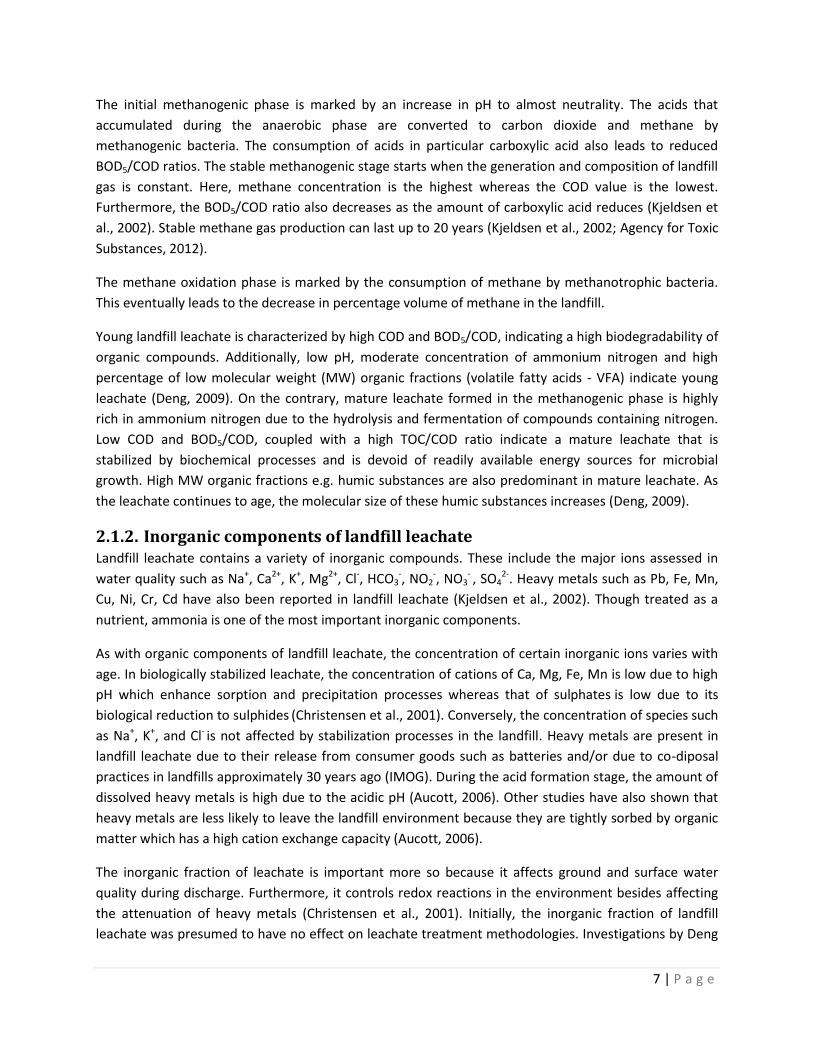
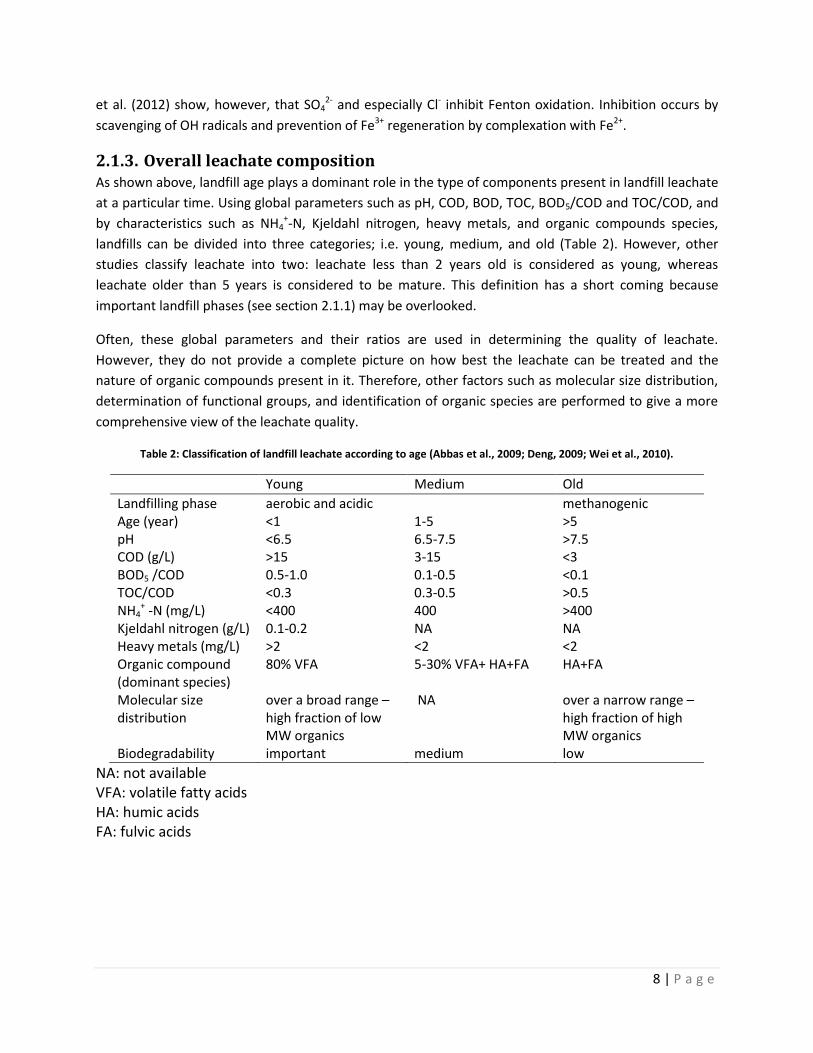
2.1.3. Overall leachate composition As shown above, landfill age plays a dominant role in the type of components present in landfill leachate
at a particular time. Using global parameters such as pH, COD, BOD, TOC, BOD5/COD and TOC/COD, and
by characteristics such as NH4+-N, Kjeldahl nitrogen, heavy metals, and organic compounds species,
landfills can be divided into three categories; i.e. young, medium, and old (Table 2). However, other
studies classify leachate into two: leachate less than 2 years old is considered as young, whereas
leachate older than 5 years is considered to be mature. This definition has a short coming because
important landfill phases (see section 2.1.1) may be overlooked.
Often, these global parameters and their ratios are used in determining the quality of leachate.
However, they do not provide a complete picture on how best the leachate can be treated and the
nature of organic compounds present in it. Therefore, other factors such as molecular size distribution,
determination of functional groups, and identification of organic species are performed to give a more
comprehensive view of the leachate quality.
Table 2: Classification of landfill leachate according to age (Abbas et al., 2009; Deng, 2009; Wei et al., 2010).
Young Medium Old
Landfilling phase aerobic and acidic methanogenic Age (year) <1 1-5 >5 pH <6.5 6.5-7.5 >7.5 COD (g/L) >15 3-15 <3 BOD5 /COD 0.5-1.0 0.1-0.5 <0.1 TOC/COD <0.3 0.3-0.5 >0.5 NH4
+ -N (mg/L) <400 400 >400 Kjeldahl nitrogen (g/L) 0.1-0.2 NA NA Heavy metals (mg/L) >2 <2 <2 Organic compound (dominant species)
80% VFA 5-30% VFA+ HA+FA HA+FA
Molecular size distribution
over a broad range – high fraction of low MW organics
NA over a narrow range – high fraction of high MW organics
Biodegradability important medium low
NA: not available VFA: volatile fatty acids HA: humic acids FA: fulvic acids
9 | P a g e
2.2. Treatment of Landfill Leachate The generation of landfill leachate is an inevitable consequence of landfilling. Before the turn of the 21st
century, landfill leachate was discharged into the sewer system to be treated in a conventional waste
water treatment plant or discharged directly into surface waters where it was assumed the pollution
effect will be diluted. However, current strict environmental legislations (e.g. the European Water
Framework Directive) especially on ground and surface water coupled with the need for water reuse
have necessitated the treatment of landfill leachate. Complete or partial treatment can be done on-site
where the leachate is produced or at an off-site facility. Several methods are available for leachate
treatment. However, the choice depends on type of leachate, technology costs and performance,
amongst others.
Treatment technologies which have been investigated and applied can be divided into conventional and
advanced technologies.
2.2.1. Conventional techniques
2.2.1.1. Recycling
Leachate recycling is one of the least expensive treatment techniques since a treatment plant is not
required. Renou et al. (2008) reported that recycling increased the moisture content in the landfill and
allowed the distribution of nutrients and enzymes between methanogens and solids/liquids.
Additionally, recirculation of leachate at 30% initial waste bed volume led to a significant reduction in
methane production and measured COD. According to Diamadopolous (1994), irrigation of leachate over
wastes in the landfill contributed to a significant reduction in COD and BOD by 90% and 98%,
respectively. However, the nitrogen concentration increased by 30% probably due to the continuous
degradation of nitrogenous matter. Promotion of short leachate stabilization periods is also one of the
benefits of recycling.
However, not all leachate can be recycled (IMOG) because high volumes can lead to ponding, saturation
and acidic conditions. High acidic conditions (pH < 5) will further impair methanogens; hence poor
anaerobic degradation of wastes (Renou et al., 2008).
2.2.1.2. Combined treatment with municipal waste water
Treatment of landfill leachate together with municipal waste water has been reported to be an
economical and feasible solution because leachate contributes the nitrogenous fraction whereas sewage
contributes the phosphorus needed (Borghi et al., 2003; Abbas et al., 2009). Borghi et al. (2003) also
reported that a concentration decrease of organic pollutants would be realized through dilution and
adaptability of the activated sludge. However, this is refuted by studies which reported that the organic
pollutants and heavy metals from leachate reduced treatment efficiency and increased effluent
concentrations (Renou et al., 2008). Borghi et al. (2003) showed that COD and ammonia from a mixture
of landfill leachate and municipal waste (in a ratio of 1/10) can be removed at a rate of 126 mg/L.hr and
51 mg/L.hr, respectively, using the activated sludge method with previously acclimated sludge at a
hydraulic residence time of 4 hours. Up to 92% COD and 75% ammonia removal could be achieved in a
SBR when landfill leachate is sonicated before mixing with municipal waste waters (Neczaj et al., 2007).
10 | P a g e
2.2.1.3. Biological treatment
Many biological techniques currently in use in treatment of landfill leachate are adaptations of waste
water treatment methods. These methods involve controlling the environmental conditions such as
temperature, pH, availability of nutrients, oxygen, e.t.c. for optimum growth of micro-organisms. These
micro-organisms consist of various communities which interact together to metabolize organic matter
and inorganic elements such as nitrogen, phosphorus into biomass, gases and energy.
Based on the presence or absence of oxygen; biological techniques can be classified as aerobic,
anaerobic or anoxic. According to Alkalay et al. (1998), the decision to select aerobic or anaerobic
treatment can be done using the decision model of Forgies (1988) for leachate treatment train selection.
Biological treatment methods such as anaerobic techniques are preferred because they are not only
economical but also energy recovery can be achieved (Kheradmand et al., 2010). However, it is
important to note that sole treatment of landfill leachate by biological methods will not yield
satisfactory results (Kargi et al., 2003; Oller et al., 2011). This is because frequent nutrient imbalances
such as high ammonium nitrogen, low phosphorus and carbon content in landfill leachate make it
difficult to maintain proper biological treatment (Zhao et al., 2012). Furthermore, recalcitrant
substances such as humic acids, fulvic acids and xenobiotic organic substances (XOC’s) are not degraded
during biological treatment. Therefore, these bio-refractory compounds and XOC’s pass through the
biological treatment process consequently increasing the organic level in the effluent (Zhao et al., 2012).
For this reason, it is important that biological methods are used in combination with advanced physical,
chemical techniques (Kargi et al., 2003).
Aerobic biological treatment
Aerobic treatment of landfill leachate is a biochemical process where bacteria degrade organic matter
and other pollutants in the presence of oxygen. Here, organic compounds are oxidized to carbon dioxide
and water, whereas ammonium nitrogen is oxidized to nitrate and complex contaminants to more easily
biodegradable substances. This process is then followed by an anoxic process where the nitrates formed
are converted to nitrogen gas. Aerobic processes can be divided into two broad categories.
Suspended growth systems
These are biological treatment processes which are based on the growth and maintenance of a
suspension of micro-organisms. Suspended growth technologies which have been employed to treat
landfill leachate include aerated lagoons, activated sludge, and sequence batch reactors.
Aerated lagoons are also known as stabilization ponds. Their low operation, maintenance costs and low
skills requirements make them the most popular method of waste water treatment (Renou et al., 2008).
Essentially, an aerated lagoon is a 1-2 m deep basin dug in the ground and designed to look like a natural
lake. The upper part of a lagoon is aerobic and oxidizes reduced compounds from the lower anaerobic
part. Aerated lagoons have been successfully used to treat landfill leachate. Mehmood (2009) reported
overall COD and ammonium removal of 75% and 99%, respectively, at a hydraulic retention time (HRT)
of 50 days. Fernandes et al., (2012) observed a total chemical oxygen demand (TCOD) and ammonia
removal of 56% and 82% when three sequential ponds were used. The low removal of TCOD was
attributed to the inhibition by algae in one of the ponds. A COD removal efficiency of 97% at a HRT of 10
11 | P a g e
days was reported by Robinson and Grantham (1988). A removal of 93% of ammonium nitrogen was
obtained due to adequate desludging. Though aerated lagoons exhibit high COD and ammonium
nitrogen removal efficiencies in the treatment of landfill leachate; the effluent levels do not meet the
required discharge limits. Hence, recirculation is required (Mehmood 2009, Fernandes et al., 2012).
Activated sludge systems consist of a completely mixed aeration reactor where biodegradation takes
place and clarifiers where sludge is settled. Part of the sludge is recycled whereas excess sludge together
with clarified water is discharged appropriately. These systems offer more intensive treatment than
aerated lagoons because they operate with intensive aeration and large populations of acclimatized
bacteria (Sector guidance note, 2007). In experiments involving aerobic post treatment of anaerobically
treated landfill leachate, Kettunen et al. (1996) reported 75% removal of the remaining COD. This
contributed to 15-30% of the overall COD removal in the whole process. In a review of methods
available for leachate treatment, Abbas et al. (2009) and Renou et al. (2008) mentioned that inadequate
sludge settling, the need for longer aeration times, high energy requirements and inhibition of micro-
organisms by high ammonium nitrogen concentrations are some of the disadvantages that have shifted
the focus on activated sludge to other more robust technologies.
Sequencing batch reactors (SBR’s) are systems which allow aerobic biological treatment, equalization,
sludge settling and clarification to take place in the same tank over a time sequence. This kind of
operation creates a treatment process which is robust and less affected by frequent variation of organic
load or ammonium nitrogen (Laitinen et al., 2006). This characteristic is important in landfill leachate
treatment as leachate properties are known to change over time (see Table 2). The performance of
SBR’s was illustrated by Neczaj et al. (2005) who reported 85% COD removal when influent consisted of
10% leachate and 90% synthetic water (v/v). The average quality of municipal landfill leachate was
reduced from about 2200 to 500 mg COD/L after treatment by a SBR in the study of Laitinen et al.
(2006). Uygur and Kargi (2004) showed that SBR treatment of leachate resulted in 62% COD and 31%
ammonium nitrogen removal when a five step operation was used. Further COD removals were
achieved when powdered activated carbon was added. Despite the good performance, and flexible
nature, the use of SBR’s is marred by problems such as sludge bulking and poor clarification (Sector
guidance note, 2007).
Attached growth systems
Attached growth systems, also known as fixed film systems, are biological treatment technologies where
bacteria attach themselves on supporting material such as plastic gravel rotor blades. These
technologies include trickling filters, rotating biological contactors and moving bed biofilm reactors.
Attached growth systems offer special benefits such as immobilization of active biomass, nitrification at
low temperatures (Renou et al., 2008) and high nutrient removal (Table 3). Nitrification-denitrification
processes can occur at the same time on both the outside and inside parts of a biofilm. Table 3 shows a
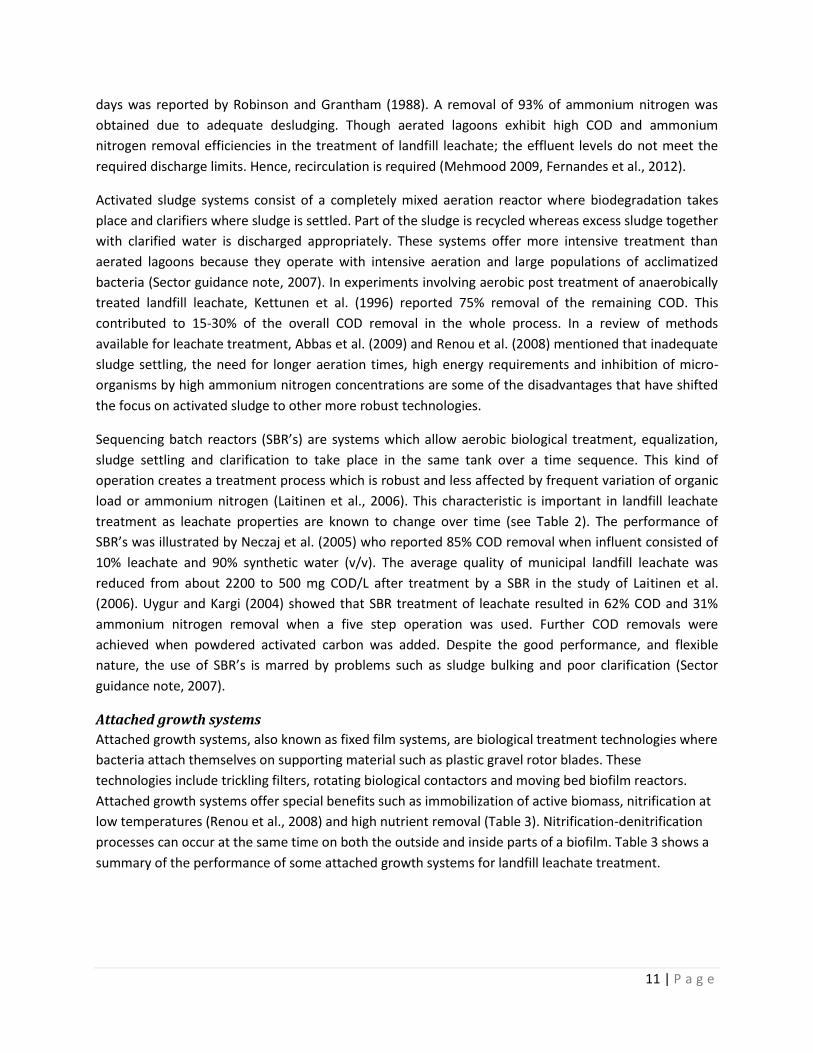
summary of the performance of some attached growth systems for landfill leachate treatment.
12 | P a g e
Table 3: Typical performance of attached growth biological treatment systems.
HRT: Hydraulic residence time LR: Loading rate DOC: Dissolved organic carbon N: Nitrogen
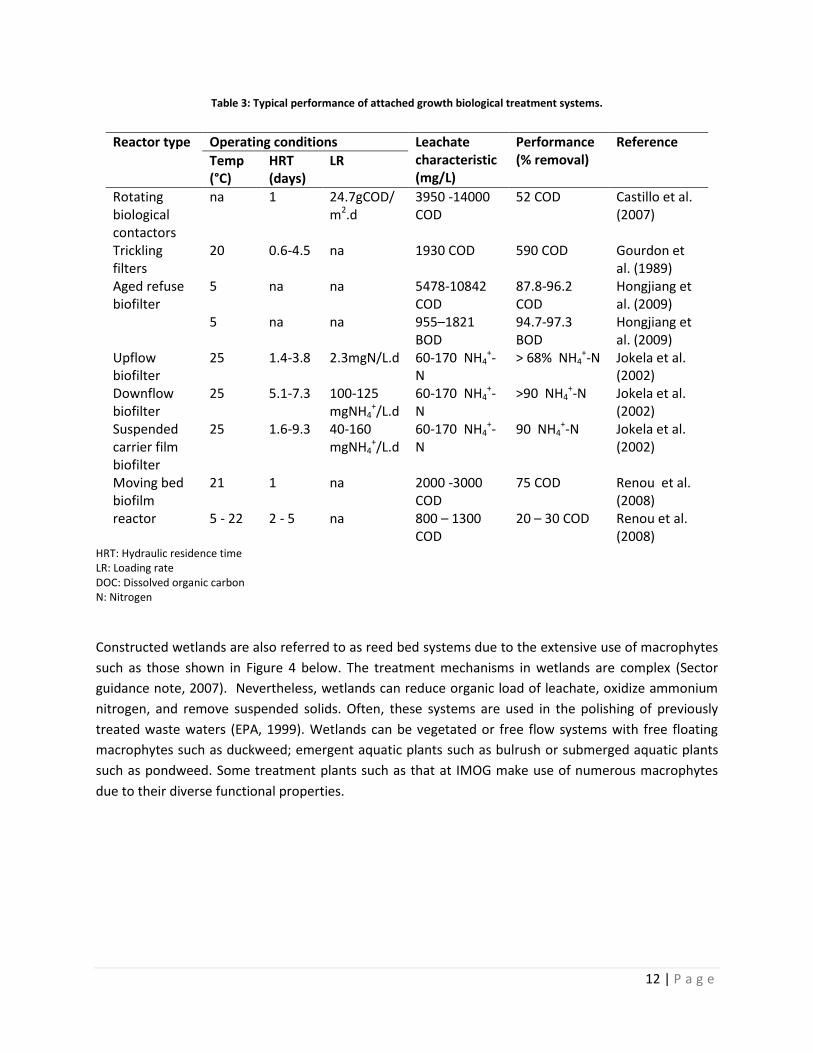
Constructed wetlands are also referred to as reed bed systems due to the extensive use of macrophytes
such as those shown in Figure 4 below. The treatment mechanisms in wetlands are complex (Sector
guidance note, 2007). Nevertheless, wetlands can reduce organic load of leachate, oxidize ammonium
nitrogen, and remove suspended solids. Often, these systems are used in the polishing of previously
treated waste waters (EPA, 1999). Wetlands can be vegetated or free flow systems with free floating
macrophytes such as duckweed; emergent aquatic plants such as bulrush or submerged aquatic plants
such as pondweed. Some treatment plants such as that at IMOG make use of numerous macrophytes
due to their diverse functional properties.
Reactor type Operating conditions Leachate characteristic (mg/L)
Performance (% removal)
Reference
Temp (°C)
HRT (days)
LR
Rotating biological contactors
na 1 24.7gCOD/m2.d
3950 -14000 COD
52 COD Castillo et al. (2007)
Trickling filters
20 0.6-4.5 na 1930 COD 590 COD Gourdon et al. (1989)
Aged refuse biofilter
5 na na 5478-10842 COD
87.8-96.2 COD
Hongjiang et al. (2009)
5 na na 955–1821 BOD
94.7-97.3 BOD
Hongjiang et al. (2009)
Upflow biofilter
25 1.4-3.8 2.3mgN/L.d 60-170 NH4+-
N > 68% NH4
+-N Jokela et al. (2002)
Downflow biofilter
25 5.1-7.3 100-125 mgNH4
+/L.d 60-170 NH4
+-N
>90 NH4+-N Jokela et al.
(2002) Suspended carrier film biofilter
25 1.6-9.3 40-160 mgNH4
+/L.d 60-170 NH4
+-N
90 NH4+-N Jokela et al.
(2002)
Moving bed biofilm reactor
21 1 na 2000 -3000 COD
75 COD Renou et al. (2008)
5 - 22 2 - 5 na 800 – 1300 COD
20 – 30 COD Renou et al. (2008)
13 | P a g e
Figure 4: Plants currently used in reed bed systems at IMOG, Moen.
Anaerobic biological treatment
Anaerobic treatment is a biochemical process which takes place in the absence of oxygen; it involves
two phases: the acid phase where facultative micro-organisms convert complex organic matter into
organic acids. In the second phase, obligate anaerobic organisms change volatile organic acids to carbon
dioxide and methane. The methane formed can be harvested and used as a source of energy in reactor
heating (Kheradmand et al., 2010). The benefits of anaerobic treatment include its ability to treat high-
strength organic effluents (COD > 10,000 mg/L), stabilization of organics, and reduced sludge production
(Abbas et al., 2009; Sector guidance note, 2007). Furthermore, hydrogen sulphide produced by the
reduction of sulphates is a good precipitant for the toxic metals in landfill leachate. The metal sulphides
formed accumulate in sludge as inert solids and sludge disposal leads to their overall removal from
landfill leachate (Sector guidance note 2007). Several scientific reports have shown that anaerobic
systems can be used in landfill leachate treatment. These systems include Upflow anaerobic sludge
blanket (UASB) (Kawai et al., 2012; Kettunen et al., 1996), anaerobic sequencing batch reactor (AnSBR)
(Timur and Ozturk, 1999; Kennedy and Lentz, 2000), Upflow anaerobic filter, anaerobic hybrid bed (Calli
et al., 2006), CSTR (completely stirred tank reactor), and anaerobic digesters (Chiu-Yue, 1998; Imena,
2008). Anaerobic lagooning of landfill leachate has also been reported in warmer climates (Sector
guidance note, 2007). Table 4 shows typical performance of anaerobic biological leachate treatment
systems.
Configurations can be either fixed film of suspended growth systems. Though anaerobic systems offer
several benefits in leachate treatment, they also have disadvantages. Anaerobic treatment offers low
removal or even increase in ammonium nitrogen content (Zhu et al., 2008; Sector guidance note, 2007).
For this reason, novel techniques such as coupling of partial nitritation with Anammox have been
developed to economically reduce ammonium nitrogen in landfill leachate. After anaerobic treatment,
effluent is in a reduced state containing high levels of dissolved amines, sulphides and methane.
Discharge of such an effluent to surface waters will lead to severe loss of aquatic life. Therefore, aerobic
post treatment is required (Sector guidance note, 2007).
14 | P a g e
Table 4: Typical performance of anaerobic biological leachate treatment systems.
Reactor type HRT Influent COD (mg/L)
% COD removal
Reference
Upflow anaerobic sludge blanket
2-7 days 1770 40 Kawai et al. (2012)
10 hrs 1300±120 71±3 Kettunen et al. (1996)
34 hrs 1600±110 45±5 Kettunen et al. (1996)
1.3±0.7 days 1900±52 52±3 Kettunen and Rintala (1998)
Continuous stirred anaerobic digester
na 15000 60 Imena (2008)
Hybrid anaerobic reactor
35 hrs 780±60 56±3 Kettunen et al. (1996)
2 stage anaerobic digester
15 days 55351 92 Kheradmand et al. (2010)
CSTR anaerobic digester
20 days 5790-6958 81-86 Chiu-Yue et al. (1999)
10 days 5790-6958 75-83 Chiu-Yue et al. (1999)
5.3 days 5790-6958 68-76 Chiu-Yue et al. (1999)
CSTR: Completely stirred tank reactor na: not available
2.2.1.4. Physical – chemical methods
These are processes which treat waste waters by the reduction of suspended solids, colloidal particles,
floating material and other toxic pollutants such as XOC’s and heavy metals by either flotation, filtration,
coagulation-flocculation, adsorption and chemical oxidation. Physical-chemical methods are commonly
used in pretreatment of waste waters such as landfill leachates prior to biological treatment or as a
polishing step after other forms of (biological) treatment. For individual treatment, i.e. without
combination with other treatment techniques, Diamadopolous (1994) and Kurniawan et al. (2006)
agreed that physical-chemical methods are best suited in the treatment of stabilized landfill leachate as
opposed to young leachate which is characterized by low molecular weight organic material.
Flotation
This is a physical method which is used to reduce floating matter such as colloids, oil and greasy
substances, and fibres. Using configurations such as dissolved air flotation units, flotation can be used in
the harvesting of dissolved metals or micro-organisms acclimatized to landfill leachate (Rubio et al.,
2002). Despite its potential in reducing the quality of landfill leachate, few studies have been devoted to
it.
Coagulation-flocculation
Coagulation-flocculation is a treatment process which achieves overall purification of waste waters by
the addition of coagulants and flocculants. During coagulation, the coagulant neutralizes the electrical
charges of the particles in water allowing the particles to come close together forming larger particles.
pH adjustments are also effected during the addition of coagulants. In the flocculation stage, the
15 | P a g e
flocculant promotes the formation of larger easy-to-settle flocs. This technique allows the removal of
suspended solids and colloidal particles in solution. Aluminium sulphate, ferric chloride, ferrous sulphate
and ferric chlorosulphate are commonly used coagulants (Amokrane et al., 1997). Non-ionic, cationic
and anionic polyelectrolytes can also be used as coagulants to increase the floc settling rate.
Amokrane et al. (1997) have shown that for landfill leachate ferric chloride at a coagulant dose of 35
mmol/L is more effective than aluminum at the same concentration for reducing turbidity A (94 to 84%)
and COD (55% to 42%). pH reduction from 8.5 to 5.6 was also observed when ferric chloride was used.
Diamodopolus (1994) reported that 35% and 39% COD removal was achieved using aluminium sulphate
at an optimum dosage (15 mmol/L) at pH 5.6 and 4.8, respectively. When ferric chloride was used at the
same concentration but at pH 3.5; 56% COD removal was achieved. Kargi et al. (2003) observed 60%
COD removal when ferric chloride was used at an optimum dose of 6.1 mmol/L and pH 6.0. The
performance of lime as a coagulant was also assessed: at a dose of 3100 mmol/L and pH 11.5, 18% COD
removal was achieved (Diamodopolus, 1994). Recalcitrant compounds such as humic acids (HA) can also
be removed by coagulation-flocculation. HA removal efficiencies of 80%, 53%, 70% were reported by Liu
et al. (2012) when ferric chloride 6-hydrate, ferric sulphate 7-hydrate, and polyferric sulphate were
used, respectively. Since XOC’s such as phthalic acid esters can be sorbed to dissolved organic matter
(DOM), removal of DOM from leachate results into overall removal of phthalic acid esters (Zhang and
Wang, 2009). From these studies, it can be concluded that iron based salts are more efficient coagulants
than aluminum salts. Additionally, they coagulate at a wider range of pH, form heavier flocs, and do not
pose any carcinogenic or mutagenic health risks (Amokrane et al., 1997). Nevertheless, generation of
sludge, high cost of chemical and sludge disposal, and dependence on pH, dose and type of coagulant
are some of the major drawbacks which hamper the individual use of coagulation-flocculation in
leachate treatment.
Chemical Precipitation
Due to its simplicity, chemical precipitation has been used in the removal of ammonium nitrogen, heavy
metals and organic compounds. Here, ions in leachate solution are converted into precipitates through
chemical reactions (Kurniawan et al., 2006). Amokrane et al. (1997) demonstrated that 40% COD and
90% heavy metal removal can be achieved when lime is used as a coagulant. Kurniawan et al. (2006)
reports a study on the removal of heavy metals from landfill leachate. It was shown that 8 g/L of lime
could reduce the concentration of manganese and iron by 77% and 78%, respectively. Nickel and lead
had a low removal of respectively 51% and 46%. It should be noted that 8 g/L is a very high dose.
Precipitation of heavy metals in leachate using sulphides has been proposed by Enzminger et al. (1987).
The usage of sulphides was seen to be advantageous due to their ability to work over a broad pH range
and their extremely low solubility. However, the probability that sulphide might end up in the effluent
and generation of hydrogen sulphide were major drawbacks in sulphide use as a precipitant.
Recent developments have seen the use of struvite, chemically known as magnesium ammonium
phosphate (MAP), in chemical precipitation of ammonium from landfill leachate. However, the
limitation of MAP is that an external source of magnesium and phosphate is needed given that landfill
leachate is deficient in magnesium and phosphorus. In their review, Abbas et al. (2009) report the use of
MAP at a pH of 8.5 to 9.0 to reduce ammonium concentration from 5600 mg/L to 110 mg/L. Results
16 | P a g e
from Di Laconi et al. (2010) indicate that 95% ammonium removal was achieved when the Mg:NH4:PO4
ratio was set at 2:1:1, at a pH of 9. Similar studies by Kima et al. (2007) corroborated with this and
demonstrated that ammonium precipitation efficiencies greater than 90% were achieved when struvite
was used in a sequence that involves addition of magnesium and phosphorus sources before control in
pH.
Adsorption
This is a mass transfer process where a solute in liquid phase becomes physically or chemically bound to
the surface of a solid compound. Carbon adsorption is the most common form of adsorption treatment
in landfill leachate though other forms of adsorbents such as zeolites, peat and resins have been used
(Renou et al., 2008; Kurniawan et al., 2006). The popularity of activated carbon as an adsorbent is owed
to its highly porous character and large surface area, controllable pore structure, thermostability, and
low acid/base reactivity (Foo and Hameed, 2009; Abbas et al., 2009). Activated carbon is available in
granular and powdered form; popularly known as granular activated carbon (GAC) and powdered
activated carbon (PAC), respectively. Usage of activated carbon in treatment of landfill leachate or
coupled with other techniques is prevalent. A widely reported case is that from the Goslar landfill in
Germany where GAC was used to reduce the influent COD (940 mg/L) by 91% (Foo and Hameed, 2009).
In a Greek landfill, PAC at a dosage of 6 g/L was successfully used to reduce the initial concentration of
COD (5690 mg/L) by 95% (Kurniawan et al., 2006). For an equal dose of GAC, Diamodopolous (1994)
managed to reduce the COD of landfill leachate from 1140 mg/L to 270 mg/L; and Abbas et al. (2009)
report a COD and ammonium nitrogen removal of 50-70%.
Carbon adsorption has also been paired with biological and/or other physical-chemical treatment to
remove recalcitrant compounds, for instance in the IMOG treatment plant (Moen, Belgium). This
arrangement may create a synergy which leads to enhanced nitrification, sludge filterability, and
removal of recalcitrant organic compounds (Foo and Hameed, 2009). Wei et al. (2010) presented a case
study where combined use of 10 g/L PAC and coagulation-flocculation enhanced the removal of COD
(from 2817 to 407 mg/L), Fe (from 9.6 to 0.03 mg/L) and Pb (from 289 to 7 µg/L). Kurniawan and Wai-
Hung, (2009) demonstrated that H2O2 oxidation when integrated with GAC adsorption gave removal
efficiencies of 82% COD and 59% NH4+-N. Adsorbent dosage is an important parameter in carbon
adsorption (Foo et al., 2013). Activated carbon has also successfully been used in the removal of heavy
metals from leachate. Kurniawan et al. (2006) reports a study where Cd (ll), Cu(ll), Cr(lll), Mn(ll), Pb(ll),
and Zn(ll) were removed from landfill leachate using 2 g/L of GAC. These heavy metals whose initial
concentration stood at 84 mg/L were lowered by approximately 80-96%. Unfortunately, the constant
need for regeneration of adsorbent is a major drawback of the adsorption method.
2.2.2. Advanced techniques
2.2.2.1. Membrane techniques
Membranes are pressure-driven barriers used to separate constituents in water. These membranes
separate the feed into permeate – a relatively clean water stream and concentrate – a stream
containing rejected compounds. With reference to pore size, membranes can be classified into four
groups namely: reversed osmosis, nanofiltration, ultrafiltration and microfiltration. The efficiency of
17 | P a g e
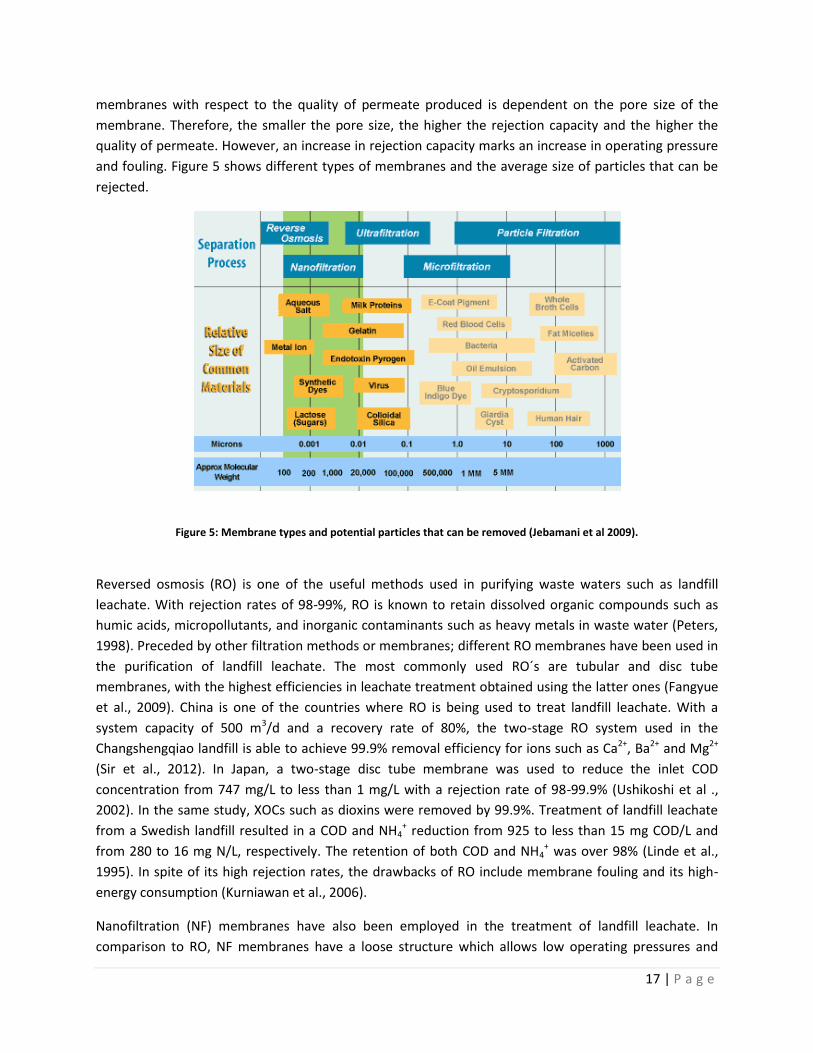
membranes with respect to the quality of permeate produced is dependent on the pore size of the
membrane. Therefore, the smaller the pore size, the higher the rejection capacity and the higher the
quality of permeate. However, an increase in rejection capacity marks an increase in operating pressure
and fouling. Figure 5 shows different types of membranes and the average size of particles that can be
rejected.
Figure 5: Membrane types and potential particles that can be removed (Jebamani et al 2009).
Reversed osmosis (RO) is one of the useful methods used in purifying waste waters such as landfill
leachate. With rejection rates of 98-99%, RO is known to retain dissolved organic compounds such as
humic acids, micropollutants, and inorganic contaminants such as heavy metals in waste water (Peters,
1998). Preceded by other filtration methods or membranes; different RO membranes have been used in
the purification of landfill leachate. The most commonly used RO´s are tubular and disc tube
membranes, with the highest efficiencies in leachate treatment obtained using the latter ones (Fangyue
et al., 2009). China is one of the countries where RO is being used to treat landfill leachate. With a
system capacity of 500 m3/d and a recovery rate of 80%, the two-stage RO system used in the
Changshengqiao landfill is able to achieve 99.9% removal efficiency for ions such as Ca2+, Ba2+ and Mg2+
(Sir et al., 2012). In Japan, a two-stage disc tube membrane was used to reduce the inlet COD
concentration from 747 mg/L to less than 1 mg/L with a rejection rate of 98-99.9% (Ushikoshi et al .,
2002). In the same study, XOCs such as dioxins were removed by 99.9%. Treatment of landfill leachate
from a Swedish landfill resulted in a COD and NH4+ reduction from 925 to less than 15 mg COD/L and
from 280 to 16 mg N/L, respectively. The retention of both COD and NH4+ was over 98% (Linde et al.,
1995). In spite of its high rejection rates, the drawbacks of RO include membrane fouling and its high-
energy consumption (Kurniawan et al., 2006).
Nanofiltration (NF) membranes have also been employed in the treatment of landfill leachate. In
comparison to RO, NF membranes have a loose structure which allows low operating pressures and
18 | P a g e
higher fluxes (Trebouet et al., 2001). NF membranes have pores enabling the removal of particles with a
molecular weight higher than 300 g/mol and inorganic particles through electrostatic interactions
between the particles and the membrane (Abbas et al., 2009). The significance of this membrane in
leachate treatment lies in its surface charges which allow charged particles smaller than the membrane
pores to be rejected along with bigger neutral solutes and salts (Kurniawan et al., 2006). For this reason,
the high rejection rate for dissolved organic matter (DOM) and sulphate ions coupled with low rejection
for chloride and sodium ions reduces the volume of concentrate. NF membranes are commonly made of
polymeric films which have a molecular cut-off between 200-2000 g/mol (Renou et al., 2008). NF was
used to reduce total Kjeldahl nitrogen (TKN) in leachate by 22% whereas the iron concentration was
reduced by 99% at a cross flow velocity of 3 m/s, a pH of 8.3, and an applied pressure of 2MPa (Trebouet
et al., 2001). Ince et al. (2010) reported 44% removal efficiency for Kjeldahl Nitrogen. Though nitrogen
removal is low in both cases; the difference in removal efficiencies could have been due to use of
different materials for the membrane as well as different operating conditions. A COD removal of 66%
was achieved in a hybrid set up which included micro-filtration (Ince et al., 2010). This reduction was
achieved when the cross flow velocity was set at 1 m/s, pH of 9.3, and applied pressure of 0.175 MPa.
Microfiltration (MF) and ultrafiltration (UF) membranes have also been used in leachate treatment
albeit as a pretreatment step to remove colloids and suspended matter before RO or NF treatment
(Deng, 2007). Due to their pore size (0.1-2 µm), MF membranes can also effectively remove suspended
solids, protozoa and bacteria. MF membranes are rarely used alone and this is because no significant
retention of COD is achieved (Renou et al., 2008). UF is used as a pretreatment step to remove
macromolecules with molecular weight between 5,000-100,000 g/mol (Deng, 2007).
2.2.2.2. Advanced oxidation processes
In recent years, stringent environmental legislation has led to the development of advanced oxidation
methods that can degrade not only the biodegradable fraction of organic matter but also biorecalcitrant
(micro) pollutants present in landfill leachate. Advanced oxidation processes (AOP) are operated at
near/ambient temperature and pressure, and are characterized by the production of hydroxyl radicals.
With an oxidation potential of 2.8 V (second only to fluorine) (Table 5), hydroxyl radicals can attack
organic molecules with a rate constant in the order of 106-109 M-1S-1 (Andreozi et al., 1999). Moreover,
hydroxyl radicals are characterized by very little selectivity of attack making them suitable for oxidation
of recalcitrant organic pollutants in landfill leachate.
19 | P a g e
Table 5: Oxidation potential of some oxidizing agents (Wei et al., 2010).
NHE: normal hydrogen electrode
Advanced oxidation processes are versatile processes in that numerous ways are available for
production of hydroxyl radicals. These include the addition of oxidizing agents such as ozone and/or
hydrogen peroxide, irradiation with e.g. ultraviolet light or ultrasounds; and use of catalysts such as iron
(ll). Below, an overview of some major AOP techniques is given.
Fenton oxidation
In Fenton oxidation, hydroxyl radicals are produced by adding hydrogen peroxide to waste waters in the
presence of ferrous salts. In the mechanism for formation of hydroxyl and other radicals in the absence
of organic compounds, Fe2+ acts as a catalyst (Wei et al., 2010).
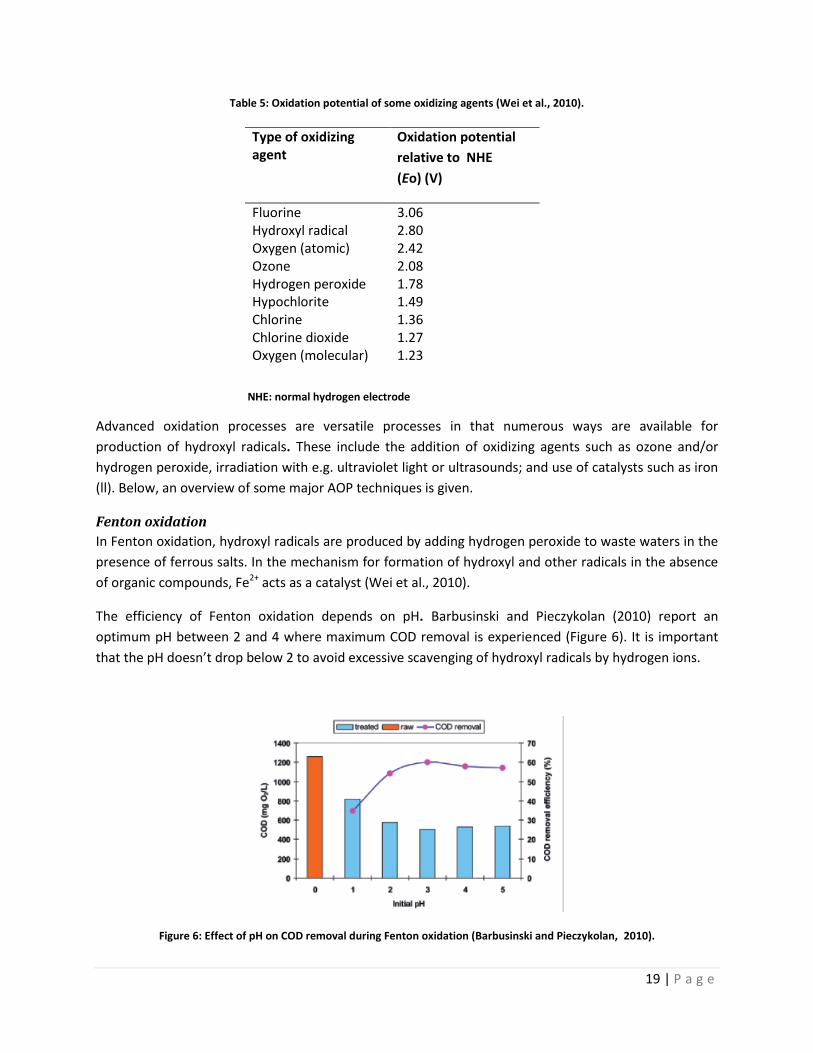
The efficiency of Fenton oxidation depends on pH. Barbusinski and Pieczykolan (2010) report an
optimum pH between 2 and 4 where maximum COD removal is experienced (Figure 6). It is important
that the pH doesn’t drop below 2 to avoid excessive scavenging of hydroxyl radicals by hydrogen ions.
Figure 6: Effect of pH on COD removal during Fenton oxidation (Barbusinski and Pieczykolan, 2010).
Type of oxidizing agent
Oxidation potential
relative to NHE
(Eo) (V)
Fluorine 3.06 Hydroxyl radical 2.80 Oxygen (atomic) 2.42 Ozone 2.08 Hydrogen peroxide 1.78 Hypochlorite 1.49 Chlorine 1.36 Chlorine dioxide 1.27 Oxygen (molecular) 1.23
20 | P a g e
Singh and Tang (2013) determined the optimum dosage of H2O2/Fe2+ in terms of maximum COD
removal. They discovered that this value ranged from 0.5 to 60 (w/w) depending on leachate
characteristics. For instance, untreated leachate exhibited a higher optimum ratio (2.4, w/w) compared
to biologically treated landfill leachate (0.9, w/w). Fenton oxidation has been used successfully in the
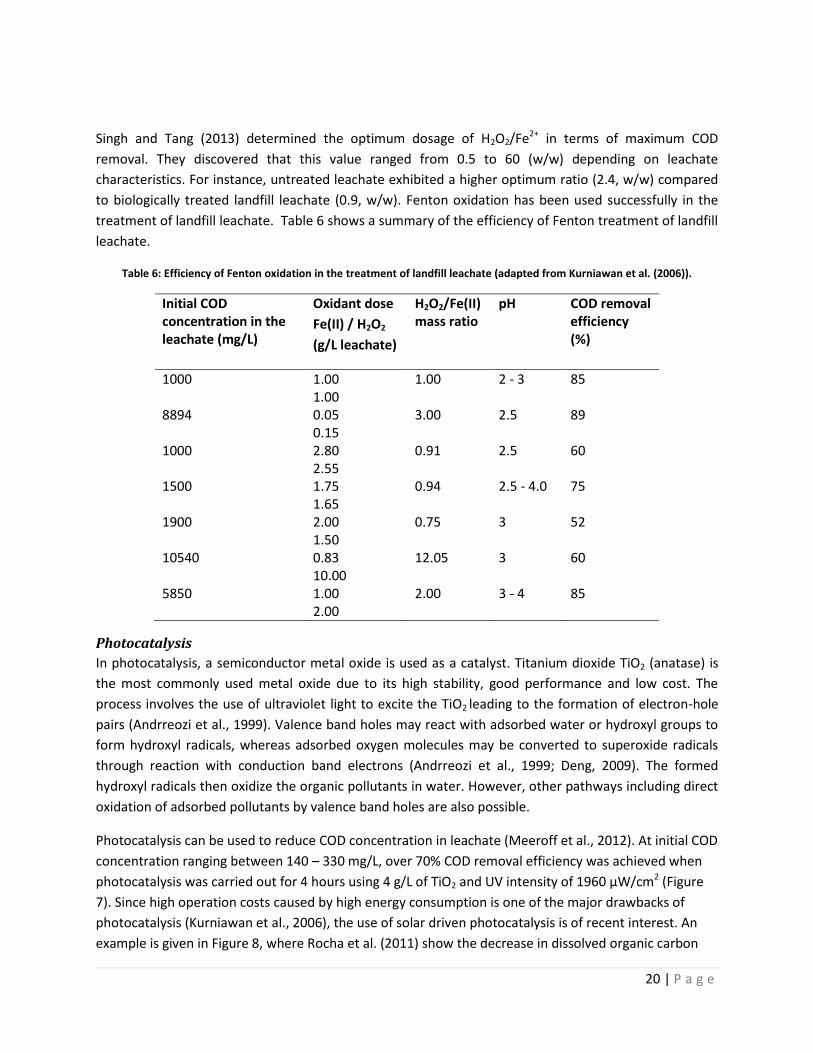
treatment of landfill leachate. Table 6 shows a summary of the efficiency of Fenton treatment of landfill
leachate.
Table 6: Efficiency of Fenton oxidation in the treatment of landfill leachate (adapted from Kurniawan et al. (2006)).
Initial COD concentration in the leachate (mg/L)
Oxidant dose
Fe(II) / H2O2
(g/L leachate)
H2O2/Fe(II) mass ratio
pH COD removal efficiency (%)
1000 1.00 1.00
1.00 2 - 3 85
8894 0.05 0.15
3.00 2.5 89
1000 2.80 2.55
0.91 2.5 60
1500 1.75 1.65
0.94 2.5 - 4.0 75
1900 2.00 1.50
0.75 3 52
10540 0.83 10.00
12.05 3 60
5850 1.00 2.00
2.00 3 - 4 85
Photocatalysis
In photocatalysis, a semiconductor metal oxide is used as a catalyst. Titanium dioxide TiO2 (anatase) is
the most commonly used metal oxide due to its high stability, good performance and low cost. The
process involves the use of ultraviolet light to excite the TiO2 leading to the formation of electron-hole
pairs (Andrreozi et al., 1999). Valence band holes may react with adsorbed water or hydroxyl groups to
form hydroxyl radicals, whereas adsorbed oxygen molecules may be converted to superoxide radicals
through reaction with conduction band electrons (Andrreozi et al., 1999; Deng, 2009). The formed
hydroxyl radicals then oxidize the organic pollutants in water. However, other pathways including direct
oxidation of adsorbed pollutants by valence band holes are also possible.
Photocatalysis can be used to reduce COD concentration in leachate (Meeroff et al., 2012). At initial COD
concentration ranging between 140 – 330 mg/L, over 70% COD removal efficiency was achieved when
photocatalysis was carried out for 4 hours using 4 g/L of TiO2 and UV intensity of 1960 µW/cm2 (Figure
7). Since high operation costs caused by high energy consumption is one of the major drawbacks of
photocatalysis (Kurniawan et al., 2006), the use of solar driven photocatalysis is of recent interest. An
example is given in Figure 8, where Rocha et al. (2011) show the decrease in dissolved organic carbon
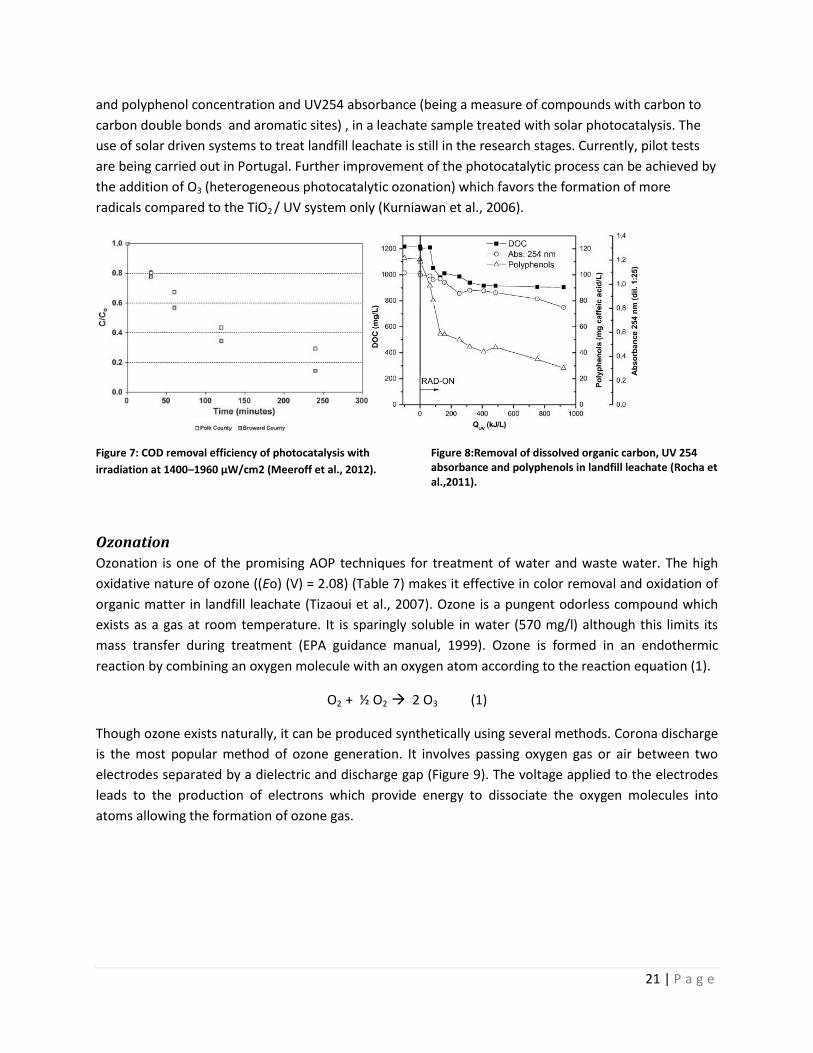
21 | P a g e
and polyphenol concentration and UV254 absorbance (being a measure of compounds with carbon to
carbon double bonds and aromatic sites) , in a leachate sample treated with solar photocatalysis. The
use of solar driven systems to treat landfill leachate is still in the research stages. Currently, pilot tests
are being carried out in Portugal. Further improvement of the photocatalytic process can be achieved by
the addition of O3 (heterogeneous photocatalytic ozonation) which favors the formation of more
radicals compared to the TiO2 / UV system only (Kurniawan et al., 2006).
Figure 7: COD removal efficiency of photocatalysis with
irradiation at 1400–1960 μW/cm2 (Meeroff et al., 2012). Figure 8:Removal of dissolved organic carbon, UV 254 absorbance and polyphenols in landfill leachate (Rocha et al.,2011).
Ozonation
Ozonation is one of the promising AOP techniques for treatment of water and waste water. The high
oxidative nature of ozone ((Eo) (V) = 2.08) (Table 7) makes it effective in color removal and oxidation of
organic matter in landfill leachate (Tizaoui et al., 2007). Ozone is a pungent odorless compound which
exists as a gas at room temperature. It is sparingly soluble in water (570 mg/l) although this limits its
mass transfer during treatment (EPA guidance manual, 1999). Ozone is formed in an endothermic
reaction by combining an oxygen molecule with an oxygen atom according to the reaction equation (1).
O2 + ½ O2 2 O3 (1)
Though ozone exists naturally, it can be produced synthetically using several methods. Corona discharge
is the most popular method of ozone generation. It involves passing oxygen gas or air between two
electrodes separated by a dielectric and discharge gap (Figure 9). The voltage applied to the electrodes
leads to the production of electrons which provide energy to dissociate the oxygen molecules into
atoms allowing the formation of ozone gas.
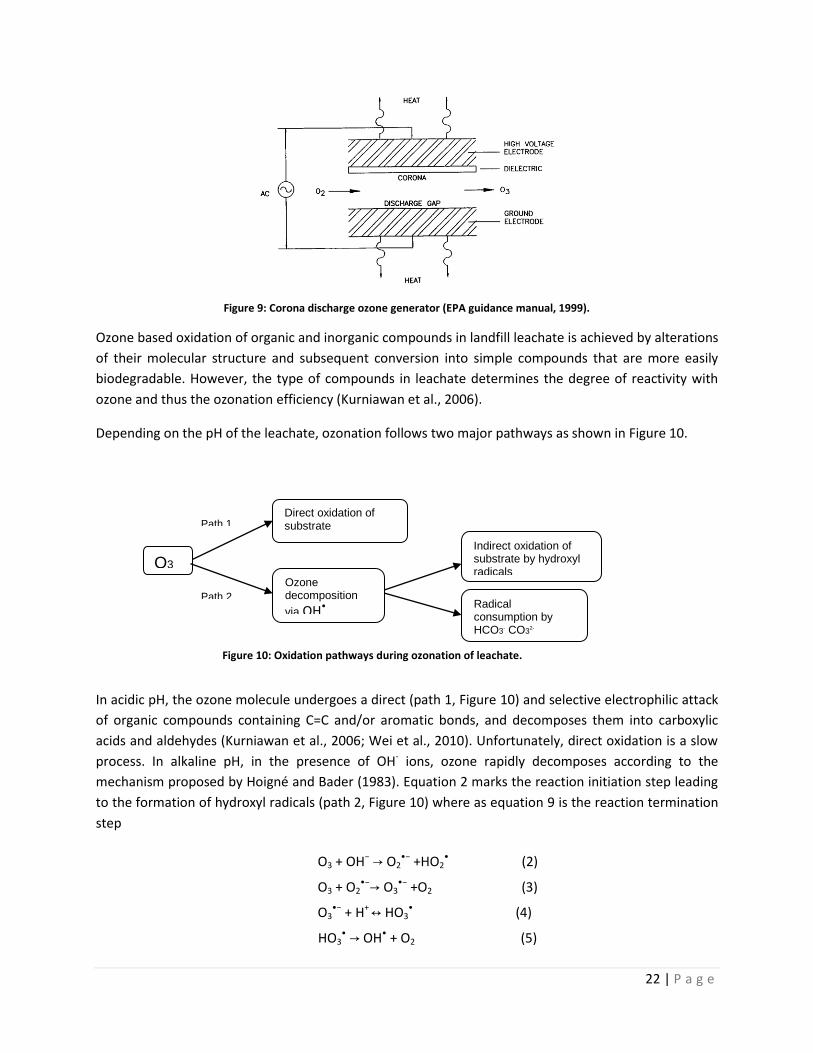
22 | P a g e
Figure 9: Corona discharge ozone generator (EPA guidance manual, 1999).
Ozone based oxidation of organic and inorganic compounds in landfill leachate is achieved by alterations
of their molecular structure and subsequent conversion into simple compounds that are more easily
biodegradable. However, the type of compounds in leachate determines the degree of reactivity with
ozone and thus the ozonation efficiency (Kurniawan et al., 2006).
Depending on the pH of the leachate, ozonation follows two major pathways as shown in Figure 10.
In acidic pH, the ozone molecule undergoes a direct (path 1, Figure 10) and selective electrophilic attack
of organic compounds containing C=C and/or aromatic bonds, and decomposes them into carboxylic
acids and aldehydes (Kurniawan et al., 2006; Wei et al., 2010). Unfortunately, direct oxidation is a slow
process. In alkaline pH, in the presence of OH- ions, ozone rapidly decomposes according to the
mechanism proposed by Hoigné and Bader (1983). Equation 2 marks the reaction initiation step leading
to the formation of hydroxyl radicals (path 2, Figure 10) where as equation 9 is the reaction termination
step
O3 + OH− → O2•− +HO2
• (2)
O3 + O2•−→ O3
•− +O2 (3)
O3•− + H+ ↔ HO3
• (4)
HO3• → OH• + O2 (5)
Path 1
Path 2
O3
Direct oxidation of substrate
Radical consumption by HCO3
- CO32-
Indirect oxidation of substrate by hydroxyl radicals
Ozone decomposition
via OH•
Figure 10: Oxidation pathways during ozonation of leachate.
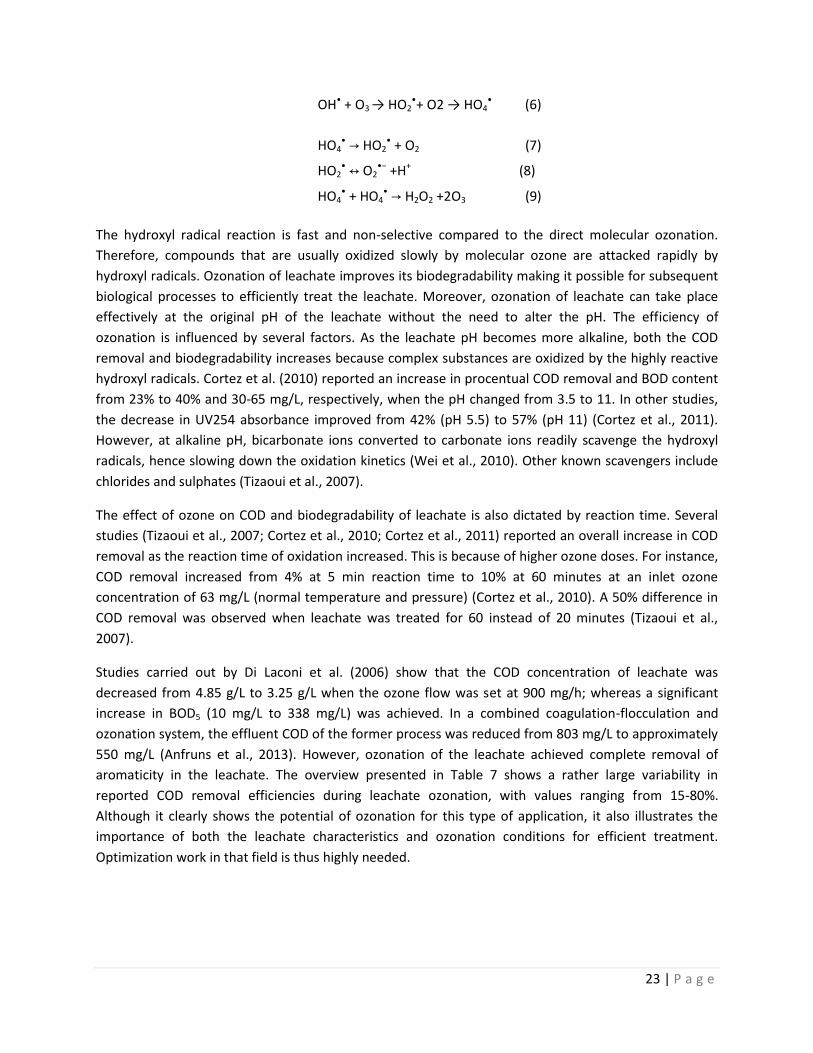
23 | P a g e
OH• + O3 → HO2•+ O2 → HO4
• (6)
HO4• → HO2
• + O2 (7)
HO2• ↔ O2
•− +H+ (8)
HO4• + HO4
• → H2O2 +2O3 (9)
The hydroxyl radical reaction is fast and non-selective compared to the direct molecular ozonation.
Therefore, compounds that are usually oxidized slowly by molecular ozone are attacked rapidly by
hydroxyl radicals. Ozonation of leachate improves its biodegradability making it possible for subsequent
biological processes to efficiently treat the leachate. Moreover, ozonation of leachate can take place
effectively at the original pH of the leachate without the need to alter the pH. The efficiency of
ozonation is influenced by several factors. As the leachate pH becomes more alkaline, both the COD
removal and biodegradability increases because complex substances are oxidized by the highly reactive
hydroxyl radicals. Cortez et al. (2010) reported an increase in procentual COD removal and BOD content
from 23% to 40% and 30-65 mg/L, respectively, when the pH changed from 3.5 to 11. In other studies,
the decrease in UV254 absorbance improved from 42% (pH 5.5) to 57% (pH 11) (Cortez et al., 2011).
However, at alkaline pH, bicarbonate ions converted to carbonate ions readily scavenge the hydroxyl
radicals, hence slowing down the oxidation kinetics (Wei et al., 2010). Other known scavengers include
chlorides and sulphates (Tizaoui et al., 2007).
The effect of ozone on COD and biodegradability of leachate is also dictated by reaction time. Several
studies (Tizaoui et al., 2007; Cortez et al., 2010; Cortez et al., 2011) reported an overall increase in COD
removal as the reaction time of oxidation increased. This is because of higher ozone doses. For instance,
COD removal increased from 4% at 5 min reaction time to 10% at 60 minutes at an inlet ozone
concentration of 63 mg/L (normal temperature and pressure) (Cortez et al., 2010). A 50% difference in
COD removal was observed when leachate was treated for 60 instead of 20 minutes (Tizaoui et al.,
2007).
Studies carried out by Di Laconi et al. (2006) show that the COD concentration of leachate was
decreased from 4.85 g/L to 3.25 g/L when the ozone flow was set at 900 mg/h; whereas a significant
increase in BOD5 (10 mg/L to 338 mg/L) was achieved. In a combined coagulation-flocculation and
ozonation system, the effluent COD of the former process was reduced from 803 mg/L to approximately
550 mg/L (Anfruns et al., 2013). However, ozonation of the leachate achieved complete removal of
aromaticity in the leachate. The overview presented in Table 7 shows a rather large variability in
reported COD removal efficiencies during leachate ozonation, with values ranging from 15-80%.
Although it clearly shows the potential of ozonation for this type of application, it also illustrates the
importance of both the leachate characteristics and ozonation conditions for efficient treatment.
Optimization work in that field is thus highly needed.
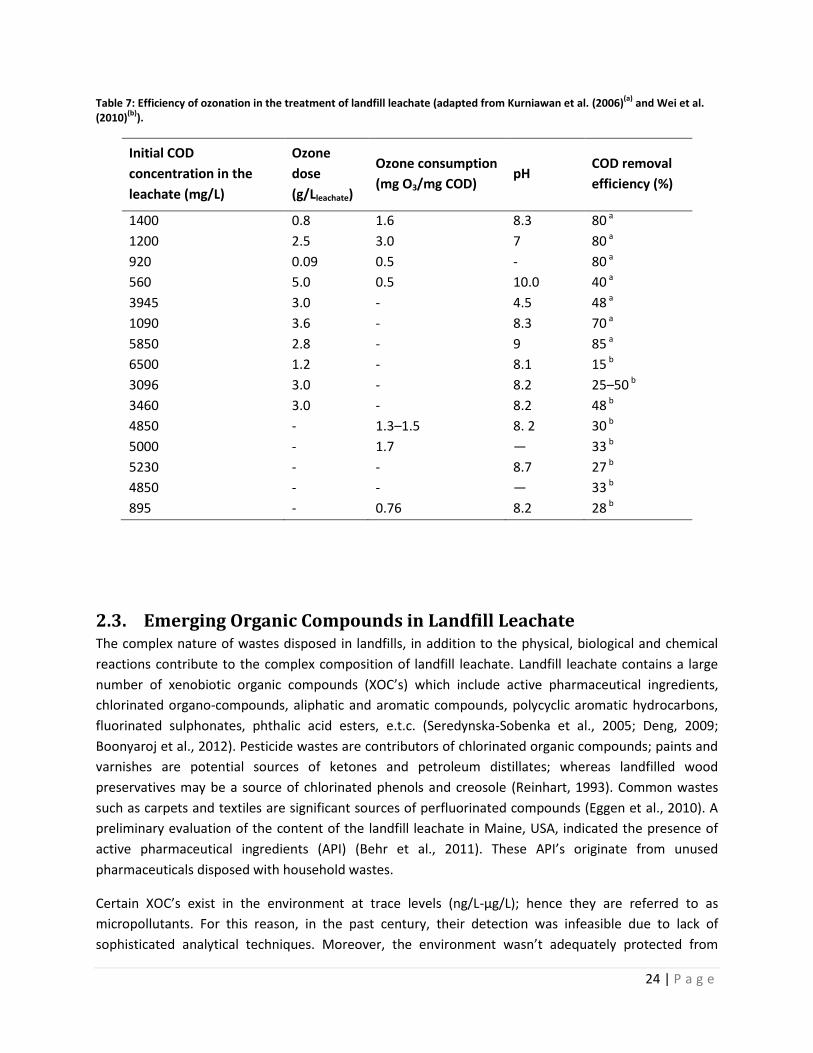
24 | P a g e
Table 7: Efficiency of ozonation in the treatment of landfill leachate (adapted from Kurniawan et al. (2006)(a)
and Wei et al. (2010)
(b)).
Initial COD
concentration in the
leachate (mg/L)
Ozone
dose
(g/Lleachate)
Ozone consumption
(mg O3/mg COD) pH
COD removal
efficiency (%)
1400 0.8 1.6 8.3 80 a
1200 2.5 3.0 7 80 a
920 0.09 0.5 - 80 a
560 5.0 0.5 10.0 40 a
3945 3.0 - 4.5 48 a
1090 3.6 - 8.3 70 a
5850 2.8 - 9 85 a
6500 1.2 - 8.1 15 b
3096 3.0 - 8.2 25–50 b
3460 3.0 - 8.2 48 b
4850 - 1.3–1.5 8. 2 30 b
5000 - 1.7 — 33 b
5230 - - 8.7 27 b
4850 - - — 33 b
895 - 0.76 8.2 28 b
2.3. Emerging Organic Compounds in Landfill Leachate The complex nature of wastes disposed in landfills, in addition to the physical, biological and chemical
reactions contribute to the complex composition of landfill leachate. Landfill leachate contains a large
number of xenobiotic organic compounds (XOC’s) which include active pharmaceutical ingredients,
chlorinated organo-compounds, aliphatic and aromatic compounds, polycyclic aromatic hydrocarbons,
fluorinated sulphonates, phthalic acid esters, e.t.c. (Seredynska-Sobenka et al., 2005; Deng, 2009;
Boonyaroj et al., 2012). Pesticide wastes are contributors of chlorinated organic compounds; paints and
varnishes are potential sources of ketones and petroleum distillates; whereas landfilled wood
preservatives may be a source of chlorinated phenols and creosole (Reinhart, 1993). Common wastes
such as carpets and textiles are significant sources of perfluorinated compounds (Eggen et al., 2010). A
preliminary evaluation of the content of the landfill leachate in Maine, USA, indicated the presence of
active pharmaceutical ingredients (API) (Behr et al., 2011). These API’s originate from unused
pharmaceuticals disposed with household wastes.
Certain XOC’s exist in the environment at trace levels (ng/L-µg/L); hence they are referred to as
micropollutants. For this reason, in the past century, their detection was infeasible due to lack of
sophisticated analytical techniques. Moreover, the environment wasn’t adequately protected from
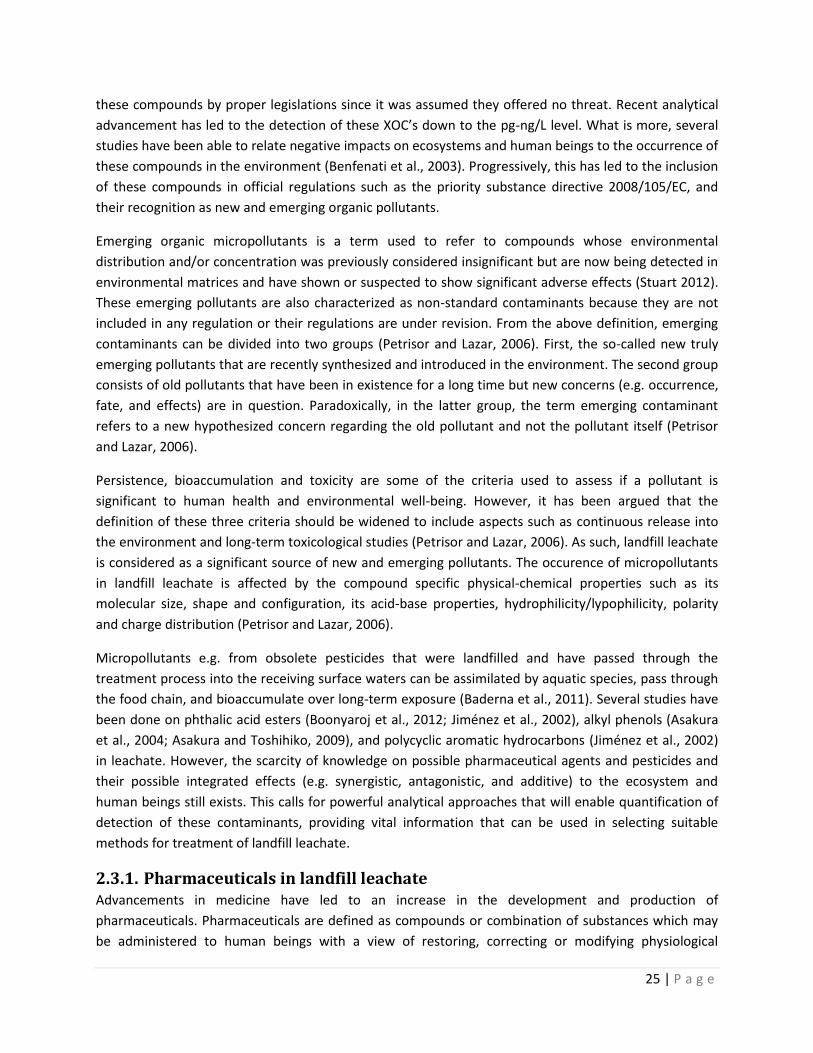
25 | P a g e
these compounds by proper legislations since it was assumed they offered no threat. Recent analytical
advancement has led to the detection of these XOC’s down to the pg-ng/L level. What is more, several
studies have been able to relate negative impacts on ecosystems and human beings to the occurrence of
these compounds in the environment (Benfenati et al., 2003). Progressively, this has led to the inclusion
of these compounds in official regulations such as the priority substance directive 2008/105/EC, and
their recognition as new and emerging organic pollutants.
Emerging organic micropollutants is a term used to refer to compounds whose environmental
distribution and/or concentration was previously considered insignificant but are now being detected in
environmental matrices and have shown or suspected to show significant adverse effects (Stuart 2012).
These emerging pollutants are also characterized as non-standard contaminants because they are not
included in any regulation or their regulations are under revision. From the above definition, emerging
contaminants can be divided into two groups (Petrisor and Lazar, 2006). First, the so-called new truly
emerging pollutants that are recently synthesized and introduced in the environment. The second group
consists of old pollutants that have been in existence for a long time but new concerns (e.g. occurrence,
fate, and effects) are in question. Paradoxically, in the latter group, the term emerging contaminant
refers to a new hypothesized concern regarding the old pollutant and not the pollutant itself (Petrisor
and Lazar, 2006).
Persistence, bioaccumulation and toxicity are some of the criteria used to assess if a pollutant is
significant to human health and environmental well-being. However, it has been argued that the
definition of these three criteria should be widened to include aspects such as continuous release into
the environment and long-term toxicological studies (Petrisor and Lazar, 2006). As such, landfill leachate
is considered as a significant source of new and emerging pollutants. The occurence of micropollutants
in landfill leachate is affected by the compound specific physical-chemical properties such as its
molecular size, shape and configuration, its acid-base properties, hydrophilicity/lypophilicity, polarity
and charge distribution (Petrisor and Lazar, 2006).
Micropollutants e.g. from obsolete pesticides that were landfilled and have passed through the
treatment process into the receiving surface waters can be assimilated by aquatic species, pass through
the food chain, and bioaccumulate over long-term exposure (Baderna et al., 2011). Several studies have
been done on phthalic acid esters (Boonyaroj et al., 2012; Jiménez et al., 2002), alkyl phenols (Asakura
et al., 2004; Asakura and Toshihiko, 2009), and polycyclic aromatic hydrocarbons (Jiménez et al., 2002)
in leachate. However, the scarcity of knowledge on possible pharmaceutical agents and pesticides and
their possible integrated effects (e.g. synergistic, antagonistic, and additive) to the ecosystem and
human beings still exists. This calls for powerful analytical approaches that will enable quantification of
detection of these contaminants, providing vital information that can be used in selecting suitable
methods for treatment of landfill leachate.
2.3.1. Pharmaceuticals in landfill leachate Advancements in medicine have led to an increase in the development and production of
pharmaceuticals. Pharmaceuticals are defined as compounds or combination of substances which may
be administered to human beings with a view of restoring, correcting or modifying physiological
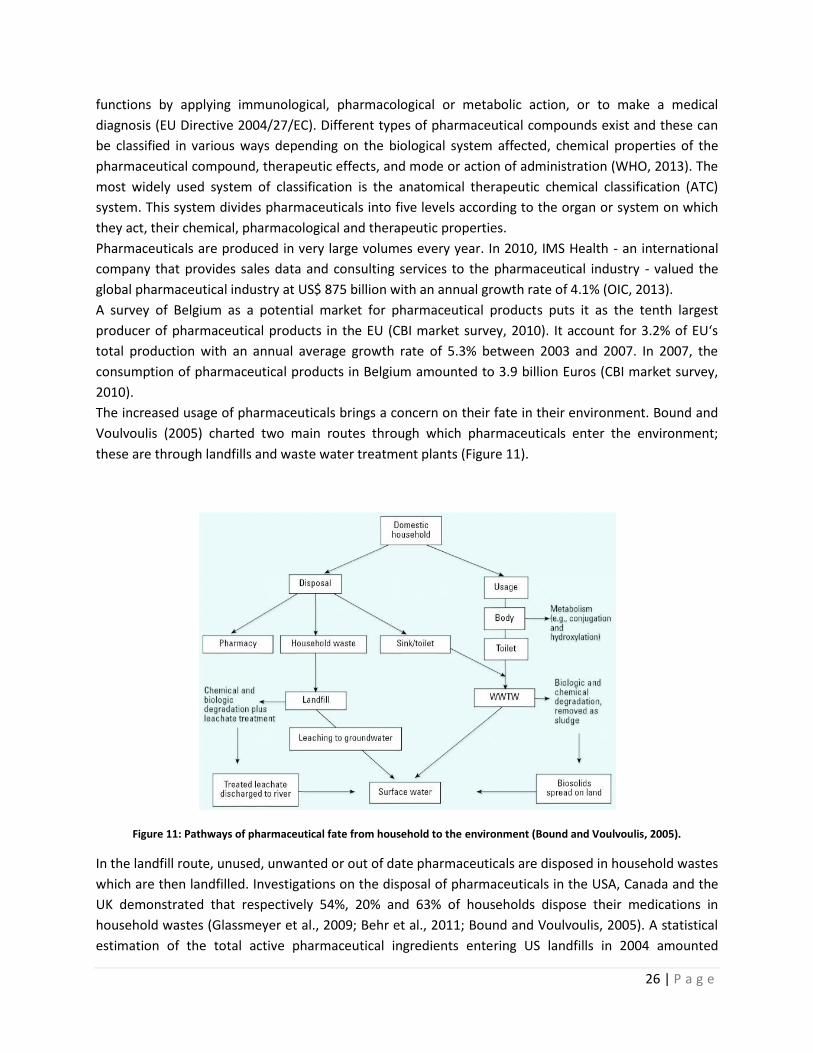
26 | P a g e
functions by applying immunological, pharmacological or metabolic action, or to make a medical
diagnosis (EU Directive 2004/27/EC). Different types of pharmaceutical compounds exist and these can
be classified in various ways depending on the biological system affected, chemical properties of the
pharmaceutical compound, therapeutic effects, and mode or action of administration (WHO, 2013). The
most widely used system of classification is the anatomical therapeutic chemical classification (ATC)
system. This system divides pharmaceuticals into five levels according to the organ or system on which
they act, their chemical, pharmacological and therapeutic properties.
Pharmaceuticals are produced in very large volumes every year. In 2010, IMS Health - an international
company that provides sales data and consulting services to the pharmaceutical industry - valued the
global pharmaceutical industry at US$ 875 billion with an annual growth rate of 4.1% (OIC, 2013).
A survey of Belgium as a potential market for pharmaceutical products puts it as the tenth largest
producer of pharmaceutical products in the EU (CBI market survey, 2010). It account for 3.2% of EU‘s
total production with an annual average growth rate of 5.3% between 2003 and 2007. In 2007, the
consumption of pharmaceutical products in Belgium amounted to 3.9 billion Euros (CBI market survey,
2010).
The increased usage of pharmaceuticals brings a concern on their fate in their environment. Bound and
Voulvoulis (2005) charted two main routes through which pharmaceuticals enter the environment;
these are through landfills and waste water treatment plants (Figure 11).
Figure 11: Pathways of pharmaceutical fate from household to the environment (Bound and Voulvoulis, 2005).
In the landfill route, unused, unwanted or out of date pharmaceuticals are disposed in household wastes
which are then landfilled. Investigations on the disposal of pharmaceuticals in the USA, Canada and the
UK demonstrated that respectively 54%, 20% and 63% of households dispose their medications in
household wastes (Glassmeyer et al., 2009; Behr et al., 2011; Bound and Voulvoulis, 2005). A statistical
estimation of the total active pharmaceutical ingredients entering US landfills in 2004 amounted
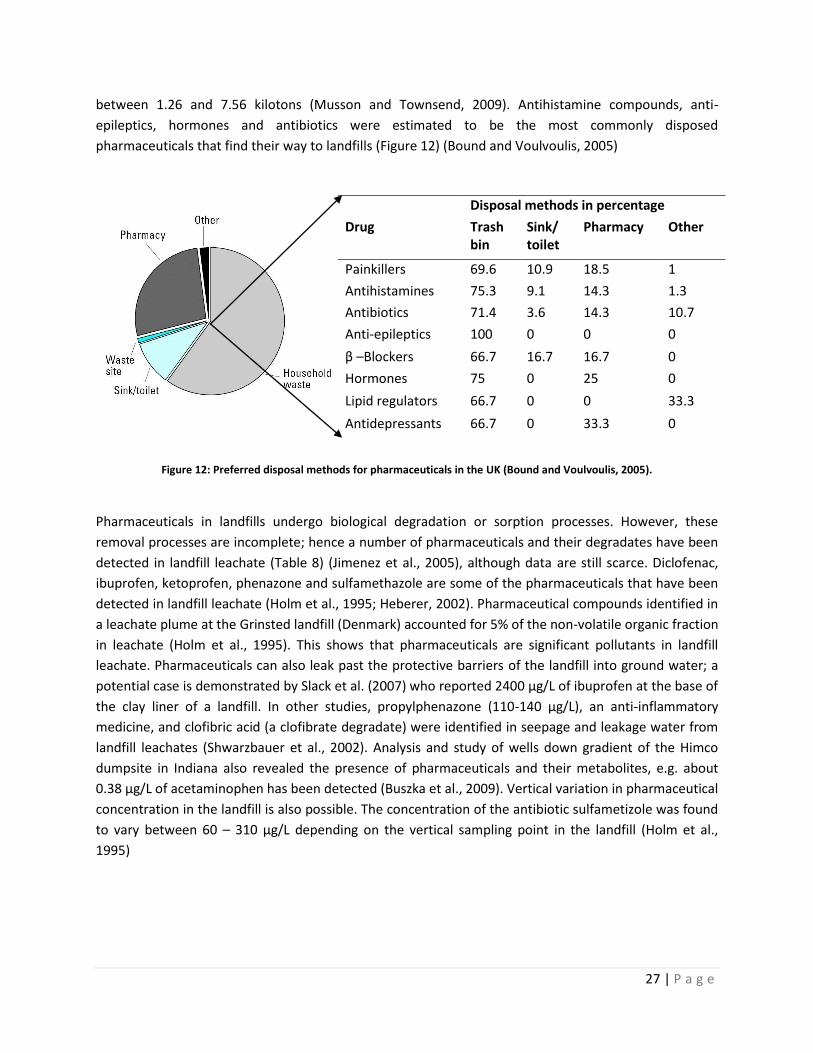
27 | P a g e
between 1.26 and 7.56 kilotons (Musson and Townsend, 2009). Antihistamine compounds, anti-
epileptics, hormones and antibiotics were estimated to be the most commonly disposed
pharmaceuticals that find their way to landfills (Figure 12) (Bound and Voulvoulis, 2005)
Figure 12: Preferred disposal methods for pharmaceuticals in the UK (Bound and Voulvoulis, 2005).
Pharmaceuticals in landfills undergo biological degradation or sorption processes. However, these
removal processes are incomplete; hence a number of pharmaceuticals and their degradates have been
detected in landfill leachate (Table 8) (Jimenez et al., 2005), although data are still scarce. Diclofenac,
ibuprofen, ketoprofen, phenazone and sulfamethazole are some of the pharmaceuticals that have been
detected in landfill leachate (Holm et al., 1995; Heberer, 2002). Pharmaceutical compounds identified in
a leachate plume at the Grinsted landfill (Denmark) accounted for 5% of the non-volatile organic fraction
in leachate (Holm et al., 1995). This shows that pharmaceuticals are significant pollutants in landfill
leachate. Pharmaceuticals can also leak past the protective barriers of the landfill into ground water; a
potential case is demonstrated by Slack et al. (2007) who reported 2400 µg/L of ibuprofen at the base of
the clay liner of a landfill. In other studies, propylphenazone (110-140 µg/L), an anti-inflammatory
medicine, and clofibric acid (a clofibrate degradate) were identified in seepage and leakage water from
landfill leachates (Shwarzbauer et al., 2002). Analysis and study of wells down gradient of the Himco
dumpsite in Indiana also revealed the presence of pharmaceuticals and their metabolites, e.g. about
0.38 µg/L of acetaminophen has been detected (Buszka et al., 2009). Vertical variation in pharmaceutical
concentration in the landfill is also possible. The concentration of the antibiotic sulfametizole was found
to vary between 60 – 310 µg/L depending on the vertical sampling point in the landfill (Holm et al.,
1995)
Disposal methods in percentage
Drug Trash bin
Sink/ toilet
Pharmacy Other
Painkillers 69.6 10.9 18.5 1
Antihistamines 75.3 9.1 14.3 1.3
Antibiotics 71.4 3.6 14.3 10.7
Anti-epileptics 100 0 0 0
β –Blockers 66.7 16.7 16.7 0
Hormones 75 0 25 0
Lipid regulators 66.7 0 0 33.3
Antidepressants 66.7 0 33.3 0
28 | P a g e
Table 8: Detected pharmaceuticals in landfill leachate.
Name Therapautic class
Molecular weight (g/mol)
Molecular formula
Concentration range (μg/L)
Reference
Diethyl stilbestrol Hormone 268 C18H20O2 na Liyana et al. (2009)
Cholesterol Hormone 386 C27H46O 0.022 -0.044 Liyana et al. (2009); Barnes et al. (2004)
Ibuprofen NSAID 206 C13H18O2 0.07 -2400 Eggen et al. (2010); Shwarzbauer et al. (2002); Slack et al. (2007)
Paracetamol NSAID 151 C8H9NO2 < 0.002- 0.09 Eggen et al. (2010)
Phenazon Analgesic 188 C11H12N2O < 0.003 Eggen et al. (2010)
Gemfibrozil Fibrate 250 C15H22O3 < 0.1 Eggen et al. (2010)
Naproxen NSAID 230 C14H14O3 < 0.0003 - 0.3 Eggen et al. (2010)
Carbamazepin Anti-epileptic drug
236 C15H12N2O 0.0008 – 0.009 Eggen et al. (2010)
Lincomycin Antibiotic 406 C18H34N2O6S 0.05 – 0.1 Barnes et al. (2004)
Triclosan Antibacterial, antifungal
289 C12H7Cl3O2 < 0.04 – 0.21 Barnes et al. (2004)
Propyl phenazone
Analgesic drug
230 C14H18N2O 110 -140 Holm et al. (1995); Shwarzbauer et al. (2002)
Clofibric acid Clofibrate drug intermediate
214 C10H11ClO3 nr Slack et al. (2005); Shwarzbauer et al. (2002)
5,5 diallylbarbituric acid
Barbiturate 208 C10H12N2O3 nr Holm et al. (1995)
nr: not available NSAID: Non steroidal anti inflammatory drug
2.3.2. Pesticides in landfill leachate Synthetic pesticides are substances which are meant to prevent or mitigate the effects of a pest or to
destroy the pest. Pesticides are commonly used in agriculture as plant protection products; however
they also find use in public health. They can be grouped according to the target organism for instance as
herbicide, fungicide, insecticide e.t.c; or by chemical family e.g. organochlorines, organophosphates,
carbamates e.t.c. Classification can also be done based on their biological mechanism. Pesticides have
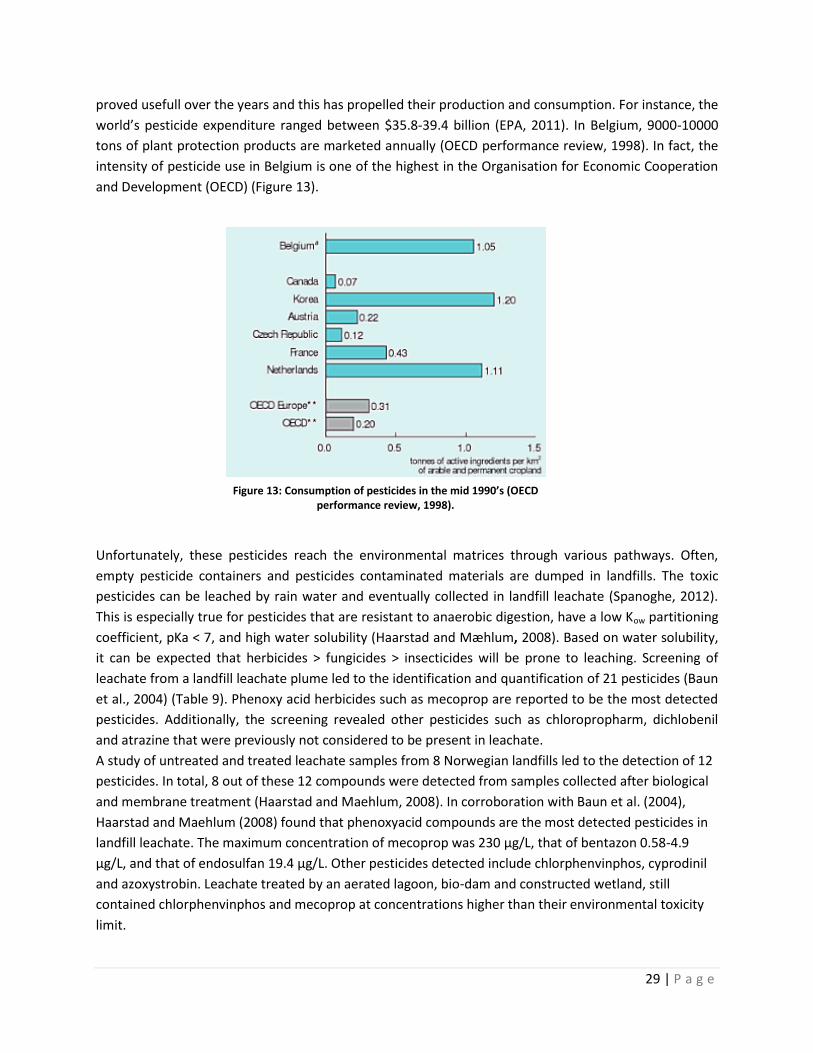
29 | P a g e
proved usefull over the years and this has propelled their production and consumption. For instance, the
world’s pesticide expenditure ranged between $35.8-39.4 billion (EPA, 2011). In Belgium, 9000-10000
tons of plant protection products are marketed annually (OECD performance review, 1998). In fact, the
intensity of pesticide use in Belgium is one of the highest in the Organisation for Economic Cooperation
and Development (OECD) (Figure 13).
Unfortunately, these pesticides reach the environmental matrices through various pathways. Often,
empty pesticide containers and pesticides contaminated materials are dumped in landfills. The toxic
pesticides can be leached by rain water and eventually collected in landfill leachate (Spanoghe, 2012).
This is especially true for pesticides that are resistant to anaerobic digestion, have a low Kow partitioning
coefficient, pKa < 7, and high water solubility (Haarstad and Mæhlum, 2008). Based on water solubility,
it can be expected that herbicides > fungicides > insecticides will be prone to leaching. Screening of
leachate from a landfill leachate plume led to the identification and quantification of 21 pesticides (Baun
et al., 2004) (Table 9). Phenoxy acid herbicides such as mecoprop are reported to be the most detected
pesticides. Additionally, the screening revealed other pesticides such as chloropropharm, dichlobenil
and atrazine that were previously not considered to be present in leachate.
A study of untreated and treated leachate samples from 8 Norwegian landfills led to the detection of 12
pesticides. In total, 8 out of these 12 compounds were detected from samples collected after biological
and membrane treatment (Haarstad and Maehlum, 2008). In corroboration with Baun et al. (2004),
Haarstad and Maehlum (2008) found that phenoxyacid compounds are the most detected pesticides in
landfill leachate. The maximum concentration of mecoprop was 230 µg/L, that of bentazon 0.58-4.9
µg/L, and that of endosulfan 19.4 µg/L. Other pesticides detected include chlorphenvinphos, cyprodinil
and azoxystrobin. Leachate treated by an aerated lagoon, bio-dam and constructed wetland, still
contained chlorphenvinphos and mecoprop at concentrations higher than their environmental toxicity
limit.
Figure 13: Consumption of pesticides in the mid 1990’s (OECD performance review, 1998).
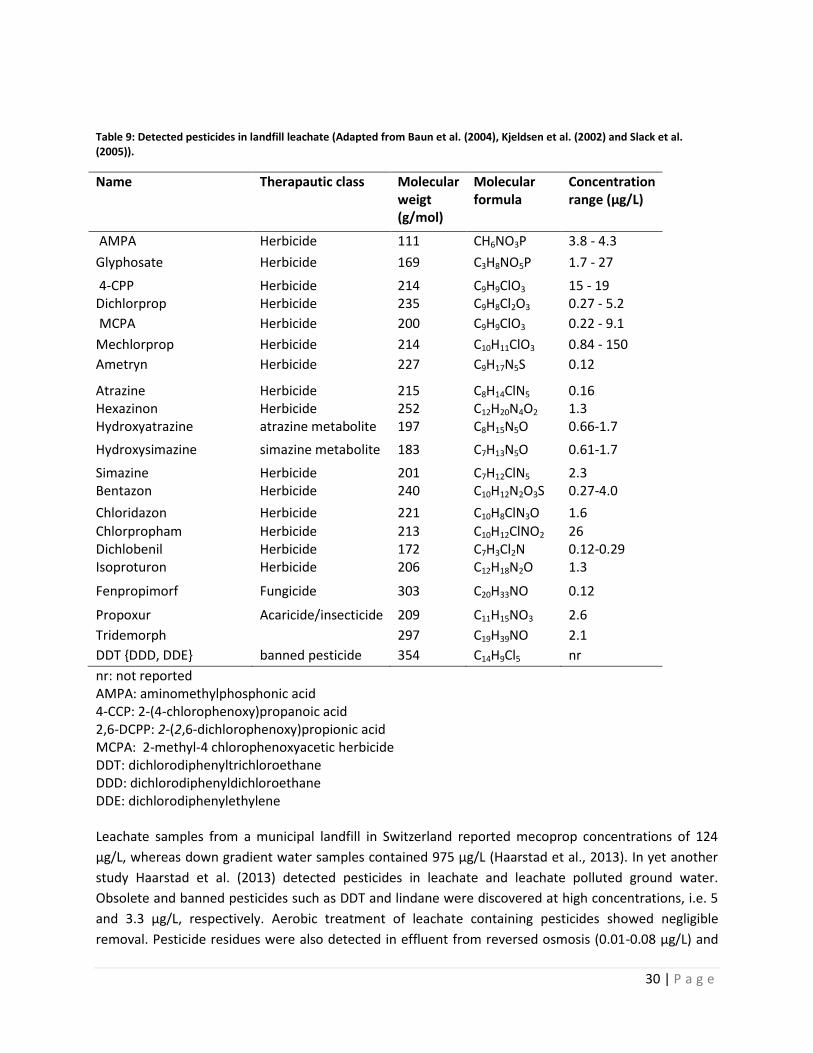
30 | P a g e
Table 9: Detected pesticides in landfill leachate (Adapted from Baun et al. (2004), Kjeldsen et al. (2002) and Slack et al. (2005)).
Name Therapautic class Molecular weigt (g/mol)
Molecular formula
Concentration range (μg/L)
AMPA Herbicide 111 CH6NO3P 3.8 - 4.3
Glyphosate Herbicide 169 C3H8NO5P 1.7 - 27
4-CPP Herbicide 214 C9H9ClO3 15 - 19 Dichlorprop Herbicide 235 C9H8Cl2O3 0.27 - 5.2
MCPA Herbicide 200 C9H9ClO3 0.22 - 9.1
Mechlorprop Herbicide 214 C10H11ClO3 0.84 - 150
Ametryn Herbicide 227 C9H17N5S 0.12
Atrazine Herbicide 215 C8H14ClN5 0.16 Hexazinon Herbicide 252 C12H20N4O2 1.3 Hydroxyatrazine atrazine metabolite 197 C8H15N5O 0.66-1.7
Hydroxysimazine simazine metabolite 183 C7H13N5O 0.61-1.7
Simazine Herbicide 201 C7H12ClN5 2.3 Bentazon Herbicide 240 C10H12N2O3S 0.27-4.0
Chloridazon Herbicide 221 C10H8ClN3O 1.6
Chlorpropham Herbicide 213 C10H12ClNO2 26 Dichlobenil Herbicide 172 C7H3Cl2N 0.12-0.29 Isoproturon Herbicide 206 C12H18N2O 1.3
Fenpropimorf Fungicide 303 C20H33NO 0.12
Propoxur Acaricide/insecticide 209 C11H15NO3 2.6
Tridemorph 297 C19H39NO 2.1
DDT {DDD, DDE} banned pesticide 354 C14H9Cl5 nr
nr: not reported AMPA: aminomethylphosphonic acid 4-CCP: 2-(4-chlorophenoxy)propanoic acid 2,6-DCPP: 2-(2,6-dichlorophenoxy)propionic acid MCPA: 2-methyl-4 chlorophenoxyacetic herbicide DDT: dichlorodiphenyltrichloroethane DDD: dichlorodiphenyldichloroethane DDE: dichlorodiphenylethylene Leachate samples from a municipal landfill in Switzerland reported mecoprop concentrations of 124
µg/L, whereas down gradient water samples contained 975 µg/L (Haarstad et al., 2013). In yet another
study Haarstad et al. (2013) detected pesticides in leachate and leachate polluted ground water.
Obsolete and banned pesticides such as DDT and lindane were discovered at high concentrations, i.e. 5
and 3.3 µg/L, respectively. Aerobic treatment of leachate containing pesticides showed negligible
removal. Pesticide residues were also detected in effluent from reversed osmosis (0.01-0.08 µg/L) and
31 | P a g e
SBR treated leachate (0.03-1.1 µg/L). Removal of organochloro pesticides by anaerobic and membrane
bioreactor treatment showed to be effective for some pesticides such as hexachlorocyclohexane.
However, the more persistent DDE (DDT metabolite) was still detected at the end of the process (Yiping
et al., 2008).
In Japan, the organophosphate insecticide diazinon was detected in landfill leachate at a concentration
of 5-24 ng/L. Other measured pesticides include the fungicide flutolanil (4-15 ng/L), atrazine (13-166
ng/L), and the carbamate herbicide molinate (24-100 ng/L) (Yasuhara et al., 1997).
2.3.3 Analytical techniques to measure organic micropollutants in landfill
leachate The first step in the analytical procedure is the sampling and sample preparation, which is often the
most challenging and time consuming step (Demeestere, 2012). Landfill leachate is a very dirty and
complex matrix that contains – apart from the analytes of interest – a variety of other compounds which
can cause significant interferences during the analysis. The aim of sample preparation is to remove
these interferences as much as possible and to concentrate the micropollutants that are to be
measured.
Liquid-liquid extraction (LLE) is used by some authors that analyzed landfill leachate towards the
presence of pesticides, endocrine disrupting compounds and pharmaceuticals (Yasuhara et al., 1997;
Asakura et al., 2004; Murray and Beck, 1990; Oman and Hynning, 1993; Jimenez et al., 2002). However,
consecutive extractions are time consuming and quite a lot of solvent is used in LLE. Furthermore,
formation of emulsions makes separation of solvent from leachate and dewatering difficult (Asakura et
al., 2004). This led to the development of new approaches. Liquid-phase micro-extraction (LPME)
techniques are miniaturized methods of LLE which have been applied in determining emerging
pollutants in landfill leachate, although applications are still scarce (Mahugo-Santana et al., 2011).
As an alternative to LLE, solid-phase extraction (SPE) uses a solid instead of a liquid phase to isolate the
analytes from the leachate. During extraction, sample and solvent material flow through the sorbent
material which can be found at the base of packed cartridges between two frits or as free disks, pipette
tips or SPE plates. Regardless of the type of sorbent used, the different steps of action during SPE are (i)
wetting and conditioning of the sorbent; (ii) loading of the sample; (iii) washing of unwanted
compounds; and (iv) elution of the analytes of interest (Demeestere, 2012). Applications of SPE in
leachate analysis can be found in Barnes et al. (2004), Liyana et al. (2009), Benfenati et al., (1999) and
Boonyaroj et al., (2012) for extracting organic micropollutants like antibiotic and other human-
prescription and non-prescription pharmaceuticals, diethylstilbestrol, phenolic acids and phthalic esters.
Once the analytes are transferred into a clean extract, molecular separation is performed using gas
chromatography (GC) or liquid chromatography (LC). GC applications for micropollutant analysis in
landfill leachate are reported by e.g. Yasuhara et al., (1997), Murray and Beck, (1990) and Boonyaroj et
al., (2012). For compounds that are not easily volatilized, derivatization is needed, as illustrated by
32 | P a g e
Asakura et al. (2004) for Bisphenol A analysis. In case of thermally unstable, non-volatile or highly polar
compounds, LC is the separation method of choice. For example, Benfenati et al. (1999) used LC for
identification of polar acidic compounds in landfill leachate.
To obtain sufficient sensitivity and selectivity, advanced detection techniques are needed to finally
identify and quantify organic micropollutants in wastewaters and other environmental matrices.
Therefore, modern mass spectrometry (MS), coupled to GC or LC, is the most powerful detection
technique for this kind of analysis. In MS, compounds eluting from the separation phase are ionized
using different methods like electron ionization (EI, when coupled with GC) or electrospray ionization
(ESI, when coupled with LC). After ionization, the ions are focused and accelerated into a beam after
which they are separated from each other by an analyzer according to their mass to charge (m/z) ratio.
In mass separation, resolving power expresses to which extend two ions with a mass difference ΔM can
be separated (R=M/ΔM where ΔM=M1-M2, M1>M2 and M=m/z of ion). A distinction can be made
between low-resolution mass analysers such as a quadrupole or ion trap, and more advanced high-
resolution mass analysers such as the double focusing magnetic sector instruments, time-of-flight
analyzers, and the quite recent developed orbitrap analysers. The higher the resolving power, the better
the instrument can differentiate between the analytes of interest and co-eluting matrix compounds
which is of high importance in trace analysis in complex and dirty matrices like landfill leachate.
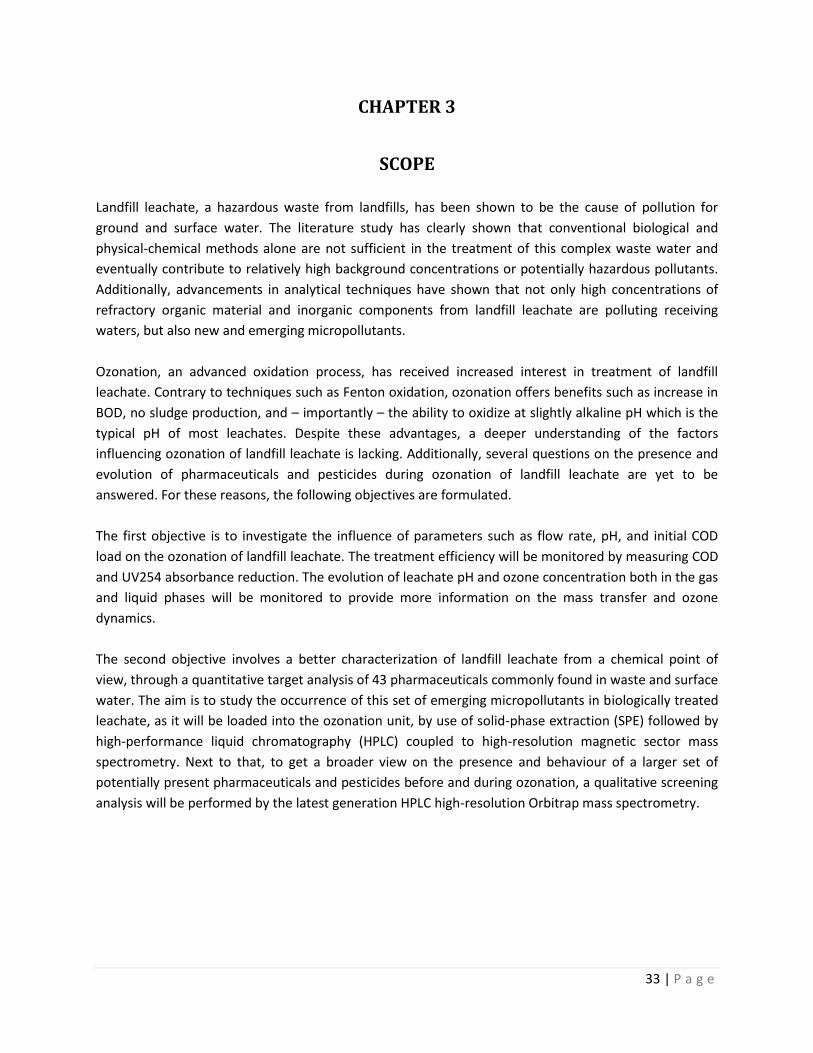
33 | P a g e
CHAPTER 3
SCOPE
Landfill leachate, a hazardous waste from landfills, has been shown to be the cause of pollution for
ground and surface water. The literature study has clearly shown that conventional biological and
physical-chemical methods alone are not sufficient in the treatment of this complex waste water and
eventually contribute to relatively high background concentrations or potentially hazardous pollutants.
Additionally, advancements in analytical techniques have shown that not only high concentrations of
refractory organic material and inorganic components from landfill leachate are polluting receiving
waters, but also new and emerging micropollutants.
Ozonation, an advanced oxidation process, has received increased interest in treatment of landfill
leachate. Contrary to techniques such as Fenton oxidation, ozonation offers benefits such as increase in
BOD, no sludge production, and – importantly – the ability to oxidize at slightly alkaline pH which is the
typical pH of most leachates. Despite these advantages, a deeper understanding of the factors
influencing ozonation of landfill leachate is lacking. Additionally, several questions on the presence and
evolution of pharmaceuticals and pesticides during ozonation of landfill leachate are yet to be
answered. For these reasons, the following objectives are formulated.
The first objective is to investigate the influence of parameters such as flow rate, pH, and initial COD
load on the ozonation of landfill leachate. The treatment efficiency will be monitored by measuring COD
and UV254 absorbance reduction. The evolution of leachate pH and ozone concentration both in the gas
and liquid phases will be monitored to provide more information on the mass transfer and ozone
dynamics.
The second objective involves a better characterization of landfill leachate from a chemical point of
view, through a quantitative target analysis of 43 pharmaceuticals commonly found in waste and surface
water. The aim is to study the occurrence of this set of emerging micropollutants in biologically treated
leachate, as it will be loaded into the ozonation unit, by use of solid-phase extraction (SPE) followed by
high-performance liquid chromatography (HPLC) coupled to high-resolution magnetic sector mass
spectrometry. Next to that, to get a broader view on the presence and behaviour of a larger set of
potentially present pharmaceuticals and pesticides before and during ozonation, a qualitative screening
analysis will be performed by the latest generation HPLC high-resolution Orbitrap mass spectrometry.
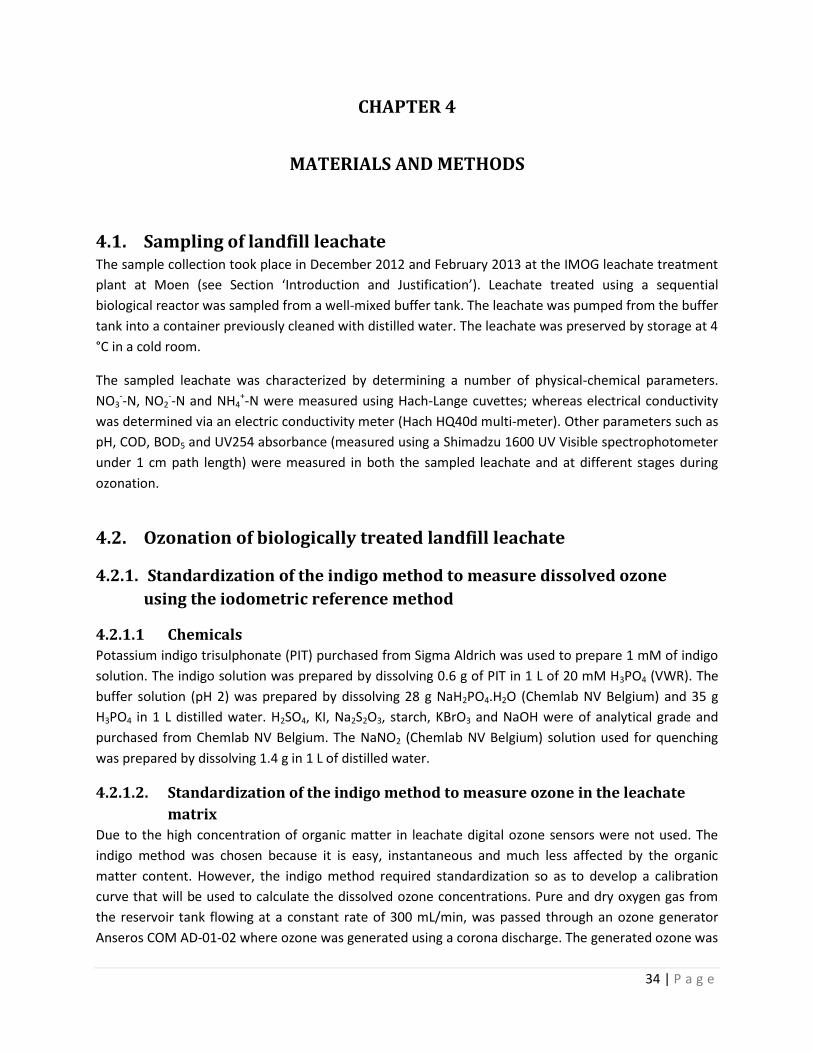
34 | P a g e
CHAPTER 4
MATERIALS AND METHODS
4.1. Sampling of landfill leachate The sample collection took place in December 2012 and February 2013 at the IMOG leachate treatment
plant at Moen (see Section ‘Introduction and Justification’). Leachate treated using a sequential
biological reactor was sampled from a well-mixed buffer tank. The leachate was pumped from the buffer
tank into a container previously cleaned with distilled water. The leachate was preserved by storage at 4
°C in a cold room.
The sampled leachate was characterized by determining a number of physical-chemical parameters.
NO3--N, NO2
--N and NH4+-N were measured using Hach-Lange cuvettes; whereas electrical conductivity
was determined via an electric conductivity meter (Hach HQ40d multi-meter). Other parameters such as
pH, COD, BOD5 and UV254 absorbance (measured using a Shimadzu 1600 UV Visible spectrophotometer
under 1 cm path length) were measured in both the sampled leachate and at different stages during
ozonation.
4.2. Ozonation of biologically treated landfill leachate
4.2.1. Standardization of the indigo method to measure dissolved ozone
using the iodometric reference method
4.2.1.1 Chemicals
Potassium indigo trisulphonate (PIT) purchased from Sigma Aldrich was used to prepare 1 mM of indigo
solution. The indigo solution was prepared by dissolving 0.6 g of PIT in 1 L of 20 mM H3PO4 (VWR). The
buffer solution (pH 2) was prepared by dissolving 28 g NaH2PO4.H2O (Chemlab NV Belgium) and 35 g
H3PO4 in 1 L distilled water. H2SO4, KI, Na2S2O3, starch, KBrO3 and NaOH were of analytical grade and
purchased from Chemlab NV Belgium. The NaNO2 (Chemlab NV Belgium) solution used for quenching
was prepared by dissolving 1.4 g in 1 L of distilled water.
4.2.1.2. Standardization of the indigo method to measure ozone in the leachate
matrix
Due to the high concentration of organic matter in leachate digital ozone sensors were not used. The
indigo method was chosen because it is easy, instantaneous and much less affected by the organic
matter content. However, the indigo method required standardization so as to develop a calibration
curve that will be used to calculate the dissolved ozone concentrations. Pure and dry oxygen gas from
the reservoir tank flowing at a constant rate of 300 mL/min, was passed through an ozone generator
Anseros COM AD-01-02 where ozone was generated using a corona discharge. The generated ozone was
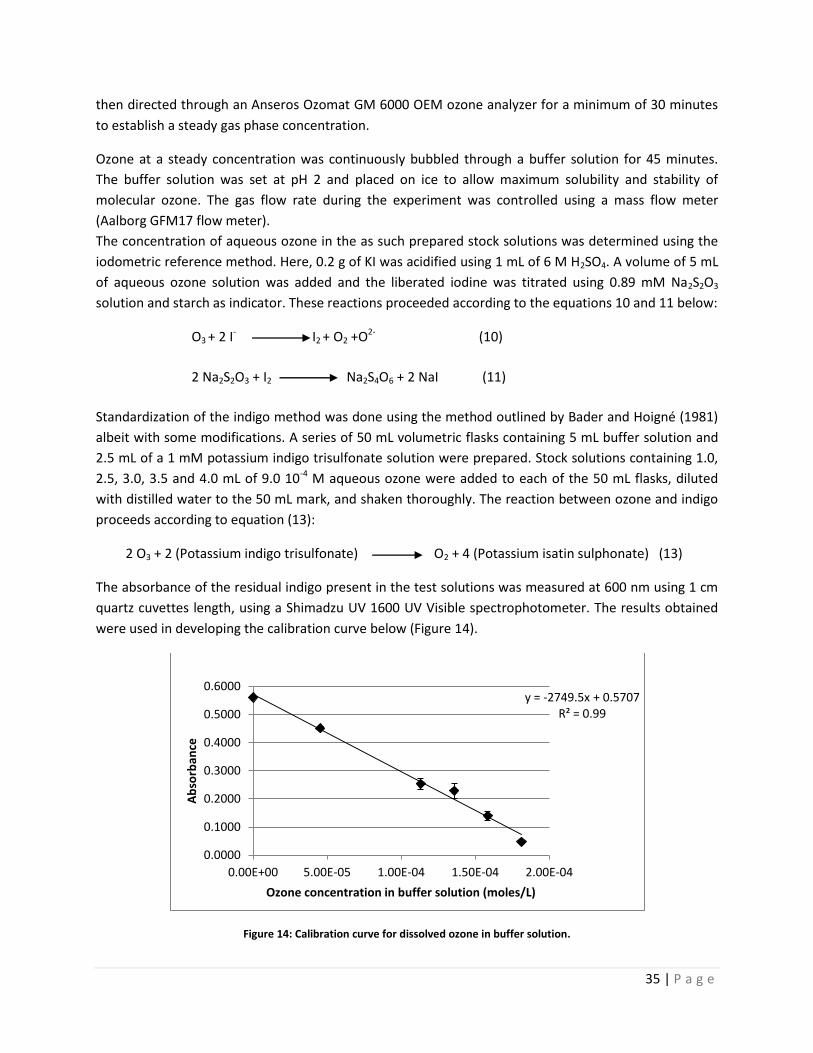
35 | P a g e
then directed through an Anseros Ozomat GM 6000 OEM ozone analyzer for a minimum of 30 minutes
to establish a steady gas phase concentration.
Ozone at a steady concentration was continuously bubbled through a buffer solution for 45 minutes.
The buffer solution was set at pH 2 and placed on ice to allow maximum solubility and stability of
molecular ozone. The gas flow rate during the experiment was controlled using a mass flow meter
(Aalborg GFM17 flow meter).
The concentration of aqueous ozone in the as such prepared stock solutions was determined using the
iodometric reference method. Here, 0.2 g of KI was acidified using 1 mL of 6 M H2SO4. A volume of 5 mL
of aqueous ozone solution was added and the liberated iodine was titrated using 0.89 mM Na2S2O3
solution and starch as indicator. These reactions proceeded according to the equations 10 and 11 below:
O3 + 2 I- I2 + O2 +O2- (10)
2 Na2S2O3 + I2 Na2S4O6 + 2 NaI (11)
Standardization of the indigo method was done using the method outlined by Bader and Hoigné (1981)
albeit with some modifications. A series of 50 mL volumetric flasks containing 5 mL buffer solution and
2.5 mL of a 1 mM potassium indigo trisulfonate solution were prepared. Stock solutions containing 1.0,
2.5, 3.0, 3.5 and 4.0 mL of 9.0 10-4 M aqueous ozone were added to each of the 50 mL flasks, diluted
with distilled water to the 50 mL mark, and shaken thoroughly. The reaction between ozone and indigo
proceeds according to equation (13):
2 O3 + 2 (Potassium indigo trisulfonate) O2 + 4 (Potassium isatin sulphonate) (13)
The absorbance of the residual indigo present in the test solutions was measured at 600 nm using 1 cm
quartz cuvettes length, using a Shimadzu UV 1600 UV Visible spectrophotometer. The results obtained
were used in developing the calibration curve below (Figure 14).
Figure 14: Calibration curve for dissolved ozone in buffer solution.
y = -2749.5x + 0.5707 R² = 0.99
0.0000
0.1000
0.2000
0.3000
0.4000
0.5000
0.6000
0.00E+00 5.00E-05 1.00E-04 1.50E-04 2.00E-04
Ab
sorb
ance
Ozone concentration in buffer solution (moles/L)
36 | P a g e
4.2.2 Ozonation experiments Biologically treated leachate (10 L) was transferred into a lab scale batch reactor (Audenaert et al.,
2013). The construction material of the reactor was glass whereas the fittings and tubings were made of
Teflon. During the experiment, a circulation pump working at 500 L/hr was used to ensure proper mixing
of the reactor content. Figure 15 gives a visual representation of the experimental set-up.
.
Ozone at a steady flow and gas inlet concentration was bubbled through the leachate using a ceramic
bubble diffuser located at the bottom of the reactor. During ozonation, the concentration of the
unreacted ozone in the outlet gas phase was monitored using the Anseros Ozomat GM 6000 OEM ozone
analyzer and logged every second using a Cole-Parmer FN-18200-00 log device. Changes in pH were
monitored using a pH electrode (metro OHM 600).
A set of 50 mL volumetric flasks containing 5 mL of buffer solution and 2.5 mL of 1 mM PIT solution were
prepared. From the total reactor volume, 250 mL of ozonated leachate was sampled after 20, 30, 45 and
60 minutes. Twenty milliliters of the ozonated leachate was used to oxidize the buffered solution of PIT
and distilled water added to the 50 mL mark. To determine possible matrix effects that the leachate may
have on indigo, the remaining solution was quenched using 0.02 M NaNO2. This is because NO2- is a
good scavenger of ozone molecules. Twenty milliliters of quenched leachate was added to a buffered
PIT solution. Another 20 mL of quenched leachate was added to a 50 mL volumetric flask containing only
buffer solution without PIT, and again diluted to the 50 mL mark with distilled water. This was done to
determine the matrix effects of leachate when in distilled water. The absorbance of the resultant
solutions was measured using a Shimadzu 1600 UV-Visible spectrophotometer at 600 nm at 1 cm path
length.
Batch reactor
Ozone off-gas
monitor
Ozone gas generator
and analyzer
pH meter
Circulation
pump
Figure 15: Ozonation reactor and experimental set-up.
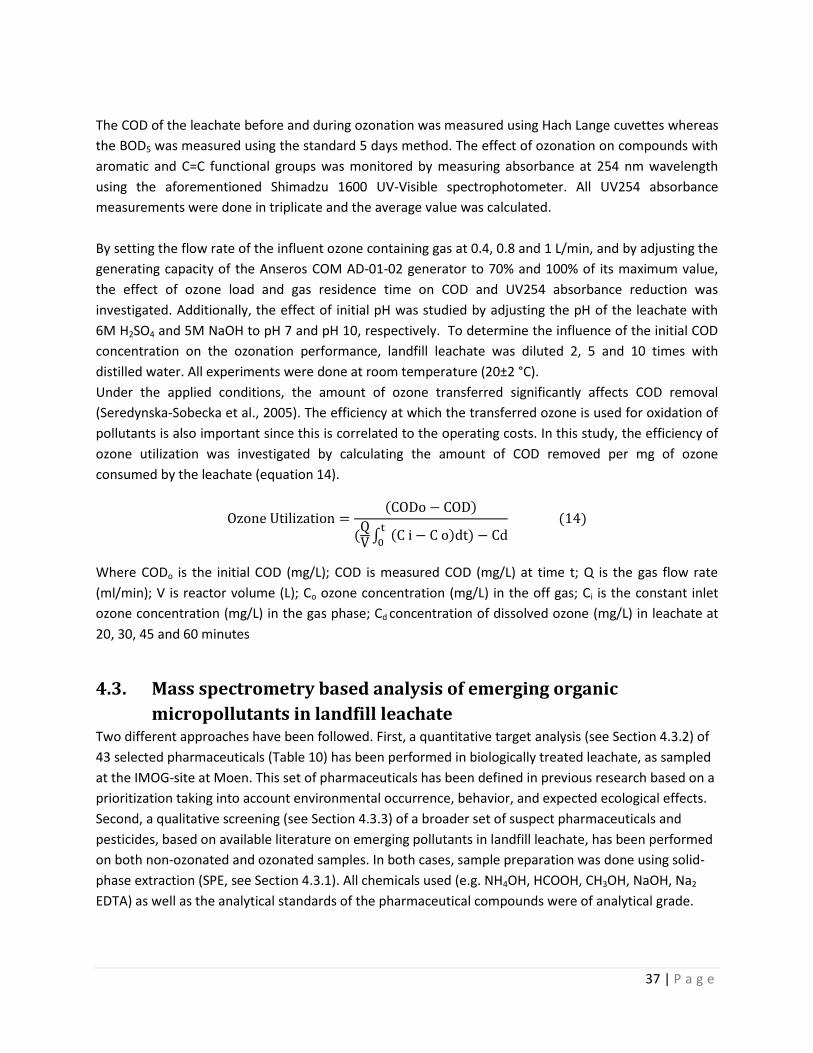
37 | P a g e
The COD of the leachate before and during ozonation was measured using Hach Lange cuvettes whereas
the BOD5 was measured using the standard 5 days method. The effect of ozonation on compounds with
aromatic and C=C functional groups was monitored by measuring absorbance at 254 nm wavelength
using the aforementioned Shimadzu 1600 UV-Visible spectrophotometer. All UV254 absorbance
measurements were done in triplicate and the average value was calculated.
By setting the flow rate of the influent ozone containing gas at 0.4, 0.8 and 1 L/min, and by adjusting the
generating capacity of the Anseros COM AD-01-02 generator to 70% and 100% of its maximum value,
the effect of ozone load and gas residence time on COD and UV254 absorbance reduction was
investigated. Additionally, the effect of initial pH was studied by adjusting the pH of the leachate with
6M H2SO4 and 5M NaOH to pH 7 and pH 10, respectively. To determine the influence of the initial COD
concentration on the ozonation performance, landfill leachate was diluted 2, 5 and 10 times with
distilled water. All experiments were done at room temperature (20±2 °C).
Under the applied conditions, the amount of ozone transferred significantly affects COD removal
(Seredynska-Sobecka et al., 2005). The efficiency at which the transferred ozone is used for oxidation of
pollutants is also important since this is correlated to the operating costs. In this study, the efficiency of
ozone utilization was investigated by calculating the amount of COD removed per mg of ozone
consumed by the leachate (equation 14).
Where CODo is the initial COD (mg/L); COD is measured COD (mg/L) at time t; Q is the gas flow rate
(ml/min); V is reactor volume (L); Co ozone concentration (mg/L) in the off gas; Ci is the constant inlet
ozone concentration (mg/L) in the gas phase; Cd concentration of dissolved ozone (mg/L) in leachate at
20, 30, 45 and 60 minutes
4.3. Mass spectrometry based analysis of emerging organic
micropollutants in landfill leachate Two different approaches have been followed. First, a quantitative target analysis (see Section 4.3.2) of
43 selected pharmaceuticals (Table 10) has been performed in biologically treated leachate, as sampled
at the IMOG-site at Moen. This set of pharmaceuticals has been defined in previous research based on a
prioritization taking into account environmental occurrence, behavior, and expected ecological effects.
Second, a qualitative screening (see Section 4.3.3) of a broader set of suspect pharmaceuticals and
pesticides, based on available literature on emerging pollutants in landfill leachate, has been performed
on both non-ozonated and ozonated samples. In both cases, sample preparation was done using solid-
phase extraction (SPE, see Section 4.3.1). All chemicals used (e.g. NH4OH, HCOOH, CH3OH, NaOH, Na2
EDTA) as well as the analytical standards of the pharmaceutical compounds were of analytical grade.
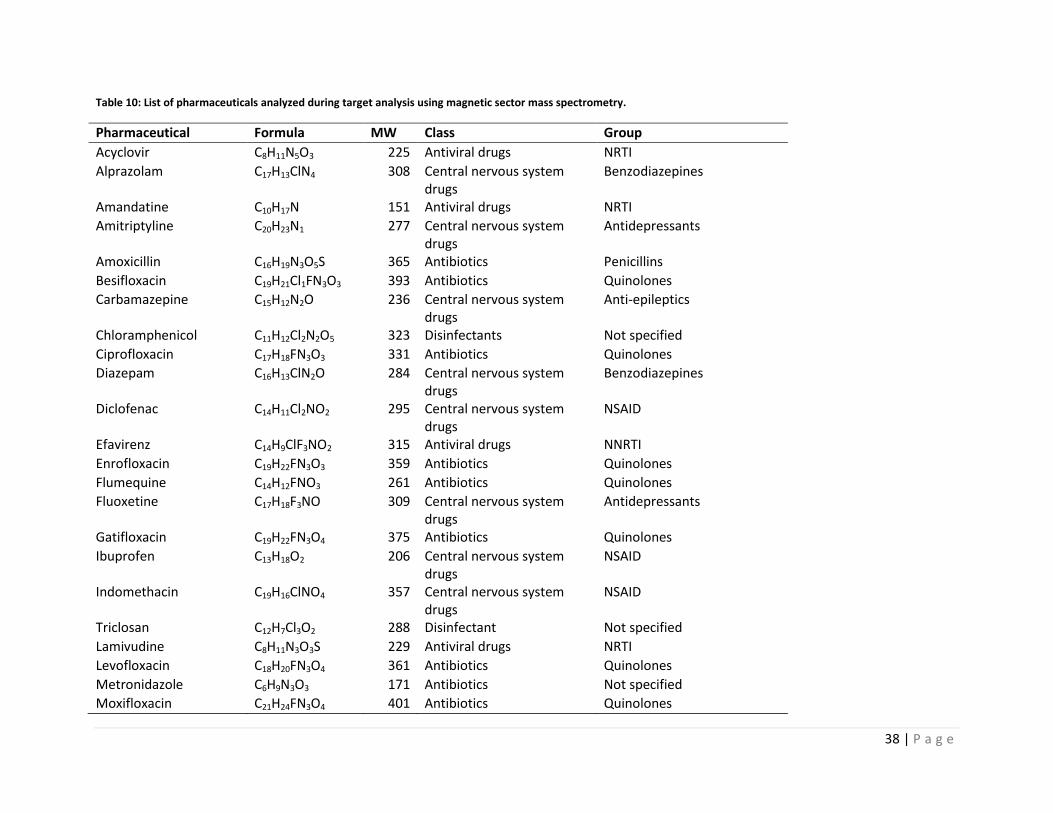
38 | P a g e
Table 10: List of pharmaceuticals analyzed during target analysis using magnetic sector mass spectrometry.
Pharmaceutical Formula MW Class Group
Acyclovir C8H11N5O3 225 Antiviral drugs NRTI
Alprazolam C17H13ClN4 308 Central nervous system drugs
Benzodiazepines
Amandatine C10H17N 151 Antiviral drugs NRTI
Amitriptyline C20H23N1 277 Central nervous system drugs
Antidepressants
Amoxicillin C16H19N3O5S 365 Antibiotics Penicillins
Besifloxacin C19H21Cl1FN3O3 393 Antibiotics Quinolones
Carbamazepine C15H12N2O 236 Central nervous system drugs
Anti-epileptics
Chloramphenicol C11H12Cl2N2O5 323 Disinfectants Not specified
Ciprofloxacin C17H18FN3O3 331 Antibiotics Quinolones
Diazepam C16H13ClN2O 284 Central nervous system drugs
Benzodiazepines
Diclofenac C14H11Cl2NO2 295 Central nervous system drugs
NSAID
Efavirenz C14H9ClF3NO2 315 Antiviral drugs NNRTI
Enrofloxacin C19H22FN3O3 359 Antibiotics Quinolones
Flumequine C14H12FNO3 261 Antibiotics Quinolones
Fluoxetine C17H18F3NO 309 Central nervous system drugs
Antidepressants
Gatifloxacin C19H22FN3O4 375 Antibiotics Quinolones
Ibuprofen C13H18O2 206 Central nervous system drugs
NSAID
Indomethacin C19H16ClNO4 357 Central nervous system drugs
NSAID
Triclosan C12H7Cl3O2 288 Disinfectant Not specified
Lamivudine C8H11N3O3S 229 Antiviral drugs NRTI
Levofloxacin C18H20FN3O4 361 Antibiotics Quinolones
Metronidazole C6H9N3O3 171 Antibiotics Not specified
Moxifloxacin C21H24FN3O4 401 Antibiotics Quinolones
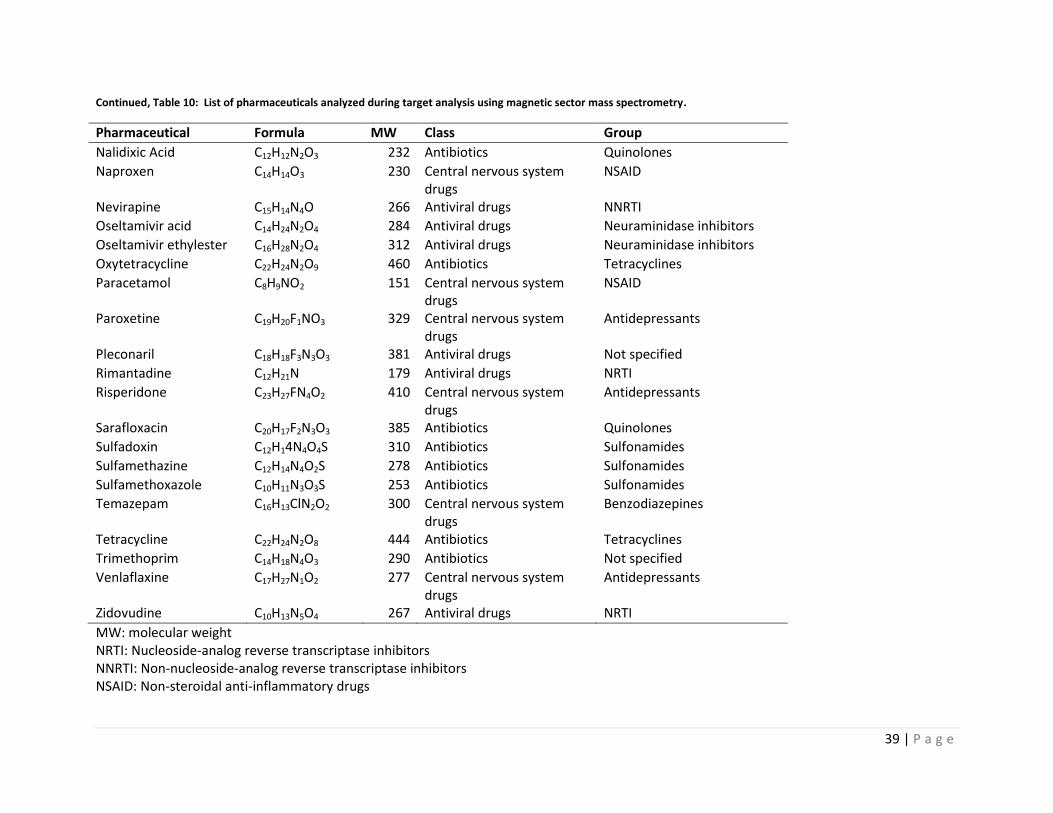
39 | P a g e
Continued, Table 10: List of pharmaceuticals analyzed during target analysis using magnetic sector mass spectrometry.
Pharmaceutical Formula MW Class Group
Nalidixic Acid C12H12N2O3 232 Antibiotics Quinolones
Naproxen C14H14O3 230 Central nervous system drugs
NSAID
Nevirapine C15H14N4O 266 Antiviral drugs NNRTI
Oseltamivir acid C14H24N2O4 284 Antiviral drugs Neuraminidase inhibitors
Oseltamivir ethylester C16H28N2O4 312 Antiviral drugs Neuraminidase inhibitors
Oxytetracycline C22H24N2O9 460 Antibiotics Tetracyclines
Paracetamol C8H9NO2 151 Central nervous system drugs
NSAID
Paroxetine C19H20F1NO3 329 Central nervous system drugs
Antidepressants
Pleconaril C18H18F3N3O3 381 Antiviral drugs Not specified
Rimantadine C12H21N 179 Antiviral drugs NRTI
Risperidone C23H27FN4O2 410 Central nervous system drugs
Antidepressants
Sarafloxacin C20H17F2N3O3 385 Antibiotics Quinolones
Sulfadoxin C12H14N4O4S 310 Antibiotics Sulfonamides
Sulfamethazine C12H14N4O2S 278 Antibiotics Sulfonamides
Sulfamethoxazole C10H11N3O3S 253 Antibiotics Sulfonamides
Temazepam C16H13ClN2O2 300 Central nervous system drugs
Benzodiazepines
Tetracycline C22H24N2O8 444 Antibiotics Tetracyclines
Trimethoprim C14H18N4O3 290 Antibiotics Not specified
Venlaflaxine C17H27N1O2 277 Central nervous system drugs
Antidepressants
Zidovudine C10H13N5O4 267 Antiviral drugs NRTI
MW: molecular weight NRTI: Nucleoside-analog reverse transcriptase inhibitors NNRTI: Non-nucleoside-analog reverse transcriptase inhibitors NSAID: Non-steroidal anti-inflammatory drugs
40 | P a g e
4.3.1 Solid-phase extraction (SPE) Before SPE, 50 mL of biologically treated leachate, leachate ozonated for 60 minutes and 240 minutes was
sampled in glass beakers previously cleaned with 0.1% ammonium hydroxide, 0.1% formic acid water and
methanol in that order. The samples were then filtered through a 1 µm glass fibre filter (Whatman) and
through 0.45 µm nylon membrane filters (Whatman) to remove suspended material. The pH of the
filtrates was then adjusted to 3.0 ± 0.1 using 0.1% formic acid and stored in a freezer at -18°C to prevent
any form of biodegradation taking place.
About 12 hours before doing SPE, the samples were thawed in a fridge. Then, the pH of the samples was
adjusted to 7.0 ± 0.1 using 0.1% formic acid and 5M NaOH. To complex metal species that might be
present in the leachate , 2 mL of a 5% (w/v) Na2 EDTA solution was added.
Sample extraction was done using Hydrophilic-Lipophilic balance cartridges (Oasis HLB, Waters). The HLB
catridges (200 mg of sorbent) were first conditioned using 6 mL of methanol, followed by 6 mL of
deionized water flowing at a rate of 5 mL/min through the cartridge. Next, 50 mL of each neutralized
sample was loaded onto the SPE cartridge and forced through the sorbent material using a IST Vacmaster-
10 set-up (Figure 16). To enhance the chances for desired compounds to be sorbed, the flow was
maintained at about 5 mL/min (dropwise). Sample extraction was then followed by washing with 4 times 6
mL of deionized water to remove unwanted analytes such as humic substances which contributed to the
dark color of both the extract and sorption material. After this washing step, the cartridges were dried for
about 10-15 minutes, and the analytes eluted under vacuum with 5 mL of methanol. The volume of the
eluents was then reduced to 1 mL using nitrogen gas after which the walls of the glass tubes were rinsed
twice: first with 1 mL methanol and a second time with 0.5 mL methanol to ensure that no substances
were adhered to the sides of the glass tube. The eluents were finally evaporated to complete dryness.
Finally, the dried sample was reconstituted with 1 mL H2O/MeOH (90:10) solution, centrifuged to remove
particles formed during drying, and filtered using a syringe filter into a vial awaiting HPLC-MS analysis. For
analysis in electrospray positive mode, 0.1% formic acid was added to the extract.
Figure 16: SPE extraction using the Vacmaster-10 device.
SPE cartridges
Vacmaster-10
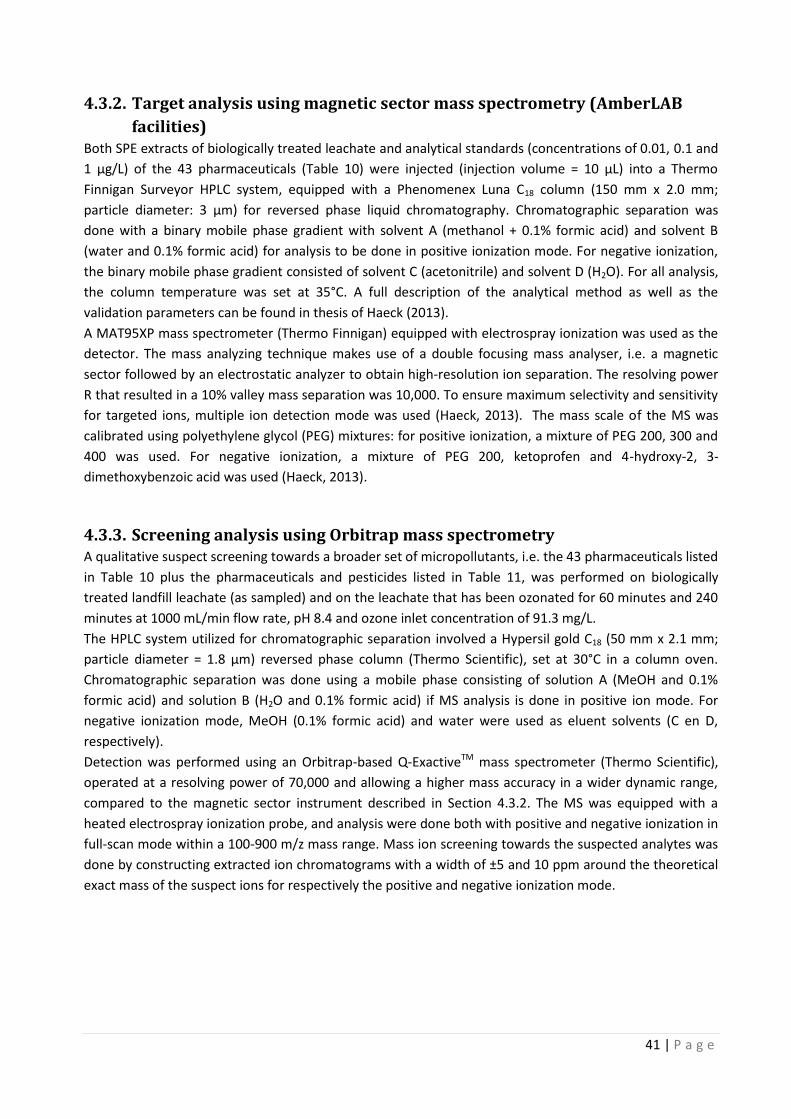
41 | P a g e
4.3.2. Target analysis using magnetic sector mass spectrometry (AmberLAB
facilities) Both SPE extracts of biologically treated leachate and analytical standards (concentrations of 0.01, 0.1 and
1 µg/L) of the 43 pharmaceuticals (Table 10) were injected (injection volume = 10 µL) into a Thermo
Finnigan Surveyor HPLC system, equipped with a Phenomenex Luna C18 column (150 mm x 2.0 mm;
particle diameter: 3 µm) for reversed phase liquid chromatography. Chromatographic separation was
done with a binary mobile phase gradient with solvent A (methanol + 0.1% formic acid) and solvent B
(water and 0.1% formic acid) for analysis to be done in positive ionization mode. For negative ionization,
the binary mobile phase gradient consisted of solvent C (acetonitrile) and solvent D (H2O). For all analysis,
the column temperature was set at 35°C. A full description of the analytical method as well as the
validation parameters can be found in thesis of Haeck (2013).
A MAT95XP mass spectrometer (Thermo Finnigan) equipped with electrospray ionization was used as the
detector. The mass analyzing technique makes use of a double focusing mass analyser, i.e. a magnetic
sector followed by an electrostatic analyzer to obtain high-resolution ion separation. The resolving power
R that resulted in a 10% valley mass separation was 10,000. To ensure maximum selectivity and sensitivity
for targeted ions, multiple ion detection mode was used (Haeck, 2013). The mass scale of the MS was
calibrated using polyethylene glycol (PEG) mixtures: for positive ionization, a mixture of PEG 200, 300 and
400 was used. For negative ionization, a mixture of PEG 200, ketoprofen and 4-hydroxy-2, 3-
dimethoxybenzoic acid was used (Haeck, 2013).
4.3.3. Screening analysis using Orbitrap mass spectrometry A qualitative suspect screening towards a broader set of micropollutants, i.e. the 43 pharmaceuticals listed
in Table 10 plus the pharmaceuticals and pesticides listed in Table 11, was performed on biologically
treated landfill leachate (as sampled) and on the leachate that has been ozonated for 60 minutes and 240
minutes at 1000 mL/min flow rate, pH 8.4 and ozone inlet concentration of 91.3 mg/L.
The HPLC system utilized for chromatographic separation involved a Hypersil gold C18 (50 mm x 2.1 mm;
particle diameter = 1.8 µm) reversed phase column (Thermo Scientific), set at 30°C in a column oven.
Chromatographic separation was done using a mobile phase consisting of solution A (MeOH and 0.1%
formic acid) and solution B (H2O and 0.1% formic acid) if MS analysis is done in positive ion mode. For
negative ionization mode, MeOH (0.1% formic acid) and water were used as eluent solvents (C en D,
respectively).
Detection was performed using an Orbitrap-based Q-ExactiveTM mass spectrometer (Thermo Scientific),
operated at a resolving power of 70,000 and allowing a higher mass accuracy in a wider dynamic range,
compared to the magnetic sector instrument described in Section 4.3.2. The MS was equipped with a
heated electrospray ionization probe, and analysis were done both with positive and negative ionization in
full-scan mode within a 100-900 m/z mass range. Mass ion screening towards the suspected analytes was
done by constructing extracted ion chromatograms with a width of ±5 and 10 ppm around the theoretical
exact mass of the suspect ions for respectively the positive and negative ionization mode.
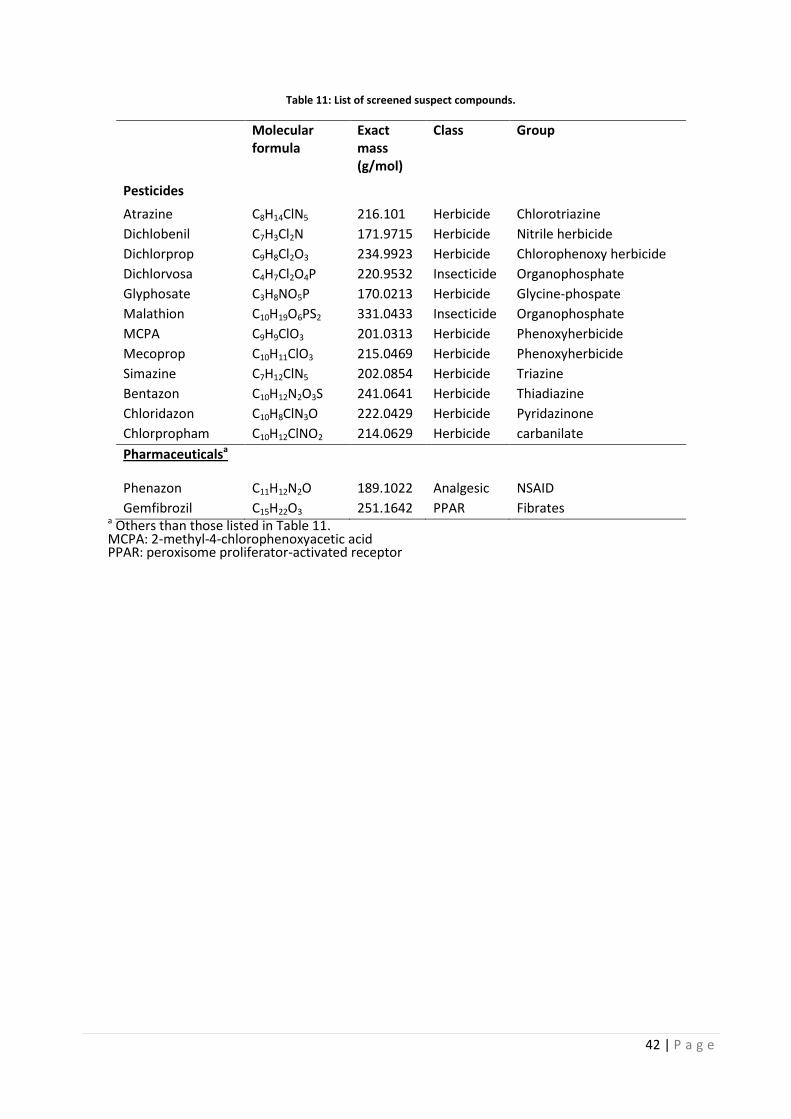
42 | P a g e
Table 11: List of screened suspect compounds.
Molecular formula
Exact mass (g/mol)
Class Group
Pesticides
Atrazine C8H14ClN5 216.101 Herbicide Chlorotriazine
Dichlobenil C7H3Cl2N 171.9715 Herbicide Nitrile herbicide
Dichlorprop C9H8Cl2O3 234.9923 Herbicide Chlorophenoxy herbicide
Dichlorvosa C4H7Cl2O4P 220.9532 Insecticide Organophosphate
Glyphosate C3H8NO5P 170.0213 Herbicide Glycine-phospate
Malathion C10H19O6PS2 331.0433 Insecticide Organophosphate
MCPA C9H9ClO3 201.0313 Herbicide Phenoxyherbicide
Mecoprop C10H11ClO3 215.0469 Herbicide Phenoxyherbicide
Simazine C7H12ClN5 202.0854 Herbicide Triazine
Bentazon C10H12N2O3S 241.0641 Herbicide Thiadiazine
Chloridazon C10H8ClN3O 222.0429 Herbicide Pyridazinone
Chlorpropham C10H12ClNO2 214.0629 Herbicide carbanilate
Pharmaceuticalsa
Phenazon C11H12N2O 189.1022 Analgesic NSAID
Gemfibrozil C15H22O3 251.1642 PPAR Fibrates a Others than those listed in Table 11. MCPA: 2-methyl-4-chlorophenoxyacetic acid PPAR: peroxisome proliferator-activated receptor
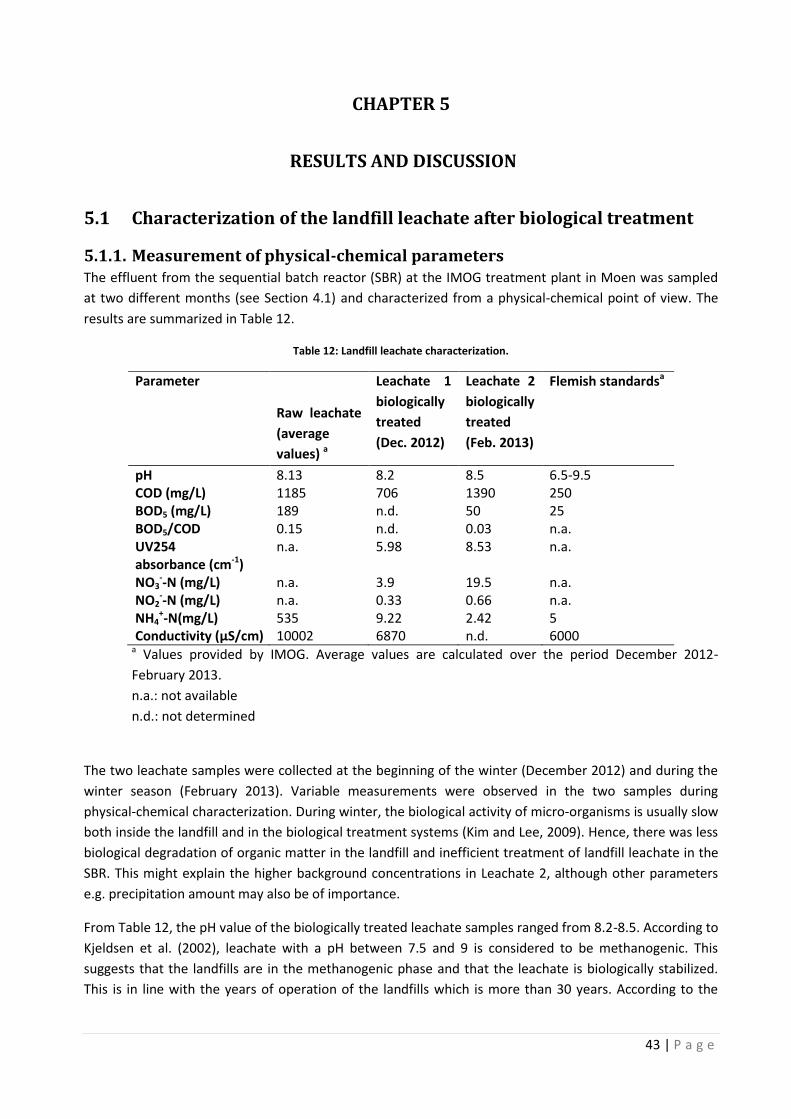
43 | P a g e
CHAPTER 5
RESULTS AND DISCUSSION
5.1 Characterization of the landfill leachate after biological treatment
5.1.1. Measurement of physical-chemical parameters The effluent from the sequential batch reactor (SBR) at the IMOG treatment plant in Moen was sampled
at two different months (see Section 4.1) and characterized from a physical-chemical point of view. The
results are summarized in Table 12.
Table 12: Landfill leachate characterization.
Parameter
Raw leachate
(average
values) a
Leachate 1
biologically
treated
(Dec. 2012)
Leachate 2
biologically
treated
(Feb. 2013)
Flemish standardsa
pH 8.13 8.2 8.5 6.5-9.5 COD (mg/L) 1185 706 1390 250 BOD5 (mg/L) 189 n.d. 50 25 BOD5/COD 0.15 n.d. 0.03 n.a. UV254 absorbance (cm-1)
n.a. 5.98 8.53 n.a.
NO3--N (mg/L) n.a. 3.9 19.5 n.a.
NO2--N (mg/L) n.a. 0.33 0.66 n.a.
NH4+-N(mg/L) 535 9.22 2.42 5
Conductivity (µS/cm) 10002 6870 n.d. 6000 a Values provided by IMOG. Average values are calculated over the period December 2012-
February 2013.
n.a.: not available
n.d.: not determined
The two leachate samples were collected at the beginning of the winter (December 2012) and during the
winter season (February 2013). Variable measurements were observed in the two samples during
physical-chemical characterization. During winter, the biological activity of micro-organisms is usually slow
both inside the landfill and in the biological treatment systems (Kim and Lee, 2009). Hence, there was less
biological degradation of organic matter in the landfill and inefficient treatment of landfill leachate in the
SBR. This might explain the higher background concentrations in Leachate 2, although other parameters
e.g. precipitation amount may also be of importance.
From Table 12, the pH value of the biologically treated leachate samples ranged from 8.2-8.5. According to
Kjeldsen et al. (2002), leachate with a pH between 7.5 and 9 is considered to be methanogenic. This
suggests that the landfills are in the methanogenic phase and that the leachate is biologically stabilized.
This is in line with the years of operation of the landfills which is more than 30 years. According to the
44 | P a g e
Flemish standards for discharge of treated leachate to surface waters (Table 12), the pH was in
conformity.
Compared to the measured COD concentrations (706 – 1390 mg/L), the BOD5 of the leachate was very low
(50 mg/L) but higher than the Flemish legislation standards. Nevertheless, this does not pose a problem
since the effluent from the SBR is post treated using a wetland and an activated carbon filter. This shows
that though the BOD5 of the leachate has been reduced considerably during biological treatment, the non-
biodegradable fraction of COD was still very high. Comparing the COD of the raw leachate (1185 mg/L)
with that of biologically treated leachate clearly shows that low COD removal was achieved after biological
treatment. The biodegradability ratio of the leachate was 0.03, indicating (given it is lower than 0.1) that
the amount of organic matter remaining was recalcitrant in nature, and cannot undergo microbial
oxidation (Rocha et al., 2011; Kjeldsen et al., 2002). UV254 absorbance, a measure of compounds with
double carbon-carbon bonds and aromatic functional groups, was also high in both leachate samples.
Also a high electrical conductivity (6870 µS/cm) was measured. This can be attributed to high
concentrations of chloride ions, metal species, ammonium and sulfate ions which are commonly present
in the landfill leachate (Rocha et al., 2011; Kjeldsen et al., 2002). Quite large differences in ammonium and
nitrate nitrogen in both leachate samples can be observed. Whereas the NH4+-N in December 2012
amounted to 9.22 mg/L, it was about a factor of 4 lower in February 2013. On the other hand, the NO3--N
amount in leachate 1 was 3.9 mg/L and 19.5 mg/L in leachate 2. The differences between the two leachate
samples can be attributed to system inefficiencies during the nitrification and denitrification stages.
5.1.2. Emerging organic micro-pollutants: target analysis of pharmaceutical
residues The presence of pharmaceuticals in the environment is a major environmental concern and achieving ng/L
levels of detection of pharmaceuticals in a complex matrix such as landfill leachate is not an easy task.
Through the method described in Section 4.3.2 of the Materials and Methods, interesting knowledge has
been achieved in the occurrence of multi-class pharmaceuticals in landfill leachate, although it should be
emphasized that it is based on one single analysis; and thus, the results cannot be generalized. More
research in this field is certainly needed. Table 13 shows the pharmaceuticals detected (3 ≤ S/N ratio < 10)
and quantified (S/N ratio ≥ 10) in leachate sample 2.
Table 13: Pharmaceutical compounds detected in biologically treated leachate (sample 2).
pharmaceutical S/N ratio Concentration (ng/L)
Metronidazole 14 121 Sulfamethazine 52 94 Diclofenac 36 48 Moxifloxacin 3 D Paracetamol 3 D Risperidone 3 D Sulfadoxin 4 D Nalidixic acid 3 D Carbamezapine 4 D
S/N: signal-to-noise ratio; D: Detected
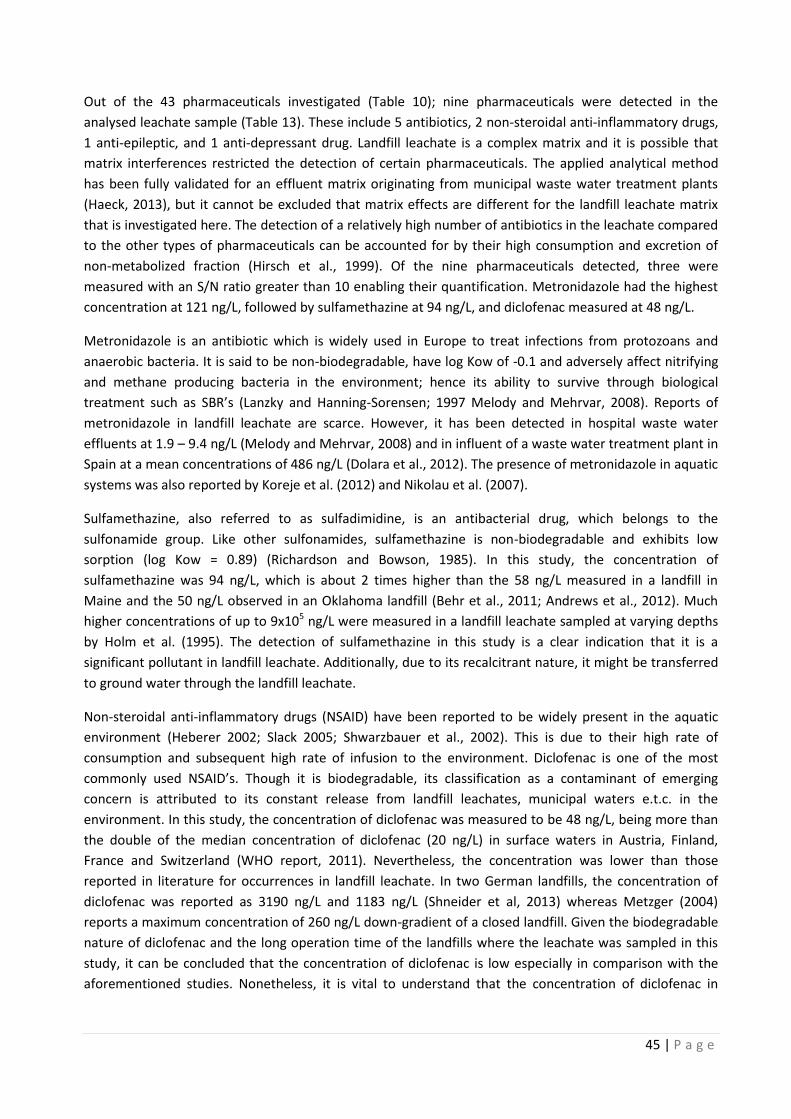
45 | P a g e
Out of the 43 pharmaceuticals investigated (Table 10); nine pharmaceuticals were detected in the
analysed leachate sample (Table 13). These include 5 antibiotics, 2 non-steroidal anti-inflammatory drugs,
1 anti-epileptic, and 1 anti-depressant drug. Landfill leachate is a complex matrix and it is possible that
matrix interferences restricted the detection of certain pharmaceuticals. The applied analytical method
has been fully validated for an effluent matrix originating from municipal waste water treatment plants
(Haeck, 2013), but it cannot be excluded that matrix effects are different for the landfill leachate matrix
that is investigated here. The detection of a relatively high number of antibiotics in the leachate compared
to the other types of pharmaceuticals can be accounted for by their high consumption and excretion of
non-metabolized fraction (Hirsch et al., 1999). Of the nine pharmaceuticals detected, three were
measured with an S/N ratio greater than 10 enabling their quantification. Metronidazole had the highest
concentration at 121 ng/L, followed by sulfamethazine at 94 ng/L, and diclofenac measured at 48 ng/L.
Metronidazole is an antibiotic which is widely used in Europe to treat infections from protozoans and
anaerobic bacteria. It is said to be non-biodegradable, have log Kow of -0.1 and adversely affect nitrifying
and methane producing bacteria in the environment; hence its ability to survive through biological
treatment such as SBR’s (Lanzky and Hanning-Sorensen; 1997 Melody and Mehrvar, 2008). Reports of
metronidazole in landfill leachate are scarce. However, it has been detected in hospital waste water
effluents at 1.9 – 9.4 ng/L (Melody and Mehrvar, 2008) and in influent of a waste water treatment plant in
Spain at a mean concentrations of 486 ng/L (Dolara et al., 2012). The presence of metronidazole in aquatic
systems was also reported by Koreje et al. (2012) and Nikolau et al. (2007).
Sulfamethazine, also referred to as sulfadimidine, is an antibacterial drug, which belongs to the
sulfonamide group. Like other sulfonamides, sulfamethazine is non-biodegradable and exhibits low
sorption (log Kow = 0.89) (Richardson and Bowson, 1985). In this study, the concentration of
sulfamethazine was 94 ng/L, which is about 2 times higher than the 58 ng/L measured in a landfill in
Maine and the 50 ng/L observed in an Oklahoma landfill (Behr et al., 2011; Andrews et al., 2012). Much
higher concentrations of up to 9x10⁵ ng/L were measured in a landfill leachate sampled at varying depths
by Holm et al. (1995). The detection of sulfamethazine in this study is a clear indication that it is a
significant pollutant in landfill leachate. Additionally, due to its recalcitrant nature, it might be transferred
to ground water through the landfill leachate.
Non-steroidal anti-inflammatory drugs (NSAID) have been reported to be widely present in the aquatic
environment (Heberer 2002; Slack 2005; Shwarzbauer et al., 2002). This is due to their high rate of
consumption and subsequent high rate of infusion to the environment. Diclofenac is one of the most
commonly used NSAID’s. Though it is biodegradable, its classification as a contaminant of emerging
concern is attributed to its constant release from landfill leachates, municipal waters e.t.c. in the
environment. In this study, the concentration of diclofenac was measured to be 48 ng/L, being more than
the double of the median concentration of diclofenac (20 ng/L) in surface waters in Austria, Finland,
France and Switzerland (WHO report, 2011). Nevertheless, the concentration was lower than those
reported in literature for occurrences in landfill leachate. In two German landfills, the concentration of
diclofenac was reported as 3190 ng/L and 1183 ng/L (Shneider et al, 2013) whereas Metzger (2004)
reports a maximum concentration of 260 ng/L down-gradient of a closed landfill. Given the biodegradable
nature of diclofenac and the long operation time of the landfills where the leachate was sampled in this
study, it can be concluded that the concentration of diclofenac is low especially in comparison with the
aforementioned studies. Nonetheless, it is vital to understand that the concentration of diclofenac in
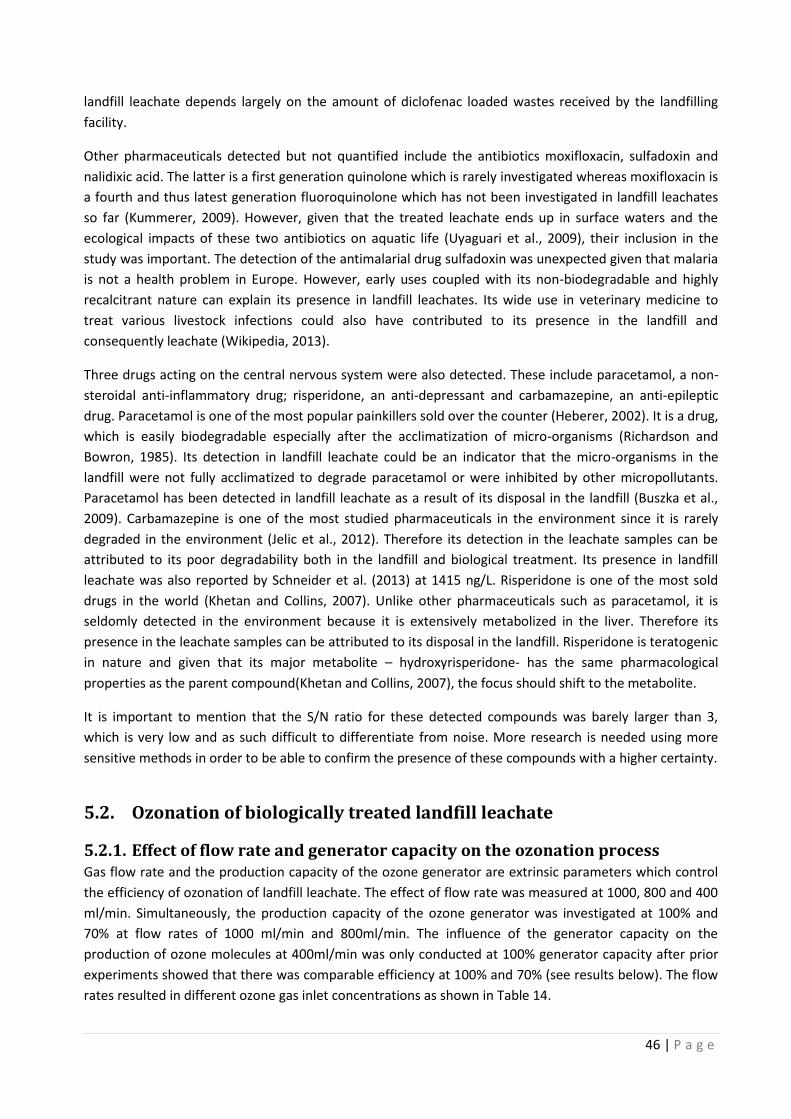
46 | P a g e
landfill leachate depends largely on the amount of diclofenac loaded wastes received by the landfilling
facility.
Other pharmaceuticals detected but not quantified include the antibiotics moxifloxacin, sulfadoxin and
nalidixic acid. The latter is a first generation quinolone which is rarely investigated whereas moxifloxacin is
a fourth and thus latest generation fluoroquinolone which has not been investigated in landfill leachates
so far (Kummerer, 2009). However, given that the treated leachate ends up in surface waters and the
ecological impacts of these two antibiotics on aquatic life (Uyaguari et al., 2009), their inclusion in the
study was important. The detection of the antimalarial drug sulfadoxin was unexpected given that malaria
is not a health problem in Europe. However, early uses coupled with its non-biodegradable and highly
recalcitrant nature can explain its presence in landfill leachates. Its wide use in veterinary medicine to
treat various livestock infections could also have contributed to its presence in the landfill and
consequently leachate (Wikipedia, 2013).
Three drugs acting on the central nervous system were also detected. These include paracetamol, a non-
steroidal anti-inflammatory drug; risperidone, an anti-depressant and carbamazepine, an anti-epileptic
drug. Paracetamol is one of the most popular painkillers sold over the counter (Heberer, 2002). It is a drug,
which is easily biodegradable especially after the acclimatization of micro-organisms (Richardson and
Bowron, 1985). Its detection in landfill leachate could be an indicator that the micro-organisms in the
landfill were not fully acclimatized to degrade paracetamol or were inhibited by other micropollutants.
Paracetamol has been detected in landfill leachate as a result of its disposal in the landfill (Buszka et al.,
2009). Carbamazepine is one of the most studied pharmaceuticals in the environment since it is rarely
degraded in the environment (Jelic et al., 2012). Therefore its detection in the leachate samples can be
attributed to its poor degradability both in the landfill and biological treatment. Its presence in landfill
leachate was also reported by Schneider et al. (2013) at 1415 ng/L. Risperidone is one of the most sold
drugs in the world (Khetan and Collins, 2007). Unlike other pharmaceuticals such as paracetamol, it is
seldomly detected in the environment because it is extensively metabolized in the liver. Therefore its
presence in the leachate samples can be attributed to its disposal in the landfill. Risperidone is teratogenic
in nature and given that its major metabolite – hydroxyrisperidone- has the same pharmacological
properties as the parent compound(Khetan and Collins, 2007), the focus should shift to the metabolite.
It is important to mention that the S/N ratio for these detected compounds was barely larger than 3,
which is very low and as such difficult to differentiate from noise. More research is needed using more
sensitive methods in order to be able to confirm the presence of these compounds with a higher certainty.
5.2. Ozonation of biologically treated landfill leachate
5.2.1. Effect of flow rate and generator capacity on the ozonation process Gas flow rate and the production capacity of the ozone generator are extrinsic parameters which control
the efficiency of ozonation of landfill leachate. The effect of flow rate was measured at 1000, 800 and 400
ml/min. Simultaneously, the production capacity of the ozone generator was investigated at 100% and
70% at flow rates of 1000 ml/min and 800ml/min. The influence of the generator capacity on the
production of ozone molecules at 400ml/min was only conducted at 100% generator capacity after prior
experiments showed that there was comparable efficiency at 100% and 70% (see results below). The flow
rates resulted in different ozone gas inlet concentrations as shown in Table 14.
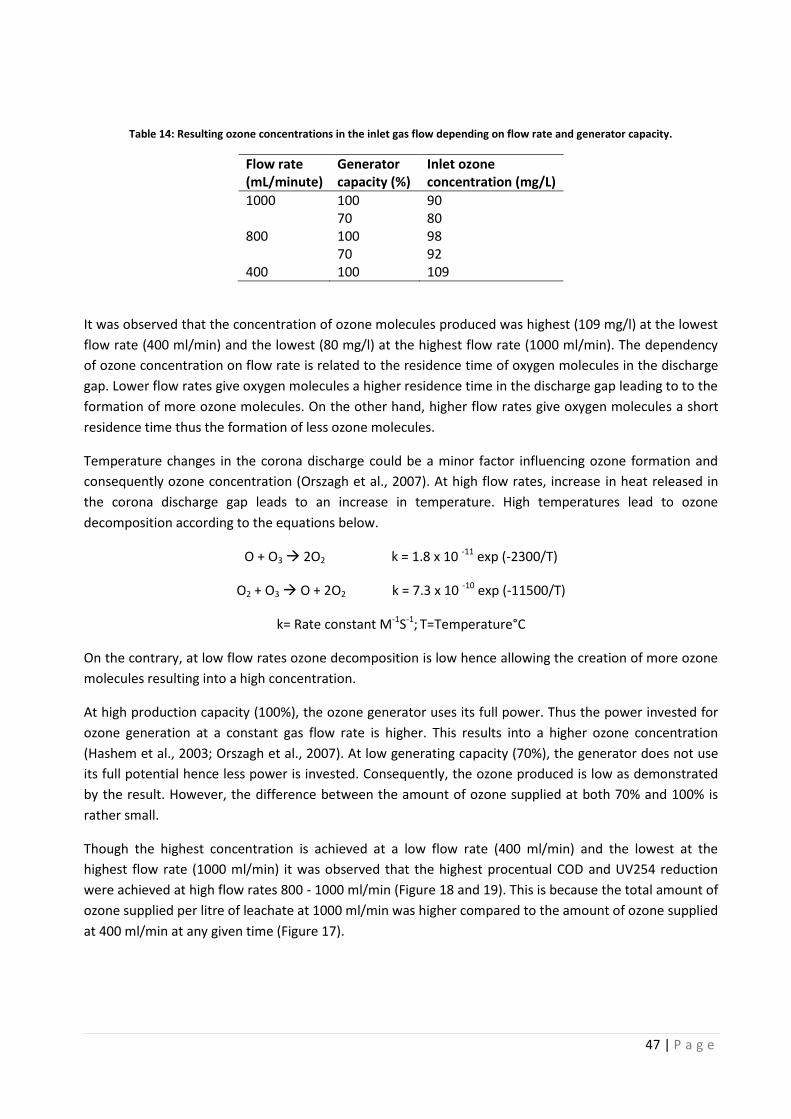
47 | P a g e
Table 14: Resulting ozone concentrations in the inlet gas flow depending on flow rate and generator capacity.
Flow rate (mL/minute)
Generator capacity (%)
Inlet ozone concentration (mg/L)
1000
100 90 70 80
800
100 98 70 92
400 100 109
It was observed that the concentration of ozone molecules produced was highest (109 mg/l) at the lowest
flow rate (400 ml/min) and the lowest (80 mg/l) at the highest flow rate (1000 ml/min). The dependency
of ozone concentration on flow rate is related to the residence time of oxygen molecules in the discharge
gap. Lower flow rates give oxygen molecules a higher residence time in the discharge gap leading to to the
formation of more ozone molecules. On the other hand, higher flow rates give oxygen molecules a short
residence time thus the formation of less ozone molecules.
Temperature changes in the corona discharge could be a minor factor influencing ozone formation and
consequently ozone concentration (Orszagh et al., 2007). At high flow rates, increase in heat released in
the corona discharge gap leads to an increase in temperature. High temperatures lead to ozone
decomposition according to the equations below.
O + O3 2O2 k = 1.8 x 10 -11 exp (-2300/T)
O2 + O3 O + 2O2 k = 7.3 x 10 -10 exp (-11500/T)
k= Rate constant M-1S-1; T=Temperature°C
On the contrary, at low flow rates ozone decomposition is low hence allowing the creation of more ozone
molecules resulting into a high concentration.
At high production capacity (100%), the ozone generator uses its full power. Thus the power invested for
ozone generation at a constant gas flow rate is higher. This results into a higher ozone concentration
(Hashem et al., 2003; Orszagh et al., 2007). At low generating capacity (70%), the generator does not use
its full potential hence less power is invested. Consequently, the ozone produced is low as demonstrated
by the result. However, the difference between the amount of ozone supplied at both 70% and 100% is
rather small.
Though the highest concentration is achieved at a low flow rate (400 ml/min) and the lowest at the
highest flow rate (1000 ml/min) it was observed that the highest procentual COD and UV254 reduction
were achieved at high flow rates 800 - 1000 ml/min (Figure 18 and 19). This is because the total amount of
ozone supplied per litre of leachate at 1000 ml/min was higher compared to the amount of ozone supplied
at 400 ml/min at any given time (Figure 17).
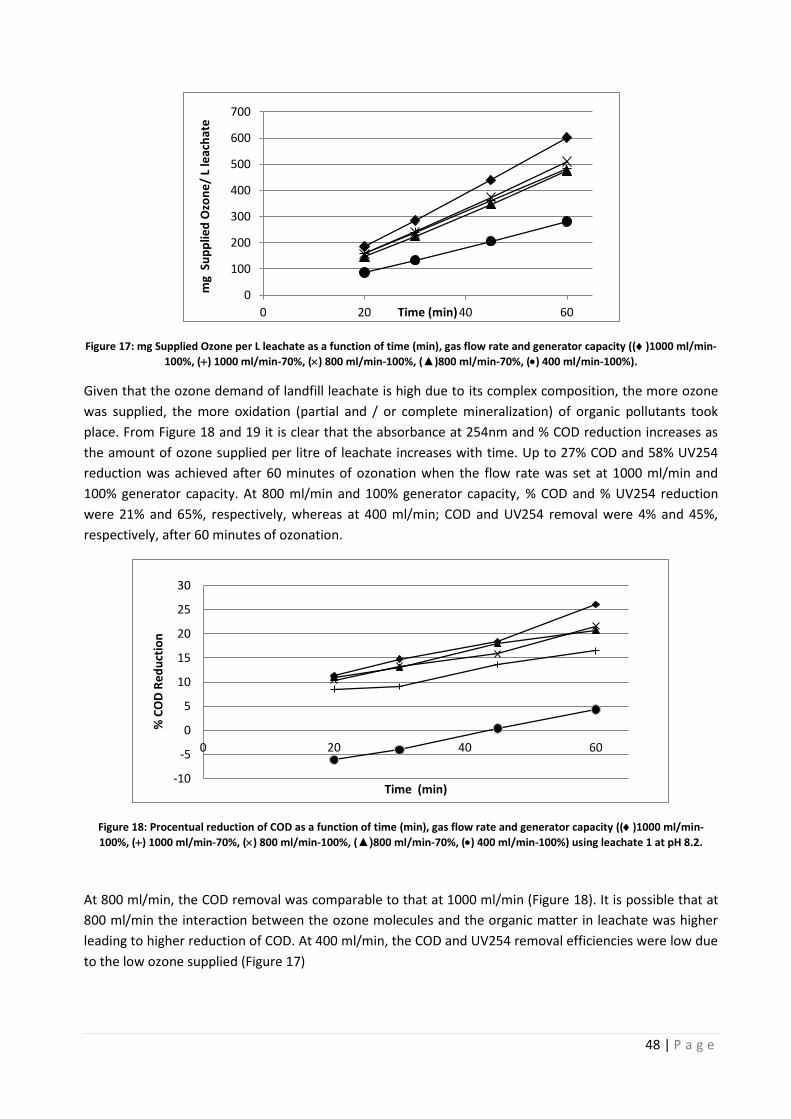
48 | P a g e
Figure 17: mg Supplied Ozone per L leachate as a function of time (min), gas flow rate and generator capacity (()1000 ml/min-
100%, () 1000 ml/min-70%, () 800 ml/min-100%, (▲)800 ml/min-70%, () 400 ml/min-100%).
Given that the ozone demand of landfill leachate is high due to its complex composition, the more ozone
was supplied, the more oxidation (partial and / or complete mineralization) of organic pollutants took
place. From Figure 18 and 19 it is clear that the absorbance at 254nm and % COD reduction increases as
the amount of ozone supplied per litre of leachate increases with time. Up to 27% COD and 58% UV254
reduction was achieved after 60 minutes of ozonation when the flow rate was set at 1000 ml/min and
100% generator capacity. At 800 ml/min and 100% generator capacity, % COD and % UV254 reduction
were 21% and 65%, respectively, whereas at 400 ml/min; COD and UV254 removal were 4% and 45%,
respectively, after 60 minutes of ozonation.
Figure 18: Procentual reduction of COD as a function of time (min), gas flow rate and generator capacity (()1000 ml/min-
100%, () 1000 ml/min-70%, () 800 ml/min-100%, (▲)800 ml/min-70%, () 400 ml/min-100%) using leachate 1 at pH 8.2.
At 800 ml/min, the COD removal was comparable to that at 1000 ml/min (Figure 18). It is possible that at
800 ml/min the interaction between the ozone molecules and the organic matter in leachate was higher
leading to higher reduction of COD. At 400 ml/min, the COD and UV254 removal efficiencies were low due
to the low ozone supplied (Figure 17)
0
100
200
300
400
500
600
700
0 20 40 60
mg
Su
pp
lied
Ozo
ne
/ L
leac
hat
e
Time (min)
-10
-5
0
5
10
15
20
25
30
0 20 40 60
% C
OD
Re
du
ctio
n
Time (min)
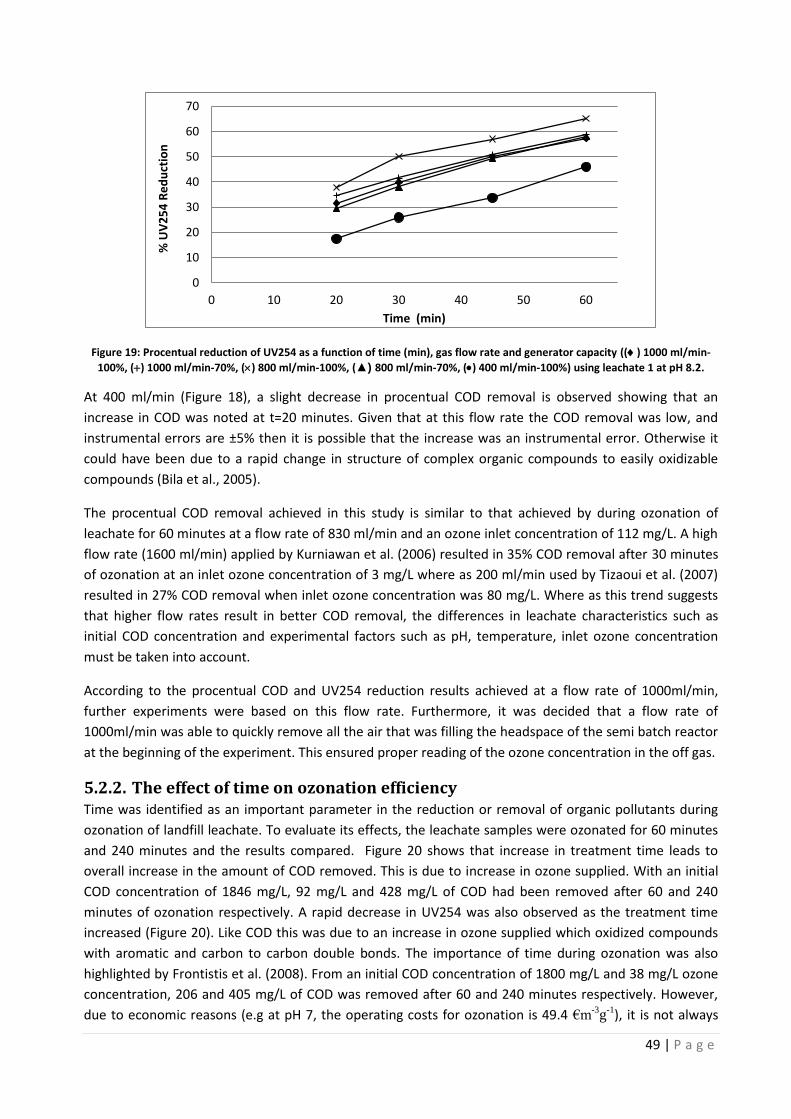
49 | P a g e
Figure 19: Procentual reduction of UV254 as a function of time (min), gas flow rate and generator capacity (() 1000 ml/min-
100%, () 1000 ml/min-70%, () 800 ml/min-100%, (▲) 800 ml/min-70%, () 400 ml/min-100%) using leachate 1 at pH 8.2.
At 400 ml/min (Figure 18), a slight decrease in procentual COD removal is observed showing that an
increase in COD was noted at t=20 minutes. Given that at this flow rate the COD removal was low, and
instrumental errors are ±5% then it is possible that the increase was an instrumental error. Otherwise it
could have been due to a rapid change in structure of complex organic compounds to easily oxidizable
compounds (Bila et al., 2005).
The procentual COD removal achieved in this study is similar to that achieved by during ozonation of
leachate for 60 minutes at a flow rate of 830 ml/min and an ozone inlet concentration of 112 mg/L. A high
flow rate (1600 ml/min) applied by Kurniawan et al. (2006) resulted in 35% COD removal after 30 minutes
of ozonation at an inlet ozone concentration of 3 mg/L where as 200 ml/min used by Tizaoui et al. (2007)
resulted in 27% COD removal when inlet ozone concentration was 80 mg/L. Where as this trend suggests
that higher flow rates result in better COD removal, the differences in leachate characteristics such as
initial COD concentration and experimental factors such as pH, temperature, inlet ozone concentration
must be taken into account.
According to the procentual COD and UV254 reduction results achieved at a flow rate of 1000ml/min,
further experiments were based on this flow rate. Furthermore, it was decided that a flow rate of
1000ml/min was able to quickly remove all the air that was filling the headspace of the semi batch reactor
at the beginning of the experiment. This ensured proper reading of the ozone concentration in the off gas.
5.2.2. The effect of time on ozonation efficiency Time was identified as an important parameter in the reduction or removal of organic pollutants during
ozonation of landfill leachate. To evaluate its effects, the leachate samples were ozonated for 60 minutes
and 240 minutes and the results compared. Figure 20 shows that increase in treatment time leads to
overall increase in the amount of COD removed. This is due to increase in ozone supplied. With an initial
COD concentration of 1846 mg/L, 92 mg/L and 428 mg/L of COD had been removed after 60 and 240
minutes of ozonation respectively. A rapid decrease in UV254 was also observed as the treatment time
increased (Figure 20). Like COD this was due to an increase in ozone supplied which oxidized compounds
with aromatic and carbon to carbon double bonds. The importance of time during ozonation was also
highlighted by Frontistis et al. (2008). From an initial COD concentration of 1800 mg/L and 38 mg/L ozone
concentration, 206 and 405 mg/L of COD was removed after 60 and 240 minutes respectively. However,
due to economic reasons (e.g at pH 7, the operating costs for ozonation is 49.4 €m-3g
-1), it is not always
0
10
20
30
40
50
60
70
0 10 20 30 40 50 60
% U
V2
54
Re
du
ctio
n
Time (min)
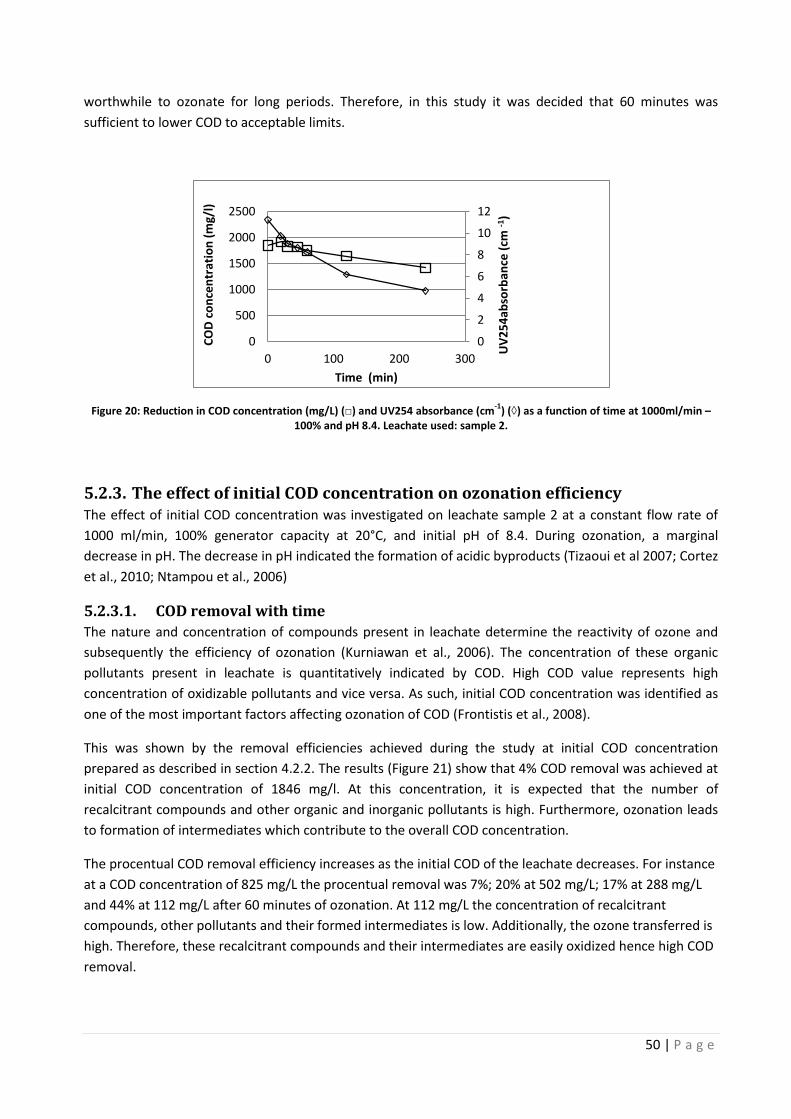
50 | P a g e
worthwhile to ozonate for long periods. Therefore, in this study it was decided that 60 minutes was
sufficient to lower COD to acceptable limits.
Figure 20: Reduction in COD concentration (mg/L) (□) and UV254 absorbance (cm-1
) (◊) as a function of time at 1000ml/min – 100% and pH 8.4. Leachate used: sample 2.
5.2.3. The effect of initial COD concentration on ozonation efficiency The effect of initial COD concentration was investigated on leachate sample 2 at a constant flow rate of
1000 ml/min, 100% generator capacity at 20°C, and initial pH of 8.4. During ozonation, a marginal
decrease in pH. The decrease in pH indicated the formation of acidic byproducts (Tizaoui et al 2007; Cortez
et al., 2010; Ntampou et al., 2006)
5.2.3.1. COD removal with time
The nature and concentration of compounds present in leachate determine the reactivity of ozone and
subsequently the efficiency of ozonation (Kurniawan et al., 2006). The concentration of these organic
pollutants present in leachate is quantitatively indicated by COD. High COD value represents high
concentration of oxidizable pollutants and vice versa. As such, initial COD concentration was identified as
one of the most important factors affecting ozonation of COD (Frontistis et al., 2008).
This was shown by the removal efficiencies achieved during the study at initial COD concentration
prepared as described in section 4.2.2. The results (Figure 21) show that 4% COD removal was achieved at
initial COD concentration of 1846 mg/l. At this concentration, it is expected that the number of
recalcitrant compounds and other organic and inorganic pollutants is high. Furthermore, ozonation leads
to formation of intermediates which contribute to the overall COD concentration.
The procentual COD removal efficiency increases as the initial COD of the leachate decreases. For instance
at a COD concentration of 825 mg/L the procentual removal was 7%; 20% at 502 mg/L; 17% at 288 mg/L
and 44% at 112 mg/L after 60 minutes of ozonation. At 112 mg/L the concentration of recalcitrant
compounds, other pollutants and their formed intermediates is low. Additionally, the ozone transferred is
high. Therefore, these recalcitrant compounds and their intermediates are easily oxidized hence high COD
removal.
0
2
4
6
8
10
12
0
500
1000
1500
2000
2500
0 100 200 300
UV
25
4ab
sorb
ance
(cm
-1)
CO
D c
on
cen
trat
ion
(m
g/l)
Time (min)
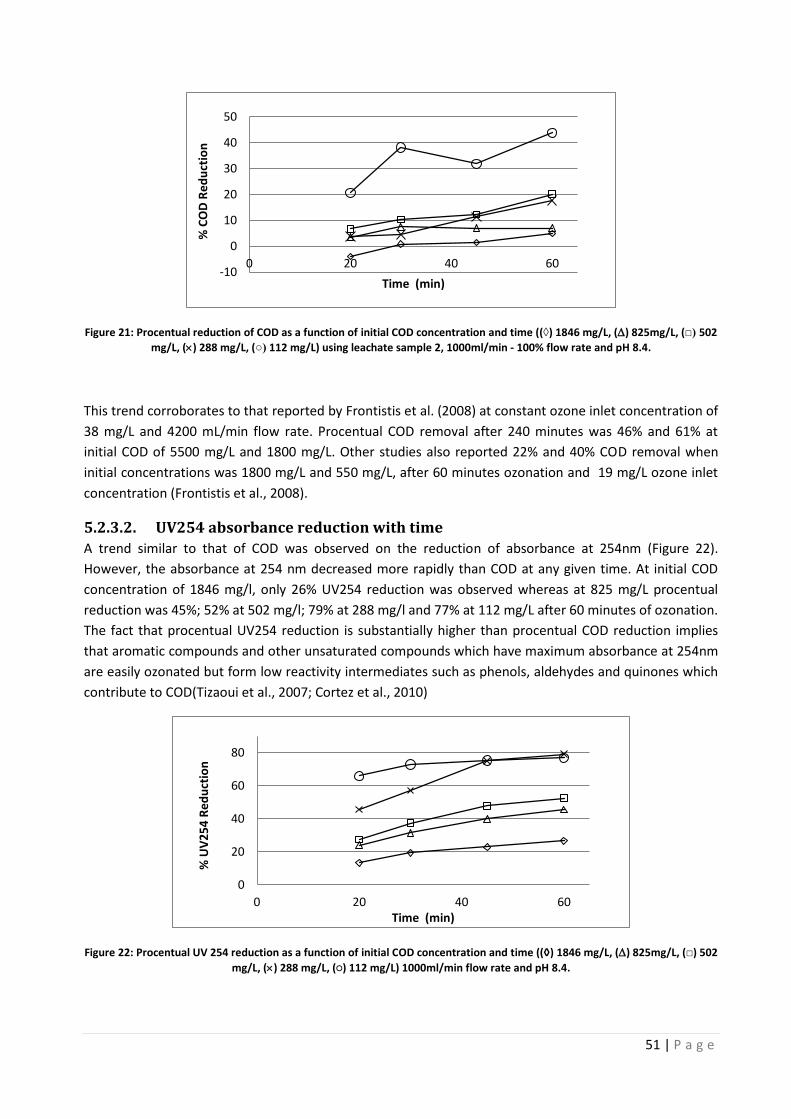
51 | P a g e
Figure 21: Procentual reduction of COD as a function of initial COD concentration and time ((◊) 1846 mg/L, () 825mg/L, (□) 502
mg/L, () 288 mg/L, (○) 112 mg/L) using leachate sample 2, 1000ml/min - 100% flow rate and pH 8.4.
This trend corroborates to that reported by Frontistis et al. (2008) at constant ozone inlet concentration of
38 mg/L and 4200 mL/min flow rate. Procentual COD removal after 240 minutes was 46% and 61% at
initial COD of 5500 mg/L and 1800 mg/L. Other studies also reported 22% and 40% COD removal when
initial concentrations was 1800 mg/L and 550 mg/L, after 60 minutes ozonation and 19 mg/L ozone inlet
concentration (Frontistis et al., 2008).
5.2.3.2. UV254 absorbance reduction with time
A trend similar to that of COD was observed on the reduction of absorbance at 254nm (Figure 22).
However, the absorbance at 254 nm decreased more rapidly than COD at any given time. At initial COD
concentration of 1846 mg/l, only 26% UV254 reduction was observed whereas at 825 mg/L procentual
reduction was 45%; 52% at 502 mg/l; 79% at 288 mg/l and 77% at 112 mg/L after 60 minutes of ozonation.
The fact that procentual UV254 reduction is substantially higher than procentual COD reduction implies
that aromatic compounds and other unsaturated compounds which have maximum absorbance at 254nm
are easily ozonated but form low reactivity intermediates such as phenols, aldehydes and quinones which
contribute to COD(Tizaoui et al., 2007; Cortez et al., 2010)
Figure 22: Procentual UV 254 reduction as a function of initial COD concentration and time ((◊) 1846 mg/L, () 825mg/L, (□) 502
mg/L, () 288 mg/L, (○) 112 mg/L) 1000ml/min flow rate and pH 8.4.
-10
0
10
20
30
40
50
0 20 40 60
% C
OD
Re
du
ctio
n
Time (min)
0
20
40
60
80
0 20 40 60
% U
V2
54
Re
du
ctio
n
Time (min)
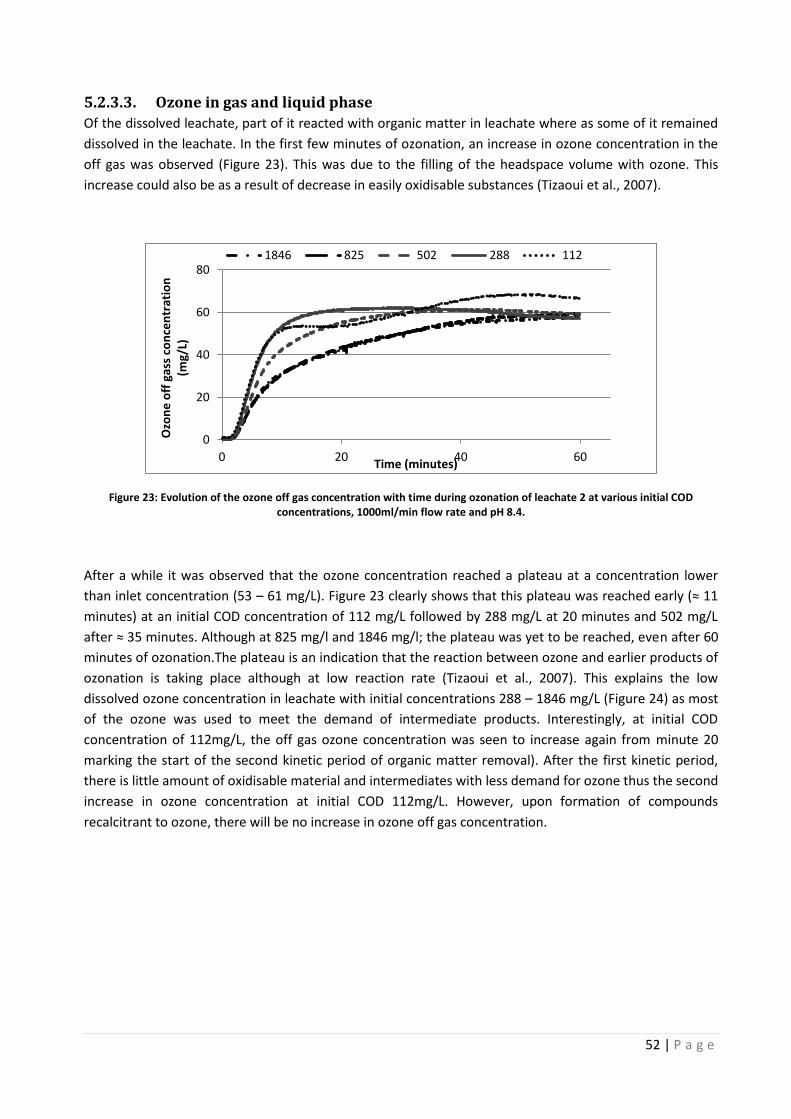
52 | P a g e
5.2.3.3. Ozone in gas and liquid phase
Of the dissolved leachate, part of it reacted with organic matter in leachate where as some of it remained
dissolved in the leachate. In the first few minutes of ozonation, an increase in ozone concentration in the
off gas was observed (Figure 23). This was due to the filling of the headspace volume with ozone. This
increase could also be as a result of decrease in easily oxidisable substances (Tizaoui et al., 2007).
Figure 23: Evolution of the ozone off gas concentration with time during ozonation of leachate 2 at various initial COD concentrations, 1000ml/min flow rate and pH 8.4.
After a while it was observed that the ozone concentration reached a plateau at a concentration lower
than inlet concentration (53 – 61 mg/L). Figure 23 clearly shows that this plateau was reached early (≈ 11
minutes) at an initial COD concentration of 112 mg/L followed by 288 mg/L at 20 minutes and 502 mg/L
after ≈ 35 minutes. Although at 825 mg/l and 1846 mg/l; the plateau was yet to be reached, even after 60
minutes of ozonation.The plateau is an indication that the reaction between ozone and earlier products of
ozonation is taking place although at low reaction rate (Tizaoui et al., 2007). This explains the low
dissolved ozone concentration in leachate with initial concentrations 288 – 1846 mg/L (Figure 24) as most
of the ozone was used to meet the demand of intermediate products. Interestingly, at initial COD
concentration of 112mg/L, the off gas ozone concentration was seen to increase again from minute 20
marking the start of the second kinetic period of organic matter removal). After the first kinetic period,
there is little amount of oxidisable material and intermediates with less demand for ozone thus the second
increase in ozone concentration at initial COD 112mg/L. However, upon formation of compounds
recalcitrant to ozone, there will be no increase in ozone off gas concentration.
0
20
40
60
80
0 20 40 60
Ozo
ne
off
gas
s co
nce
ntr
atio
n
(mg/
L)
Time (minutes)
1846 825 502 288 112
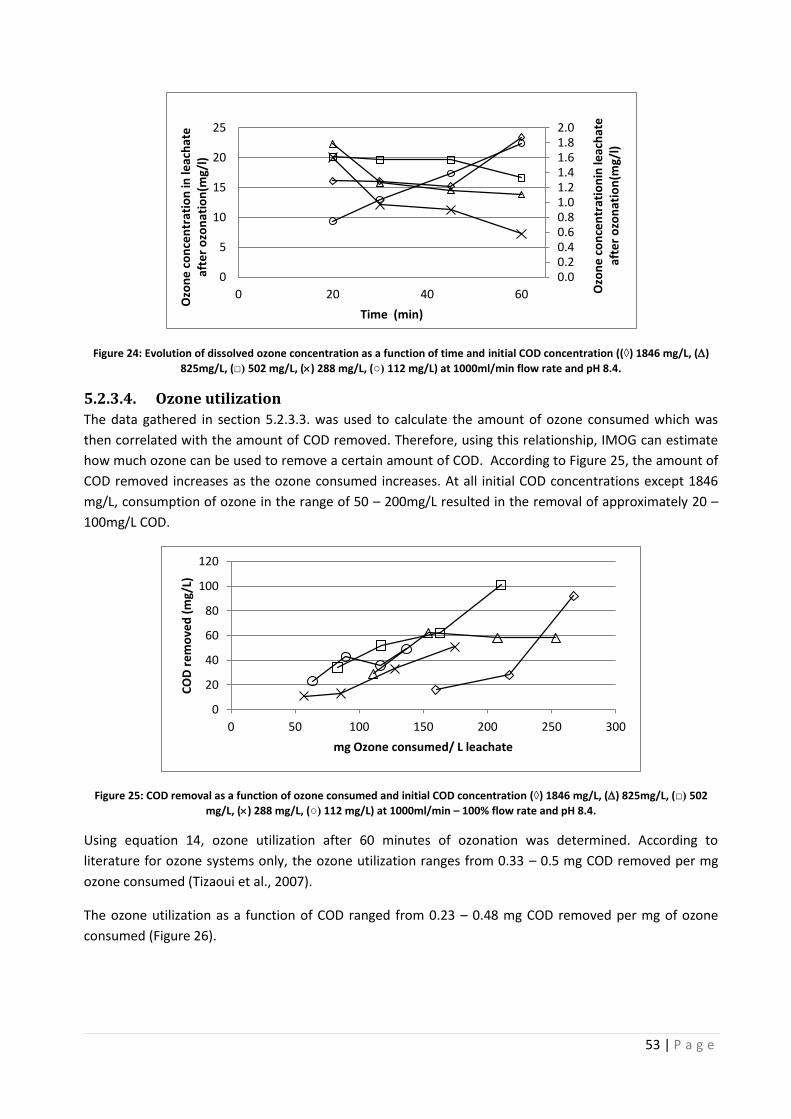
53 | P a g e
Figure 24: Evolution of dissolved ozone concentration as a function of time and initial COD concentration ((◊) 1846 mg/L, ()
825mg/L, (□) 502 mg/L, () 288 mg/L, (○) 112 mg/L) at 1000ml/min flow rate and pH 8.4.
5.2.3.4. Ozone utilization
The data gathered in section 5.2.3.3. was used to calculate the amount of ozone consumed which was
then correlated with the amount of COD removed. Therefore, using this relationship, IMOG can estimate
how much ozone can be used to remove a certain amount of COD. According to Figure 25, the amount of
COD removed increases as the ozone consumed increases. At all initial COD concentrations except 1846
mg/L, consumption of ozone in the range of 50 – 200mg/L resulted in the removal of approximately 20 –
100mg/L COD.
Figure 25: COD removal as a function of ozone consumed and initial COD concentration (◊) 1846 mg/L, () 825mg/L, (□) 502
mg/L, () 288 mg/L, (○) 112 mg/L) at 1000ml/min – 100% flow rate and pH 8.4.
Using equation 14, ozone utilization after 60 minutes of ozonation was determined. According to
literature for ozone systems only, the ozone utilization ranges from 0.33 – 0.5 mg COD removed per mg
ozone consumed (Tizaoui et al., 2007).
The ozone utilization as a function of COD ranged from 0.23 – 0.48 mg COD removed per mg of ozone
consumed (Figure 26).
0.0 0.2 0.4 0.6 0.8 1.0 1.2 1.4 1.6 1.8 2.0
0
5
10
15
20
25
0 20 40 60 Ozo
ne
co
nce
ntr
atio
nin
leac
hat
e
afte
r o
zon
atio
n(m
g/l)
Ozo
ne
co
nce
ntr
atio
n in
leac
hat
e
afte
r o
zon
atio
n(m
g/l)
Time (min)
0
20
40
60
80
100
120
0 50 100 150 200 250 300
CO
D r
em
ove
d (
mg/
L)
mg Ozone consumed/ L leachate
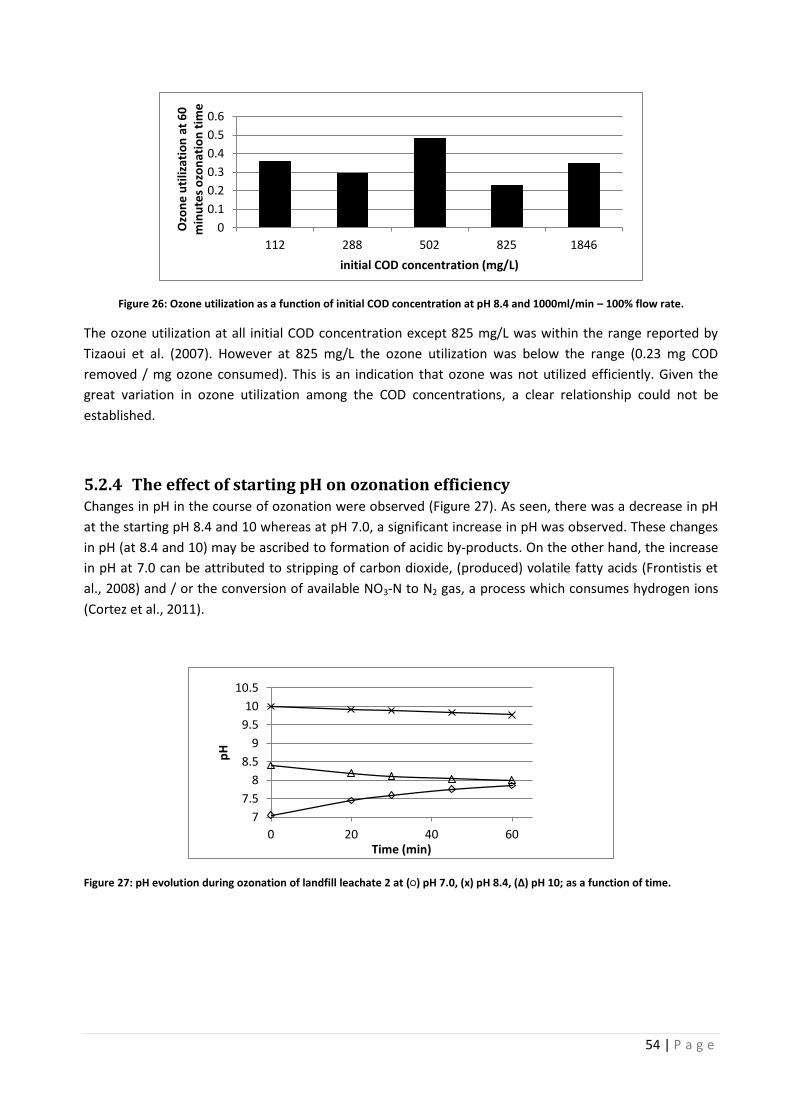
54 | P a g e
Figure 26: Ozone utilization as a function of initial COD concentration at pH 8.4 and 1000ml/min – 100% flow rate.
The ozone utilization at all initial COD concentration except 825 mg/L was within the range reported by
Tizaoui et al. (2007). However at 825 mg/L the ozone utilization was below the range (0.23 mg COD
removed / mg ozone consumed). This is an indication that ozone was not utilized efficiently. Given the
great variation in ozone utilization among the COD concentrations, a clear relationship could not be
established.
5.2.4 The effect of starting pH on ozonation efficiency Changes in pH in the course of ozonation were observed (Figure 27). As seen, there was a decrease in pH
at the starting pH 8.4 and 10 whereas at pH 7.0, a significant increase in pH was observed. These changes
in pH (at 8.4 and 10) may be ascribed to formation of acidic by-products. On the other hand, the increase
in pH at 7.0 can be attributed to stripping of carbon dioxide, (produced) volatile fatty acids (Frontistis et
al., 2008) and / or the conversion of available NO3-N to N2 gas, a process which consumes hydrogen ions
(Cortez et al., 2011).
Figure 27: pH evolution during ozonation of landfill leachate 2 at (○) pH 7.0, (x) pH 8.4, (∆) pH 10; as a function of time.
0
0.1
0.2
0.3
0.4
0.5
0.6
112 288 502 825 1846
Ozo
ne
uti
lizat
ion
at
60
m
inu
tes
ozo
nat
ion
tim
e
initial COD concentration (mg/L)
7
7.5
8
8.5
9
9.5
10
10.5
0 20 40 60
pH
Time (min)
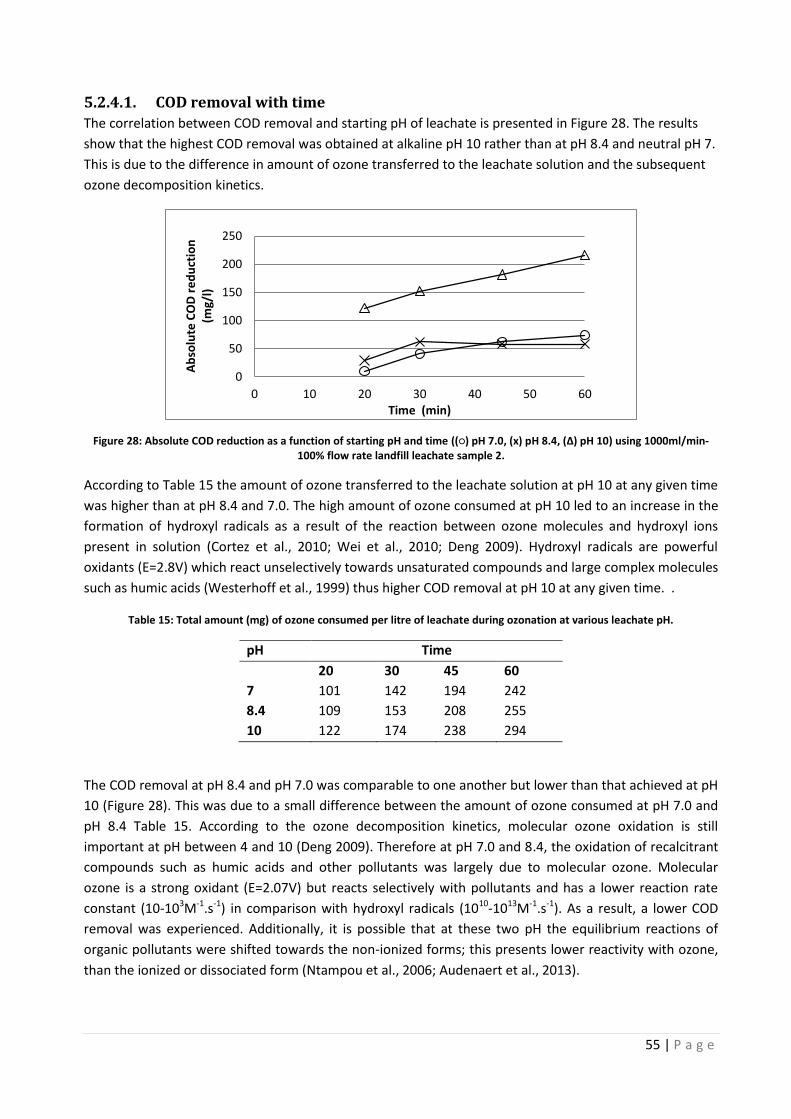
55 | P a g e
5.2.4.1. COD removal with time
The correlation between COD removal and starting pH of leachate is presented in Figure 28. The results
show that the highest COD removal was obtained at alkaline pH 10 rather than at pH 8.4 and neutral pH 7.
This is due to the difference in amount of ozone transferred to the leachate solution and the subsequent
ozone decomposition kinetics.
Figure 28: Absolute COD reduction as a function of starting pH and time ((○) pH 7.0, (x) pH 8.4, (∆) pH 10) using 1000ml/min-100% flow rate landfill leachate sample 2.
According to Table 15 the amount of ozone transferred to the leachate solution at pH 10 at any given time
was higher than at pH 8.4 and 7.0. The high amount of ozone consumed at pH 10 led to an increase in the
formation of hydroxyl radicals as a result of the reaction between ozone molecules and hydroxyl ions
present in solution (Cortez et al., 2010; Wei et al., 2010; Deng 2009). Hydroxyl radicals are powerful
oxidants (E=2.8V) which react unselectively towards unsaturated compounds and large complex molecules
such as humic acids (Westerhoff et al., 1999) thus higher COD removal at pH 10 at any given time. .
Table 15: Total amount (mg) of ozone consumed per litre of leachate during ozonation at various leachate pH.
pH Time
20 30 45 60
7 101 142 194 242
8.4 109 153 208 255
10 122 174 238 294
The COD removal at pH 8.4 and pH 7.0 was comparable to one another but lower than that achieved at pH
10 (Figure 28). This was due to a small difference between the amount of ozone consumed at pH 7.0 and
pH 8.4 Table 15. According to the ozone decomposition kinetics, molecular ozone oxidation is still
important at pH between 4 and 10 (Deng 2009). Therefore at pH 7.0 and 8.4, the oxidation of recalcitrant
compounds such as humic acids and other pollutants was largely due to molecular ozone. Molecular
ozone is a strong oxidant (E=2.07V) but reacts selectively with pollutants and has a lower reaction rate
constant (10-103M-1.s-1) in comparison with hydroxyl radicals (1010-1013M-1.s-1). As a result, a lower COD
removal was experienced. Additionally, it is possible that at these two pH the equilibrium reactions of
organic pollutants were shifted towards the non-ionized forms; this presents lower reactivity with ozone,
than the ionized or dissociated form (Ntampou et al., 2006; Audenaert et al., 2013).
0
50
100
150
200
250
0 10 20 30 40 50 60
Ab
solu
te C
OD
re
du
ctio
n
(mg/
l)
Time (min)
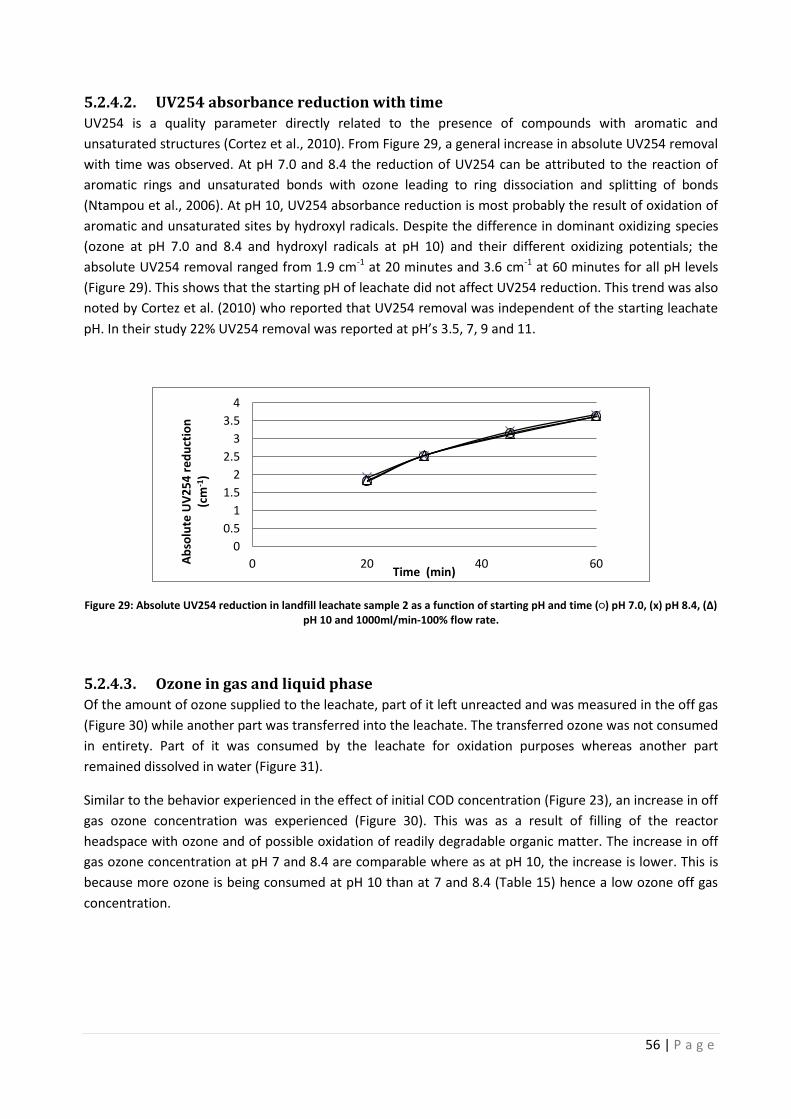
56 | P a g e
5.2.4.2. UV254 absorbance reduction with time
UV254 is a quality parameter directly related to the presence of compounds with aromatic and
unsaturated structures (Cortez et al., 2010). From Figure 29, a general increase in absolute UV254 removal
with time was observed. At pH 7.0 and 8.4 the reduction of UV254 can be attributed to the reaction of
aromatic rings and unsaturated bonds with ozone leading to ring dissociation and splitting of bonds
(Ntampou et al., 2006). At pH 10, UV254 absorbance reduction is most probably the result of oxidation of
aromatic and unsaturated sites by hydroxyl radicals. Despite the difference in dominant oxidizing species
(ozone at pH 7.0 and 8.4 and hydroxyl radicals at pH 10) and their different oxidizing potentials; the
absolute UV254 removal ranged from 1.9 cm-1 at 20 minutes and 3.6 cm-1 at 60 minutes for all pH levels
(Figure 29). This shows that the starting pH of leachate did not affect UV254 reduction. This trend was also
noted by Cortez et al. (2010) who reported that UV254 removal was independent of the starting leachate
pH. In their study 22% UV254 removal was reported at pH’s 3.5, 7, 9 and 11.
Figure 29: Absolute UV254 reduction in landfill leachate sample 2 as a function of starting pH and time (○) pH 7.0, (x) pH 8.4, (∆) pH 10 and 1000ml/min-100% flow rate.
5.2.4.3. Ozone in gas and liquid phase
Of the amount of ozone supplied to the leachate, part of it left unreacted and was measured in the off gas
(Figure 30) while another part was transferred into the leachate. The transferred ozone was not consumed
in entirety. Part of it was consumed by the leachate for oxidation purposes whereas another part
remained dissolved in water (Figure 31).
Similar to the behavior experienced in the effect of initial COD concentration (Figure 23), an increase in off
gas ozone concentration was experienced (Figure 30). This was as a result of filling of the reactor
headspace with ozone and of possible oxidation of readily degradable organic matter. The increase in off
gas ozone concentration at pH 7 and 8.4 are comparable where as at pH 10, the increase is lower. This is
because more ozone is being consumed at pH 10 than at 7 and 8.4 (Table 15) hence a low ozone off gas
concentration.
0
0.5
1
1.5
2
2.5
3
3.5
4
0 20 40 60 Ab
solu
te U
V2
54
re
du
ctio
n
(cm
-1)
Time (min)
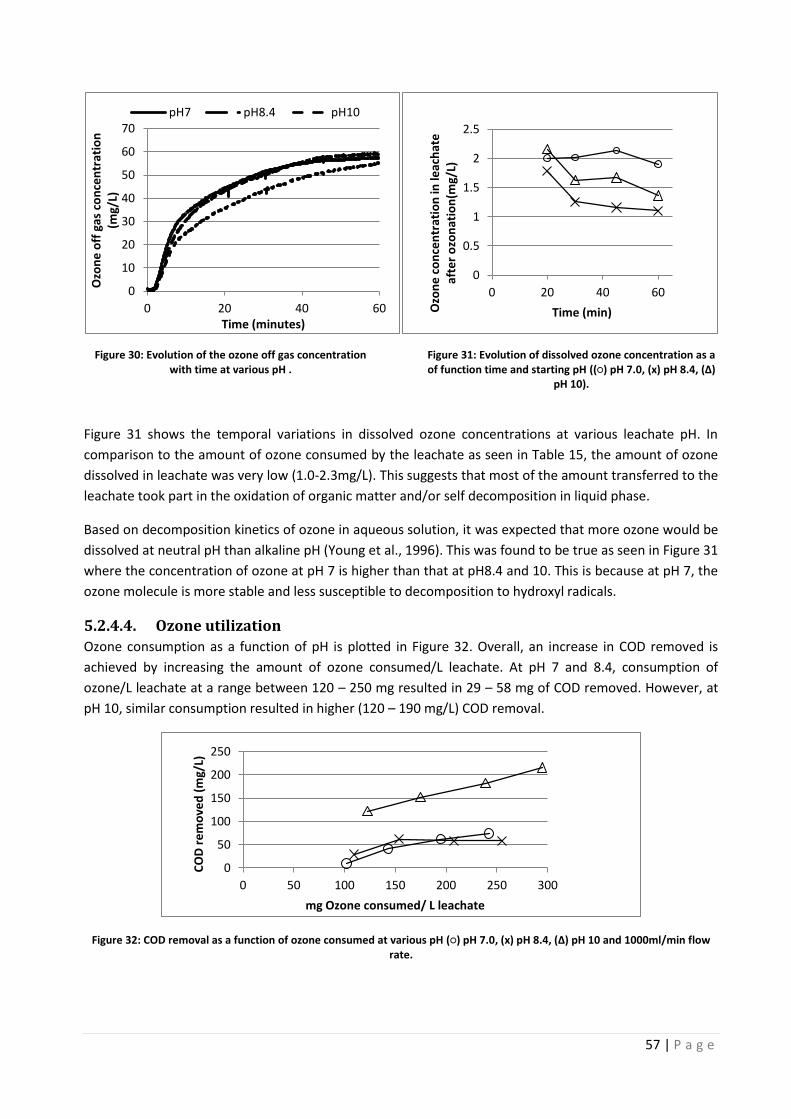
57 | P a g e
Figure 30: Evolution of the ozone off gas concentration with time at various pH .
Figure 31: Evolution of dissolved ozone concentration as a of function time and starting pH ((○) pH 7.0, (x) pH 8.4, (∆)
pH 10).
Figure 31 shows the temporal variations in dissolved ozone concentrations at various leachate pH. In
comparison to the amount of ozone consumed by the leachate as seen in Table 15, the amount of ozone
dissolved in leachate was very low (1.0-2.3mg/L). This suggests that most of the amount transferred to the
leachate took part in the oxidation of organic matter and/or self decomposition in liquid phase.
Based on decomposition kinetics of ozone in aqueous solution, it was expected that more ozone would be
dissolved at neutral pH than alkaline pH (Young et al., 1996). This was found to be true as seen in Figure 31
where the concentration of ozone at pH 7 is higher than that at pH8.4 and 10. This is because at pH 7, the
ozone molecule is more stable and less susceptible to decomposition to hydroxyl radicals.
5.2.4.4. Ozone utilization
Ozone consumption as a function of pH is plotted in Figure 32. Overall, an increase in COD removed is
achieved by increasing the amount of ozone consumed/L leachate. At pH 7 and 8.4, consumption of
ozone/L leachate at a range between 120 – 250 mg resulted in 29 – 58 mg of COD removed. However, at
pH 10, similar consumption resulted in higher (120 – 190 mg/L) COD removal.
Figure 32: COD removal as a function of ozone consumed at various pH (○) pH 7.0, (x) pH 8.4, (∆) pH 10 and 1000ml/min flow rate.
0
10
20
30
40
50
60
70
0 20 40 60
Ozo
ne
off
gas
co
nce
ntr
atio
n
(mg/
L)
Time (minutes)
pH7 pH8.4 pH10
0
0.5
1
1.5
2
2.5
0 20 40 60
Ozo
ne
co
nce
ntr
atio
n in
leac
hat
e
afte
r o
zon
atio
n(m
g/L)
Time (min)
0
50
100
150
200
250
0 50 100 150 200 250 300
CO
D r
em
ove
d (
mg/
L)
mg Ozone consumed/ L leachate
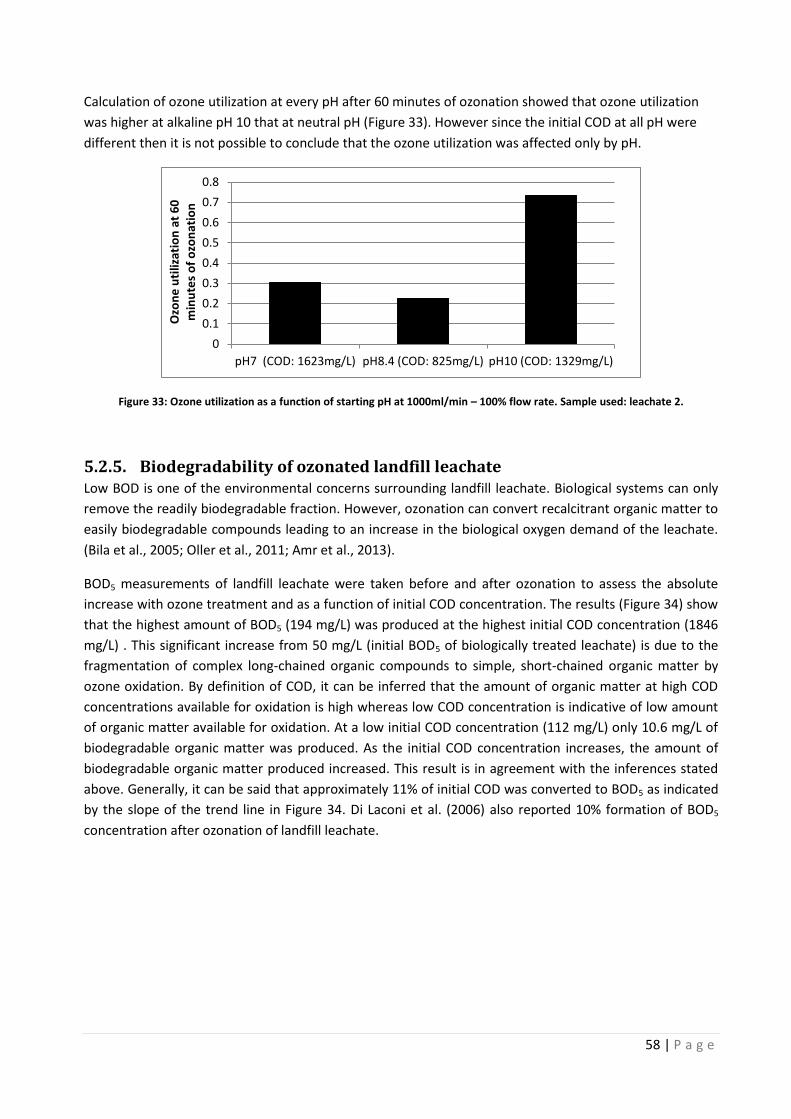
58 | P a g e
Calculation of ozone utilization at every pH after 60 minutes of ozonation showed that ozone utilization
was higher at alkaline pH 10 that at neutral pH (Figure 33). However since the initial COD at all pH were
different then it is not possible to conclude that the ozone utilization was affected only by pH.
Figure 33: Ozone utilization as a function of starting pH at 1000ml/min – 100% flow rate. Sample used: leachate 2.
5.2.5. Biodegradability of ozonated landfill leachate Low BOD is one of the environmental concerns surrounding landfill leachate. Biological systems can only
remove the readily biodegradable fraction. However, ozonation can convert recalcitrant organic matter to
easily biodegradable compounds leading to an increase in the biological oxygen demand of the leachate.
(Bila et al., 2005; Oller et al., 2011; Amr et al., 2013).
BOD5 measurements of landfill leachate were taken before and after ozonation to assess the absolute
increase with ozone treatment and as a function of initial COD concentration. The results (Figure 34) show
that the highest amount of BOD5 (194 mg/L) was produced at the highest initial COD concentration (1846
mg/L) . This significant increase from 50 mg/L (initial BOD5 of biologically treated leachate) is due to the
fragmentation of complex long-chained organic compounds to simple, short-chained organic matter by
ozone oxidation. By definition of COD, it can be inferred that the amount of organic matter at high COD
concentrations available for oxidation is high whereas low COD concentration is indicative of low amount
of organic matter available for oxidation. At a low initial COD concentration (112 mg/L) only 10.6 mg/L of
biodegradable organic matter was produced. As the initial COD concentration increases, the amount of
biodegradable organic matter produced increased. This result is in agreement with the inferences stated
above. Generally, it can be said that approximately 11% of initial COD was converted to BOD5 as indicated
by the slope of the trend line in Figure 34. Di Laconi et al. (2006) also reported 10% formation of BOD5
concentration after ozonation of landfill leachate.
0
0.1
0.2
0.3
0.4
0.5
0.6
0.7
0.8
pH7 (COD: 1623mg/L) pH8.4 (COD: 825mg/L) pH10 (COD: 1329mg/L)
Ozo
ne
uti
lizat
ion
at
60
m
inu
tes
of
ozo
nat
ion
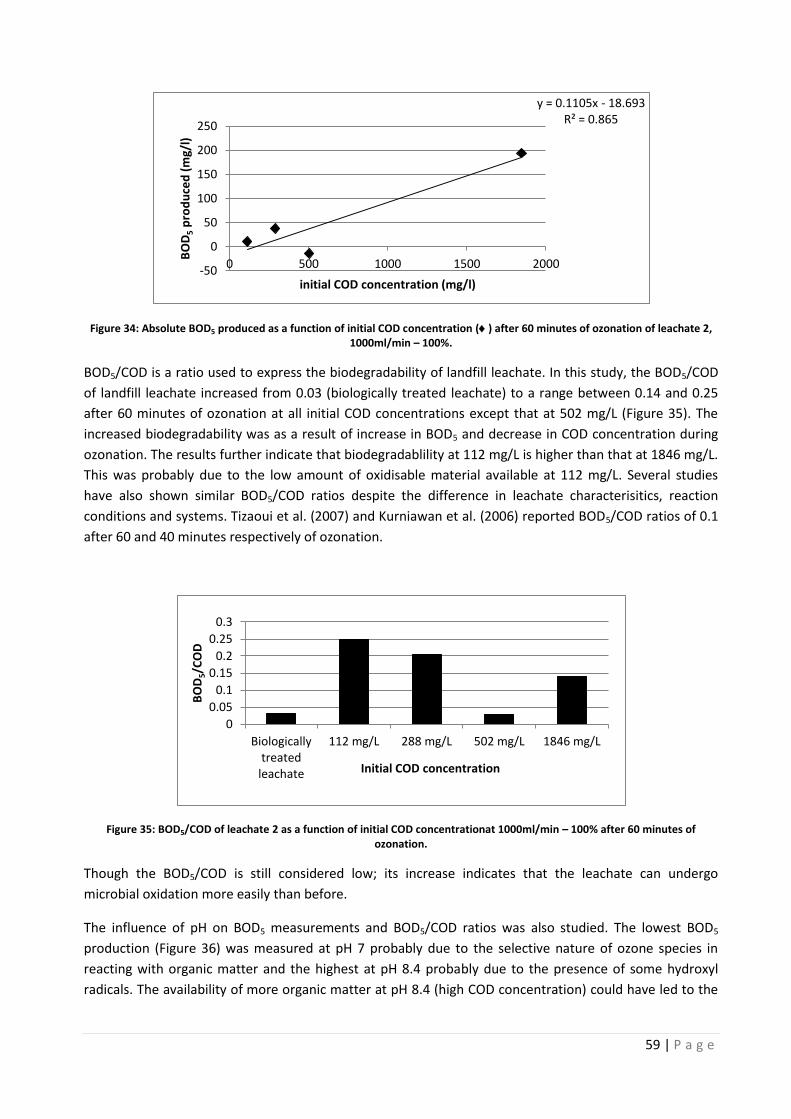
59 | P a g e
Figure 34: Absolute BOD5 produced as a function of initial COD concentration () after 60 minutes of ozonation of leachate 2, 1000ml/min – 100%.
BOD5/COD is a ratio used to express the biodegradability of landfill leachate. In this study, the BOD5/COD
of landfill leachate increased from 0.03 (biologically treated leachate) to a range between 0.14 and 0.25
after 60 minutes of ozonation at all initial COD concentrations except that at 502 mg/L (Figure 35). The
increased biodegradability was as a result of increase in BOD5 and decrease in COD concentration during
ozonation. The results further indicate that biodegradablility at 112 mg/L is higher than that at 1846 mg/L.
This was probably due to the low amount of oxidisable material available at 112 mg/L. Several studies
have also shown similar BOD5/COD ratios despite the difference in leachate characterisitics, reaction
conditions and systems. Tizaoui et al. (2007) and Kurniawan et al. (2006) reported BOD5/COD ratios of 0.1
after 60 and 40 minutes respectively of ozonation.
Figure 35: BOD5/COD of leachate 2 as a function of initial COD concentrationat 1000ml/min – 100% after 60 minutes of ozonation.
Though the BOD5/COD is still considered low; its increase indicates that the leachate can undergo
microbial oxidation more easily than before.
The influence of pH on BOD5 measurements and BOD5/COD ratios was also studied. The lowest BOD5
production (Figure 36) was measured at pH 7 probably due to the selective nature of ozone species in
reacting with organic matter and the highest at pH 8.4 probably due to the presence of some hydroxyl
radicals. The availability of more organic matter at pH 8.4 (high COD concentration) could have led to the
y = 0.1105x - 18.693 R² = 0.865
-50
0
50
100
150
200
250
0 500 1000 1500 2000
BO
D5
pro
du
ced
(m
g/l)
initial COD concentration (mg/l)
0
0.05
0.1
0.15
0.2
0.25
0.3
Biologically treated
leachate
112 mg/L 288 mg/L 502 mg/L 1846 mg/L
BO
D5/C
OD
Initial COD concentration
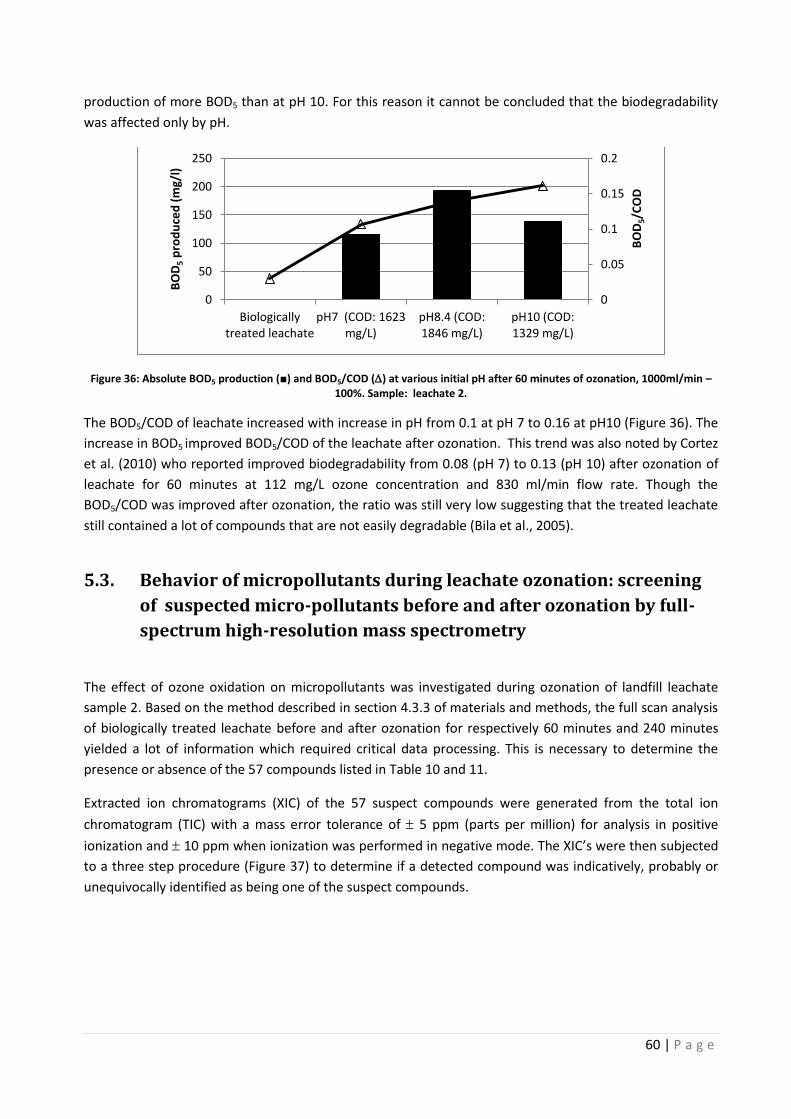
60 | P a g e
production of more BOD5 than at pH 10. For this reason it cannot be concluded that the biodegradability
was affected only by pH.
Figure 36: Absolute BOD5 production (■) and BOD5/COD () at various initial pH after 60 minutes of ozonation, 1000ml/min – 100%. Sample: leachate 2.
The BOD5/COD of leachate increased with increase in pH from 0.1 at pH 7 to 0.16 at pH10 (Figure 36). The
increase in BOD5 improved BOD5/COD of the leachate after ozonation. This trend was also noted by Cortez
et al. (2010) who reported improved biodegradability from 0.08 (pH 7) to 0.13 (pH 10) after ozonation of
leachate for 60 minutes at 112 mg/L ozone concentration and 830 ml/min flow rate. Though the
BOD5/COD was improved after ozonation, the ratio was still very low suggesting that the treated leachate
still contained a lot of compounds that are not easily degradable (Bila et al., 2005).
5.3. Behavior of micropollutants during leachate ozonation: screening
of suspected micro-pollutants before and after ozonation by full-
spectrum high-resolution mass spectrometry
The effect of ozone oxidation on micropollutants was investigated during ozonation of landfill leachate
sample 2. Based on the method described in section 4.3.3 of materials and methods, the full scan analysis
of biologically treated leachate before and after ozonation for respectively 60 minutes and 240 minutes
yielded a lot of information which required critical data processing. This is necessary to determine the
presence or absence of the 57 compounds listed in Table 10 and 11.
Extracted ion chromatograms (XIC) of the 57 suspect compounds were generated from the total ion
chromatogram (TIC) with a mass error tolerance of 5 ppm (parts per million) for analysis in positive
ionization and 10 ppm when ionization was performed in negative mode. The XIC’s were then subjected
to a three step procedure (Figure 37) to determine if a detected compound was indicatively, probably or
unequivocally identified as being one of the suspect compounds.
0
0.05
0.1
0.15
0.2
0
50
100
150
200
250
Biologically treated leachate
pH7 (COD: 1623 mg/L)
pH8.4 (COD: 1846 mg/L)
pH10 (COD: 1329 mg/L)
BO
D5/C
OD
BO
D5
pro
du
ced
(m
g/l)
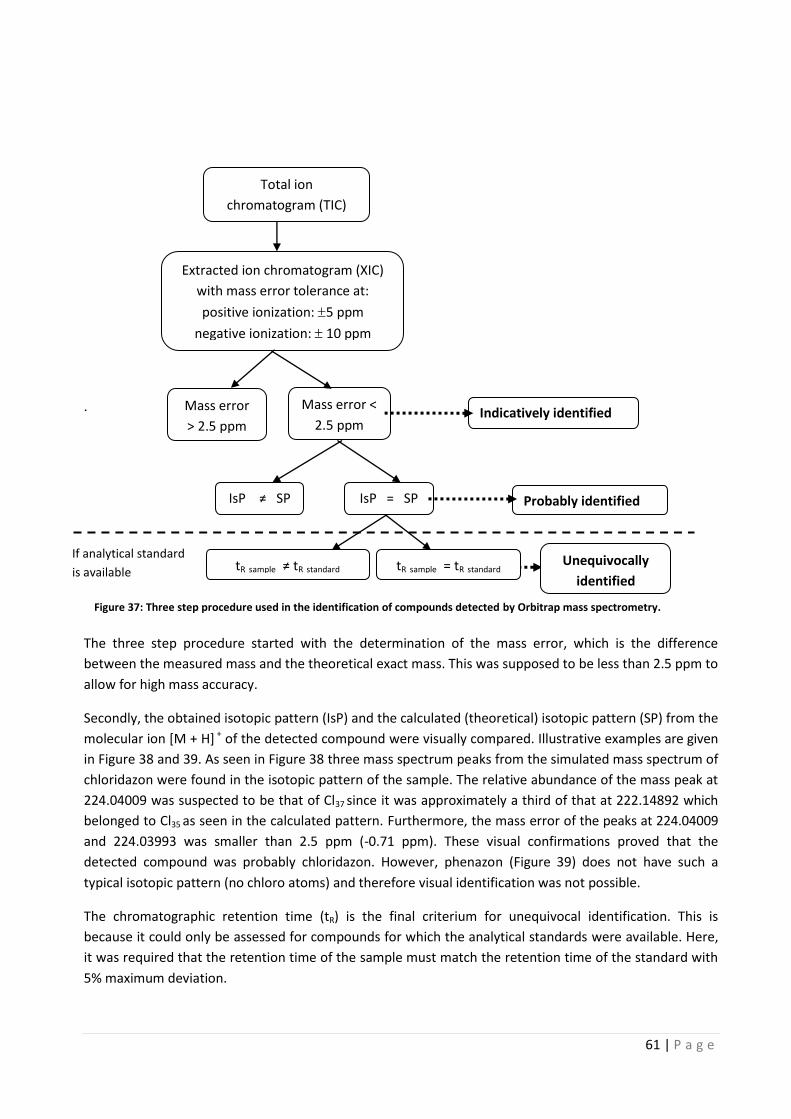
61 | P a g e
.
The three step procedure started with the determination of the mass error, which is the difference
between the measured mass and the theoretical exact mass. This was supposed to be less than 2.5 ppm to
allow for high mass accuracy.
Secondly, the obtained isotopic pattern (IsP) and the calculated (theoretical) isotopic pattern (SP) from the
molecular ion [M + H] + of the detected compound were visually compared. Illustrative examples are given
in Figure 38 and 39. As seen in Figure 38 three mass spectrum peaks from the simulated mass spectrum of
chloridazon were found in the isotopic pattern of the sample. The relative abundance of the mass peak at
224.04009 was suspected to be that of Cl37 since it was approximately a third of that at 222.14892 which
belonged to Cl35 as seen in the calculated pattern. Furthermore, the mass error of the peaks at 224.04009
and 224.03993 was smaller than 2.5 ppm (-0.71 ppm). These visual confirmations proved that the
detected compound was probably chloridazon. However, phenazon (Figure 39) does not have such a
typical isotopic pattern (no chloro atoms) and therefore visual identification was not possible.
The chromatographic retention time (tR) is the final criterium for unequivocal identification. This is
because it could only be assessed for compounds for which the analytical standards were available. Here,
it was required that the retention time of the sample must match the retention time of the standard with
5% maximum deviation.
If analytical standard
is available
Indicatively identified
Probably identified
Unequivocally
identified
Total ion
chromatogram (TIC)
tR sample ≠ tR standard
IsP ≠ SP
Mass error <
2.5 ppm
Mass error
> 2.5 ppm
Extracted ion chromatogram (XIC)
with mass error tolerance at:
positive ionization: 5 ppm
negative ionization: 10 ppm
IsP = SP
tR sample = tR standard
Figure 37: Three step procedure used in the identification of compounds detected by Orbitrap mass spectrometry.
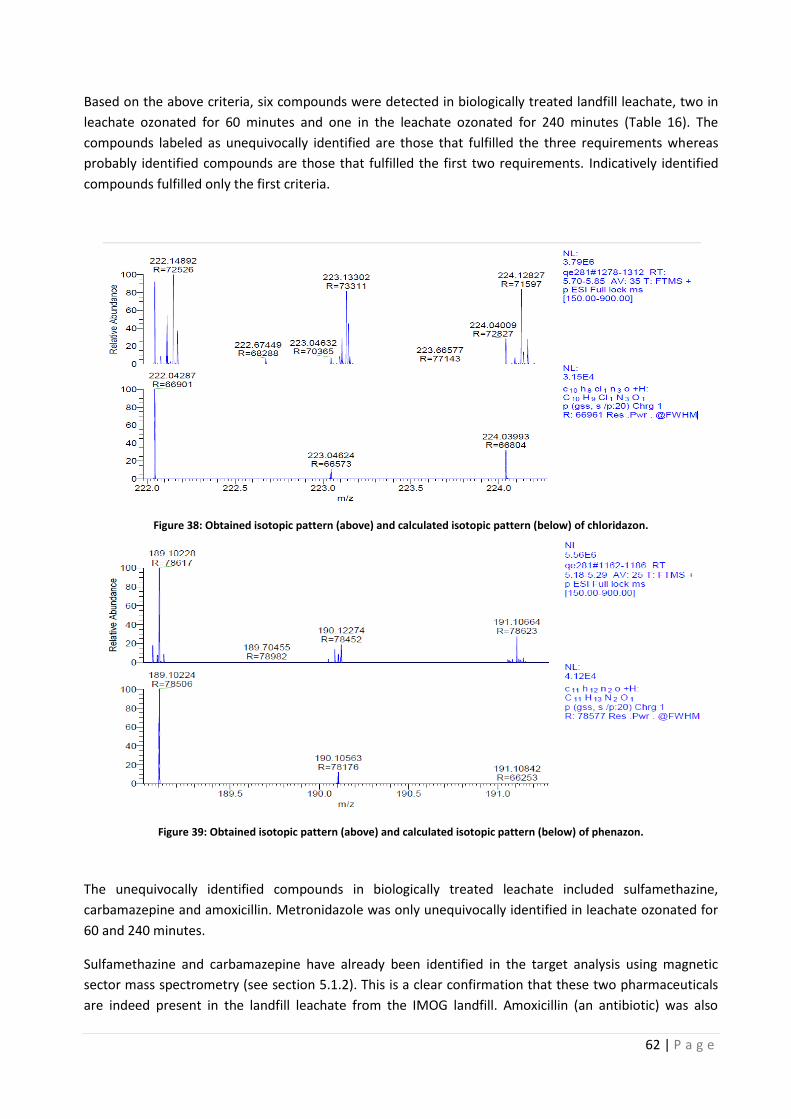
62 | P a g e
Based on the above criteria, six compounds were detected in biologically treated landfill leachate, two in
leachate ozonated for 60 minutes and one in the leachate ozonated for 240 minutes (Table 16). The
compounds labeled as unequivocally identified are those that fulfilled the three requirements whereas
probably identified compounds are those that fulfilled the first two requirements. Indicatively identified
compounds fulfilled only the first criteria.
Figure 38: Obtained isotopic pattern (above) and calculated isotopic pattern (below) of chloridazon.
Figure 39: Obtained isotopic pattern (above) and calculated isotopic pattern (below) of phenazon.
The unequivocally identified compounds in biologically treated leachate included sulfamethazine,
carbamazepine and amoxicillin. Metronidazole was only unequivocally identified in leachate ozonated for
60 and 240 minutes.
Sulfamethazine and carbamazepine have already been identified in the target analysis using magnetic
sector mass spectrometry (see section 5.1.2). This is a clear confirmation that these two pharmaceuticals
are indeed present in the landfill leachate from the IMOG landfill. Amoxicillin (an antibiotic) was also
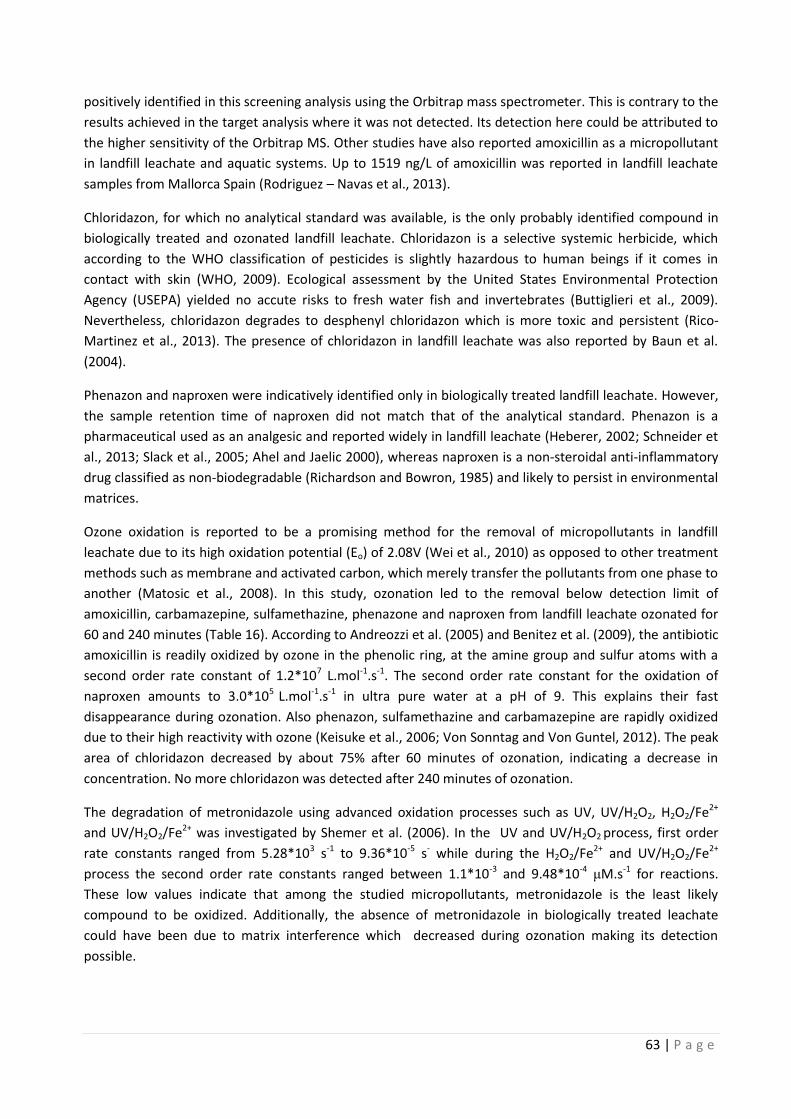
63 | P a g e
positively identified in this screening analysis using the Orbitrap mass spectrometer. This is contrary to the
results achieved in the target analysis where it was not detected. Its detection here could be attributed to
the higher sensitivity of the Orbitrap MS. Other studies have also reported amoxicillin as a micropollutant
in landfill leachate and aquatic systems. Up to 1519 ng/L of amoxicillin was reported in landfill leachate
samples from Mallorca Spain (Rodriguez – Navas et al., 2013).
Chloridazon, for which no analytical standard was available, is the only probably identified compound in
biologically treated and ozonated landfill leachate. Chloridazon is a selective systemic herbicide, which
according to the WHO classification of pesticides is slightly hazardous to human beings if it comes in
contact with skin (WHO, 2009). Ecological assessment by the United States Environmental Protection
Agency (USEPA) yielded no accute risks to fresh water fish and invertebrates (Buttiglieri et al., 2009).
Nevertheless, chloridazon degrades to desphenyl chloridazon which is more toxic and persistent (Rico-
Martinez et al., 2013). The presence of chloridazon in landfill leachate was also reported by Baun et al.
(2004).
Phenazon and naproxen were indicatively identified only in biologically treated landfill leachate. However,
the sample retention time of naproxen did not match that of the analytical standard. Phenazon is a
pharmaceutical used as an analgesic and reported widely in landfill leachate (Heberer, 2002; Schneider et
al., 2013; Slack et al., 2005; Ahel and Jaelic 2000), whereas naproxen is a non-steroidal anti-inflammatory
drug classified as non-biodegradable (Richardson and Bowron, 1985) and likely to persist in environmental
matrices.
Ozone oxidation is reported to be a promising method for the removal of micropollutants in landfill
leachate due to its high oxidation potential (Eo) of 2.08V (Wei et al., 2010) as opposed to other treatment
methods such as membrane and activated carbon, which merely transfer the pollutants from one phase to
another (Matosic et al., 2008). In this study, ozonation led to the removal below detection limit of
amoxicillin, carbamazepine, sulfamethazine, phenazone and naproxen from landfill leachate ozonated for
60 and 240 minutes (Table 16). According to Andreozzi et al. (2005) and Benitez et al. (2009), the antibiotic
amoxicillin is readily oxidized by ozone in the phenolic ring, at the amine group and sulfur atoms with a
second order rate constant of 1.2*107 L.mol-1.s-1. The second order rate constant for the oxidation of
naproxen amounts to 3.0*105 L.mol-1.s-1 in ultra pure water at a pH of 9. This explains their fast
disappearance during ozonation. Also phenazon, sulfamethazine and carbamazepine are rapidly oxidized
due to their high reactivity with ozone (Keisuke et al., 2006; Von Sonntag and Von Guntel, 2012). The peak
area of chloridazon decreased by about 75% after 60 minutes of ozonation, indicating a decrease in
concentration. No more chloridazon was detected after 240 minutes of ozonation.
The degradation of metronidazole using advanced oxidation processes such as UV, UV/H2O2, H2O2/Fe2+
and UV/H2O2/Fe2+ was investigated by Shemer et al. (2006). In the UV and UV/H2O2 process, first order
rate constants ranged from 5.28*103 s-1 to 9.36*10-5 s- while during the H2O2/Fe2+ and UV/H2O2/Fe2+
process the second order rate constants ranged between 1.1*10-3 and 9.48*10-4 μM.s-1 for reactions.
These low values indicate that among the studied micropollutants, metronidazole is the least likely
compound to be oxidized. Additionally, the absence of metronidazole in biologically treated leachate
could have been due to matrix interference which decreased during ozonation making its detection
possible.
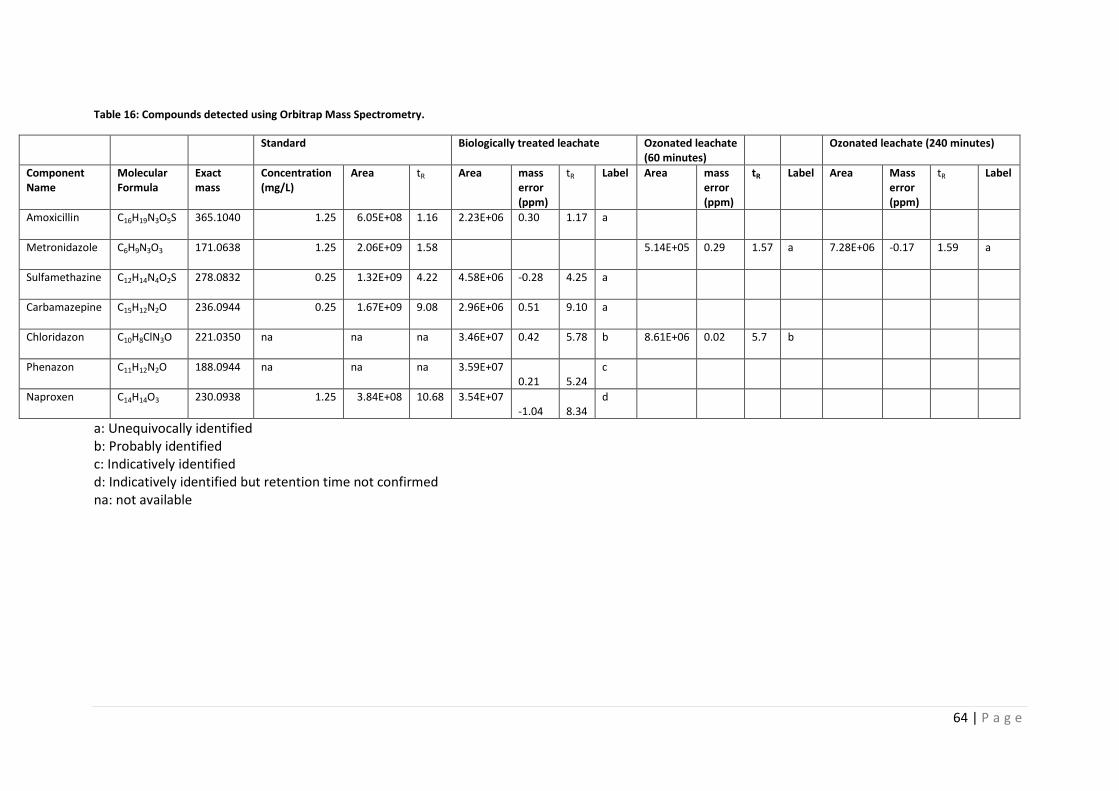
64 | P a g e
Table 16: Compounds detected using Orbitrap Mass Spectrometry.
Standard Biologically treated leachate
Ozonated leachate (60 minutes)
Ozonated leachate (240 minutes)
Component Name
Molecular Formula
Exact mass
Concentration (mg/L)
Area tR Area mass error (ppm)
tR Label Area mass error (ppm)
tR
Label Area Mass error (ppm)
tR Label
Amoxicillin C16H19N3O5S
365.1040 1.25 6.05E+08 1.16 2.23E+06 0.30 1.17 a
Metronidazole
C6H9N3O3
171.0638 1.25 2.06E+09 1.58 5.14E+05 0.29 1.57 a 7.28E+06 -0.17 1.59 a
Sulfamethazine
C12H14N4O2S
278.0832 0.25 1.32E+09 4.22 4.58E+06 -0.28 4.25 a
Carbamazepine C15H12N2O
236.0944 0.25 1.67E+09 9.08 2.96E+06 0.51 9.10 a
Chloridazon
C10H8ClN3O
221.0350 na na na 3.46E+07 0.42 5.78 b 8.61E+06 0.02 5.7 b
Phenazon
C11H12N2O
188.0944 na na na 3.59E+07 0.21 5.24
c
Naproxen
C14H14O3
230.0938 1.25 3.84E+08 10.68 3.54E+07 -1.04 8.34
d
a: Unequivocally identified b: Probably identified c: Indicatively identified d: Indicatively identified but retention time not confirmed na: not available
65 | P a g e
CHAPTER 6
CONCLUSIONS AND RECOMMENDATIONS
6.1. Conclusions The optimal treatment of landfill leachate to meet today’s strict legislation is a challenge. Biological
methods have long been considered to be the most appropriate technologies in treating landfill
leachate. However, preliminary characterization of leachate samples during this study shows that
recalcitrant organic matter such as humic acids, pharmaceuticals and pesticides are not degraded during
biological treatment.
Indeed, a mass spectrometric target analysis of biologically treated leachate sampled at the IMOG
landfills revealed the presence of multi-class pharmaceuticals, including metronidazole (121 ng/L),
sulfamethazine (94 ng/L) and commonly used NSAID’s like paracetamol and diclofenac (48 mg/L). The
occurance of sulfamethazine and carbamazepine was further confirmed during suspect screening.
Additionally, the systemic pesticide chloridazon was probably identified during the suspect screening.
The presence of these compounds in leachate is a clear confirmation that landfill leachate is a significant
source of micropollutants which need further investigation in environmental studies.
Ozonation experiments showed that this post-treatment technique is effective in reducing recalcitrant
organic matter (COD) and micropollutants present in biologically treated landfill leachate. However, this
efficiency depends on extrinsic factors such as the ozone inlet concentration and gas flow rate, and
ozonation time. Intrinsic factors such as the initial amount of COD and the leachate pH also play an
important role in ozonation.
Overall, from the results obtained in our set-up, we can conclude that:
High inlet gas flow rate (1000 ml/min) and maximum ozone generator capacity (100%) ensured that
maximum ozone was supplied, resulting in a better reduction of COD concentration and UV254
absorbance.
A high procentual reduction in COD concentration (44%) and UV254 absorbance (77) was observed
at low initial COD concentrations (e.g 112 mg/L) due to the low amount of organic matter in contrast
to high initial COD concentration (1846 mg/L).
Alkaline pH 10 led to a significant reduction of COD concentration (200 mg/L) in comparison with
COD reductions measured at neutral pH 7 (50 mg/L). In practice, increase of natural leachate pH to
alkaline pH increases cost of operation as other chemicals are required. However, compared to
other alternatives such as use of high ozone concentrations or use of other post treatment
techniques such as activated carbon, ozonation at alkaline pH might be cheaper. On the other hand,
UV254 absorbance reduction was not affected by pH.
Ozonation significantly increases the BOD5 (10 – 194 mg/L as a function of initial COD) of landfill
leachate, hence increasing biodegradability (0.14 – 0.25 as a function of initial COD). Increased
66 | P a g e
biodegradability creates an opportunity to recyle the effluent to a preceding biological treatment
process.
A clear link could not be established between ozone utilization and initial COD concentration.
However the ozone utilization ranged between 0.23 – 0.48 mg COD removed per mg ozone
consumed.
For most of the micropollutants detected in biologically treated leachate, subsequent ozonation (60
min) resulted into a concentration decrease below their detection limit, although further research is
needed to better understand their behavior during leachate treatment.
6.2. Recommendations Though this study provides important information on ozonation of landfill leachate that is beneficial to
IMOG and other landfilling facilities, certain crucial factors require further research. These include:
To fully understand the impact of pH on leachate treatment, it is recommended that pH should
be kept constant during ozonation.
This study only focused on use of ozonation after the biological treatment. Further investigation
is required to determine the optimal position of the ozonation step in a complete treatment
chain, with possibilities of recycling ozonated effluent or further treatment with other full-scale
applied technologies
To allow proper quantification of pharmaceuticals and other micropollutants in landfill leachate,
it is recommended to optimize analytical methods and fully validate (e.g. calibration, extraction
recoveries, detection limits, matrix effects) them for their applicability in the complex landfill
leachate matrix.
Further investigations should be carried out to determine the behavior of certain
pharmaceuticals such as metronidazole and their byproducts during ozonation of landfill
leachate.
67 | P a g e
REFERENCES
Abbas A. A., Guo J., Liu Z. P., Pan Y. Y., Wisaam S. A. (2009). Review on landfill leachate treatments.
Journal of Applied Sciences Research, 5, 534-545.
Abdoli M. A., Karbassi A. R., Samiee-Zafarghandi R., Rashidi Z., Gitipour S. Pazoki, M. (2012). Electricity
generation from leachate treatment plant. International Journal of Environmental Research, 6, 493-498.
Agency for Toxic Substances and Disease Registry (ATSDR) (2012). Available at
www.atsdr.cdc.gov/hac/landfill/html/ch2.html last visited on 1/11/2012.
Alkalay D., Guerrero L., Lema J.M., Mendez R., Chamy R. (1998). Review: Anaerobic treatment of
municipal sanitary landfill leachates: the problem of refractory and toxic components. World Journal of
Microbiology and Biotechnology, 14, 309-320.
Amokrane A., Comel C., Veron J. (1997). Landfill leachates pre-treatment by coagulation-flocculation.
Water Research, 31, 2775 2782.
Amr S. S. A., Aziz H. A., Adlan M. N., Aziz S. Q. (2013). Effect of ozone and ozone/fenton in the advanced
oxidation process on biodegradable characteristics of semi-aerobic stabilized leachate. Clean – Soil, Air,
Water, 41 (2), 148–152.
Andreozzi R., Caprio V., Insola A., Marotta R. (1999). Advanced oxidation processes (AOP) for water
purification and recovery. Catalysis Today, 53, 51–59.
Andrews W. J., Masoner J. R., Cozzarelli I. M. (2012). Emerging contaminants at a closed and an
operating landfill in Oklahoma. Ground Water Monitoring and Remediation, 32, 120–130.
Anfruns A., Gabarr´o J., Gonzalez-Olmos R., Puig S., Balaguer M.D., Colprim J. (2013). Coupling
anammox and advanced oxidation-based technologies for mature landfill leachate treatment. Journal of
Hazardous Materials, 258 -259, 27 - 34.
Asakura H., Toshihiko M. (2009). Experimental study of behavior of endocrine-disrupting chemicals in
leachate treatment process and evaluation of removal efficiency. Waste Management, 29, 1852–1859.
Asakura H., Toshihiko M., Nobutoshi T. (2004). Behavior of endocrine-disrupting chemicals in leachate
from MSW landfill sites in Japan. Waste Management, 24, 613–622.
Aucott M., 2006. The fate of heavy metalsin landfills: a review. Industrial ecology and pollution
prevention and the NY-NJ harbor. New York academy of sciences, 13.
Audenaert W.T.M., Vandierendonck D., Van Hulle S.W.H., Nopens, I. (2013). Comparison of ozone and
HO˙ induced conversion of effluent organic matter (EfOM) using ozonation and UV/H₂O₂ treatment.
Water Research, 47, 2387–2398.
68 | P a g e
Bader H., Hoigne J. (1981). Determination of Ozone in Water by the Indigo Method. Water research, 15,
449-456.
Baderna D., Maggioni S., Boriani E., Gemma S., Molteni M., Lombardo A., Colombo A., Bordonali S.,
Rotella G., Lodi M., Benfenati E. (2011). A combined approach to investigate the toxicity of an industrial
landfill’s leachate: Chemical analyses, risk assessment and in vitro assays. Environmental Research, 111,
603–613
Barbusinski K., B. Pieczykolan (2010). COD removal from landfill leachate using fenton oxidation and
coagulation. Architecture civil engineering environment, 4, 93-100.
Barnes K. K., Christenson S. C., Kolpin D. W., Focazio M. J., Furlong E. T., Zaugg S. D., Meyer M. T., Barber
L. B. (2004). Pharmaceuticals and other organic waste water contaminants within a leachate plume
downgradient of a municipal landfill. Ground water monitoring and remediation, 24, 119 – 126
Baun A., Ledin A., Reitzel L.A., Bjerg P.L., Christensen T.H. (2004). Xenobiotic organic compounds in
leachates from ten Danish MSW landfills—chemical analysis and toxicity tests. Water Research, 38,
3845–3858.
Behr R. S., Stahler C.G. D., Pistell A. E., (2011). The pharmaceutical content of landfill leachate a
preliminary evaluation. Northeast Water Science Forum Science to Inform Pharmaceutical and Personal
Care Product Management.
Benfenati E., Barcelo D., Johnson I., Galassi S., Levsen K. (2003). Emerging organic pollutants in landfill
leachates from industrial waste landfills and industrial effluent. Trends in analytical chemistry, 22,757-
765.
Benfenati E., Pierucci P., Fanelli R., Preiss A., Godejohann M., Astratov M., Levsen K., Barcelo D. (1999).
Comparative studies of the leachate of an industrial landfill by gas chromatography-mass spectrometry,
liquid chromatography-nuclear magnetic resonance and liquid-mass spectrometry. Journal of
chromatography A, 831, 243-256.
Benitez F. J., Acero J. L., Real F. J., Roldán G. (2009) Ozonation of pharmaceutical compounds: Rate
constants and elimination in various water matrices. Chemosphere, 77, 53–59.
Bila D. M., Montalv A. F., Silva A. C., Dezo . (2005). Ozonation of a landfill leachate: evaluation of
toxicity removal and biodegradability improvement. Journal of Hazardous Materials, 117, 235–242.
Boonyaroj V., Chiemchaisri C., Chiemchaisri W., Theepharaksapan S., Yamamoto K. (2012). Toxic organic
micro-pollutants removal mechanisms in long-term operated membrane bioreactor treating municipal
solid waste leachate. Bioresource Technology, 113, 174–180.
Borghi A. D., Binaghi L., Converti A., Borghi M. D. (2003). Combined treatment of leachate from sanitary
landfill and municipal wastewater by activated sludge. Chemical and Biochemcal Engineering Quarterly,
17, 277–283.
69 | P a g e
Bound J. P., Voulvoulis N. (2005). Household disposal of pharmaceuticals as a pathway for aquatic
contamination in the United Kingdom. Environmental Health Perspectives, 113, 1705-1711.
Buszka P. M., Yeskis D. J., Kolpin D. W., Furlong E. T., Zaugg S. D., Meyer M. T. (2009). Waste-Indicator
and Pharmaceutical Compounds in Landfill Leachate Affected Ground Water near Elkhart, Indiana,
2000–2002. Bulletin of Environmental Contamination and Toxicology, 82, 653–659.
Buttiglieri G., Peschka M., Fromel T., Muller J., Malpei F., Seel P., Knepper T. P. (2009). Environmental
occurrence and degradation of the herbicide n-chloridazon. Water research, 43, 2865 – 2873.
Calli B., Mertoglu B., Roest K., Inan B. (2006). Comparison of long-term performances and final microbial
compositions of anaerobic reactors treating landfill leachate. Bio-resource Technology, 97, 641–647.
Castillo E., M. Vergara, Y. Moreno (2007). Landfill leachate treatment using a rotating biological
contactor and an upward-flow anaerobic sludge bed reactor. Waste Management, 27, 720–726.
CBI Market Survey (2010). The Pharmaceutical Products Market in Belgium.
Chandaria industries limited www.chandaria.com/process/pr_convert.php last visited on 16/06/2013.
Chian E. K., Dewalle F. B. (1975). Compiliation of methodology for measuring pollution parameters in
landfill leachate. USEPA
Chiu-Yue L., Feng-Yi B., Jen C. (1999). Anaerobic co-digestion of septage and landfill leachate.
Bioresource Technology, 68, 275-282.
Christensen T.H., Kjeldsen P., Bjerg P.L., Jensen D. L., Christensen J. B., Baun A., Albrechtsen H.J., Heron
G. (2001). Review: Biogeochemistry of landfill leachate plumes. Applied Geochemistry Volume, 16, 659-
718.
Cortez S., Teixeira P., Oliveira R., Mota M. (2011). Mature landfill leachate treatment by denitrification
and ozonation. Process Biochemistry, 46, 148–153.
Cortez S., Teixeira P., Oliveira R., Mota M., (2010). Ozonation as polishing treatment of mature landfill
leachate. Journal of Hazardous Materials, 182, 730–734.
Demeestere K. (2012). Analysis of organic micropollutants.
Deng Y. (2007). Physical chemical removal of organic contaminants in municipal landfill leachate. E.C.
Lehmann ed. Landfill research focus, Nova publishers, New York.
Deng Y. (2009). Advanced Oxidation Processes (AOPS) for Reduction of Organic Pollutants in Landfill
Leachate: A Review. International Journal of Environment and Waste Management, 4, 367-384.
Deng Y., Rosario-Muniz E., Ma X. (2012). Effects of inorganic anions on fenton oxidation of organic
species in landfill leachate. Waste Management and Research, 30, 12-19.
70 | P a g e
Di Laconi C., Pagano M., Ramadori R., Lopez A. (2010). Nitrogen recovery from a stabilized municipal
landfill leachate. Bioresource Technology, 101, 1732–1736.
Di Laconi C., Ramadori R., Lopez A. (2006). Combined biological and chemical degradation for treating a
mature municipal landfill leachate. Biochemical Engineering Journal, 31, 118–124.
Diamadopoulos E. (1994). Characterization and treatment of recirculation stabilized leachate. Water
Research, 28, 2439-2445.
Dolara D., Gros M., Rodriguez-Mozaz S., Moreno J., Comas J., Rodriguez-Roda I., Barceló D. (2012)
Removal of emerging contaminants from municipal wastewater with an integrated membrane system,
MBR–RO. Journal of Hazardous Materials, 239 – 240, 64– 69.
Eggen T., Moeder M., Arukwe A. (2010). Municipal landfill leachates: A significant source for new and
emerging pollutants. Science of the Total Environment, 408, 5147–5157.
Enzminger J.D., Robertson D., Ahlert R.C., Kosson D.S. (1987). Treatment of Landfill Leachates. Journal
of Hazardous Materials, 14, 83-101.
EPA (2011) Pesticides industry sales and usage, 2006 and 2007 market estimates.
EPA Guidance Manual (1999). Alternative Disinfectants and Oxidants
EU Directive 2004/27/EC of the European Parliament and of the Council of 31 March 2004 amending
Directive 2001/83/EC on the Community code relating to medicinal products for human use (Text with
EEA relevance) Official Journal L 136 , 30/04/2004, 34 – 57.
Fangyue L., Knut W., Wilhelm H. (2009). Treatment of the methanogenic landfill leachate with thin open
channel reverse osmosis membrane modules. Waste Management, 29, 960–964.
Fernandes H., Aline V., Martins C. L., Antonio R. V., Costa R. H. R. (2012). Microbial and chemical profile
of a ponds system for the treatment of landfill leachate. Waste Management, Article In Press
Foo K.Y., Hameed B.H. (2009). An overview of landfill leachate treatment via activated carbon
adsorption process. Journal of Hazardous Materials, 171, 54–60.
Foo K.Y., Lee L.K., Hameed B.H. (2013). Batch adsorption of semi-aerobic landfill leachate by granular
activated carbon prepared by microwave heating Chemical Engineering Journal, 222, 259–264.
Forgie, D.J.L. (1988). Selection of the most appropriate leachate treatment methods. Part 3: A decision
model for the treatment train selection. Water Pollution Research Journal Canada, 23, 341-355.
Frontistis Z., Xekoukoulotakis N.P., Diamadopoulos E., Mantzavinos D. (2008). Ozonation of Landfill
Leachates: Treatment Optimization by Factorial Design. Journal of Advanced Oxidation Technology, 11,
370-376.
71 | P a g e
Glassmeyer S. T., Hinchey E. K., Boehme S. E., Daughton C.G., Ruhoy I. S., Conerly O., Daniels R. L., Lauer
L., McCarthy M., Nettesheim T. G., Sykes K., Thompson V. G. (2009). Disposal practices for unwanted
residential medications in the United States. Environment International 35 566–572.
Gourdon R., Comel C., Vermande P., Veron J., (1989). Fractionation of the organic matter of a landfill
leachate before and after aerobic or anaerobic biological treatment. Water Research, 23, 167-173.
Haarstad K., Mæhlum T. (2008). Pesticides in Norwegian Landfill Leachates. The Open Environmental &
Biological Monitoring Journal, 1, 8-15.
Haarstad K., T. Mæhlum, H. Borch (2013). Occurrence removal and possible effects of pesticides in MSW
leachate. Available at lst.sb.ltu.se/iclrs/documents/symp2000/papers/Haarstad,_Maehlum,_Borch last
visited on 18/06/2013.
Haeck A. (2013). Validatie van een analytische methode gebruik makend van hoge-resolutie massaspectrometrie voor het meten van geneesmiddelenresidu’s in afvalwate. Masters thesis, Ghent University. Hashem A., Abdel –Salaam A., Mizuno A., Yehia A., Turky A., Gabr A. (2003). Optimum operating
conditions for ozone generation in AC corona and AC silent discharge reactors. Journal of Institute of
Electrostatics Japan, 27, 129-134.
Heberer T. (2002). Occurrence, fate, and removal of pharmaceutical residues in the aquatic
environment: a review of recent research data. Toxicology Letters 131, 5–17.
Hirsch R., Ternes T., Haberer K., Kratz K. L. (1999). Occurrence of antibiotics in the aquatic environment.
The Science of the Total Environment 225, 109-118.
Hoigné J., Bader H., (1983). Rate constants of reaction of ozone with organic and inorganic compounds
in water. Part II. Dissociating organic compounds, Water Research, 17, 185.
Holm J.V., Kirsten R., Poul L. B., Christensen T. H. (1995). Occurrence and distribution of pharmaceutical
organic compounds in the groundwater down gradient of a landfill (Grindsted, Denmark). Environmental
Science &Technology, 29, 1415-1420.
Hongjiang L., Youcai Z., Lei S., Yingying G. (2009). Three-stage aged refuse biofilter for the treatment of
landfill leachate. Journal of Environmental Sciences, 21, 70–75.
Huset C. A., Barlaz M. A., Barofsky D. F., Field J. A. (2011). Quantitative determination of fluorochemicals
in municipal landfill leachates. Chemosphere 82, 1380-1386.
Imena S., Ismail T., Sami S., Fathi A., Khaled M., Ahmed G., Latifa B.; 2008. Characterization and
anaerobic batch reactor treatment of Jebel Chakir Landfill leachate. Desalination, 246, 417–424.
IMOG (2012). Oral information during plant visit.
Ince M., Senturk E., Engin G. O., Keskinler B. (2010). Further treatment of landfill leachate by
nanofiltration and microfiltration–PAC hybrid process. Desalination, 255, 52–60.
72 | P a g e
Jebamani I. S., Gopalakrishnan V., Senthilkumar G. (2009). Brine Solution Recovery Using Nanofiltration.
Available at http://www.eco-web.com/edi/090714.html last visited 18/06/2013
Jelic A., Cruz-Morato´ C., Marco-Urrea E., Sarra` M., Perez S., Vicent T., Petrovi M., Barcelo D. (2012).
Degradation of carbamazepine by Trametes versicolor in an air pulsed fluidized bed bioreactor and
identification of intermediates. Water research, 46, 955-964
Jiménez L., Alzaga R., Bayona J. M. (2002). Determination of organic contaminants in landfill leachates: a
review. International Journal of Environmental. Analytical Chemistry, 82, 415-430
Jokela J.P.Y., Kettunen R.H., Sormunen K.M., Rintala J.A. (2002). Biological nitrogen removal from
municipal landfill leachate: low-cost nitrification in biofilters and laboratory scale in-situ denitrification.
Water Research, 36, 4079–4087.
Kargi F., Pamukoglu M. Y. (2003). Aerobic biological treatment of pre-treated landfill leachate by fed-
batch operation. Enzyme and Microbial Technology, 33, 588–595.
Kawai M., Purwanti I.F., Nagao N., Slamet A., Hermana J., Tod T. (2012). Seasonal variation in chemical
properties and degradability by anaerobic digestion of landfill leachate at Benowo in Surabaya,
Indonesia. Journal of Environmental Management, 110, 267-275.
Keisuke I., Naeimeh J. N., Mohamed G. E. (2006) Degradation of aqueous pharmaceuticals by ozonation
and advanced oxidation processes: A review. The Journal of the International Ozone Association, 28,
353-414.
Kennedy K. J. And Lentz E. M. (2000). Treatment of landfill leachate using sequencing batch and
continuous flow upflow anaerobic sludge blanket (UASB) Reactors. Water Research, 34, 3640-3656.
Kettunen R. H., Hoilijoki T. H., Rintala J. A. (1996). Anaerobic and sequential anaerobic-aerobic
treatments of municipal landfill leachate at low temperature. Bio-resource Technology, 58, 31-40.
Kettunen R. H., J. A. Rintala (1998). Performance of an on-site UASB reactor treating leachate at low
temperature. Water Research, 32, 537-546.
Kheradmand S., Karimi-Jashni A., Sartaj M. (2010). Treatment of municipal landfill leachate using a
combined anaerobic digester and activated sludge system. Waste Management, 30, 1025–1031.
Khetan S. K., Collins T. J. (2007). Human Pharmaceuticals in the Aquatic Environment: A Challenge to
Green Chemistry. Chemical Reviews, 107, 2319-2364.
Kim Y. D., Lee D.G., (2009). Comparative study on leachate in closed landfill sites: focusing on seasonal
variations. Journal of Matter Cycles and Waste Management, 11, 174–182.
Kima D., Hong-Duck R., Man-Soo K., Jinhyeong K., Sang-Ill L. (2007). Enhancing struvite precipitation
potential for ammonia nitrogen removal in municipal landfill leachate. Journal of Hazardous Materials,
146, 81–85.
73 | P a g e
Kjeldsen P., Barlaz M. A., Rooker A. P., Baun A., Ledin A., Christensen T. H. (2002). Present and Long-
Term Composition of MSW Landfill Leachate: A Review. Critical Reviews in Environmental Science and
Technology, 32, 297-336.
KLinde K., Jonsson A., Wimmerstedt R. (1995). Treatment of three types of landfill leachate with reverse
osmosis. Desalination, 101, 21-30.
K'oreje K. O., Demeestere K., De Wispelaere P., Vergeynst L., Dewulf J., Van Langenhove H. (2012). From
multi-residue screening to target analysis of pharmaceuticals in water: Development of a new approach
based on magnetic sector mass spectrometry and application in the Nairobi River basin, Kenya. Science
of the Total Environment, 437, 153–164.
Kümmerer K. (2009) Antibiotics in the aquatic environment – A review – Part I. Chemosphere 75 417–
434
Kurniawan T. A., Wai-hung L. (2009). Removal of refractory compounds from stabilized landfill leachate
using an integrated H2O2 oxidation and granular activated carbon (GAC) adsorption treatment. Water
Research, 43, 4079 – 4091.
Kurniawan T. A., Wai-Hung L., Chan G.Y.S. (2006). Degradation of recalcitrant compounds from stabilized
landfill leachate using a combination of ozone-gac adsorption treatment. Journal of Hazardous
Materials, B137, 443–455.
Kurniawan T. A., Wai-hung L., Chan G.Y.S. (2006). Radicals-catalyzed oxidation reactions for degradation
of recalcitrant compounds from landfill leachate. Chemical Engineering Journal, 125, 35–57.
Laitinen N., Luonsi A., Vilen J. (2006). Landfill leachate treatment with sequencing batch reactor and
membrane bioreactor. Desalination, 191, 86–91.
Lanzky P. F. and Haning-Sorensen B. (1997). The toxic effect of the antibiotic metronidazole on aquatic
organisms. Chemosphere, 35, 2553-2561.
Liu X., Xiao-Ming L., Qi Y., Xiu Y., Ting-Ting S., Wei Z., Kun L., Yi-Hu S., Guang-Ming Z. (2012). Landfill
leachate pretreatment by coagulation–flocculation process using iron-based coagulants: Optimization by
response surface methodology. Chemical Engineering Journal, 200-202, 39-50.
Liyana S., Youcai Z., Weimin S., Ziyang L. (2009). Hydrophobic organic chemicals (HOCs) removal from
biologically treated landfill leachate by powder-activated carbon (PAC), granular-activated carbon (GAC)
and biomimetic fat cell (BFC). Journal of Hazardous Materials, 163, 1084–1089.
Mahugo-Santana C., Sosa-Ferrera Z., Torres-Padro M. E., Santana-Rodrı´guez. J. J. (2011). Application of
new approaches to liquid-phase microextraction for the determination of emerging pollutants. Trends in
Analytical Chemistry, 30, 5
Matošić M., Terzić S., Korajlija Jakopović H., Mijatović I., Ahel M. (2008). Treatment of a Landfill Leachate
Containing Compounds of Pharmaceutical Origin. Water science technology, 58, 597-602
74 | P a g e
Meeroff D. E., Bloetscher F., Reddy D.V., Gasnier F., Swapnil J., McBarnette A., Hatsuko H. (2012).
Application of photochemical technologies for treatment of landfill leachate. Journal of Hazardous
Materials 209, 299– 307.
Mehmood M.K., Adetutu E., Nedwell D.B., Ball A.S. (2009). In situ microbial treatment of landfill leachate
using aerated lagoons. Bioresource Technology, 100, 2741–2744.
Melody B. J. and Mehrvar M. (2008). Aqueous Metronidazole Degradation by UV/H2O2 Process in
Single-and Multi-Lamp Tubular Photoreactors: Kinetics and Reactor Design. Industrial and Engineering
Chemistry Research, 47, 6525–6537
Metzger J. W. (2004). Drugs in municipal landfills and landfill leachate. Pharmaceuticals in the
environment sources, fate, effects and risks. Kummerer K. ed. 2nd Edition springerlink Heidelberg,
Germany.
Monserrat C., Damia B., (2001). Characterization of organic pollutants in textile waste waters and landfill
leachate by using toxicity based fractionation methods followed by liquid and gas chromatography
coupled to mass spectrometric detection. Analytica Chimica Acta, 426, 253-264.
Muhammad U., Hamidi A. A., Mohd S. Yusoff (2010). Variability of Parameters Involved in Leachate
Pollution Index and Determination of LPI from Four Landfills in Malaysia. International Journal of
Chemical Engineering, 2010, 56-61.
Murray H. E., Beck J. N. (1990). Concentrations of Synthetic Organic Chemicals in Leachate from a
Municipal Landfill Environmental Pollution, 67, 195-203.
Musson S. E., Townsend T. G. (2009). Pharmaceutical compound content of municipal solid waste.
Journal of Hazardous Materials, 162, 730–735.
Neczaj E., Okoniewska E., Malgorzata K. (2005). Treatment of landfill leachate by sequencing batch
reactor. Desalination, 185, 357–362.
Nikolaou A., Meric S., Fatta D. (2007). Occurrence patterns of pharmaceuticals in water and wastewater
environments. Analitical and Bioanalitical Chemistry, 387, 1225 – 1234.
Ntampou X., Zouboulis A.I., Samaras P. (2006) Appropriate combination of physico-chemical methods
(coagulation/flocculation and ozonation) for the efficient treatment of landfill leachates. Chemosphere,
62, 722–730.
OECD (1998). Environmental performance reviews: Belgium.
OIC (2013). Pharmaceuticals industry in OIC member countries production, consumption and trade.
Available at www.sesric.org/files/article/433.pdf last visited on 1st July 2013.
75 | P a g e
Oller I., Malato S., Sánchez-Pérez J.A. (2011). Combination of advanced oxidation processes and
biological treatments for wastewater decontamination—A review. Science of the Total Environment,
409, 4141–4166.
Oman C., Hynning P. (1993). Identification of organic compounds in municipal landfill leachates.
Environmental Pollution, 80, 265-271.
Országh J., Horváth G., Matejčík Š., Skalný J. D., Mason N. J. (2007). The Ozone Generation in Positive
and Negative DC Corona Discharges Fed by Dry Oxygen: Effect of Gas Flow Rate. 28th ICPIG, July 15-20,
2007, Prague, Czech Republic.
Peters T. A. (1998). Purification of landfill leachate with reverse osmosis and nanofiltration. Desalination,
119, 289-293.
Petrisor I. G., Lazar I. (2006). Emerging contaminats – the problem, examples and bioremediation
alternatives part 1. Roumanian Biotechnological Letters, 11, 2693.
Reinhart D. R. (1993). A review of recent studies on the sources of harzadous compounds emitted from
solid waste landfills. Waste management and research, 11, 257-268.
Renou S., Givaudan J. G., Poulain S., Dirassouyan F., Moulin P. (2008) Review: Landfill leachate
treatment: Review and opportunity. Journal of Hazardous Materials, 150, 468–493.
Richardson M. L. and Bowron J. M. (1985). The fate of pharmaceutical chemicals in the aquatic
environment. Journal of Pharmacy and Pharmacology, 37, 1-12.
Rico-Martinez R., Arias-Almeida J. C., Alejandro I., Pérez-Legaspi, Alvarado-Flores J., Retes-Pruneda J. L.
(2013). Adverse Effects of Herbicides on Freshwater Zooplankton available at www.intechopen.com last
visited on 20/06/2013.
Robinson H. D., Grantham G. (1988). The treatment of landfill leachates in on-site aerated lagoon plants:
experience in Britain and Ireland. Water Research, 22, 733-747.
Rocha E. M.R., Vıtor J.P. V., Fonseca A., Saraiva I., Boaventura R. A. R. (2011). Landfill leachate treatment
by solar-driven AOPs. Solar Energy, 85, 46–56.
Rodrı´guez-Navas C., Erland B., Søren A. B., Martin H., Krogh K. A., Fernando M., Rafael F., Vı´ctor C.
(2013). Pollution Pathways of Pharmaceutical Residues in the Aquatic Environment on the Island of
Mallorca, Spain. Archives of Environmental Contamination and Toxicology, 1-11.
Rubio J., Souza M.L., Smith R.W. (2002). Overview of flotation as a wastewater treatment technique.
Minerals Engineering, 15, 139–155.
Schneider C., Kuch B., Braun M., Metzger J. W. (2013)Pharmaceuticals in landfill leachates and receiving
WWTP influents.
76 | P a g e
Schwarzbauer J., Sabine H., Sabine B., Ralf L. (2002). Occurrence and alteration of organic contaminants
in seepage and leakage water from a waste deposit landfill. Water Research, 36, 2275–2287.
Sector guidance note IPPC S.5; (2007). PPC technical guidance for treatment of landfill leachate.
Seredynska-Sobecka B., Tomaszewska M., Morawski A. W. (2005). Removal of micro-pollutants from
water by ozonation/biofiltration process. Desalination, 182, 151-157.
Shemer H., Kunukcu Y. K., Linden K. G. (2006). Degradation of the pharmaceutical Metronidazole via UV,
Fenton, and photo-Fenton processes. Chemosphere, 63, 269.
Singh S.K., Tang W. Z. (2013). Statistical analysis of optimum Fenton oxidation conditions for landfill
leachate treatment. Waste Management, 33, 81–88.
Sír M., Podhola M., Patoˇcka T., Honzajková Z., Kocurek P., Kubal M., Kura M. (2012). The effect of humic
acids on the reverse osmosis treatment of hazardous landfill leachate. Journal of Hazardous Materials,
207–208, 86–90.
Slack R. J., Gronow J. R., Hall D. H., Voulvoulis N. (2007). Household hazardous waste disposal to landfill:
Using LandSim to model leachate migration. Environmental Pollution, 146, 501-509.
Slack R.J., Gronow J.R., Voulvoulis N. (2005). Household hazardous waste in municipal landfills:
contaminants in leachate. Science of the Total Environment, 337, 119– 137.
Spanoghe P. (2012). Obsolete pesticide stocks lecture slides. Department of crop protection chemistry,
Ghent University.
Stuart M., Lapworth D., Crane E., Hart A. (2012). Review of risk from potential emerging contaminants in
UK groundwater. Science of the Total Environment, 416, 1–21.
Timur H., Ozturk I. (1999). Anaerobic Sequencing Batch Reactor Treatment of Landfill Leachate. Water
Research, 33, 3225-3230.
Tizaoui C., Bouselmi L., Mansouri L., Ghrabi A. (2007). Landfill leachate treatment with ozone and
ozone/hydrogen peroxide systems. Journal of Hazardous Materials, 140, 316–324.
Trebouet D., Schlumpf J. P., Jaouen P., Quemeneur F. (2001). Stabilized Landfill Leachate Treatment by
Combined Physicochemical–Nanofiltration Processes. Water Research, 35, 2935–2942.
Ushikoshi K., Kobayashi T., Uematsu K., Toji A., Kojima D., Matsumoto K. (2002). Leachate treatment by
the reverse osmosis system. Desalination, 150, 121-129.
Uyaguari M., Key P., Moore J., Jackson K., Scott G. (2009). Acute Effects of the Antibiotic Oxytetracycline
on the Bacterial Community of the Grass Shrimp, Palaemonetes Pugio. Environmental Toxicology and
Chemistry, 28, 2715–2724.
77 | P a g e
Uygur A., Kargı F. (2004). Biological nutrient removal from pre-treated landfill leachate in a sequencing
batch reactor. Journal of Environmental Management, 71, 9–14.
VLAREM II Order of the Flemish Government of 1 June 1995 concerning General and Sectoral provisions
relating to Environmental Safety, subsection 5.2.5.6. Operation, closure and after-care.
Von Sonntag C., Von Gunten U. (2012). Chemistry of ozone in water and waste water treatment from
basic principles to application. IWA publishing, UK.
Wei L., Qixing Z., Tao H. (2010). Removal of Organic Matter from Landfill Leachate by Advanced
Oxidation Processes: A Review. International Journal of Chemical Engineering, 2010, 46-55.
Westerhoff P., Aiken M. G., Amy G., J. Debroux (1999). Relationships between the Structure of Natural
Organic Matter and Its Reactivity towards Molecular Ozone and Hydroxyl Radicals Water Research, 33,
2265-2276.
WHO (2009). Recommended classification of pesticides by hazard and guidelines to classification
Germany
WHO (2013). http://apps.who.int/medicinedocs/en/d/Js6160e/8.html accessed on the 13/05/2013
WHO report (2011). Pharmaceuticals in Drinking-water.
Wikipedia (2013). available at en.wikipedia.org/wiki/Sulfadoxine last visited on 15th August 2013
Wiszniowski J., Robert D., Surmacz-Gorska J., Miksch K., Weber J. V., (2006). Landfill Leachate Treatment
Methods: A Review. Environmental Chemistry Letters, 4, 51-61.
Yasuharaa A., Hiroaki S., Masataka N., Takashi Y., Takashi U., Osami N., Tameo O., Katashi K., Hiroshi F.,
Makoto N., Yusaku O., Yasunori K., Kenzo B., Yukio N. (1997). Determination of organic components in
leachates from hazardous waste disposal sites in Japan by gas chromatography–mass spectrometry.
Journal of Chromatography A, 774, 321–332.
Yiping X., Zhou Y., Wang D., Chen S., Liu J., Wang Z. (2008). Occurrence and removal of organic
micropollutants in the treatment of landfill leachate by combined anaerobic-membrane bioreactor
technology. Journal of Environmental Sciences, 20, 1281–1287.
Young K., Wei-Jeng S., Yung-Shuen S. (1996). Decomposition Kinetics of Ozone in Aqueous Solution
Industrial Engineering Chemistry Research, 35, 3369-3374
Zhang C., Wang Y. (2009). Removal of dissolved organic matter and phthalic acid esters from landfill
leachate through a complexation–flocculation process. Waste Management, 29, 110–116
Zhao R., Novak J. T., Goldsmith C. D. (2012). Evaluation of on-site biological treatment for landfill
leachates and its impact: A size distribution study. Water research, 46, 3837-3848.
78 | P a g e
Zhu L., Junxin L. (2008). Landfill leachate treatment with a novel process: Anaerobic ammonium
oxidation (Anammox) combined with soil infiltration system. Journal of Hazardous Materials, 151, 202–
212.


