An overview of present & Future Of
Bangalore Metro Rail Project

Reach – 1
Reach – 3
Under Ground
Reach – 4
Reach – 2
South Extension
North Extension
Nagasandra
East West CorridorElevated Section 13.02 KmUnderground Section 4.88 KmElevated Stations 12Underground Stations 4
North South CorridorElevated Section 20.20 KmUnderground Section 4.00 KmElevated Stations 21Underground Stations 3
Srirampura
Sampige Road
KRMarket
National College
RVROAD
Attiguppe
Vijayanagar
Hosahalli
kempegowda
Sir.MV
CubbonPark
Halasuru
Indiranagar

PHASE 1EAST – WEST CORRIDOR 18.10 KMS
NORTH-SOUTH CORRIDOR 24.20 KMS TOTAL 42.30 KMS
Elevated Stations 33Underground Stations 7Total 40
GAUGE Standard GaugeTRACTION 750V dc Third RailSPEED Max 80Kmph ; Avg. 34Kmph TRAVEL TIME 33 / 44 Mins.
Bangalore Metro Rail Project
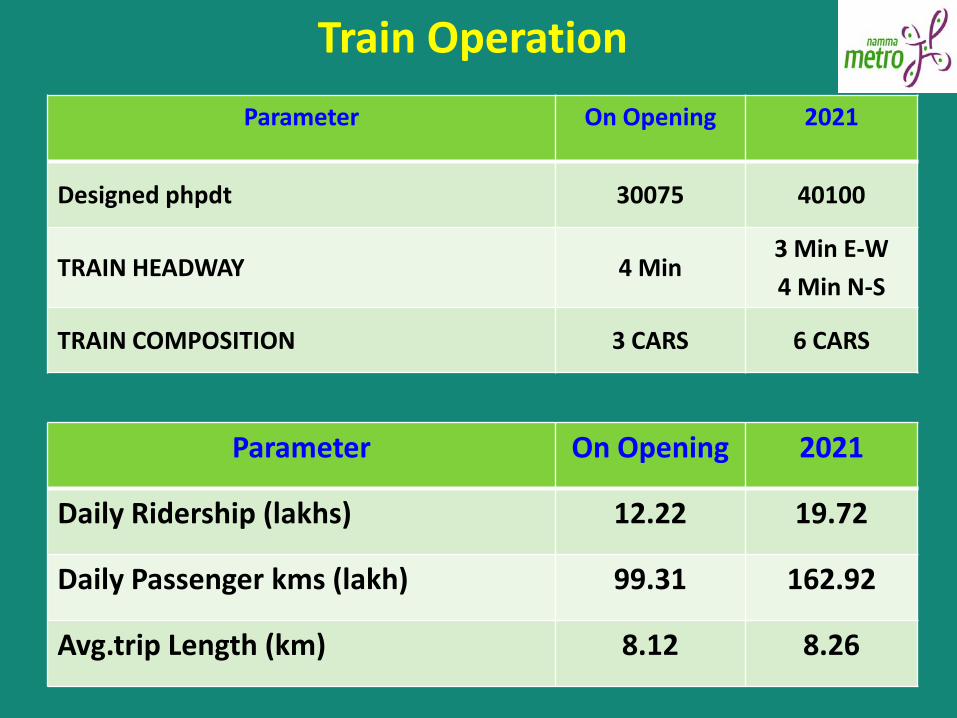
Train Operation
Parameter On Opening 2021
Daily Ridership (lakhs) 12.22 19.72
Daily Passenger kms (lakh) 99.31 162.92
Avg.trip Length (km) 8.12 8.26
Parameter On Opening 2021
Designed phpdt 30075 40100
TRAIN HEADWAY 4 Min3 Min E-W
4 Min N-S
TRAIN COMPOSITION 3 CARS 6 CARS
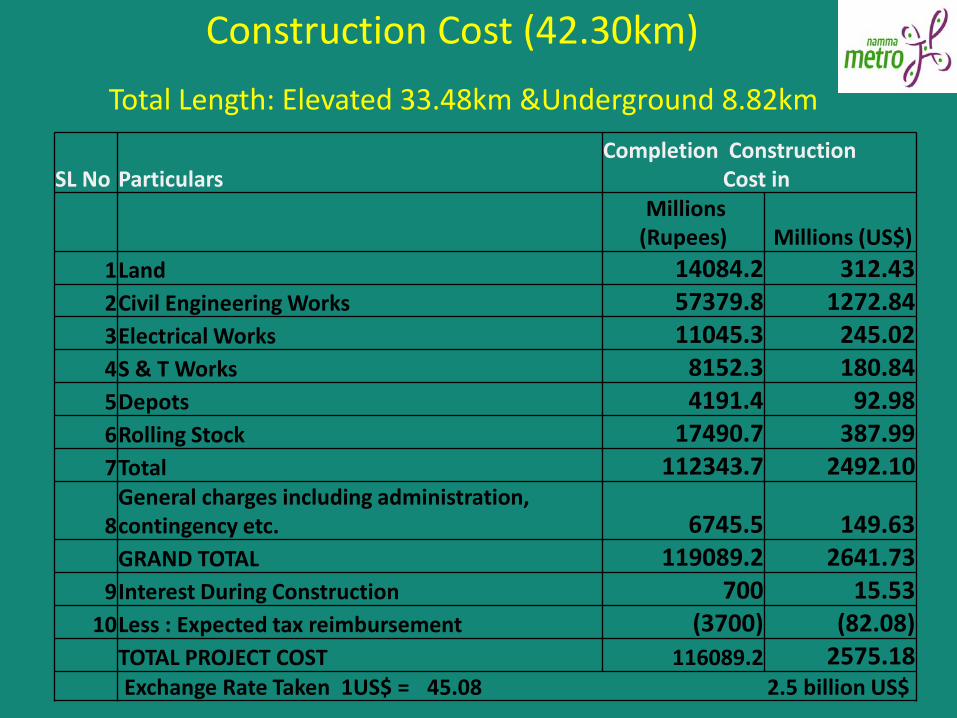
Construction Cost (42.30km)
Total Length: Elevated 33.48km &Underground 8.82km
SL No ParticularsCompletion Construction
Cost inMillions
(Rupees) Millions (US$)1Land 14084.2 312.432Civil Engineering Works 57379.8 1272.843Electrical Works 11045.3 245.024S & T Works 8152.3 180.845Depots 4191.4 92.986Rolling Stock 17490.7 387.997Total 112343.7 2492.10
8General charges including administration, contingency etc. 6745.5 149.63GRAND TOTAL 119089.2 2641.73
9Interest During Construction 700 15.5310Less : Expected tax reimbursement (3700) (82.08)
TOTAL PROJECT COST 116089.2 2575.18Exchange Rate Taken 1US$ =
`45.08 2.5 billion US$

Funding Pattern in CroresSl.
No.Particulars GoI GoK Total
1 Equity 1635 1635 3270
2 Subordinate Debt 1090 2215 3305
3 Sub total (1+2) 2725 3850 6575
4 Senior Term Debt (JICA &Others)
- - 5034
5 Grand Total (3+4) - - 11609 (100%)
Senior Term Debt - JICA 2849- ADB 1250 (under finalization)- SBI 800 - HUDCO 700

UNIQUE LAND PACKAGERehabilitation Allowances
Residential / Commercial Properties
RESIDENTIAL Shifting Allowance* Avg. Rs. 15000/- one time payment Inconvenience Allowance* Avg. Rs. 30000/- one time payment
Transitional Allowance Rs. 75000/- one time payment
Rental Income Lost Rs. 10/- per sq. ft. lost Right to salvage material Full TDR As applicable
COMMERCIAL Shifting Allowance* Avg. Rs. 15000/- one time paymentLoss of Business* Avg. Rs. 75000/- one time payment
Business Re-establishment* Avg. Rs. 240/- per sq. ft. for area lost
Rental Income lost Rs. 20/- per sq. ft. lost
Right to salvage material Full
TDR As applicable
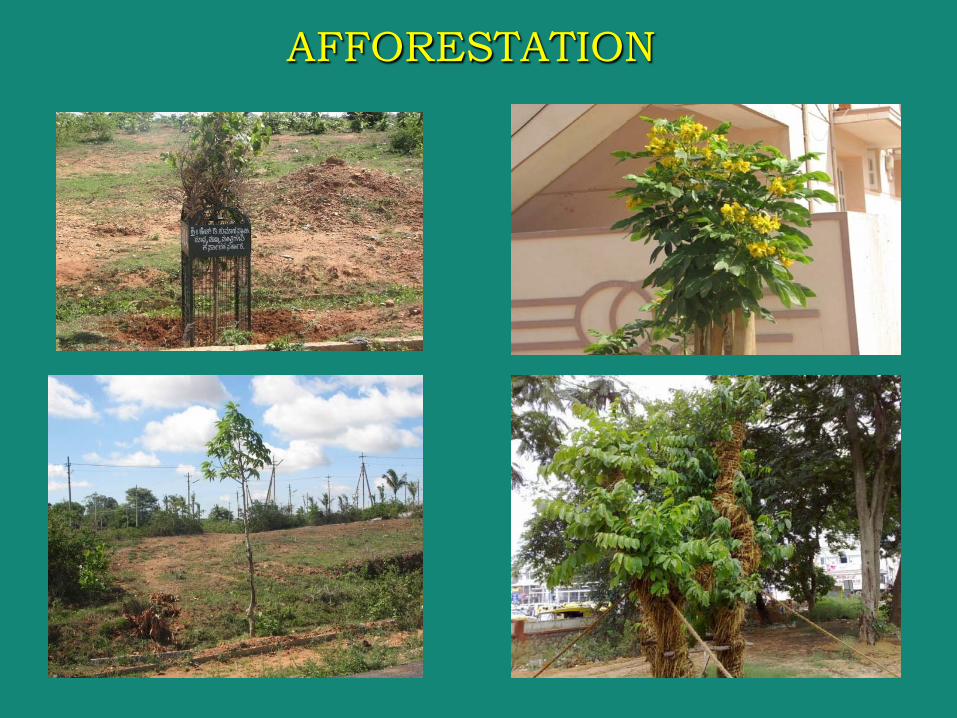
AFFORESTATION
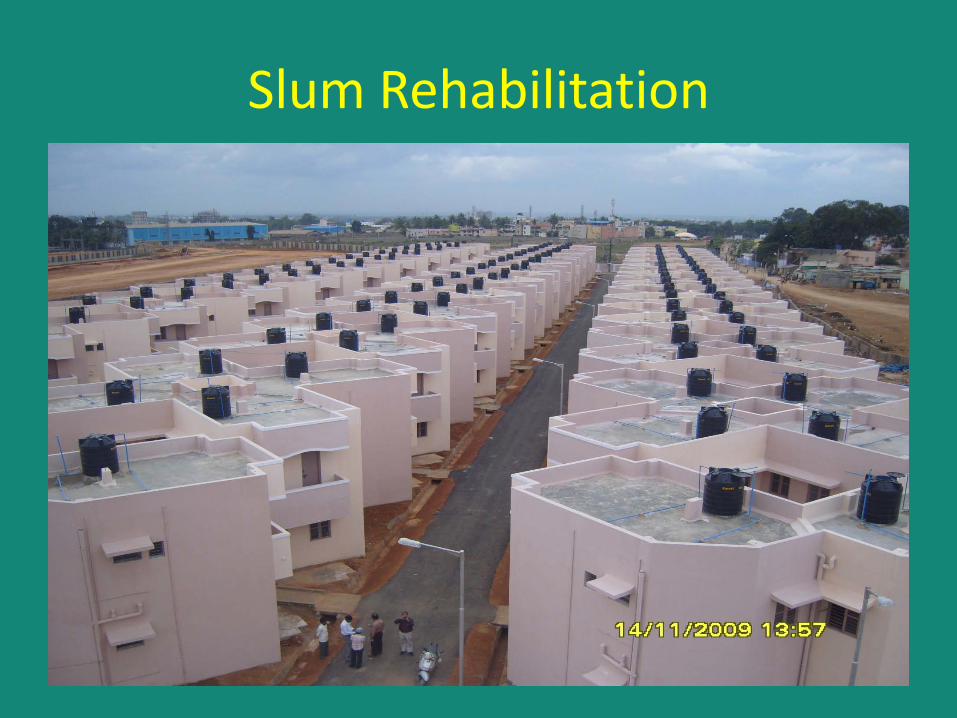
Slum Rehabilitation

YESHWANTHPUR
MAHALAKSHMI LAYOUT
MYSORE ROADTERMINAL
DEEPANJALINAGAR
VIJAYANAGAR
HOSAHALLITOLL GATE
MAGADI ROAD
CITY RLY STATION
MAJESTIC
CENTRALCOLLEGE
VIDHANASOUDHA
CRICKETSTADIUM
M G ROAD
TRINITYCIRCLE
ULSOOR
CMH ROAD
OLD MADRAS ROAD
B HALLITERMINAL
RAJAJINAGARKUVEMPU ROAD
MALLESWARAMSWASTIK
CHICKPET CITY MARKET
K R ROAD
LALBAGH
SOUTH ENDCIRCLE
JAYNAGARR V ROADTERMINAL
Huge Parking Lots
PEENYA DEPOT
JALAHALLI CROSSORR
PEENYA VILLAGE
ElevatedUnder GroundAt Grade
DASARAHALLI
Nagasandra
SOAP FACTORY
KSRTC, BMTC,SWR
KSRTC, BMTC
BMTC, BANASHANKARI
BMTC, KSRTC
KSRTC, BMTC,SWR
Seamless Travel INTEGRATIONKSRTC
BMTC,SWR
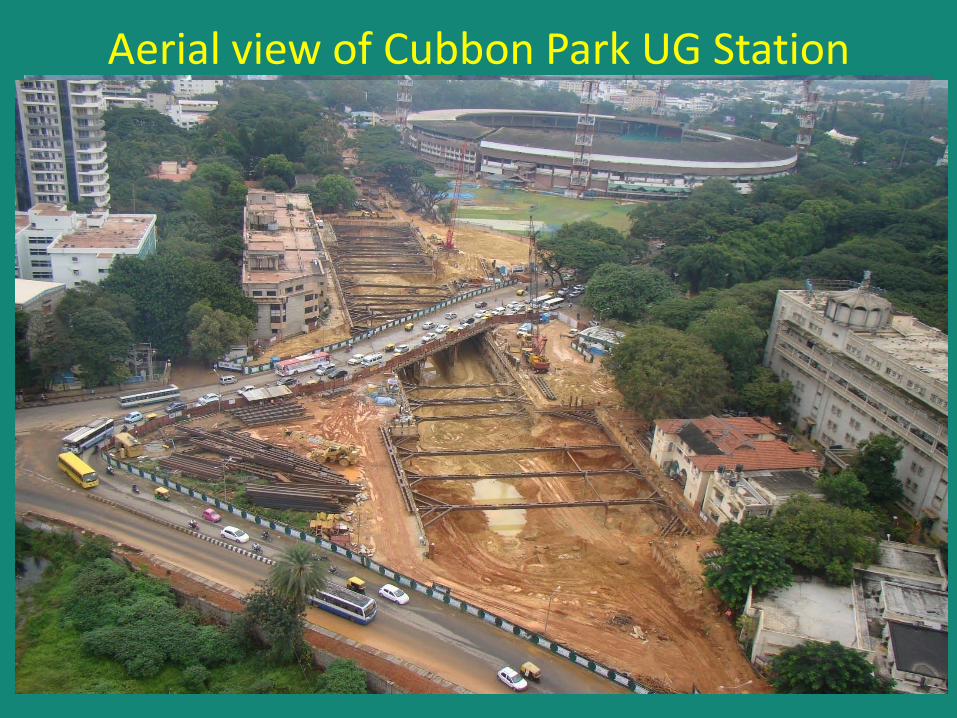
Aerial view of Cubbon Park UG Station
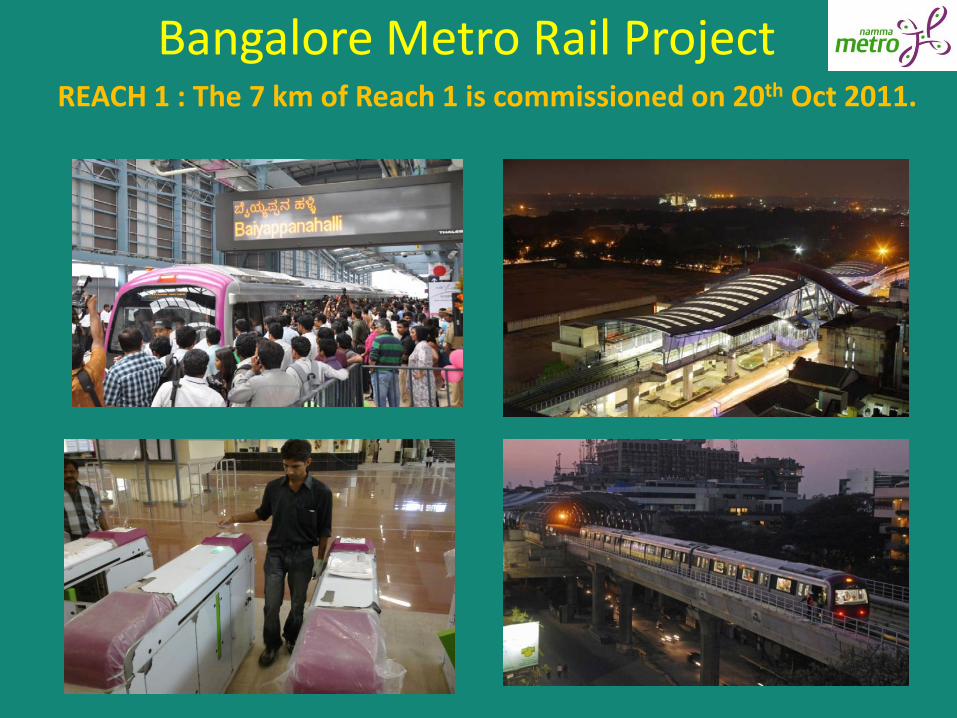
Bangalore Metro Rail ProjectREACH 1 : The 7 km of Reach 1 is commissioned on 20th Oct 2011.

Progress OfBangalore Metro Rail Project as on Jan’2012
15.00
4.00
1.00
8.00
4.50
12.00
5.00
3.00
1.502.00 2.00
7.008.00
2.00
16.00
1.00
8.00
15.00
3.91
0.81
6.61
2.30
0.35 0.35 0.700.10
1.991.11
1.40
3.89
1.03
9.06
0.221.40
0.00
2.00
4.00
6.00
8.00
10.00
12.00
14.00
16.00
18.00Te
nder
Fin
alis
atio
n
Land
Util
ities
Elev
ated
Str
uctu
res
(Via
duct
)
Stat
ions
-El
evat
ed &
at G
rade
Tunn
els
Stat
ions
-U
G
Perm
anen
t Way
Vent
ilatio
n an
d A
irco
nditi
onin
g
Dep
ot B
aiya
ppan
ahal
li
Dep
ot P
eeny
a
Trac
tion
and
Pow
er s
uppl
y
Sign
allin
g an
d Te
leco
mm
unic
atio
n
Aut
omat
ic F
are
Colle
ctio
n
Rolli
ng S
tock
Esca
lato
rs a
nd L
ifts
Fina
l Tes
ting
and
Com
mis
sion
ing
Overall Progress – 54%

Bangalore Metro Rail Project
Physical Progress up to Jan 2012
Percentage in terms of work executed 54.52%
Percentage in terms of tenders awarded 99%
Financial Progress up to Jan 2012
In Crore 6125In Percentage 52.76%

Bangalore Metro Rail Project
Peenya Depot - Yeshwanthpur -Sampige Road
December 2012
Peenya Depot - Hessarghatta cross March 2013
U/G Section E-W corridor December 2013
City Station - Mysore Road December 2013
K.R.Market - R.V Road - Puttenahallicross
December 2013
Commissioning Schedule

Phase- 2 alignment
Baiyappanahalli
Mysore Road
Hessaraghatta CrossBIEC
Anjanapura Township
Kengeri
Nagawara
IIMB Bommasandra
RV Road
White Field
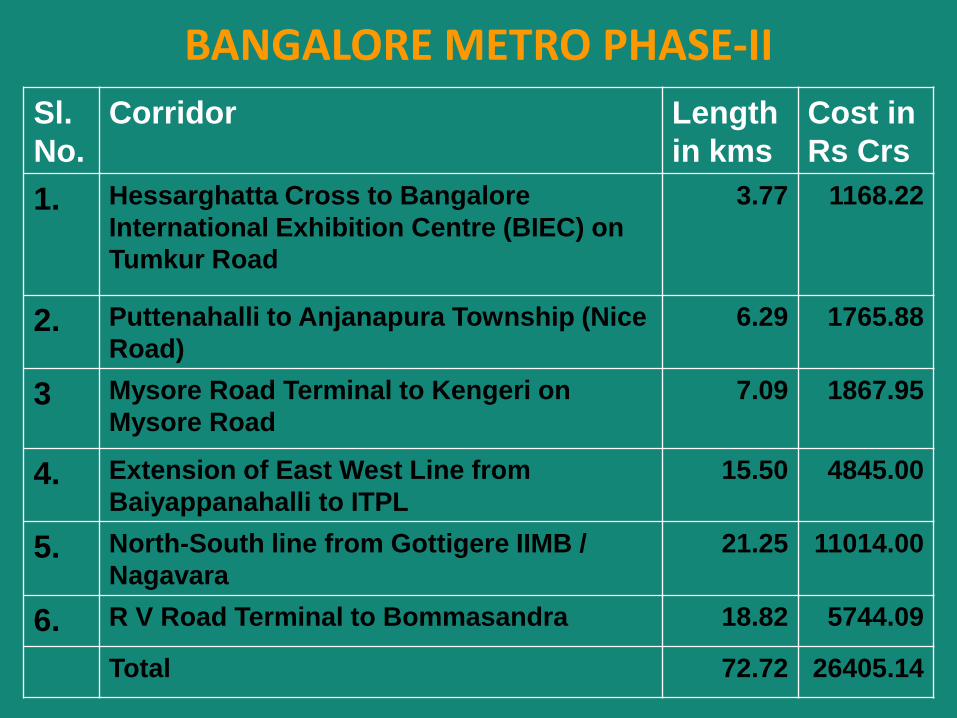
BANGALORE METRO PHASE-IISl. No.
Corridor Length in kms
Cost in Rs Crs
1. Hessarghatta Cross to Bangalore International Exhibition Centre (BIEC) on Tumkur Road
3.77 1168.22
2. Puttenahalli to Anjanapura Township (Nice Road)
6.29 1765.88
3 Mysore Road Terminal to Kengeri on Mysore Road
7.09 1867.95
4. Extension of East West Line from Baiyappanahalli to ITPL
15.50 4845.00
5. North-South line from Gottigere IIMB / Nagavara
21.25 11014.00
6. R V Road Terminal to Bommasandra 18.82 5744.09
Total 72.72 26405.14
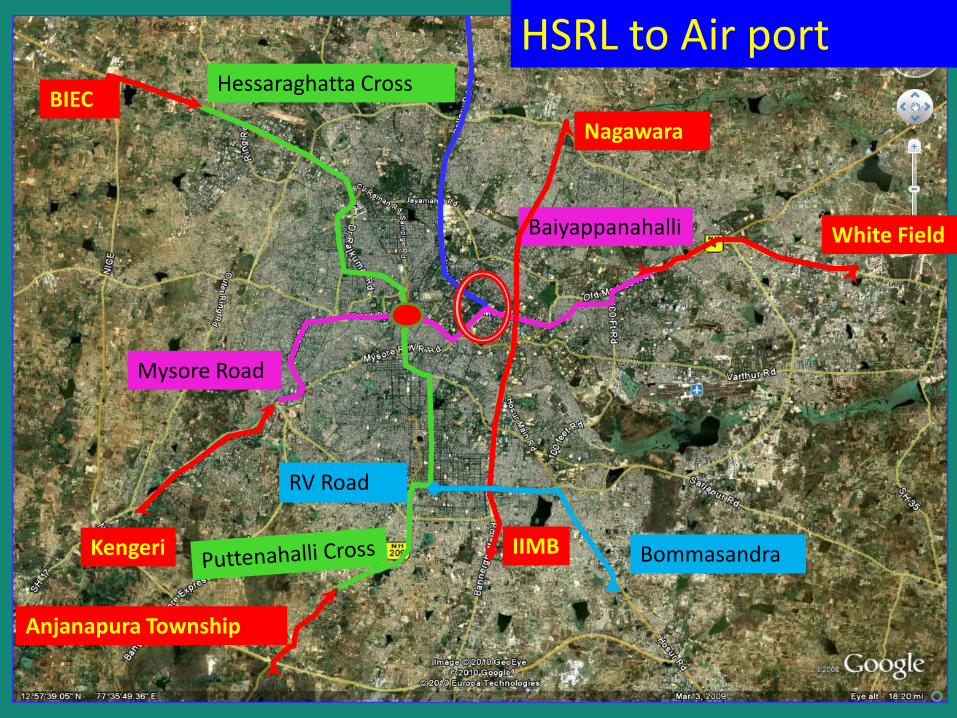
HSRL to Air port
Baiyappanahalli
Mysore Road
Hessaraghatta CrossBIEC
Anjanapura Township
Kengeri
Nagawara
IIMB
White Field
Bommasandra
RV Road

MG ROAD CAT – 0.095 KM
HEBBAL – 8.822 KM
YELAHANKA – 15.073 KM
DEVANHALLI AIRPORT – 33.25 KM
19
Bangalore Metro Rail Project
Thank You

By
Prof. Dr. S.L. Dhingra
Transportation System EngineeringDepartment of Civil Engineering
IIT Bombay, India([email protected])

Introduction
Transport Problems of Mumbai
Mumbai Metro
Salient Features of Proposed Metro Corridor
Study Need
Issues for Consideration
Study area
SP Model Building & Analysis
Social Cost - Benefit Analysis
Economic Cost Analysis
Summary & Conclusion

Of Late (about 10 years back)
GoI realized that the development of Infrastructure--- will
lead to
Economic Development--- but there were many
Uncertainty Issues

Desired State – Actual State Problem=
Goals Objectives
Desired State Much more Dynamic
Problems or issues can be reduced but can NEVER be eliminated
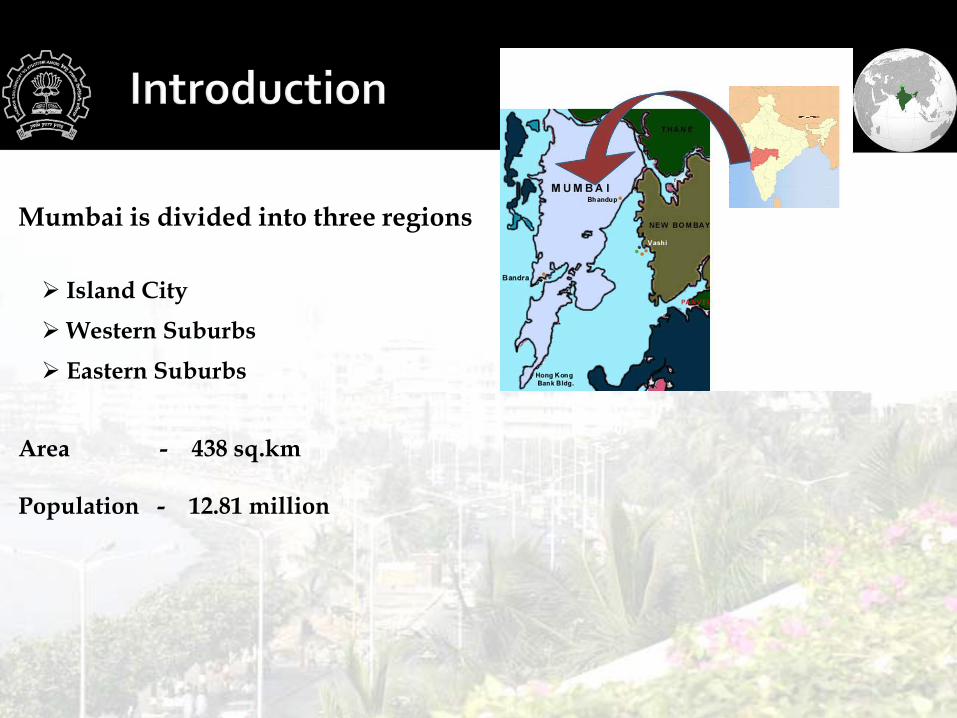
Mumbai is divided into three regions
Area - 438 sq.km
Population - 12.81 million
Island CityWestern Suburbs Eastern Suburbs

Heavy Traffic Congestion on Roads
Average Speed 10-12 kmph
Buses have even less speeds.
Intersection Delays
Corridor Congestion
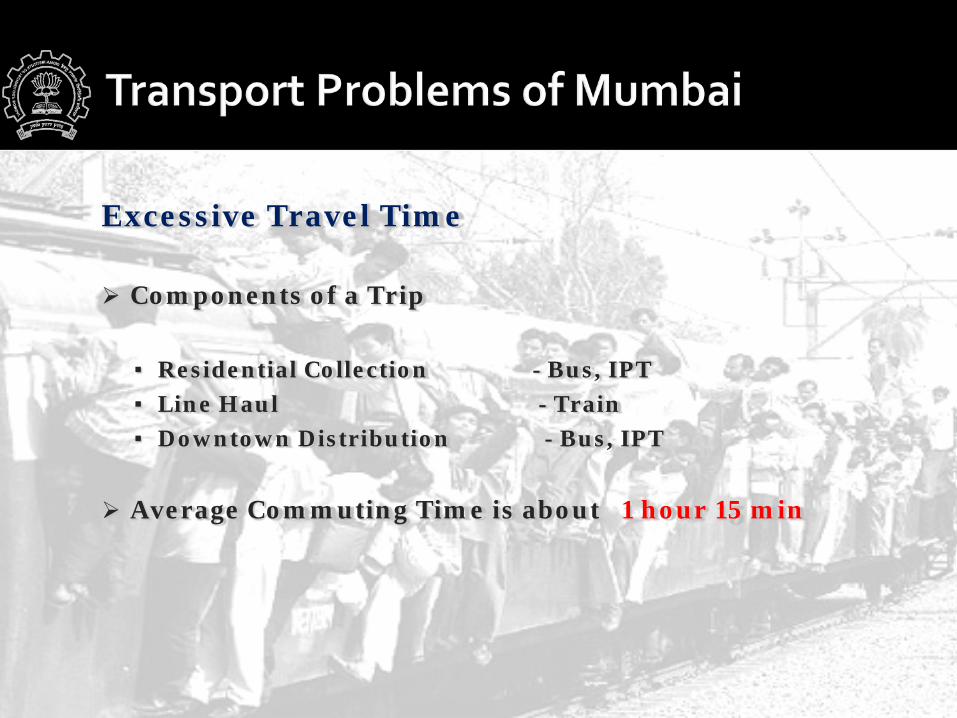
Excessive Travel Time
Components of a Trip
▪ Residential Collection - Bus, IPT
▪ Line Haul - Train
▪ Downtown Distribution - Bus, IPT
Average Commuting Time is about 1 hour 15 min
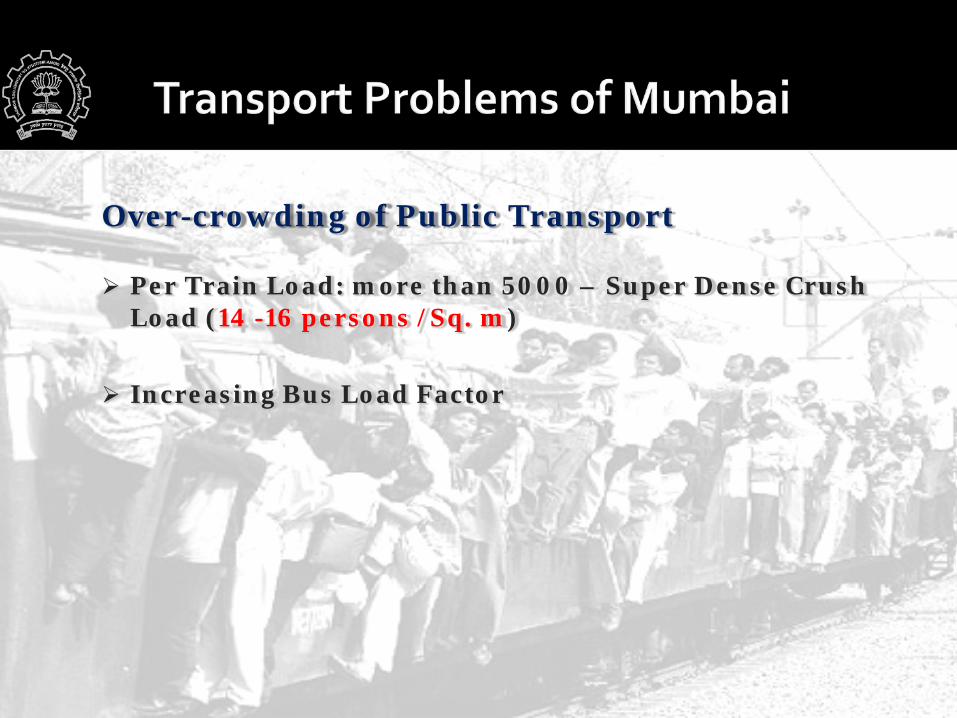
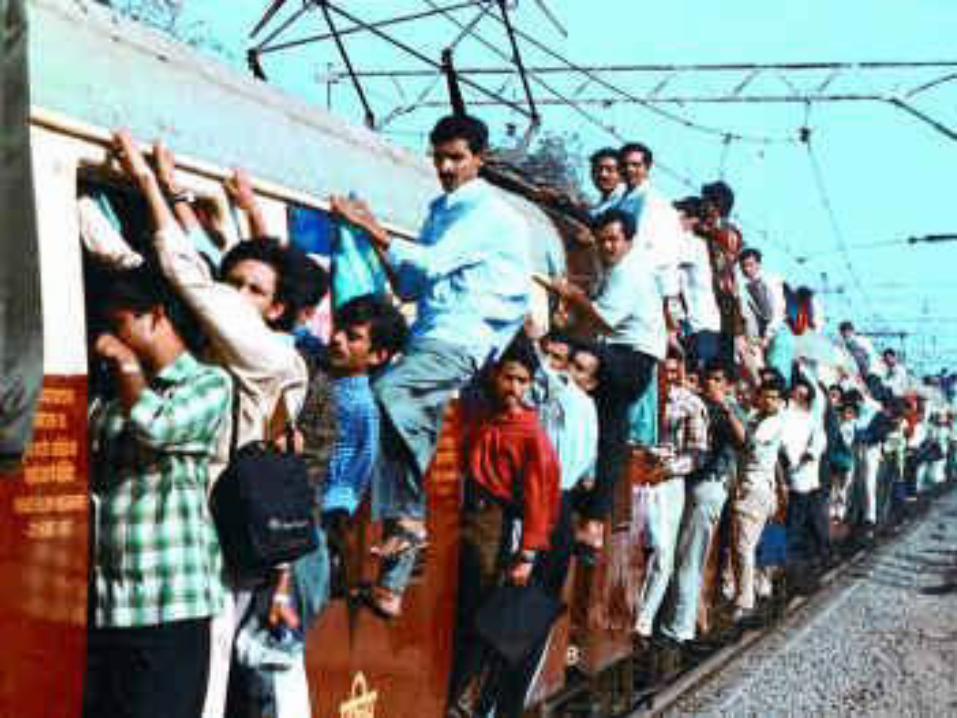
Over-crowding of Public Transport
Per Train Load: more than 5000 – Super Dense Crush Load (14 -16 persons /Sq. m)
Increasing Bus Load Factor
There are innumerable possibilities in the road sectorbut the major hurdle is the ownership of the facility.
The earlier passion allowed the tolls to be collected bythe Govt. Only, and then to transfer to the private party
Lack of maintenance funds Extremely bureaucratic setup of the administrative
structures, not responsive to user needs. Lack of clearly defined responsibilities of the central and
local governments for managing the network. Shortage of qualified technical staff, low salaries and few
incentives to perform better. Poor management information system.
Legal Issues
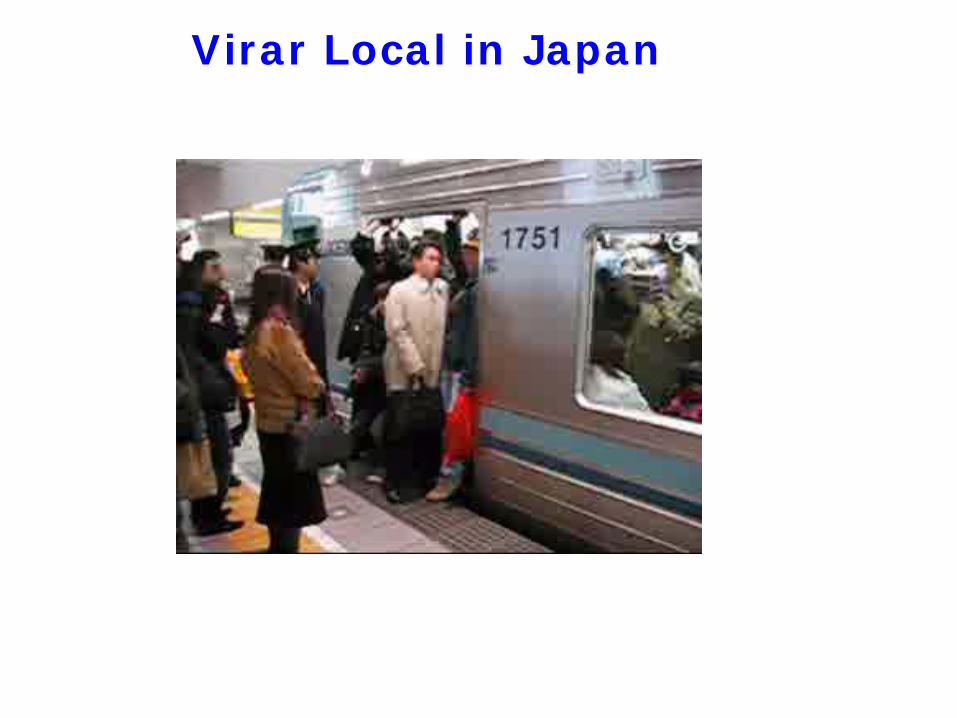
Virar Local in Japan

Census Year Number of UAs/Towns
Urban Population(in million)
Level of Urbanization %
1901 1827 25.85 10.84
1911 1815 25.20 10.29
1921 1949 28.08 11.18
1931 2072 33.45 11.99
1941 2250 44.15 13.86
1951 2843 62.44 17.29
1961 2365 78.93 17.57
1971 2590 109.11 19.91
1981 3378 159.46 23.34
1991 3368 217.71 25.72
Source: Census of India Report
Urbanization trends in INDIA
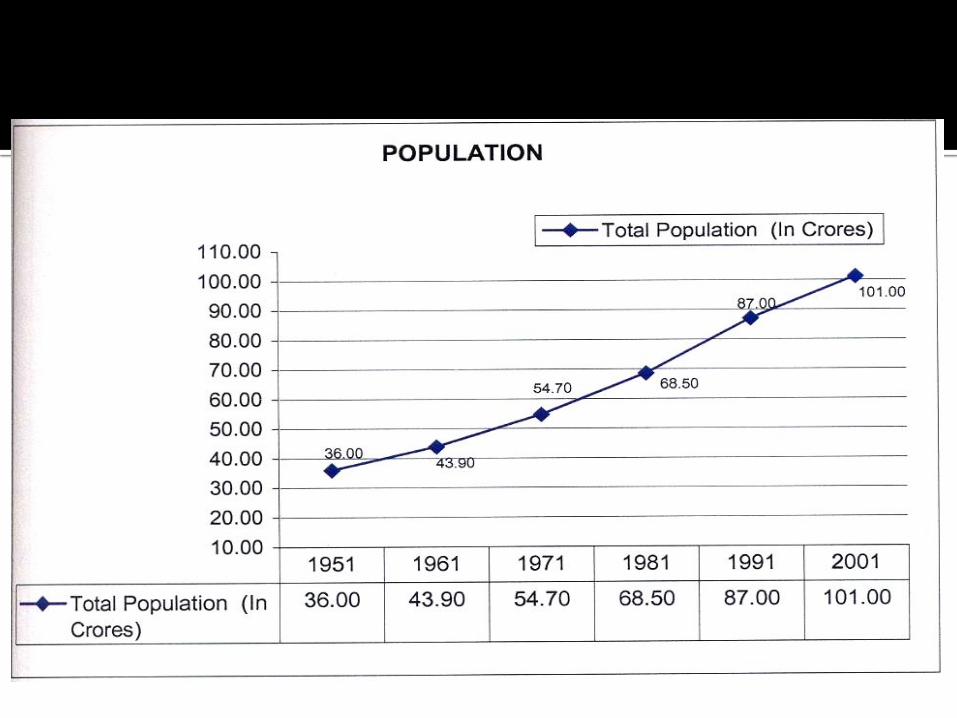
Population in India

Metro Cities 1992 1993 1994 1995 1996 1997 1998Ahmedabad 419 449 478 510 572 631 686Bangalore 605 654 716 796 900 972 1130Bhopal 144 154 165 179 223 242 237Calcutta 497 517 545 561 588 588 664Chennai 604 641 689 768 812 890 975Cochin 32 36 42 52 197 226 NACoimbatore 74 93 115 172 241 256 310Delhi 1963 2097 2239 2432 2630 2848 3033Hyderabad 485 520 543 557 764 769 887Indore 238 253 267 289 325 361 399Jaipur 292 314 339 368 405 449 492Kanpur 186 196 209 223 247 247 282Lucknow 235 249 266 282 303 331 360Ludhiana 220 238 258 291 321 359 NAMadurai 42 50 57 81 117 122 156Mumbai 647 546 608 667 724 797 860Nagpur 168 176 185 198 213 239 270Patna 191 197 201 209 220 220 245Pune 296 313 331 358 412 468 527Surat 223 243 271 301 331 362 399Vadodara 179 193 212 235 275 332 361Varanasi 126 135 146 157 169 184 199Visakhapatnam 163 163 165 183 201 207 219Data relates to district N.A: Not Available
Total Registered Motor Vehicles In Metropolitan Cities of India (1992-98)
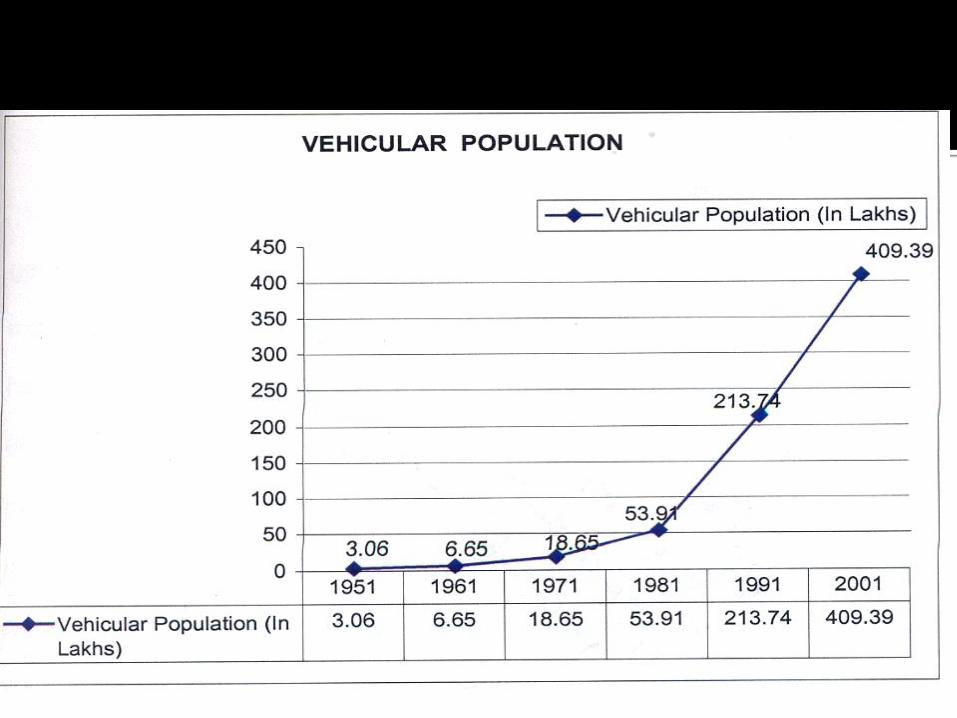
Vehicular Population in India

Sector wise distribution of Pollution:Transport 64%Power 04%Domestic 15%Industrial 17%
Ambient Air Quality at Mahim Junction
8090 – 107Nox2001144 – 3170SPM
8043 – 120SO2
Limits (µgm/Nm3)
Observed (µgm/Nm3)
Item
Air Pollution in Mumbai

Enormous Growth in Population and Activities (Employment)
Enormous Growth in Vehicles
Skewed Land use Distribution
Highly Inadequate Public Transport
Lack of Pedestrian Facilities
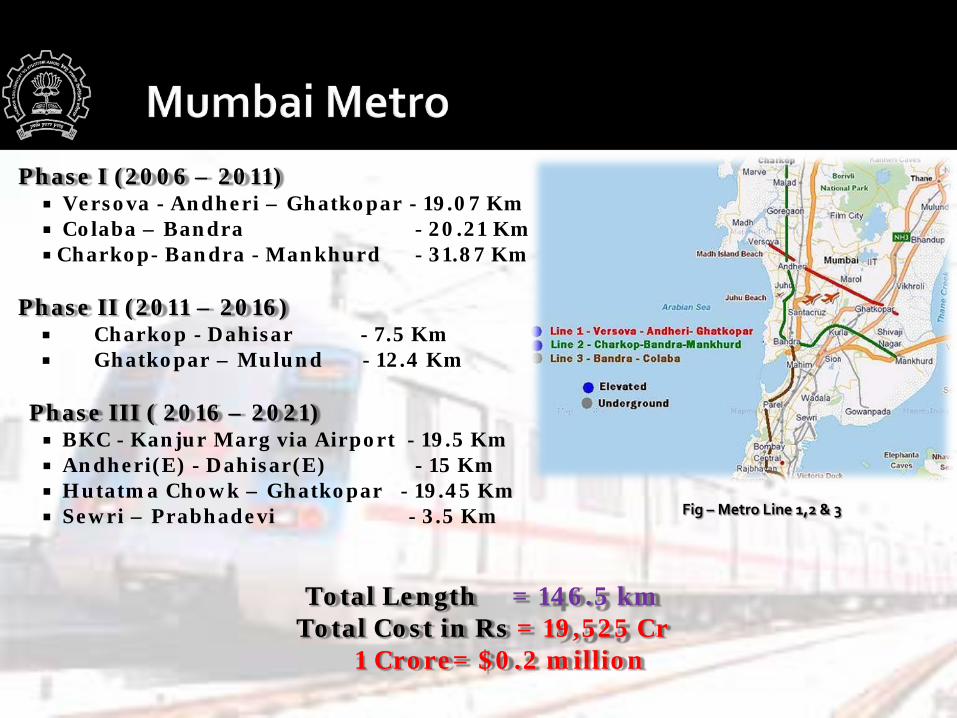
Phase I (2006 – 2011) Versova - Andheri – Ghatkopar - 19.07 Km Colaba – Bandra - 20.21 Km Charkop- Bandra - Mankhurd - 31.87 Km
Phase II (2011 – 2016) Charkop - Dahisar - 7.5 Km Ghatkopar – Mulund - 12.4 Km
Phase III ( 2016 – 2021) BKC - Kanjur Marg via Airport - 19.5 Km Andheri(E) - Dahisar(E) - 15 Km Hutatma Chowk – Ghatkopar - 19.45 Km Sewri – Prabhadevi - 3.5 Km
Total Length = 146.5 km Total Cost in Rs = 19,525 Cr
1 Crore= $0.2 million
Fig – Metro Line 1,2 & 3
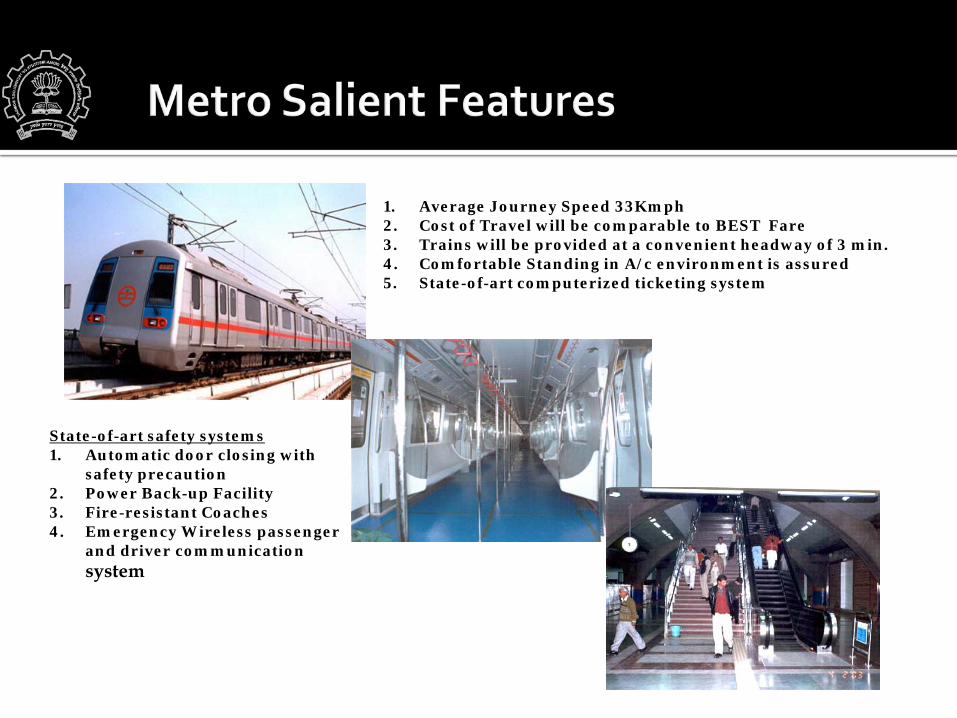
1. Average Journey Speed 33Kmph2. Cost of Travel will be comparable to BEST Fare 3. Trains will be provided at a convenient headway of 3 min.4. Comfortable Standing in A/c environment is assured5. State-of-art computerized ticketing system
State-of-art safety systems1. Automatic door closing with
safety precaution2. Power Back-up Facility3. Fire-resistant Coaches4. Emergency Wireless passenger
and driver communication system
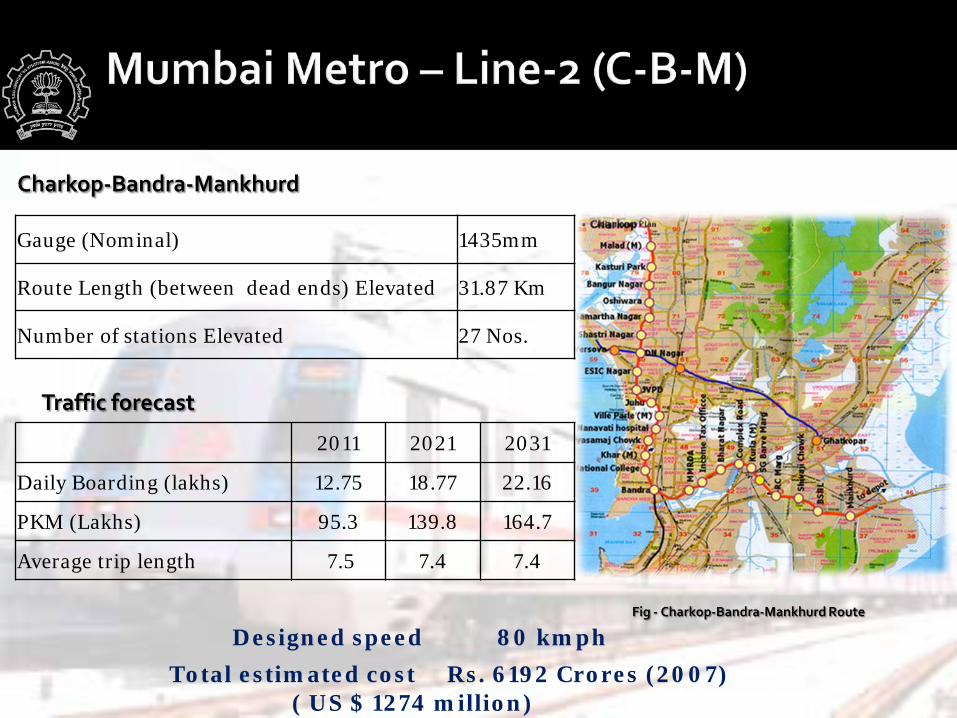
Charkop-Bandra-Mankhurd
Gauge (Nominal) 1435mm
Route Length (between dead ends) Elevated 31.87 Km
Number of stations Elevated 27 Nos.
2011 2021 2031
Daily Boarding (lakhs) 12.75 18.77 22.16
PKM (Lakhs) 95.3 139.8 164.7
Average trip length 7.5 7.4 7.4
Traffic forecast
Designed speed 80 kmph
Total estimated cost Rs. 6192 Crores (2007) ( US $ 1274 million)
Fig - Charkop-Bandra-Mankhurd Route

Sustainability
Social Need
Obligation from general people to EL metro
To find Long term benefits
Construction Cost
Infrastructure Cost
Land Acquisition Cost
Rehabilitation and Resettlement cost
Litigation Cost
Cost of Delays due to legal or other obstacles
Environmental Cost
Social Cost
Economic Cost
Impact of increase in FSI from
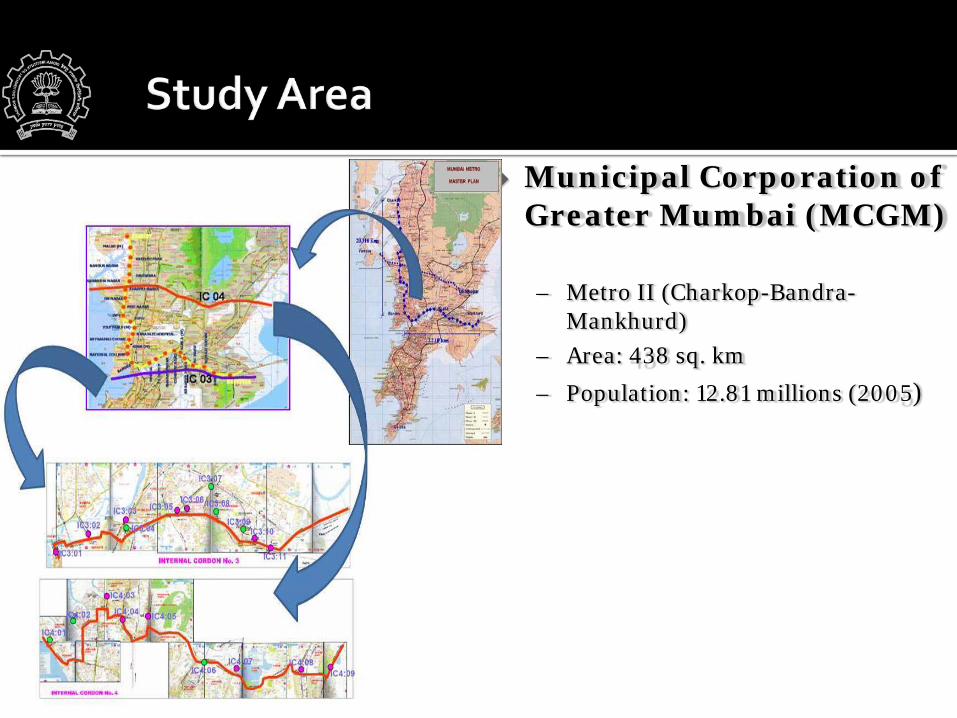
Municipal Corporation of Greater Mumbai (MCGM)
– Metro II (Charkop-Bandra-Mankhurd)
– Area: 438 sq. km
– Population: 12.81 millions (2005)
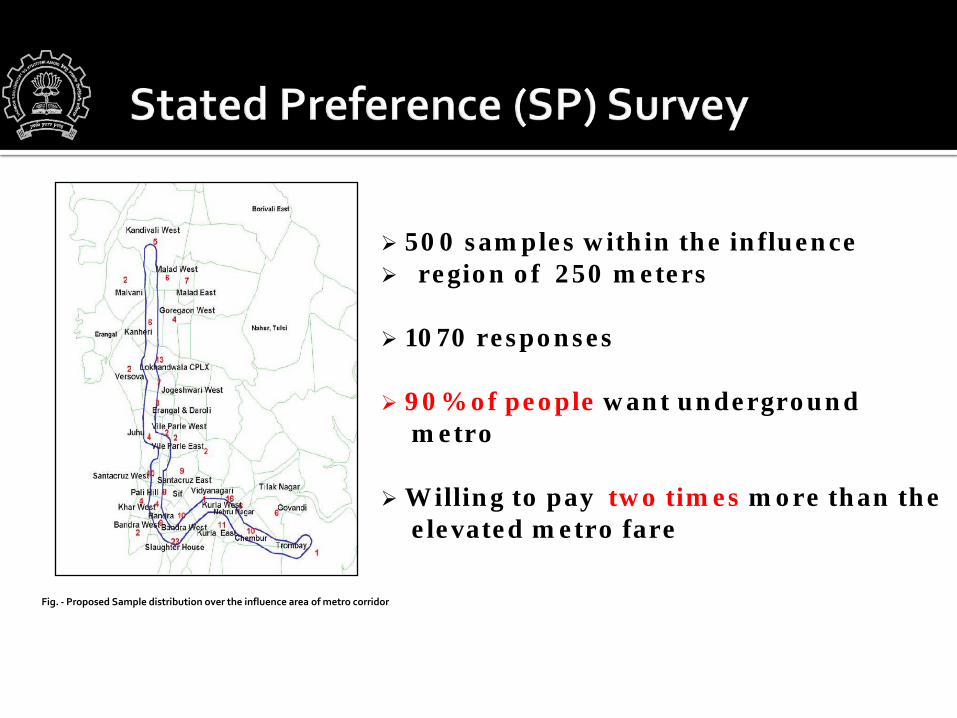
500 samples within the influence region of 250 meters
1070 responses
90% of people want underground metro
Willing to pay two times more than the elevated metro fare
Fig. - Proposed Sample distribution over the influence area of metro corridor
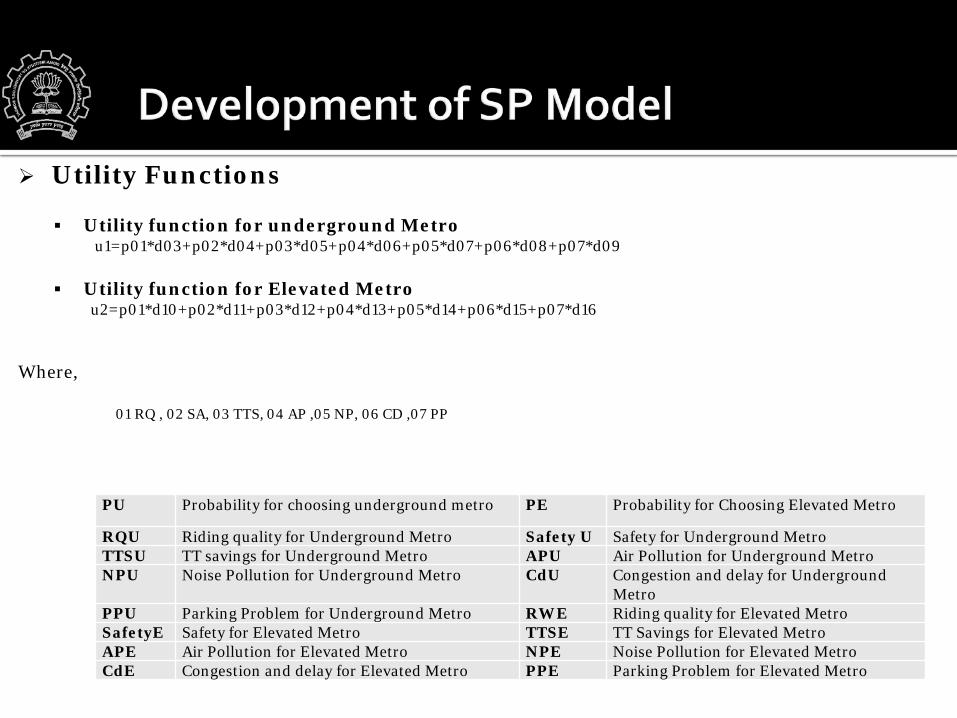
Utility Functions
Utility function for underground Metrou1=p01*d03+p02*d04+p03*d05+p04*d06+p05*d07+p06*d08+p07*d09
Utility function for Elevated Metrou2=p01*d10+p02*d11+p03*d12+p04*d13+p05*d14+p06*d15+p07*d16
Where,
01 RQ , 02 SA, 03 TTS, 04 AP ,05 NP, 06 CD ,07 PP
PU Probability for choosing underground metro PE Probability for Choosing Elevated Metro
RQU Riding quality for Underground Metro Safety U Safety for Underground Metro TTSU TT savings for Underground Metro APU Air Pollution for Underground MetroNPU Noise Pollution for Underground Metro CdU Congestion and delay for Underground
MetroPPU Parking Problem for Underground Metro RWE Riding quality for Elevated Metro SafetyE Safety for Elevated Metro TTSE TT Savings for Elevated Metro APE Air Pollution for Elevated Metro NPE Noise Pollution for Elevated MetroCdE Congestion and delay for Elevated Metro PPE Parking Problem for Elevated Metro
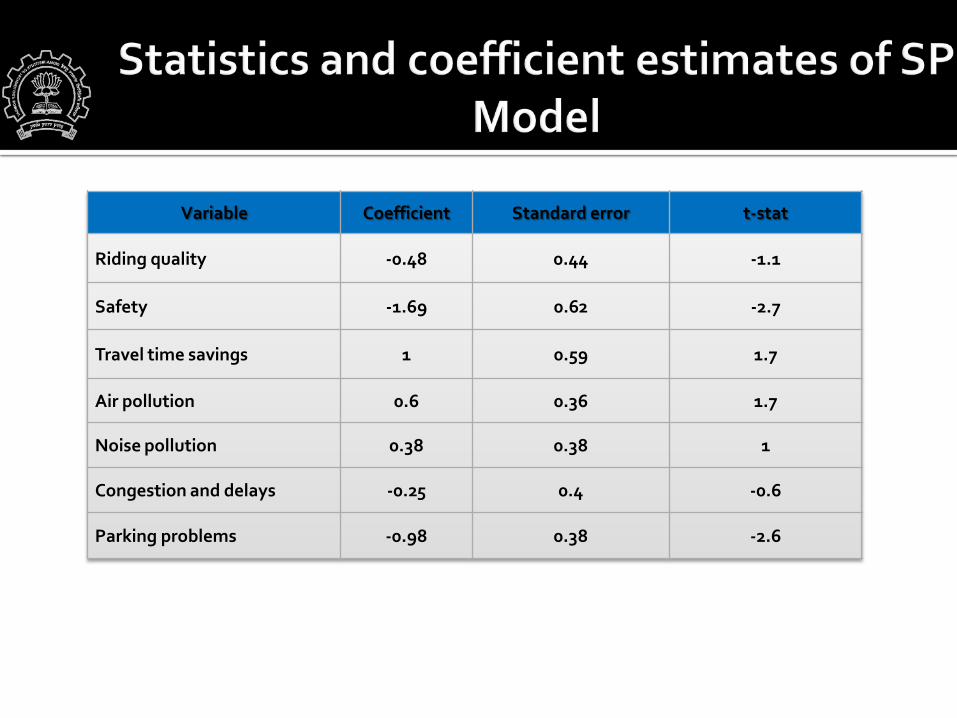
Variable Coefficient Standard error t-stat
Riding quality -0.48 0.44 -1.1
Safety -1.69 0.62 -2.7
Travel time savings 1 0.59 1.7
Air pollution 0.6 0.36 1.7
Noise pollution 0.38 0.38 1
Congestion and delays -0.25 0.4 -0.6
Parking problems -0.98 0.38 -2.6
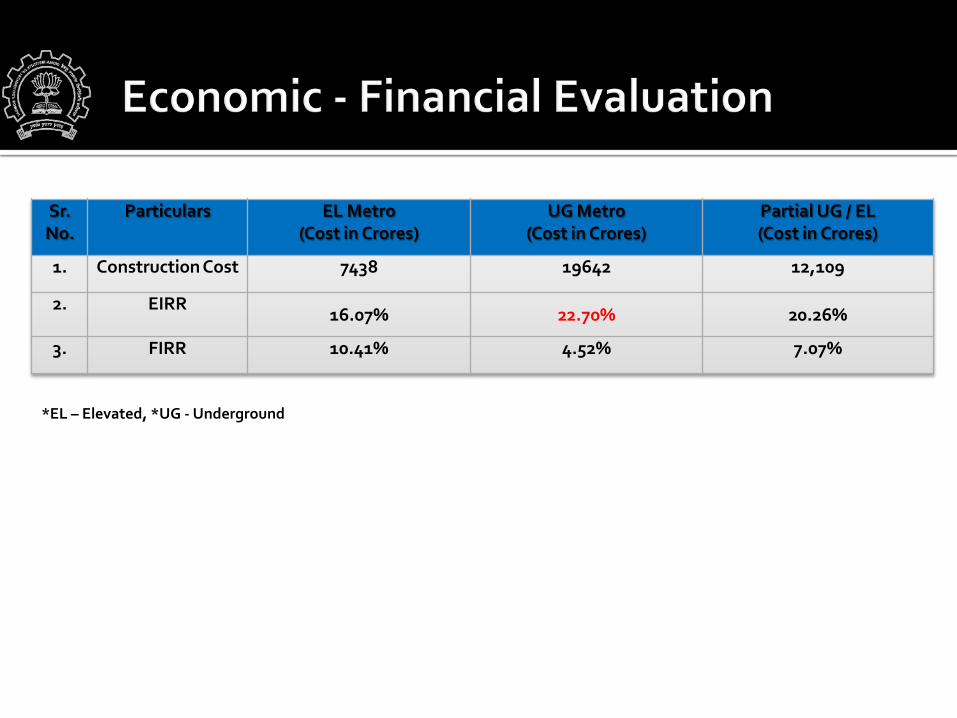
Sr. No.
Particulars EL Metro(Cost in Crores)
UG Metro(Cost in Crores)
Partial UG / EL(Cost in Crores)
1. Construction Cost 7438 19642 12,109
2. EIRR 16.07% 22.70% 20.26%
3. FIRR 10.41% 4.52% 7.07%
*EL – Elevated, *UG - Underground
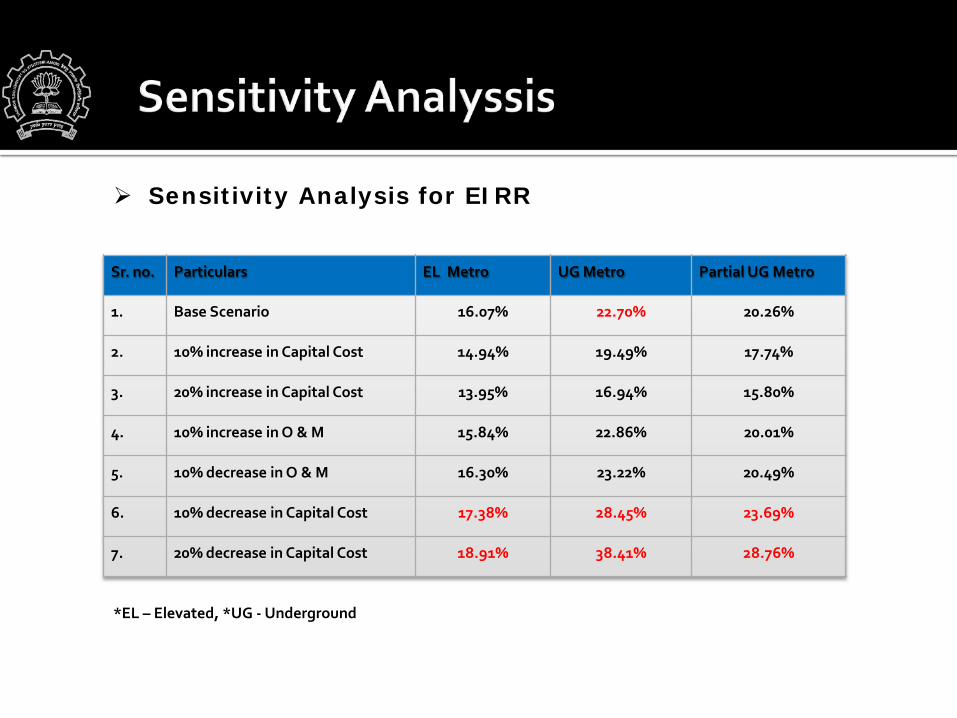
Sr. no. Particulars EL Metro UG Metro Partial UG Metro
1. Base Scenario 16.07% 22.70% 20.26%
2. 10% increase in Capital Cost 14.94% 19.49% 17.74%
3. 20% increase in Capital Cost 13.95% 16.94% 15.80%
4. 10% increase in O & M 15.84% 22.86% 20.01%
5. 10% decrease in O & M 16.30% 23.22% 20.49%
6. 10% decrease in Capital Cost 17.38% 28.45% 23.69%
7. 20% decrease in Capital Cost 18.91% 38.41% 28.76%
Sensitivity Analysis for EIRR
*EL – Elevated, *UG - Underground

Sr.No. Particulars EL Metro UG Metro Partial UG Metro
1. Base Scenario 10.41% 4.52% 7.25%
2. 10% increase in Capital Cost 9.75% 4.02% 6.68%
3. 20% increase in Capital Cost 9.16% 3.57% 6.17%
4. 10% increase in O & M 10.17% 4.34% 7.05%
5. 10% decrease in O & M 10.64% 4.69% 7.45%
6. 10% decrease in Capital Cost 11.17% 5.09% 7.90%
7. 20% decrease in Capital Cost 12.06% 5.74% 8.66%
8. 10% increase in Revenue 11.38% 5.24% 8.08%
9. 10% decrease in Revenue 9.35% 3.72% 6.34%
Sensitivity Analysis for FIRR
*EL – Elevated, *UG - Underground

Social
Investment
Operation and Maintenance (O&M) Charges
Revenue
Benefits
By process of Land acquisition
Less number of Vehicles on road with MRTS Implemented
Decongestion Effect
Savings in Time
Savings in Accidents
Savings in Vehicle Operating Cost (VOC)
Savings in the cost of Road Infrastructure
Saving in Land Acquisition Cost
Savings in Pulling Down the Structures
Savings in Shifting of Utilities Service
Technical Issues
Legal
Social/Quality of Life
Other Infrastructure
Environment
Cost, Finance & Economics
Integrated Transport Plan
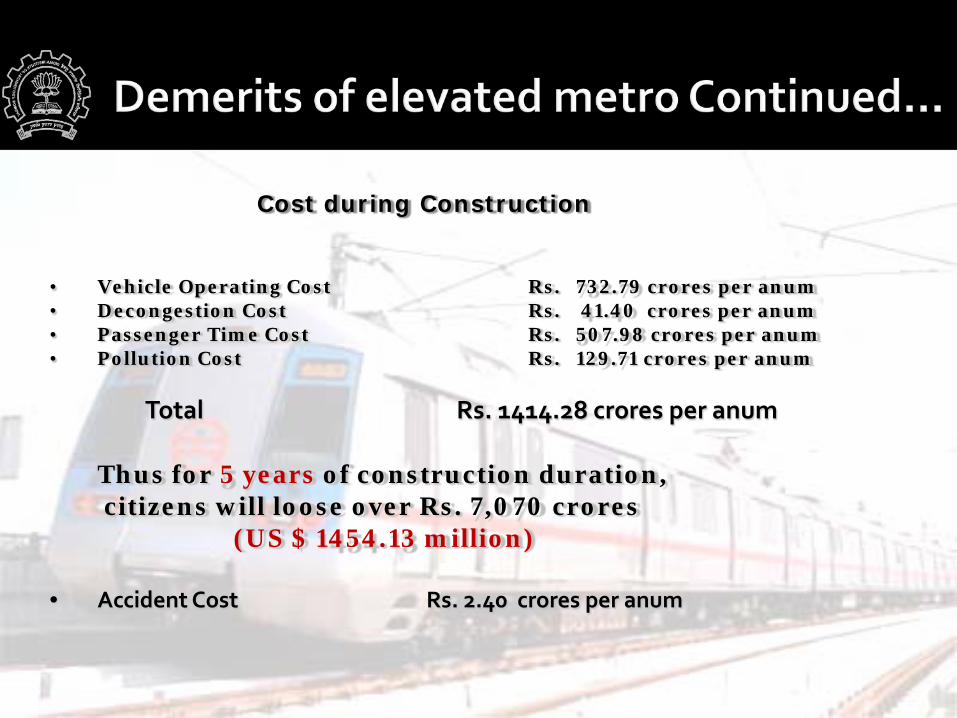
• Vehicle Operating Cost Rs. 732.79 crores per anum• Decongestion Cost Rs. 41.40 crores per anum• Passenger Time Cost Rs. 507.98 crores per anum• Pollution Cost Rs. 129.71 crores per anum
Total Rs. 1414.28 crores per anum
Thus for 5 years of construction duration,citizens will loose over Rs. 7,070 crores
(US $ 1454.13 million)
• Accident Cost Rs. 2.40 crores per anum
Cost during Construction
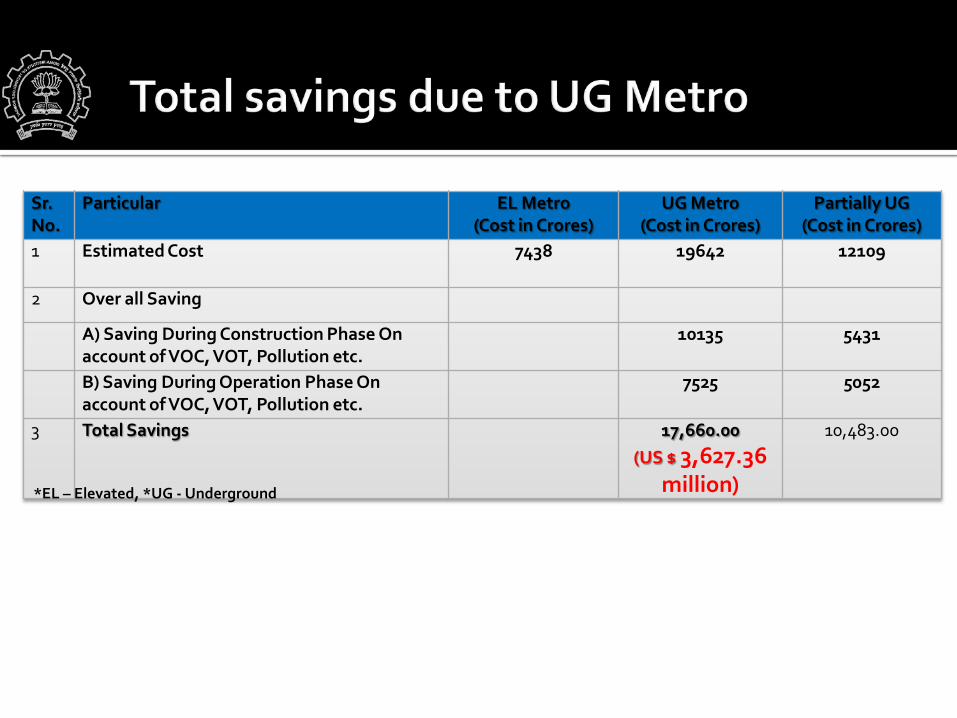
Sr. No.
Particular EL Metro(Cost in Crores)
UG Metro(Cost in Crores)
Partially UG(Cost in Crores)
1 Estimated Cost 7438 19642 12109
2 Over all Saving
A) Saving During Construction Phase On account of VOC, VOT, Pollution etc.
10135 5431
B) Saving During Operation Phase On account of VOC, VOT, Pollution etc.
7525 5052
3 Total Savings 17,660.00(US $ 3,627.36
million)
10,483.00
*EL – Elevated, *UG - Underground
Metro Rail System is expected to reduce the traffic on roads.
This is a much needed system to support the present traffic
conditions of the metropolis.
The social benefits outweigh for the underground metro
compared to the elevated metro.
High direct and indirect cost savings of underground metro
compared to elevated metro.
EIIR significance. On the ground of constitutional right of equity and demand of
users, UG metro proves to be the best alternative over EL metro.
Transportation Systems EngineeringDepartment of Civil Engineering
IIT Bombay
THANK YOU !
E-Mail: [email protected] Page: http://www.civil.iitb.ac.in/~dhingra/index.html


