Obesity Trends in India and Consequences
Dr. Umesh Kapil MD, DNB, FAMS ,
Professor Public Health Nutrition Department of Human Nutrition All India Institute of Medical Sciences, New Delhi 110 029, INDIA Tel No: (Off) 91-11- 26593383 ; (R) 91-11-26195105 Mobile:. 9810609340 Fax : 91-11-26588641 , 91-11-26588663 [email protected]

India : Double Burden of Disease
Under nutrition due to Poverty 30 % below BPL
Over nutrition and Obesity 5-7% MIG and HIG Urban area
This is most productive workforce of the country Academics/Planners/ Administrators/ Professionals
SHOULD BE GIVEN PRIORITY

Author Year of Study
Country/State
Criteria used
Prevalence of over-weight (M/F)
Prevalence of obesity (M/F)
Gopinath et.al 1994 Delhi BMI>25 21.3% (M)
33.4% (F)
INA
Singhal et al 1998 Jaipur BMI>25 14.6% (M)
6.6% (F)
INA
Asthana et al 1997 Varanasi BMI>25 30.2% (F) INA
Chadha et al 1997 Delhi BMI>25 20.7 (M)
32.6% (F)
INA
Obesity Trends in India : Recent studies: Adults

Author Year of Study
Country/State
Criteria used
Prevalence of over-weight (M/F)
Prevalence of obesity (M/F)
Singh et.al 1999 5 Cities BMI>23BMI>25BMI>27
50.9% (F)
Vasanthanani 2000 Coimbatore BMI>30 36.0% (M)
Mohan et al 2000 Chennai BMI>25 38.0% (M)33.1% (F)
Easwaran et al 2001 Coimbatore BMI>25BMI>24
65.0% (M)65.0% (F)
Gupta et al 2002 Jaipur BMI>27 24.5% (M)30.2% (F)
NFHS-II 1998-99
India BMI>25 8.6% MIG27.2 HIG
Obesity Trends in India : Recent studies
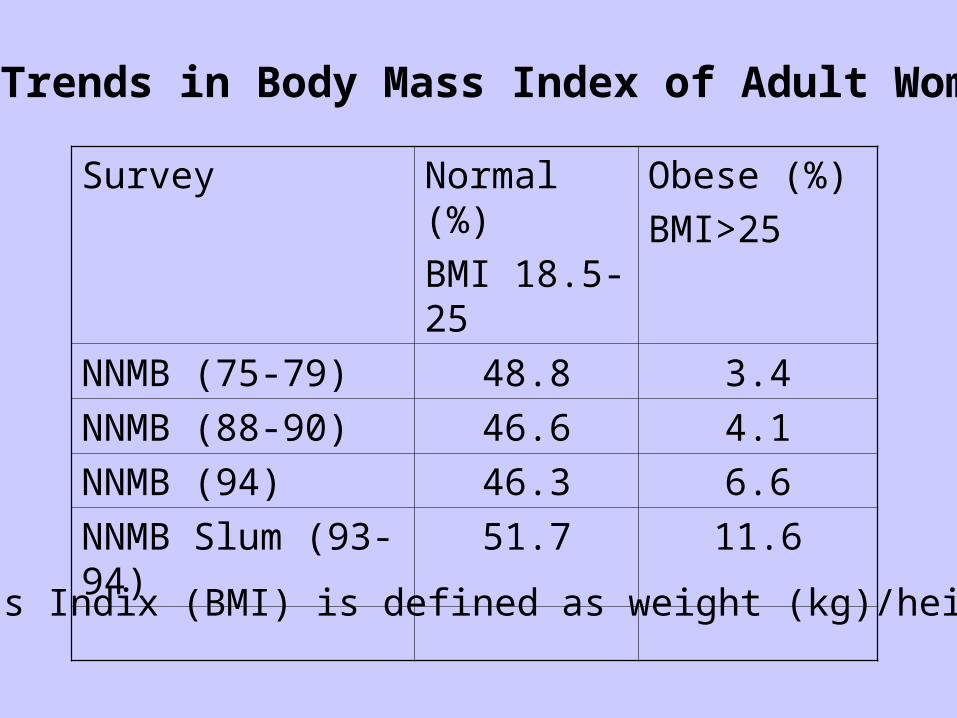
Survey Normal (%)
BMI 18.5-25
Obese (%)
BMI>25
NNMB (75-79) 48.8 3.4
NNMB (88-90) 46.6 4.1
NNMB (94) 46.3 6.6
NNMB Slum (93-94) 51.7 11.6
Trends in Body Mass Index of Adult Women
Body Mass Indix (BMI) is defined as weight (kg)/height² (m)

Obesity Trends in India : Recent studies Children
S.No Author Name State/
country
Prevalence of obesity
1.* Umesh Kapil etal, 2001
Delhi (India)
8% boys
6% girls
2.** Vedavati S etal, 1998
Chennai, India
6% obese
1.* Indian Pediatrics, 2002 May, 17: 449-452
2.** Indian Pediatrics, 2003 Aug, 40: 775-779.

Obesity Trends in India : Recent studies Children
S.No Author Name State/
country
Prevalence of obesity
3.* A.K.Gupta etal, 1985-86
India 7.94% boys
6.90% girls
4.** Ramachandran A etal, 2000
India 3.6% boys
2.7% girls
3.* Indian Pediatrics, 1990, Apr, 27 333-337
4.** Diabetes research and Clinical Practice 2002; 57 185-190.


Risk factor for Non Communicable Diseases
Cardiovascular diseases CAD, CHF, Stroke Insulin Resistance and Type-2 Diabetes Mellitus Reproductive disorders Pulmonary diseases Gall stone disease Cancer- Colon, Rectum, Prostate-Male Gall stone–bile duct, breast, endometrium cervix, ovary- Female Bone: Joint and skin diseases
Oesteoprosis Mental Health Psychological well being Accidents Muscloskeletal injuries
Obesity


Diabetes
Gall bladder disease
Hypertension
Dyslipidaemia
Insulin resistance
Breathlessness
Sleep apnoea
Greatly increased(relative risk >>3)
Coronary heart disease
Osteoarthritis (knees)
Hyperuricaemia and gout
Moderately increased(relative risk
ca 2-3)
Cancer (breast cancer in postmenopausal women, endometrial cancer, colon cancer)
Reproductive hormone abnormalities
Polycystic ovary syndrome
Impaired fertility
Low back pain
Increased anaesthetic risk
Foetal defects arising from maternal obesity
Slightly increased(relative risk
ca 1-2)
Relative risk of health problems associated with
obesity in developed countries.

High Prevalence of Metabolic Syndrome
(Syndrome X)
HypertensionIncreased Insulin ResistanceCentral ObesityDyslipidemia

Obesity and Mortality
Morbidly obese individuals (more than 200% ideal body weight) have as much as a twelve fold increase in mortality

Source: Bray GA. 1992. AJCN; 55; 488S-94S

Obesity and Diabetes
As many as 80% of patients with type-2 diabetes mellitus are obese

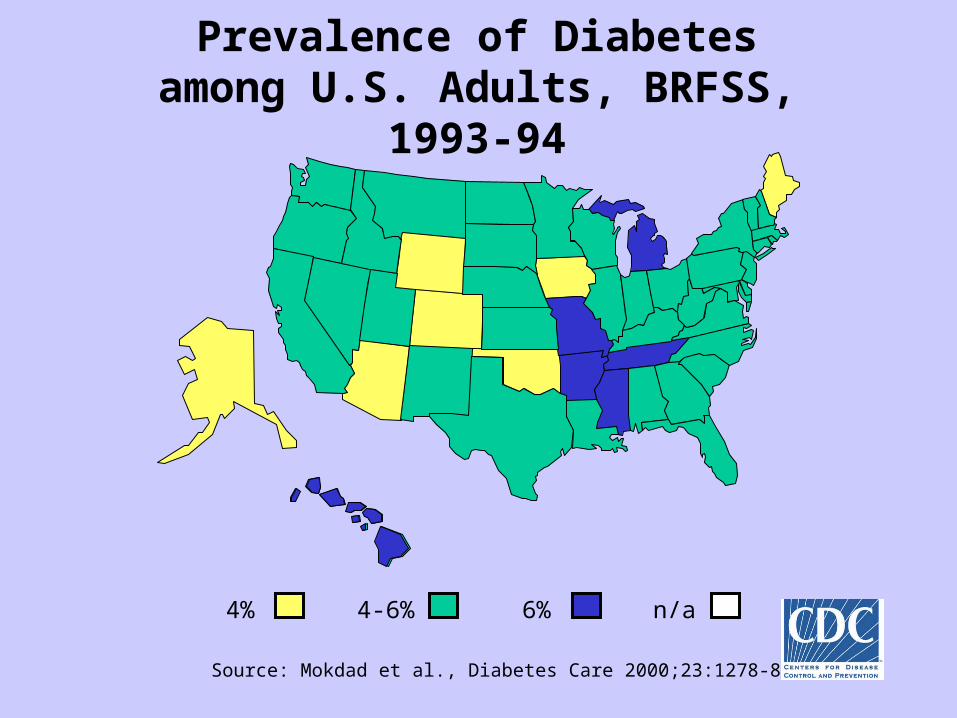
4% 4-6% 6% n/a
Source: Mokdad et al., Diabetes Care 2000;23:1278-83
Prevalence of Diabetes among U.S. Adults, BRFSS,
1993-94

Prevalence of Diabetes among U.S. Adults, BRFSS, 1997-98
4% 4-6% 6% n/a
Source: Mokdad et al., Diabetes Care 2000;23:1278-83

Obesity and Diabetes
Mild obesity Two fold risk of Diabetes
Moderate obesity Five fold risk of Diabetes
Severe obesity Ten fold risk of Diabetes

Indian Scenario : Diabetes
Between 1988 and 2000, there was a 70% increase in the prevalence of Diabetes in the city of Chennai
The recent study document a prevalence of13% in adults

Possible Reasons:Average per capita energy ( Kcals ) intake
as per expenditure classes , IndiaExpenditure
ClassesUrban
(1972-73)
Urban
(1993-94)
Lower 30% 1579 1682
Middle 40% 2154 2111
Top 30% 2572 2405
Source: NSSO, 1997

Average daily per capita dietary intake of Fats in India
Year Fat (g)
Rural
Fat(g)
Urban
1972-73 24 36
1983 27 37
1993-94 31.4 42
1999-2000 36.1 49.6
Source: NSSO 2001

Life style changes between 1972-2000
Increase in Sedentary Life style
Decrease Physical activities
Intake of calories remaining same
Increase in Fat intake
Most manual jobs have been replaced by mechanized jobs
Transportation to school /work place universally by use of motor car/Bus/Bicycles
Increase in hours for activities :TV viewing/ Computer

Studies on prevalence of hypertension on obese children
S.No Author Name State/
country
Prevalence of hypertension
1*. M.Verma etal
1994
Punjab (India)
Obese children: 13.7%
Non-obese: children: 0.4%
2**. A.K. Gupta etal 1993
India Obese children: 34%
Non-obese children: 0.16%
1* Indian Pediatrics1994Sept; 31: 1065-1069
2** Indian Pediatrics 1990 Apr;27(4)333-7.

Study on prevalence of IGT(Impaired Glucose Tolerance) and diabetes mellitus in
obese childrenS.No Author Name State/
country
Prevalence of IGT & DM
1.* Ranjana Sinha etal, 1999-2000
Yale IGT: 25% (4-10yrs
: 21%(11- 18yrs)
DM: 4%( 11-18yrs)
2.** Ripamonti G etal, 1990
Italy IGT: 11%
1.* New England Journal of Medicine;2002 March;346(11);802-810
2.** Minerva Med; 1991 Jun; 82(6):345-8

Study on the prevalence of Dyslipediamas in obese children
S.No Author Name State/
country
Prevalence of Dyslipediamas
1.* Zwiauer K etal, 1990
Australia 46% girls
41% boys
2,** Valverde MA etal, 1998
Portugal 67.6% elevated triglyceride levels
1.* Wien Klin Wochenschr. 1990 May 11; 102(10): 299-303
2.** Arch Latinoam Nutr. 1999 Dec; 49(4): 338-43

Study on the prevalence of Dyslipediamas in obese children (Cont..)
S.No Author Name State/
countryPrevalence of Dyslipediamas
3.* Fredland O etal, 2002
Texas (USA)
52% elevated serum cholesterol levels
3.*J Pediatr Endocrinology Met’ 15’ 1011-1016 (2002)

Role of Physical Activity
According to WHO at least 30 minutes of cumulative moderate exercise (equivalent to walking briskly) for all ages plus for children , an additional 20 minutes of vigorous exercise ( equivalent to running) three times a week .
(These recommendations are basically for prevention of CHD).
The prevention of obesity may require combination of both : more Physical Activity and Dietary interventions.

Body Mass Index
Rel
ativ
e R
isk
Women
Willett, Dietz & Colditz, N.E.J.M. 1999. 341, 426-434
BMI in relation to morbidity over 18 yearsBMI in relation to morbidity over 18 years
Aged 30-55 at start.
1
2
3
4
5
6
0<21 22 23 24 25 26 27 28 29 30
Type 2 diabetesCholelithiasisCoronary Heart DiseaseHypertension
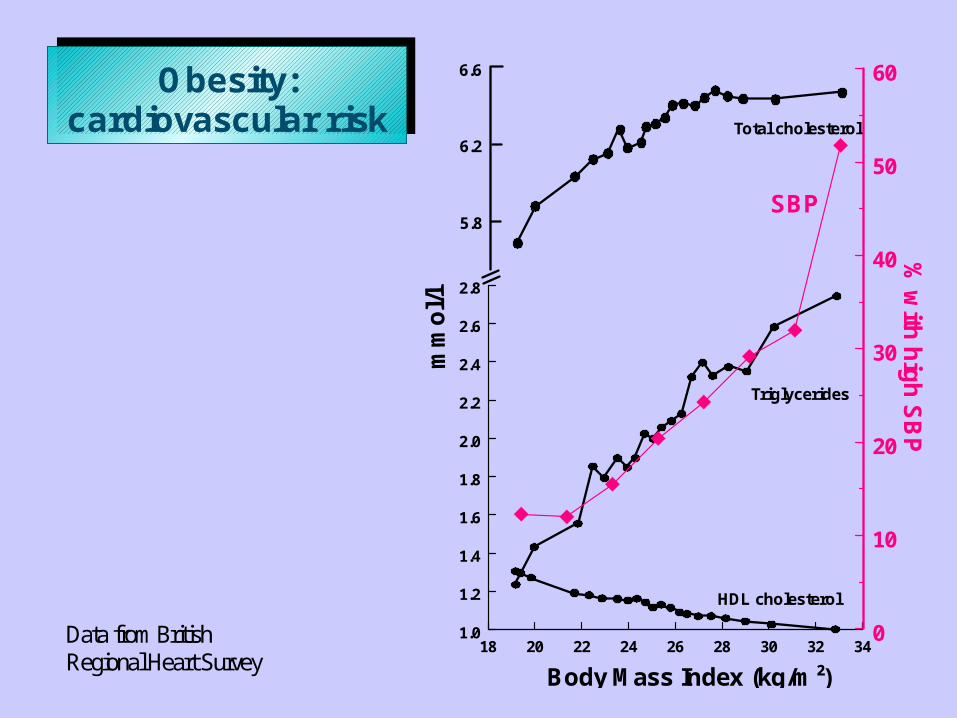
18 20 22 24 26 28 30 32 341.0
1.2
1.4
1.6
1.8
2.0
2.2
2.4
2.6
2.8
6.6
6.2
5.8
Total cholesterol
Triglycerides
HDL cholesterol
Body Mass Index (kg/m²)
0
10
20
30
40
50
60
mm
ol/l
SBP
% w
ith h
igh
SB
P
Obesity: cardiovascular risk
Data from British Regional Heart Survey

WE MUST LEARN LESSON FROM THE DVELOPED COUNTRIES
RDA for the Affluent Urban Sedentary Population life Styles Should be developed

All India Institute of Medical Sciences , New Delhi
Thank you


