Download - NICKEL OUTLOOK An “Underestimated” Metal

NICKEL OUTLOOK An “Underestimated” Metal
PDAC 2012 Commodities and Market Outlook SessionMarch 4, 2012

www.royalnickel.com
Disclaimer
Opinions, estimates and projections contained in this presentation are subject to change without notice. The information and opinionscontained in this presentations have been compiled or arrived at from sources believed reliable but no representation or warranty,express or implied, is made as to their accuracy or completeness. Neither Royal Nickel nor its employees or agents accepts any liabilitywhatsoever for any loss arising from the use of this presentation or its contents.
Cautionary Statements Concerning Forward‐Looking StatementsThis document contains “forward-looking information” which includes, but is not limited to, statements with respect to the global supply and demand fornickel as well as forward looking information relating to a number of companies and their projects, including Royal Nickel Corporation ("RNC") and itsdevelopment stage project in the Province of Quebec, Canada called the Dumont Nickel Project. Often, but not always, forward-looking statements canbe identified by the use of words such as “plans”, “expects”, “is expected”, “budget”, “scheduled”, “estimates”, “forecasts”, “intends”, “anticipates”, or“does not anticipate” or “believes” or variations (including negative variations) of such words and phrases, or state that certain actions, events or results“may”, “could”, “would”, “might” or “will” be taken, occur or be achieved. Accordingly, readers should not place undue reliance on forward-lookingstatements.
Forward-looking statements involve known and unknown risks, uncertainties and other factors which may cause the actual results, performance orachievements of the company to be materially different from any future results, performance or achievements expressed or implied by the forward-looking statements. The technical information relating to the Dumont Nickel Project referred to in this document is derived from the results of apreliminary feasibility study announced by RNC on November 1, 2011. The preliminary feasibility study, and the estimates contained therein, arepreliminary in nature, and are based on a number of assumptions, any one of which, if incorrect, could materially change the projected outcome. Factorsthat could affect the outcome include, among others: the actual results of current exploration and development activities; nickel recovery, project delays;funding needs; general business, economic, competitive, political and social uncertainties; future prices of metals; availability of alternative nickelsources or substitutions; conclusions of economic evaluations; changes in project parameters as plans continue to be refined; the future cost of capitalto the company; possible variations of ore grade or recovery rates; failure of plant, equipment or processes to operate as anticipated; accidents, labourdisputes and other risks of the mining industry; political instability, terrorism, insurrection or war; delays in obtaining governmental approvals, necessarypermitting or in the completion of development or construction activities. For a more detailed discussion of such risks and other factors that could causeactual results to differ materially from those expressed or implied by such forward-looking statements, refer to RNC’s filings with Canadian securitiesregulators available on SEDAR at www.sedar.com.
Although RNC has attempted to identify important factors that could cause actual actions, events or results to differ materially from those described inforward-looking statements, there may be other factors that cause actions, events or results to differ from those anticipated, estimated or intended.Forward-looking statements contained herein are made as of the date of this presentation and RNC disclaims any obligation to update any forward-looking statements, whether as a result of new information, future events or results or otherwise, except as required by applicable securities laws. Therecan be no assurance that forward-looking statements will prove to be accurate, as actual results and future events could differ materially from thoseanticipated in such statements. Accordingly, readers should not place undue reliance on forward-looking statements.
1TSX: RNX

www.royalnickel.com
Nickel ‐ An Underestimated Metal
Context• 2011 – Another deficit year• China, 300 series, ROW demand, NPI – significant positives • 35 years of low supply growth, poor project pipeline development
2012‐2015 A Largely Balanced Market , NOT OVERSUPPLIED(Surpluses arise ONLY if prices are HIGHER than current levels of $8‐$9/lb)
Beyond 2015The “Cupboard is Bare” – Few New Projects in Project Pipeline
• Laterites – Any appetite for more $5 billion projects ?
• NPI – A higher cost, ore quality constrained option
• Sulphides ‐ Not enough, and many too early stage
2

www.royalnickel.com
Context ‐ 2011 – Another Deficit Year
3
‐37
9 3 2
‐3
15
‐29
4130
80
‐22
‐46
2000 2001 2002 2003 2004 2005 2006 2007 2008 2009 2010 2011
LME Nickel Inventory Change Year‐over‐year2000 ‐ 2011 (Kt)
LME nickel inventories have declined for a 2nd year; LME nickel inventories are down 46 kt in 2011 (~3 % of demand) or 77kt since their peak in early 2010.
Source: Metalprices.com
www.royalnickel.com
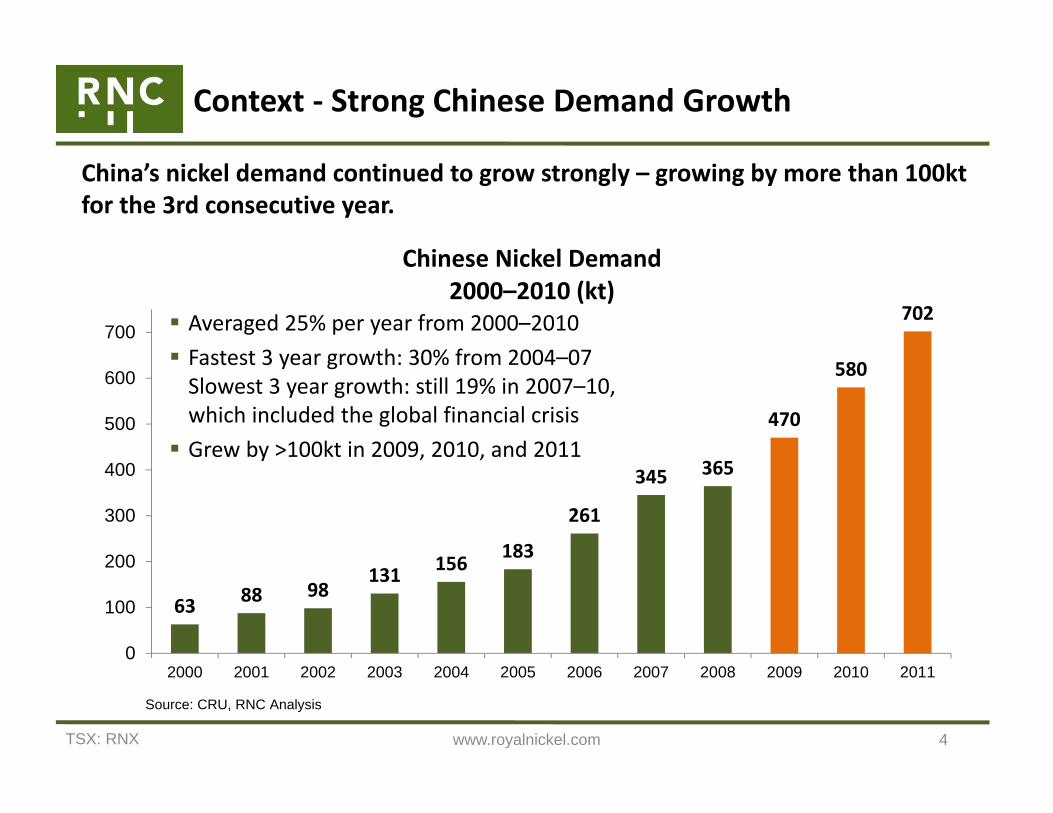
63 88 98131 156 183
261
345 365
470
580
702
0
100
200
300
400
500
600
700
2000 2001 2002 2003 2004 2005 2006 2007 2008 2009 2010 2011
Chinese Nickel Demand2000–2010 (kt)
Averaged 25% per year from 2000–2010 Fastest 3 year growth: 30% from 2004–07 Slowest 3 year growth: still 19% in 2007–10, which included the global financial crisis Grew by >100kt in 2009, 2010, and 2011
4
Context ‐ Strong Chinese Demand Growth
Source: CRU, RNC Analysis
China’s nickel demand continued to grow strongly – growing by more than 100kt for the 3rd consecutive year.
TSX: RNX

www.royalnickel.com
Context ‐ Rebound in 300 Series Demand
5
Source: ISSF, Macquarie May 2011, Pariser May 2007
Global Stainless Steel Production(% Breakdown by grade)
With lower nickel prices and increased nickel availability, 300 series nickel demand has rebounded sharply in 2011 driven by significant increases in China.
Source: Macquarie November 2011
0
20
40
60
80
100
400 Series200 Series300 Series
Chinese Stainless Steel Production(Breakdown by grade, kt)
// //
www.royalnickel.com
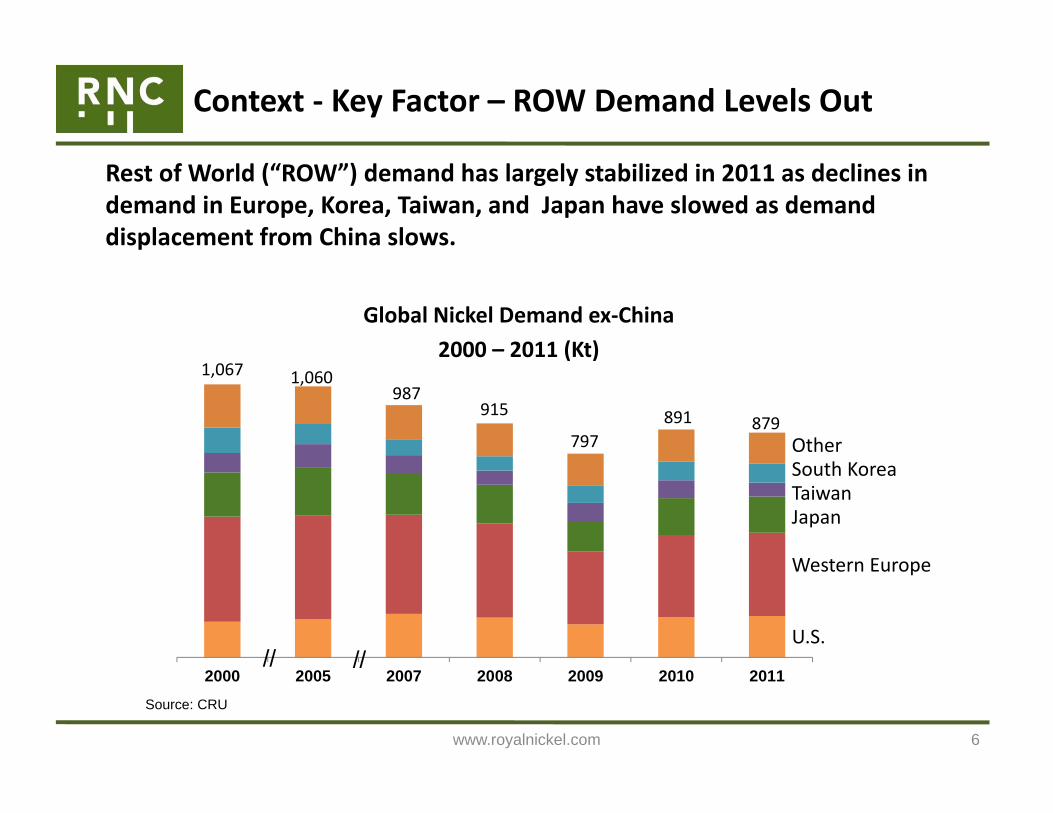
Context ‐ Key Factor – ROW Demand Levels Out
Rest of World (“ROW”) demand has largely stabilized in 2011 as declines in demand in Europe, Korea, Taiwan, and Japan have slowed as demand displacement from China slows.
6
2000 2005 2007 2008 2009 2010 2011
Global Nickel Demand ex‐China2000 – 2011 (Kt)
Source: CRU
1,067 1,060987
915
797891 879
OtherSouth KoreaTaiwanJapan
Western Europe
U.S.// //

www.royalnickel.com
Context ‐ NPI to the Rescue Again in 2011
Significant market deficits in late 2010/early 2011 pushed nickel prices to $10‐$13/lb to stimulate enough NPI production to close market gap. NPI production represented almost 50% of supply growth in 2011.
7
NPI
Global Nickel Supply Growth 2010 – 2011 (Kt)
Source: Macquarie
Other
167Despite a 10+% increase in nickel production:
Nickel prices rose to an average of $10.36/lb in 2011 from $9.89/lb in 2010
Nickel forecasts must consider amount/production cost of NPI required to balance market

www.royalnickel.com 8
Context ‐ NPI – Effective Swing Producer
Effective swing producer as nickel pig iron production is very price sensitive requiring nickel prices towards $10/lb to expand
NPI producers will face increased cost pressure going forward which will push trigger price higher Coke, electricity availability and prices, RMB appreciation, environmental compliance
Please note that over 6 million tonnes of reported Chinese nickel ore imports in 2011 was used to produce pig iron for steel rather than NPI
LME Nickel Prices &Chinese Nickel Pig Iron Production
2008 to 2011
Source: Macquarie

www.royalnickel.com
248 9%
17%
242
0
100
200
300
400
500
600
NickelSupply2011‐15
Nickel 2011–2015 Supply Growthvs. Chinese Demand Growth Required
to Absorb it Low risk projects only permit9% per year growth in Chinese demand(~1/3 of trend growth of 25%)
Including all higher risk projects,only 17% demand growth possible(still only 2/3 of trend growth) Assumes no demand growth in the
rest of the world, mine supply from existing operations will not decline
9
2011 – 2015Not Too Much Supply , Not Even Enough For China
Source: Brook Hunt – A Wood Mackenzie Company, RNC Analysis
Even with all of the projects under construction, China alonewill consume all of their production EVEN if all higher‐risk projects successfully ramp up.
Lower RiskFeNi,Sulphide
Higher RiskPAL
490
Chinese DemandGrowth Required to
Absorb Supply
TSX: RNX
ktnickel

www.royalnickel.com
Beyond 2015“The Cupboard is Bare” – Few Projects in Pipeline
China is going to need 1+ MILLION tonnes more nickel before the end of this decade Rest of world led by Brazil, India, Russia will also need more
Current set of projects under construction, AT BEST, will only provide ~500,000 tonnes or half of that amount
Little visibility on remaining 500,000+ tonnes the market requires in futurePotential to once again face significant supply shortfalls by 2015‐16 Current set of projects under construction cleans out project “cupboard” Significant cost and technical challenges associated with laterite projects result in
little appetite for new $5+ billion laterite projects Few large scale greenfield exploration discoveries – 35 years of underinvestment NPI ultimately constrained by high grade ore availability and structural cost increases (power,
labour, currency) in China Indonesia is a significant wild card and has potential to negatively disrupt market
Stated ban on exports of ore by 2014, currently ~15% of world nickel supply, likely to result in some form of export restriction or export duties (similar to tin market)
By 2015‐16, only a few new large scale projects, such as RNC’s Dumont and First Quantum’s Enterprise nickel sulphide projects, are expected to be ready to meet the world’s growing demand for nickel
10

www.royalnickel.com 11
Beyond 2015 ‐ Evolution of Metal Demand
As an economy industrializes, demand moves from more basic materials like carbon steel into stainless steels and ultimately into specialty alloys that require a lot of nickel and will drive non‐stainless nickel consumption in China.
Source: World Steel Association, ICSG, World Stainless Steel Statistics, Brook Hunt – A Wood Mackenzie Company, RNC Analysis
203
441503
0100200300400500
3.8
18.4
13.5
0
5
10
15
20
0.3
1.3 1.3
0
0.5
1
1.5
Carbon Steel Stainless Steel Nickel
China
ChinaChina
2010 Kg/capita consumption 2010 Kg/capita consumption2010 Kg/capita consumption

www.royalnickel.com 12
Beyond 2015 ‐ Nickel Consumption per Capita
Source: CRU, RNC Analysis
Despite huge growth in demand, Chinese per capita consumption is still less than half of that of industrial economies such as Western Europe and Japan.
1.3 1.3
0.4
0.00
0.20
0.40
0.60
0.80
1.00
1.20
1.40
Germany Japan China
Nickel Consumption per Capita2010 (kg/capita)
At Japanese and German per capita consumption levels, Chinese nickel demand would increase by +1 million tonnes This is equivalent to 20+
Dumont scale projects

www.royalnickel.com
Beyond 2015 Laterites Not Answer, Current Wave “Cleans out Cupboard”
The bulk of the current wave of projects have been known for many decades: either discovered/developed too late during the 1965–75 period or inferior to other projects that were developed
Most of current project wave has sat “in the cupboard” for many decades (even back to the beginning of the last century)
13
Project Discovery
Koniambo Early 1900s
Goro Early 1900s
Ramu Early 1960s
Ambatovy Early 1960s
Barro Alto Early 1960s
Onca Puma Mid 1970s
Talvivaara Early 1980s

www.royalnickel.com
Beyond 2015Current Wave Has Not Been Replaced
Since cupboard was full in 1975, there was very little need to do “new shopping” for new projects with greenfield development and exploration, which resulted in a very poorly structured project pipeline Since 1990, only large greenfield discoveries have occurred when exploration was occurring for
other metals: Voisey’s Bay (diamonds), Kabanga (gold), Enterprise (copper)
Very little project development and exploration has been done over past few years. As a result, the current set of projects has now developed all saprolite deposits with large resource of 2.2% average grade or higher (Koniambo, Onca Puma, Barro Alto)
No new high grade laterite discoveries have been made to replace these projects in the project pipeline
If Koniambo, with an average ore grade of 2.6%, required $5+ Billion to develop, how much would similar output from a 1.8% saprolite greenfield project cost ?!? Remember that a number of modules for this plant were constructed in China ! Remember today’s new NPI plants are the same as a traditional RKEF FeNi plant !!
14

www.royalnickel.com
Beyond 2015Nickel Supply – Low Growth for Last 35 Years
Significant capacity growth in 1965–75 was followed by 35 years of low supply growth and weak project pipeline development which will continue to hamper future supply growth.
15
5.2%
1.4% 1.6% 1.4%
1.3%
1.7%1.2%
2.8%
0.0%
1.0%
2.0%
3.0%
4.0%
5.0%
6.0%
7.0%
1965‐75 1975‐90 1990‐00 2000‐10
Global Nickel Supply Growth“Traditional” vs. Alternative
1965–2010 (% CAGR)
< 2% growth for 35 years !
1965–75 saw a burst of new projects driven by inability of Inco to continue to meet global demand growth 1975–90 saw significant project rationalization Collapse of former Soviet Union demand(20% of world total) provided supply during 1990s Ni pig iron and demand destruction in 2000–10 closed gap caused by lack of new supply from weak project pipeline development
StainlessDemand Destruction
NPI
FSUCollapse
JapanFeNi
Source: Brook Hunt – A Wood Mackenzie Company, Macquarie, RNC Analysis

www.royalnickel.com
Beyond 2015NPI – Rapid Growth in Overall Mine Production
16
Ore imports for nickel production have quickly become a large share of overall global mine production – tripled in 4 years.
Source: USGS, Brook Hunt – A Wood Mackenzie Company

www.royalnickel.com
Beyond 2015NPI – Not China!, but Japan in 1960s
17
Ore imports for nickel production have quickly become a large share of overall global mine production.
NPI is not new, it is effectively same process as Japan in 1960s. First time was France in the 1880s–1920s
Even by 1960s, ore grades in New Caledonia were falling. Minimum ore grade imported to Japan in 1963 was 3%. By 1970, it was down to 2.5% and is trending to 2% today
By 1970, ore imports into Japan leveled off. By 2010, ore imports were still at 1970 levels of approximately 4.5 Mt Due to a combination of lower
ore grades, higher energy costs, and rising input costs in Japan
Source: USGS, Brook Hunt – A Wood Mackenzie Company

www.royalnickel.com
Beyond 2015NPI ‐ Already Seeing Pressure on Ore Availability
When NPI production was growing earlier this year, highest grade ore prices (1.8‐2.0%) decoupled from other grades and reached $4/lb as supply could not keep pace.Increased demand should mean even higher prices during next NPI growth cycle ?
18
Nickel Laterite Ore Prices – ChinaUS$/lb
Source: Metalligence
0.9~1.1%
1.4~1.6%1.8~1.9%2%
Source: Metalligence
$0
$1
$2
$3
$4
$5
$6
$7
$8
Apr‐07
Jul‐0
7Jul‐0
7Sep‐07
Oct‐07
Nov
‐07
Dec‐07
Jan‐08
Feb‐08
Mar‐08
Apr‐08
Jun‐08
Jul‐0
8Jul‐0
8Sep‐08
Oct‐08
Nov
‐08
Dec‐08
Jan‐09
Feb‐09
Mar‐09
Apr‐09
May‐09
Jun‐09
Jul‐0
9Au
g‐09
Sep‐09
Oct‐09
Nov
‐09
Dec‐09
Jan‐10
Mar‐10
Mar‐10
Apr‐10
Jun‐10
Jul‐1
0Au
g‐10
Sep‐10
Oct‐10
Nov
‐10
Dec‐10
Feb‐11
Mar‐11
Apr‐11
May‐11
Jun‐11
Jul‐1
1Au
g‐11
Sep‐11

www.royalnickel.com
Beyond 2015NPI Input Costs are Increasing
19Source: Metalligence
Cok
e Pr
ice
(US$
/ to
nne)
Pow
er P
rice
(US$
/ K
ilow
att h
our)
China Electricity Prices(Shangdong and Fujian Provinces)
Shangdong
China Coke Prices(Shangdong Province)
Fujian
22% Increase
96% Increase
0.000
0.010
0.020
0.030
0.040
0.050
0.060
0.070
0.080
0.090
0.100
Jan‐07
Feb‐07
Apr‐07
May‐07
Jul‐0
7Au
g‐07
Oct‐07
Dec‐07
Jan‐08
Mar‐08
May‐08
Jul‐0
8Au
g‐08
Oct‐08
Dec‐08
Jan‐09
Mar‐09
May‐09
Jun‐09
Aug‐09
Sep‐09
Nov
‐09
Jan‐10
Mar‐10
Jul‐1
0Ap
r‐11
Dec‐10
Sep‐11 0
50
100
150
200
250
300
350
400
Jan-
07A
pr-0
7Ju
l-07
Oct
-07
Jan-
08A
pr-0
8Ju
l-08
Oct
-08
Jan-
09A
pr-0
9Ju
l-09
Oct
-09
Jan-
10A
pr-1
0Ju
l-10
Oct
-10
Jan-
11A
pr-1
1Ju
l-11
Oct
-11
36% Increase
Input costs have climbed significantly since NPI was first produced in China in early 2007

www.royalnickel.com
Beyond 2015Indonesian Ore Exports – Availability? Price?
20
0.2
6.3 7.4 7.2
12.2
25.7
0
5
10
15
20
25
30
2006 2007 2008 2009 2010 2011
Indonesian Nickel Ore Exports to China (Mt)
New Indonesian legislation to place a ban on nickel ore exports by 2014 could lead to significant disruptions to Chinese NPI production and overall nickel supply (Indonesian nickel ore exports now ~15% of overall nickel supply)
Source: GTIS

www.royalnickel.com
Beyond 2015Sulphides Can Help, but Most Projects Too Early
Simpler mine/mill operations rather than fully integrated smelting/refining operations
Conventional mine/mill operations have a long track record. Breakthrough by BHP Billiton (originally WMC Resources) at Mt. Keith in processing ultramafic ores has now operated successfully for almost 20 years
Capital intensity a fraction of largest scale laterite projects For examples, RNC Dumont’s initial capital of $1.1 billion and $25 per tonne of nickel output is a fraction of the $5+ billion and capital intensity of ~$90 per tonne spent at Goro, Koniambo, Ambatovy
Inherently, sulphide minerals require much less energy to liberate nickel than laterites
Deposits in more politically stable jurisdictions (e.g. Canada, Finland, Sweden, Australia) versus (Indonesia, Philippines, PNG, New Caledonia)
21

www.royalnickel.com
Nickel – 2 Key Messages to Take Away
2012‐2015 A Largely Balanced Market , NOT OVERSUPPLIED
Surpluses arise ONLY if prices are HIGHER than current levels of $8‐$9/lb
Beyond 2015The “Cupboard is Bare” – Few new projects in project pipeline
Potential for primary supply shortfalls similar to 2005‐2007 period, additional NPI production to fill gap requires much higher nickel prices than today
Potential for significant supply disruptions from Indonesia
22


