MECHANISMS OF HUMAN GENE EVOLUTION
by
Xiaoxia Wang
A dissertation submitted in partial fulfillment of the requirements for the degree of
Doctor of Philosophy (Ecology and Evolutionary Biology)
In The University of Michigan 2007
Doctoral Committee
Associate Professor Jianzhi Zhang Chair Professor Jeffrey C Long Professor David P Mindell Professor Priscilla K Tucker
i
To my father and mother
ii
ACKNOWLEDGEMENTS
My sincerest thanks go to my advisor Jianzhi Zhang for his continuous support in
my PhD program For the past five years he has always been there to listen give
valuable advice and bring out the good ideas in me His patience and generosity gave me
a lot of courage and confidence His wisdom and intelligence opened my mind so I
learned to enjoy the beauty of science and experience the world in an entirely new way
I am also grateful to my dissertation committee for their patience kindness and
constant guidance Thanks also to my labmates and cohorts Without their friendship and
support I cannot survive the competition in academic field Particularly Soochin Cho
and Ondrej Podlaha offered me tremendous help on my study and work and kept me in
good spirits I am honored to work with so many intelligent people in Zhang lab sharing
my ideas with them and listening to their remarkable opinions
I also owe many thanks to Prosanta Chakrabarty LaDonna Walker Julia Eussen for
helping me at any time and solving any unsolvable problems for me
Finally I thank my parents for giving me my life in the first place for supporting me
to pursue my dream and for listening to my complaints and frustrations No matter how
far I am away from them I can feel their love surrounding me at any time
iii
TABLE OF CONTENTS
DEDICATIONhelliphelliphelliphelliphelliphelliphelliphelliphelliphelliphelliphelliphelliphelliphelliphelliphelliphelliphelliphelliphelliphelliphelliphelliphelliphellip iiACNOWLEDGEMENTShelliphelliphelliphelliphelliphelliphelliphelliphelliphelliphelliphelliphelliphelliphelliphelliphelliphelliphelliphelliphellip iiiLIST OF FIGUREShelliphelliphelliphelliphelliphelliphelliphelliphelliphelliphelliphelliphelliphelliphelliphelliphelliphelliphelliphelliphelliphelliphelliphellip viLIST OF TABLEShelliphelliphelliphelliphelliphelliphelliphelliphelliphelliphelliphelliphelliphelliphelliphelliphelliphelliphelliphelliphelliphelliphelliphelliphellip viiiABSTRACThelliphelliphelliphelliphelliphelliphelliphelliphelliphelliphelliphelliphelliphelliphelliphelliphelliphelliphelliphelliphelliphelliphelliphelliphelliphelliphellip ixINTRODUCTIONhelliphelliphelliphelliphelliphelliphelliphelliphelliphelliphelliphelliphelliphelliphelliphelliphelliphelliphelliphelliphelliphelliphelliphellip 1CHAPTER 1 RAPID EVOLUTION OF MAMMALIAN X-LINKED TESTIS-EXPRESSED HOMEOBOX GENEShelliphelliphelliphelliphelliphelliphelliphelliphelliphelliphelliphelliphellip 9 11 ABSTRACThelliphelliphelliphelliphelliphelliphelliphelliphelliphelliphelliphelliphelliphelliphelliphelliphelliphelliphelliphelliphelliphellip 9 12 INTRODUCTIONhelliphelliphelliphelliphelliphelliphelliphelliphelliphelliphelliphelliphelliphelliphelliphelliphelliphelliphelliphelliphellip 10 13 RESULTShelliphelliphelliphelliphelliphelliphelliphelliphelliphelliphelliphelliphelliphelliphelliphelliphelliphelliphelliphelliphelliphelliphelliphellip 11 14 DISCUSSIONhelliphelliphelliphelliphelliphelliphelliphelliphelliphelliphelliphelliphelliphelliphelliphelliphelliphelliphelliphelliphelliphellip 19 15 MATERIALS AND METHODShelliphelliphelliphelliphelliphelliphelliphelliphelliphelliphelliphelliphelliphelliphellip 22 16 ACKNOWLEDGMENTShelliphelliphelliphelliphelliphelliphelliphelliphelliphelliphelliphelliphelliphelliphelliphellip 25 17 LITERACTURE CITEDhelliphelliphelliphelliphelliphelliphelliphelliphelliphelliphelliphelliphelliphelliphelliphelliphelliphellip 32CHAPTER 2 RAPID EVOLUTION OF PRIMATE ESX1 AN X-LINKED PLACENTA- AND TESTIS-EXPRESSED HOMEOBOX GENE 35 21 ABSTRACThelliphelliphelliphelliphelliphelliphelliphelliphelliphelliphelliphelliphelliphelliphelliphelliphelliphelliphelliphelliphelliphellip 35 22 INTRODUCTIONhelliphelliphelliphelliphelliphelliphelliphelliphelliphelliphelliphelliphelliphelliphelliphelliphelliphelliphelliphelliphellip 36 23 RESULTShelliphelliphelliphelliphelliphelliphelliphelliphelliphelliphelliphelliphelliphelliphelliphelliphelliphelliphelliphelliphelliphelliphelliphellip 38 24 DISCUSSIONhelliphelliphelliphelliphelliphelliphelliphelliphelliphelliphelliphelliphelliphelliphelliphelliphelliphelliphelliphelliphelliphellip 45 25 MATERIALS AND METHODShelliphelliphelliphelliphelliphelliphelliphelliphelliphelliphelliphelliphelliphelliphellip 48 26 ACKNOWLEDGMENTShelliphelliphelliphelliphelliphelliphelliphelliphelliphelliphelliphelliphelliphelliphelliphelliphelliphellip 50 27 LITERACTURE CITEDhelliphelliphelliphelliphelliphelliphelliphelliphelliphelliphelliphelliphelliphelliphelliphelliphelliphellip 59CHAPTER 3 RELAXATION OF SELECTIVE CONSTRAINT AND LOSS OF FUNCTION IN THE EVOLUTION OF HUMAN BITTER TASTE RECEPTOR GENEShelliphelliphelliphelliphelliphelliphelliphelliphelliphelliphelliphelliphelliphelliphelliphelliphelliphelliphelliphelliphelliphelliphelliphellip 62 31 ABSTRACThelliphelliphelliphelliphelliphelliphelliphelliphelliphelliphelliphelliphelliphelliphelliphelliphelliphelliphelliphelliphelliphellip 62 32 INTRODUCTIONhelliphelliphelliphelliphelliphelliphelliphelliphelliphelliphelliphelliphelliphelliphelliphelliphelliphelliphelliphelliphellip 62 33 RESULTShelliphelliphelliphelliphelliphelliphelliphelliphelliphelliphelliphelliphelliphelliphelliphelliphelliphelliphelliphelliphelliphelliphelliphellip 64 34 DISCUSSIONhelliphelliphelliphelliphelliphelliphelliphelliphelliphelliphelliphelliphelliphelliphelliphelliphelliphelliphelliphelliphelliphellip 72 35 MATERIALS AND METHODShelliphelliphelliphelliphelliphelliphelliphelliphelliphelliphelliphelliphelliphelliphellip 76 36 ACKNOWLEDGMENTShelliphelliphelliphelliphelliphelliphelliphelliphelliphelliphelliphelliphelliphelliphelliphelliphelliphellip 78 37 LITERACTURE CITEDhelliphelliphelliphelliphelliphelliphelliphelliphelliphelliphelliphelliphelliphelliphelliphelliphelliphellip 85CHAPTER 4 ADAPTIVE PSEUDOGENIZATION OF CASPASE12 IN HUMAN EVOLUTIONhelliphelliphelliphelliphelliphelliphelliphelliphelliphelliphelliphelliphelliphelliphelliphelliphelliphelliphelliphelliphelliphelliphellip 89 41 ABSTRACThelliphelliphelliphelliphelliphelliphelliphelliphelliphelliphelliphelliphelliphelliphelliphelliphelliphelliphelliphelliphelliphellip 89
iv
42 INTRODUCTIONhelliphelliphelliphelliphelliphelliphelliphelliphelliphelliphelliphelliphelliphelliphelliphelliphelliphelliphelliphelliphellip 89 43 RESULTShelliphelliphelliphelliphelliphelliphelliphelliphelliphelliphelliphelliphelliphelliphelliphelliphelliphelliphelliphelliphelliphelliphelliphellip 92 44 DISCUSSIONhelliphelliphelliphelliphelliphelliphelliphelliphelliphelliphelliphelliphelliphelliphelliphelliphelliphelliphelliphelliphelliphellip 98 45 MATERIALS AND METHODShelliphelliphelliphelliphelliphelliphelliphelliphelliphelliphelliphelliphelliphelliphellip 101 46 ACKNOWLEDGMENTShelliphelliphelliphelliphelliphelliphelliphelliphelliphelliphelliphelliphelliphelliphelliphelliphelliphellip 105 47 LITERACTURE CITEDhelliphelliphelliphelliphelliphelliphelliphelliphelliphelliphelliphelliphelliphelliphelliphelliphelliphellip 113
v
LIST OF FIGURES Figure 11 Phylogenetic tree of TGIFLX TGIF2 and TGIF geneshelliphelliphelliphelliphelliphelliphellip 26
Figure 12 Alignment of TGIFLX sequences of 16 primateshelliphelliphelliphelliphelliphelliphelliphelliphellip 27
Figure 13 Pairwise comparisons of dS and dN among 16 primate TGIFLX sequences for (A) the entire sequence (B) nonhomeodomain regions and (C) the homeodomainhelliphelliphelliphelliphelliphelliphelliphelliphelliphelliphelliphelliphelliphelliphelliphelliphelliphelliphelliphelliphelliphelliphelliphelliphelliphelliphelliphellip 28
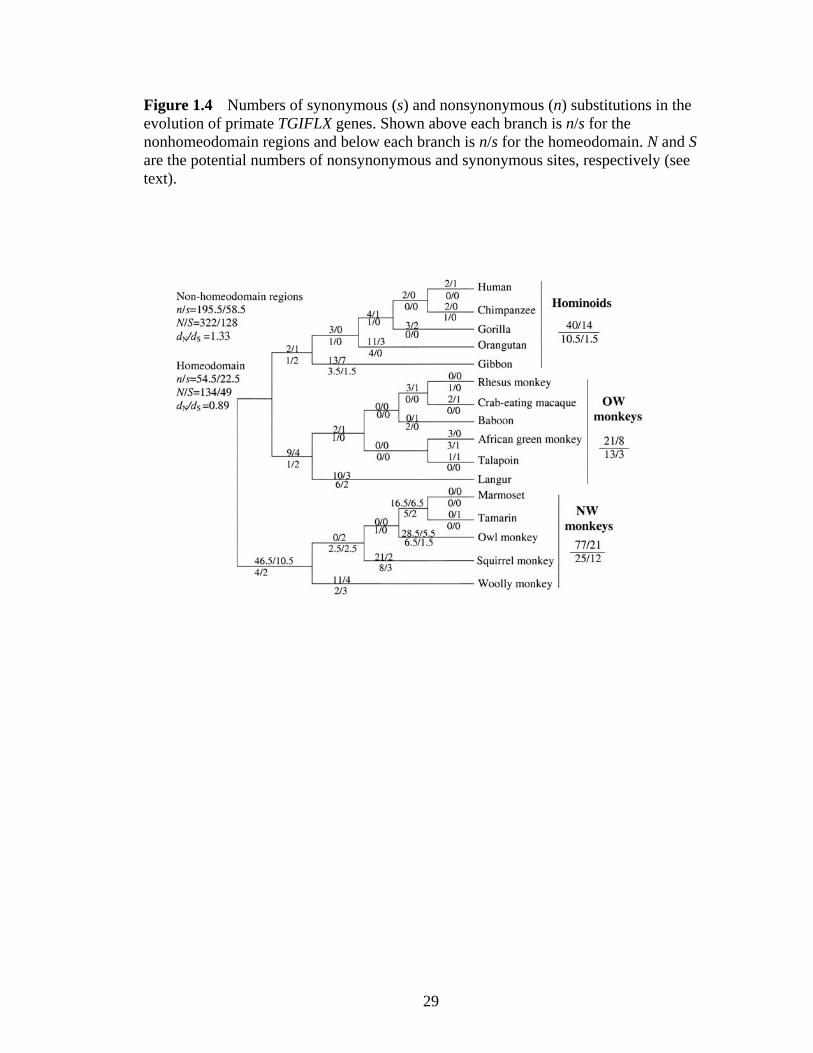
Figure 14 Numbers of synonymous (s) and nonsynonymous (n) substitutions in the evolution of primate TGIFLX geneshelliphelliphelliphelliphelliphelliphelliphelliphelliphelliphelliphelliphelliphelliphelliphelliphelliphellip 29
Figure 15 Distribution of the evolutionary rate of 64 mammalian homeobox geneshelliphelliphelliphelliphelliphelliphelliphelliphelliphelliphelliphelliphelliphelliphelliphelliphelliphelliphelliphelliphelliphelliphelliphelliphelliphelliphelliphelliphelliphelliphellip 30
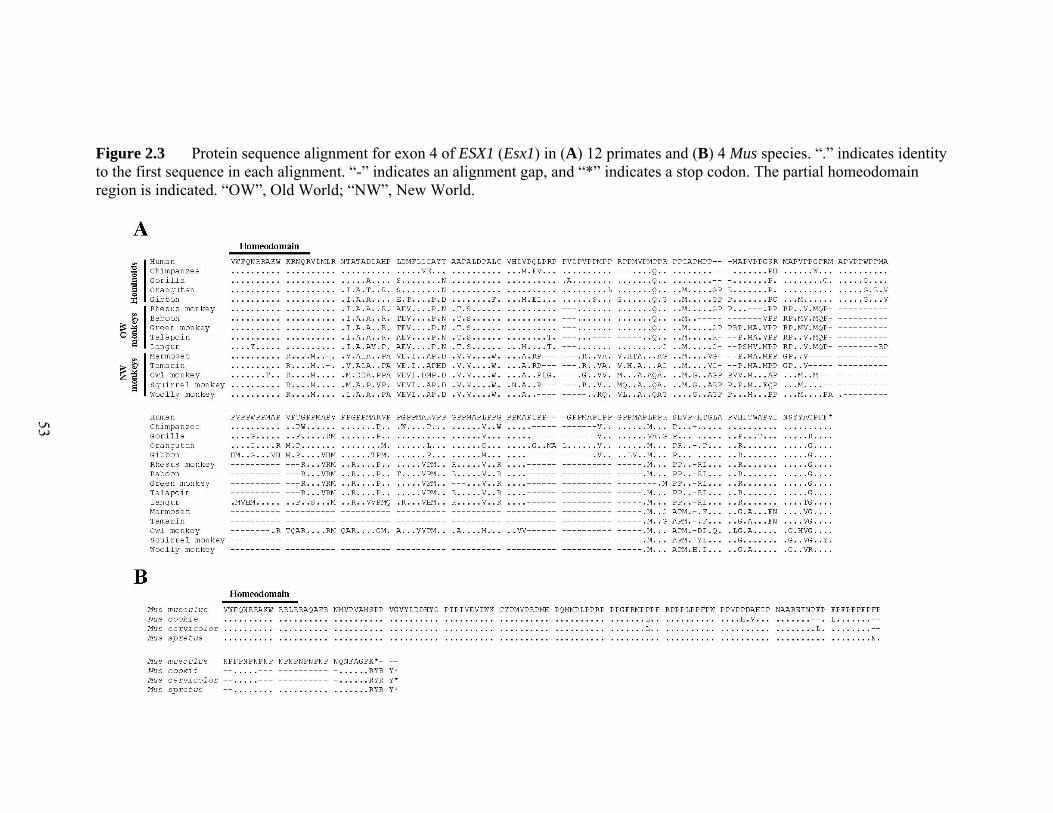
Figure 21 Structures of the orthologous (A) human ESX1 and (B) mouse Esx1 genes adapted from (Fohn and Behringer 2001) and (Li et al 1997)helliphelliphelliphelliphelliphellip 51 Figure 22 Alignment of human and chimpanzee ESX1 protein sequenceshelliphellip 52 Figure 23 Protein sequence alignment for exon 4 of ESX1 (Esx1) in (A) 12 primates and (B) 4 Mus specieshelliphelliphelliphelliphelliphelliphelliphelliphelliphelliphelliphelliphelliphelliphelliphelliphelliphelliphelliphelliphellip 53 Figure 24 Pairwise synonymous (dS) and nonsynonymous (dN) nucleotide distances for (A) the entire exon 4 of ESX1 among 15 primates (B) the C-terminal non-homeodomain region of ESX1 among 15 primates and (C) the exon 4 of Esx1 among 4 Mus specieshelliphelliphelliphelliphelliphelliphelliphelliphelliphelliphelliphelliphelliphelliphelliphelliphelliphelliphelliphelliphelliphelliphelliphelliphellip 54 Figure 25 Separate alignments of translated ESX1 exon 4 of (A) hominoids (B) Old World monkeys and (C) New World monkeyshelliphelliphelliphelliphelliphelliphelliphelliphelliphelliphelliphelliphellip 55 Figure 26 Numbers of synonymous (s) and nonsynonymous (n) substitutions in the evolution of primate ESX1helliphelliphelliphelliphelliphelliphelliphelliphelliphelliphelliphelliphelliphelliphelliphelliphelliphelliphelliphelliphellip 56 Figure 31 Evolutionary relationships of 113 putatively functional TAS2R genes from the human chimpanzee mouse and rathelliphelliphelliphelliphelliphelliphelliphelliphelliphelliphelliphelliphelliphelliphelliphellip 79 Figure 32 Comparison of dNdS among different functional domains of TAS2Rshellip 80
vi
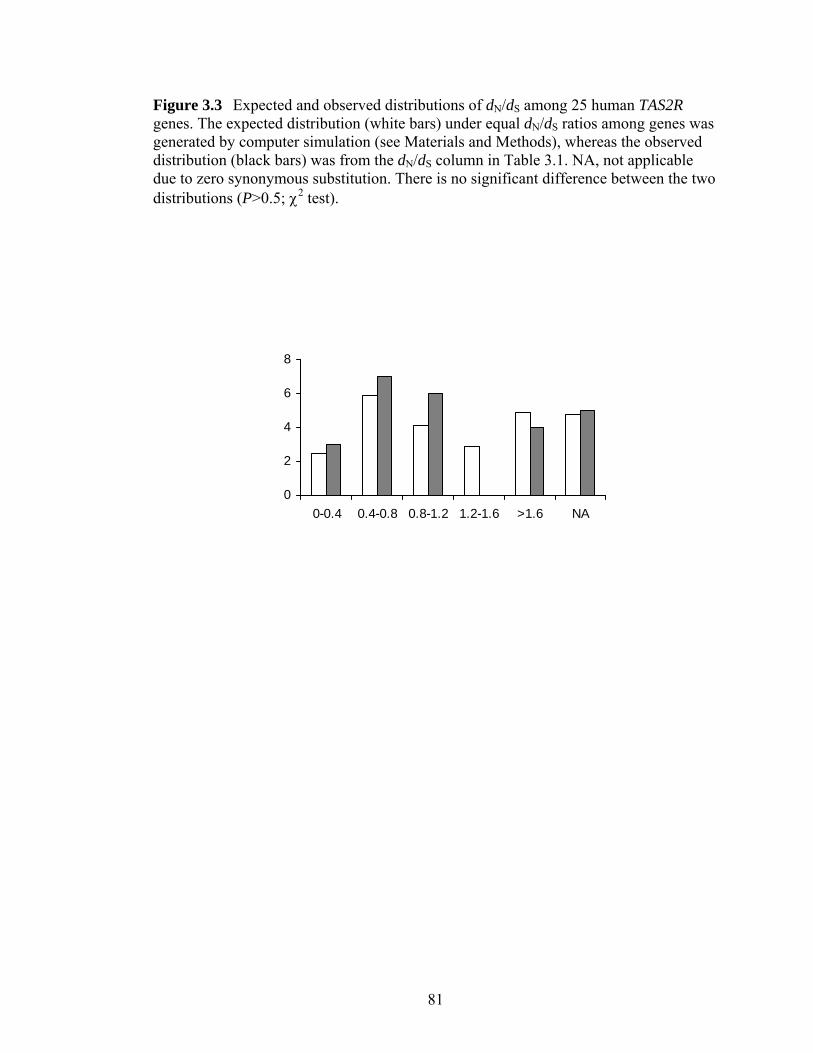
Figure 33 Expected and observed distributions of dNdS among 25 human TAS2R geneshelliphelliphelliphelliphelliphelliphelliphelliphelliphelliphelliphelliphelliphelliphelliphelliphelliphelliphelliphelliphelliphelliphelliphelliphelliphelliphelliphelliphelliphelliphellip
81
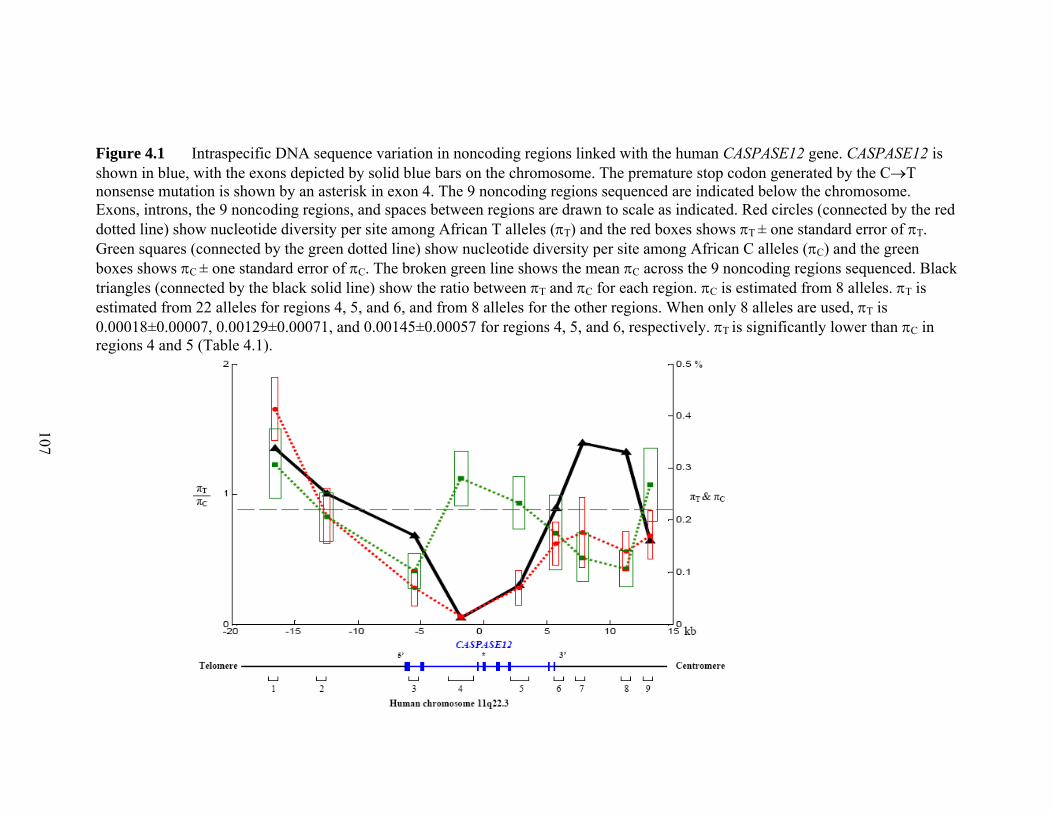
Figure 41 Intraspecific DNA sequence variation in noncoding regions linked with the human CASPASE12 genehelliphelliphelliphelliphelliphelliphelliphelliphelliphelliphelliphelliphelliphelliphelliphelliphelliphelliphelliphelliphelliphellip 107 Figure 42 Genotypes of the 4 CC homozygotes and 4 TT homozygotes that were sequenced in all 9 noncoding regionshelliphelliphelliphelliphelliphelliphelliphelliphelliphelliphelliphelliphelliphelliphelliphelliphelliphelliphellip 108 Figure 43 Estimating the age of the null allele and the onset of the selective sweep 109
vii
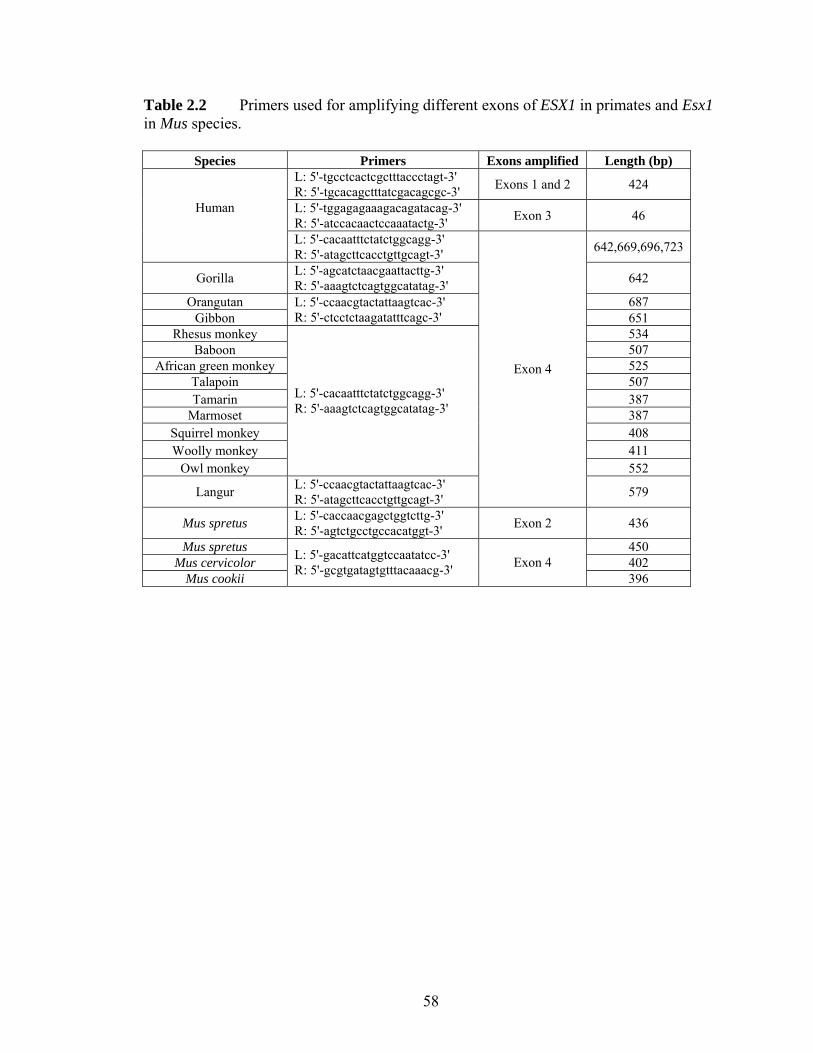
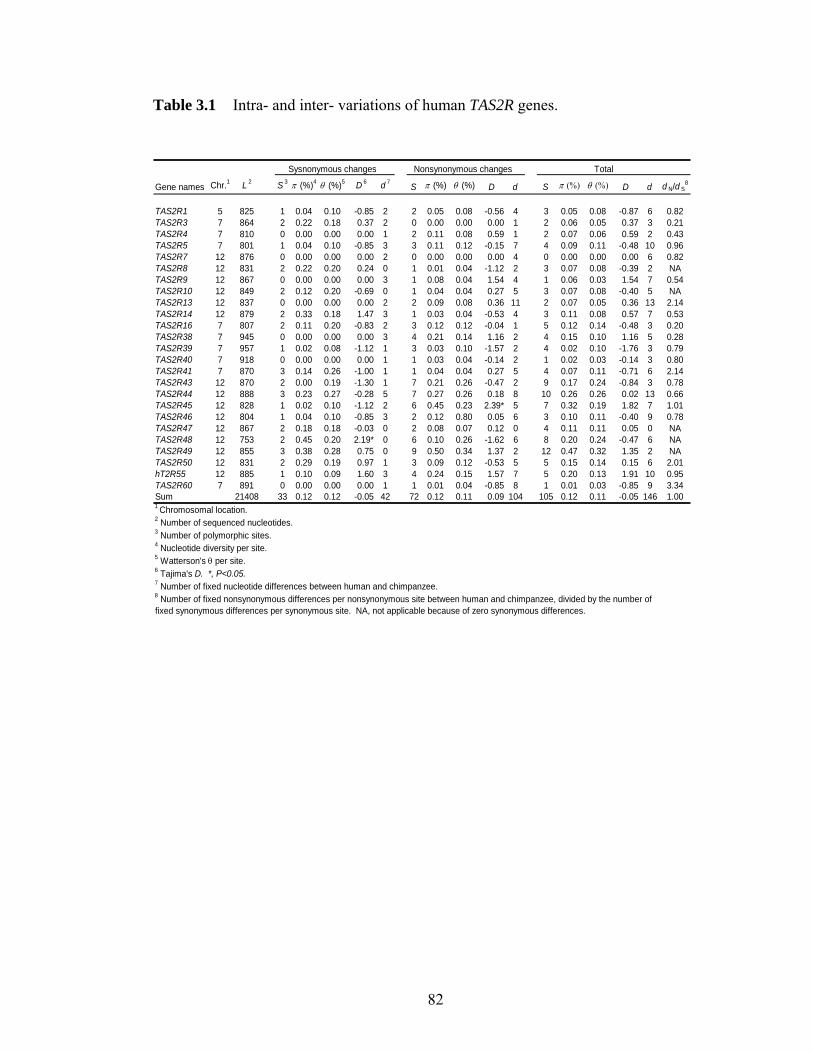
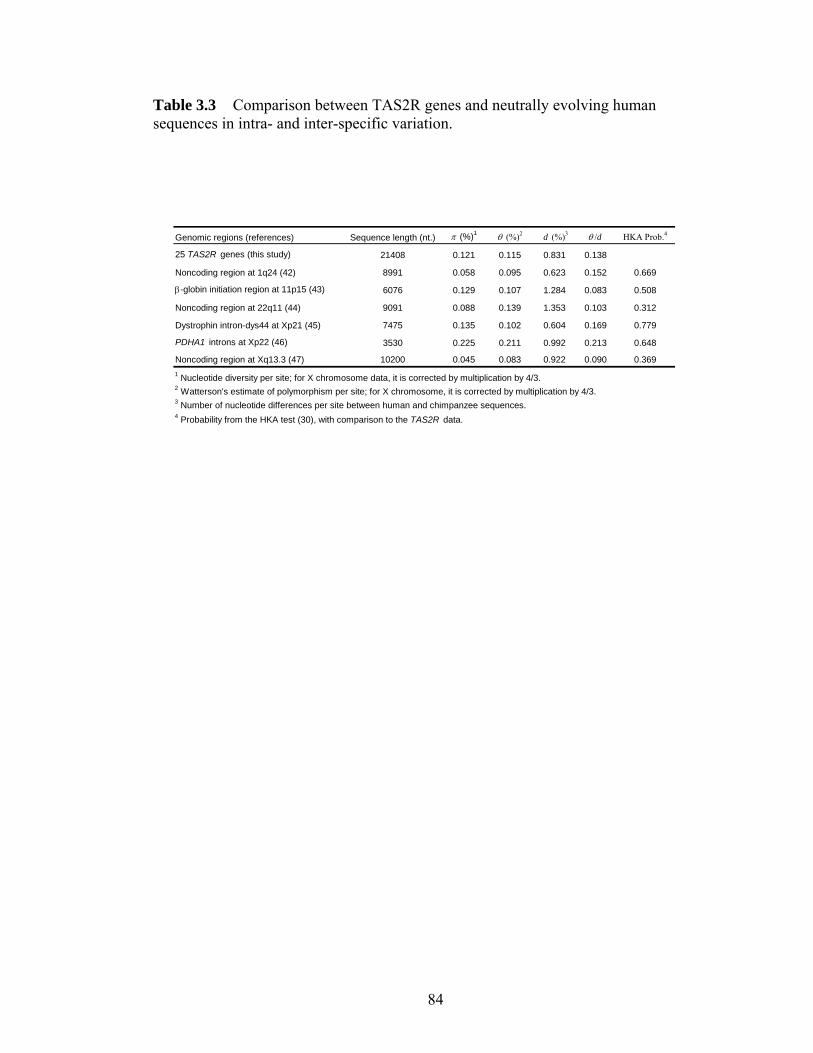
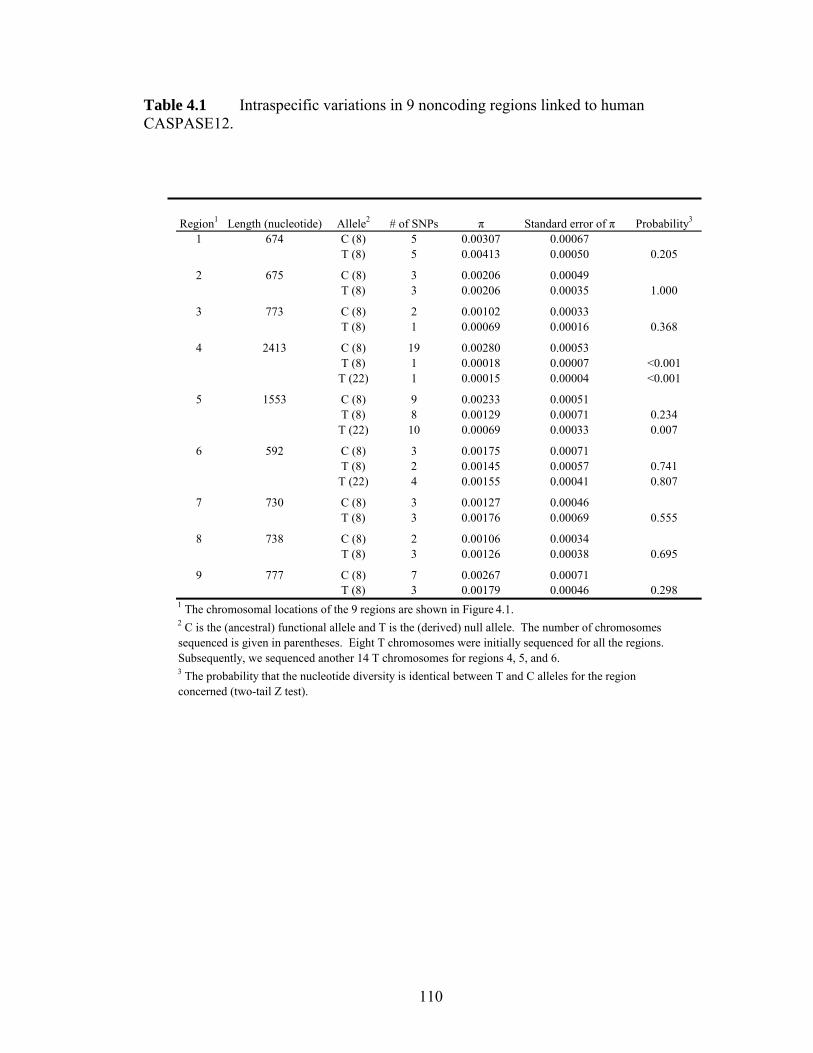
LIST OF TABLES Table 11 Protein p-distances between orthologous human and mouse homeobox geneshelliphelliphelliphelliphelliphelliphelliphelliphelliphelliphelliphelliphelliphelliphelliphelliphelliphelliphelliphelliphelliphelliphelliphelliphelliphelliphelliphelliphelliphellip 31 Table 21 ESX1 exon 4 sequence variations among 32 menhelliphelliphelliphelliphelliphelliphelliphelliphellip 57 Table 22 Primers used for amplifying different exons of ESX1 in primates and Esx1 in Mus specieshelliphelliphelliphelliphelliphelliphelliphelliphelliphelliphelliphelliphelliphelliphelliphelliphelliphelliphelliphelliphelliphelliphelliphellip 58 Table 31 Intra- and inter- variations of human TAS2R geneshelliphelliphelliphelliphelliphelliphellip 82 Table 32 Rates of synonymous and nonsynonymous nucleotide changes in human TAS2Rshelliphelliphelliphelliphelliphelliphelliphelliphelliphelliphelliphelliphelliphelliphelliphelliphelliphelliphelliphelliphelliphelliphelliphelliphelliphelliphellip 83 Table 41 Intraspecific variations in 9 noncoding regions linked to human CASPASE12helliphelliphelliphelliphelliphelliphelliphelliphelliphelliphelliphelliphelliphelliphelliphelliphelliphelliphelliphelliphelliphelliphelliphelliphelliphelliphelliphellip 110 Table 42 Results from coalescent simulationshelliphelliphelliphelliphelliphelliphelliphelliphelliphelliphelliphelliphellip 111 Table 43 SNPs identified in the noncoding regions linked with CASP12helliphelliphellip 112
viii
ABSTRACT
ldquoWhat makes us humansrdquo is one of the most fascinating questions in evolution The
genetic basis of the phenotypic differences between humans and close evolutionary
relatives has been a hot topic for molecular evolutionary studies Investigating human
genetic variations within the context of primates will provide valuable information about
the development and function of important primate features and unique human features
In Chapter 1 and 2 I conducted detailed evolutionary studies on two homeobox
genes TGIFLX and ESX1 Evolutionary analysis provided evidence for positive selection
acting on the two genes during primate evolution Given the key roles played by
homeobox genes in various developmental processes the identification of non-conserved
homeobox genes is interesting because such homeobox genes may regulate important
developmental processes that vary among relatively closely related species TGIFLX and
ESX1 are located on X chromosome and involved in male spermatogenesis process The
finding of positive selection in these genes suggests that even in the recent past of human
and primate evolution spermatogenesis has been subject to adaptive modifications
Characterizing genetic variations within humans is also a powerful way to detect the
genetic basis of human uniqueness Gene loss is an important source of human-specific
genetic change Genes related to chemoreception and immunity account for a large
proportion of lost genes in the human lineage In Chapter 3 I reported the relaxation of
selective constraint and loss of function in the evolution of human bitter taste receptor
genes probably due to the change in diet use of fire and reliance on other means of
ix
toxin avoidance that emerged in human evolution This finding provided further evidence
for reduced sensory capabilities of humans in comparison to many other mammals
Gene loss or pseudogenization has also been proposed to serve as an engine of
evolutionary change especially during human origins (the ldquoless-is-morerdquo hypothesis) In
Chapter 4 I focused on CASPASE12 a cysteinyl aspartate proteinase participating in
inflammatory and innate immune response to endotoxins My results provided population
genetic evidence that the nearly complete fixation of a null allele at CASPASE12 has been
driven by positive selection probably because the null allele confers protection from
severe sepsis Furthermore the identification and analysis of human-specific
pseudogenes open the door for understanding the roles of gene losses in human origins
and the demonstration that gene loss itself can be adaptive supports and extends the
lsquolsquoless-is-morersquorsquo hypothesis
x
INTRODUCTION
The finding of DNA double helix structure followed by dramatic achievements in
biochemical techniques such as PCR (Polymerase Chain Reaction) DNA sequencing
and genetic engineering opened a new era for evolutionary study Characterizing genetic
differences at the level of DNA molecules and its products (protein or RNA molecules)
has moved the study of evolution into a brand new dimension One of the most
fascinating questions in evolution is what makes us humans In addition to several
well-known features such as bipedalism enlarged brains language capability and other
high-order cognitive functions numerous traits differentiate humans from other great
apes (Varki and Altheide 2005) With rapid progress in human genetics comparative
genomes and molecular evolution the evolutioanry basis of these differences has begun
to be unraveled
Investigating our ldquohumannessrdquo in the context of primates will tell us what is
common to primates and what is unique to humans Phylogenetic analysis of primate
genomic data can provide valuable clues about the development and function of
important primate features and the genetic basis of human uniqueness So far finished or
draft primate genome sequences are available only for human common chimpanzee and
rhesus macaque No New World monkey has been sequenced in genomic scale despite
1
their evolutionary significance one more step further the human-rhesus relationship In
order to learn the mechanism of molecular evolution in a phylogenetic framework
encompassing the entire order Primates I focused on candidate gene investigation in my
dissertation work A candidate gene approach takes advantage of a priori knowledge
obtained from genetic biochemical or physiological assays about specific genes and can
acquire striking outcomes (Varki and Altheide 2005) FOXP2 evolution is a good
example The conserved transcriptional factor FOXP2 is required for speech development
in humans (Lai et al 2001) Intriguingly two adaptive amino acid replacements were
found in hominin evolution suggesting that these two substitutions were at least partially
responsible for the emergence of human speech and language (Enard et al 2002 Zhang
et al 2002)
In the first half of this thesis (Chapter 1 amp 2) I provide evidence for positive
selection acting on two homeobox genes TGIFLX and ESX1 during primate evolution
Homeobox genes are characterized by the presence of a sequence motif known as the
homeobox which encodes the ~60-amino-acid homeodomain a helix-turn-helix DNA
binding domain (Gehring et al 1994) In humans there are about 230 homeobox genes
(Nam and Nei 2005) encoding a large family of transcription factors that play key roles
in various developmental processes such as body-plan specification pattern formation
and cell-fate determination (Gehring et al 1994) Due to their functional importance
most homeodomain proteins are evolutionarily highly conserved in sequence (McGinnis
et al 1984 Gehring et al 1994 Zhang and Nei 1996) Hence the identification of
2
non-conserved homeobox genes would be particularly interesting because such
homeobox genes may regulate important developmental processes that vary among
relatively closely related species
Two such rapidly-evolving homeobox genes are well known from fruit flies (OdsH)
and rodents (Rhox5) respectively OdsH is an X-linked gene involved in spermatogenesis
and it is partly responsible for the hybrid male sterility between Drosophila simulans and
D mauritiana (Ting et al 1998) Mouse Rhox5 (also known as Pem) is expressed in both
male and female reproductive tissues (Sutton and Wilkinson 1997) Targeted disruption of
Rhox5 increases male germ cell apoptosis and reduces sperm production sperm motility
and fertility (Maclean et al 2005) In fact Rhox5 is just one member of a recently
expanded homeobox gene cluster known as the Rhox cluster on the mouse X
chromosome (Maclean et al 2005 MacLean et al 2006 Morris et al 2006 Wang and
Zhang 2006) Several other members of the cluster are also expressed in reproductive
tissues (Maclean et al 2005) and evolve rapidly (Jackson et al 2006 Wang and Zhang
2006) Interestingly each of the two cases involves a homeobox gene that is X-linked and
testis-expressed In my work I identified rapid evolution in another two X-linked
testis-expressed homeobox genes from primates TGIFLX (Chapter 1) and ESX1 (Chapter
2) Positive selection has been acting on both genes during primate evolution The
evolutionary patterns in light of the structure and function of these two genes are
discussed
In the second half of this thesis (Chapter 3 amp 4) I focus on human-specific gene
3
evolution by characterizing genetic variations within humans In addition to amino acid
replacements (like the cases presented in Chapter 1 amp 2) gene expression modification
generation of new genes and loss of existing genes are also genetic mechanisms
underlying human uniqueness In particular gene loss or pseudogenization leads to
immediate loss of gene function which probably affects organisms to a greater extent
than most amino acid replacements do A number of genes are known to have been lost in
the human lineage since its divergence from the chimpanzee lineage (Chou et al 1998
Szabo et al 1999 Winter et al 2001 Gilad et al 2003 Hamann et al 2003 Meyer-Olson
et al 2003 Stedman et al 2004 Wang et al 2004 Fischer et al 2005 Go et al 2005
Perry et al 2005) Many of these genes are involved in chemoreception and immunity
such as the olfactory receptor (OR) genes (Gilad et al 2003) and vomeronasal pheromone
receptor genes (Zhang and Webb 2003 Grus et al 2005) These cases of gene loss may
reflect significant changes in the way humans interact with each other or with the
environment human diet and human behavior during the past few million years In
Chapter 3 I present my finding of relaxation of selective constraint and loss of function
in the evolution of human bitter taste receptor genes which provide further evidence for
reduced sensory capabilities of humans in comparison to many other mammals
Recently Olson (1999) and Olson and Varki (2003) proposed the ldquoless-is-morerdquo
hypothesis suggesting that gene loss may serve as an engine of evolutionary change This
hypothesis is particularly intriguing for human evolution as several human gene losses
have been proposed to provide opportunities for adaptations and be responsible for
4
human-specific phenotypes For example the pseudogenization of the sarcomeric myosin
gene MYH16 at the time of the emergence of the genus Homo is thought to be responsible
for the marked size reduction in hominin masticatory muscles which may have allowed
the brain-size expansion (Stedman et al 2004) (but also see Perry et al 2005) In another
example the human-specific inactivation of the gene encoding the enzyme
CMP-N-acetylneuraminic acid hydroxylase (CMAH) led to the deficiency of the
mammalian common sialic acid Neu5Gc (N-glycolylneuraminic acid) on the human cell
surface (Chou et al 1998) This inactivation was due to an Alu-mediated sequence
replacement (Hayakawa et al 2001) that occurred ~27 million years ago (Chou et al
2002) and may have had several important consequences for human biology and
evolution (Varki 2001) In Chapter 4 I present a case of adaptive gene loss in humans I
provide evidence that the nearly complete fixation of a null allele at CASPASE12
(CASP12) has been driven by positive selection probably because the allele confers
lowered susceptibility to severe sepsis This finding opens the door for understanding the
roles of gene losses in human origins and the demonstration that gene loss itself can be
adaptive supports and extends the ldquoless-is-morerdquo hypothesis
5
LITERATURE CITED
Chou HH Hayakawa T Diaz S Krings M Indriati E Leakey M Paabo S Satta Y Takahata N Varki A (2002) Inactivation of CMP-N-acetylneuraminic acid hydroxylase occurred prior to brain expansion during human evolution Proc Natl Acad Sci U S A 9911736-11741
Chou HH Takematsu H Diaz S Iber J Nickerson E Wright KL Muchmore EA Nelson DL Warren ST Varki A (1998) A mutation in human CMP-sialic acid hydroxylase occurred after the Homo-Pan divergence Proc Natl Acad Sci U S A 9511751-11756
Enard W Przeworski M Fisher SE Lai CSL Wiebe V Kitano T Monaco AP Paabo S (2002) Molecular evolution of FOXP2 a gene involved in speech and language Nature 418869-872
Fischer A Gilad Y Man O Paabo S (2005) Evolution of bitter taste receptors in humans and apes Mol Biol Evol 22432-436
Gehring WJ Affolter M Burglin T (1994) Homeodomain proteins Annual review of biochemistry 63487-526
Gilad Y Man O Paabo S Lancet D (2003) Human specific loss of olfactory receptor genes Proc Natl Acad Sci U S A 1003324-3327
Go Y Satta Y Takenaka O Takahata N (2005) Lineage-specific loss of function of bitter taste receptor genes in humans and nonhuman primates Genetics 170313-326
Grus WE Shi P Zhang YP Zhang JZ (2005) Dramatic variation of the vomeronasal pheromone receptor gene repertoire among five orders of placental and marsupial mammals Proceedings of the National Academy of Sciences of the United States of America 1025767-5772
Hamann J Kwakkenbos MJ de Jong EC Heus H Olsen AS van Lier RA (2003) Inactivation of the EGF-TM7 receptor EMR4 after the Pan-Homo divergence Eur J Immunol 331365-1371
Hayakawa T Satta Y Gagneux P Varki A Takahata N (2001) Alu-mediated inactivation of the human CMP- N-acetylneuraminic acid hydroxylase gene Proc Natl Acad Sci U S A 9811399-11404
Jackson M Watt AJ Gautier P Gilchrist D Driehaus J Graham GJ Keebler J Prugnolle F Awadalla P Forrester LM (2006) A murine specific expansion of the Rhox cluster involved in embryonic stem cell biology is under natural selection BMC genomics 7212
Lai CSL Fisher SE Hurst JA Vargha-Khadem F Monaco AP (2001) A forkhead-domain gene is mutated in a severe speech and language disorder Nature 413519-523
Maclean JA 2nd Chen MA Wayne CM Bruce SR Rao M Meistrich ML Macleod C Wilkinson MF (2005) Rhox a new homeobox gene cluster Cell 120369-382
MacLean JA 2nd Lorenzetti D Hu Z Salerno WJ Miller J Wilkinson MF (2006) Rhox homeobox gene cluster recent duplication of three family members Genesis
6
44122-129 McGinnis W Hart CP Gehring WJ Ruddle FH (1984) Molecular cloning and
chromosome mapping of a mouse DNA sequence homologous to homeotic genes of Drosophila Cell 38675-680
Meyer-Olson D Brady KW Blackard JT Allen TM Islam S Shoukry NH Hartman K Walker CM Kalams SA (2003) Analysis of the TCR beta variable gene repertoire in chimpanzees identification of functional homologs to human pseudogenes J Immunol 1704161-4169
Morris L Gordon J Blackburn CC (2006) Identification of a tandem duplicated array in the Rhox alpha locus on mouse chromosome X Mamm Genome 17178-187
Nam J Nei M (2005) Evolutionary change of the numbers of homeobox genes in bilateral animals Molecular biology and evolution 222386-2394
Olson MV (1999) When less is more gene loss as an engine of evolutionary change Am J Hum Genet 6418-23
Olson MV Varki A (2003) Sequencing the chimpanzee genome insights into human evolution and disease Nat Rev Genet 420-28
Perry GH Verrelli BC Stone AC (2005) Comparative analyses reveal a complex history of molecular evolution for human MYH16 Mol Biol Evol 22379-382
Stedman HH Kozyak BW Nelson A Thesier DM Su LT Low DW Bridges CR Shrager JB Minugh-Purvis N Mitchell MA (2004) Myosin gene mutation correlates with anatomical changes in the human lineage Nature 428415-418
Sutton KA Wilkinson MF (1997) Rapid evolution of a homeodomain evidence for positive selection J Mol Evol 45579-588
Szabo Z Levi-Minzi SA Christiano AM Struminger C Stoneking M Batzer MA Boyd CD (1999) Sequential loss of two neighboring exons of the tropoelastin gene during primate evolution J Mol Evol 49664-671
Ting CT Tsaur SC Wu ML Wu CI (1998) A rapidly evolving homeobox at the site of a hybrid sterility gene Science 2821501-1504
Varki A (2001) Loss of N-glycolylneuraminic acid in humans Mechanisms consequences and implications for hominid evolution Am J Phys Anthropol Suppl 3354-69
Varki A Altheide TK (2005) Comparing the human and chimpanzee genomes Searching for needles in a haystack Genome Research 151746-1758
Wang X Thomas SD Zhang J (2004) Relaxation of selective constraint and loss of function in the evolution of human bitter taste receptor genes Hum Mol Genet 132671-2678
Wang X Zhang J (2006) Remarkable expansions of an X-linked reproductive homeobox gene cluster in rodent evolution Genomics 8834-43
Winter H Langbein L Krawczak M Cooper DN Jave-Suarez LF Rogers MA Praetzel S Heidt PJ Schweizer J (2001) Human type I hair keratin pseudogene phihHaA has functional orthologs in the chimpanzee and gorilla evidence for recent
7
inactivation of the human gene after the Pan-Homo divergence Hum Genet 10837-42
Zhang J Nei M (1996) Evolution of Antennapedia-class homeobox genes Genetics 142295-303
Zhang JZ Webb DM (2003) Evolutionary deterioration of the vomeronasal pheromone transduction pathway in catarrhine primates Proceedings of the National Academy of Sciences of the United States of America 1008337-8341
Zhang JZ Webb DM Podlaha O (2002) Accelerated protein evolution and origins of human-specific features FOXP2 as an example Genetics 1621825-1835
8
CHAPTER 1
RAPID EVOLUTION OF MAMMALIAN X-LINKED TESTIS-EXPRESSED HOMEOBOX GENES
11 ABSTRACT
Homeobox genes encode transcription factors that function in various
developmental processes and are usually evolutionarily conserved in their sequences
However two X-chromosome-linked testis-expressed homeobox genes one from rodents
and the other from fruit flies are known to evolve rapidly under positive Darwinian
selection Here we report yet another case from primates TGIFLX is an X-linked
homeobox gene that originated by retroposition of the autosomal gene TGIF2 most likely
in a common ancestor of rodents and primates While TGIF2 is ubiquitously expressed
TGIFLX is exclusively expressed in adult testis A comparison of the TGIFLX sequences
among 16 anthropoid primates revealed a significantly higher rate of nonsynonymous
nucleotide substitution (dN) than synonymous substitution (dS) strongly suggesting the
action of positive selection Although the high dNdS ratio is most evident outside the
homeobox the homeobox has a dNdS of 089 and includes two codons that are likely
under selection Furthermore the rate of radical amino acid substitutions that alter amino
acid charge is significantly greater than that of conservative substitutions suggesting that
the selection promotes diversity of the protein charge profile More interestingly an
analysis of 64 orthologous homeobox genes from humans and mice shows substantially
higher rates of amino acid substitution in X-linked testis-expressed genes than in other
9
genes These results suggest a general pattern of rapid evolution of mammalian X-linked
testis-expressed homeobox genes Although the physiological function of and the exact
selective agent on TGIFLX and other rapidly evolving homeobox genes are unclear the
common expression pattern of these transcription factor genes led us to conjecture that the
selection is related to one or more aspects of male reproduction and may contribute to
speciation
12 INTRODUCTION
Homeobox genes are characterized by the presence of an 60-codon sequence
motif known as the homeobox which encodes a helix-turn-helix DNA-binding domain
named the homeodomain (Gehring et al 1994a) Initially identified from fruit flies
(Mcginnis et al 1984 Scott and Weiner 1984) homeobox-containing genes have now
been found in fungi plants and animals and form a large gene superfamily (Kappen et al
1993 Bharathan et al 1997 Kappen 2000 Banerjee-Basu and Baxevanis 2001)
Homeobox genes function as transcription factors that regulate the expressions of their
target genes in various developmental processes such as body-plan specification pattern
formation and cell fate determination (Gehring et al 1994a) Because of their
fundamental importance in development homeobox genes are of substantial interest to
evolutionary biologists as they may provide key information on the evolution of
development (Shepherd et al 1984 Garciafernandez and Holland 1994 Zhang and Nei
1996 Carroll et al 2001) Earlier studies showed that homeobox genes particularly the
homeobox region are conserved in evolution (Mcginnis et al 1984 Gehring et al 1994a)
although two notable exceptions Pem in rodents and OdsH in Drosophila have been
10
reported (Sutton and Wilkinson 1997 Ting et al 1998) In both cases high rates of amino
acid substitution were found in the homeodomain and the action of positive selection was
suggested Interestingly both genes are located on X chromosomes and are expressed in
testis although Pem is also expressed in female reproductive tissues OdsH is in part
responsible for the hybrid male sterility between Drosophila simulans and D mauritiana
(Ting et al 1998) These intriguing findings suggest that homeobox genes may also be
involved in developmental processes that vary among closely related species Because
such developmental variations may lead to reproductive isolation and speciation (Ting et
al 1998) it is of interest to identify new cases of rapidly evolving homeobox genes Here
we describe the identification of such a rapidly evolving homeobox gene TGIFLX
[TG-interacting factor (TGIF)-like X] from primates TGIFLX is a member of TGIFs a
group of transcription factors of the three amino-acid loop extension (TALE) superclass
of the homeodomain protein family (Bertolino et al 1995 Blanco-Arias et al 2002)
Earlier evolutionary analyses suggested that the X-chromosome-linked TGIFLX gene
originated by retroposition of the autosomal TGIF2 gene a member of TGIFs
(Blanco-Arias et al 2002) In contrast to TGIF2 which is ubiquitously expressed
TGIFLX is specifically expressed in the germ cells of adult testis (Blanco-Arias et al
2002 Lai et al 2002) In this report we show that (1) the retroposition event predated the
divergence of primates and rodents (2) TGIFLX evolved rapidly in primates under
positive selection and (3) mammalian X-linked testis-expressed homeobox genes evolve
rapidly in general
13 RESULTS
11
131 Retroposition predated the human-mouse separation
To determine when the retroposition that generated TGIFLX occurred in evolution
we conducted a BLAST search in the GenBank for homologous sequences to TGIFLX
and its mother gene TGIF2 We identified a homeobox gene Tex1 (also known as
Tgifx1-pending) in the mouse that is mapped to a region of the X chromosome that is
syntenic with human Xq213 where TGIFLX is located Tex1 is also specifically
expressed in the germ cells of mouse testis (Lai et al 2002) These facts suggest that
mouse Tex1 is orthologous to human TGIFLX Furthermore we obtained the gene
sequences of human and mouse TGIF2 from GenBank and conducted a phylogenetic
analysis of these sequences The human and mouse TGIF sequences are used as
outgroups The gene tree shows high bootstrap support for the retroposition that gave
birth to TGIFLX occurring in a common ancestor of primates and rodents (Figure 11)
Although retroposition usually generates pseudogenes a number of
retroposition-mediated functional genes have been identified (Long 2001) TGIFLX is
apparently a functional gene as its open reading frame has been maintained throughout
mammalian evolution Retroposition is a mutation-prone process due to a high error rate
in retrotranscription Also newly duplicated genes often have elevated rates of evolution
due to relaxation of functional constraints andor positive selection (Zhang 2003) Thus
one may expect to see a burst of substitutions in the TGIFLX branch immediately
following the retroposition Interestingly the phylogenetic tree (Figure 11) shows that
TGIFLX evolves more rapidly than TGIF2 not only in this branch but also throughout its
evolutionary history We found that the number of amino acid substitutions per site
(Poisson distance) between the orthologous human and mouse TGIFLX genes is 0814 plusmn
12
0080 and the corresponding number for TGIF2 is 0031 plusmn 0013 their difference being
statistically significant (P lt 0001) Of 1880 orthologous human and rodent genes
analyzed by Makalowski and Boguski (1998) only 6 have substitution rates greater than
that of TGIFLX suggesting that it is evolving at an exceptionally high rate To further
characterize the substitution rate of TGIFLX we conducted a detailed evolutionary study
of this gene in primates
132 Positive selection on primate TGIFLX
The TGIFLX coding sequences from five hominoids and four OW monkeys were
reported by Blanco-Arias et al (2002) We here determined the orthologous sequences in
two additional OW monkeys and five NW monkeys Thus a total of 16 primate
sequences are analyzed here The alignment of these 16 protein sequences shows that they
are highly variable (Figure 12) The nonhomeodomain regions show the highest
variability although 25 of the 63 amino acid positions in the homeodomain are also
variable among the 16 primates Hydrophobic amino acids are usually conserved in
homeodomains in the present case 22 of the 29 hydrophobic sites are completely
conserved among the primate sequences and the remaining 7 also involve only
hydrophobic amino acid changes In the third helix of the homeodomain four amino
acids (W51 F52 N54 and R56 positions in the homeodomain) are known to be
conserved (Banerjee-Basu and Baxevanis 2001) which is also the case here Position 53
is usually occupied by a polar amino acid in homeodomains but was found to have a
small nonpolar amino acid in a previous analysis of TALE homeodomains (Burglin
1997) In our sequences position 53 is variable with either polar or nonpolar amino acids
13
To examine whether the high sequence variability is a result of positive selection we
computed the synonymous (dS) and nonsynonymous (dN) distances between each pair of
the sequences For the entire coding region higher dN than dS is observed in 93 of 120
pairwise comparisons (Figure 13A) suggesting the possible action of positive selection
This pattern is more apparent when only the nonhomeodomain regions are analyzed as
98 of the comparisons show dN gt dS (Figure 13B) For the homeodomain however only
39 of the comparisons show dN gt dS (Figure 13C) These results indicate that the
substitution rate and pattern may be different between amino acid positions inside and
outside the homeodomain
To test the hypothesis of positive selection more rigorously we used a
phylogeny-based approach (Zhang and Nei 1997) The phylogentic relationships of the 16
primates are assumed to follow the tree in Figure 14 This phylogeny is relatively well
established especially for the major divisions (Goodman et al 1998 Page and Goodman
2001 Singer et al 2003 Steiper and Ruvolo 2003) and use of alternative trees does not
affect our main conclusion On the basis of this tree we inferred the ancestral TGIFLX
gene sequences at all interior nodes of the tree and counted the numbers of synonymous
(s) and nonsynonymous (n) substitutions on each tree branch (Figure 14) We found that
the sums of n and s for all branches are 1955 and 585 respectively for the
nonhomeodomain regions The potential numbers of nonsynonymous (N) and
synonymous (S) sites are 322 and 128 respectively Thus ns = 334 is significantly
greater than NS = 251 (P = 0031 binomial test) The binomial test used here is more
conservative than Fishers exact test used in Zhang et al (1997) and is more appropriate
here because of multiple substitutions that may have occurred at individual sites (Zhang
14
and Rosenberg 2002) Fishers exact test would have given a P value of 0002 here We
also analyzed ns in hominoids OW monkeys and NW monkeys separately but did not
find significant differences (Figure 14) The average number of synonymous
substitutions per site is 0155 between hominoids and New World monkeys and 00819
between hominoids and Old World monkeys These values are virtually identical to the
corresponding numbers obtained from multiple intron and noncoding sequences of
primate genomes (0149 and 0079 respectively Li 1997 pp 221ndash224) suggesting that
the synonymous substitution rate in TGIFLX is normal Thus our results strongly suggest
that positive selection is responsible for the rapid evolution at nonsynonymous sites of the
nonhomeodomain regions
For the homeodomain we found that ns (242) is slightly lower than NS (273)
and that the null hypothesis of ns = NS cannot be rejected This may suggest that the
homeodomain is under no functional constraints It may also suggest that some sites in the
homeodomain are under positive selection while other sites are under purifying selection
giving an overall pattern of similar average substitution rates at synonymous and
nonsynonymous sites (see below) When we examine the substitution patterns of
hominoids OW monkeys and NW monkeys separately we find that the ns ratio is
higher among hominoids and OW monkeys (23545 = 522) than among NW monkeys
(2512 = 208 Figure 14) However this difference is not significant (P = 0132) The ns
ratio is not significantly different from NS for hominoids and OW monkeys (P = 0150)
Statistical methods for identifying individual codons that are under positive
selection have been developed in recent years (Suzuki and Gojobori 1999 Yang et al
2000) We first applied the likelihood method (Yang et al 2000) to the TGIFLX data and
15
compared the likelihoods under models 7 and 8 Here model 7 assumes that the dNdS
ratio for individual sites follows a szlig-distribution between 0 and 1 while model 8 adds an
extra class of sites to model 7 We found that model 8 fits the data significantly better
than model 7 ( 2 = 152 df = 2 P lt 0001) with an additional class of sites of dNdS =
242 Four codons were identified to be under positive selection with posterior
probabilities gt90 and they are marked on the sequences shown in Figure 12 Similar
results were obtained when models 1 and 2 were compared (see Yang et al 2000) for
details of the model description) Because the likelihood method has been shown to
generate false-positive results occasionally (Suzuki and Nei 2002) we examined the
evidence for selection at the four codons by a more conservative parsimony-based
method (Suzuki and Gojobori 1999) None of the four codons show significant results of
positive selection when they are tested individually (P = 019ndash059) When they are tested
together however significant evidence for positive selection is found (average dNdS =
510 P = 0021) suggesting that one or more of the four codons are under positive
selection It is interesting to note that two of the four codons are located within the
homeodomain while the other two are adjacent to the 3 end of the homeodomain
suggesting that the homeodomain may indeed be under positive selection (Figure 12)
The two residues within the homeodomain are not among the completely conserved
residues of all homeodomains indicating that substitutions at these sites are unlikely to
disrupt the basic structure and function of homeodomains Furthermore crystal structures
of homeodomains show that the first of the two residues is involved in DNA-protein
binding and that it contributes significantly to the functional specificity of homeodomains
(Gehring et al 1994b) The second of the two residues belongs to helix I of the
16
homeodomain and it may also be involved in DNA-protein binding although a more
specific molecular function has yet to be defined
133 Selection promotes the diversity of charge profile
To investigate what types of nonsynonymous substitutions are favored by selection
we counted the numbers of conservative and radical nonsynonymous substitutions on
each branch of the tree in Figure 14 Conservative nonsynonymous substitutions are
those that do not alter the charge of the encoded amino acids and radical substitutions are
those that alter the charge of the amino acids We found a total number of r = 915 radical
substitutions and c = 104 conservative substitutions in the tree for the nonhomeodomain
regions The potential numbers of radical and conservative sites are R = 128 and C = 195
respectively The radical substitution rate (rR = 0715) is significantly greater than the
conservative substitution rate (cC = 0533) at P = 0027 (binomial test) This is in sharp
contrast to the situation in most mammalian genes where the radical substitution rate is
below the conservative rate (Zhang 2000) This result suggests that selection may favor
alterations of amino acid charge in TGIFLX evolution We also tested the hypothesis that
selection may favor an alternation of amino acid polarity but obtained no supporting
evidence For the homeodomain there is no evidence for selection promoting the
diversity of either amino acid polarity or charge
In the above we compared the number of radical substitutions per radical site (rR)
with the number of conservative substitutions per conservative site (cC) This
comparison provides information on differential selections at radical vs conservative sites
as long as the four parameters (r c R and C) are correctly estimated (Smith 2003) In
contrast comparisons between r and c can be misleading because the potential numbers
17
of radical (R) and conservative (C) sites in a gene sequence are usually different and they
are affected by many factors unrelated to selection (Dagan et al 2002)
134 Rapid evolution of mammalian X-linked testis-expressed homeobox genes
As mentioned two other homeobox genes Pem and OdsH were reported to evolve
rapidly (Sutton and Wilkinson 1997 Ting et al 1998) The dNdS ratio of Pem ranges
from 065 to 156 for the homeodomain between Mus musculus and several related
rodents (Sutton and Wilkinson 1997) We reanalyzed the OdsH homeodomain sequences
from D simulans and D mauritiana (Ting et al 1998) and obtained a dNdS ratio of 155
Interestingly TGIFLX Pem and OdsH are all located in X chromosomes and are all
testis expressed This observation prompted us to wonder whether it is a general pattern
for X-linked testis-expressed homeobox genes to evolve rapidly To test this hypothesis
we searched for orthologous homeobox genes from the human and mouse genome
sequences Our search was not exhaustive but random Of the 64 genes found 4 are
X-linked and testis expressed 3 are X-linked and non-testis expressed 13 are autosomal
and testis expressed and 44 are autosomal and non-testis expressed Note that there
appear to be only 7 X-linked homeobox genes as a further exhaustive search did not find
additional genes Here testis expression simply means that the gene is expressed in
testis regardless of its expression in other tissues We aligned the sequences and
computed the amino acid p-distance for each orthologous pair As shown in Table 11 and
Figure 15A when the entire protein is considered autosomal homeobox genes
(regardless of the expression pattern) and X-chromosomal non-testis-expressed
homeobox genes have similar amino acid p-distances on average which are an order of
magnitude lower than those of X-linked testis-expressed homeobox genes and their
18
difference is statistically significant (P lt 00001 permutation test) The same pattern is
observed when only the homeodomain or nonhomeodomain regions are considered
(Table 11 Figure 15 B and C) These results suggest that it is a general pattern for
mammalian X-linked testis-expressed homeobox genes to evolve rapidly In addition to
TGIFLX the other X-linked testis-expressed homeobox genes are ESX1L OTEX and
PEPP-2 While the mouse ortholog of human ESX1L is clearly defined by a phylogenetic
analysis (data not shown) and chromosomal locations the orthologs of human OTEX and
PEPP-2 are not uniquely defined probably because of independent gene duplications in
rodents and primates after their separation (Wayne et al 2002) From the mouse genome
sequence we identified a total of 15 homologs of the human OTEX and PEPP-2 genes
and conducted a phylogenetic analysis of these genes The phylogeny is not well resolved
and has low bootstrap supports (not shown) To be conservative we computed protein
p-distances for the human OTEX with each of the 15 mouse genes and presented the
smallest distance in Table 11 We also did the same for the human PEPP-2 gene
Considering possible nonindependent comparisons involved we also repeated all the
statistical tests when only one of the OTEX and PEPP-2 genes was used We found that
the statistical results remain unchanged
14 DISCUSSION
In this report we provide evidence that TGIFLX evolves rapidly under positive
selection in primates and that the selection favors diversity in charge profile Although
positive selection acts mainly in the nonhomeodomain regions of the protein it may also
operate at a few sites in the homeodomain The homeodomain is used in binding DNA
19
sequences in transcription regulation while the nonhomeodomain regions in TGIFLX
might be used in protein-protein interaction as in the case of TGIF and TGIF2 (Bertolino
et al 1995 Melhuish and Wotton 2000 Melhuish et al 2001) Rapid evolution at these
sites thus may alter the DNA- and protein-binding properties of TGIFLX In mouse the
TGIFLX ortholog Tex1 is exclusively expressed in the germ cells at the spermatid stage
(Lai et al 2002) and apparently escapes the inactivation that most X-linked genes are
supposed to experience in spermatogenesis (Lifschyt and Lindsley 1972) Although the
physiological function of TGIFLX is unknown the restricted temporal and spatial
expression pattern suggests a role of this gene in spermatogenesis and the detected
positive selection on TGIFLX may be related to spermatogenesis as well
Our analysis of homeobox genes of humans and mice revealed a general pattern of
rapid evolution of X-linked testis-expressed homeobox genes although the number of
such genes is relatively small It is interesting to note that among autosomal homeobox
genes testis-expressed genes and non-testis-expressed genes show similar rates of amino
acid substitution (Figure 15) Thus testis expression alone does not explain high rates of
protein evolution Among non-testis-expressed homeobox genes there is also no
significant difference in substitution rate between autosomal genes and X-linked genes
suggesting that chromosomal location alone also does not explain the difference in amino
acid substitution rate We noted in collecting the expression pattern data that 3 of the 4
X-linked testis-expressed genes (TGIFLX OTEX and PEPP-2) but only 1 (NKX31) of
the 13 autosomal testis-expressed genes have exclusive or highly selective expressions in
testis This difference suggests that the majority of the autosomal testis-expressed genes
may be under greater functional constraints due to their multifaceted roles in many tissues
20
and developmental processes and thus evolve more slowly Indeed NKX31 which is
expressed only in testis has the highest substitution rate among the 13 autosomal
testis-expressed genes (Table 11) On the contrary most of the X-linked testis-expressed
homeobox genes are expressed exclusively or highly in testis and may thus be specifically
involved in male reproduction Many authors showed that genes involved in male
reproduction evolve rapidly under positive selection (eg Lee et al 1995 Swanson and
Vacquier 1995 Metz and Palumbi 1996 Tsaur and Wu 1997 Rooney and Zhang 1999
Wyckoff et al 2000 Swanson and Vacquier 2002 Podlaha and Zhang 2003) In
particular Torgerson and Singh (2003) recently showed that mammalian X-linked sperm
proteins evolve faster than autosomal ones Our finding of rapid evolution of mammalian
X-linked testis-expressed homeobox genes is thus consistent with these previous
observations
Wang et al (2001) reported that the mammalian X chromosome harbors
disproportionately more spermatogonia-expressed genes than autosomes Spermatogonia
are the mitotic germ cells of the testis from which sperm arise by spermatogenesis
Spermatogonia-expressed genes are probably involved in male reproduction In our
random sample of 64 homeobox genes 57 of the 7 X-linked genes and 23 of the 57
autosomal genes are testis expressed Thus even for homeobox genes the X chromosome
appears to harbor a higher proportion of testis-expressed genes than autosomes (P =
0074) If only those genes that are exclusively (or highly selectively) expressed in testis
are considered the X chromosome harbors an even higher percentage of such genes (37
= 43) than autosomes (157 = 2) and their difference is significant (P = 0003)
Sex-chromosome meiotic drive andor sexual antagonism have been invoked as possible
21
explanations for a higher proportion of X-linked genes to function in male reproduction
and these hypotheses have been discussed extensively in Wang et al (2001)
It has also been proposed that X-linked genes evolve more rapidly than autosomal
genes (Charlesworth et al 1987) This is particularly so when the X-linked genes are
expressed only in males because all newly arising advantageous alleles dominant or
recessive are exposed to positive Darwinian selection In contrast recessive
advantageous alleles at autosomal loci are effectively neutral when the allele frequencies
are very low This might explain the effectiveness of positive selection on X-linked
testis-expressed genes
The X chromosome has been shown to be of special importance in hybrid sterility
between closely related species (reviewed in Coyne 1992) The importance of homeobox
genes in hybrid sterility however is not well recognized probably because most
homeobox genes are evolutionarily conserved It was thus a surprise to identify the
rapidly evolving OdsH an X-linked testis-expressed homeobox gene that is in part
responsible for the hybrid male sterility between D simulans and D mauritiana (Ting et
al 1998) This study showed that it is a general pattern for mammalian X-linked
testis-expressed homeobox genes to evolve rapidly This suggests the intriguing
possibility that it is a rule rather than an exception that homeobox genes such as OdsH
play important roles in reproductive isolation In the future it will be of great interest to
work out the developmental pathways in which these homeobox genes function and the
biological significance of their rapid pace of evolution
15 MATERIALS AND METHODS
22
151 DNA amplification and sequencing
The TGIFLX coding region does not contain introns The coding region was
amplified from genomic DNAs of two Old World (OW) monkeys (green monkey
Cercopithecus aethiops and douc langur Pygathrix nemaeus) and five New World (NW)
monkeys (marmoset Callithrix jacchus tamarin Saguinus oedipus owl monkey Aotus
trivirgatus squirrel monkey Saimiri sciureus and woolly monkey Lagothrix lagotricha)
using polymerase chain reaction (PCR) For green monkey and douc langur primers 2XL
(5-TTTGAATATGGAGGCCGCTG) and 2XR (5-CATCATCAATCATGGATTAG) were
used for tamarin woolly monkey and marmoset primers 2XL and XIA1
(5-GGATTAGACTCTTGCTTCTTCT) were used for owl monkey and squirrel monkey
primers X2 (5-ATATGGAGGCCGCTGCAgAAGAC) and X3
(5-GGCTCTTGCTTCTTCTCTAGC) were used PCRs were performed with MasterTaq
under conditions recommended by the manufacturer (Eppendorf Hamburg Germany)
The products were then purified and sequenced from both directions using the dideoxy
chain termination method with an automated sequencer
152 Analysis of TGIFLX gene sequences
The DNA sequences of the TGIFLX coding region from five hominoids (humans
and apes) and four OW monkeys (Blanco-Arias et al 2002) were obtained from GenBank
The accession numbers are human (Homo sapiens) AJ427749 chimpanzee (Pan
troglodytes) AJ345073 gorilla (Gorilla gorilla) AJ345074 orangutan (Pongo
pygmaeus) AJ345075 gibbon (Hylobates lar) AJ345076 talapoin (Miopithecus
talapoin) AJ345077 rhesus monkey (Macaca mulatta) AJ345078 crab-eating macaque
23
(M fascicularis) AJ345079 and baboon (Papio hamadryas) AJ345080 These publicly
available sequences are analyzed together with those determined in this study Seven
amino acids at the N terminus and 10 amino acids at the C terminus of the sequences are
encoded by the primer sequences and were not included in data analysis A total of 16
TGIFLX protein sequences were aligned using the software DAMBE (Xia and Xie 2001)
followed by manual adjustments The DNA sequence alignment was then made following
the protein alignment The MEGA2 program (Kumar et al 2001) was used for
phylogenetic analysis The number of synonymous nucleotide substitutions per
synonymous site (dS) and that of nonsynonymous substitutions per nonsynonymous site
(dN) were computed using the modified Nei-Gojobori method (Nei and Gojobori 1986
Zhang et al 1998) with an estimated transitiontransversion ratio of 16 On the basis of
the phylogeny of the 16 primates we inferred ancestral TGIFLX sequences at all interior
nodes of this tree using the distance-based Bayesian method (Zhang and Nei 1997) The
numbers of synonymous (s) and nonsynonymous (n) substitutions on each branch of the
tree were then counted Radical and conservative nonsynonymous substitutions with
regard to amino acid charge and polarity were computed following Zhang (2000)
Positive selection at individual codons was tested using the likelihood-based (Yang et al
2000) and parsimony-based (Suzuki and Gojobori 1999) methods
153 Analysis of other homeobox genes of human and mouse
We searched for homeobox genes from the human genome resources
(httpwwwncbinlmnihgovgenomeguidehuman) and then found their mouse
orthologs using the UniGene tool
24
(httpwwwncbinlmnihgoventrezqueryfcgidb=unigene) We downloaded the human
and mouse protein sequences aligned them using DAMBE and computed protein
p-distances (proportional differences Nei and Kumar 2000) between human and mouse
orthologs The information on gene location and expression pattern was found using
human genome resources and the LocusLink tool
(httpwwwncbinlmnihgovLocusLink)
16 ACKNOWLEDGMENTS
We thank Lizhi Gao Ondrej Podlaha David Webb and two anonymous reviewers
for valuable comments This work was supported by a startup fund from the University of
Michigan and a National Institutes of Health grant (GM67030) to JZ
25
Figure 11 Phylogenetic tree of TGIFLX TGIF2 and TGIF genes The tree is reconstructed with the neighbor-joining method with the protein Poisson distances Bootstrap percentages from 1000 replications are shown on tree branches Branch lengths show the numbers of amino acid substitutions per site TGIF genes are used as outgroups
26
Figure 12 Alignment of TGIFLX sequences of 16 primates A dot indicates identity to the human sequence and a dash indicates a gap The first 7 and last 10 amino acid positions are primer encoded in various sequences and are not used in subsequent sequence analysis The four positively selected sites with posterior probabilities gt90 (see text) are in boldface type
27
Figure 13 Pairwise comparisons of dS and dN among 16 primate TGIFLX sequences for (A) the entire sequence (B) nonhomeodomain regions and (C) the homeodomain
28
Figure 14 Numbers of synonymous (s) and nonsynonymous (n) substitutions in the evolution of primate TGIFLX genes Shown above each branch is ns for the nonhomeodomain regions and below each branch is ns for the homeodomain N and S are the potential numbers of nonsynonymous and synonymous sites respectively (see text)
29
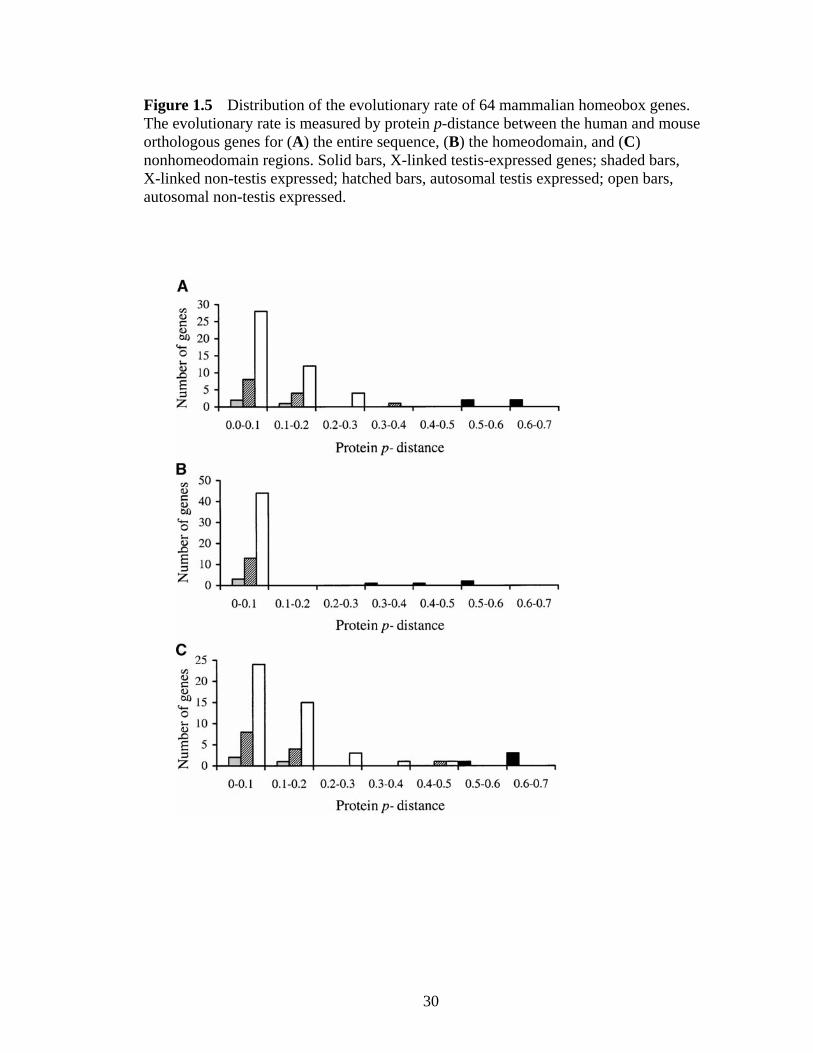
Figure 15 Distribution of the evolutionary rate of 64 mammalian homeobox genes The evolutionary rate is measured by protein p-distance between the human and mouse orthologous genes for (A) the entire sequence (B) the homeodomain and (C) nonhomeodomain regions Solid bars X-linked testis-expressed genes shaded bars X-linked non-testis expressed hatched bars autosomal testis expressed open bars autosomal non-testis expressed
30
Table 11 Protein p-distances between orthologous human and mouse homeobox genes
Protein p-distance
Gene name Protein length (amino acids) Entire protein homeodomain Non-homeodomain
region X-linked testis expressed TGIFLX
222
0550
0456
0582 ESX1L 310 0565 0333 0620 OTEX 176 0625 0544 0664 PEPP-2 208 0606 0526 0636 Meanplusmnsem 0587plusmn0018 0465plusmn0048 0626plusmn0017
X-linked non-testis expressed ARX 560 0036 0000 0040 CDX4 282 0167 0017 0207 POU3F4 361 0011 0000 0013 Meanplusmnsem 0071plusmn0048 0006plusmn0006 0087plusmn0061
Autosomal testis expressed IRX2 471 0104 0000 0119 LHX2 389 0010 0000 0012 LHX9 321 0006 0000 0007 NKX31 230 0322 0000 0435 NKX6-2 277 0029 0000 0036 PBX2 430 0021 0000 0024 PKNOX2 305 0011 0000 0012 TIX1 a 949 0144 0037 0175 ZHX3 a 522 0123 0030 0154 SIX1 273 0015 0000 0019 TGIF 272 0103 0000 0134 TGIF2 237 0063 0000 0084 ZFHX1B 1214 0034 0017 0035 Meanplusmnsem 0076plusmn0024 0006plusmn0004 0096plusmn0033
Autosomal non-testis expressed ALX3 343 0085 0000 0102 ALX4 397 0111 0000 0129 BAPX1 333 0153 0000 0187 BARX2 254 0130 0000 0162 CRX 299 0033 0000 0042 DLX4 168 0274 0017 0417 GHS-2 303 0092 0000 0114 HHEX 303 0070 0018 0085 IPF1 283 0120 0000 0150 IRX3 501 0102 0000 0116 IRX4 512 0158 0000 0180 IRX5 417 0113 0000 0132 IRX6 438 0233 0048 0263 LHX1 406 0005 0000 0006 LHX3 398 0101 0000 0117 LHX4 367 0008 0000 0010 LHX5 402 0012 0000 0014 LHX6 340 0168 0000 0201 LMX1A 382 0029 0000 0034 LMX1B 372 0003 0000 0003 OTX1 354 0025 0000 0030 PHOX2A 280 0021 0000 0027 PHOX2B 314 0000 0000 0000 PITX1 314 0035 0000 0043 PITX2 317 0013 0000 0015 PITX3 302 0017 0000 0020 PKNOX1 314 0039 0000 0045 PROP1 223 0265 0070 0331 PROX1 736 0023 0000 0025 PRX2 246 0077 0000 0102 RAX 342 0140 0000 0170 SHOX2 330 0015 0000 0019 SIX2 436 0014 0023 0012 SIX3 332 0024 0000 0029 SIX4 753 0089 0000 0103 SIX5 657 0139 0000 0150 SIX6 246 0024 0017 0027 TLX1 330 0027 0000 0033 TLX2 284 0070 0000 0088 TLX3 291 0010 0000 0013 VAX1 279 0029 0000 0036 VAX2 290 0121 0000 0150 VSX1 354 0229 0040 0260 ZFH4 3525 0082 0009 0087 Meanplusmnsem 0080plusmn0011 0006plusmn0002 0097plusmn0014
a The mouse sequence is not available Instead the rat sequence is analyzed here
31
17 LITERATURE CITED
Banerjee-Basu S Baxevanis AD (2001) Molecular evolution of the homeodomain family of transcription factors Nucleic Acids Research 293258-3269
Bertolino E Reimund B WildtPerinic D Clerc RG (1995) A novel homeobox protein which recognizes a TGT core and functionally interferes with a retinoid-responsive motif Journal of Biological Chemistry 27031178-31188
Bharathan G Janssen BJ Kellogg EA Sinha N (1997) Did homeodomain proteins duplicate before the origin of angiosperms fungi and metazoa Proceedings of the National Academy of Sciences of the United States of America 9413749-13753
Blanco-Arias P Sargent CA Affara NA (2002) The human-specific Yp112Xq213 homology block encodes a potentially functional testis-specific TGIF-like retroposon Mammalian Genome 13463-468
Burglin TR (1997) Analysis of TALE superclass homeobox genes (MEIS PBC KNOX Iroquois TGIF) reveals a novel domain conserved between plants and animals Nucleic Acids Research 254173-4180
Charlesworth B Coyne JA Barton NH (1987) The Relative Rates of Evolution of Sex-Chromosomes and Autosomes American Naturalist 130113-146
Coyne JA (1992) Genetics and Speciation Nature 355511-515 Dagan T Talmor Y Graur D (2002) Ratios of radical to conservative amino acid
replacement are affected by mutational and compositional factors and may not be indicative of positive Darwinian selection Molecular Biology and Evolution 191022-1025
Garciafernandez J Holland PWH (1994) Archetypal Organization of the Amphioxus Hox Gene-Cluster Nature 370563-566
Gehring WJ Affolter M Burglin T (1994a) Homeodomain Proteins Annual Review of Biochemistry 63487-526
Gehring WJ Qian YQ Billeter M Furukubotokunaga K Schier AF Resendezperez D Affolter M Otting G Wuthrich K (1994b) Homeodomain-DNA Recognition Cell 78211-223
Goodman M Porter CA Czelusniak J Page SL Schneider H Shoshani J Gunnell G Groves CP (1998) Toward a phylogenetic classification of primates based on DNA evidence complemented by fossil evidence Molecular Phylogenetics and Evolution 9585-598
Kappen C (2000) The homeodomain an ancient evolutionary motif in animals and plants Computers amp Chemistry 2495-103
Kappen C Schughart K Ruddle FH (1993) Early Evolutionary Origin of Major Homeodomain Sequence Classes Genomics 1854-70
Kumar S Tamura K Jakobsen IB Nei M (2001) MEGA2 molecular evolutionary genetics analysis software Bioinformatics 171244-1245
Lai YL Li H Chiang HS Hsieh-Li HM (2002) Expression of a novel TGIF subclass homeobox gene Tex1 in the spermatids of mouse testis during spermatogenesis Mechanisms of Development 113185-187
Lee YH Ota T Vacquier VD (1995) Positive Selection Is a General Phenomenon in the Evolution of Abalone Sperm Lysin Molecular Biology and Evolution 12231-238
32
Lifschyt E Lindsley DL (1972) Role of X-Chromosome Inactivation during Spermatogenesis Proceedings of the National Academy of Sciences of the United States of America 69182-amp
Long M (2001) Evolution of novel genes Current Opinion in Genetics amp Development 11673-680
Mcginnis W Garber RL Wirz J Kuroiwa A Gehring WJ (1984) A Homologous Protein-Coding Sequence in Drosophila Homeotic Genes and Its Conservation in Other Metazoans Cell 37403-408
Melhuish TA Gallo CM Wotton D (2001) TGIF2 interacts with histone deacetylase I and represses transcription Journal of Biological Chemistry 27632109-32114
Melhuish TA Wotton D (2000) The interaction of the carboxyl terminus-binding protein with the Smad corepressor TGIF is disrupted by a holoprosencephaly mutation in TGIF Journal of Biological Chemistry 27539762-39766
Metz EC Palumbi SR (1996) Positive selection and sequence rearrangements generate extensive polymorphism in the gamete recognition protein bindin Molecular Biology and Evolution 13397-406
Nei M Gojobori T (1986) Simple Methods for Estimating the Numbers of Synonymous and Nonsynonymous Nucleotide Substitutions Molecular Biology and Evolution 3418-426
Page SL Goodman M (2001) Catarrhine phylogeny Noncoding DNA evidence for a diphyletic origin of the mangabeys and for a human-chimpanzee clade Molecular Phylogenetics and Evolution 1814-25
Podlaha O Zhang JZ (2003) Positive selection on protein-length in the evolution of a primate sperm ion channel Proceedings of the National Academy of Sciences of the United States of America 10012241-12246
Rooney AP Zhang JZ (1999) Rapid evolution of a primate sperm protein Relaxation of functional constraint or positive Darwinian selection Molecular Biology and Evolution 16706-710
Scott MP Weiner AJ (1984) Structural Relationships among Genes That Control Development - Sequence Homology between the Antennapedia Ultrabithorax and Fushi Tarazu Loci of Drosophila Proceedings of the National Academy of Sciences of the United States of America-Biological Sciences 814115-4119
Singer SS Schmitz J Schwiegk C Zischler H (2003) Molecular cladistic markers in New World monkey phylogeny (Platyrrhini Primates) Molecular Phylogenetics and Evolution 26490-501
Smith NGC (2003) Are radical and conservative substitution rates useful statistics in molecular evolution Journal of Molecular Evolution 57467-478
Steiper ME Ruvolo M (2003) New World monkey phylogeny based on X-linked G6PD DNA sequences Molecular Phylogenetics and Evolution 27121-130
Sutton KA Wilkinson MF (1997) Rapid evolution of a homeodomain Evidence for positive selection Journal of Molecular Evolution 45579-588
Suzuki Y Gojobori T (1999) A method for detecting positive selection at single amino acid sites Molecular Biology and Evolution 161315-1328
Suzuki Y Nei M (2002) Simulation study of the reliability and robustness of the statistical methods for detecting positive selection at single amino acid sites Molecular Biology and Evolution 191865-1869
33
Swanson WJ Vacquier VD (1995) Extraordinary Divergence and Positive Darwinian Selection in a Fusagenic Protein Coating the Acrosomal Process of Abalone Spermatozoa Proceedings of the National Academy of Sciences of the United States of America 924957-4961
Swanson WJ Vacquier VD (2002) The rapid evolution of reproductive proteins Nature Reviews Genetics 3137-144
Ting CT Tsaur SC Wu ML Wu CI (1998) A rapidly evolving homeobox at the site of a hybrid sterility gene Science 2821501-1504
Tsaur SC Wu CI (1997) Positive selection and the molecular evolution of a gene of male reproduction Acp26Aa of Drosophila Molecular Biology and Evolution 14544-549
Wayne CM MacLean JA Cornwall G Wilkinson MF (2002) Two novel human X-linked homeobox genes hPEPP1 and hPEPP2 selectively expressed in the testis Gene 3011-11
Wyckoff GJ Wang W Wu CI (2000) Rapid evolution of male reproductive genes in the descent of man Nature 403304-309
Xia X Xie Z (2001) DAMBE Software package for data analysis in molecular biology and evolution Journal of Heredity 92371-373
Yang ZH Nielsen R Goldman N Pedersen AMK (2000) Codon-substitution models for heterogeneous selection pressure at amino acid sites Genetics 155431-449
Zhang JZ (2000) Rates of conservative and radical nonsynonymous nucleotide substitutions in mammalian nuclear genes Journal of Molecular Evolution 5056-68
Zhang JZ (2003) Evolution by gene duplication an update Trends in Ecology amp Evolution 18292-298
Zhang JZ Nei M (1996) Evolution of antennapedia-class homeobox genes Genetics 142295-303
Zhang JZ Nei M (1997) Accuracies of ancestral amino acid sequences inferred by the parsimony likelihood and distance methods Journal of Molecular Evolution 44S139-S146
Zhang JZ Rosenberg HF (2002) Diversifying selection of the tumor-growth promoter angiogenin in primate evolution Molecular Biology and Evolution 19438-445
Zhang JZ Rosenberg HF Nei M (1998) Positive Darwinian selection after gene duplication in primate ribonuclease genes Proceedings of the National Academy of Sciences of the United States of America 953708-3713
34
CHAPTER 2
RAPID EVOLUTION OF PRIMATE ESX1 AN X-LINEKD PLACENTA- AND TESTIS-EXPRESSED HOMEOBOX GENE
21 ABSTRACT
Homeobox genes encode transcription factors that play important roles in various
developmental processes and are usually evolutionarily conserved Here we report a case
of rapid evolution of a homeobox gene in humans and non-human primates ESX1 is an
X-linked homeobox gene primarily expressed in the placenta and testis with
physiological functions in placentafetus development and spermatogenesis ESX1 is
paternally imprinted in mice but is not imprinted in humans We provide evidence for a
significantly higher nonsynonymous substitution rate than synonymous rate in ESX1
between humans and chimps as well as among a total of 15 primate species Population
genetic data also show signals of recent selective sweeps within humans Positive
selection appears to be concentrated in the C-terminal non-homeodomain region which
has been implicated in regulating human male germ cell division by prohibiting the
degradation of cyclins By contrast mouse Esx1 has a substantively different C-terminal
region subject to strong purifying selection These and other results suggest that even the
fundamental process of spermatogenesis has been targeted by positive selection in
primate and human evolution and that mouse may not be a suitable model for studying
human reproduction
35
22 INTRODUCTION
Homeobox genes are characterized by the presence of a sequence motif known as
the homeobox which encodes the ~60-amino-acid homeodomain a helix-turn-helix
DNA binding domain (Gehring et al 1994) In humans there are about 230 homeobox
genes (Nam and Nei 2005) encoding a large family of transcription factors that play key
roles in various developmental processes such as body-plan specification pattern
formation and cell-fate determination (Gehring et al 1994) Due to their functional
importance most homeodomain proteins are evolutionarily highly conserved in sequence
(McGinnis et al 1984 Gehring et al 1994 Zhang and Nei 1996) Hence the
identification of non-conserved homeobox genes would be particularly interesting
because such homeobox genes may regulate important developmental processes that vary
among relatively closely related species Three such rapidly-evolving homeobox genes
are known from fruit flies (OdsH) rodents (Rhox5) and primates (TGIFLX)
respectively OdsH is an X-linked gene involved in spermatogenesis and it is partly
responsible for the hybrid male sterility between Drosophila simulans and D mauritiana
(Ting et al 1998) Mouse Rhox5 (also known as Pem) is expressed in both male and
female reproductive tissues (Sutton and Wilkinson 1997) Targeted disruption of Rhox5
increases male germ cell apoptosis and reduces sperm production sperm motility and
fertility (Maclean et al 2005) In fact Rhox5 is just one member of a recently expanded
homeobox gene cluster known as the Rhox cluster on the mouse X chromosome
(Maclean et al 2005 MacLean et al 2006 Morris et al 2006 Wang and Zhang 2006)
Several other members of the cluster are also expressed in reproductive tissues (Maclean
et al 2005) and evolve rapidly (Jackson et al 2006 Wang and Zhang 2006) TGIFLX is a
36
retroduplicate formed in the common ancestor of primates and rodents by retroposition of
the autosomal gene TGIF2 to the X chromosome and is specifically expressed in the
germ cells of adult testis (Wang and Zhang 2004) Interestingly each of the three cases
involves a homeobox gene that is X-linked and testis-expressed Here we report yet
another case of rapid evolution of an X-linked testis-expressed homeobox gene ESX1
Human ESX1 also known as ESX1L and ESXR1 is a paired-like homeobox gene
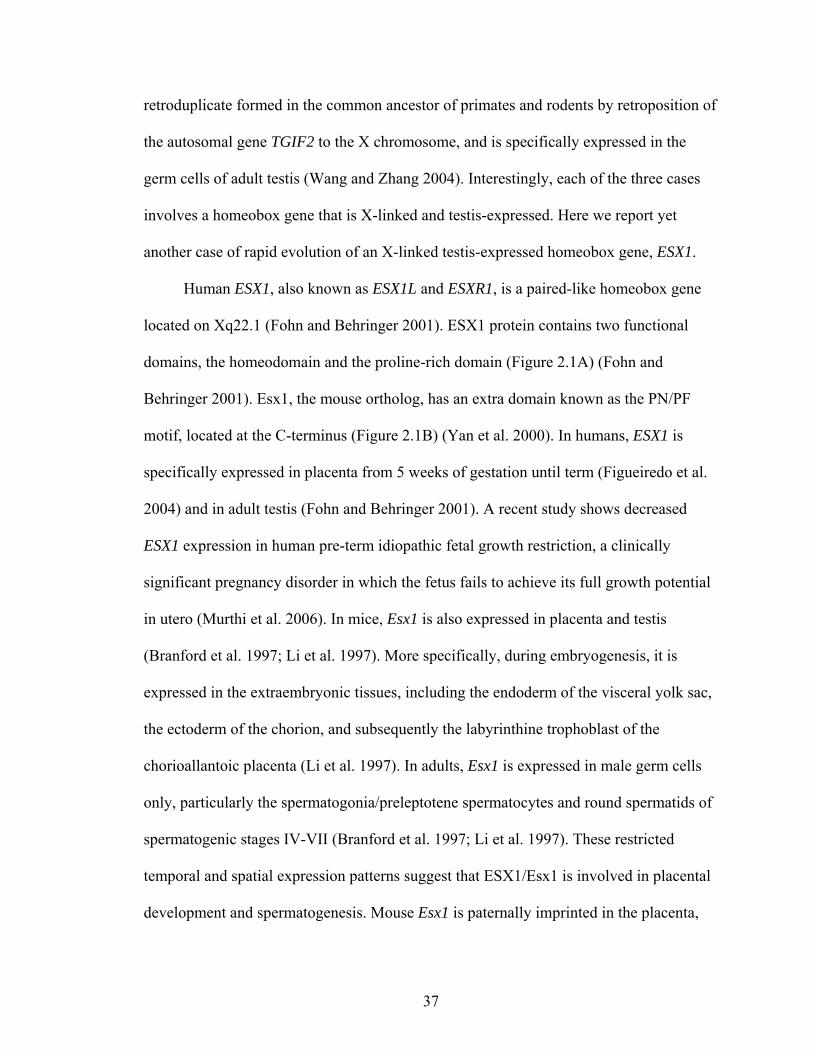
located on Xq221 (Fohn and Behringer 2001) ESX1 protein contains two functional
domains the homeodomain and the proline-rich domain (Figure 21A) (Fohn and
Behringer 2001) Esx1 the mouse ortholog has an extra domain known as the PNPF
motif located at the C-terminus (Figure 21B) (Yan et al 2000) In humans ESX1 is
specifically expressed in placenta from 5 weeks of gestation until term (Figueiredo et al
2004) and in adult testis (Fohn and Behringer 2001) A recent study shows decreased
ESX1 expression in human pre-term idiopathic fetal growth restriction a clinically
significant pregnancy disorder in which the fetus fails to achieve its full growth potential
in utero (Murthi et al 2006) In mice Esx1 is also expressed in placenta and testis
(Branford et al 1997 Li et al 1997) More specifically during embryogenesis it is
expressed in the extraembryonic tissues including the endoderm of the visceral yolk sac
the ectoderm of the chorion and subsequently the labyrinthine trophoblast of the
chorioallantoic placenta (Li et al 1997) In adults Esx1 is expressed in male germ cells
only particularly the spermatogoniapreleptotene spermatocytes and round spermatids of
spermatogenic stages IV-VII (Branford et al 1997 Li et al 1997) These restricted
temporal and spatial expression patterns suggest that ESX1Esx1 is involved in placental
development and spermatogenesis Mouse Esx1 is paternally imprinted in the placenta
37
with only the maternally derived allele expressed (Li and Behringer 1998) Heterozygous
female mice inheriting a null Esx1 allele from their mother are born 20 smaller than
normal suggesting that Esx1 is required for placental development and fetal growth in
mice (Li and Behringer 1998) By contrast biparental expression of ESX1 is found in
human placenta (Grati et al 2004)
Our preliminary comparison between human ESX1 and mouse Esx1 proteins
showed an unexpectedly high level of sequence divergence (34) suggesting that the
gene might be evolving rapidly in primates andor rodents as a result of positive
Darwinian selection (Wang and Zhang 2004) Below we first describe the evolutionary
pattern of ESX1 in primates and then compare it to the evolutionary pattern in rodents
We show that positive selection has acted on ESX1 within humans between humans and
chimpanzees and among a large array of primate species whereas purifying selection has
dominated Esx1 evolution in rodents We discuss these evolutionary patterns in light of
the structure and function of the gene
23 RESULTS
231 Comparison of ESX1 sequences between humans and chimps and within
humans
We obtained the ESX1 gene sequence from the chimpanzee genome sequence
(httpgenomewustledu) and compared it with the human ESX1 sequence available in
GenBank (AY114148) The alignment shows a high level of sequence divergence Of the
aligned 406 amino acid sites there are 25 amino acid replacements in addition to two
gaps totaling 12 amino acids (Figure 22) A comparison of synonymous (dS) and
38
nonsynonymous (dN) nucleotide distances between gene sequences can inform us about
the nature and strength of selection acting on a gene A higher dN than dS indicates
positive selection whereas a lower dN than dS indicates negative or purifying selection
The vast majority of genes in the human genome are under negative selection with a
genomic average dNdS ratio of 026 (Bakewell et al 2007) In ESX1 however dN (0031)
is significantly greater than dS (0009) (P = 0028 Fisherrsquos exact test (Zhang et al 1997))
Because the dS value of ESX1 is not significantly different from the genomic average dS
of 0012 (Consortium 2005) the above observation strongly suggests that positive
selection has promoted nonsynonymous substitutions in ESX1 during the divergence
between humans and chimps
To identify the regions where positive selection has been operating we divided the
ESX1 protein sequence into three segments the N-terminus homeodomain and
C-terminus (Figure 22) The homeodomain is completely identical in amino acid
sequence between human and chimp and thus has not been targeted by positive selection
(dN = 0 dS = 0019 P = 029 Fisherrsquos exact test) In the N-terminus dN (0024) and dS (0)
are not significantly different (P = 01) and hence neutrality cannot be rejected In the
C-terminus however dN (0047) is significantly greater than dS (0012) (P = 0035) Thus
positive selection has been concentrated in the C-terminus As aforementioned the
C-terminus is mainly composed of proline-rich repeats The two alignment gaps between
human and chimp also occur in the C-terminus (Figure 22) Compared to the human
sequence the chimp sequence lost a complete nine-amino-acid repeat and part of another
repeat
39
To further examine whether the positive selection might have happened in the
recent history of human evolution we sequenced exon 4 of ESX1 in 32 unrelated male
humans of diverse geographic origins (4 Pygmy Africans 6 African Americans 12
Caucasians 3 Southeast Asians 2 Chinese 2 Pacific Islanders and 3 Andes Indians)
Exon 4 encodes 14 amino acids of the homeodomain corresponding roughly to the third
helix of the homeodomain and the complete C-terminus of ESX1 the likely target of
positive selection (Figures 21 and 22) From the 32 alleles we observed 4
insertiondeletion (indel) polymorphisms and 9 single nucleotide polymorphisms (SNPs)
All of these polymorphisms occur in the C-terminus (non-homeodomain) region and
none of them disrupt the open reading frame (Figure 22) Table 21 lists the
polymorphisms and their associated allele frequencies The polymorphic data allow us to
compute the level of DNA polymorphism in exon 4 Nucleotide diversity per sequence (π)
is 0897 and Wattersonrsquos polymorphism per sequence (θ) is 127 A comparison between
expected and observed distributions of allelic frequencies can tell us whether a genomic
region is likely to have been subject to recent selective sweeps which render π lower than
θ and high-frequency alleles enriched generating negative values of Tajimarsquos D (Tajima
1989) and Fay and Wursquos H (Fay and Wu 2000) Combining the information from D and
H Zeng and colleagues recently invented a new test known as the DH test of positive
selection (Zeng et al 2006) This test is superior to the individual D and H tests because
it is more powerful and is insensitive to common confounding factors such as background
selection population growth and population subdivision (Zeng et al 2006) We found
that the DH test rejects the neutral hypothesis for the exon 4 sequences of 32 humans
(Plt0039) For samples with African Caucasian and Asian origins the tail probability of
40
the DH test is 0067 031 and 026 respectively Thus selective sweeps might have
occurred among Africans Consistent with this result the H test also yields a significant
result for the African samples (P=0044) and this P value is lower than 128 of the 132
genes that were recently surveyed in Africans (Akey et al 2004) In other words ESX1 is
among the bottom 3 of human genes for H value in Africans These results support the
hypothesis of recent selective sweeps at human ESX1 or linked genomic regions We also
sequenced exons 1 2 and 3 of ESX1 in 8 male humans with diverse geographic origins
(1 Pygmy African 3 African Americans 1 Caucasian 2 Chinese and 1 Pacific Islander)
but observed no polymorphisms
232 Positive selection at the C-terminus of ESX1 in many primates
To examine whether ESX1 has also been under positive selection in other primates
we obtained the rhesus monkey ESX1 gene sequence by searching its recently completed
draft genome sequence (httpwwwncbinlmnihgov) We then sequenced exon 4 of
ESX1 in 12 additional primate species including three hominoids four Old World
monkeys and five New World monkeys (see Materials and Methods) Together with the
three known sequences from human chimp and rhesus a total of 15 primate sequences
of exon 4 were conceptually translated and aligned by Clustal W with manual adjustment
DNA sequences were subsequently aligned by following the protein alignment (Figure
23A) A gene tree of the 15 sequences was reconstructed using the neighbor-joining
method (Saitou and Nei 1987) The tree topology is consistent with the known species
tree suggesting that the sequences analyzed are orthologous to each other We found that
the length of exon 4 is highly variable among species The shortest proline-rich repeat
41
region is found in marmoset and tamarin while the longest is observed in orangutan The
nine-amino-acid repeat unit has variable sequences among the primate species although
proline is always the most frequent amino acid
To examine the potential action of positive selection in exon 4 of primate ESX1 we
computed pairwise dN and dS among the 15 sequences Excluding alignment gaps we
analyzed a total of 312 nucleotide sites Higher dN than dS is observed in 79 (752) of
105 pairwise comparisons (Figure 24A) There is no apparent difference in this pattern
among hominoids Old World monkeys and New World monkeys When only the
(non-homeodomain) C-terminus is analyzed 86 (819) comparisons showed dN gt dS
(Figure 24B) In our dataset the average dS is 012 between hominoids and Old World
monkeys 018 between hominoids and New World monkeys and 016 between Old World
monkeys and New World monkeys All three numbers are greater than the corresponding
values (008 012 and 015 respectively) previously estimated from multiple different
intron and noncoding sequences of the same species pairs (Li 1997) Thus the
synonymous substitution rate of ESX1 is not reduced and the overall higher dN over dS
suggests positive selection
Due to the occurrence of many indels in the proline-rich region of primate ESX1
the sequence alignment may not be reliable Because closely related species are more
likely to share the same repeat sequence which facilitates alignment we made separate
alignments for hominoids Old World monkeys and New World monkeys respectively
(Figure 25) The dN and dS values were then computed for species pairs within each of
the three groups It happened that each of the three groups has 5 species Of the 30
42
pairwise comparisons 23 (767) show dN gt dS This finding is similar to the above
result when all 15 sequences are aligned and analyzed together
To test positive selection in primate ESX1 more rigorously we conducted a
phylogeny-based analysis (22) We inferred the ancestral sequences for the C-terminus at
all interior nodes of the primate tree (Figure 26) using PAML (Yang 1997) and then
counted the numbers of nonsynonymous and synonymous substitutions on each tree
branch We found that the ratio of the total number of nonsynonymous substitutions and
that of synonymous substitutions over all branches of the tree equals ns = 13938 = 366
significantly greater than the expected value of NS=17793=190 (P=0002 Fisherrsquos
exact test) Here N and S are the numbers of nonsynonymous and synonymous sites
respectively in the C-terminus
We also conducted a likelihood-based analysis to detect positive selection on
individual codons within the C-terminus using PAML We compared the null model M8a
with the alternative model M8 M8a introduced by Swanson et al (Swanson et al 2003)
assumes that the dNdS ratio of individual codons follows a beta distribution between 0
and 1 with an extra class of codons with fixed dNdS of 1 M8 is identical to M8a except
for the presence of an additional class of codons with any dNdS M8 is found to fit the
data significantly better than M8a (χ2 = 4963 df = 2 P lt 10-10) M8 suggests that ~66
of codons in the C-terminus have been subject to positive selection with dNdS = 404
Analysis using another pair of models M1a and M2a also supports a large proportion of
codons under positive selection (χ2 = 4977 df = 2 P lt 10-10) Taken together various
analyses provide strong evidence that positive selection has acted in the C-terminus of
primate ESX1 to promote amino acid substitutions We note that although sequence
43
alignment is not easy for ESX1 alignment errors cannot render dN significantly greater
than dS because even when the alignment is completely random dN is expected to be
equal to dS
233 Purifying selection on rodent Esx1
To test whether positive selection on ESX1 extends to non-primate mammals we
turn to rodents We first obtained the Esx1 gene sequence of Mus musculus from
GenBank and determined the sequence of exons 2 and 4 of Esx1 from M spretus Coding
for only two and 15 amino acids respectively exons 1 and 3 are not studied here Esx1
possesses a unique PFPN motif at its C-terminus consisting of PF
(proline-phenylalanine) tandem repeats followed by PN (proline-asparagine) tandem
repeats (Figure 21B) An earlier study found that the PFPN motif can inhibit both
nuclear localization and DNA binding activity of the Esx1 protein (Yan et al 2000) A
comparison of exons 2 and 4 sequences of M musculus and M spretus shows strong
purifying selection on Esx1 as dN (0006) is significantly lower than dS (0032) (P = 001
Fisherrsquos exact test) Exon 4 was also sequenced in M cervicolor and M cookii (Figure
23B) Significantly lower dN than dS is observed in all pairwise comparisons among the
four Mus species with the exception of the comparison between M cervicolor and M
cookii probably owing to the small number of substitutions involved (Figure 24C)
Sequence length variation is observed in the PNPF motif but not in the proline-rich
region Overall our results suggest that Esx1 has been subject to purifying selection in
the Mus genus of rodents
44
24 DISCUSSION
In this work we provide evidence for positive selection acting in the C-terminus
region of the homeodomain-containing protein ESX1 during primate evolution as well as
in human populations In adult humans ESX1 is primarily expressed in testis A previous
study showed that ESX1 is proteolytically processed into a 45-kDa N-terminal fragment
(including the homeodomain) and a 20-kDa C-terminal fragment The C-terminal
fragment is found in cytoplasm and can inhibit the degradation of cyclin A and B1
causing cell-cycle arrest in human cells (Ozawa et al 2004) Cyclins are a family of
proteins controlling transitions through different phases of the cell cycle Thus it has
been proposed that the C-terminal fragment of ESX1 plays a role in spermatogenesis
functioning as a checkpoint in male germ cell division (Ozawa et al 2004) In contrast
the N-terminal fragment including the homeodomain functions as a transcriptional
repressor in nucleus (Ozawa et al 2004 Yanagihara et al 2005) Our observations of
conserved sequences in the N-terminal fragment but rapid sequence changes in the
C-terminal fragment are explainable by the distinct functions of the two regions The
finding of positive selection in the C-terminus of primate ESX1 suggests that even in the
recent past of human and primate evolution spermatogenesis has been subject to adaptive
modifications (Wyckoff et al 2000) Because different species reach sexual maturity at
different ages the optimal time of germ cell division may also vary among species The
observed positive selection on ESX1 may reflect such adaptations in individual species
In general our finding is consistent with many reports of rapid evolution of proteins
involved in animal male reproduction (Swanson and Vacquier 2002) Furthermore
mammalian sperm proteins on the X chromosome have been found to evolve faster than
45
those on autosomes (Torgerson and Singh 2003) Thus the rapid evolution of ESX1 is
likely related to its role in spermatogenesis as well as its location in the X chromosome
Interestingly male mice with null Esx1 are fertile indicating that Esx1 is not
essential for spermatogenesis in mice (Li and Behringer 1998) The observation of
purifying selection acting on the C-terminal region of Esx1 in mice may be explained by
the fact that the gene function has changed between primates and rodents It is likely that
Esx1 is more important for placenta development rather than spermatogenesis in mice (Li
and Behringer 1998) Biochemical studies also showed that the nuclear localization of
mouse Esx1 is regulated by the presence of the PFPN motif (Yan et al 2000) which is
lacking in primate ESX1 further suggesting functional differences between primate
ESX1 and rodent Esx1 To examine the C-terminal sequence of ESX1 in other mammals
we TBLASTN-searched the GenBank with human ESX1 and mouse Esx1 as queries We
found putative orthologous Esx1 genes in rat dog and cow In horse only a partial
sequence was identified by WISE2 (httpwwwebiacukWise2) We did not find Esx1
orthologs in opossum and chicken genome sequences The estimated dNdS ratio between
mouse and rat in the C-terminal region of Esx1 is significantly lower than 1 (Plt001)
consistent with our findings in the Mus genus Rat Esx1 has a similar domain structure as
mouse Esx1 with the exception that all of the PF repeats are replaced by PN repeats in
the PFPN motif By contrast the C-terminus of cow and horse Esx1 proteins is similar to
that of primates with the proline-rich region but not the PFPN motif The putative Esx1
in dog has neither the proline-rich region nor the PFPN motif at its C-terminus It seems
likely that the PFPN motif was acquired by Esx1 in rodent evolution
46
The different evolutionary patterns of primate ESX1 and rodent Esx1 suggest that
the utility of the mouse model for studying human reproduction may be limited Previous
studies also reported several other reproduction-related genes that show substantive
human-mouse differences For example SED1 a protein involved in sperm-egg binding
in mice has lost an important protein-protein binding domain in ancestral primates
which was accompanied by rapid sequence changes in another domain by positive
selection (Podlaha et al 2006) In another example three human X-linked homeobox
genes PEPP1 PEPP2 and PEPP3 correspond to a cluster to 30 Rhox genes in mouse
due to dramatic expansions of the gene cluster in rodent evolution (Wang and Zhang
2006) The mouse Rhox genes are expressed in male and female reproductive tissues and
at least one of them (Rhox5) is involved in male reproduction evident from reduced
fertilities of Rhox5-knockout mice (Maclean et al 2005)
Esx1 is paternally imprinted in mouse placenta and is functionally important to
placenta morphogenesis and fetal growth (Li et al 1997 Li and Behringer 1998) In
contrast ESX1 is not imprinted in human placenta (Grati et al 2004) Imprinting is an
important regulatory pathway involved in the development and function of the placenta in
eutherian mammals The imprinting of Esx1 is consistent with the general phenomenon in
mice that the paternally derived X chromosome is preferentially inactivated in placental
tissues of female embryos (West et al 1977 Wagschal and Feil 2006) Recently Monk
and colleagues reported that several human orthologs of mouse placenta-imprinted genes
are un-imprinted (Monk et al 2006) In addition an earlier investigation revealed a
widespread reduction in the maintenance of imprinting in humans (Morison et al 2005)
If imprinted genes tend to be involved in intra-genomic conflict and hence evolve rapidly
47
by arms race (Haig 1993) our observation of rapid evolution of the un-imprinted primate
ESX1 but slow evolution of imprinted rodent Esx1 is unexpected While a change in
spermatogenesis function might explain the unexpected evolutionary pattern for
ESX1Esx1 in the future it would be interesting to test the genomic conflict hypothesis
by comparing the evolutionary rates of all mouse imprinted genes with those of their
un-imprinted human orthologs
25 MATERIALS AND METHODS
251 DNA samples
One individual from each of 12 primate species 32 male humans one Mus spretus
one Mus cookie and one Mus cervicolor were surveyed The 12 primate species include
three hominoids (gorilla Gorilla gorilla orangutan Pongo pygmaeus and gibbon
Hylobates lar) four Old World monkeys (green monkey Cercopithecus aethiops langur
Pygathrix nemaeus talapoin Miopithecus talapoin and baboon Papio hamadryas) and
five New World monkeys (marmoset Callithrix jacchus tamarin Saguinus oedipus owl
monkey Aotus trivirgatus squirrel monkey Saimiri sciureus and woolly monkey
Lagothrix lagotricha) The animal DNA samples were from (Wang and Zhang 2004) and
(Podlaha et al 2005) whereas the human DNA samples were purchased from Coriell
(httpccrcoriellorg)
252 Gene amplification and DNA sequencing
The amplified ESX1 regions in different species and the primers used for
amplification are described in Table 22 Primers were designed according to the
48
published human (NT_011651) and mouse (NM_007957) sequences Polymerase chain
reactions (PCRs) were performed with MasterTaq or TripleMasterTaq under conditions
recommended by the manufacturer (Eppendorf Hamburg Germany) DMSO (Dimethyl
sulfoxide) was used in PCR amplification and DNA sequencing of exon 4 Amplified
exon 4 sequences from 12 primates were cloned into PCR4TOPO vector (Invitrogen) and
then sequenced from both directions Other PCR products were purified and directly
sequenced from both directions The dideoxy chain termination method was used in DNA
sequencing by an automated sequencer Sequencher (GeneCodes) was used to assemble
the sequences and identify DNA polymorphisms in humans
253 Human population genetic analysis
The DH test was conducted by program DHjar (Zeng et al 2006) The population
recombination rate used in the test was estimated to be R=3Nr
=3times10000times(018times10-6times723) = 4 per sequence per generation Here N =10000 is the
effective population size of humans 018times10-6 is the pedigree-based recombination rate
per generation per nucleotide at the ESX1 locus (Kong et al 2002) and 723 is the number
of nucleotides of the human ESX1 exon 4 sequence For samples of African Caucasian
and Asian origins we used N =10000 4000 and 4000 respectively as their effective
population sizes (Tenesa et al 2007) The chimpanzee ESX1 sequence was used as the
outgroup in computing DH except for one site where the gorilla sequence was used as the
outgroup because the chimpanzee sequence is different from both human alleles P values
in the DH test and H test were estimated using 100000 replications of coalescent
simulation
49
50
254 Evolutionary analysis
The coding sequences of human ESX1 and mouse Esx1 were obtained from
GenBank with accession numbers AY114148 and NM_007957 respectively Clustal W
(Thompson et al 1994) was used to conduct sequence alignment for the primates and the
Mus species respectively MEGA3 (Kumar et al 2004) was used for phylogenetic
analysis Pairwise synonymous (dS) and nonsynonymous (dN) distances were calculated
using the modified Nei-Gojobori method (Zhang et al 1998) with estimated
transitiontransversion ratios Based on the phylogeny of 15 primates we inferred
ancestral ESX1 sequences at all interior nodes of the tree by using the likelihood method
under the M8 model in PAML315 (Yang 1997) The number of synonymous (s) and
nonsynonymous (n) substitutions on each branch of the tree were then counted The
numbers of synonymous (S) and nonsynonymous (N) sites were also estimated by
PAML
26 ACKNOWLEDGEMENTS
We thank Kai Zeng for assistance with the DH test and Meg Bakewell Soochin
Cho and Ondrej Podlaha for valuable comments This work was supported by research
grants from the University of Michigan and National Institutes of Health to JZ
Figure 21 Structures of the orthologous (A) human ESX1 and (B) mouse Esx1 genes adapted from (Fohn and Behringer 2001) and (Li et al 1997) Exons are boxed with coding regions shown in grey and homeobox shown by hatches The approximate length of each intron is given in parentheses Pro-rich and PNPF motifs are indicated underneath the gene structure
100 bp
A (02 kb (13 kb) (19 kb) Pro-rich
51
B
(08 kb) (1 kb) (13 kb)
Pro-rich PNPF
Figure 22 Alignment of human and chimpanzee ESX1 protein sequences The human sequence is from GenBank (accession number AY114148) The homeodomain is boxed Single nucleotide polymorphisms (SNPs) detected in humans are shaded For each nonsynonymous SNP the alternative amino acid is shown above the human sequence For each synonymous SNP no alternative amino acid is shown Triangles indicate indel polymorphisms observed in humans with deletions shown by triangles pointing upwards and insertions shown by triangles pointing downwards The width of the triangle shows the size of the indel ldquordquo indicates identity to the human sequence and ldquo-rdquo indicates a gap
52
Figure 23 Protein sequence alignment for exon 4 of ESX1 (Esx1) in (A) 12 primates and (B) 4 Mus species ldquordquo indicates identity to the first sequence in each alignment ldquo-rdquo indicates an alignment gap and ldquordquo indicates a stop codon The partial homeodomain region is indicated ldquoOWrdquo Old World ldquoNWrdquo New World
53
Figure 24 Pairwise synonymous (dS) and nonsynonymous (dN) nucleotide distances for (A) the entire exon 4 of ESX1 among 15 primates (B) the C-terminal non-homeodomain region of ESX1 among 15 primates and (C) the exon 4 of Esx1 among 4 Mus species
A
0
01
02
03
0 01 02 03
dN
dS B
0
01
02
03
0 01 02 03
dN
dS C
0
01
02
03
0 01 02 03
dN
dS
54
Figure 25 Separate alignments of translated ESX1 exon 4 of (A) hominoids (B) Old World monkeys and (C) New World monkeys ldquordquo indicates identity to the top sequence ldquo-rdquo indicates a gap and ldquordquo indicates a stop codon A Human VWFQNRRAKW KRNQRVLMLR NTATADLAHP LDMFLGGAYY AAPALDPALC VHLVPQLPRP PVLPVPPMPP Chimpanzee ---------- VE MEV Gorilla A SN A Orangutan IATR SN L Gibbon IAA ETPD F MEI S Human RPPMVPMPPR PPIAPMPP-- -MAPVPPGSR MAPVPPGPRM APVPPWPPMA PVPPWPPMAP VPTGPPMAPV Chimpanzee ---Q -- -PH W PW Gorilla Q -- -P C G G PRM Orangutan Q MGP RP GRV GR MP Gibbon GQG MGP PPC M GV HMGVH MPVHM Human P--------- PGPPMARVPP GPPMARVPPG PPMAPLPPGP PMAPLPP--- GPPMAPLPPG PPMAPLPPRS Chimpanzee --------- --------- PW V V--- WV MP Gorilla --------- --------- P RV V--- V VAGP Orangutan --------- M L G GMAL V MP Gibbon --------- --------- TPM V M--- V LVMP Human HVPHTGLAPV HITWAPVINS YYACPFF Chimpanzee ---- ---------- -------- Gorilla PT R Orangutan RP R G Gibbon R G
B Baboon VWFQNRRAKW KRNQRVLMLR NIAAAALARP TEVFLGGPYN ATPSLDPALC VHLVPQLPRP PVPPMPPRPP Green monkey Rhesus monkey A Langur Y VP A MT Talapoin A T Q Baboon MVPMQPRP-- ---------- PMAPVPPRPP MVPMQPRPPM VRMP------ ---------P RPPMAPVPTG Green monkey PM APMPPGPPRP ------ --------- P Rhesus monkey PM APMPPGP--- G V ------ --------- P Langur PGPM APMPPGP--- SVM V HPMAPVP PGPSMAPMP VVMQPR Talapoin AP-- ---------- V ------ --------- P Baboon PPMVPMPPRP PMAPVPPRPP MAPMPPRPPV PRIGLAPVRI TWAPVINSYY AGPFF Green monkey --- --- Rhesus monkey Langur H T Talapoin
C Marmoset VWFQNRRAKW RRNQRMLM-R NVAALALAPA VEMILGAPYD AVPVLDPAWC VHLAPR---P PRPPVAPVPH Tamarin - H --- Owl monkey T L MDDP VDM QPLG GVMP Squirrel monkey L MAPVP V NQ--- PMQP Woolly monkey L LA V Q--- QLMAP Marmoset TAP------- --MPAGP--- PMAP------ ---------- ---------- ---------- ---MPVGPPM Tamarin M------- ----- ------ ---------- ---------- ---------- --- Owl monkey MAQARPPM AGPVV PGAPMAP MPPMARTQAR PPMARMQARP PMAGMPAGPP VVPPA Squirrel monkey MMQARPPM AGR--- P------ ---------- ---------- ---------- ---PEQ Woolly monkey MQAGPP---I AG--- ------ ---------- ---------- ---------- ---P Marmoset APMPPGPPVV PMPPGAPMP- HFGLAPVGIA WAPFNNSYYV GPFF Tamarin - Owl monkey R- DIQL VIGH Squirrel monkey --- R- YIT VIG Y Woolly monkey AA RH I VIG R
55
Figure 26 Numbers of synonymous (s) and nonsynonymous (n) substitutions in the evolution of primate ESX1 Shown on each branch are the n and s values for the C-terminal non-homeodomain region The numbers of nonsynonymous (N) and synonymous (S) sites for the same region are also given
n s = 13938 N S = 17793 (nN) (sS) = 192 20
3151
5151
41
61
83
143
10
00286
0010
235
153
61
1000
00
41
0020
20
8282
41
Human Chimpanzee Gorilla Orangutan
Gibbon Rhesus monkey Baboon African green monkey Talapoin Langur Marmoset Tamarin Owl monkey Squirrel monkey Woolly monkey
Hominoids
Old World monkeys
New World monkeys
56
Table 21 ESX1 exon 4 sequence variations among 32 men The position of each polymorphism follows the GenBank sequence AY114148 starting from the first nucleotide of exon 4 The polymorphisms and their corresponding allele frequencies are given For each polymorphism we present the allele from the GenBank sequence followed by the deviating allele Polymorphisms are classified into synonymous (s) nonsynonymous (n) insertion (i) and deletion (d) types The indel length in nucleotides is shown for each indel polymorphism
Nucleotide position
Polymorphism Type Frequency
68 C(Ala)T(Val) n 097003 164 C (Pro)T (Leu) n 097003
361-387 27- d 097003 407 C(Pro)G(Arg) n 094006 447 G(Gly)C(Gly) s 097003
460-486 27- d 094006 488 C(Pro)G(Arg) n 059041 490 C(Leu)G(Val) n 059041 504 G(Pro)A(Pro) s 097003
After 513 -27 i 097003 before 514 -27 i 037063
549 A(Pro)G(Pro) s 097003 571 C(Leu)G(Val) n 094006
57
Table 22 Primers used for amplifying different exons of ESX1 in primates and Esx1 in Mus species
Species Primers Exons amplified Length (bp) L 5-tgcctcactcgctttaccctagt-3 R 5-tgcacagctttatcgacagcgc-3 Exons 1 and 2 424
L 5-tggagagaaagacagatacag-3 R 5-atccacaactccaaatactg-3 Exon 3 46 Human
L 5-cacaatttctatctggcagg-3 R 5-atagcttcacctgttgcagt-3 642669696723
Gorilla L 5-agcatctaacgaattacttg-3 R 5-aaagtctcagtggcatatag-3 642
Orangutan 687 Gibbon
L 5-ccaacgtactattaagtcac-3 R 5-ctcctctaagatatttcagc-3 651
Rhesus monkey 534 Baboon 507
African green monkey 525 Talapoin 507 Tamarin 387
Marmoset 387 Squirrel monkey 408 Woolly monkey 411
Owl monkey
L 5-cacaatttctatctggcagg-3 R 5-aaagtctcagtggcatatag-3
552
Langur L 5-ccaacgtactattaagtcac-3 R 5-atagcttcacctgttgcagt-3
Exon 4
579
Mus spretus L 5-caccaacgagctggtcttg-3 R 5-agtctgcctgccacatggt-3 Exon 2 436
Mus spretus 450 Mus cervicolor 402
Mus cookii
L 5-gacattcatggtccaatatcc-3 R 5-gcgtgatagtgtttacaaacg-3 Exon 4
396
58
27 LITERATURE CITED
Akey JM Eberle MA Rieder MJ Carlson CS Shriver MD Nickerson DA Kruglyak L (2004) Population history and natural selection shape patterns of genetic variation in 132 genes PLoS Biol 2e286
Bakewell MA Shi P Zhang J (2007) More genes underwent positive selection in chimpanzee evolution than in human evolution Proc Natl Acad Sci USA 104in press
Branford WW Zhao GQ Valerius MT Weinstein M Birkenmeier EH Rowe LB Potter SS (1997) Spx1 a novel X-linked homeobox gene expressed during spermatogenesis Mechanisms of development 6587-98
Consortium CSaA (2005) Initial sequence of the chimpanzee genome and comparison with the human genome Nature 43769-87
Fay JC Wu CI (2000) Hitchhiking under positive Darwinian selection Genetics 1551405-1413
Figueiredo AL Salles MG Albano RM Porto LC (2004) Molecular and morphologic analyses of expression of ESX1L in different stages of human placental development J Cell Mol Med 8545-550
Fohn LE Behringer RR (2001) ESX1L a novel X chromosome-linked human homeobox gene expressed in the placenta and testis Genomics 74105-108
Gehring WJ Affolter M Burglin T (1994) Homeodomain proteins Annual review of biochemistry 63487-526
Grati FR Sirchia SM Gentilin B Rossella F Ramoscelli L Antonazzo P Cavallari U Bulfamante G Cetin I Simoni G Miozzo M (2004) Biparental expression of ESX1L gene in placentas from normal and intrauterine growth-restricted pregnancies Eur J Hum Genet 12272-278
Haig D (1993) Genetic conflicts in human pregnancy The Quarterly review of biology 68495-532
Jackson M Watt AJ Gautier P Gilchrist D Driehaus J Graham GJ Keebler J Prugnolle F Awadalla P Forrester LM (2006) A murine specific expansion of the Rhox cluster involved in embryonic stem cell biology is under natural selection BMC genomics 7212
Kong A Gudbjartsson DF Sainz J Jonsdottir GM Gudjonsson SA Richardsson B Sigurdardottir S Barnard J Hallbeck B Masson G Shlien A Palsson ST Frigge ML Thorgeirsson TE Gulcher JR Stefansson K (2002) A high-resolution recombination map of the human genome Nature genetics 31241-247
Kumar S Tamura K Nei M (2004) MEGA3 Integrated software for Molecular Evolutionary Genetics Analysis and sequence alignment Brief Bioinform 5150-163
Li W (1997) Molecular Evolution Sinauer Sunderland Mass Li Y Behringer RR (1998) Esx1 is an X-chromosome-imprinted regulator of placental
development and fetal growth Nat Genet 20309-311 Li Y Lemaire P Behringer RR (1997) Esx1 a novel X chromosome-linked homeobox
gene expressed in mouse extraembryonic tissues and male germ cells Dev Biol 18885-95
59
Maclean JA 2nd Chen MA Wayne CM Bruce SR Rao M Meistrich ML Macleod C Wilkinson MF (2005) Rhox a new homeobox gene cluster Cell 120369-382
MacLean JA 2nd Lorenzetti D Hu Z Salerno WJ Miller J Wilkinson MF (2006) Rhox homeobox gene cluster recent duplication of three family members Genesis 44122-129
McGinnis W Hart CP Gehring WJ Ruddle FH (1984) Molecular cloning and chromosome mapping of a mouse DNA sequence homologous to homeotic genes of Drosophila Cell 38675-680
Monk D Arnaud P Apostolidou S Hills FA Kelsey G Stanier P Feil R Moore GE (2006) Limited evolutionary conservation of imprinting in the human placenta Proc Natl Acad Sci U S A 1036623-6628
Morison IM Ramsay JP Spencer HG (2005) A census of mammalian imprinting Trends Genet 21457-465
Morris L Gordon J Blackburn CC (2006) Identification of a tandem duplicated array in the Rhox alpha locus on mouse chromosome X Mamm Genome 17178-187
Murthi P Doherty VL Said JM Donath S Brennecke SP Kalionis B (2006) Homeobox gene ESX1L expression is decreased in human pre-term idiopathic fetal growth restriction Mol Hum Reprod 12335-340
Nam J Nei M (2005) Evolutionary change of the numbers of homeobox genes in bilateral animals Molecular biology and evolution 222386-2394
Ozawa H Ashizawa S Naito M Yanagihara M Ohnishi N Maeda T Matsuda Y Jo Y Higashi H Kakita A Hatakeyama M (2004) Paired-like homeodomain protein ESXR1 possesses a cleavable C-terminal region that inhibits cyclin degradation Oncogene 236590-6602
Podlaha O Webb DM Tucker PK Zhang J (2005) Positive Selection for Indel Substitutions in the Rodent Sperm Protein Catsper1 Molecular biology and evolution 221845-1852
Podlaha O Webb DM Zhang J (2006) Accelerated evolution and loss of a domain of the sperm-egg-binding protein SED1 in ancestral primates Molecular biology and evolution 231828-1831
Saitou N Nei M (1987) The neighbor-joining method a new method for reconstructing phylogenetic trees Molecular biology and evolution 4406-425
Sutton KA Wilkinson MF (1997) Rapid evolution of a homeodomain evidence for positive selection J Mol Evol 45579-588
Swanson WJ Nielsen R Yang Q (2003) Pervasive adaptive evolution in mammalian fertilization proteins Mol Biol Evol 2018-20
Swanson WJ Vacquier VD (2002) The rapid evolution of reproductive proteins Nat Rev Genet 3137-144
Tajima F (1989) Statistical method for testing the neutral mutation hypothesis by DNA polymorphism Genetics 123585-595
Tenesa A Navarro P Hayes BJ Duffy DL Clarke GM Goddard ME Visscher PM (2007) Recent human effective population size estimated from linkage disequilibrium Genome Research 17520-526
Thompson JD Higgins DG Gibson TJ (1994) CLUSTAL W improving the sensitivity of progressive multiple sequence alignment through sequence weighting
60
position-specific gap penalties and weight matrix choice Nucleic acids research 224673-4680
Ting CT Tsaur SC Wu ML Wu CI (1998) A rapidly evolving homeobox at the site of a hybrid sterility gene Science 2821501-1504
Torgerson DG Singh RS (2003) Sex-linked mammalian sperm proteins evolve faster than autosomal ones Mol Biol Evol 201705-1709
Wagschal A Feil R (2006) Genomic imprinting in the placenta Cytogenet Genome Res 11390-98
Wang X Zhang J (2004) Rapid evolution of mammalian X-linked testis-expressed homeobox genes Genetics 167879-888
Wang X Zhang J (2006) Remarkable expansions of an X-linked reproductive homeobox gene cluster in rodent evolution Genomics 8834-43
West JD Frels WI Chapman VM Papaioannou VE (1977) Preferential expression of the maternally derived X chromosome in the mouse yolk sac Cell 12873-882
Wyckoff GJ Wang W Wu CI (2000) Rapid evolution of male reproductive genes in the descent of man Nature 403304-309
Yan YT Stein SM Ding J Shen MM Abate-Shen C (2000) A novel PFPN motif inhibits nuclear localization and DNA binding activity of the ESX1 homeoprotein Mol Cell Biol 20661-671
Yanagihara M Ishikawa S Naito M Nakajima J Aburatani H Hatakeyama M (2005) Paired-like homeoprotein ESXR1 acts as a sequence-specific transcriptional repressor of the human K-ras gene Oncogene 245878-5887
Yang Z (1997) PAML a program package for phylogenetic analysis by maximum likelihood Comput Appl Biosci 13555-556
Zeng K Fu YX Shi S Wu CI (2006) Statistical tests for detecting positive selection by utilizing high-frequency variants Genetics 1741431-1439
Zhang J Kumar S Nei M (1997) Small-sample tests of episodic adaptive evolution a case study of primate lysozymes Molecular biology and evolution 141335-1338
Zhang J Nei M (1996) Evolution of Antennapedia-class homeobox genes Genetics 142295-303
Zhang J Rosenberg HF Nei M (1998) Positive Darwinian selection after gene duplication in primate ribonuclease genes Proc Natl Acad Sci U S A 953708-3713
61
CHAPTER 3
RELAXATION OF SELECTIVE CONSTRAINT AND LOSS OF FUNCTION IN THE EVOLUTION OF HUMAN BITTER TASTE RECEPTOR GENES
31 ABSTRACT
Bitter taste perception prevents mammals from ingesting poisonous substances
because many toxins taste bitter and cause aversion We hypothesize that human bitter
taste receptor (TAS2R) genes might be relaxed from selective constraints because of the
change in diet use of fire and reliance on other means of toxin avoidance that emerged
in human evolution Here we examine the intraspecific variations of all 25 genes of the
human TAS2R repertoire Our data show hallmarks of neutral evolution including
similar rates of synonymous (dS) and nonsynonymous (dN) nucleotide changes among
rare polymorphisms common polymorphisms and substitutions no variation in dNdS
among functional domains segregation of pseudogene alleles within species and
fixation of loss-of-function mutations These results together with previous findings of
large numbers of loss-of-function mutations in olfactory pheromonal and visual
sensory genes in humans suggest surprisingly reduced sensory capabilities of humans
in comparison to many other mammals
32 INTRODUCTION
Humans and most mammals can perceive and discriminate among five major
taste modalities sweet sour bitter salty and umami (the taste of sodium glutamate)
62
(Kinnamon and Cummings 1992 Lindemann 1996) Among these bitter perception has
a special role of preventing animals from ingesting poisonous substances because many
toxins taste bitter and cause aversion (Garcia and Hankins 1975 Glendinning 1994)
The sense of the bitter taste begins by binding of bitter compounds to bitter taste
receptors that are found on the surface of the taste receptor cells of the tongue and
palate epithelium (Lindemann 1996 Chandrashekar et al 2000) The receptors are
encoded by a large family of seven-transmembrane G protein-coupled receptor genes
named TAS2Rs (or T2Rs) and the roles of TAS2Rs in bitter taste have been demonstrated
by both in vitro and in vivo functional assays (Adler et al 2000 Chandrashekar et al
2000 Matsunami et al 2000 Bufe et al 2002 Behrens et al 2004) Unlike visual
pigment genes or olfactory receptor genes for which only one gene is expressed in each
visual or olfactory receptor cell multiple TAS2R genes are found to be expressed in
each bitter taste receptor cell in rodents providing a plausible explanation for the
uniform taste of many structurally distinct toxins (Chandrashekar et al 2000) TAS2R
genes do not contain introns in their protein-coding regions which facilitated their
detection in sequenced genomes Twenty-five putatively functional TAS2R genes (with
open reading frames [ORFs]) and 8 pseudogenes (with disrupted ORFs) have been
identified from the human genome sequence and they are mapped to chromosomes 5 7
and 12 (Shi et al 2003) In comparison the mouse genome contains 33 functional
Tast2r genes and 3 pseudogenes (Shi et al 2003) A phylogenetic analysis of these
genes suggested considerable variation in the TAS2R repertoire among different
mammalian lineages (Shi et al 2003) Although only a minority of these TAS2R genes
has been functionally characterized their chromosomal location sequence similarity
63
and phylogenetic relationships strongly suggest that they are involved in bitter
perception
Because TAS2Rs are directly involved in the interaction between mammals and
their dietary sources it is likely that the evolution of these proteins responds to and
reflects dietary changes in organismal evolution For example there were significant
changes in diet during human evolution (Harris 1992 Leonard 2002 Milton 2003) In
particular the amount of meat in hominid diet began to increase about 2 million years
(MY) ago while the amount of plant materials decreased (Harris 1992 Leonard 2002
Milton 2003) This dietary shift may have caused a reduction in the importance of bitter
taste and TAS2R genes because animal tissues contain fewer bitter and toxic compounds
than plant tissues (Glendinning 1994) Detoxification of poisonous foods by controlled
use of fire starting ~08 MY ago (Goren-Inbar et al 2004) may trigger a further
functional relaxation in TAS2Rs We thus hypothesize that patterns of intra-specific
polymorphism and recent evolution of human TAS2R genes should exhibit low selective
constraints Here we characterize the intra- and inter-specific variations of all 25
members of the human TAS2R repertoire and provide strong evidence supporting this
hypothesis
33 RESULTS
331 Equal levels of synonymous and nonsynonymous polymorphisms in human
TAS2R genes
To examine the genetic variation of TAS2Rs within humans we sequenced all 25
functional genes in 22 humans of diverse geographic origins and one chimpanzee
64
Because synonymous nucleotide changes do not alter protein sequences and are more or
less neutral whereas nonsynonymous changes could be subject to natural selection a
comparison between them can reveal signals of selection (Li 1997 Nei and Kumar
2000) In most genes the majority of nonsynonymous sites are under selective
constraints resulting in lower rates of polymorphisms and substitutions at
nonsynonymous sites than at synonymous sites (Li 1997 Nei and Kumar 2000) In
human TAS2Rs we identified 72 nonsynonymous and 33 synonymous polymorphic
sites from 21408 nucleotide sites including 15242 nonsynonymous and 6166
synonymous sites respectively (Tables 31 and 32 Figure online at
httphmgoxfordjournalsorgcgidataddh289DC11 ) The number of polymorphisms
per nonsynonymous site (472times10-3 Wattersonrsquos θ =109times10-3) is 88 of that per
synonymous site (535times10-3 θ = 123times10-3) indicating that the overall selective
constraints on the two types of sites are similar (P=031 Fisherrsquos exact test) in TAS2R
genes Consistent with this observation the nucleotide diversity per site (Li 1997 Nei
and Kumar 2000) is virtually identical between nonsynonymous (πN=122times10-3) and
synonymous (πS=119times10-3) sites (Table 31) Furthermore while the TAS2R πS is close
to the average synonymous nucleotide diversity observed from a large number of
human genes (11times10-3) (Cargill et al 1999) πN is about 4 times the corresponding
average (028times10-3) (Cargill et al 1999) These comparisons suggest that the similar
magnitudes of πN and πS at TAS2Rs are likely due to reduced selective constraints on
nonsynonymous sites
Alternatively high πN may result from balancing selection which retains
beneficial alleles in a population for a long time (Hughes and Nei 1988) Balancing
65
selection has been suggested to account for the high πN of the TAS2R38 (also called
PTC) gene (Wooding et al 2004) which is largely responsible for the well known
human polymorphism in tasting the synthetic compound phenylthiocarbamide (PTC)
(Kim et al 2003) A characteristic of balancing selection is the positiveness of π minusθ
which can be measured by Tajimarsquos D statistic (Tajima 1989) For the present data D is
positive in 12 genes 0 in one gene and negative in 12 genes with an overall value of -
0048 for all the genes analyzed together (Table 31) D is not significantly different
from 0 for the 25 genes individually or collectively When the synonymous and
nonsynonymous sites were separated one gene (TAS2R48) had a significantly positive
D at synonymous sites (Plt005) and another (TAS2R45) had a significantly positive D
at nonsynonymous sites (Plt005) But the two significant cases may simply be due to
multiple testing as 50 tests were conducted and 25 significant cases (at 5) were
expected by chance These observations do not support the balancing selection
hypothesis for the human TAS2R repertoire although failure to detect balancing
selection here does not preclude its operation at a few TAS2R genes Similar results
were obtained by Fu and Lirsquos tests (Fu and Li 1993) (data not shown) Wooding et al
(Wooding et al 2004) suggested the action of balancing selection on TAS2R38 largely
because the observation of a positive Tajimarsquos D (155) This D value was not
significantly higher than 0 under the assumption that the population size is constant but
it became significantly higher than 0 under specific models of population expansion
(Wooding et al 2004) They suggested that an instant population expansion from the
effective size of 10000 to 1000000 that occurred 100000 years ago is most
appropriate for humans (Rogers 1995 Wooding et al 2004) (see also the manual of the
66
DFSC program of S Wooding at
httpwwwxmissioncom~woodingDFSCREADME) We evaluated this model by
computing D for 6 apparently neutral loci (see Table 33) of the human genome under
this model Surprisingly 5 of the 6 loci (except the locus at Xq133) show significantly
positive D values Thus we believe that use of the above population expansion model
leads to false positive detection of balancing selection Although this does not mean that
use of the constant-population model is correct it is certainly a more conservative and
safer test for balancing selection particularly when the details of human population
expansion is still unclear
Possible natural selection on human TAS2Rs can be further scrutinized by
comparing rare and common polymorphisms (Fay et al 2001) We used the chimpanzee
as the outgroup of humans to determine which human alleles are derived and which are
ancestral and then classified each polymorphism to either rare or common using 10
frequency for the derived allele as the cutoff (Table 32) We found that the ratio of the
number of nonsynonymous polymorphisms to that of synonymous polymorphisms was
similar between rare (3315=220) and common (3918=217) categories (P=057) This
is consistent with the lack of purifying selection on TAS2Rs because purifying selection
would prevent deleterious nonsynonymous mutations from becoming common and thus
generate a lower nonsynonymoussynonymous ratio for common polymorphisms than
for rare ones (Fay et al 2001)
332 Pseudogenization of human TAS2Rs
67
In addition to the many nonsynonymous polymorphisms two nonsense
polymorphisms were observed in human TAS2Rs The first was a CrarrT mutation at
position 640 of TAS2R7 that changed an Arg residue to a premature stop codon and
resulted in a receptor that contains only five transmembrane domains (Figure online at
httphmgoxfordjournalsorgcgidataddh289DC11 ) This apparently nonfunctional
allele was observed once (in Andes Indian) in the 22 individuals surveyed The
relatively low frequency (23) of the allele makes it difficult to distinguish whether it
is neutral (but newly emergent) or deleterious The second nonsense polymorphism
(GrarrA at position 749) changed a Trp to a premature stop codon in TAS2R46 resulting
in a truncated receptor with six transmembrane domains (Figure online at
httphmgoxfordjournalsorgcgidataddh289DC11 ) This nonfunctional allele was
observed 11 times in our samples The moderate frequency (025) of this allele and its
presence in various human populations (African Americans Caucasians Southeast
Asians Chinese and Pacific Islanders) demonstrates that it is not under purifying
selection A comparison between the human and chimpanzee genome sequences
indicates that chimpanzees have 6 TAS2R pseudogenes while humans have two
additional ones (hps1 and hps2 in (Shi et al 2003)) both having been fixed as revealed
by our sequencing of 22 humans (Figures online at
httphmgoxfordjournalsorgcgidataddh289DC12 and
httphmgoxfordjournalsorgcgidataddh289DC13 ) We also confirmed that the
chimpanzee orthologs of hps1 and hps2 have intact ORFs by sequencing one individual
Therefore in the 6-7 million years (MY) since the human-chimpanzee split (Brunet et
al 2002) two functional TAS2R genes have turned into pseudogenes in the hominid
68
lineage and another one or two are becoming pseudogenes in present-day humans By
contrast no new TAS2R pseudogenes have been fixed in the chimpanzee lineage
There are three residues that are absolutely conserved among all 63 mouse and rat
Tas2rs (see below) suggesting that these residues are required for proper functioning of
bitter taste receptors However two of them have changed in human TAS2Rs Position
103 of human TAS2R13 is fixed with Phe while this position is Leu in all mouse and
rat Tas2rs Similarly human TAS2R14 is fixed with Met at position 205 while it is Leu
in rodents An in vitro study showed that human TAS2R14 responds to multiple bitter
compounds (Behrens et al 2004) It will be interesting to examine if human TAS2R13
is functional
333 Equal rates of synonymous and nonsynonymous substitutions
When did the functional relaxation in human TAS2Rs occur This question may
be addressed by comparing polymorphism and divergence data A comparison between
orthologous TAS2R genes from the 22 humans and one chimpanzee identified 104
nonsynonymous and 42 synonymous substitutions that have been fixed between species
(Tables 31 32) These numbers translate into identical rates of nonsynonymous
(682times10-3) and synonymous (682times10-3) substitutions per site (P=052) When we
measured the human-chimpanzee distance by comparing a randomly picked human
allele with a randomly picked chimpanzee allele as normally conducted the
synonymous and nonsynonymous distances both became 83times10-3 per site These
numbers are significantly (Plt005) lower than the average human-chimpanzee distance
(0012 per site) observed from large genomic data (Chen et al 2001 Ebersberger et al
69
2002) and may reflect mutation rate variation within genome (Ellegren et al 2003) The
McDonald-Kreitman test (Mcdonald and Kreitman 1991) did not detect any difference
between the intraspecific and interspecific patterns of nonsynonymous and synonymous
variations for human TAS2Rs (P=038 Table 32) From the single chimpanzee
sequenced 3 synonymous and 8 nonsynonymous polymorphisms were found The
nonsynonymoussynonymous ratio (83=267) is comparable to the ratio for human
polymorphisms (7233=218) and the ratio for fixed substitutions between species
(10442=248) We also conducted an HKA test (Hudson et al 1987) by comparing the
polymorphism and divergence data from human TAS2Rs and those from 6 noncoding
regions of the human genome that are at least 3000 nucleotides long and are not known
to be under natural selection but no difference was found (Table 33) These results
suggest that the functional relaxation already started in the common ancestor of humans
and chimpanzees and that there is no detectable difference in selection between the
human polymorphism and divergence data
An alternative explanation for the above between-species data is a more complex
scenario involving purifying selection at some sites and positive selection at some other
sites of TAS2Rs Previous studies showed that transmembrane (TM) domains of
TAS2Rs are more conserved than extracellular (EC) and intracellular (IC) domains and
that EC domains may be subject to positive selection between rapidly diversifying
paralogous genes consistent with the presumable tastant-TAS2R binding sites being
located in the EC domains (Shi et al 2003) To test the hypothesis of positive and
purifying selection on human and chimpanzee TAS2Rs we estimated the dNdS ratio in
EC TM and IC domains respectively For comparison we used Tas2r genes from the
70
mouse and rat To obtain these genes we searched the rat genome sequence using all 33
mouse Tas2r genes as queries and identified 30 rat Tas2r genes A phylogenetic tree of
all putatively functional TAS2R genes from the human chimpanzee mouse and rat was
reconstructed (Figure 31 Figure online at
httphmgoxfordjournalsorgcgidataddh289DC14 ) From this tree 28 pairs of
mouse and rat genes were apparently orthologous We concatenated these 28 genes for
the mouse and rat respectively and estimated the average dN and dS between them
Figure 32 shows that the dNdS ratio is significantly lower than 1 for each of the three
functional regions (EC TM and IC) in rodent Tas2r genes demonstrating the operation
of purifying selection between the orthologs Among-domain variation in dNdS another
characteristic of functional genes is also evident and TM domains show the lowest
dNdS For both intraspecific and interspecific data of human TAS2Rs dNdS is not
significantly different from 1 for any of the three functional regions or the entire genes
Furthermore no variation in dNdS among functional regions is seen Compared with
rodent Tas2rs human TAS2Rs have significantly elevated dNdS in the TM domains
These observations are consistent with the hypothesis of functional relaxation in
humans (and chimpanzees) but do not support the alternative hypothesis of a
combination of positive and purifying selection because the latter predicts an elevation
in dNdS in EC domains while maintaining low dNdS in functionally conserved TM
domains
Similarly one may hypothesize that some TAS2Rs of humans are under positive
selection while some others are under purifying selection giving an average dNdS of ~1
for the repertoire Table 31 lists the dNdS ratio for each of the 25 human TAS2R genes
71
and some ratios appear much higher than others although none of them are significantly
different from 1 We used computer simulation to test whether this among-gene
variation was simply due to chance In the simulation we assumed that every gene has
the expected dN and dS identical to the corresponding averages of the 25 human TAS2R
genes and then generated an expected distribution of dNdS from 5000 simulations
(Figure 33) When this distribution was compared with the observed distribution no
significant difference was found (P=065 χ2 test Fig 33) suggesting that the apparent
among-gene variation in dNdS shown in Table 31 is explainable by chance alone
34 DISCUSSION
In this work we characterized the intra- and inter-specific variations of the entire
human bitter taste receptor gene repertoire Our intra-specific data show equal levels of
synonymous and nonsynonymous polymorphisms equal nonsynonymoussynonymous
ratios for rare and common polymorphisms equal nonsynonymoussynonymous ratios
among functional domains segregation of nonfunctional alleles in populations and
fixation of pseudogenes in the species All these observations support the lack of
selective constraint on human TAS2R genes Our inter-specific comparison between the
human and chimpanzee also suggests that TAS2R genes have been under neutral
evolution without much constraint If a complete functional relaxation occurred in the
common ancestor of humans and chimpanzees it is perplexing why fixations of
mutations that disrupt TAS2R ORFs occurred only twice in humans and did not occur at
all in chimpanzees Using computer simulation (see Materials and Methods) we
estimated that the average half-life of human TAS2R genes is 677 MY in the absence of
72
natural selection meaning that after 677 MY of neutral evolution a TAS2R gene has a
50 chance of becoming a fixed pseudogene From the observation that only two out of
27 TAS2R genes have become fixed pseudogenes during hominid evolution we
obtained the maximum likelihood estimate of the starting time (T) of the complete
functional relaxation to be 075 MY ago though any T within 01 to 26 MY ago cannot
be rejected at 5 significance level It is likely that an incomplete functional relaxation
started early in the ancestry of humans and chimpanzees but a second wave of more
complete relaxation occurred recently in the hominid lineage alone This would explain
the lack of pseudogene formation in chimpanzees and the paucity of human
pseudogenizations Because each TAS2R recognizes multiple related toxic compounds
(Bufe et al 2002 Behrens et al 2004) and each taste receptor cell expresses multiple
TAS2R genes (Chandrashekar et al 2000) it is possible that an incomplete functional
relaxation occurs when the number or amount of toxins that a species encounters
reduces
As mentioned a dietary change that started 2 MY ago (Harris 1992 Leonard
2002 Milton 2003) resulted in an increase of animal tissues and decrease of plant
tissues in hominid diet which reduced the number of toxic foods that hominids came
across Controlled use of fire was evident about 08 MY ago (Goren-Inbar et al 2004)
the reliance on TAS2Rs to detect toxins further diminished because cooking
significantly detoxifies poisonous food (Harris 1992) It is interesting that the likelihood
estimate of the starting time (075 MY ago) of the complete functional relaxation in
human TAS2R genes coincides with the beginning of the fire use in hominid evolution
although our estimate has a large variance Our data suggest that chimpanzee TAS2Rs
73
are likely under relaxed selective constraint as well although to a lesser degree as
evident from the lack of pseudogenization It has been noted that chimpanzees
occasionally eat meat (2-13 of diet) whereas other great apes (gorillas and
orangutans) almost never do so (Milton 2003) Furthermore among the plant foods
chimpanzees eat mostly ripe fruits while gorillas and orangutans eat more leaves unripe
fruits bark and pith (Milton 2003) Ripe fruits contain considerably fewer toxins than
do leaves and unripe fruits (Glendinning 1994) These factors when combined may
have reduced the selective pressures on chimpanzee TAS2Rs A broader survey of
TAS2R genes in primates may provide a better understanding of the ecology and
selective agents behind the evolution of TAS2R genes and the bitter taste
Our finding that the TAS2R bitter taste receptor gene repertoire of humans is
under relaxed selective constraint has several implications First humans have lost and
continue to lose TAS2R genes which would result in a decrease in the number of bitter
compounds that we can taste Second the segregation of nonfunctional TAS2R alleles in
current human populations indicates among-individual variation in bitter sensitivity
Third functional relaxation may also allow the appearance of new TAS2R alleles that
can bind previously unrecognizable tastants While the emergence of these new alleles
may increase the diversity in bitter recognition among humans it likely has little effect
on fitness because of the neutral nature of the new alleles It should be noted that loss of
selective constraint does not result in loss of function instantly Probably because of the
relatively short time since the loss of selective constraints on human TAS2R genes
many human TAS2R genes may still be functional and we can still taste many bitter
74
compounds But loss of function will result after sufficient time of evolution under no
selective constraint
Our finding is intriguing when compared with the evolutionary patterns of other
human sensory genes Olfactory receptor genes have been inactivated in the human
lineage at a higher rate than in chimpanzees and other primates In humans over 50 of
olfactory receptor genes are pseudogenes in contrast to 30-35 in other apes and less
than 20 in rodents (Gilad et al 2003 Gilad et al 2004) In fact humans have fewer
than 400 functional olfactory receptor genes (Niimura and Nei 2003) and they appear to
be under weak or no selective constraints (Gimelbrant et al 2004) while mice have
over 1000 functional genes (Zhang et al 2004) Humans apes and Old World monkeys
have lost important components of the vomeronasal pheromone signal transduction
pathway and are insensitive to vomeronasal pheromones (Liman and Innan 2003 Zhang
and Webb 2003) Humans also have an unusually high frequency of redgreen color
blindness (eg 8 in male Caucasians) that is not found in wild apes or Old World
monkeys (Surridge et al 2003) Deafness also occurs at a relatively high frequency
(008) in humans nonfunctional GJB2 alleles which are responsible for genetic
deafness in many populations have a total frequency of ~18 in United States (Nance
and Kearsey 2004) Although genes involved in these sensory systems may have
deteriorated at different times in the evolutionary lineage of humans it is compelling
that sensitivities to a number of sensory signals are weaker in humans than in many of
our mammalian relatives It is possible that in the evolution of apes and particularly
humans sensory capabilities became a less important component of an individualrsquos
fitness
75
35 MATERIALS AND METHODS
351 Sequencing human and chimpanzee TAS2R genes
Genomic DNAs of one chimpanzee (Pan troglodytes) and 22 unrelated humans
(Homo sapiens) of diverse geographic origins (3 Pygmy Africans 6 African Americans
5 Caucasians 3 Southeast Asians 2 Chinese 2 Pacific Islanders and 1 Andes Indian)
were purchased from Coriell Cell Repositories Gene-specific primers for amplifying
the 25 TAS2R genes were designed according to the human genome sequence The
protein-coding region of each TAS2R gene has 900-1000 nucleotides most of which
were amplified in our experiments After removing the primer-encoded regions the
total number of nucleotides examined here was 21408 or on average 856 per gene
Polymerase chain reactions (PCRs) were performed with high fidelity DNA polymerase
under conditions recommended by the manufacturer (Invitrogen) PCR products were
separated on 15 agarose gel and purified using the Gel Extraction Kit (Qiagen)
before being sequenced from both directions using the dideoxy chain termination
method with an automated DNA sequencer Sequencher (GeneCodes) was used to
assemble the sequences and to identify DNA polymorphisms Two human pseudogenes
(hps1 and hps2) were also sequenced in the 22 humans and one chimpanzee The primer
sequences are available upon request
352 Evolutionary analyses
Numbers of synonymous and nonsynonymous sites and numbers of synonymous
and nonsynonymous nucleotide changes were counted following (Zhang et al 1998)
76
The number of synonymous changes per synonymous site (dS) and the number of
nonsynonymous changes per nonsynonymous sites (dN) were then computed (Nei and
Kumar 2000) Wattersonrsquos θ nucleotide diversity π Tajimarsquos D test (Tajima 1989) and
HKA test (Hudson et al 1987) were computed or conducted by DnaSP (Rozas et al
2003) Rare and common polymorphisms were defined using the cutoff of 10
frequency for the derived allele Use of different cutoffs (5 and 15) did not change
our result The sequence data of six noncoding regions used in the HKA test were from
(Zietkiewicz et al 1998 Harris and Hey 1999 Kaessmann et al 1999 Fullerton et al
2000 Zhao et al 2000 Yu et al 2001) Mouse Tas2r gene sequences were obtained
from (Shi et al 2003) Rat Tas2r genes were identified by BLAST searches of the rat
genome sequence using the mouse genes as queries A neighbor-joining tree (Saitou and
Nei 1987) of the putatively functional TAS2R genes of the human chimpanzee mouse
and rat was reconstructed using the protein Poisson distance (Nei and Kumaer 2000)
The bootstrap test (with 2000 replications) was used to examine the reliability of the
observed branching patterns (Felsenstein 1985) MEGA2 (Kumar et al 2001) was used
for the phylogenetic analysis Twenty-eight pairs of orthologous Tas2r genes from the
mouse and rat were identified and used for computing dS and dN Functional domains in
TAS2Rs were defined following (Adler et al 2000) Computer simulation was used to
evaluate the expected variation in dNdS among TAS2R genes Because the total numbers
of fixed synonymous and nonsynonymous differences in the 25 orthologous genes of
humans and chimpanzees were 42 and 104 respectively (Table 31) the average
numbers per gene were 168 and 416 respectively Since nucleotide substitution is a
Poisson process we generated a Poisson random number with the mean of 168 as the
77
number of synonymous substitution for a gene and an independent Poisson random
number with the mean of 416 as the number of nonsynonymous substitution for the
gene The dNdS ratio for the gene was then computed following (Zhang et al 1998)
using the average numbers of synonymous (24664) and nonsynonymous (60968) sites
per gene for the TAS2R genes When the number of synonymous substitution was 0
dNdS was designated as NA Such simulation was repeated 5000 times and a
distribution of dNdS was generated This distribution was compared with the observed
distribution from the 25 TAS2Rs by a χ2 test We used the program PSEUDOGENE
(Zhang and Webb 2003) to estimate the half-life (t12) of each of the human TAS2R
genes and obtained an average of 677plusmn005 MY In the computation we used a point
nucleotide substitution rate of 64times10-10 per site per year which was estimated from the
synonymous substitution rates in TAS2R genes under the assumption of 65 MY as the
time since the human-chimpanzee split (Brunet et al 2002) We also used a substitution
rate of 081times10-10 per site per year for ORF-disruptive indels which was estimated from
human-chimpanzee genomic comparisons (Britten 2002 Podlaha and Zhang 2003
Zhang and Webb 2003) The starting time of the complete functional relaxation (T) as
well as its confidence interval was estimated using a likelihood approach (Zhang and
Webb 2003)
36 ACKNOWLEDGMENTS
We thank Soochin Cho David Webb and two anonymous reviewers for valuable
comments This work was supported by a startup fund of the University of Michigan
and a research grant from the National Institutes of Health (GM67030) to JZ
78
Figure 31 Evolutionary relationships of 113 putatively functional TAS2R genes from the human chimpanzee mouse and rat The tree is reconstructed by the neighbor-joining method with protein Poisson distances Bootstrap percentages (ge50) from 2000 replications are shown at interior nodes The mouse and rat genes with uncertain orthology are marked with triangles and are not used in computing the dNdS ratios presented in Figure 32 The protein sequence alignment used for the tree reconstruction is provided in Figure online (httphmgoxfordjournalsorgcgidataddh289DC14)
mouse Tas2r117 rat Tas2r117 mouse Tas2r109
rat Tas2r109 mouse Tas2r129
rat Tas2r129 human TAS2R14
chimp TAS2R14 mouse Tas2r116
mouse Tas2r113 ratTas2r113
mouse Tas2r115 mouse Tas2r125
mouse Tas2r103 rat Tas2r103
mouse Tas2r140 rat Tas2r140
mouse Tas2r110 mouse Tas2r123 rat Tas2r123 rat Tas2r110
mouse Tas2r120 rat Tas2r120
mouseTas2r136 rat Tas2r136
human TAS2R50 chimpTAS2R50
human TAS2R48 chimp TAS2R48
human TAS2R49 chimp TAS2R49
humanTAS2R46 chimp TAS2R46
humanTAS2R47 chimpTAS2R47
human TAS2R45 chimp TAS2R45
human TAS2R43 chimp TAS2R43
human TAS2R44 chimpTAS2R44 human TAS2R13
chimp TAS2R13 mouse Tas2r121 rat Tas2r121
mouse Tas2r124 rat Tas2r124
mouse Tas2r102 rat Tas2r102
human ht2r55 chimp ht2r55
mouse Tas2r131 rat Tas2r131
human TAS2R7 chimp TAS2R7
mouse Tas2r130 rat Tas2r130
human TAS2R8 chimp TAS2R8
huamn TAS2R9 chimp TAS2R9
human TAS2R10 chimp TAS2R10
mouse Tas2r106 rat Tas2r106
mouse Tas2r107 rat Tas2r107
mouse Tas2r104 rat Tas2r104
mouse Tas2r114 rat Tas2r114
mouse Tas2r105 rat Tas2r105
human TAS2R3 chimp TAS2R3
mouse t2r41 rat t2r41
human TAS2R5 chimp TAS2R5
human TAS2R38 chimp TAS2R38
mouse Tas2r138 rat Tas2r138 human TAS2R4 chimp TAS2R4 mouse Tas2r108 rat Tas2r108
mouse Tas2r139 rat Tas2r139
human TAS2R39 chimp TAS2R39
human TAS2R40 chimp TAS2R40
mouse Tas2r144 rat Tas2r144
human TAS2R1 chimp TAS2R1
mouse Tas2r119 rat Tas2r119
human TAS2R16 chimp TAS2R16
mouse Tas2r118 rat Tas2r118
mouse Tas2r143 rat Tas2r143
human TAS2R41 chimp TAS2R41 mouse Tas2r126 rat Tas2r126
human TAS2R60 chimp TAS2R60
mouse Tas2r135 rat Tas2r135
100
100
100
100
100
100
100
100
100
100
99
100
100
100
100
100
100
100
100
99
100
100
100
100
100
100
99
100
100
100
100
55
100
100
100
100100
100
100
100
89
100
70
100
100
100
100
100
100
100
99
100
99
68
100
68
100
100
100
100
100
100
89
100
84
64
100
100
100
100
100100
99
99
99
7678
62
99
68100
83
79
75
100
73
99
84
99
69
89
52
76
53
59
94
02
79
Figure 32 Comparison of dNdS among different functional domains of TAS2Rs Black bars show the dNdS ratios computed from the concatenated sequences of 28 pairs of orthologous Tas2r genes of the mouse and rat Shaded bars show the dNdS ratios of the fixed differences between human and chimpanzee for the concatenated sequences of 25 pairs of orthologous TAS2R genes White bars show the dNdS ratios computed from the human polymorphisms at the 25 TAS2R genes All comparisons are conducted using Fisherrsquos exact test following (Zhang et al 1997) Significant levels 5 05 005 The test result of the null hypothesis of dNdS=1 for each bar is indicated above the bar Comparisons between two bars are indicated with brackets Non-significant results are not indicated EC four extracellular domains TM seven transmembrane domains IC four intracellular domains Total entire proteins
00
05
10
15
20
EC TM IC Total
d Nd S
P =0059
80
Figure 33 Expected and observed distributions of dNdS among 25 human TAS2R genes The expected distribution (white bars) under equal dNdS ratios among genes was generated by computer simulation (see Materials and Methods) whereas the observed distribution (black bars) was from the dNdS column in Table 31 NA not applicable due to zero synonymous substitution There is no significant difference between the two distributions (Pgt05 χ2 test)
0
2
4
6
8
0-04 04-08 08-12 12-16 gt16 NA
81
Table 31 Intra- and inter- variations of human TAS2R genes Table 1 Intra- and inter-specific variations of human TAS2R genes
Sysnonymous changes Nonsynonymous changes Total
Gene names Chr1 L 2 S 3 π ()4 θ ()5 D 6 d 7S π () θ () D d S π () θ () D d d Nd S
8
TAS2R1 5 825 1 004 010 -085 2 2 005 008 -056 4 3 005 008 -087 6 082TAS2R3 7 864 2 022 018 037 2 0 000 000 000 1 2 006 005 037 3 021TAS2R4 7 810 0 000 000 000 1 2 011 008 059 1 2 007 006 059 2 043TAS2R5 7 801 1 004 010 -085 3 3 011 012 -015 7 4 009 011 -048 10 096TAS2R7 12 876 0 000 000 000 2 0 000 000 000 4 0 000 000 000 6 082TAS2R8 12 831 2 022 020 024 0 1 001 004 -112 2 3 007 008 -039 2 NATAS2R9 12 867 0 000 000 000 3 1 008 004 154 4 1 006 003 154 7 054TAS2R10 12 849 2 012 020 -069 0 1 004 004 027 5 3 007 008 -040 5 NATAS2R13 12 837 0 000 000 000 2 2 009 008 036 11 2 007 005 036 13 214TAS2R14 12 879 2 033 018 147 3 1 003 004 -053 4 3 011 008 057 7 053TAS2R16 7 807 2 011 020 -083 2 3 012 012 -004 1 5 012 014 -048 3 020TAS2R38 7 945 0 000 000 000 3 4 021 014 116 2 4 015 010 116 5 028TAS2R39 7 957 1 002 008 -112 1 3 003 010 -157 2 4 002 010 -176 3 079TAS2R40 7 918 0 000 000 000 1 1 003 004 -014 2 1 002 003 -014 3 080TAS2R41 7 870 3 014 026 -100 1 1 004 004 027 5 4 007 011 -071 6 214TAS2R43 12 870 2 000 019 -130 1 7 021 026 -047 2 9 017 024 -084 3 078TAS2R44 12 888 3 023 027 -028 5 7 027 026 018 8 10 026 026 002 13 066TAS2R45 12 828 1 002 010 -112 2 6 045 023 239 5 7 032 019 182 7 101TAS2R46 12 804 1 004 010 -085 3 2 012 080 005 6 3 010 011 -040 9 078TAS2R47 12 867 2 018 018 -003 0 2 008 007 012 0 4 011 011 005 0 NATAS2R48 12 753 2 045 020 219 0 6 010 026 -162 6 8 020 024 -047 6 NATAS2R49 12 855 3 038 028 075 0 9 050 034 137 2 12 047 032 135 2 NATAS2R50 12 831 2 029 019 097 1 3 009 012 -053 5 5 015 014 015 6 201hT2R55 12 885 1 010 009 160 3 4 024 015 157 7 5 020 013 191 10 095TAS2R60 7 891 0 000 000 000 1 1 001 004 -085 8 1 001 003 -085 9 334Sum 21408 33 012 012 -005 42 72 012 011 009 104 105 012 011 -005 146 1001 Chromosomal location2 Number of sequenced nucleotides3 Number of polymorphic sites4 Nucleotide diversity per site5 Wattersons θ per site6 Tajimas D Plt0057 Number of fixed nucleotide differences between human and chimpanzee8 Number of fixed nonsynonymous differences per nonsynonymous site between human and chimpanzee divided by the number offixed synonymous differences per synonymous site NA not applicable because of zero synonymous differences
82
Table 32 Rates of synonymous and nonsynonymous nucleotide changes in human TAS2Rs
Table 2 Rates of synonymous and nonsynonymous nucleotide changes in human TAS2R s Nonsynonymous Synonymous NS ratio
Number of sites sequenced 15242 6166 247Rare polymorphisms 33 15 220Common polymorphisms 39 18 217Fixed changes 104 42 248None of the NS ratios are significantly different from each other (Fishers test)
83
Table 33 Comparison between TAS2R genes and neutrally evolving human sequences in intra- and inter-specific variation
Table 3 Comparison between TAS2R genes and neutrally evolving human sequences in intra- and inter-specific variations
Genomic regions (references) Sequence length (nt) π ()1 θ ()2 d ()3 θ d HKA Prob4
25 TAS2R genes (this study) 21408 0121 0115 0831 0138
Noncoding region at 1q24 (42) 8991 0058 0095 0623 0152 0669
β-globin initiation region at 11p15 (43) 6076 0129 0107 1284 0083 0508
Noncoding region at 22q11 (44) 9091 0088 0139 1353 0103 0312
Dystrophin intron-dys44 at Xp21 (45) 7475 0135 0102 0604 0169 0779
PDHA1 introns at Xp22 (46) 3530 0225 0211 0992 0213 0648
Noncoding region at Xq133 (47) 10200 0045 0083 0922 0090 03691 Nucleotide diversity per site for X chromosome data it is corrected by multiplication by 432 Wattersons estimate of polymorphism per site for X chromosome it is corrected by multiplication by 433 Number of nucleotide differences per site between human and chimpanzee sequences 4 Probability from the HKA test (30) with comparison to the TAS2R data
84
37 LITERATURE CITED Adler E Hoon MA Mueller KL Chandrashekar J Ryba NJP Zuker CS (2000) A novel
family of mammalian taste receptors Cell 100693-702 Behrens M Brockhoff A Kuhn C Bufe B Winnig M Meyerhof W (2004) The human
taste receptor hTAS(2)R(14) responds to a variety of different bitter compounds Biochemical and Biophysical Research Communications 319479-485
Britten RJ (2002) Divergence between samples of chimpanzee and human DNA sequences is 5 counting indels Proceedings of the National Academy of Sciences of the United States of America 9913633-13635
Brunet M Guy F Pilbeam D Mackaye HT Likius A Ahounta D Beauvilain A et al (2002) A new hominid from the Upper Miocene of Chad central Africa Nature 418145-151
Bufe B Hofmann T Krautwurst D Raguse JD Meyerhof W (2002) The human TAS2R16 receptor mediates bitter taste in response to beta-glucopyranosides Nature Genetics 32397-401
Cargill M Altshuler D Ireland J Sklar P Ardlie K Patil N Lane CR Lim EP Kalyanaraman N Nemesh J Ziaugra L Friedland L Rolfe A Warrington J Lipshutz R Daley GQ Lander ES (1999) Characterization of single-nucleotide polymorphisms in coding regions of human genes Nature Genetics 22231-238
Chandrashekar J Mueller KL Hoon MA Adler E Feng LX Guo W Zuker CS Ryba NJP (2000) T2Rs function as bitter taste receptors Cell 100703-711
Chen FC Vallender EJ Wang H Tzeng CS Li WH (2001) Genomic divergence between human and chimpanzee estimated from large-scale alignments of genomic sequences Journal of Heredity 92481-489
Ebersberger I Metzler D Schwarz C Paabo S (2002) Genomewide comparison of DNA sequences between humans and chimpanzees American Journal of Human Genetics 701490-1497
Ellegren H Smith NGC Webster MT (2003) Mutation rate variation in the mammalian genome Current Opinion in Genetics amp Development 13562-568
Fay JC Wyckoff GJ Wu CI (2001) Positive and negative selection on the human genome Genetics 1581227-1234
Felsenstein J (1985) Confidence-Limits on Phylogenies - an Approach Using the Bootstrap Evolution 39783-791
Fu YX Li WH (1993) Statistical Tests of Neutrality of Mutations Genetics 133693-709
Fullerton SM Bond J Schneider JA Hamilton B Harding RM Boyce AJ Clegg JB (2000) Polymorphism and divergence in the beta-globin replication origin initiation region Molecular Biology and Evolution 17179-188
Garcia J Hankins WG (1975) The evolution of bitter and the acquisition of toxiphobia In Denton DA and Coghlan JP (eds) Olfaction and Taste V Proceedings of the 5th International Symposium in Melbourne Australia Academic Press New York pp 39-45
Gilad Y Man O Paabo S Lancet D (2003) Human specific loss of olfactory receptor genes Proceedings of the National Academy of Sciences of the United States of America 1003324-3327
85
Gilad Y Wiebel V Przeworski M Lancet D Paabo S (2004) Loss of olfactory receptor genes coincides with the acquisition of full trichromatic vision in primates Plos Biology 2120-125
Gimelbrant AA Skaletsky H Chess A (2004) Selective pressures on the olfactory receptor repertoire since the human-chimpanzee divergence Proceedings of the National Academy of Sciences of the United States of America 1019019-9022
Glendinning JI (1994) Is the Bitter Rejection Response Always Adaptive Physiology amp Behavior 561217-1227
Goren-Inbar N Alperson N Kislev ME Simchoni O Melamed Y Ben-Nun A Werker E (2004) Evidence of hominin control of fire at Gesher Benot Yaaqov Israel Science 304725-727
Harris DR (1992) Human diet and subsistence In Jones S Martin R and Pilbeam D (eds) The Cambridge Encyclopedia of Human Evolution Cambridge University Press Cambridge pp 69-74
Harris EE Hey J (1999) X chromosome evidence for ancient human histories Proceedings of the National Academy of Sciences of the United States of America 963320-3324
Hudson RR Kreitman M Aguade M (1987) A Test of Neutral Molecular Evolution Based on Nucleotide Data Genetics 116153-159
Hughes AL Nei M (1988) Pattern of Nucleotide Substitution at Major Histocompatibility Complex Class-I Loci Reveals Overdominant Selection Nature 335167-170
Kaessmann H Heissig F von Haeseler A Paabo S (1999) DNA sequence variation in a non-coding region of low recombination on the human X chromosome Nature Genetics 2278-81
Kim UK Jorgenson E Coon H Leppert M Risch N Drayna D (2003) Positional cloning of the human quantitative trait locus underlying taste sensitivity to phenylthiocarbamide Science 2991221-1225
Kinnamon SC Cummings TA (1992) Chemosensory Transduction Mechanisms in Taste Annual Review of Physiology 54715-731
Kumar S Tamura K Jakobsen IB Nei M (2001) MEGA2 molecular evolutionary genetics analysis software Bioinformatics 171244-1245
Leonard WR (2002) Food for thought - Dietary change was a driving force in human evolution Scientific American 287106-115
Liman ER Innan H (2003) Relaxed selective pressure on an essential component of pheromone transduction in primate evolution Proceedings of the National Academy of Sciences of the United States of America 1003328-3332
Lindemann B (1996) Taste reception Physiological Reviews 76719-766 Matsunami H Montmayeur JP Buck LB (2000) A family of candidate taste receptors
in human and mouse Nature 404601-+ Mcdonald JH Kreitman M (1991) Adaptive Protein Evolution at the Adh Locus in
Drosophila Nature 351652-654 Milton K (2003) The critical role played by animal source foods in human (Homo)
evolution Journal of Nutrition 1333886S-3892S Nance WE Kearsey MJ (2004) Relevance of connexin deafness (DFNB1) to human
evolution American Journal of Human Genetics 741081-1087
86
Niimura Y Nei M (2003) Evolution of olfactory receptor genes in the human genome Proceedings of the National Academy of Sciences of the United States of America 10012235-12240
Podlaha O Zhang JZ (2003) Positive selection on protein-length in the evolution of a primate sperm ion channel Proceedings of the National Academy of Sciences of the United States of America 10012241-12246
Rogers AR (1995) Genetic-Evidence for a Pleistocene Population Explosion Evolution 49608-615
Rozas J Sanchez-DelBarrio JC Messeguer X Rozas R (2003) DnaSP DNA polymorphism analyses by the coalescent and other methods Bioinformatics 192496-2497
Saitou N Nei M (1987) The Neighbor-Joining Method - a New Method for Reconstructing Phylogenetic Trees Molecular Biology and Evolution 4406-425
Shi P Zhang JZ Yang H Zhang YP (2003) Adaptive diversification of bitter taste receptor genes in mammalian evolution Molecular Biology and Evolution 20805-814
Surridge AK Osorio D Mundy NI (2003) Evolution and selection of trichromatic vision in primates Trends in Ecology amp Evolution 18198-205
Tajima F (1989) Statistical-Method for Testing the Neutral Mutation Hypothesis by DNA Polymorphism Genetics 123585-595
Wooding S Kim UK Bamshad MJ Larsen J Jorde LB Drayna D (2004) Natural selection and molecular evolution in PTC a bitter-taste receptor gene American Journal of Human Genetics 74637-646
Yu N Fu YX Sambuughin N Ramsay M Jenkins T Leskinen E Patthy L Jorde LB Kuromori T Li WH (2001) Global patterns of human DNA sequence variation in a 10-kb region on chromosome 1 Molecular Biology and Evolution 18214-222
Zhang JZ Kumar S Nei M (1997) Small-sample tests of episodic adaptive evolution A case study of primate lysozymes Molecular Biology and Evolution 141335-1338
Zhang JZ Rosenberg HF Nei M (1998) Positive Darwinian selection after gene duplication in primate ribonuclease genes Proceedings of the National Academy of Sciences of the United States of America 953708-3713
Zhang JZ Webb DM (2003) Evolutionary deterioration of the vomeronasal pheromone transduction pathway in catarrhine primates Proceedings of the National Academy of Sciences of the United States of America 1008337-8341
Zhang XM Rodriguez I Mombaerts P Firestein S (2004) Odorant and vomeronasal receptor genes in two mouse genome assemblies Genomics 83802-811
Zhao ZM Jin L Fu YX Ramsay M Jenkins T Leskinen E Pamilo P Trexler M Patthy L Jorde LB Ramos-Onsins S Yu N Li WH (2000) Worldwide DNA sequence variation in a 10-kilobase noncoding region on human chromosome 22 Proceedings of the National Academy of Sciences of the United States of America 9711354-11358
Zietkiewicz E Yotova V Jarnik M Korah-Laskowska M Kidd KK Modiano D Scozzari R Stoneking M Tishkoff S Batzer M Labuda D (1998) Genetic
87
structure of the ancestral population of modern humans Journal of Molecular Evolution 47146-155
88
CHAPTER 4
ADAPTIVE PSEUDOGENIZATION OF CASPASE12 IN HUMAN EVOLUTION
41 ABSTRACT
Pseudogenization is a widespread phenomenon in genome evolution and it has
been proposed to serve as an engine of evolutionary change especially during human
origins (the ldquoless-is-morerdquo hypothesis) Here we provide population genetic evidence that
positive selection drove the nearly complete fixation of a null allele of human
CASPASE12 a gene implicated in susceptibility to severe sepsis We estimate that the
selective advantage of the null allele is ~09 and the pseudogenization started shortly
before the out-of-Africa migration of modern humans This adaptive gene loss might
have occurred because of changes in our environment or genetic background that altered
the threat from or response to sepsis Our finding opens the door for understanding the
roles of gene losses in human origins and the demonstration that gene loss itself can be
adaptive supports and extends the ldquoless-is-morerdquo hypothesis
42 INTRODUCTION
Although humans are highly similar to chimpanzees at the genomic sequence and
protein sequence levels (Chen and Li 2001 Britten 2002 Ebersberger et al 2002
Wildman et al 2003 Watanabe et al 2004 The Chimpanzee Sequencing and Analysis
Consortium 2005) the two species differ dramatically in many aspects of their biology
89
such as bipedalism brain size languagespeech capability and susceptibility to the
humansimian immunodeficiency virus (HIVSIV) With rapid progress in human
genetics comparative genomics and molecular evolution the genetic basis of these
differences has begun to be unraveled For example the conserved transcriptional factor
FOXP2 is required for speech development in humans (Lai et al 2001) and it
experienced two adaptive amino acid replacements in hominin evolution suggesting that
these two substitutions were at least partially responsible for the emergence of human
speech and language (Enard et al 2002 Zhang et al 2002) Compared to such amino acid
replacements gene gains and losses are more dramatic genetic changes (Olson 1999
Olson and Varki 2003 Zhang 2003 Fortna et al 2004 Li and Saunders 2005) In
particular gene loss or pseudogenization leads to immediate loss of gene function
which probably affects organisms to a greater extent than most amino acid replacements
do A number of genes are known to have been lost in the human lineage since its
divergence from the chimpanzee lineage (Chou et al 1998 Szabo et al 1999 Winter et
al 2001 Gilad et al 2003 Hamann et al 2003 Meyer-Olson et al 2003 Stedman et al
2004 Wang et al 2004 Fischer et al 2005 Go et al 2005 Perry et al 2005) Recently
Olson (Olson 1999) and Olson and Varki (Olson and Varki 2003) proposed the ldquoless-is-
morerdquo hypothesis suggesting that gene loss may serve as an engine of evolutionary
change This hypothesis is particularly intriguing for human evolution as several human
gene losses have been proposed to provide opportunities for adaptations and be
responsible for human-specific phenotypes For example the pseudogenization of the
sarcomeric myosin gene MYH16 at the time of the emergence of the genus Homo is
thought to be responsible for the marked size reduction in hominin masticatory muscles
90
which may have allowed the brain-size expansion (Stedman et al 2004) (but see (Perry et
al 2005) In another example the human-specific inactivation of the gene encoding the
enzyme CMP-N-acetylneuraminic acid hydroxylase (CMAH) led to the deficiency of the
mammalian common sialic acid Neu5Gc (N-glycolylneuraminic acid) on the human cell
surface (Chou et al 1998) This inactivation was due to an Alu-mediated sequence
replacement (Hayakawa et al 2001) that occurred ~27 million years ago (Chou et al
2002) and may have had several important consequences to human biology and evolution
(Varki 2001)
There has been no demonstration of positive selection driving the loss of a human
gene although the loss may have subsequently allowed future adaptations Such passive
pseudogenization incidences are not themselves adaptations To explore the possibility of
adaptive pseudogenization we focus on CASPASE12 evolution in human population
CASPASE12 belongs to the caspase family which are cysteinyl aspartate proteinases
that play important roles in the processing of inflammatory cytokines and the initiation
and execution of apoptosis (Alnemri et al 1996 Lamkanfi et al 2002) In humans 11
functional caspase genes are known CASPASE1-10 and CASPASE14 Human
CASPASE12 (CASP12) was identified as a pseudogene following the cloning of mouse
Caspase12 (Fischer et al 2002) Compared with other mammalian orthologs human
CASP12 contains a premature stop codon due to a C to T nonsense mutation at nucleotide
position 629 of exon 4 (Fischer et al 2002 Saleh et al 2004) This mutation leads to the
production of truncated nonfunctional CASP12 in humans (Saleh et al 2004) The null T
allele is fixed in a sample of 347 non-Africans and has a frequency of 89 in 776
individuals of African descent (Saleh et al 2004) Interestingly the T allele is associated
91
with a reduced incidence and mortality of severe sepsis (Saleh et al 2004) suggesting
that the loss of functional CASP12 is beneficial to present-day humans In this work we
provide evidence that the nearly complete fixation of a null allele at CASPASE12 (Fischer
et al 2002 Saleh et al 2004 The Chimpanzee Sequencing and Analysis Consortium
2005) has been driven by positive selection probably because the allele confers lowered
susceptibility to severe sepsis
43 RESULTS
431 Adaptive loss of CASP12 in human evolution
To test whether the nearly complete fixation of the null allele at CASP12 has been
driven by positive selection we looked for signals of recent (incomplete) selective
sweeps by examining the intraspecific variation of putatively neutral regions surrounding
the CT polymorphism The positive selection hypothesis predicts that the level of
polymorphism in these regions is lower in the null T allele than in the C allele especially
in the proximity of the CT polymorphism due to the hitchhiking effect (Maynard Smith
and Haigh 1974) Furthermore the frequency distribution of the neutral polymorphisms
in the T allele should deviate from the neutral expectation generating negative values of
Tajimarsquos D (Tajima 1989) and Fay and Wursquos H (Fay and Wu 2000)
From a sample of 63 humans of African descent we identified 4 CC homozygotes
and 43 TT homozygotes We sequenced the 4 CC homozygotes and 4 randomly chosen
TT homozygotes in 9 noncoding regions of varying distances from the CT
polymorphism (Figure 41) The sequenced regions vary in size from ~600 to 2400
nucleotides In total 53 and 29 single nucleotide polymorphisms (SNPs) were identified
92
from 8925 nucleotide sites in CC and TT individuals respectively (Figure 42 Table
41) Although the T allele is much more prevalent than the C allele in the population the
T allele has a significantly lower number of SNPs per nucleotide than the C allele in the
linked regions (Plt001 Fisherrsquos exact test) Nucleotide diversity per site (π) is also lower
in the T alleles (πT=000131plusmn000019) than in the C alleles (πC=000218plusmn000031)
(P=002 two-tail Z test) More strikingly although the variation of πC across the 9
regions is more or less random that of πT exhibits a V shape with the bottom of the
valley located in region 4 which has its 3rsquo end only 607 nucleotides from the CT
polymorphism (Figure 41) When one moves ~10000 nucleotides from this
polymorphism πT rises to a level comparable to πC To exclude the possibility that the
low πT observed around the CT polymorphism was due to the use of a small sample we
sequenced 7 additional TT individuals of African descent in regions 4 5 and 6 The πT
values obtained from the combined data of 11 individuals were either lower than or
similar to those from the 4 individuals (Table 41) suggesting that the observation of low
πT is not due to a small sample In region 4 where the greatest reduction in
polymorphism is observed only 1 SNP is found across the 2413 nucleotide positions
among the 22 T alleles sequenced By contrast 19 SNPs were found in the same region
among 8 C alleles examined Region 4 was also sequenced in 6 non-Africans (all non-
Africans are TT homozygotes (Saleh et al 2004)) but no SNP was detected and all non-
African T alleles are identical to the predominant T allele from Africans This indicates a
common origin of African and non-African T alleles
In a formal test of the selective sweep hypothesis we used coalescent simulations
to examine whether the polymorphisms observed in region 4 can be explained by neutral
93
models of evolution Such tests require a sample that is representative of the population
under investigation We thus sequenced 20 additional African TT homozygotes so that
our sample comprises 6270=89 of T alleles and 870=11 C alleles expected in
populations of African descent (Saleh et al 2004) In the 70 chromosomes sequenced the
two most common haplotypes observed (with a total frequency of 6170) are both from T
alleles and these two haplotypes have only one nucleotide difference Let k1 be the
number of chromosomes with the most common haplotype in a sample and k2 be the
number of chromosomes with the most frequent haplotype among those that are one
nucleotide different from the most common haplotype in the sample We first simulated
the evolution of a population with a constant size In 0066 of the 50000 replications
we observed k1+k2ge61 We also simulated various demographic changes to mimic the
evolution of human populations and k1+k2ge61 was observed in fewer than 1 of
simulation replications in all models considered (Table 42) These demographic models
included ancient or recent population expansions severe bottleneck repeated bottlenecks
with subsequent expansion and population subdivision and admixture (Evans et al 2005)
(see Materials and Methods) Previous studies suggested that the models used here are
much more stringent than that associated with the real demographic history of humans
(Zietkiewicz et al 1998 Harpending and Rogers 2000) Hence our tests are
conservative
We also computed statistics D and H for regions 4 and 5 in the T allele as these
two regions have significantly lower πT than πC (Table 41) Both statistics were
significantly negative in region 5 (D=-208 Plt001 H=-471 Plt0025) consistent with
the expectations from a selective sweep D (-023 P=047) and H (-090 P=009) were
94
not significantly negative in region 4 probably because the number of SNPs is too small
for the statistic tests to be powerful It should be noted that the above tests are less
rigorous than the coalescent simulations because the tests are conducted on subsets of the
genealogy (Evans et al 2005) Linkage disequilibrium (LD) can also be used to test
recent selective sweeps if long-range haplotypes can be reliably inferred (Sabeti et al
2002) In the present case however long-range haplotypes are difficult to infer with
certainty due to the small number of CC homozygotes available But the genotypes
shown in Figure 42 provide a visual indication of longer LD in T alleles than in C alleles
and a decay of LD when one moves away from the CT polymorphism consistent with
the recent origin of T alleles Taken together our observations especially the proximity
of the πT valley to the CT polymorphism and the coalescent simulations strongly
suggest that the spread of the T allele among Africans and non-Africans has been driven
by positive selection and that the selective advantage was directly conferred by the CrarrT
nonsense mutation
432 Dating the pseudogenization event and selective sweep in CASP12
When did the pseudogenization of human CASP12 start We took two approaches
to estimate the age of the T allele In the first method we used the information of
noncoding region 4 which is longest among the 9 sequenced regions and is also closest
to the CT polymorphism The founding haplotype of T alleles is inferred and the
proportion (P) of present-day T alleles identical to the founding haplotype is estimated It
can be shown that P=(1-r)G where G is the age of the T allele in generation and r is the
total rate of mutation and recombination per sequence per generation (Stephens et al
95
1998) In the present case it is easy to infer the founding haplotype (for region 4) because
of the low polymorphism and the availability of an outgroup (chimpanzee) sequence P is
estimated to be 0811 based on the observation of 60 copies of the founding haplotype in
a total of 74 T alleles sequenced (including both Africans and non-Africans) The
mutation rate is estimated to be 23(12times106)times25 = 4792times10-5 per sequence per
generation Here 23 is the average number of nucleotide differences between human and
chimpanzee in region 4 12times106 is twice the divergence time in year between the two
species (Brunet et al 2002) and 25 is the average human generation time in years The
recombination rate is estimated to be 07times10-8times3720=2269times10-5 per sequence per
generation where 07times10-8 is the pedigree-based recombination rate per generation per
nucleotide at the CASP12 locus (Kong et al 2002) and 3720 is the number of nucleotides
between the 5rsquo end of region 4 and the CT polymorphism We thus estimated that
G=2970 generations (Figure 43A) which corresponds to 74250 years The 95
confidence interval for P is between 0647 to 1 If we consider the sampling error of P
the 95 confidence interval for the estimated time is from 0 to 154 thousand years The
standard error of the estimated mutation rate is 1 23 =21 of the estimate while the
error of the recombination rate is difficult to evaluate
In the second method we used a deterministic selection model (Hartl and Clark
1997) to estimate the number of generations required for the T allele to rise to its present-
day frequency among individuals of African descent It has been estimated that the
incidence of severe sepsis is I=059 and the mortality rate is M=265 among African
Americans (Alexander et al 2004) The genotype frequencies among individuals of
African descent are fCC =1675 fCT =186 and fTT =7977 respectively (Saleh et al
96
2004) Here we used the genotype frequency data from ref (Saleh et al 2004) because
their sample is considerably larger than ours The proportions of the three genotypes
among severe sepsis patients have been estimated to be P(CC | sepsis)=105 P(CT |
sepsis)=290 and P(TT | sepsis)=605 (Saleh et al 2004) Using Bayes theorem we
calculated the survival rate (S) for a given genotype X by SX=1-MP(sepsis | X) =1-IMP(X
| sepsis)fX and obtained SCC=09902 SCT=09976 and STT=09988 Here we assumed
that the pre-reproductive-age incidence of sepsis in much of the human history is
comparable to the total incidence of sepsis estimated today (Alexander et al 2004) The
relative fitness of CC to the fitness of TT is therefore WCC =SCCSTT=0991 Similarly
WCT =SCTSTT=0999 and WTT =1 The selective disadvantage of CC compared with
TT is s =1- WCC =0009 and the degree of dominance of the C allele relative to the T
allele is h=(1-WCT)(1-WCC)=011 The number of generations required for a given
change in allele frequency was calculated using the differential equation dpdt=p(1-
p)s[ph+(1-p)(1-h)] with the current T frequency p =0891 (Saleh et al 2004) and the
initial T frequency p0 =1(2N) where N is the effective population size of humans (Hartl
and Clark 1997) The calculated number of generations is t =2111 (Figure 43B) under
the assumption of an effective population size of 104 individuals (Takahata et al 1995
Harpending et al 1998) In this computation we ignored the effect of random genetic
drift because 2Ns =180gtgt1 and the behavior of the alleles is dominated by selection
(Kimura 1983) Because of the sampling error the 95 confidence interval of p is
[0875 0907] which gave the 95 confidence interval of the time required for the T
allele to reach todayrsquos frequency to be 51 to 55 thousand years Note that the actual error
of the time estimate may be considerably larger because the estimation errors of h and s
97
are difficult to assess Here we assumed that positive selection acted as soon as the null
allele appeared It is possible that the null allele was initially neutral but later became
beneficial due to a change in the genetic or environmental background If this is the case
the appearance of the T allele would be earlier than dated by this method
Strictly speaking the first approach we used was to date the appearance of the T
allele whereas the second approach was to date the onset of the selective sweep These
two events were not necessarily simultaneous although the appearance of the T allele
was a prerequisite for the selective sweep Despite the potentially large errors the two
estimates were close suggesting that the T allele might have been beneficial since its
appearance Because the T alleles of Africans and non-Africans share the same origin the
CrarrT nonsense mutation must predate the out-of-Africa migration of modern humans
which is believed to have occurred 40-60 thousand years ago (Cavalli-Sforza and
Feldman 2003) Our dating suggests that the pseudogenization of CASP12 began not long
before this migration As a comparison it is interesting to compute the mean time
required for a neutral allele to rise to the current frequency of p=0891 This can be
estimated by -4Np(lnp)(1-p) =37736 generations or 943000 years (Kimura and Ohta
1973) In the above N is the effective population size of humans and is assumed to be
104 Thus it would have taken a considerably longer time for the null allele to reach
todayrsquos frequency if it were neutral
44 DISCUSSION
Our population genetic study provided strong evidence that the nearly complete
fixation of a null allele at human CASP12 has been driven by positive selection possibly
98
because it confers resistance to severe sepsis CASP12 is a functional gene in all
mammals surveyed except humans (Saleh et al 2004) suggesting that it is indispensable
in a typical mammal The functional human CASP12 acts as a dominant-negative
regulator of essential cellular responses including the NF-κB and IL-1 pathways it
attenuates the inflammatory and innate immune response to endotoxins (Saleh et al
2004) Because an appropriate level of immune response that is neither excessive nor
insufficient is important to an organism one can imagine that the immune suppression
function of CASP12 becomes harmful when the immune system cannot fully respond to a
challenge It is likely that during human evolution alterations in our genetic andor
environmental background resulted in a malfunction of the immune response to
endotoxins which rendered the previously necessary function of CASP12 deleterious in
humans and the null allele advantageous over the functional one Identification of such
genetic andor environmental alterations will be valuable for understating human-specific
immune functions It is interesting to note that mouse Casp12 is implicated in amyloid-
induced neuronal apoptosis whereas the functional form of human CASP12 does not
have this function The reasons and consequences of this difference particularly in
relation to the human-specific pathology of Alzheimerrsquos disease are intriguing (The
Chimpanzee Sequencing and Analysis Consortium 2005)
The ldquoless-is-morerdquo hypothesis emphasized that gene loss can sometimes play an
active role in evolution (Olson 1999) with the premise that gene loss may provide
opportunities for future adaptations Our finding that gene loss itself can be adaptive
supports and extends the ldquoless-is-morerdquo hypothesis In the context of pathogenic threats
it is interesting to mention two examples where human null alleles are selected for in
99
certain geographic areas (Stephens et al 1998 Hamblin et al 2002) In the first example
a null allele generated by a 32-nucleotide deletion in the CCR5 chemokine receptor gene
was subject to positive selection in Caucasians in the recent human history (Stephens et
al 1998) (but see (Sabeti et al 2005) CCR5 is used by pathogens such as HIV as a
coreceptor to enter host cells the null allele protects humans from attacks of these
pathogens The exact pathogens that were responsible for the spread of the CCR5 null
allele however are still under debate (Galvani and Novembre 2005) In the second
example a null allele at the Duffy blood group locus was shown to be beneficial in some
Africans probably because it confers resistance to malaria (Hamblin et al 2002)
Nevertheless in both of these examples the null alleles appear to be less fit than the
functional alleles when the pathogens are rare or absent Thus the positive selection for
the null alleles is limited to small geographic areas and it is unlikely that they will lead to
the eventual loss of the two human genes By contrast CASP12 has been lost in non-
Africans and is nearly lost in Africans
How often does adaptive gene loss occur in general While this problem has not
been investigated systematically two non-human cases have been reported recently The
first occurred in a gene responsible for pheromone synthesis in insects and the
pseudogenization led to the origin of a partially reproductively isolated race of
Drosophila melanogaster (Takahashi et al 2001 Greenberg et al 2003) The second case
involves a gene whose functional product prevents selfing in plants and the
pseudogenization event allowed the evolution of self-pollination in Arabidopsis thaliana
(Shimizu et al 2004) Given the high frequency of pseudogenization in eukaryotic
genomes one may speculate that adaptive gene loss is not uncommon Interestingly two
100
of the three adaptive pseudogenizations so far documented happened to genes that are
involved in chemoreception or immunity consistent with the previous finding that genes
of these functions tend to evolve rapidly with high rates of turnover (Hughes 1999 Grus
et al 2005) Although detection of adaptive gene loss is restricted due to a rapid decay of
population genetic signals of selective sweeps (Przeworski 2003) it is possible that
adaptive gene loss is more frequent than previously thought especially from the above
two functional categories This said the study of the roles that gene losses play in
evolution has just begun more empirical evidence is needed to demonstrate the
importance of the ldquoless-is-morerdquo hypothesis during evolution in general and human
evolution in particular
45 MATERIALS AND METHODS
451 DNA amplification and sequencing of CASP12 alleles
All human genomic DNA samples were purchased from Coriell Cell Repositories
The genotypes of 63 individuals of African descent at the CT polymorphism (position
629 of exon 4) were determined by sequencing a portion of exon 4 These individuals
included 48 African Americans 6 African pygmies and 9 Africans (south of the Sahara)
Four CC homozygotes (3 African Americans and 1 African pygmy) 43 TT
homozygotes and 16 CT heterozygotes were identified The T allele has a frequency of
81plusmn0035 in our sample slightly lower than that (89) reported in a previous study
which was based on a much larger sample (Saleh et al 2004) All 4 CC individuals and 4
randomly picked TT individuals (3 African Americans and 1 African pygmy) were
sequenced in 9 noncoding regions as shown in Figure 41 To ensure that the low
101
polymorphism found among TT individuals in regions 4 5 and 6 was not due to the
small sample size we sequenced 7 additional TT individuals (all African Americans) in
the three regions The genotypes of 6 non-Africans (2 Caucasians 1 Chinese 2 Pacific
Islanders and 1 Andes) at the CT polymorphism were also determined by the same
approach and all were found to be TT homozygotes (Note that the fixation of the T
allele in non-Africans was previously demonstrated in a sample of 347 individuals (Saleh
et al 2004)) Region 4 was sequenced in these 6 non-Africans and no SNPs were found
For conducting coalescent simulations by the ms program (Hudson 2002) we sequenced
20 additional TT individuals of the African descent for region 4 so that our sample of
Africans comprised 4 CC and 31 TT individuals with the frequency of T alleles being
89 which is expected for Africans (Saleh et al 2004) Our sample can be treated as a
random sample under the reasonable assumption of random mating with respect to the
CT polymorphism
The experimental procedure was as follows Fragment-specific primers were
designed according to the human genome sequence Polymerase chain reactions (PCRs)
were performed with MasterTaq (Eppendorf) under conditions recommended by the
manufacturer PCR products were separated on 15 agarose gel and purified using the
Gel Extraction Kit (Qiagen) Amplified DNA fragments were sequenced from both
directions in an automated DNA sequencer using the dideoxy chain termination method
Sequencher (GeneCodes) was used to assemble the sequences and to identify DNA
polymorphisms All singletons were confirmed by an independent PCR and sequencing
experiment After removing the primer regions each sequenced fragment is 500-800
nucleotides long All the SNPs identified in this study are listed in Table 43
102
452 Population genetic analysis
Nucleotide diversity per site π (Tajima 1989) Tajimarsquos D (Tajima 1989) and Fay
and Wursquos H (Fay and Wu 2000) were computed by DnaSP (Rozas and Rozas 1999)
Gaps in the sequence alignments were excluded from the analysis The chimpanzee
genome sequence available in GenBank was used as an outgroup in computing H
Tajimarsquos test (Tajima 1989) and Fay and Wursquos test (Fay and Wu 2000) were conducted
by DnaSP using coalescent simulations with 50000 replications under the assumption of
no recombination which gave more conservative results than when recombination is
considered To test the hypothesis of selective sweeps more rigorously we modeled
various demographic scenarios of human populations by coalescent simulations (50000
replications per model) The parameters used in the coalescent simulations are described
in Supplementary Methods Two methods were used to estimate the age of the T allele as
described in detail in ResultsDiscussion
453 Demographic history simulation
Our sample for region 4 included 4 CC and 31 TT individuals of African descent
Thus the sample frequency of the T allele is 89 same as the expected value for humans
of African descent (Saleh et al 2004) In the 70 chromosomes sequenced 19 SNPs were
found The two most common haplotypes observed (with a total frequency of 6170) are
from T alleles and these two haplotypes have only one nucleotide difference Let k1 be the
number of copies of the most common haplotype in a sample and k2 be the number of
copies of the most frequent haplotype among those that are one nucleotide different from
103
the most common haplotype in the sample In coalescent simulations we calculated the
proportion of cases (out of 50000 replications) in which k1+k2ge61 We used the ms
program (Hudson 2002) to generate independent samples under a variety of neutral
models with different demographic histories The number of alleles and the number of
segregating sites were set to be 70 and 19 respectively The pedigree-based
recombination rate of R=07times10-8 per generation per nucleotide at the CASP12 locus
(Kong et al 2002) was used We examined 9 demographic models following Evans and
colleagues (Evans et al 2005) We assumed an effective population size of N=104
(Takahata et al 1995 Harpending et al 1998) as the genetic variants of non-Africans are
usually subsets of those of Africans In the following command lines 2413 is the length
of region 4 in nucleotide and 0675 is the population recombination rate for region 4
when N=104 is used (ρ=4NR=4times104times07times10-8times2413=0675)
The 9 models tested and the command lines used in the ms program are
1) Constant population with an effective size of 104
ms 70 50000 -s 19 -r 0675 2413
2) An ancient population expansion from 104 at 5000 generations ago exponentially to
107 today
ms 70 50000 -s 19 -r 675 2413 -G 5526204223 -eG 0000125 0
3) A recent population expansion from 104 at 1000 generations ago exponentially to 107
today
ms 70 50000 -s 19 -r 675 2413 -G 2763102112 -eG 0000025
4) A severe bottle neck starting 5000 generations ago that reduced the population from
104 instantly to 103
and lasted until 2500 generations ago at which point the population
104
started to expand exponentially to 107 today
ms 70 50000 -s 19 -r 675 2413 -G 147365446 -eG 00000625 0 -eN 0000125 0001
5) Repeated bottlenecks for five successive rounds starting 7000 generations ago each
from 104 instantly to 103
for 500 generations followed by exponential recovery back to
104 over another 500 generations except at the end of the fifth bottleneck 2500
generations ago which was followed by exponential growth to 107 today
ms 70 50000 -s 19 -r 675 2413 -G 147365446 -eG 00000625 0 -eN 0000075 0001 -eG 0000075
1842068074 -eG 00000875 0 -eN 00001 0001 -eG 00001 1842068074 -eG 00001125 0 -eN 0000125 0001 -eG
0000125 1842068074 -eG 00001375 0 -eN 000015 0001 -eG 000015 1842068074 -eG 00001625 0 -eN 0000175
0001
6) Population structure where the initial 70 chromosomes were split equally into 2
different subpopulations under constant population size with 1 migration per generation
ms 70 50000 -s 19 -r 0675 2413 -es 00 1 05 -eM 00 10
7) Population structure where the initial 70 chromosomes were split equally into 3
different subpopulations with 1 migration per generation
ms 70 50000 -s 19 -r 0675 2413 -es 00 1 03333 -es 00 1 05 -eM 00 10
8) Population structure where the initial 70 chromosomes were split equally into 4
different subpopulations with 1 migration per generation
ms 70 50000 -s 19 -r 0675 2413 -es 00 1 025 -es 00 1 0333 -es 00 1 05 -eM 00 10
9) Population structure where the initial 70 chromosomes were split equally into 5
different subpopulations with 1 migration per generation
ms 70 50000 -s 19 -r 0675 2413 -es 00 1 02 -es 00 1 025 -es 00 1 0333 -es 00 1 05 -eM 00 10
46 ACKNOWLEDGMENTS
We thank Soochin Cho Ondrej Podlaha Peng Shi and three referees for valuable
comments on an earlier version of the manuscript This work was supported by research
105
106
grants from University of Michigan and National Institutes of Health (R01GM067030) to
JZ
Figure 41 Intraspecific DNA sequence variation in noncoding regions linked with the human CASPASE12 gene CASPASE12 is shown in blue with the exons depicted by solid blue bars on the chromosome The premature stop codon generated by the CrarrT nonsense mutation is shown by an asterisk in exon 4 The 9 noncoding regions sequenced are indicated below the chromosome Exons introns the 9 noncoding regions and spaces between regions are drawn to scale as indicated Red circles (connected by the red dotted line) show nucleotide diversity per site among African T alleles (πT) and the red boxes shows πT plusmn one standard error of πT Green squares (connected by the green dotted line) show nucleotide diversity per site among African C alleles (πC) and the green boxes shows πC plusmn one standard error of πC The broken green line shows the mean πC across the 9 noncoding regions sequenced Black triangles (connected by the black solid line) show the ratio between πT and πC for each region πC is estimated from 8 alleles πT is estimated from 22 alleles for regions 4 5 and 6 and from 8 alleles for the other regions When only 8 alleles are used πT is 000018plusmn000007 000129plusmn000071 and 000145plusmn000057 for regions 4 5 and 6 respectively πT is significantly lower than πC in regions 4 and 5 (Table 41)
107
Figure 42 Genotypes of the 4 CC homozygotes and 4 TT homozygotes that were sequenced in all 9 noncoding regions Each row represents one human individual and each column represents one SNP site The top 4 individuals are homozygous for the functional CASP12 allele and the bottom 4 individuals are homozygous for the null allele Blue yellow and green squares indicate homozygotes for the ancestral allele homozygotes for the derived allele and heterozygotes respectively at each SNP site The nucleotide position of each SNP site is given at the bottom of the figure with the ancestralderived nucleotides indicated The nucleotide positions are relative to the start codon ATG On the top of the figure is the chromosome with the exons of CASP12 depicted by solid blue bars on the chromosome The premature stop codon generated by the CrarrT nonsense mutation is shown by an asterisk in exon 4 The 9 noncoding regions sequenced are indicated below the chromosome
1 CC2 CC3 CC4 CC
5 TT6 TT7 TT8 TT
CT
AG
CT
GA
CT
GA
CT
TCC
TA
GA
GTCTGC
AG
AA
GA
CC
TTCA
GG
AG
AC
TTATCA
TTAG
TTCC
TC
T
CT
TGC
GA
TC
AG
ATCA
TG
AG
AC
TG
TTCC
TTCA
TC
TG
ATCG
ATCC
TC
TTGA
CA
GC
GA
G
-9705-9612-9598-9548-9499-9150-5519-5194-5042-49932336572516262130003081314231483869395739804018404541114181423947064759485550835175
6025
83358453866794409586985499511016810239102501182311867119681464214771149591811218374184391871620030200932011820133202442029820516
108
Figure 43 Estimating the age of the null allele and the onset of the selective sweep (A) Decline of the frequency (P) of the founding haplotype of the null allele over generations (G) We used the formula P=(1-r)G with the sum of the mutation and recombination rate r being 7061times10-5 per generation The dashed line shows the estimated P at present and its corresponding G (B) The increase of the frequency (p) of the null allele over generations (t) by positive selection based on the differential equation dpdt=p(1-p)s[ph+(1-p)(1-h)] Here we used p0=000005 h=011 s=0009 The dashed line shows the estimated p at present and its corresponding t
A
B
109
Table 41 Intraspecific variations in 9 noncoding regions linked to human CASPASE12
Region1 Length (nucleotide) Allele2 of SNPs π Standard error of π Probability3
1 674 C (8) 5 000307 000067T (8) 5 000413 000050 0205
2 675 C (8) 3 000206 000049T (8) 3 000206 000035 1000
3 773 C (8) 2 000102 000033T (8) 1 000069 000016 0368
4 2413 C (8) 19 000280 000053T (8) 1 000018 000007 lt0001T (22) 1 000015 000004 lt0001
5 1553 C (8) 9 000233 000051T (8) 8 000129 000071 0234T (22) 10 000069 000033 0007
6 592 C (8) 3 000175 000071T (8) 2 000145 000057 0741T (22) 4 000155 000041 0807
7 730 C (8) 3 000127 000046T (8) 3 000176 000069 0555
8 738 C (8) 2 000106 000034T (8) 3 000126 000038 0695
9 777 C (8) 7 000267 000071T (8) 3 000179 000046 0298
1 The chromosomal locations of the 9 regions are shown in Figure 312 C is the (ancestral) functional allele and T is the (derived) null allele The number of chromosomessequenced is given in parentheses Eight T chromosomes were initially sequenced for all the regions Subsequently we sequenced another 14 T chromosomes for regions 4 5 and 63 The probability that the nucleotide diversity is identical between T and C alleles for the regionconcerned (two-tail Z test)
41
110
Table 42 Results from coalescent simulations
Demographic models1 Probability ()2
Constant population size 0066Ancient population expansion 0006Recent population expansion 0068Several bottlenecks 0232Repeated bottlenecks with subsequent expansion 0126Population structure with 2 subpopulations 0066Population structure with 3 subpopulations 0116Population structure with 4 subpopulations 0358Population structure with 5 subpopulations 08241 The parameters used are detailed in Materials and Methods2 Proportion of cases with k 1+k 2 ge 61 in 50000 simulation replications
See main text for details
111
Table 43 SNPs identified in the noncoding regions linked with CASP12
Nucleotide positions1 SNPs2 Allele frequency ()3 Sample size4
-9705 CT 375 8-9612 AG 125 8-9598 CT 625 8-9548 GA 437 8-9499 CT 375 8-9150 GA 63 8-5519 CT 63 8-5194 TC 375 8-5042 CT 625 8-4993 AG 188 8233 AG 250 8657 TC 313 8
2516 TG 14 352621 CA 14 352674 AG 14 353000 GA 914 353081 AG 957 353142 AC 914 353148 CT 914 353869 TC 14 353957 AG 86 353980 GA 86 354018 GA 914 354045 CT 14 354111 TA 700 354181 TC 14 354239 AT 71 354706 TA 914 354759 GT 14 354855 TC 14 355083 CT 14 355175 CT 86 358335 TG 767 158453 CG 767 158642 GA 67 158667 AT 33 158893 CT 67 159440 CA 133 159586 GA 233 159854 TC 233 159951 AT 767 1510168 GA 233 1510239 GA 33 1510250 CT 33 1511823 GT 33 1511867 TC 733 1511968 CT 200 1514642 TC 188 814771 AT 750 814959 CT 188 818112 GA 63 818374 TC 63 818439 GA 250 818716 TC 186 820030 CT 63 820093 CT 63 820118 TG 125 820133 AC 688 820244 AG 63 820298 CG 375 820516 AG 375 8
1 The nucleotide positions are relative to the start codon ATG of the CASP12 gene2 The ancestralderived nucleotides are given for each SNP3 Frequency of the derived allele estimated from individuals of African descent4 Number of sequenced human individuals with African descent
112
47 LITERATURE CITED
Alexander S Lilly E Angus D Barnato A Linde-Zwirbe W (2004) Racial variation in the incidence ICU utilization and mortality of severe sepsis Critical Care Medicine 32
Alnemri ES Livingston DJ Nicholson DW Salvesen G Thornberry NA Wong WW Yuan J (1996) Human ICECED-3 protease nomenclature Cell 87171
Britten RJ (2002) Divergence between samples of chimpanzee and human DNA sequences is 5 counting indels Proc Natl Acad Sci U S A 9913633-13635
Brunet M Guy F Pilbeam D Mackaye HT Likius A Ahounta D Beauvilain A et al (2002) A new hominid from the Upper Miocene of Chad Central Africa Nature 418145-151
Cavalli-Sforza LL Feldman MW (2003) The application of molecular genetic approaches to the study of human evolution Nat Genet 33 Suppl266-275
Chen FC Li WH (2001) Genomic divergences between humans and other hominoids and the effective population size of the common ancestor of humans and chimpanzees Am J Hum Genet 68444-456
Chou HH Hayakawa T Diaz S Krings M Indriati E Leakey M Paabo S Satta Y Takahata N Varki A (2002) Inactivation of CMP-N-acetylneuraminic acid hydroxylase occurred prior to brain expansion during human evolution Proc Natl Acad Sci U S A 9911736-11741
Chou HH Takematsu H Diaz S Iber J Nickerson E Wright KL Muchmore EA Nelson DL Warren ST Varki A (1998) A mutation in human CMP-sialic acid hydroxylase occurred after the Homo-Pan divergence Proc Natl Acad Sci U S A 9511751-11756
Ebersberger I Metzler D Schwarz C Paabo S (2002) Genomewide comparison of DNA sequences between humans and chimpanzees Am J Hum Genet 701490-1497
Enard W Przeworski M Fisher SE Lai CS Wiebe V Kitano T Monaco AP Paabo S (2002) Molecular evolution of FOXP2 a gene involved in speech and language Nature 418869-872
Evans PD Gilbert SL Mekel-Bobrov N Vallender EJ Anderson JR Vaez-Azizi LM Tishkoff SA Hudson RR Lahn BT (2005) Microcephalin a gene regulating brain size continues to evolve adaptively in humans Science 3091717-1720
Fay JC Wu CI (2000) Hitchhiking under positive Darwinian selection Genetics 1551405-1413
Fischer A Gilad Y Man O Paabo S (2005) Evolution of bitter taste receptors in humans and apes Mol Biol Evol 22432-436
Fischer H Koenig U Eckhart L Tschachler E (2002) Human caspase 12 has acquired deleterious mutations Biochem Biophys Res Commun 293722-726
Fortna A Kim Y MacLaren E Marshall K Hahn G Meltesen L Brenton M Hink R Burgers S Hernandez-Boussard T Karimpour-Fard A Glueck D McGavran L Berry R Pollack J Sikela JM (2004) Lineage-specific gene duplication and loss in human and great ape evolution PLoS Biol 2E207
Galvani AP Novembre J (2005) The evolutionary history of the CCR5-Delta32 HIV-resistance mutation Microbes Infect 7302-309
113
Gilad Y Man O Paabo S Lancet D (2003) Human specific loss of olfactory receptor genes Proc Natl Acad Sci U S A 1003324-3327
Go Y Satta Y Takenaka O Takahata N (2005) Lineage-specific loss of function of bitter taste receptor genes in humans and nonhuman primates Genetics 170313-326
Greenberg AJ Moran JR Coyne JA Wu CI (2003) Ecological adaptation during incipient speciation revealed by precise gene replacement Science 3021754-1757
Grus WE Shi P Zhang YP Zhang J (2005) Dramatic variation of the vomeronasal pheromone receptor gene repertoire among five orders of placental and marsupial mammals Proc Natl Acad Sci U S A 1025767-5772
Hamann J Kwakkenbos MJ de Jong EC Heus H Olsen AS van Lier RA (2003) Inactivation of the EGF-TM7 receptor EMR4 after the Pan-Homo divergence Eur J Immunol 331365-1371
Hamblin MT Thompson EE Di Rienzo A (2002) Complex signatures of natural selection at the Duffy blood group locus Am J Hum Genet 70369-383
Harpending H Rogers A (2000) Genetic perspectives on human origins and differentiation Annu Rev Genomics Hum Genet 1361-385
Harpending HC Batzer MA Gurven M Jorde LB Rogers AR Sherry ST (1998) Genetic traces of ancient demography Proc Natl Acad Sci U S A 951961-1967
Hartl D Clark A (1997) Principles of Populations Genetics Sinauer Sunderland Massachusetts
Hayakawa T Satta Y Gagneux P Varki A Takahata N (2001) Alu-mediated inactivation of the human CMP- N-acetylneuraminic acid hydroxylase gene Proc Natl Acad Sci U S A 9811399-11404
Hudson RR (2002) Generating samples under a Wright-Fisher neutral model of genetic variation Bioinformatics 18337-338
Hughes A (1999) Adaptive Evolution of Genes and Genomes Oxford University Press New York
Kimura M (1983) The Neutral Theory of Molecular Evolution Cambridge University Press Cambridge
Kimura M Ohta T (1973) Age of a Neutral Mutant Persisting in a Finite Population Genetics 75199-212
Kong A Gudbjartsson DF Sainz J Jonsdottir GM Gudjonsson SA Richardsson B Sigurdardottir S Barnard J Hallbeck B Masson G Shlien A Palsson ST Frigge ML Thorgeirsson TE Gulcher JR Stefansson K (2002) A high-resolution recombination map of the human genome Nat Genet 31241-247
Lai CS Fisher SE Hurst JA Vargha-Khadem F Monaco AP (2001) A forkhead-domain gene is mutated in a severe speech and language disorder Nature 413519-523
Lamkanfi M Declercq W Kalai M Saelens X Vandenabeele P (2002) Alice in caspase land A phylogenetic analysis of caspases from worm to man Cell Death Differ 9358-361
Li WH Saunders MA (2005) The chimpanzee and us Nature 43750-51 Maynard Smith J Haigh J (1974) The hitch-hiking effect of a favourable gene Genet Res
2323-35 Meyer-Olson D Brady KW Blackard JT Allen TM Islam S Shoukry NH Hartman K
Walker CM Kalams SA (2003) Analysis of the TCR beta variable gene repertoire
114
in chimpanzees identification of functional homologs to human pseudogenes J Immunol 1704161-4169
Olson MV (1999) When less is more gene loss as an engine of evolutionary change Am J Hum Genet 6418-23
Olson MV Varki A (2003) Sequencing the chimpanzee genome insights into human evolution and disease Nat Rev Genet 420-28
Perry GH Verrelli BC Stone AC (2005) Comparative analyses reveal a complex history of molecular evolution for human MYH16 Mol Biol Evol 22379-382
Przeworski M (2003) Estimating the time since the fixation of a beneficial allele Genetics 1641667-1676
Rozas J Rozas R (1999) DnaSP version 3 an integrated program for molecular population genetics and molecular evolution analysis Bioinformatics 15174-175
Sabeti PC Reich DE Higgins JM Levine HZ Richter DJ Schaffner SF Gabriel SB Platko JV Patterson NJ McDonald GJ Ackerman HC Campbell SJ Altshuler D Cooper R Kwiatkowski D Ward R Lander ES (2002) Detecting recent positive selection in the human genome from haplotype structure Nature 419832-837
Sabeti PC Walsh E Schaffner SF Varilly P Fry B Hutcheson HB Cullen M Mikkelsen TS Roy J Patterson N Cooper R Reich D Altshuler D OBrien S Lander ES (2005) The case for selection at CCR5-Delta32 PLoS Biol 3e378
Saleh M Vaillancourt JP Graham RK Huyck M Srinivasula SM Alnemri ES Steinberg MH Nolan V Baldwin CT Hotchkiss RS Buchman TG Zehnbauer BA Hayden MR Farrer LA Roy S Nicholson DW (2004) Differential modulation of endotoxin responsiveness by human caspase-12 polymorphisms Nature 42975-79
Shimizu KK Cork JM Caicedo AL Mays CA Moore RC Olsen KM Ruzsa S Coop G Bustamante CD Awadalla P Purugganan MD (2004) Darwinian selection on a selfing locus Science 3062081-2084
Stedman HH Kozyak BW Nelson A Thesier DM Su LT Low DW Bridges CR Shrager JB Minugh-Purvis N Mitchell MA (2004) Myosin gene mutation correlates with anatomical changes in the human lineage Nature 428415-418
Stephens JC Reich DE Goldstein DB Shin HD Smith MW Carrington M Winkler C et al (1998) Dating the origin of the CCR5-Delta32 AIDS-resistance allele by the coalescence of haplotypes Am J Hum Genet 621507-1515
Szabo Z Levi-Minzi SA Christiano AM Struminger C Stoneking M Batzer MA Boyd CD (1999) Sequential loss of two neighboring exons of the tropoelastin gene during primate evolution J Mol Evol 49664-671
Tajima F (1989) Statistical method for testing the neutral mutation hypothesis by DNA polymorphism Genetics 123585-595
Takahashi A Tsaur SC Coyne JA Wu CI (2001) The nucleotide changes governing cuticular hydrocarbon variation and their evolution in Drosophila melanogaster Proc Natl Acad Sci U S A 983920-3925
Takahata N Satta Y Klein J (1995) Divergence time and population size in the lineage leading to modern humans Theor Popul Biol 48198-221
The Chimpanzee Sequencing and Analysis Consortium (2005) Initial sequence of the chimpanzee genome and comparison with the human genome Nature 43769-87
115
Varki A (2001) Loss of N-glycolylneuraminic acid in humans Mechanisms consequences and implications for hominid evolution Am J Phys Anthropol Suppl 3354-69
Wang X Thomas SD Zhang J (2004) Relaxation of selective constraint and loss of function in the evolution of human bitter taste receptor genes Hum Mol Genet 132671-2678
Watanabe H Fujiyama A Hattori M Taylor TD Toyoda A Kuroki Y Noguchi H et al (2004) DNA sequence and comparative analysis of chimpanzee chromosome 22 Nature 429382-388
Wildman DE Uddin M Liu G Grossman LI Goodman M (2003) Implications of natural selection in shaping 994 nonsynonymous DNA identity between humans and chimpanzees enlarging genus Homo Proc Natl Acad Sci U S A 1007181-7188
Winter H Langbein L Krawczak M Cooper DN Jave-Suarez LF Rogers MA Praetzel S Heidt PJ Schweizer J (2001) Human type I hair keratin pseudogene phihHaA has functional orthologs in the chimpanzee and gorilla evidence for recent inactivation of the human gene after the Pan-Homo divergence Hum Genet 10837-42
Zhang J (2003) Evolution by gene duplication an update Trends Ecol Evolut 18292-298 Zhang J Webb DM Podlaha O (2002) Accelerated protein evolution and origins of
human-specific features Foxp2 as an example Genetics 1621825-1835 Zietkiewicz E Richer C Sinnett D Labuda D (1998) Monophyletic origin of Alu
elements in primates J Mol Evol 47172-182
116
- CHAPTER 3 RELAXATION OF SELECTIVE CONSTRAINT AND LOSS OF FUNCTION IN THE EVOLUTION OF HUMAN BITTER TASTE RECEPTOR GENEShelliphelliphelliphelliphelliphelliphelliphelliphelliphelliphelliphelliphelliphelliphelliphelliphelliphelliphelliphelliphelliphelliphelliphellip
- totalpdf
-
- CHAPTER 3 RELAXATION OF SELECTIVE CONSTRAINT AND LOSS OF FUNCTION IN THE EVOLUTION OF HUMAN BITTER TASTE RECEPTOR GENEShelliphelliphelliphelliphelliphelliphelliphelliphelliphelliphelliphelliphelliphelliphelliphelliphelliphelliphelliphelliphelliphelliphelliphellip
- totalpdf
-
- CHAPTER 3 RELAXATION OF SELECTIVE CONSTRAINT AND LOSS OF FUNCTION IN THE EVOLUTION OF HUMAN BITTER TASTE RECEPTOR GENEShelliphelliphelliphelliphelliphelliphelliphelliphelliphelliphelliphelliphelliphelliphelliphelliphelliphelliphelliphelliphelliphelliphelliphellip
- CHAPTER3pdf
-
- RELAXATION OF SELECTIVE CONSTRAINT AND LOSS OF FUNCTION IN THE EVOLUTION OF HUMAN BITTER TASTE RECEPTOR GENES
-

To my father and mother
ii
ACKNOWLEDGEMENTS
My sincerest thanks go to my advisor Jianzhi Zhang for his continuous support in
my PhD program For the past five years he has always been there to listen give
valuable advice and bring out the good ideas in me His patience and generosity gave me
a lot of courage and confidence His wisdom and intelligence opened my mind so I
learned to enjoy the beauty of science and experience the world in an entirely new way
I am also grateful to my dissertation committee for their patience kindness and
constant guidance Thanks also to my labmates and cohorts Without their friendship and
support I cannot survive the competition in academic field Particularly Soochin Cho
and Ondrej Podlaha offered me tremendous help on my study and work and kept me in
good spirits I am honored to work with so many intelligent people in Zhang lab sharing
my ideas with them and listening to their remarkable opinions
I also owe many thanks to Prosanta Chakrabarty LaDonna Walker Julia Eussen for
helping me at any time and solving any unsolvable problems for me
Finally I thank my parents for giving me my life in the first place for supporting me
to pursue my dream and for listening to my complaints and frustrations No matter how
far I am away from them I can feel their love surrounding me at any time
iii
TABLE OF CONTENTS
DEDICATIONhelliphelliphelliphelliphelliphelliphelliphelliphelliphelliphelliphelliphelliphelliphelliphelliphelliphelliphelliphelliphelliphelliphelliphelliphelliphellip iiACNOWLEDGEMENTShelliphelliphelliphelliphelliphelliphelliphelliphelliphelliphelliphelliphelliphelliphelliphelliphelliphelliphelliphelliphellip iiiLIST OF FIGUREShelliphelliphelliphelliphelliphelliphelliphelliphelliphelliphelliphelliphelliphelliphelliphelliphelliphelliphelliphelliphelliphelliphelliphellip viLIST OF TABLEShelliphelliphelliphelliphelliphelliphelliphelliphelliphelliphelliphelliphelliphelliphelliphelliphelliphelliphelliphelliphelliphelliphelliphelliphellip viiiABSTRACThelliphelliphelliphelliphelliphelliphelliphelliphelliphelliphelliphelliphelliphelliphelliphelliphelliphelliphelliphelliphelliphelliphelliphelliphelliphelliphellip ixINTRODUCTIONhelliphelliphelliphelliphelliphelliphelliphelliphelliphelliphelliphelliphelliphelliphelliphelliphelliphelliphelliphelliphelliphelliphelliphellip 1CHAPTER 1 RAPID EVOLUTION OF MAMMALIAN X-LINKED TESTIS-EXPRESSED HOMEOBOX GENEShelliphelliphelliphelliphelliphelliphelliphelliphelliphelliphelliphelliphellip 9 11 ABSTRACThelliphelliphelliphelliphelliphelliphelliphelliphelliphelliphelliphelliphelliphelliphelliphelliphelliphelliphelliphelliphelliphellip 9 12 INTRODUCTIONhelliphelliphelliphelliphelliphelliphelliphelliphelliphelliphelliphelliphelliphelliphelliphelliphelliphelliphelliphelliphellip 10 13 RESULTShelliphelliphelliphelliphelliphelliphelliphelliphelliphelliphelliphelliphelliphelliphelliphelliphelliphelliphelliphelliphelliphelliphelliphellip 11 14 DISCUSSIONhelliphelliphelliphelliphelliphelliphelliphelliphelliphelliphelliphelliphelliphelliphelliphelliphelliphelliphelliphelliphelliphellip 19 15 MATERIALS AND METHODShelliphelliphelliphelliphelliphelliphelliphelliphelliphelliphelliphelliphelliphelliphellip 22 16 ACKNOWLEDGMENTShelliphelliphelliphelliphelliphelliphelliphelliphelliphelliphelliphelliphelliphelliphelliphellip 25 17 LITERACTURE CITEDhelliphelliphelliphelliphelliphelliphelliphelliphelliphelliphelliphelliphelliphelliphelliphelliphelliphellip 32CHAPTER 2 RAPID EVOLUTION OF PRIMATE ESX1 AN X-LINKED PLACENTA- AND TESTIS-EXPRESSED HOMEOBOX GENE 35 21 ABSTRACThelliphelliphelliphelliphelliphelliphelliphelliphelliphelliphelliphelliphelliphelliphelliphelliphelliphelliphelliphelliphelliphellip 35 22 INTRODUCTIONhelliphelliphelliphelliphelliphelliphelliphelliphelliphelliphelliphelliphelliphelliphelliphelliphelliphelliphelliphelliphellip 36 23 RESULTShelliphelliphelliphelliphelliphelliphelliphelliphelliphelliphelliphelliphelliphelliphelliphelliphelliphelliphelliphelliphelliphelliphelliphellip 38 24 DISCUSSIONhelliphelliphelliphelliphelliphelliphelliphelliphelliphelliphelliphelliphelliphelliphelliphelliphelliphelliphelliphelliphelliphellip 45 25 MATERIALS AND METHODShelliphelliphelliphelliphelliphelliphelliphelliphelliphelliphelliphelliphelliphelliphellip 48 26 ACKNOWLEDGMENTShelliphelliphelliphelliphelliphelliphelliphelliphelliphelliphelliphelliphelliphelliphelliphelliphelliphellip 50 27 LITERACTURE CITEDhelliphelliphelliphelliphelliphelliphelliphelliphelliphelliphelliphelliphelliphelliphelliphelliphelliphellip 59CHAPTER 3 RELAXATION OF SELECTIVE CONSTRAINT AND LOSS OF FUNCTION IN THE EVOLUTION OF HUMAN BITTER TASTE RECEPTOR GENEShelliphelliphelliphelliphelliphelliphelliphelliphelliphelliphelliphelliphelliphelliphelliphelliphelliphelliphelliphelliphelliphelliphelliphellip 62 31 ABSTRACThelliphelliphelliphelliphelliphelliphelliphelliphelliphelliphelliphelliphelliphelliphelliphelliphelliphelliphelliphelliphelliphellip 62 32 INTRODUCTIONhelliphelliphelliphelliphelliphelliphelliphelliphelliphelliphelliphelliphelliphelliphelliphelliphelliphelliphelliphelliphellip 62 33 RESULTShelliphelliphelliphelliphelliphelliphelliphelliphelliphelliphelliphelliphelliphelliphelliphelliphelliphelliphelliphelliphelliphelliphelliphellip 64 34 DISCUSSIONhelliphelliphelliphelliphelliphelliphelliphelliphelliphelliphelliphelliphelliphelliphelliphelliphelliphelliphelliphelliphelliphellip 72 35 MATERIALS AND METHODShelliphelliphelliphelliphelliphelliphelliphelliphelliphelliphelliphelliphelliphelliphellip 76 36 ACKNOWLEDGMENTShelliphelliphelliphelliphelliphelliphelliphelliphelliphelliphelliphelliphelliphelliphelliphelliphelliphellip 78 37 LITERACTURE CITEDhelliphelliphelliphelliphelliphelliphelliphelliphelliphelliphelliphelliphelliphelliphelliphelliphelliphellip 85CHAPTER 4 ADAPTIVE PSEUDOGENIZATION OF CASPASE12 IN HUMAN EVOLUTIONhelliphelliphelliphelliphelliphelliphelliphelliphelliphelliphelliphelliphelliphelliphelliphelliphelliphelliphelliphelliphelliphelliphellip 89 41 ABSTRACThelliphelliphelliphelliphelliphelliphelliphelliphelliphelliphelliphelliphelliphelliphelliphelliphelliphelliphelliphelliphelliphellip 89
iv
42 INTRODUCTIONhelliphelliphelliphelliphelliphelliphelliphelliphelliphelliphelliphelliphelliphelliphelliphelliphelliphelliphelliphelliphellip 89 43 RESULTShelliphelliphelliphelliphelliphelliphelliphelliphelliphelliphelliphelliphelliphelliphelliphelliphelliphelliphelliphelliphelliphelliphelliphellip 92 44 DISCUSSIONhelliphelliphelliphelliphelliphelliphelliphelliphelliphelliphelliphelliphelliphelliphelliphelliphelliphelliphelliphelliphelliphellip 98 45 MATERIALS AND METHODShelliphelliphelliphelliphelliphelliphelliphelliphelliphelliphelliphelliphelliphelliphellip 101 46 ACKNOWLEDGMENTShelliphelliphelliphelliphelliphelliphelliphelliphelliphelliphelliphelliphelliphelliphelliphelliphelliphellip 105 47 LITERACTURE CITEDhelliphelliphelliphelliphelliphelliphelliphelliphelliphelliphelliphelliphelliphelliphelliphelliphelliphellip 113
v
LIST OF FIGURES Figure 11 Phylogenetic tree of TGIFLX TGIF2 and TGIF geneshelliphelliphelliphelliphelliphelliphellip 26
Figure 12 Alignment of TGIFLX sequences of 16 primateshelliphelliphelliphelliphelliphelliphelliphelliphellip 27
Figure 13 Pairwise comparisons of dS and dN among 16 primate TGIFLX sequences for (A) the entire sequence (B) nonhomeodomain regions and (C) the homeodomainhelliphelliphelliphelliphelliphelliphelliphelliphelliphelliphelliphelliphelliphelliphelliphelliphelliphelliphelliphelliphelliphelliphelliphelliphelliphelliphelliphellip 28
Figure 14 Numbers of synonymous (s) and nonsynonymous (n) substitutions in the evolution of primate TGIFLX geneshelliphelliphelliphelliphelliphelliphelliphelliphelliphelliphelliphelliphelliphelliphelliphelliphelliphellip 29
Figure 15 Distribution of the evolutionary rate of 64 mammalian homeobox geneshelliphelliphelliphelliphelliphelliphelliphelliphelliphelliphelliphelliphelliphelliphelliphelliphelliphelliphelliphelliphelliphelliphelliphelliphelliphelliphelliphelliphelliphelliphellip 30
Figure 21 Structures of the orthologous (A) human ESX1 and (B) mouse Esx1 genes adapted from (Fohn and Behringer 2001) and (Li et al 1997)helliphelliphelliphelliphelliphellip 51 Figure 22 Alignment of human and chimpanzee ESX1 protein sequenceshelliphellip 52 Figure 23 Protein sequence alignment for exon 4 of ESX1 (Esx1) in (A) 12 primates and (B) 4 Mus specieshelliphelliphelliphelliphelliphelliphelliphelliphelliphelliphelliphelliphelliphelliphelliphelliphelliphelliphelliphelliphellip 53 Figure 24 Pairwise synonymous (dS) and nonsynonymous (dN) nucleotide distances for (A) the entire exon 4 of ESX1 among 15 primates (B) the C-terminal non-homeodomain region of ESX1 among 15 primates and (C) the exon 4 of Esx1 among 4 Mus specieshelliphelliphelliphelliphelliphelliphelliphelliphelliphelliphelliphelliphelliphelliphelliphelliphelliphelliphelliphelliphelliphelliphelliphelliphellip 54 Figure 25 Separate alignments of translated ESX1 exon 4 of (A) hominoids (B) Old World monkeys and (C) New World monkeyshelliphelliphelliphelliphelliphelliphelliphelliphelliphelliphelliphelliphellip 55 Figure 26 Numbers of synonymous (s) and nonsynonymous (n) substitutions in the evolution of primate ESX1helliphelliphelliphelliphelliphelliphelliphelliphelliphelliphelliphelliphelliphelliphelliphelliphelliphelliphelliphelliphellip 56 Figure 31 Evolutionary relationships of 113 putatively functional TAS2R genes from the human chimpanzee mouse and rathelliphelliphelliphelliphelliphelliphelliphelliphelliphelliphelliphelliphelliphelliphelliphellip 79 Figure 32 Comparison of dNdS among different functional domains of TAS2Rshellip 80
vi
Figure 33 Expected and observed distributions of dNdS among 25 human TAS2R geneshelliphelliphelliphelliphelliphelliphelliphelliphelliphelliphelliphelliphelliphelliphelliphelliphelliphelliphelliphelliphelliphelliphelliphelliphelliphelliphelliphelliphelliphelliphellip
81
Figure 41 Intraspecific DNA sequence variation in noncoding regions linked with the human CASPASE12 genehelliphelliphelliphelliphelliphelliphelliphelliphelliphelliphelliphelliphelliphelliphelliphelliphelliphelliphelliphelliphelliphellip 107 Figure 42 Genotypes of the 4 CC homozygotes and 4 TT homozygotes that were sequenced in all 9 noncoding regionshelliphelliphelliphelliphelliphelliphelliphelliphelliphelliphelliphelliphelliphelliphelliphelliphelliphelliphellip 108 Figure 43 Estimating the age of the null allele and the onset of the selective sweep 109
vii
LIST OF TABLES Table 11 Protein p-distances between orthologous human and mouse homeobox geneshelliphelliphelliphelliphelliphelliphelliphelliphelliphelliphelliphelliphelliphelliphelliphelliphelliphelliphelliphelliphelliphelliphelliphelliphelliphelliphelliphelliphelliphellip 31 Table 21 ESX1 exon 4 sequence variations among 32 menhelliphelliphelliphelliphelliphelliphelliphelliphellip 57 Table 22 Primers used for amplifying different exons of ESX1 in primates and Esx1 in Mus specieshelliphelliphelliphelliphelliphelliphelliphelliphelliphelliphelliphelliphelliphelliphelliphelliphelliphelliphelliphelliphelliphelliphelliphellip 58 Table 31 Intra- and inter- variations of human TAS2R geneshelliphelliphelliphelliphelliphelliphellip 82 Table 32 Rates of synonymous and nonsynonymous nucleotide changes in human TAS2Rshelliphelliphelliphelliphelliphelliphelliphelliphelliphelliphelliphelliphelliphelliphelliphelliphelliphelliphelliphelliphelliphelliphelliphelliphelliphelliphellip 83 Table 41 Intraspecific variations in 9 noncoding regions linked to human CASPASE12helliphelliphelliphelliphelliphelliphelliphelliphelliphelliphelliphelliphelliphelliphelliphelliphelliphelliphelliphelliphelliphelliphelliphelliphelliphelliphelliphellip 110 Table 42 Results from coalescent simulationshelliphelliphelliphelliphelliphelliphelliphelliphelliphelliphelliphelliphellip 111 Table 43 SNPs identified in the noncoding regions linked with CASP12helliphelliphellip 112
viii
ABSTRACT
ldquoWhat makes us humansrdquo is one of the most fascinating questions in evolution The
genetic basis of the phenotypic differences between humans and close evolutionary
relatives has been a hot topic for molecular evolutionary studies Investigating human
genetic variations within the context of primates will provide valuable information about
the development and function of important primate features and unique human features
In Chapter 1 and 2 I conducted detailed evolutionary studies on two homeobox
genes TGIFLX and ESX1 Evolutionary analysis provided evidence for positive selection
acting on the two genes during primate evolution Given the key roles played by
homeobox genes in various developmental processes the identification of non-conserved
homeobox genes is interesting because such homeobox genes may regulate important
developmental processes that vary among relatively closely related species TGIFLX and
ESX1 are located on X chromosome and involved in male spermatogenesis process The
finding of positive selection in these genes suggests that even in the recent past of human
and primate evolution spermatogenesis has been subject to adaptive modifications
Characterizing genetic variations within humans is also a powerful way to detect the
genetic basis of human uniqueness Gene loss is an important source of human-specific
genetic change Genes related to chemoreception and immunity account for a large
proportion of lost genes in the human lineage In Chapter 3 I reported the relaxation of
selective constraint and loss of function in the evolution of human bitter taste receptor
genes probably due to the change in diet use of fire and reliance on other means of
ix
toxin avoidance that emerged in human evolution This finding provided further evidence
for reduced sensory capabilities of humans in comparison to many other mammals
Gene loss or pseudogenization has also been proposed to serve as an engine of
evolutionary change especially during human origins (the ldquoless-is-morerdquo hypothesis) In
Chapter 4 I focused on CASPASE12 a cysteinyl aspartate proteinase participating in
inflammatory and innate immune response to endotoxins My results provided population
genetic evidence that the nearly complete fixation of a null allele at CASPASE12 has been
driven by positive selection probably because the null allele confers protection from
severe sepsis Furthermore the identification and analysis of human-specific
pseudogenes open the door for understanding the roles of gene losses in human origins
and the demonstration that gene loss itself can be adaptive supports and extends the
lsquolsquoless-is-morersquorsquo hypothesis
x
INTRODUCTION
The finding of DNA double helix structure followed by dramatic achievements in
biochemical techniques such as PCR (Polymerase Chain Reaction) DNA sequencing
and genetic engineering opened a new era for evolutionary study Characterizing genetic
differences at the level of DNA molecules and its products (protein or RNA molecules)
has moved the study of evolution into a brand new dimension One of the most
fascinating questions in evolution is what makes us humans In addition to several
well-known features such as bipedalism enlarged brains language capability and other
high-order cognitive functions numerous traits differentiate humans from other great
apes (Varki and Altheide 2005) With rapid progress in human genetics comparative
genomes and molecular evolution the evolutioanry basis of these differences has begun
to be unraveled
Investigating our ldquohumannessrdquo in the context of primates will tell us what is
common to primates and what is unique to humans Phylogenetic analysis of primate
genomic data can provide valuable clues about the development and function of
important primate features and the genetic basis of human uniqueness So far finished or
draft primate genome sequences are available only for human common chimpanzee and
rhesus macaque No New World monkey has been sequenced in genomic scale despite
1
their evolutionary significance one more step further the human-rhesus relationship In
order to learn the mechanism of molecular evolution in a phylogenetic framework
encompassing the entire order Primates I focused on candidate gene investigation in my
dissertation work A candidate gene approach takes advantage of a priori knowledge
obtained from genetic biochemical or physiological assays about specific genes and can
acquire striking outcomes (Varki and Altheide 2005) FOXP2 evolution is a good
example The conserved transcriptional factor FOXP2 is required for speech development
in humans (Lai et al 2001) Intriguingly two adaptive amino acid replacements were
found in hominin evolution suggesting that these two substitutions were at least partially
responsible for the emergence of human speech and language (Enard et al 2002 Zhang
et al 2002)
In the first half of this thesis (Chapter 1 amp 2) I provide evidence for positive
selection acting on two homeobox genes TGIFLX and ESX1 during primate evolution
Homeobox genes are characterized by the presence of a sequence motif known as the
homeobox which encodes the ~60-amino-acid homeodomain a helix-turn-helix DNA
binding domain (Gehring et al 1994) In humans there are about 230 homeobox genes
(Nam and Nei 2005) encoding a large family of transcription factors that play key roles
in various developmental processes such as body-plan specification pattern formation
and cell-fate determination (Gehring et al 1994) Due to their functional importance
most homeodomain proteins are evolutionarily highly conserved in sequence (McGinnis
et al 1984 Gehring et al 1994 Zhang and Nei 1996) Hence the identification of
2
non-conserved homeobox genes would be particularly interesting because such
homeobox genes may regulate important developmental processes that vary among
relatively closely related species
Two such rapidly-evolving homeobox genes are well known from fruit flies (OdsH)
and rodents (Rhox5) respectively OdsH is an X-linked gene involved in spermatogenesis
and it is partly responsible for the hybrid male sterility between Drosophila simulans and
D mauritiana (Ting et al 1998) Mouse Rhox5 (also known as Pem) is expressed in both
male and female reproductive tissues (Sutton and Wilkinson 1997) Targeted disruption of
Rhox5 increases male germ cell apoptosis and reduces sperm production sperm motility
and fertility (Maclean et al 2005) In fact Rhox5 is just one member of a recently
expanded homeobox gene cluster known as the Rhox cluster on the mouse X
chromosome (Maclean et al 2005 MacLean et al 2006 Morris et al 2006 Wang and
Zhang 2006) Several other members of the cluster are also expressed in reproductive
tissues (Maclean et al 2005) and evolve rapidly (Jackson et al 2006 Wang and Zhang
2006) Interestingly each of the two cases involves a homeobox gene that is X-linked and
testis-expressed In my work I identified rapid evolution in another two X-linked
testis-expressed homeobox genes from primates TGIFLX (Chapter 1) and ESX1 (Chapter
2) Positive selection has been acting on both genes during primate evolution The
evolutionary patterns in light of the structure and function of these two genes are
discussed
In the second half of this thesis (Chapter 3 amp 4) I focus on human-specific gene
3
evolution by characterizing genetic variations within humans In addition to amino acid
replacements (like the cases presented in Chapter 1 amp 2) gene expression modification
generation of new genes and loss of existing genes are also genetic mechanisms
underlying human uniqueness In particular gene loss or pseudogenization leads to
immediate loss of gene function which probably affects organisms to a greater extent
than most amino acid replacements do A number of genes are known to have been lost in
the human lineage since its divergence from the chimpanzee lineage (Chou et al 1998
Szabo et al 1999 Winter et al 2001 Gilad et al 2003 Hamann et al 2003 Meyer-Olson
et al 2003 Stedman et al 2004 Wang et al 2004 Fischer et al 2005 Go et al 2005
Perry et al 2005) Many of these genes are involved in chemoreception and immunity
such as the olfactory receptor (OR) genes (Gilad et al 2003) and vomeronasal pheromone
receptor genes (Zhang and Webb 2003 Grus et al 2005) These cases of gene loss may
reflect significant changes in the way humans interact with each other or with the
environment human diet and human behavior during the past few million years In
Chapter 3 I present my finding of relaxation of selective constraint and loss of function
in the evolution of human bitter taste receptor genes which provide further evidence for
reduced sensory capabilities of humans in comparison to many other mammals
Recently Olson (1999) and Olson and Varki (2003) proposed the ldquoless-is-morerdquo
hypothesis suggesting that gene loss may serve as an engine of evolutionary change This
hypothesis is particularly intriguing for human evolution as several human gene losses
have been proposed to provide opportunities for adaptations and be responsible for
4
human-specific phenotypes For example the pseudogenization of the sarcomeric myosin
gene MYH16 at the time of the emergence of the genus Homo is thought to be responsible
for the marked size reduction in hominin masticatory muscles which may have allowed
the brain-size expansion (Stedman et al 2004) (but also see Perry et al 2005) In another
example the human-specific inactivation of the gene encoding the enzyme
CMP-N-acetylneuraminic acid hydroxylase (CMAH) led to the deficiency of the
mammalian common sialic acid Neu5Gc (N-glycolylneuraminic acid) on the human cell
surface (Chou et al 1998) This inactivation was due to an Alu-mediated sequence
replacement (Hayakawa et al 2001) that occurred ~27 million years ago (Chou et al
2002) and may have had several important consequences for human biology and
evolution (Varki 2001) In Chapter 4 I present a case of adaptive gene loss in humans I
provide evidence that the nearly complete fixation of a null allele at CASPASE12
(CASP12) has been driven by positive selection probably because the allele confers
lowered susceptibility to severe sepsis This finding opens the door for understanding the
roles of gene losses in human origins and the demonstration that gene loss itself can be
adaptive supports and extends the ldquoless-is-morerdquo hypothesis
5
LITERATURE CITED
Chou HH Hayakawa T Diaz S Krings M Indriati E Leakey M Paabo S Satta Y Takahata N Varki A (2002) Inactivation of CMP-N-acetylneuraminic acid hydroxylase occurred prior to brain expansion during human evolution Proc Natl Acad Sci U S A 9911736-11741
Chou HH Takematsu H Diaz S Iber J Nickerson E Wright KL Muchmore EA Nelson DL Warren ST Varki A (1998) A mutation in human CMP-sialic acid hydroxylase occurred after the Homo-Pan divergence Proc Natl Acad Sci U S A 9511751-11756
Enard W Przeworski M Fisher SE Lai CSL Wiebe V Kitano T Monaco AP Paabo S (2002) Molecular evolution of FOXP2 a gene involved in speech and language Nature 418869-872
Fischer A Gilad Y Man O Paabo S (2005) Evolution of bitter taste receptors in humans and apes Mol Biol Evol 22432-436
Gehring WJ Affolter M Burglin T (1994) Homeodomain proteins Annual review of biochemistry 63487-526
Gilad Y Man O Paabo S Lancet D (2003) Human specific loss of olfactory receptor genes Proc Natl Acad Sci U S A 1003324-3327
Go Y Satta Y Takenaka O Takahata N (2005) Lineage-specific loss of function of bitter taste receptor genes in humans and nonhuman primates Genetics 170313-326
Grus WE Shi P Zhang YP Zhang JZ (2005) Dramatic variation of the vomeronasal pheromone receptor gene repertoire among five orders of placental and marsupial mammals Proceedings of the National Academy of Sciences of the United States of America 1025767-5772
Hamann J Kwakkenbos MJ de Jong EC Heus H Olsen AS van Lier RA (2003) Inactivation of the EGF-TM7 receptor EMR4 after the Pan-Homo divergence Eur J Immunol 331365-1371
Hayakawa T Satta Y Gagneux P Varki A Takahata N (2001) Alu-mediated inactivation of the human CMP- N-acetylneuraminic acid hydroxylase gene Proc Natl Acad Sci U S A 9811399-11404
Jackson M Watt AJ Gautier P Gilchrist D Driehaus J Graham GJ Keebler J Prugnolle F Awadalla P Forrester LM (2006) A murine specific expansion of the Rhox cluster involved in embryonic stem cell biology is under natural selection BMC genomics 7212
Lai CSL Fisher SE Hurst JA Vargha-Khadem F Monaco AP (2001) A forkhead-domain gene is mutated in a severe speech and language disorder Nature 413519-523
Maclean JA 2nd Chen MA Wayne CM Bruce SR Rao M Meistrich ML Macleod C Wilkinson MF (2005) Rhox a new homeobox gene cluster Cell 120369-382
MacLean JA 2nd Lorenzetti D Hu Z Salerno WJ Miller J Wilkinson MF (2006) Rhox homeobox gene cluster recent duplication of three family members Genesis
6
44122-129 McGinnis W Hart CP Gehring WJ Ruddle FH (1984) Molecular cloning and
chromosome mapping of a mouse DNA sequence homologous to homeotic genes of Drosophila Cell 38675-680
Meyer-Olson D Brady KW Blackard JT Allen TM Islam S Shoukry NH Hartman K Walker CM Kalams SA (2003) Analysis of the TCR beta variable gene repertoire in chimpanzees identification of functional homologs to human pseudogenes J Immunol 1704161-4169
Morris L Gordon J Blackburn CC (2006) Identification of a tandem duplicated array in the Rhox alpha locus on mouse chromosome X Mamm Genome 17178-187
Nam J Nei M (2005) Evolutionary change of the numbers of homeobox genes in bilateral animals Molecular biology and evolution 222386-2394
Olson MV (1999) When less is more gene loss as an engine of evolutionary change Am J Hum Genet 6418-23
Olson MV Varki A (2003) Sequencing the chimpanzee genome insights into human evolution and disease Nat Rev Genet 420-28
Perry GH Verrelli BC Stone AC (2005) Comparative analyses reveal a complex history of molecular evolution for human MYH16 Mol Biol Evol 22379-382
Stedman HH Kozyak BW Nelson A Thesier DM Su LT Low DW Bridges CR Shrager JB Minugh-Purvis N Mitchell MA (2004) Myosin gene mutation correlates with anatomical changes in the human lineage Nature 428415-418
Sutton KA Wilkinson MF (1997) Rapid evolution of a homeodomain evidence for positive selection J Mol Evol 45579-588
Szabo Z Levi-Minzi SA Christiano AM Struminger C Stoneking M Batzer MA Boyd CD (1999) Sequential loss of two neighboring exons of the tropoelastin gene during primate evolution J Mol Evol 49664-671
Ting CT Tsaur SC Wu ML Wu CI (1998) A rapidly evolving homeobox at the site of a hybrid sterility gene Science 2821501-1504
Varki A (2001) Loss of N-glycolylneuraminic acid in humans Mechanisms consequences and implications for hominid evolution Am J Phys Anthropol Suppl 3354-69
Varki A Altheide TK (2005) Comparing the human and chimpanzee genomes Searching for needles in a haystack Genome Research 151746-1758
Wang X Thomas SD Zhang J (2004) Relaxation of selective constraint and loss of function in the evolution of human bitter taste receptor genes Hum Mol Genet 132671-2678
Wang X Zhang J (2006) Remarkable expansions of an X-linked reproductive homeobox gene cluster in rodent evolution Genomics 8834-43
Winter H Langbein L Krawczak M Cooper DN Jave-Suarez LF Rogers MA Praetzel S Heidt PJ Schweizer J (2001) Human type I hair keratin pseudogene phihHaA has functional orthologs in the chimpanzee and gorilla evidence for recent
7
inactivation of the human gene after the Pan-Homo divergence Hum Genet 10837-42
Zhang J Nei M (1996) Evolution of Antennapedia-class homeobox genes Genetics 142295-303
Zhang JZ Webb DM (2003) Evolutionary deterioration of the vomeronasal pheromone transduction pathway in catarrhine primates Proceedings of the National Academy of Sciences of the United States of America 1008337-8341
Zhang JZ Webb DM Podlaha O (2002) Accelerated protein evolution and origins of human-specific features FOXP2 as an example Genetics 1621825-1835
8
CHAPTER 1
RAPID EVOLUTION OF MAMMALIAN X-LINKED TESTIS-EXPRESSED HOMEOBOX GENES
11 ABSTRACT
Homeobox genes encode transcription factors that function in various
developmental processes and are usually evolutionarily conserved in their sequences
However two X-chromosome-linked testis-expressed homeobox genes one from rodents
and the other from fruit flies are known to evolve rapidly under positive Darwinian
selection Here we report yet another case from primates TGIFLX is an X-linked
homeobox gene that originated by retroposition of the autosomal gene TGIF2 most likely
in a common ancestor of rodents and primates While TGIF2 is ubiquitously expressed
TGIFLX is exclusively expressed in adult testis A comparison of the TGIFLX sequences
among 16 anthropoid primates revealed a significantly higher rate of nonsynonymous
nucleotide substitution (dN) than synonymous substitution (dS) strongly suggesting the
action of positive selection Although the high dNdS ratio is most evident outside the
homeobox the homeobox has a dNdS of 089 and includes two codons that are likely
under selection Furthermore the rate of radical amino acid substitutions that alter amino
acid charge is significantly greater than that of conservative substitutions suggesting that
the selection promotes diversity of the protein charge profile More interestingly an
analysis of 64 orthologous homeobox genes from humans and mice shows substantially
higher rates of amino acid substitution in X-linked testis-expressed genes than in other
9
genes These results suggest a general pattern of rapid evolution of mammalian X-linked
testis-expressed homeobox genes Although the physiological function of and the exact
selective agent on TGIFLX and other rapidly evolving homeobox genes are unclear the
common expression pattern of these transcription factor genes led us to conjecture that the
selection is related to one or more aspects of male reproduction and may contribute to
speciation
12 INTRODUCTION
Homeobox genes are characterized by the presence of an 60-codon sequence
motif known as the homeobox which encodes a helix-turn-helix DNA-binding domain
named the homeodomain (Gehring et al 1994a) Initially identified from fruit flies
(Mcginnis et al 1984 Scott and Weiner 1984) homeobox-containing genes have now
been found in fungi plants and animals and form a large gene superfamily (Kappen et al
1993 Bharathan et al 1997 Kappen 2000 Banerjee-Basu and Baxevanis 2001)
Homeobox genes function as transcription factors that regulate the expressions of their
target genes in various developmental processes such as body-plan specification pattern
formation and cell fate determination (Gehring et al 1994a) Because of their
fundamental importance in development homeobox genes are of substantial interest to
evolutionary biologists as they may provide key information on the evolution of
development (Shepherd et al 1984 Garciafernandez and Holland 1994 Zhang and Nei
1996 Carroll et al 2001) Earlier studies showed that homeobox genes particularly the
homeobox region are conserved in evolution (Mcginnis et al 1984 Gehring et al 1994a)
although two notable exceptions Pem in rodents and OdsH in Drosophila have been
10
reported (Sutton and Wilkinson 1997 Ting et al 1998) In both cases high rates of amino
acid substitution were found in the homeodomain and the action of positive selection was
suggested Interestingly both genes are located on X chromosomes and are expressed in
testis although Pem is also expressed in female reproductive tissues OdsH is in part
responsible for the hybrid male sterility between Drosophila simulans and D mauritiana
(Ting et al 1998) These intriguing findings suggest that homeobox genes may also be
involved in developmental processes that vary among closely related species Because
such developmental variations may lead to reproductive isolation and speciation (Ting et
al 1998) it is of interest to identify new cases of rapidly evolving homeobox genes Here
we describe the identification of such a rapidly evolving homeobox gene TGIFLX
[TG-interacting factor (TGIF)-like X] from primates TGIFLX is a member of TGIFs a
group of transcription factors of the three amino-acid loop extension (TALE) superclass
of the homeodomain protein family (Bertolino et al 1995 Blanco-Arias et al 2002)
Earlier evolutionary analyses suggested that the X-chromosome-linked TGIFLX gene
originated by retroposition of the autosomal TGIF2 gene a member of TGIFs
(Blanco-Arias et al 2002) In contrast to TGIF2 which is ubiquitously expressed
TGIFLX is specifically expressed in the germ cells of adult testis (Blanco-Arias et al
2002 Lai et al 2002) In this report we show that (1) the retroposition event predated the
divergence of primates and rodents (2) TGIFLX evolved rapidly in primates under
positive selection and (3) mammalian X-linked testis-expressed homeobox genes evolve
rapidly in general
13 RESULTS
11
131 Retroposition predated the human-mouse separation
To determine when the retroposition that generated TGIFLX occurred in evolution
we conducted a BLAST search in the GenBank for homologous sequences to TGIFLX
and its mother gene TGIF2 We identified a homeobox gene Tex1 (also known as
Tgifx1-pending) in the mouse that is mapped to a region of the X chromosome that is
syntenic with human Xq213 where TGIFLX is located Tex1 is also specifically
expressed in the germ cells of mouse testis (Lai et al 2002) These facts suggest that
mouse Tex1 is orthologous to human TGIFLX Furthermore we obtained the gene
sequences of human and mouse TGIF2 from GenBank and conducted a phylogenetic
analysis of these sequences The human and mouse TGIF sequences are used as
outgroups The gene tree shows high bootstrap support for the retroposition that gave
birth to TGIFLX occurring in a common ancestor of primates and rodents (Figure 11)
Although retroposition usually generates pseudogenes a number of
retroposition-mediated functional genes have been identified (Long 2001) TGIFLX is
apparently a functional gene as its open reading frame has been maintained throughout
mammalian evolution Retroposition is a mutation-prone process due to a high error rate
in retrotranscription Also newly duplicated genes often have elevated rates of evolution
due to relaxation of functional constraints andor positive selection (Zhang 2003) Thus
one may expect to see a burst of substitutions in the TGIFLX branch immediately
following the retroposition Interestingly the phylogenetic tree (Figure 11) shows that
TGIFLX evolves more rapidly than TGIF2 not only in this branch but also throughout its
evolutionary history We found that the number of amino acid substitutions per site
(Poisson distance) between the orthologous human and mouse TGIFLX genes is 0814 plusmn
12
0080 and the corresponding number for TGIF2 is 0031 plusmn 0013 their difference being
statistically significant (P lt 0001) Of 1880 orthologous human and rodent genes
analyzed by Makalowski and Boguski (1998) only 6 have substitution rates greater than
that of TGIFLX suggesting that it is evolving at an exceptionally high rate To further
characterize the substitution rate of TGIFLX we conducted a detailed evolutionary study
of this gene in primates
132 Positive selection on primate TGIFLX
The TGIFLX coding sequences from five hominoids and four OW monkeys were
reported by Blanco-Arias et al (2002) We here determined the orthologous sequences in
two additional OW monkeys and five NW monkeys Thus a total of 16 primate
sequences are analyzed here The alignment of these 16 protein sequences shows that they
are highly variable (Figure 12) The nonhomeodomain regions show the highest
variability although 25 of the 63 amino acid positions in the homeodomain are also
variable among the 16 primates Hydrophobic amino acids are usually conserved in
homeodomains in the present case 22 of the 29 hydrophobic sites are completely
conserved among the primate sequences and the remaining 7 also involve only
hydrophobic amino acid changes In the third helix of the homeodomain four amino
acids (W51 F52 N54 and R56 positions in the homeodomain) are known to be
conserved (Banerjee-Basu and Baxevanis 2001) which is also the case here Position 53
is usually occupied by a polar amino acid in homeodomains but was found to have a
small nonpolar amino acid in a previous analysis of TALE homeodomains (Burglin
1997) In our sequences position 53 is variable with either polar or nonpolar amino acids
13
To examine whether the high sequence variability is a result of positive selection we
computed the synonymous (dS) and nonsynonymous (dN) distances between each pair of
the sequences For the entire coding region higher dN than dS is observed in 93 of 120
pairwise comparisons (Figure 13A) suggesting the possible action of positive selection
This pattern is more apparent when only the nonhomeodomain regions are analyzed as
98 of the comparisons show dN gt dS (Figure 13B) For the homeodomain however only
39 of the comparisons show dN gt dS (Figure 13C) These results indicate that the
substitution rate and pattern may be different between amino acid positions inside and
outside the homeodomain
To test the hypothesis of positive selection more rigorously we used a
phylogeny-based approach (Zhang and Nei 1997) The phylogentic relationships of the 16
primates are assumed to follow the tree in Figure 14 This phylogeny is relatively well
established especially for the major divisions (Goodman et al 1998 Page and Goodman
2001 Singer et al 2003 Steiper and Ruvolo 2003) and use of alternative trees does not
affect our main conclusion On the basis of this tree we inferred the ancestral TGIFLX
gene sequences at all interior nodes of the tree and counted the numbers of synonymous
(s) and nonsynonymous (n) substitutions on each tree branch (Figure 14) We found that
the sums of n and s for all branches are 1955 and 585 respectively for the
nonhomeodomain regions The potential numbers of nonsynonymous (N) and
synonymous (S) sites are 322 and 128 respectively Thus ns = 334 is significantly
greater than NS = 251 (P = 0031 binomial test) The binomial test used here is more
conservative than Fishers exact test used in Zhang et al (1997) and is more appropriate
here because of multiple substitutions that may have occurred at individual sites (Zhang
14
and Rosenberg 2002) Fishers exact test would have given a P value of 0002 here We
also analyzed ns in hominoids OW monkeys and NW monkeys separately but did not
find significant differences (Figure 14) The average number of synonymous
substitutions per site is 0155 between hominoids and New World monkeys and 00819
between hominoids and Old World monkeys These values are virtually identical to the
corresponding numbers obtained from multiple intron and noncoding sequences of
primate genomes (0149 and 0079 respectively Li 1997 pp 221ndash224) suggesting that
the synonymous substitution rate in TGIFLX is normal Thus our results strongly suggest
that positive selection is responsible for the rapid evolution at nonsynonymous sites of the
nonhomeodomain regions
For the homeodomain we found that ns (242) is slightly lower than NS (273)
and that the null hypothesis of ns = NS cannot be rejected This may suggest that the
homeodomain is under no functional constraints It may also suggest that some sites in the
homeodomain are under positive selection while other sites are under purifying selection
giving an overall pattern of similar average substitution rates at synonymous and
nonsynonymous sites (see below) When we examine the substitution patterns of
hominoids OW monkeys and NW monkeys separately we find that the ns ratio is
higher among hominoids and OW monkeys (23545 = 522) than among NW monkeys
(2512 = 208 Figure 14) However this difference is not significant (P = 0132) The ns
ratio is not significantly different from NS for hominoids and OW monkeys (P = 0150)
Statistical methods for identifying individual codons that are under positive
selection have been developed in recent years (Suzuki and Gojobori 1999 Yang et al
2000) We first applied the likelihood method (Yang et al 2000) to the TGIFLX data and
15
compared the likelihoods under models 7 and 8 Here model 7 assumes that the dNdS
ratio for individual sites follows a szlig-distribution between 0 and 1 while model 8 adds an
extra class of sites to model 7 We found that model 8 fits the data significantly better
than model 7 ( 2 = 152 df = 2 P lt 0001) with an additional class of sites of dNdS =
242 Four codons were identified to be under positive selection with posterior
probabilities gt90 and they are marked on the sequences shown in Figure 12 Similar
results were obtained when models 1 and 2 were compared (see Yang et al 2000) for
details of the model description) Because the likelihood method has been shown to
generate false-positive results occasionally (Suzuki and Nei 2002) we examined the
evidence for selection at the four codons by a more conservative parsimony-based
method (Suzuki and Gojobori 1999) None of the four codons show significant results of
positive selection when they are tested individually (P = 019ndash059) When they are tested
together however significant evidence for positive selection is found (average dNdS =
510 P = 0021) suggesting that one or more of the four codons are under positive
selection It is interesting to note that two of the four codons are located within the
homeodomain while the other two are adjacent to the 3 end of the homeodomain
suggesting that the homeodomain may indeed be under positive selection (Figure 12)
The two residues within the homeodomain are not among the completely conserved
residues of all homeodomains indicating that substitutions at these sites are unlikely to
disrupt the basic structure and function of homeodomains Furthermore crystal structures
of homeodomains show that the first of the two residues is involved in DNA-protein
binding and that it contributes significantly to the functional specificity of homeodomains
(Gehring et al 1994b) The second of the two residues belongs to helix I of the
16
homeodomain and it may also be involved in DNA-protein binding although a more
specific molecular function has yet to be defined
133 Selection promotes the diversity of charge profile
To investigate what types of nonsynonymous substitutions are favored by selection
we counted the numbers of conservative and radical nonsynonymous substitutions on
each branch of the tree in Figure 14 Conservative nonsynonymous substitutions are
those that do not alter the charge of the encoded amino acids and radical substitutions are
those that alter the charge of the amino acids We found a total number of r = 915 radical
substitutions and c = 104 conservative substitutions in the tree for the nonhomeodomain
regions The potential numbers of radical and conservative sites are R = 128 and C = 195
respectively The radical substitution rate (rR = 0715) is significantly greater than the
conservative substitution rate (cC = 0533) at P = 0027 (binomial test) This is in sharp
contrast to the situation in most mammalian genes where the radical substitution rate is
below the conservative rate (Zhang 2000) This result suggests that selection may favor
alterations of amino acid charge in TGIFLX evolution We also tested the hypothesis that
selection may favor an alternation of amino acid polarity but obtained no supporting
evidence For the homeodomain there is no evidence for selection promoting the
diversity of either amino acid polarity or charge
In the above we compared the number of radical substitutions per radical site (rR)
with the number of conservative substitutions per conservative site (cC) This
comparison provides information on differential selections at radical vs conservative sites
as long as the four parameters (r c R and C) are correctly estimated (Smith 2003) In
contrast comparisons between r and c can be misleading because the potential numbers
17
of radical (R) and conservative (C) sites in a gene sequence are usually different and they
are affected by many factors unrelated to selection (Dagan et al 2002)
134 Rapid evolution of mammalian X-linked testis-expressed homeobox genes
As mentioned two other homeobox genes Pem and OdsH were reported to evolve
rapidly (Sutton and Wilkinson 1997 Ting et al 1998) The dNdS ratio of Pem ranges
from 065 to 156 for the homeodomain between Mus musculus and several related
rodents (Sutton and Wilkinson 1997) We reanalyzed the OdsH homeodomain sequences
from D simulans and D mauritiana (Ting et al 1998) and obtained a dNdS ratio of 155
Interestingly TGIFLX Pem and OdsH are all located in X chromosomes and are all
testis expressed This observation prompted us to wonder whether it is a general pattern
for X-linked testis-expressed homeobox genes to evolve rapidly To test this hypothesis
we searched for orthologous homeobox genes from the human and mouse genome
sequences Our search was not exhaustive but random Of the 64 genes found 4 are
X-linked and testis expressed 3 are X-linked and non-testis expressed 13 are autosomal
and testis expressed and 44 are autosomal and non-testis expressed Note that there
appear to be only 7 X-linked homeobox genes as a further exhaustive search did not find
additional genes Here testis expression simply means that the gene is expressed in
testis regardless of its expression in other tissues We aligned the sequences and
computed the amino acid p-distance for each orthologous pair As shown in Table 11 and
Figure 15A when the entire protein is considered autosomal homeobox genes
(regardless of the expression pattern) and X-chromosomal non-testis-expressed
homeobox genes have similar amino acid p-distances on average which are an order of
magnitude lower than those of X-linked testis-expressed homeobox genes and their
18
difference is statistically significant (P lt 00001 permutation test) The same pattern is
observed when only the homeodomain or nonhomeodomain regions are considered
(Table 11 Figure 15 B and C) These results suggest that it is a general pattern for
mammalian X-linked testis-expressed homeobox genes to evolve rapidly In addition to
TGIFLX the other X-linked testis-expressed homeobox genes are ESX1L OTEX and
PEPP-2 While the mouse ortholog of human ESX1L is clearly defined by a phylogenetic
analysis (data not shown) and chromosomal locations the orthologs of human OTEX and
PEPP-2 are not uniquely defined probably because of independent gene duplications in
rodents and primates after their separation (Wayne et al 2002) From the mouse genome
sequence we identified a total of 15 homologs of the human OTEX and PEPP-2 genes
and conducted a phylogenetic analysis of these genes The phylogeny is not well resolved
and has low bootstrap supports (not shown) To be conservative we computed protein
p-distances for the human OTEX with each of the 15 mouse genes and presented the
smallest distance in Table 11 We also did the same for the human PEPP-2 gene
Considering possible nonindependent comparisons involved we also repeated all the
statistical tests when only one of the OTEX and PEPP-2 genes was used We found that
the statistical results remain unchanged
14 DISCUSSION
In this report we provide evidence that TGIFLX evolves rapidly under positive
selection in primates and that the selection favors diversity in charge profile Although
positive selection acts mainly in the nonhomeodomain regions of the protein it may also
operate at a few sites in the homeodomain The homeodomain is used in binding DNA
19
sequences in transcription regulation while the nonhomeodomain regions in TGIFLX
might be used in protein-protein interaction as in the case of TGIF and TGIF2 (Bertolino
et al 1995 Melhuish and Wotton 2000 Melhuish et al 2001) Rapid evolution at these
sites thus may alter the DNA- and protein-binding properties of TGIFLX In mouse the
TGIFLX ortholog Tex1 is exclusively expressed in the germ cells at the spermatid stage
(Lai et al 2002) and apparently escapes the inactivation that most X-linked genes are
supposed to experience in spermatogenesis (Lifschyt and Lindsley 1972) Although the
physiological function of TGIFLX is unknown the restricted temporal and spatial
expression pattern suggests a role of this gene in spermatogenesis and the detected
positive selection on TGIFLX may be related to spermatogenesis as well
Our analysis of homeobox genes of humans and mice revealed a general pattern of
rapid evolution of X-linked testis-expressed homeobox genes although the number of
such genes is relatively small It is interesting to note that among autosomal homeobox
genes testis-expressed genes and non-testis-expressed genes show similar rates of amino
acid substitution (Figure 15) Thus testis expression alone does not explain high rates of
protein evolution Among non-testis-expressed homeobox genes there is also no
significant difference in substitution rate between autosomal genes and X-linked genes
suggesting that chromosomal location alone also does not explain the difference in amino
acid substitution rate We noted in collecting the expression pattern data that 3 of the 4
X-linked testis-expressed genes (TGIFLX OTEX and PEPP-2) but only 1 (NKX31) of
the 13 autosomal testis-expressed genes have exclusive or highly selective expressions in
testis This difference suggests that the majority of the autosomal testis-expressed genes
may be under greater functional constraints due to their multifaceted roles in many tissues
20
and developmental processes and thus evolve more slowly Indeed NKX31 which is
expressed only in testis has the highest substitution rate among the 13 autosomal
testis-expressed genes (Table 11) On the contrary most of the X-linked testis-expressed
homeobox genes are expressed exclusively or highly in testis and may thus be specifically
involved in male reproduction Many authors showed that genes involved in male
reproduction evolve rapidly under positive selection (eg Lee et al 1995 Swanson and
Vacquier 1995 Metz and Palumbi 1996 Tsaur and Wu 1997 Rooney and Zhang 1999
Wyckoff et al 2000 Swanson and Vacquier 2002 Podlaha and Zhang 2003) In
particular Torgerson and Singh (2003) recently showed that mammalian X-linked sperm
proteins evolve faster than autosomal ones Our finding of rapid evolution of mammalian
X-linked testis-expressed homeobox genes is thus consistent with these previous
observations
Wang et al (2001) reported that the mammalian X chromosome harbors
disproportionately more spermatogonia-expressed genes than autosomes Spermatogonia
are the mitotic germ cells of the testis from which sperm arise by spermatogenesis
Spermatogonia-expressed genes are probably involved in male reproduction In our
random sample of 64 homeobox genes 57 of the 7 X-linked genes and 23 of the 57
autosomal genes are testis expressed Thus even for homeobox genes the X chromosome
appears to harbor a higher proportion of testis-expressed genes than autosomes (P =
0074) If only those genes that are exclusively (or highly selectively) expressed in testis
are considered the X chromosome harbors an even higher percentage of such genes (37
= 43) than autosomes (157 = 2) and their difference is significant (P = 0003)
Sex-chromosome meiotic drive andor sexual antagonism have been invoked as possible
21
explanations for a higher proportion of X-linked genes to function in male reproduction
and these hypotheses have been discussed extensively in Wang et al (2001)
It has also been proposed that X-linked genes evolve more rapidly than autosomal
genes (Charlesworth et al 1987) This is particularly so when the X-linked genes are
expressed only in males because all newly arising advantageous alleles dominant or
recessive are exposed to positive Darwinian selection In contrast recessive
advantageous alleles at autosomal loci are effectively neutral when the allele frequencies
are very low This might explain the effectiveness of positive selection on X-linked
testis-expressed genes
The X chromosome has been shown to be of special importance in hybrid sterility
between closely related species (reviewed in Coyne 1992) The importance of homeobox
genes in hybrid sterility however is not well recognized probably because most
homeobox genes are evolutionarily conserved It was thus a surprise to identify the
rapidly evolving OdsH an X-linked testis-expressed homeobox gene that is in part
responsible for the hybrid male sterility between D simulans and D mauritiana (Ting et
al 1998) This study showed that it is a general pattern for mammalian X-linked
testis-expressed homeobox genes to evolve rapidly This suggests the intriguing
possibility that it is a rule rather than an exception that homeobox genes such as OdsH
play important roles in reproductive isolation In the future it will be of great interest to
work out the developmental pathways in which these homeobox genes function and the
biological significance of their rapid pace of evolution
15 MATERIALS AND METHODS
22
151 DNA amplification and sequencing
The TGIFLX coding region does not contain introns The coding region was
amplified from genomic DNAs of two Old World (OW) monkeys (green monkey
Cercopithecus aethiops and douc langur Pygathrix nemaeus) and five New World (NW)
monkeys (marmoset Callithrix jacchus tamarin Saguinus oedipus owl monkey Aotus
trivirgatus squirrel monkey Saimiri sciureus and woolly monkey Lagothrix lagotricha)
using polymerase chain reaction (PCR) For green monkey and douc langur primers 2XL
(5-TTTGAATATGGAGGCCGCTG) and 2XR (5-CATCATCAATCATGGATTAG) were
used for tamarin woolly monkey and marmoset primers 2XL and XIA1
(5-GGATTAGACTCTTGCTTCTTCT) were used for owl monkey and squirrel monkey
primers X2 (5-ATATGGAGGCCGCTGCAgAAGAC) and X3
(5-GGCTCTTGCTTCTTCTCTAGC) were used PCRs were performed with MasterTaq
under conditions recommended by the manufacturer (Eppendorf Hamburg Germany)
The products were then purified and sequenced from both directions using the dideoxy
chain termination method with an automated sequencer
152 Analysis of TGIFLX gene sequences
The DNA sequences of the TGIFLX coding region from five hominoids (humans
and apes) and four OW monkeys (Blanco-Arias et al 2002) were obtained from GenBank
The accession numbers are human (Homo sapiens) AJ427749 chimpanzee (Pan
troglodytes) AJ345073 gorilla (Gorilla gorilla) AJ345074 orangutan (Pongo
pygmaeus) AJ345075 gibbon (Hylobates lar) AJ345076 talapoin (Miopithecus
talapoin) AJ345077 rhesus monkey (Macaca mulatta) AJ345078 crab-eating macaque
23
(M fascicularis) AJ345079 and baboon (Papio hamadryas) AJ345080 These publicly
available sequences are analyzed together with those determined in this study Seven
amino acids at the N terminus and 10 amino acids at the C terminus of the sequences are
encoded by the primer sequences and were not included in data analysis A total of 16
TGIFLX protein sequences were aligned using the software DAMBE (Xia and Xie 2001)
followed by manual adjustments The DNA sequence alignment was then made following
the protein alignment The MEGA2 program (Kumar et al 2001) was used for
phylogenetic analysis The number of synonymous nucleotide substitutions per
synonymous site (dS) and that of nonsynonymous substitutions per nonsynonymous site
(dN) were computed using the modified Nei-Gojobori method (Nei and Gojobori 1986
Zhang et al 1998) with an estimated transitiontransversion ratio of 16 On the basis of
the phylogeny of the 16 primates we inferred ancestral TGIFLX sequences at all interior
nodes of this tree using the distance-based Bayesian method (Zhang and Nei 1997) The
numbers of synonymous (s) and nonsynonymous (n) substitutions on each branch of the
tree were then counted Radical and conservative nonsynonymous substitutions with
regard to amino acid charge and polarity were computed following Zhang (2000)
Positive selection at individual codons was tested using the likelihood-based (Yang et al
2000) and parsimony-based (Suzuki and Gojobori 1999) methods
153 Analysis of other homeobox genes of human and mouse
We searched for homeobox genes from the human genome resources
(httpwwwncbinlmnihgovgenomeguidehuman) and then found their mouse
orthologs using the UniGene tool
24
(httpwwwncbinlmnihgoventrezqueryfcgidb=unigene) We downloaded the human
and mouse protein sequences aligned them using DAMBE and computed protein
p-distances (proportional differences Nei and Kumar 2000) between human and mouse
orthologs The information on gene location and expression pattern was found using
human genome resources and the LocusLink tool
(httpwwwncbinlmnihgovLocusLink)
16 ACKNOWLEDGMENTS
We thank Lizhi Gao Ondrej Podlaha David Webb and two anonymous reviewers
for valuable comments This work was supported by a startup fund from the University of
Michigan and a National Institutes of Health grant (GM67030) to JZ
25
Figure 11 Phylogenetic tree of TGIFLX TGIF2 and TGIF genes The tree is reconstructed with the neighbor-joining method with the protein Poisson distances Bootstrap percentages from 1000 replications are shown on tree branches Branch lengths show the numbers of amino acid substitutions per site TGIF genes are used as outgroups
26
Figure 12 Alignment of TGIFLX sequences of 16 primates A dot indicates identity to the human sequence and a dash indicates a gap The first 7 and last 10 amino acid positions are primer encoded in various sequences and are not used in subsequent sequence analysis The four positively selected sites with posterior probabilities gt90 (see text) are in boldface type
27
Figure 13 Pairwise comparisons of dS and dN among 16 primate TGIFLX sequences for (A) the entire sequence (B) nonhomeodomain regions and (C) the homeodomain
28
Figure 14 Numbers of synonymous (s) and nonsynonymous (n) substitutions in the evolution of primate TGIFLX genes Shown above each branch is ns for the nonhomeodomain regions and below each branch is ns for the homeodomain N and S are the potential numbers of nonsynonymous and synonymous sites respectively (see text)
29
Figure 15 Distribution of the evolutionary rate of 64 mammalian homeobox genes The evolutionary rate is measured by protein p-distance between the human and mouse orthologous genes for (A) the entire sequence (B) the homeodomain and (C) nonhomeodomain regions Solid bars X-linked testis-expressed genes shaded bars X-linked non-testis expressed hatched bars autosomal testis expressed open bars autosomal non-testis expressed
30
Table 11 Protein p-distances between orthologous human and mouse homeobox genes
Protein p-distance
Gene name Protein length (amino acids) Entire protein homeodomain Non-homeodomain
region X-linked testis expressed TGIFLX
222
0550
0456
0582 ESX1L 310 0565 0333 0620 OTEX 176 0625 0544 0664 PEPP-2 208 0606 0526 0636 Meanplusmnsem 0587plusmn0018 0465plusmn0048 0626plusmn0017
X-linked non-testis expressed ARX 560 0036 0000 0040 CDX4 282 0167 0017 0207 POU3F4 361 0011 0000 0013 Meanplusmnsem 0071plusmn0048 0006plusmn0006 0087plusmn0061
Autosomal testis expressed IRX2 471 0104 0000 0119 LHX2 389 0010 0000 0012 LHX9 321 0006 0000 0007 NKX31 230 0322 0000 0435 NKX6-2 277 0029 0000 0036 PBX2 430 0021 0000 0024 PKNOX2 305 0011 0000 0012 TIX1 a 949 0144 0037 0175 ZHX3 a 522 0123 0030 0154 SIX1 273 0015 0000 0019 TGIF 272 0103 0000 0134 TGIF2 237 0063 0000 0084 ZFHX1B 1214 0034 0017 0035 Meanplusmnsem 0076plusmn0024 0006plusmn0004 0096plusmn0033
Autosomal non-testis expressed ALX3 343 0085 0000 0102 ALX4 397 0111 0000 0129 BAPX1 333 0153 0000 0187 BARX2 254 0130 0000 0162 CRX 299 0033 0000 0042 DLX4 168 0274 0017 0417 GHS-2 303 0092 0000 0114 HHEX 303 0070 0018 0085 IPF1 283 0120 0000 0150 IRX3 501 0102 0000 0116 IRX4 512 0158 0000 0180 IRX5 417 0113 0000 0132 IRX6 438 0233 0048 0263 LHX1 406 0005 0000 0006 LHX3 398 0101 0000 0117 LHX4 367 0008 0000 0010 LHX5 402 0012 0000 0014 LHX6 340 0168 0000 0201 LMX1A 382 0029 0000 0034 LMX1B 372 0003 0000 0003 OTX1 354 0025 0000 0030 PHOX2A 280 0021 0000 0027 PHOX2B 314 0000 0000 0000 PITX1 314 0035 0000 0043 PITX2 317 0013 0000 0015 PITX3 302 0017 0000 0020 PKNOX1 314 0039 0000 0045 PROP1 223 0265 0070 0331 PROX1 736 0023 0000 0025 PRX2 246 0077 0000 0102 RAX 342 0140 0000 0170 SHOX2 330 0015 0000 0019 SIX2 436 0014 0023 0012 SIX3 332 0024 0000 0029 SIX4 753 0089 0000 0103 SIX5 657 0139 0000 0150 SIX6 246 0024 0017 0027 TLX1 330 0027 0000 0033 TLX2 284 0070 0000 0088 TLX3 291 0010 0000 0013 VAX1 279 0029 0000 0036 VAX2 290 0121 0000 0150 VSX1 354 0229 0040 0260 ZFH4 3525 0082 0009 0087 Meanplusmnsem 0080plusmn0011 0006plusmn0002 0097plusmn0014
a The mouse sequence is not available Instead the rat sequence is analyzed here
31
17 LITERATURE CITED
Banerjee-Basu S Baxevanis AD (2001) Molecular evolution of the homeodomain family of transcription factors Nucleic Acids Research 293258-3269
Bertolino E Reimund B WildtPerinic D Clerc RG (1995) A novel homeobox protein which recognizes a TGT core and functionally interferes with a retinoid-responsive motif Journal of Biological Chemistry 27031178-31188
Bharathan G Janssen BJ Kellogg EA Sinha N (1997) Did homeodomain proteins duplicate before the origin of angiosperms fungi and metazoa Proceedings of the National Academy of Sciences of the United States of America 9413749-13753
Blanco-Arias P Sargent CA Affara NA (2002) The human-specific Yp112Xq213 homology block encodes a potentially functional testis-specific TGIF-like retroposon Mammalian Genome 13463-468
Burglin TR (1997) Analysis of TALE superclass homeobox genes (MEIS PBC KNOX Iroquois TGIF) reveals a novel domain conserved between plants and animals Nucleic Acids Research 254173-4180
Charlesworth B Coyne JA Barton NH (1987) The Relative Rates of Evolution of Sex-Chromosomes and Autosomes American Naturalist 130113-146
Coyne JA (1992) Genetics and Speciation Nature 355511-515 Dagan T Talmor Y Graur D (2002) Ratios of radical to conservative amino acid
replacement are affected by mutational and compositional factors and may not be indicative of positive Darwinian selection Molecular Biology and Evolution 191022-1025
Garciafernandez J Holland PWH (1994) Archetypal Organization of the Amphioxus Hox Gene-Cluster Nature 370563-566
Gehring WJ Affolter M Burglin T (1994a) Homeodomain Proteins Annual Review of Biochemistry 63487-526
Gehring WJ Qian YQ Billeter M Furukubotokunaga K Schier AF Resendezperez D Affolter M Otting G Wuthrich K (1994b) Homeodomain-DNA Recognition Cell 78211-223
Goodman M Porter CA Czelusniak J Page SL Schneider H Shoshani J Gunnell G Groves CP (1998) Toward a phylogenetic classification of primates based on DNA evidence complemented by fossil evidence Molecular Phylogenetics and Evolution 9585-598
Kappen C (2000) The homeodomain an ancient evolutionary motif in animals and plants Computers amp Chemistry 2495-103
Kappen C Schughart K Ruddle FH (1993) Early Evolutionary Origin of Major Homeodomain Sequence Classes Genomics 1854-70
Kumar S Tamura K Jakobsen IB Nei M (2001) MEGA2 molecular evolutionary genetics analysis software Bioinformatics 171244-1245
Lai YL Li H Chiang HS Hsieh-Li HM (2002) Expression of a novel TGIF subclass homeobox gene Tex1 in the spermatids of mouse testis during spermatogenesis Mechanisms of Development 113185-187
Lee YH Ota T Vacquier VD (1995) Positive Selection Is a General Phenomenon in the Evolution of Abalone Sperm Lysin Molecular Biology and Evolution 12231-238
32
Lifschyt E Lindsley DL (1972) Role of X-Chromosome Inactivation during Spermatogenesis Proceedings of the National Academy of Sciences of the United States of America 69182-amp
Long M (2001) Evolution of novel genes Current Opinion in Genetics amp Development 11673-680
Mcginnis W Garber RL Wirz J Kuroiwa A Gehring WJ (1984) A Homologous Protein-Coding Sequence in Drosophila Homeotic Genes and Its Conservation in Other Metazoans Cell 37403-408
Melhuish TA Gallo CM Wotton D (2001) TGIF2 interacts with histone deacetylase I and represses transcription Journal of Biological Chemistry 27632109-32114
Melhuish TA Wotton D (2000) The interaction of the carboxyl terminus-binding protein with the Smad corepressor TGIF is disrupted by a holoprosencephaly mutation in TGIF Journal of Biological Chemistry 27539762-39766
Metz EC Palumbi SR (1996) Positive selection and sequence rearrangements generate extensive polymorphism in the gamete recognition protein bindin Molecular Biology and Evolution 13397-406
Nei M Gojobori T (1986) Simple Methods for Estimating the Numbers of Synonymous and Nonsynonymous Nucleotide Substitutions Molecular Biology and Evolution 3418-426
Page SL Goodman M (2001) Catarrhine phylogeny Noncoding DNA evidence for a diphyletic origin of the mangabeys and for a human-chimpanzee clade Molecular Phylogenetics and Evolution 1814-25
Podlaha O Zhang JZ (2003) Positive selection on protein-length in the evolution of a primate sperm ion channel Proceedings of the National Academy of Sciences of the United States of America 10012241-12246
Rooney AP Zhang JZ (1999) Rapid evolution of a primate sperm protein Relaxation of functional constraint or positive Darwinian selection Molecular Biology and Evolution 16706-710
Scott MP Weiner AJ (1984) Structural Relationships among Genes That Control Development - Sequence Homology between the Antennapedia Ultrabithorax and Fushi Tarazu Loci of Drosophila Proceedings of the National Academy of Sciences of the United States of America-Biological Sciences 814115-4119
Singer SS Schmitz J Schwiegk C Zischler H (2003) Molecular cladistic markers in New World monkey phylogeny (Platyrrhini Primates) Molecular Phylogenetics and Evolution 26490-501
Smith NGC (2003) Are radical and conservative substitution rates useful statistics in molecular evolution Journal of Molecular Evolution 57467-478
Steiper ME Ruvolo M (2003) New World monkey phylogeny based on X-linked G6PD DNA sequences Molecular Phylogenetics and Evolution 27121-130
Sutton KA Wilkinson MF (1997) Rapid evolution of a homeodomain Evidence for positive selection Journal of Molecular Evolution 45579-588
Suzuki Y Gojobori T (1999) A method for detecting positive selection at single amino acid sites Molecular Biology and Evolution 161315-1328
Suzuki Y Nei M (2002) Simulation study of the reliability and robustness of the statistical methods for detecting positive selection at single amino acid sites Molecular Biology and Evolution 191865-1869
33
Swanson WJ Vacquier VD (1995) Extraordinary Divergence and Positive Darwinian Selection in a Fusagenic Protein Coating the Acrosomal Process of Abalone Spermatozoa Proceedings of the National Academy of Sciences of the United States of America 924957-4961
Swanson WJ Vacquier VD (2002) The rapid evolution of reproductive proteins Nature Reviews Genetics 3137-144
Ting CT Tsaur SC Wu ML Wu CI (1998) A rapidly evolving homeobox at the site of a hybrid sterility gene Science 2821501-1504
Tsaur SC Wu CI (1997) Positive selection and the molecular evolution of a gene of male reproduction Acp26Aa of Drosophila Molecular Biology and Evolution 14544-549
Wayne CM MacLean JA Cornwall G Wilkinson MF (2002) Two novel human X-linked homeobox genes hPEPP1 and hPEPP2 selectively expressed in the testis Gene 3011-11
Wyckoff GJ Wang W Wu CI (2000) Rapid evolution of male reproductive genes in the descent of man Nature 403304-309
Xia X Xie Z (2001) DAMBE Software package for data analysis in molecular biology and evolution Journal of Heredity 92371-373
Yang ZH Nielsen R Goldman N Pedersen AMK (2000) Codon-substitution models for heterogeneous selection pressure at amino acid sites Genetics 155431-449
Zhang JZ (2000) Rates of conservative and radical nonsynonymous nucleotide substitutions in mammalian nuclear genes Journal of Molecular Evolution 5056-68
Zhang JZ (2003) Evolution by gene duplication an update Trends in Ecology amp Evolution 18292-298
Zhang JZ Nei M (1996) Evolution of antennapedia-class homeobox genes Genetics 142295-303
Zhang JZ Nei M (1997) Accuracies of ancestral amino acid sequences inferred by the parsimony likelihood and distance methods Journal of Molecular Evolution 44S139-S146
Zhang JZ Rosenberg HF (2002) Diversifying selection of the tumor-growth promoter angiogenin in primate evolution Molecular Biology and Evolution 19438-445
Zhang JZ Rosenberg HF Nei M (1998) Positive Darwinian selection after gene duplication in primate ribonuclease genes Proceedings of the National Academy of Sciences of the United States of America 953708-3713
34
CHAPTER 2
RAPID EVOLUTION OF PRIMATE ESX1 AN X-LINEKD PLACENTA- AND TESTIS-EXPRESSED HOMEOBOX GENE
21 ABSTRACT
Homeobox genes encode transcription factors that play important roles in various
developmental processes and are usually evolutionarily conserved Here we report a case
of rapid evolution of a homeobox gene in humans and non-human primates ESX1 is an
X-linked homeobox gene primarily expressed in the placenta and testis with
physiological functions in placentafetus development and spermatogenesis ESX1 is
paternally imprinted in mice but is not imprinted in humans We provide evidence for a
significantly higher nonsynonymous substitution rate than synonymous rate in ESX1
between humans and chimps as well as among a total of 15 primate species Population
genetic data also show signals of recent selective sweeps within humans Positive
selection appears to be concentrated in the C-terminal non-homeodomain region which
has been implicated in regulating human male germ cell division by prohibiting the
degradation of cyclins By contrast mouse Esx1 has a substantively different C-terminal
region subject to strong purifying selection These and other results suggest that even the
fundamental process of spermatogenesis has been targeted by positive selection in
primate and human evolution and that mouse may not be a suitable model for studying
human reproduction
35
22 INTRODUCTION
Homeobox genes are characterized by the presence of a sequence motif known as
the homeobox which encodes the ~60-amino-acid homeodomain a helix-turn-helix
DNA binding domain (Gehring et al 1994) In humans there are about 230 homeobox
genes (Nam and Nei 2005) encoding a large family of transcription factors that play key
roles in various developmental processes such as body-plan specification pattern
formation and cell-fate determination (Gehring et al 1994) Due to their functional
importance most homeodomain proteins are evolutionarily highly conserved in sequence
(McGinnis et al 1984 Gehring et al 1994 Zhang and Nei 1996) Hence the
identification of non-conserved homeobox genes would be particularly interesting
because such homeobox genes may regulate important developmental processes that vary
among relatively closely related species Three such rapidly-evolving homeobox genes
are known from fruit flies (OdsH) rodents (Rhox5) and primates (TGIFLX)
respectively OdsH is an X-linked gene involved in spermatogenesis and it is partly
responsible for the hybrid male sterility between Drosophila simulans and D mauritiana
(Ting et al 1998) Mouse Rhox5 (also known as Pem) is expressed in both male and
female reproductive tissues (Sutton and Wilkinson 1997) Targeted disruption of Rhox5
increases male germ cell apoptosis and reduces sperm production sperm motility and
fertility (Maclean et al 2005) In fact Rhox5 is just one member of a recently expanded
homeobox gene cluster known as the Rhox cluster on the mouse X chromosome
(Maclean et al 2005 MacLean et al 2006 Morris et al 2006 Wang and Zhang 2006)
Several other members of the cluster are also expressed in reproductive tissues (Maclean
et al 2005) and evolve rapidly (Jackson et al 2006 Wang and Zhang 2006) TGIFLX is a
36
retroduplicate formed in the common ancestor of primates and rodents by retroposition of
the autosomal gene TGIF2 to the X chromosome and is specifically expressed in the
germ cells of adult testis (Wang and Zhang 2004) Interestingly each of the three cases
involves a homeobox gene that is X-linked and testis-expressed Here we report yet
another case of rapid evolution of an X-linked testis-expressed homeobox gene ESX1
Human ESX1 also known as ESX1L and ESXR1 is a paired-like homeobox gene
located on Xq221 (Fohn and Behringer 2001) ESX1 protein contains two functional
domains the homeodomain and the proline-rich domain (Figure 21A) (Fohn and
Behringer 2001) Esx1 the mouse ortholog has an extra domain known as the PNPF
motif located at the C-terminus (Figure 21B) (Yan et al 2000) In humans ESX1 is
specifically expressed in placenta from 5 weeks of gestation until term (Figueiredo et al
2004) and in adult testis (Fohn and Behringer 2001) A recent study shows decreased
ESX1 expression in human pre-term idiopathic fetal growth restriction a clinically
significant pregnancy disorder in which the fetus fails to achieve its full growth potential
in utero (Murthi et al 2006) In mice Esx1 is also expressed in placenta and testis
(Branford et al 1997 Li et al 1997) More specifically during embryogenesis it is
expressed in the extraembryonic tissues including the endoderm of the visceral yolk sac
the ectoderm of the chorion and subsequently the labyrinthine trophoblast of the
chorioallantoic placenta (Li et al 1997) In adults Esx1 is expressed in male germ cells
only particularly the spermatogoniapreleptotene spermatocytes and round spermatids of
spermatogenic stages IV-VII (Branford et al 1997 Li et al 1997) These restricted
temporal and spatial expression patterns suggest that ESX1Esx1 is involved in placental
development and spermatogenesis Mouse Esx1 is paternally imprinted in the placenta
37
with only the maternally derived allele expressed (Li and Behringer 1998) Heterozygous
female mice inheriting a null Esx1 allele from their mother are born 20 smaller than
normal suggesting that Esx1 is required for placental development and fetal growth in
mice (Li and Behringer 1998) By contrast biparental expression of ESX1 is found in
human placenta (Grati et al 2004)
Our preliminary comparison between human ESX1 and mouse Esx1 proteins
showed an unexpectedly high level of sequence divergence (34) suggesting that the
gene might be evolving rapidly in primates andor rodents as a result of positive
Darwinian selection (Wang and Zhang 2004) Below we first describe the evolutionary
pattern of ESX1 in primates and then compare it to the evolutionary pattern in rodents
We show that positive selection has acted on ESX1 within humans between humans and
chimpanzees and among a large array of primate species whereas purifying selection has
dominated Esx1 evolution in rodents We discuss these evolutionary patterns in light of
the structure and function of the gene
23 RESULTS
231 Comparison of ESX1 sequences between humans and chimps and within
humans
We obtained the ESX1 gene sequence from the chimpanzee genome sequence
(httpgenomewustledu) and compared it with the human ESX1 sequence available in
GenBank (AY114148) The alignment shows a high level of sequence divergence Of the
aligned 406 amino acid sites there are 25 amino acid replacements in addition to two
gaps totaling 12 amino acids (Figure 22) A comparison of synonymous (dS) and
38
nonsynonymous (dN) nucleotide distances between gene sequences can inform us about
the nature and strength of selection acting on a gene A higher dN than dS indicates
positive selection whereas a lower dN than dS indicates negative or purifying selection
The vast majority of genes in the human genome are under negative selection with a
genomic average dNdS ratio of 026 (Bakewell et al 2007) In ESX1 however dN (0031)
is significantly greater than dS (0009) (P = 0028 Fisherrsquos exact test (Zhang et al 1997))
Because the dS value of ESX1 is not significantly different from the genomic average dS
of 0012 (Consortium 2005) the above observation strongly suggests that positive
selection has promoted nonsynonymous substitutions in ESX1 during the divergence
between humans and chimps
To identify the regions where positive selection has been operating we divided the
ESX1 protein sequence into three segments the N-terminus homeodomain and
C-terminus (Figure 22) The homeodomain is completely identical in amino acid
sequence between human and chimp and thus has not been targeted by positive selection
(dN = 0 dS = 0019 P = 029 Fisherrsquos exact test) In the N-terminus dN (0024) and dS (0)
are not significantly different (P = 01) and hence neutrality cannot be rejected In the
C-terminus however dN (0047) is significantly greater than dS (0012) (P = 0035) Thus
positive selection has been concentrated in the C-terminus As aforementioned the
C-terminus is mainly composed of proline-rich repeats The two alignment gaps between
human and chimp also occur in the C-terminus (Figure 22) Compared to the human
sequence the chimp sequence lost a complete nine-amino-acid repeat and part of another
repeat
39
To further examine whether the positive selection might have happened in the
recent history of human evolution we sequenced exon 4 of ESX1 in 32 unrelated male
humans of diverse geographic origins (4 Pygmy Africans 6 African Americans 12
Caucasians 3 Southeast Asians 2 Chinese 2 Pacific Islanders and 3 Andes Indians)
Exon 4 encodes 14 amino acids of the homeodomain corresponding roughly to the third
helix of the homeodomain and the complete C-terminus of ESX1 the likely target of
positive selection (Figures 21 and 22) From the 32 alleles we observed 4
insertiondeletion (indel) polymorphisms and 9 single nucleotide polymorphisms (SNPs)
All of these polymorphisms occur in the C-terminus (non-homeodomain) region and
none of them disrupt the open reading frame (Figure 22) Table 21 lists the
polymorphisms and their associated allele frequencies The polymorphic data allow us to
compute the level of DNA polymorphism in exon 4 Nucleotide diversity per sequence (π)
is 0897 and Wattersonrsquos polymorphism per sequence (θ) is 127 A comparison between
expected and observed distributions of allelic frequencies can tell us whether a genomic
region is likely to have been subject to recent selective sweeps which render π lower than
θ and high-frequency alleles enriched generating negative values of Tajimarsquos D (Tajima
1989) and Fay and Wursquos H (Fay and Wu 2000) Combining the information from D and
H Zeng and colleagues recently invented a new test known as the DH test of positive
selection (Zeng et al 2006) This test is superior to the individual D and H tests because
it is more powerful and is insensitive to common confounding factors such as background
selection population growth and population subdivision (Zeng et al 2006) We found
that the DH test rejects the neutral hypothesis for the exon 4 sequences of 32 humans
(Plt0039) For samples with African Caucasian and Asian origins the tail probability of
40
the DH test is 0067 031 and 026 respectively Thus selective sweeps might have
occurred among Africans Consistent with this result the H test also yields a significant
result for the African samples (P=0044) and this P value is lower than 128 of the 132
genes that were recently surveyed in Africans (Akey et al 2004) In other words ESX1 is
among the bottom 3 of human genes for H value in Africans These results support the
hypothesis of recent selective sweeps at human ESX1 or linked genomic regions We also
sequenced exons 1 2 and 3 of ESX1 in 8 male humans with diverse geographic origins
(1 Pygmy African 3 African Americans 1 Caucasian 2 Chinese and 1 Pacific Islander)
but observed no polymorphisms
232 Positive selection at the C-terminus of ESX1 in many primates
To examine whether ESX1 has also been under positive selection in other primates
we obtained the rhesus monkey ESX1 gene sequence by searching its recently completed
draft genome sequence (httpwwwncbinlmnihgov) We then sequenced exon 4 of
ESX1 in 12 additional primate species including three hominoids four Old World
monkeys and five New World monkeys (see Materials and Methods) Together with the
three known sequences from human chimp and rhesus a total of 15 primate sequences
of exon 4 were conceptually translated and aligned by Clustal W with manual adjustment
DNA sequences were subsequently aligned by following the protein alignment (Figure
23A) A gene tree of the 15 sequences was reconstructed using the neighbor-joining
method (Saitou and Nei 1987) The tree topology is consistent with the known species
tree suggesting that the sequences analyzed are orthologous to each other We found that
the length of exon 4 is highly variable among species The shortest proline-rich repeat
41
region is found in marmoset and tamarin while the longest is observed in orangutan The
nine-amino-acid repeat unit has variable sequences among the primate species although
proline is always the most frequent amino acid
To examine the potential action of positive selection in exon 4 of primate ESX1 we
computed pairwise dN and dS among the 15 sequences Excluding alignment gaps we
analyzed a total of 312 nucleotide sites Higher dN than dS is observed in 79 (752) of
105 pairwise comparisons (Figure 24A) There is no apparent difference in this pattern
among hominoids Old World monkeys and New World monkeys When only the
(non-homeodomain) C-terminus is analyzed 86 (819) comparisons showed dN gt dS
(Figure 24B) In our dataset the average dS is 012 between hominoids and Old World
monkeys 018 between hominoids and New World monkeys and 016 between Old World
monkeys and New World monkeys All three numbers are greater than the corresponding
values (008 012 and 015 respectively) previously estimated from multiple different
intron and noncoding sequences of the same species pairs (Li 1997) Thus the
synonymous substitution rate of ESX1 is not reduced and the overall higher dN over dS
suggests positive selection
Due to the occurrence of many indels in the proline-rich region of primate ESX1
the sequence alignment may not be reliable Because closely related species are more
likely to share the same repeat sequence which facilitates alignment we made separate
alignments for hominoids Old World monkeys and New World monkeys respectively
(Figure 25) The dN and dS values were then computed for species pairs within each of
the three groups It happened that each of the three groups has 5 species Of the 30
42
pairwise comparisons 23 (767) show dN gt dS This finding is similar to the above
result when all 15 sequences are aligned and analyzed together
To test positive selection in primate ESX1 more rigorously we conducted a
phylogeny-based analysis (22) We inferred the ancestral sequences for the C-terminus at
all interior nodes of the primate tree (Figure 26) using PAML (Yang 1997) and then
counted the numbers of nonsynonymous and synonymous substitutions on each tree
branch We found that the ratio of the total number of nonsynonymous substitutions and
that of synonymous substitutions over all branches of the tree equals ns = 13938 = 366
significantly greater than the expected value of NS=17793=190 (P=0002 Fisherrsquos
exact test) Here N and S are the numbers of nonsynonymous and synonymous sites
respectively in the C-terminus
We also conducted a likelihood-based analysis to detect positive selection on
individual codons within the C-terminus using PAML We compared the null model M8a
with the alternative model M8 M8a introduced by Swanson et al (Swanson et al 2003)
assumes that the dNdS ratio of individual codons follows a beta distribution between 0
and 1 with an extra class of codons with fixed dNdS of 1 M8 is identical to M8a except
for the presence of an additional class of codons with any dNdS M8 is found to fit the
data significantly better than M8a (χ2 = 4963 df = 2 P lt 10-10) M8 suggests that ~66
of codons in the C-terminus have been subject to positive selection with dNdS = 404
Analysis using another pair of models M1a and M2a also supports a large proportion of
codons under positive selection (χ2 = 4977 df = 2 P lt 10-10) Taken together various
analyses provide strong evidence that positive selection has acted in the C-terminus of
primate ESX1 to promote amino acid substitutions We note that although sequence
43
alignment is not easy for ESX1 alignment errors cannot render dN significantly greater
than dS because even when the alignment is completely random dN is expected to be
equal to dS
233 Purifying selection on rodent Esx1
To test whether positive selection on ESX1 extends to non-primate mammals we
turn to rodents We first obtained the Esx1 gene sequence of Mus musculus from
GenBank and determined the sequence of exons 2 and 4 of Esx1 from M spretus Coding
for only two and 15 amino acids respectively exons 1 and 3 are not studied here Esx1
possesses a unique PFPN motif at its C-terminus consisting of PF
(proline-phenylalanine) tandem repeats followed by PN (proline-asparagine) tandem
repeats (Figure 21B) An earlier study found that the PFPN motif can inhibit both
nuclear localization and DNA binding activity of the Esx1 protein (Yan et al 2000) A
comparison of exons 2 and 4 sequences of M musculus and M spretus shows strong
purifying selection on Esx1 as dN (0006) is significantly lower than dS (0032) (P = 001
Fisherrsquos exact test) Exon 4 was also sequenced in M cervicolor and M cookii (Figure
23B) Significantly lower dN than dS is observed in all pairwise comparisons among the
four Mus species with the exception of the comparison between M cervicolor and M
cookii probably owing to the small number of substitutions involved (Figure 24C)
Sequence length variation is observed in the PNPF motif but not in the proline-rich
region Overall our results suggest that Esx1 has been subject to purifying selection in
the Mus genus of rodents
44
24 DISCUSSION
In this work we provide evidence for positive selection acting in the C-terminus
region of the homeodomain-containing protein ESX1 during primate evolution as well as
in human populations In adult humans ESX1 is primarily expressed in testis A previous
study showed that ESX1 is proteolytically processed into a 45-kDa N-terminal fragment
(including the homeodomain) and a 20-kDa C-terminal fragment The C-terminal
fragment is found in cytoplasm and can inhibit the degradation of cyclin A and B1
causing cell-cycle arrest in human cells (Ozawa et al 2004) Cyclins are a family of
proteins controlling transitions through different phases of the cell cycle Thus it has
been proposed that the C-terminal fragment of ESX1 plays a role in spermatogenesis
functioning as a checkpoint in male germ cell division (Ozawa et al 2004) In contrast
the N-terminal fragment including the homeodomain functions as a transcriptional
repressor in nucleus (Ozawa et al 2004 Yanagihara et al 2005) Our observations of
conserved sequences in the N-terminal fragment but rapid sequence changes in the
C-terminal fragment are explainable by the distinct functions of the two regions The
finding of positive selection in the C-terminus of primate ESX1 suggests that even in the
recent past of human and primate evolution spermatogenesis has been subject to adaptive
modifications (Wyckoff et al 2000) Because different species reach sexual maturity at
different ages the optimal time of germ cell division may also vary among species The
observed positive selection on ESX1 may reflect such adaptations in individual species
In general our finding is consistent with many reports of rapid evolution of proteins
involved in animal male reproduction (Swanson and Vacquier 2002) Furthermore
mammalian sperm proteins on the X chromosome have been found to evolve faster than
45
those on autosomes (Torgerson and Singh 2003) Thus the rapid evolution of ESX1 is
likely related to its role in spermatogenesis as well as its location in the X chromosome
Interestingly male mice with null Esx1 are fertile indicating that Esx1 is not
essential for spermatogenesis in mice (Li and Behringer 1998) The observation of
purifying selection acting on the C-terminal region of Esx1 in mice may be explained by
the fact that the gene function has changed between primates and rodents It is likely that
Esx1 is more important for placenta development rather than spermatogenesis in mice (Li
and Behringer 1998) Biochemical studies also showed that the nuclear localization of
mouse Esx1 is regulated by the presence of the PFPN motif (Yan et al 2000) which is
lacking in primate ESX1 further suggesting functional differences between primate
ESX1 and rodent Esx1 To examine the C-terminal sequence of ESX1 in other mammals
we TBLASTN-searched the GenBank with human ESX1 and mouse Esx1 as queries We
found putative orthologous Esx1 genes in rat dog and cow In horse only a partial
sequence was identified by WISE2 (httpwwwebiacukWise2) We did not find Esx1
orthologs in opossum and chicken genome sequences The estimated dNdS ratio between
mouse and rat in the C-terminal region of Esx1 is significantly lower than 1 (Plt001)
consistent with our findings in the Mus genus Rat Esx1 has a similar domain structure as
mouse Esx1 with the exception that all of the PF repeats are replaced by PN repeats in
the PFPN motif By contrast the C-terminus of cow and horse Esx1 proteins is similar to
that of primates with the proline-rich region but not the PFPN motif The putative Esx1
in dog has neither the proline-rich region nor the PFPN motif at its C-terminus It seems
likely that the PFPN motif was acquired by Esx1 in rodent evolution
46
The different evolutionary patterns of primate ESX1 and rodent Esx1 suggest that
the utility of the mouse model for studying human reproduction may be limited Previous
studies also reported several other reproduction-related genes that show substantive
human-mouse differences For example SED1 a protein involved in sperm-egg binding
in mice has lost an important protein-protein binding domain in ancestral primates
which was accompanied by rapid sequence changes in another domain by positive
selection (Podlaha et al 2006) In another example three human X-linked homeobox
genes PEPP1 PEPP2 and PEPP3 correspond to a cluster to 30 Rhox genes in mouse
due to dramatic expansions of the gene cluster in rodent evolution (Wang and Zhang
2006) The mouse Rhox genes are expressed in male and female reproductive tissues and
at least one of them (Rhox5) is involved in male reproduction evident from reduced
fertilities of Rhox5-knockout mice (Maclean et al 2005)
Esx1 is paternally imprinted in mouse placenta and is functionally important to
placenta morphogenesis and fetal growth (Li et al 1997 Li and Behringer 1998) In
contrast ESX1 is not imprinted in human placenta (Grati et al 2004) Imprinting is an
important regulatory pathway involved in the development and function of the placenta in
eutherian mammals The imprinting of Esx1 is consistent with the general phenomenon in
mice that the paternally derived X chromosome is preferentially inactivated in placental
tissues of female embryos (West et al 1977 Wagschal and Feil 2006) Recently Monk
and colleagues reported that several human orthologs of mouse placenta-imprinted genes
are un-imprinted (Monk et al 2006) In addition an earlier investigation revealed a
widespread reduction in the maintenance of imprinting in humans (Morison et al 2005)
If imprinted genes tend to be involved in intra-genomic conflict and hence evolve rapidly
47
by arms race (Haig 1993) our observation of rapid evolution of the un-imprinted primate
ESX1 but slow evolution of imprinted rodent Esx1 is unexpected While a change in
spermatogenesis function might explain the unexpected evolutionary pattern for
ESX1Esx1 in the future it would be interesting to test the genomic conflict hypothesis
by comparing the evolutionary rates of all mouse imprinted genes with those of their
un-imprinted human orthologs
25 MATERIALS AND METHODS
251 DNA samples
One individual from each of 12 primate species 32 male humans one Mus spretus
one Mus cookie and one Mus cervicolor were surveyed The 12 primate species include
three hominoids (gorilla Gorilla gorilla orangutan Pongo pygmaeus and gibbon
Hylobates lar) four Old World monkeys (green monkey Cercopithecus aethiops langur
Pygathrix nemaeus talapoin Miopithecus talapoin and baboon Papio hamadryas) and
five New World monkeys (marmoset Callithrix jacchus tamarin Saguinus oedipus owl
monkey Aotus trivirgatus squirrel monkey Saimiri sciureus and woolly monkey
Lagothrix lagotricha) The animal DNA samples were from (Wang and Zhang 2004) and
(Podlaha et al 2005) whereas the human DNA samples were purchased from Coriell
(httpccrcoriellorg)
252 Gene amplification and DNA sequencing
The amplified ESX1 regions in different species and the primers used for
amplification are described in Table 22 Primers were designed according to the
48
published human (NT_011651) and mouse (NM_007957) sequences Polymerase chain
reactions (PCRs) were performed with MasterTaq or TripleMasterTaq under conditions
recommended by the manufacturer (Eppendorf Hamburg Germany) DMSO (Dimethyl
sulfoxide) was used in PCR amplification and DNA sequencing of exon 4 Amplified
exon 4 sequences from 12 primates were cloned into PCR4TOPO vector (Invitrogen) and
then sequenced from both directions Other PCR products were purified and directly
sequenced from both directions The dideoxy chain termination method was used in DNA
sequencing by an automated sequencer Sequencher (GeneCodes) was used to assemble
the sequences and identify DNA polymorphisms in humans
253 Human population genetic analysis
The DH test was conducted by program DHjar (Zeng et al 2006) The population
recombination rate used in the test was estimated to be R=3Nr
=3times10000times(018times10-6times723) = 4 per sequence per generation Here N =10000 is the
effective population size of humans 018times10-6 is the pedigree-based recombination rate
per generation per nucleotide at the ESX1 locus (Kong et al 2002) and 723 is the number
of nucleotides of the human ESX1 exon 4 sequence For samples of African Caucasian
and Asian origins we used N =10000 4000 and 4000 respectively as their effective
population sizes (Tenesa et al 2007) The chimpanzee ESX1 sequence was used as the
outgroup in computing DH except for one site where the gorilla sequence was used as the
outgroup because the chimpanzee sequence is different from both human alleles P values
in the DH test and H test were estimated using 100000 replications of coalescent
simulation
49
50
254 Evolutionary analysis
The coding sequences of human ESX1 and mouse Esx1 were obtained from
GenBank with accession numbers AY114148 and NM_007957 respectively Clustal W
(Thompson et al 1994) was used to conduct sequence alignment for the primates and the
Mus species respectively MEGA3 (Kumar et al 2004) was used for phylogenetic
analysis Pairwise synonymous (dS) and nonsynonymous (dN) distances were calculated
using the modified Nei-Gojobori method (Zhang et al 1998) with estimated
transitiontransversion ratios Based on the phylogeny of 15 primates we inferred
ancestral ESX1 sequences at all interior nodes of the tree by using the likelihood method
under the M8 model in PAML315 (Yang 1997) The number of synonymous (s) and
nonsynonymous (n) substitutions on each branch of the tree were then counted The
numbers of synonymous (S) and nonsynonymous (N) sites were also estimated by
PAML
26 ACKNOWLEDGEMENTS
We thank Kai Zeng for assistance with the DH test and Meg Bakewell Soochin
Cho and Ondrej Podlaha for valuable comments This work was supported by research
grants from the University of Michigan and National Institutes of Health to JZ
Figure 21 Structures of the orthologous (A) human ESX1 and (B) mouse Esx1 genes adapted from (Fohn and Behringer 2001) and (Li et al 1997) Exons are boxed with coding regions shown in grey and homeobox shown by hatches The approximate length of each intron is given in parentheses Pro-rich and PNPF motifs are indicated underneath the gene structure
100 bp
A (02 kb (13 kb) (19 kb) Pro-rich
51
B
(08 kb) (1 kb) (13 kb)
Pro-rich PNPF
Figure 22 Alignment of human and chimpanzee ESX1 protein sequences The human sequence is from GenBank (accession number AY114148) The homeodomain is boxed Single nucleotide polymorphisms (SNPs) detected in humans are shaded For each nonsynonymous SNP the alternative amino acid is shown above the human sequence For each synonymous SNP no alternative amino acid is shown Triangles indicate indel polymorphisms observed in humans with deletions shown by triangles pointing upwards and insertions shown by triangles pointing downwards The width of the triangle shows the size of the indel ldquordquo indicates identity to the human sequence and ldquo-rdquo indicates a gap
52
Figure 23 Protein sequence alignment for exon 4 of ESX1 (Esx1) in (A) 12 primates and (B) 4 Mus species ldquordquo indicates identity to the first sequence in each alignment ldquo-rdquo indicates an alignment gap and ldquordquo indicates a stop codon The partial homeodomain region is indicated ldquoOWrdquo Old World ldquoNWrdquo New World
53
Figure 24 Pairwise synonymous (dS) and nonsynonymous (dN) nucleotide distances for (A) the entire exon 4 of ESX1 among 15 primates (B) the C-terminal non-homeodomain region of ESX1 among 15 primates and (C) the exon 4 of Esx1 among 4 Mus species
A
0
01
02
03
0 01 02 03
dN
dS B
0
01
02
03
0 01 02 03
dN
dS C
0
01
02
03
0 01 02 03
dN
dS
54
Figure 25 Separate alignments of translated ESX1 exon 4 of (A) hominoids (B) Old World monkeys and (C) New World monkeys ldquordquo indicates identity to the top sequence ldquo-rdquo indicates a gap and ldquordquo indicates a stop codon A Human VWFQNRRAKW KRNQRVLMLR NTATADLAHP LDMFLGGAYY AAPALDPALC VHLVPQLPRP PVLPVPPMPP Chimpanzee ---------- VE MEV Gorilla A SN A Orangutan IATR SN L Gibbon IAA ETPD F MEI S Human RPPMVPMPPR PPIAPMPP-- -MAPVPPGSR MAPVPPGPRM APVPPWPPMA PVPPWPPMAP VPTGPPMAPV Chimpanzee ---Q -- -PH W PW Gorilla Q -- -P C G G PRM Orangutan Q MGP RP GRV GR MP Gibbon GQG MGP PPC M GV HMGVH MPVHM Human P--------- PGPPMARVPP GPPMARVPPG PPMAPLPPGP PMAPLPP--- GPPMAPLPPG PPMAPLPPRS Chimpanzee --------- --------- PW V V--- WV MP Gorilla --------- --------- P RV V--- V VAGP Orangutan --------- M L G GMAL V MP Gibbon --------- --------- TPM V M--- V LVMP Human HVPHTGLAPV HITWAPVINS YYACPFF Chimpanzee ---- ---------- -------- Gorilla PT R Orangutan RP R G Gibbon R G
B Baboon VWFQNRRAKW KRNQRVLMLR NIAAAALARP TEVFLGGPYN ATPSLDPALC VHLVPQLPRP PVPPMPPRPP Green monkey Rhesus monkey A Langur Y VP A MT Talapoin A T Q Baboon MVPMQPRP-- ---------- PMAPVPPRPP MVPMQPRPPM VRMP------ ---------P RPPMAPVPTG Green monkey PM APMPPGPPRP ------ --------- P Rhesus monkey PM APMPPGP--- G V ------ --------- P Langur PGPM APMPPGP--- SVM V HPMAPVP PGPSMAPMP VVMQPR Talapoin AP-- ---------- V ------ --------- P Baboon PPMVPMPPRP PMAPVPPRPP MAPMPPRPPV PRIGLAPVRI TWAPVINSYY AGPFF Green monkey --- --- Rhesus monkey Langur H T Talapoin
C Marmoset VWFQNRRAKW RRNQRMLM-R NVAALALAPA VEMILGAPYD AVPVLDPAWC VHLAPR---P PRPPVAPVPH Tamarin - H --- Owl monkey T L MDDP VDM QPLG GVMP Squirrel monkey L MAPVP V NQ--- PMQP Woolly monkey L LA V Q--- QLMAP Marmoset TAP------- --MPAGP--- PMAP------ ---------- ---------- ---------- ---MPVGPPM Tamarin M------- ----- ------ ---------- ---------- ---------- --- Owl monkey MAQARPPM AGPVV PGAPMAP MPPMARTQAR PPMARMQARP PMAGMPAGPP VVPPA Squirrel monkey MMQARPPM AGR--- P------ ---------- ---------- ---------- ---PEQ Woolly monkey MQAGPP---I AG--- ------ ---------- ---------- ---------- ---P Marmoset APMPPGPPVV PMPPGAPMP- HFGLAPVGIA WAPFNNSYYV GPFF Tamarin - Owl monkey R- DIQL VIGH Squirrel monkey --- R- YIT VIG Y Woolly monkey AA RH I VIG R
55
Figure 26 Numbers of synonymous (s) and nonsynonymous (n) substitutions in the evolution of primate ESX1 Shown on each branch are the n and s values for the C-terminal non-homeodomain region The numbers of nonsynonymous (N) and synonymous (S) sites for the same region are also given
n s = 13938 N S = 17793 (nN) (sS) = 192 20
3151
5151
41
61
83
143
10
00286
0010
235
153
61
1000
00
41
0020
20
8282
41
Human Chimpanzee Gorilla Orangutan
Gibbon Rhesus monkey Baboon African green monkey Talapoin Langur Marmoset Tamarin Owl monkey Squirrel monkey Woolly monkey
Hominoids
Old World monkeys
New World monkeys
56
Table 21 ESX1 exon 4 sequence variations among 32 men The position of each polymorphism follows the GenBank sequence AY114148 starting from the first nucleotide of exon 4 The polymorphisms and their corresponding allele frequencies are given For each polymorphism we present the allele from the GenBank sequence followed by the deviating allele Polymorphisms are classified into synonymous (s) nonsynonymous (n) insertion (i) and deletion (d) types The indel length in nucleotides is shown for each indel polymorphism
Nucleotide position
Polymorphism Type Frequency
68 C(Ala)T(Val) n 097003 164 C (Pro)T (Leu) n 097003
361-387 27- d 097003 407 C(Pro)G(Arg) n 094006 447 G(Gly)C(Gly) s 097003
460-486 27- d 094006 488 C(Pro)G(Arg) n 059041 490 C(Leu)G(Val) n 059041 504 G(Pro)A(Pro) s 097003
After 513 -27 i 097003 before 514 -27 i 037063
549 A(Pro)G(Pro) s 097003 571 C(Leu)G(Val) n 094006
57
Table 22 Primers used for amplifying different exons of ESX1 in primates and Esx1 in Mus species
Species Primers Exons amplified Length (bp) L 5-tgcctcactcgctttaccctagt-3 R 5-tgcacagctttatcgacagcgc-3 Exons 1 and 2 424
L 5-tggagagaaagacagatacag-3 R 5-atccacaactccaaatactg-3 Exon 3 46 Human
L 5-cacaatttctatctggcagg-3 R 5-atagcttcacctgttgcagt-3 642669696723
Gorilla L 5-agcatctaacgaattacttg-3 R 5-aaagtctcagtggcatatag-3 642
Orangutan 687 Gibbon
L 5-ccaacgtactattaagtcac-3 R 5-ctcctctaagatatttcagc-3 651
Rhesus monkey 534 Baboon 507
African green monkey 525 Talapoin 507 Tamarin 387
Marmoset 387 Squirrel monkey 408 Woolly monkey 411
Owl monkey
L 5-cacaatttctatctggcagg-3 R 5-aaagtctcagtggcatatag-3
552
Langur L 5-ccaacgtactattaagtcac-3 R 5-atagcttcacctgttgcagt-3
Exon 4
579
Mus spretus L 5-caccaacgagctggtcttg-3 R 5-agtctgcctgccacatggt-3 Exon 2 436
Mus spretus 450 Mus cervicolor 402
Mus cookii
L 5-gacattcatggtccaatatcc-3 R 5-gcgtgatagtgtttacaaacg-3 Exon 4
396
58
27 LITERATURE CITED
Akey JM Eberle MA Rieder MJ Carlson CS Shriver MD Nickerson DA Kruglyak L (2004) Population history and natural selection shape patterns of genetic variation in 132 genes PLoS Biol 2e286
Bakewell MA Shi P Zhang J (2007) More genes underwent positive selection in chimpanzee evolution than in human evolution Proc Natl Acad Sci USA 104in press
Branford WW Zhao GQ Valerius MT Weinstein M Birkenmeier EH Rowe LB Potter SS (1997) Spx1 a novel X-linked homeobox gene expressed during spermatogenesis Mechanisms of development 6587-98
Consortium CSaA (2005) Initial sequence of the chimpanzee genome and comparison with the human genome Nature 43769-87
Fay JC Wu CI (2000) Hitchhiking under positive Darwinian selection Genetics 1551405-1413
Figueiredo AL Salles MG Albano RM Porto LC (2004) Molecular and morphologic analyses of expression of ESX1L in different stages of human placental development J Cell Mol Med 8545-550
Fohn LE Behringer RR (2001) ESX1L a novel X chromosome-linked human homeobox gene expressed in the placenta and testis Genomics 74105-108
Gehring WJ Affolter M Burglin T (1994) Homeodomain proteins Annual review of biochemistry 63487-526
Grati FR Sirchia SM Gentilin B Rossella F Ramoscelli L Antonazzo P Cavallari U Bulfamante G Cetin I Simoni G Miozzo M (2004) Biparental expression of ESX1L gene in placentas from normal and intrauterine growth-restricted pregnancies Eur J Hum Genet 12272-278
Haig D (1993) Genetic conflicts in human pregnancy The Quarterly review of biology 68495-532
Jackson M Watt AJ Gautier P Gilchrist D Driehaus J Graham GJ Keebler J Prugnolle F Awadalla P Forrester LM (2006) A murine specific expansion of the Rhox cluster involved in embryonic stem cell biology is under natural selection BMC genomics 7212
Kong A Gudbjartsson DF Sainz J Jonsdottir GM Gudjonsson SA Richardsson B Sigurdardottir S Barnard J Hallbeck B Masson G Shlien A Palsson ST Frigge ML Thorgeirsson TE Gulcher JR Stefansson K (2002) A high-resolution recombination map of the human genome Nature genetics 31241-247
Kumar S Tamura K Nei M (2004) MEGA3 Integrated software for Molecular Evolutionary Genetics Analysis and sequence alignment Brief Bioinform 5150-163
Li W (1997) Molecular Evolution Sinauer Sunderland Mass Li Y Behringer RR (1998) Esx1 is an X-chromosome-imprinted regulator of placental
development and fetal growth Nat Genet 20309-311 Li Y Lemaire P Behringer RR (1997) Esx1 a novel X chromosome-linked homeobox
gene expressed in mouse extraembryonic tissues and male germ cells Dev Biol 18885-95
59
Maclean JA 2nd Chen MA Wayne CM Bruce SR Rao M Meistrich ML Macleod C Wilkinson MF (2005) Rhox a new homeobox gene cluster Cell 120369-382
MacLean JA 2nd Lorenzetti D Hu Z Salerno WJ Miller J Wilkinson MF (2006) Rhox homeobox gene cluster recent duplication of three family members Genesis 44122-129
McGinnis W Hart CP Gehring WJ Ruddle FH (1984) Molecular cloning and chromosome mapping of a mouse DNA sequence homologous to homeotic genes of Drosophila Cell 38675-680
Monk D Arnaud P Apostolidou S Hills FA Kelsey G Stanier P Feil R Moore GE (2006) Limited evolutionary conservation of imprinting in the human placenta Proc Natl Acad Sci U S A 1036623-6628
Morison IM Ramsay JP Spencer HG (2005) A census of mammalian imprinting Trends Genet 21457-465
Morris L Gordon J Blackburn CC (2006) Identification of a tandem duplicated array in the Rhox alpha locus on mouse chromosome X Mamm Genome 17178-187
Murthi P Doherty VL Said JM Donath S Brennecke SP Kalionis B (2006) Homeobox gene ESX1L expression is decreased in human pre-term idiopathic fetal growth restriction Mol Hum Reprod 12335-340
Nam J Nei M (2005) Evolutionary change of the numbers of homeobox genes in bilateral animals Molecular biology and evolution 222386-2394
Ozawa H Ashizawa S Naito M Yanagihara M Ohnishi N Maeda T Matsuda Y Jo Y Higashi H Kakita A Hatakeyama M (2004) Paired-like homeodomain protein ESXR1 possesses a cleavable C-terminal region that inhibits cyclin degradation Oncogene 236590-6602
Podlaha O Webb DM Tucker PK Zhang J (2005) Positive Selection for Indel Substitutions in the Rodent Sperm Protein Catsper1 Molecular biology and evolution 221845-1852
Podlaha O Webb DM Zhang J (2006) Accelerated evolution and loss of a domain of the sperm-egg-binding protein SED1 in ancestral primates Molecular biology and evolution 231828-1831
Saitou N Nei M (1987) The neighbor-joining method a new method for reconstructing phylogenetic trees Molecular biology and evolution 4406-425
Sutton KA Wilkinson MF (1997) Rapid evolution of a homeodomain evidence for positive selection J Mol Evol 45579-588
Swanson WJ Nielsen R Yang Q (2003) Pervasive adaptive evolution in mammalian fertilization proteins Mol Biol Evol 2018-20
Swanson WJ Vacquier VD (2002) The rapid evolution of reproductive proteins Nat Rev Genet 3137-144
Tajima F (1989) Statistical method for testing the neutral mutation hypothesis by DNA polymorphism Genetics 123585-595
Tenesa A Navarro P Hayes BJ Duffy DL Clarke GM Goddard ME Visscher PM (2007) Recent human effective population size estimated from linkage disequilibrium Genome Research 17520-526
Thompson JD Higgins DG Gibson TJ (1994) CLUSTAL W improving the sensitivity of progressive multiple sequence alignment through sequence weighting
60
position-specific gap penalties and weight matrix choice Nucleic acids research 224673-4680
Ting CT Tsaur SC Wu ML Wu CI (1998) A rapidly evolving homeobox at the site of a hybrid sterility gene Science 2821501-1504
Torgerson DG Singh RS (2003) Sex-linked mammalian sperm proteins evolve faster than autosomal ones Mol Biol Evol 201705-1709
Wagschal A Feil R (2006) Genomic imprinting in the placenta Cytogenet Genome Res 11390-98
Wang X Zhang J (2004) Rapid evolution of mammalian X-linked testis-expressed homeobox genes Genetics 167879-888
Wang X Zhang J (2006) Remarkable expansions of an X-linked reproductive homeobox gene cluster in rodent evolution Genomics 8834-43
West JD Frels WI Chapman VM Papaioannou VE (1977) Preferential expression of the maternally derived X chromosome in the mouse yolk sac Cell 12873-882
Wyckoff GJ Wang W Wu CI (2000) Rapid evolution of male reproductive genes in the descent of man Nature 403304-309
Yan YT Stein SM Ding J Shen MM Abate-Shen C (2000) A novel PFPN motif inhibits nuclear localization and DNA binding activity of the ESX1 homeoprotein Mol Cell Biol 20661-671
Yanagihara M Ishikawa S Naito M Nakajima J Aburatani H Hatakeyama M (2005) Paired-like homeoprotein ESXR1 acts as a sequence-specific transcriptional repressor of the human K-ras gene Oncogene 245878-5887
Yang Z (1997) PAML a program package for phylogenetic analysis by maximum likelihood Comput Appl Biosci 13555-556
Zeng K Fu YX Shi S Wu CI (2006) Statistical tests for detecting positive selection by utilizing high-frequency variants Genetics 1741431-1439
Zhang J Kumar S Nei M (1997) Small-sample tests of episodic adaptive evolution a case study of primate lysozymes Molecular biology and evolution 141335-1338
Zhang J Nei M (1996) Evolution of Antennapedia-class homeobox genes Genetics 142295-303
Zhang J Rosenberg HF Nei M (1998) Positive Darwinian selection after gene duplication in primate ribonuclease genes Proc Natl Acad Sci U S A 953708-3713
61
CHAPTER 3
RELAXATION OF SELECTIVE CONSTRAINT AND LOSS OF FUNCTION IN THE EVOLUTION OF HUMAN BITTER TASTE RECEPTOR GENES
31 ABSTRACT
Bitter taste perception prevents mammals from ingesting poisonous substances
because many toxins taste bitter and cause aversion We hypothesize that human bitter
taste receptor (TAS2R) genes might be relaxed from selective constraints because of the
change in diet use of fire and reliance on other means of toxin avoidance that emerged
in human evolution Here we examine the intraspecific variations of all 25 genes of the
human TAS2R repertoire Our data show hallmarks of neutral evolution including
similar rates of synonymous (dS) and nonsynonymous (dN) nucleotide changes among
rare polymorphisms common polymorphisms and substitutions no variation in dNdS
among functional domains segregation of pseudogene alleles within species and
fixation of loss-of-function mutations These results together with previous findings of
large numbers of loss-of-function mutations in olfactory pheromonal and visual
sensory genes in humans suggest surprisingly reduced sensory capabilities of humans
in comparison to many other mammals
32 INTRODUCTION
Humans and most mammals can perceive and discriminate among five major
taste modalities sweet sour bitter salty and umami (the taste of sodium glutamate)
62
(Kinnamon and Cummings 1992 Lindemann 1996) Among these bitter perception has
a special role of preventing animals from ingesting poisonous substances because many
toxins taste bitter and cause aversion (Garcia and Hankins 1975 Glendinning 1994)
The sense of the bitter taste begins by binding of bitter compounds to bitter taste
receptors that are found on the surface of the taste receptor cells of the tongue and
palate epithelium (Lindemann 1996 Chandrashekar et al 2000) The receptors are
encoded by a large family of seven-transmembrane G protein-coupled receptor genes
named TAS2Rs (or T2Rs) and the roles of TAS2Rs in bitter taste have been demonstrated
by both in vitro and in vivo functional assays (Adler et al 2000 Chandrashekar et al
2000 Matsunami et al 2000 Bufe et al 2002 Behrens et al 2004) Unlike visual
pigment genes or olfactory receptor genes for which only one gene is expressed in each
visual or olfactory receptor cell multiple TAS2R genes are found to be expressed in
each bitter taste receptor cell in rodents providing a plausible explanation for the
uniform taste of many structurally distinct toxins (Chandrashekar et al 2000) TAS2R
genes do not contain introns in their protein-coding regions which facilitated their
detection in sequenced genomes Twenty-five putatively functional TAS2R genes (with
open reading frames [ORFs]) and 8 pseudogenes (with disrupted ORFs) have been
identified from the human genome sequence and they are mapped to chromosomes 5 7
and 12 (Shi et al 2003) In comparison the mouse genome contains 33 functional
Tast2r genes and 3 pseudogenes (Shi et al 2003) A phylogenetic analysis of these
genes suggested considerable variation in the TAS2R repertoire among different
mammalian lineages (Shi et al 2003) Although only a minority of these TAS2R genes
has been functionally characterized their chromosomal location sequence similarity
63
and phylogenetic relationships strongly suggest that they are involved in bitter
perception
Because TAS2Rs are directly involved in the interaction between mammals and
their dietary sources it is likely that the evolution of these proteins responds to and
reflects dietary changes in organismal evolution For example there were significant
changes in diet during human evolution (Harris 1992 Leonard 2002 Milton 2003) In
particular the amount of meat in hominid diet began to increase about 2 million years
(MY) ago while the amount of plant materials decreased (Harris 1992 Leonard 2002
Milton 2003) This dietary shift may have caused a reduction in the importance of bitter
taste and TAS2R genes because animal tissues contain fewer bitter and toxic compounds
than plant tissues (Glendinning 1994) Detoxification of poisonous foods by controlled
use of fire starting ~08 MY ago (Goren-Inbar et al 2004) may trigger a further
functional relaxation in TAS2Rs We thus hypothesize that patterns of intra-specific
polymorphism and recent evolution of human TAS2R genes should exhibit low selective
constraints Here we characterize the intra- and inter-specific variations of all 25
members of the human TAS2R repertoire and provide strong evidence supporting this
hypothesis
33 RESULTS
331 Equal levels of synonymous and nonsynonymous polymorphisms in human
TAS2R genes
To examine the genetic variation of TAS2Rs within humans we sequenced all 25
functional genes in 22 humans of diverse geographic origins and one chimpanzee
64
Because synonymous nucleotide changes do not alter protein sequences and are more or
less neutral whereas nonsynonymous changes could be subject to natural selection a
comparison between them can reveal signals of selection (Li 1997 Nei and Kumar
2000) In most genes the majority of nonsynonymous sites are under selective
constraints resulting in lower rates of polymorphisms and substitutions at
nonsynonymous sites than at synonymous sites (Li 1997 Nei and Kumar 2000) In
human TAS2Rs we identified 72 nonsynonymous and 33 synonymous polymorphic
sites from 21408 nucleotide sites including 15242 nonsynonymous and 6166
synonymous sites respectively (Tables 31 and 32 Figure online at
httphmgoxfordjournalsorgcgidataddh289DC11 ) The number of polymorphisms
per nonsynonymous site (472times10-3 Wattersonrsquos θ =109times10-3) is 88 of that per
synonymous site (535times10-3 θ = 123times10-3) indicating that the overall selective
constraints on the two types of sites are similar (P=031 Fisherrsquos exact test) in TAS2R
genes Consistent with this observation the nucleotide diversity per site (Li 1997 Nei
and Kumar 2000) is virtually identical between nonsynonymous (πN=122times10-3) and
synonymous (πS=119times10-3) sites (Table 31) Furthermore while the TAS2R πS is close
to the average synonymous nucleotide diversity observed from a large number of
human genes (11times10-3) (Cargill et al 1999) πN is about 4 times the corresponding
average (028times10-3) (Cargill et al 1999) These comparisons suggest that the similar
magnitudes of πN and πS at TAS2Rs are likely due to reduced selective constraints on
nonsynonymous sites
Alternatively high πN may result from balancing selection which retains
beneficial alleles in a population for a long time (Hughes and Nei 1988) Balancing
65
selection has been suggested to account for the high πN of the TAS2R38 (also called
PTC) gene (Wooding et al 2004) which is largely responsible for the well known
human polymorphism in tasting the synthetic compound phenylthiocarbamide (PTC)
(Kim et al 2003) A characteristic of balancing selection is the positiveness of π minusθ
which can be measured by Tajimarsquos D statistic (Tajima 1989) For the present data D is
positive in 12 genes 0 in one gene and negative in 12 genes with an overall value of -
0048 for all the genes analyzed together (Table 31) D is not significantly different
from 0 for the 25 genes individually or collectively When the synonymous and
nonsynonymous sites were separated one gene (TAS2R48) had a significantly positive
D at synonymous sites (Plt005) and another (TAS2R45) had a significantly positive D
at nonsynonymous sites (Plt005) But the two significant cases may simply be due to
multiple testing as 50 tests were conducted and 25 significant cases (at 5) were
expected by chance These observations do not support the balancing selection
hypothesis for the human TAS2R repertoire although failure to detect balancing
selection here does not preclude its operation at a few TAS2R genes Similar results
were obtained by Fu and Lirsquos tests (Fu and Li 1993) (data not shown) Wooding et al
(Wooding et al 2004) suggested the action of balancing selection on TAS2R38 largely
because the observation of a positive Tajimarsquos D (155) This D value was not
significantly higher than 0 under the assumption that the population size is constant but
it became significantly higher than 0 under specific models of population expansion
(Wooding et al 2004) They suggested that an instant population expansion from the
effective size of 10000 to 1000000 that occurred 100000 years ago is most
appropriate for humans (Rogers 1995 Wooding et al 2004) (see also the manual of the
66
DFSC program of S Wooding at
httpwwwxmissioncom~woodingDFSCREADME) We evaluated this model by
computing D for 6 apparently neutral loci (see Table 33) of the human genome under
this model Surprisingly 5 of the 6 loci (except the locus at Xq133) show significantly
positive D values Thus we believe that use of the above population expansion model
leads to false positive detection of balancing selection Although this does not mean that
use of the constant-population model is correct it is certainly a more conservative and
safer test for balancing selection particularly when the details of human population
expansion is still unclear
Possible natural selection on human TAS2Rs can be further scrutinized by
comparing rare and common polymorphisms (Fay et al 2001) We used the chimpanzee
as the outgroup of humans to determine which human alleles are derived and which are
ancestral and then classified each polymorphism to either rare or common using 10
frequency for the derived allele as the cutoff (Table 32) We found that the ratio of the
number of nonsynonymous polymorphisms to that of synonymous polymorphisms was
similar between rare (3315=220) and common (3918=217) categories (P=057) This
is consistent with the lack of purifying selection on TAS2Rs because purifying selection
would prevent deleterious nonsynonymous mutations from becoming common and thus
generate a lower nonsynonymoussynonymous ratio for common polymorphisms than
for rare ones (Fay et al 2001)
332 Pseudogenization of human TAS2Rs
67
In addition to the many nonsynonymous polymorphisms two nonsense
polymorphisms were observed in human TAS2Rs The first was a CrarrT mutation at
position 640 of TAS2R7 that changed an Arg residue to a premature stop codon and
resulted in a receptor that contains only five transmembrane domains (Figure online at
httphmgoxfordjournalsorgcgidataddh289DC11 ) This apparently nonfunctional
allele was observed once (in Andes Indian) in the 22 individuals surveyed The
relatively low frequency (23) of the allele makes it difficult to distinguish whether it
is neutral (but newly emergent) or deleterious The second nonsense polymorphism
(GrarrA at position 749) changed a Trp to a premature stop codon in TAS2R46 resulting
in a truncated receptor with six transmembrane domains (Figure online at
httphmgoxfordjournalsorgcgidataddh289DC11 ) This nonfunctional allele was
observed 11 times in our samples The moderate frequency (025) of this allele and its
presence in various human populations (African Americans Caucasians Southeast
Asians Chinese and Pacific Islanders) demonstrates that it is not under purifying
selection A comparison between the human and chimpanzee genome sequences
indicates that chimpanzees have 6 TAS2R pseudogenes while humans have two
additional ones (hps1 and hps2 in (Shi et al 2003)) both having been fixed as revealed
by our sequencing of 22 humans (Figures online at
httphmgoxfordjournalsorgcgidataddh289DC12 and
httphmgoxfordjournalsorgcgidataddh289DC13 ) We also confirmed that the
chimpanzee orthologs of hps1 and hps2 have intact ORFs by sequencing one individual
Therefore in the 6-7 million years (MY) since the human-chimpanzee split (Brunet et
al 2002) two functional TAS2R genes have turned into pseudogenes in the hominid
68
lineage and another one or two are becoming pseudogenes in present-day humans By
contrast no new TAS2R pseudogenes have been fixed in the chimpanzee lineage
There are three residues that are absolutely conserved among all 63 mouse and rat
Tas2rs (see below) suggesting that these residues are required for proper functioning of
bitter taste receptors However two of them have changed in human TAS2Rs Position
103 of human TAS2R13 is fixed with Phe while this position is Leu in all mouse and
rat Tas2rs Similarly human TAS2R14 is fixed with Met at position 205 while it is Leu
in rodents An in vitro study showed that human TAS2R14 responds to multiple bitter
compounds (Behrens et al 2004) It will be interesting to examine if human TAS2R13
is functional
333 Equal rates of synonymous and nonsynonymous substitutions
When did the functional relaxation in human TAS2Rs occur This question may
be addressed by comparing polymorphism and divergence data A comparison between
orthologous TAS2R genes from the 22 humans and one chimpanzee identified 104
nonsynonymous and 42 synonymous substitutions that have been fixed between species
(Tables 31 32) These numbers translate into identical rates of nonsynonymous
(682times10-3) and synonymous (682times10-3) substitutions per site (P=052) When we
measured the human-chimpanzee distance by comparing a randomly picked human
allele with a randomly picked chimpanzee allele as normally conducted the
synonymous and nonsynonymous distances both became 83times10-3 per site These
numbers are significantly (Plt005) lower than the average human-chimpanzee distance
(0012 per site) observed from large genomic data (Chen et al 2001 Ebersberger et al
69
2002) and may reflect mutation rate variation within genome (Ellegren et al 2003) The
McDonald-Kreitman test (Mcdonald and Kreitman 1991) did not detect any difference
between the intraspecific and interspecific patterns of nonsynonymous and synonymous
variations for human TAS2Rs (P=038 Table 32) From the single chimpanzee
sequenced 3 synonymous and 8 nonsynonymous polymorphisms were found The
nonsynonymoussynonymous ratio (83=267) is comparable to the ratio for human
polymorphisms (7233=218) and the ratio for fixed substitutions between species
(10442=248) We also conducted an HKA test (Hudson et al 1987) by comparing the
polymorphism and divergence data from human TAS2Rs and those from 6 noncoding
regions of the human genome that are at least 3000 nucleotides long and are not known
to be under natural selection but no difference was found (Table 33) These results
suggest that the functional relaxation already started in the common ancestor of humans
and chimpanzees and that there is no detectable difference in selection between the
human polymorphism and divergence data
An alternative explanation for the above between-species data is a more complex
scenario involving purifying selection at some sites and positive selection at some other
sites of TAS2Rs Previous studies showed that transmembrane (TM) domains of
TAS2Rs are more conserved than extracellular (EC) and intracellular (IC) domains and
that EC domains may be subject to positive selection between rapidly diversifying
paralogous genes consistent with the presumable tastant-TAS2R binding sites being
located in the EC domains (Shi et al 2003) To test the hypothesis of positive and
purifying selection on human and chimpanzee TAS2Rs we estimated the dNdS ratio in
EC TM and IC domains respectively For comparison we used Tas2r genes from the
70
mouse and rat To obtain these genes we searched the rat genome sequence using all 33
mouse Tas2r genes as queries and identified 30 rat Tas2r genes A phylogenetic tree of
all putatively functional TAS2R genes from the human chimpanzee mouse and rat was
reconstructed (Figure 31 Figure online at
httphmgoxfordjournalsorgcgidataddh289DC14 ) From this tree 28 pairs of
mouse and rat genes were apparently orthologous We concatenated these 28 genes for
the mouse and rat respectively and estimated the average dN and dS between them
Figure 32 shows that the dNdS ratio is significantly lower than 1 for each of the three
functional regions (EC TM and IC) in rodent Tas2r genes demonstrating the operation
of purifying selection between the orthologs Among-domain variation in dNdS another
characteristic of functional genes is also evident and TM domains show the lowest
dNdS For both intraspecific and interspecific data of human TAS2Rs dNdS is not
significantly different from 1 for any of the three functional regions or the entire genes
Furthermore no variation in dNdS among functional regions is seen Compared with
rodent Tas2rs human TAS2Rs have significantly elevated dNdS in the TM domains
These observations are consistent with the hypothesis of functional relaxation in
humans (and chimpanzees) but do not support the alternative hypothesis of a
combination of positive and purifying selection because the latter predicts an elevation
in dNdS in EC domains while maintaining low dNdS in functionally conserved TM
domains
Similarly one may hypothesize that some TAS2Rs of humans are under positive
selection while some others are under purifying selection giving an average dNdS of ~1
for the repertoire Table 31 lists the dNdS ratio for each of the 25 human TAS2R genes
71
and some ratios appear much higher than others although none of them are significantly
different from 1 We used computer simulation to test whether this among-gene
variation was simply due to chance In the simulation we assumed that every gene has
the expected dN and dS identical to the corresponding averages of the 25 human TAS2R
genes and then generated an expected distribution of dNdS from 5000 simulations
(Figure 33) When this distribution was compared with the observed distribution no
significant difference was found (P=065 χ2 test Fig 33) suggesting that the apparent
among-gene variation in dNdS shown in Table 31 is explainable by chance alone
34 DISCUSSION
In this work we characterized the intra- and inter-specific variations of the entire
human bitter taste receptor gene repertoire Our intra-specific data show equal levels of
synonymous and nonsynonymous polymorphisms equal nonsynonymoussynonymous
ratios for rare and common polymorphisms equal nonsynonymoussynonymous ratios
among functional domains segregation of nonfunctional alleles in populations and
fixation of pseudogenes in the species All these observations support the lack of
selective constraint on human TAS2R genes Our inter-specific comparison between the
human and chimpanzee also suggests that TAS2R genes have been under neutral
evolution without much constraint If a complete functional relaxation occurred in the
common ancestor of humans and chimpanzees it is perplexing why fixations of
mutations that disrupt TAS2R ORFs occurred only twice in humans and did not occur at
all in chimpanzees Using computer simulation (see Materials and Methods) we
estimated that the average half-life of human TAS2R genes is 677 MY in the absence of
72
natural selection meaning that after 677 MY of neutral evolution a TAS2R gene has a
50 chance of becoming a fixed pseudogene From the observation that only two out of
27 TAS2R genes have become fixed pseudogenes during hominid evolution we
obtained the maximum likelihood estimate of the starting time (T) of the complete
functional relaxation to be 075 MY ago though any T within 01 to 26 MY ago cannot
be rejected at 5 significance level It is likely that an incomplete functional relaxation
started early in the ancestry of humans and chimpanzees but a second wave of more
complete relaxation occurred recently in the hominid lineage alone This would explain
the lack of pseudogene formation in chimpanzees and the paucity of human
pseudogenizations Because each TAS2R recognizes multiple related toxic compounds
(Bufe et al 2002 Behrens et al 2004) and each taste receptor cell expresses multiple
TAS2R genes (Chandrashekar et al 2000) it is possible that an incomplete functional
relaxation occurs when the number or amount of toxins that a species encounters
reduces
As mentioned a dietary change that started 2 MY ago (Harris 1992 Leonard
2002 Milton 2003) resulted in an increase of animal tissues and decrease of plant
tissues in hominid diet which reduced the number of toxic foods that hominids came
across Controlled use of fire was evident about 08 MY ago (Goren-Inbar et al 2004)
the reliance on TAS2Rs to detect toxins further diminished because cooking
significantly detoxifies poisonous food (Harris 1992) It is interesting that the likelihood
estimate of the starting time (075 MY ago) of the complete functional relaxation in
human TAS2R genes coincides with the beginning of the fire use in hominid evolution
although our estimate has a large variance Our data suggest that chimpanzee TAS2Rs
73
are likely under relaxed selective constraint as well although to a lesser degree as
evident from the lack of pseudogenization It has been noted that chimpanzees
occasionally eat meat (2-13 of diet) whereas other great apes (gorillas and
orangutans) almost never do so (Milton 2003) Furthermore among the plant foods
chimpanzees eat mostly ripe fruits while gorillas and orangutans eat more leaves unripe
fruits bark and pith (Milton 2003) Ripe fruits contain considerably fewer toxins than
do leaves and unripe fruits (Glendinning 1994) These factors when combined may
have reduced the selective pressures on chimpanzee TAS2Rs A broader survey of
TAS2R genes in primates may provide a better understanding of the ecology and
selective agents behind the evolution of TAS2R genes and the bitter taste
Our finding that the TAS2R bitter taste receptor gene repertoire of humans is
under relaxed selective constraint has several implications First humans have lost and
continue to lose TAS2R genes which would result in a decrease in the number of bitter
compounds that we can taste Second the segregation of nonfunctional TAS2R alleles in
current human populations indicates among-individual variation in bitter sensitivity
Third functional relaxation may also allow the appearance of new TAS2R alleles that
can bind previously unrecognizable tastants While the emergence of these new alleles
may increase the diversity in bitter recognition among humans it likely has little effect
on fitness because of the neutral nature of the new alleles It should be noted that loss of
selective constraint does not result in loss of function instantly Probably because of the
relatively short time since the loss of selective constraints on human TAS2R genes
many human TAS2R genes may still be functional and we can still taste many bitter
74
compounds But loss of function will result after sufficient time of evolution under no
selective constraint
Our finding is intriguing when compared with the evolutionary patterns of other
human sensory genes Olfactory receptor genes have been inactivated in the human
lineage at a higher rate than in chimpanzees and other primates In humans over 50 of
olfactory receptor genes are pseudogenes in contrast to 30-35 in other apes and less
than 20 in rodents (Gilad et al 2003 Gilad et al 2004) In fact humans have fewer
than 400 functional olfactory receptor genes (Niimura and Nei 2003) and they appear to
be under weak or no selective constraints (Gimelbrant et al 2004) while mice have
over 1000 functional genes (Zhang et al 2004) Humans apes and Old World monkeys
have lost important components of the vomeronasal pheromone signal transduction
pathway and are insensitive to vomeronasal pheromones (Liman and Innan 2003 Zhang
and Webb 2003) Humans also have an unusually high frequency of redgreen color
blindness (eg 8 in male Caucasians) that is not found in wild apes or Old World
monkeys (Surridge et al 2003) Deafness also occurs at a relatively high frequency
(008) in humans nonfunctional GJB2 alleles which are responsible for genetic
deafness in many populations have a total frequency of ~18 in United States (Nance
and Kearsey 2004) Although genes involved in these sensory systems may have
deteriorated at different times in the evolutionary lineage of humans it is compelling
that sensitivities to a number of sensory signals are weaker in humans than in many of
our mammalian relatives It is possible that in the evolution of apes and particularly
humans sensory capabilities became a less important component of an individualrsquos
fitness
75
35 MATERIALS AND METHODS
351 Sequencing human and chimpanzee TAS2R genes
Genomic DNAs of one chimpanzee (Pan troglodytes) and 22 unrelated humans
(Homo sapiens) of diverse geographic origins (3 Pygmy Africans 6 African Americans
5 Caucasians 3 Southeast Asians 2 Chinese 2 Pacific Islanders and 1 Andes Indian)
were purchased from Coriell Cell Repositories Gene-specific primers for amplifying
the 25 TAS2R genes were designed according to the human genome sequence The
protein-coding region of each TAS2R gene has 900-1000 nucleotides most of which
were amplified in our experiments After removing the primer-encoded regions the
total number of nucleotides examined here was 21408 or on average 856 per gene
Polymerase chain reactions (PCRs) were performed with high fidelity DNA polymerase
under conditions recommended by the manufacturer (Invitrogen) PCR products were
separated on 15 agarose gel and purified using the Gel Extraction Kit (Qiagen)
before being sequenced from both directions using the dideoxy chain termination
method with an automated DNA sequencer Sequencher (GeneCodes) was used to
assemble the sequences and to identify DNA polymorphisms Two human pseudogenes
(hps1 and hps2) were also sequenced in the 22 humans and one chimpanzee The primer
sequences are available upon request
352 Evolutionary analyses
Numbers of synonymous and nonsynonymous sites and numbers of synonymous
and nonsynonymous nucleotide changes were counted following (Zhang et al 1998)
76
The number of synonymous changes per synonymous site (dS) and the number of
nonsynonymous changes per nonsynonymous sites (dN) were then computed (Nei and
Kumar 2000) Wattersonrsquos θ nucleotide diversity π Tajimarsquos D test (Tajima 1989) and
HKA test (Hudson et al 1987) were computed or conducted by DnaSP (Rozas et al
2003) Rare and common polymorphisms were defined using the cutoff of 10
frequency for the derived allele Use of different cutoffs (5 and 15) did not change
our result The sequence data of six noncoding regions used in the HKA test were from
(Zietkiewicz et al 1998 Harris and Hey 1999 Kaessmann et al 1999 Fullerton et al
2000 Zhao et al 2000 Yu et al 2001) Mouse Tas2r gene sequences were obtained
from (Shi et al 2003) Rat Tas2r genes were identified by BLAST searches of the rat
genome sequence using the mouse genes as queries A neighbor-joining tree (Saitou and
Nei 1987) of the putatively functional TAS2R genes of the human chimpanzee mouse
and rat was reconstructed using the protein Poisson distance (Nei and Kumaer 2000)
The bootstrap test (with 2000 replications) was used to examine the reliability of the
observed branching patterns (Felsenstein 1985) MEGA2 (Kumar et al 2001) was used
for the phylogenetic analysis Twenty-eight pairs of orthologous Tas2r genes from the
mouse and rat were identified and used for computing dS and dN Functional domains in
TAS2Rs were defined following (Adler et al 2000) Computer simulation was used to
evaluate the expected variation in dNdS among TAS2R genes Because the total numbers
of fixed synonymous and nonsynonymous differences in the 25 orthologous genes of
humans and chimpanzees were 42 and 104 respectively (Table 31) the average
numbers per gene were 168 and 416 respectively Since nucleotide substitution is a
Poisson process we generated a Poisson random number with the mean of 168 as the
77
number of synonymous substitution for a gene and an independent Poisson random
number with the mean of 416 as the number of nonsynonymous substitution for the
gene The dNdS ratio for the gene was then computed following (Zhang et al 1998)
using the average numbers of synonymous (24664) and nonsynonymous (60968) sites
per gene for the TAS2R genes When the number of synonymous substitution was 0
dNdS was designated as NA Such simulation was repeated 5000 times and a
distribution of dNdS was generated This distribution was compared with the observed
distribution from the 25 TAS2Rs by a χ2 test We used the program PSEUDOGENE
(Zhang and Webb 2003) to estimate the half-life (t12) of each of the human TAS2R
genes and obtained an average of 677plusmn005 MY In the computation we used a point
nucleotide substitution rate of 64times10-10 per site per year which was estimated from the
synonymous substitution rates in TAS2R genes under the assumption of 65 MY as the
time since the human-chimpanzee split (Brunet et al 2002) We also used a substitution
rate of 081times10-10 per site per year for ORF-disruptive indels which was estimated from
human-chimpanzee genomic comparisons (Britten 2002 Podlaha and Zhang 2003
Zhang and Webb 2003) The starting time of the complete functional relaxation (T) as
well as its confidence interval was estimated using a likelihood approach (Zhang and
Webb 2003)
36 ACKNOWLEDGMENTS
We thank Soochin Cho David Webb and two anonymous reviewers for valuable
comments This work was supported by a startup fund of the University of Michigan
and a research grant from the National Institutes of Health (GM67030) to JZ
78
Figure 31 Evolutionary relationships of 113 putatively functional TAS2R genes from the human chimpanzee mouse and rat The tree is reconstructed by the neighbor-joining method with protein Poisson distances Bootstrap percentages (ge50) from 2000 replications are shown at interior nodes The mouse and rat genes with uncertain orthology are marked with triangles and are not used in computing the dNdS ratios presented in Figure 32 The protein sequence alignment used for the tree reconstruction is provided in Figure online (httphmgoxfordjournalsorgcgidataddh289DC14)
mouse Tas2r117 rat Tas2r117 mouse Tas2r109
rat Tas2r109 mouse Tas2r129
rat Tas2r129 human TAS2R14
chimp TAS2R14 mouse Tas2r116
mouse Tas2r113 ratTas2r113
mouse Tas2r115 mouse Tas2r125
mouse Tas2r103 rat Tas2r103
mouse Tas2r140 rat Tas2r140
mouse Tas2r110 mouse Tas2r123 rat Tas2r123 rat Tas2r110
mouse Tas2r120 rat Tas2r120
mouseTas2r136 rat Tas2r136
human TAS2R50 chimpTAS2R50
human TAS2R48 chimp TAS2R48
human TAS2R49 chimp TAS2R49
humanTAS2R46 chimp TAS2R46
humanTAS2R47 chimpTAS2R47
human TAS2R45 chimp TAS2R45
human TAS2R43 chimp TAS2R43
human TAS2R44 chimpTAS2R44 human TAS2R13
chimp TAS2R13 mouse Tas2r121 rat Tas2r121
mouse Tas2r124 rat Tas2r124
mouse Tas2r102 rat Tas2r102
human ht2r55 chimp ht2r55
mouse Tas2r131 rat Tas2r131
human TAS2R7 chimp TAS2R7
mouse Tas2r130 rat Tas2r130
human TAS2R8 chimp TAS2R8
huamn TAS2R9 chimp TAS2R9
human TAS2R10 chimp TAS2R10
mouse Tas2r106 rat Tas2r106
mouse Tas2r107 rat Tas2r107
mouse Tas2r104 rat Tas2r104
mouse Tas2r114 rat Tas2r114
mouse Tas2r105 rat Tas2r105
human TAS2R3 chimp TAS2R3
mouse t2r41 rat t2r41
human TAS2R5 chimp TAS2R5
human TAS2R38 chimp TAS2R38
mouse Tas2r138 rat Tas2r138 human TAS2R4 chimp TAS2R4 mouse Tas2r108 rat Tas2r108
mouse Tas2r139 rat Tas2r139
human TAS2R39 chimp TAS2R39
human TAS2R40 chimp TAS2R40
mouse Tas2r144 rat Tas2r144
human TAS2R1 chimp TAS2R1
mouse Tas2r119 rat Tas2r119
human TAS2R16 chimp TAS2R16
mouse Tas2r118 rat Tas2r118
mouse Tas2r143 rat Tas2r143
human TAS2R41 chimp TAS2R41 mouse Tas2r126 rat Tas2r126
human TAS2R60 chimp TAS2R60
mouse Tas2r135 rat Tas2r135
100
100
100
100
100
100
100
100
100
100
99
100
100
100
100
100
100
100
100
99
100
100
100
100
100
100
99
100
100
100
100
55
100
100
100
100100
100
100
100
89
100
70
100
100
100
100
100
100
100
99
100
99
68
100
68
100
100
100
100
100
100
89
100
84
64
100
100
100
100
100100
99
99
99
7678
62
99
68100
83
79
75
100
73
99
84
99
69
89
52
76
53
59
94
02
79
Figure 32 Comparison of dNdS among different functional domains of TAS2Rs Black bars show the dNdS ratios computed from the concatenated sequences of 28 pairs of orthologous Tas2r genes of the mouse and rat Shaded bars show the dNdS ratios of the fixed differences between human and chimpanzee for the concatenated sequences of 25 pairs of orthologous TAS2R genes White bars show the dNdS ratios computed from the human polymorphisms at the 25 TAS2R genes All comparisons are conducted using Fisherrsquos exact test following (Zhang et al 1997) Significant levels 5 05 005 The test result of the null hypothesis of dNdS=1 for each bar is indicated above the bar Comparisons between two bars are indicated with brackets Non-significant results are not indicated EC four extracellular domains TM seven transmembrane domains IC four intracellular domains Total entire proteins
00
05
10
15
20
EC TM IC Total
d Nd S
P =0059
80
Figure 33 Expected and observed distributions of dNdS among 25 human TAS2R genes The expected distribution (white bars) under equal dNdS ratios among genes was generated by computer simulation (see Materials and Methods) whereas the observed distribution (black bars) was from the dNdS column in Table 31 NA not applicable due to zero synonymous substitution There is no significant difference between the two distributions (Pgt05 χ2 test)
0
2
4
6
8
0-04 04-08 08-12 12-16 gt16 NA
81
Table 31 Intra- and inter- variations of human TAS2R genes Table 1 Intra- and inter-specific variations of human TAS2R genes
Sysnonymous changes Nonsynonymous changes Total
Gene names Chr1 L 2 S 3 π ()4 θ ()5 D 6 d 7S π () θ () D d S π () θ () D d d Nd S
8
TAS2R1 5 825 1 004 010 -085 2 2 005 008 -056 4 3 005 008 -087 6 082TAS2R3 7 864 2 022 018 037 2 0 000 000 000 1 2 006 005 037 3 021TAS2R4 7 810 0 000 000 000 1 2 011 008 059 1 2 007 006 059 2 043TAS2R5 7 801 1 004 010 -085 3 3 011 012 -015 7 4 009 011 -048 10 096TAS2R7 12 876 0 000 000 000 2 0 000 000 000 4 0 000 000 000 6 082TAS2R8 12 831 2 022 020 024 0 1 001 004 -112 2 3 007 008 -039 2 NATAS2R9 12 867 0 000 000 000 3 1 008 004 154 4 1 006 003 154 7 054TAS2R10 12 849 2 012 020 -069 0 1 004 004 027 5 3 007 008 -040 5 NATAS2R13 12 837 0 000 000 000 2 2 009 008 036 11 2 007 005 036 13 214TAS2R14 12 879 2 033 018 147 3 1 003 004 -053 4 3 011 008 057 7 053TAS2R16 7 807 2 011 020 -083 2 3 012 012 -004 1 5 012 014 -048 3 020TAS2R38 7 945 0 000 000 000 3 4 021 014 116 2 4 015 010 116 5 028TAS2R39 7 957 1 002 008 -112 1 3 003 010 -157 2 4 002 010 -176 3 079TAS2R40 7 918 0 000 000 000 1 1 003 004 -014 2 1 002 003 -014 3 080TAS2R41 7 870 3 014 026 -100 1 1 004 004 027 5 4 007 011 -071 6 214TAS2R43 12 870 2 000 019 -130 1 7 021 026 -047 2 9 017 024 -084 3 078TAS2R44 12 888 3 023 027 -028 5 7 027 026 018 8 10 026 026 002 13 066TAS2R45 12 828 1 002 010 -112 2 6 045 023 239 5 7 032 019 182 7 101TAS2R46 12 804 1 004 010 -085 3 2 012 080 005 6 3 010 011 -040 9 078TAS2R47 12 867 2 018 018 -003 0 2 008 007 012 0 4 011 011 005 0 NATAS2R48 12 753 2 045 020 219 0 6 010 026 -162 6 8 020 024 -047 6 NATAS2R49 12 855 3 038 028 075 0 9 050 034 137 2 12 047 032 135 2 NATAS2R50 12 831 2 029 019 097 1 3 009 012 -053 5 5 015 014 015 6 201hT2R55 12 885 1 010 009 160 3 4 024 015 157 7 5 020 013 191 10 095TAS2R60 7 891 0 000 000 000 1 1 001 004 -085 8 1 001 003 -085 9 334Sum 21408 33 012 012 -005 42 72 012 011 009 104 105 012 011 -005 146 1001 Chromosomal location2 Number of sequenced nucleotides3 Number of polymorphic sites4 Nucleotide diversity per site5 Wattersons θ per site6 Tajimas D Plt0057 Number of fixed nucleotide differences between human and chimpanzee8 Number of fixed nonsynonymous differences per nonsynonymous site between human and chimpanzee divided by the number offixed synonymous differences per synonymous site NA not applicable because of zero synonymous differences
82
Table 32 Rates of synonymous and nonsynonymous nucleotide changes in human TAS2Rs
Table 2 Rates of synonymous and nonsynonymous nucleotide changes in human TAS2R s Nonsynonymous Synonymous NS ratio
Number of sites sequenced 15242 6166 247Rare polymorphisms 33 15 220Common polymorphisms 39 18 217Fixed changes 104 42 248None of the NS ratios are significantly different from each other (Fishers test)
83
Table 33 Comparison between TAS2R genes and neutrally evolving human sequences in intra- and inter-specific variation
Table 3 Comparison between TAS2R genes and neutrally evolving human sequences in intra- and inter-specific variations
Genomic regions (references) Sequence length (nt) π ()1 θ ()2 d ()3 θ d HKA Prob4
25 TAS2R genes (this study) 21408 0121 0115 0831 0138
Noncoding region at 1q24 (42) 8991 0058 0095 0623 0152 0669
β-globin initiation region at 11p15 (43) 6076 0129 0107 1284 0083 0508
Noncoding region at 22q11 (44) 9091 0088 0139 1353 0103 0312
Dystrophin intron-dys44 at Xp21 (45) 7475 0135 0102 0604 0169 0779
PDHA1 introns at Xp22 (46) 3530 0225 0211 0992 0213 0648
Noncoding region at Xq133 (47) 10200 0045 0083 0922 0090 03691 Nucleotide diversity per site for X chromosome data it is corrected by multiplication by 432 Wattersons estimate of polymorphism per site for X chromosome it is corrected by multiplication by 433 Number of nucleotide differences per site between human and chimpanzee sequences 4 Probability from the HKA test (30) with comparison to the TAS2R data
84
37 LITERATURE CITED Adler E Hoon MA Mueller KL Chandrashekar J Ryba NJP Zuker CS (2000) A novel
family of mammalian taste receptors Cell 100693-702 Behrens M Brockhoff A Kuhn C Bufe B Winnig M Meyerhof W (2004) The human
taste receptor hTAS(2)R(14) responds to a variety of different bitter compounds Biochemical and Biophysical Research Communications 319479-485
Britten RJ (2002) Divergence between samples of chimpanzee and human DNA sequences is 5 counting indels Proceedings of the National Academy of Sciences of the United States of America 9913633-13635
Brunet M Guy F Pilbeam D Mackaye HT Likius A Ahounta D Beauvilain A et al (2002) A new hominid from the Upper Miocene of Chad central Africa Nature 418145-151
Bufe B Hofmann T Krautwurst D Raguse JD Meyerhof W (2002) The human TAS2R16 receptor mediates bitter taste in response to beta-glucopyranosides Nature Genetics 32397-401
Cargill M Altshuler D Ireland J Sklar P Ardlie K Patil N Lane CR Lim EP Kalyanaraman N Nemesh J Ziaugra L Friedland L Rolfe A Warrington J Lipshutz R Daley GQ Lander ES (1999) Characterization of single-nucleotide polymorphisms in coding regions of human genes Nature Genetics 22231-238
Chandrashekar J Mueller KL Hoon MA Adler E Feng LX Guo W Zuker CS Ryba NJP (2000) T2Rs function as bitter taste receptors Cell 100703-711
Chen FC Vallender EJ Wang H Tzeng CS Li WH (2001) Genomic divergence between human and chimpanzee estimated from large-scale alignments of genomic sequences Journal of Heredity 92481-489
Ebersberger I Metzler D Schwarz C Paabo S (2002) Genomewide comparison of DNA sequences between humans and chimpanzees American Journal of Human Genetics 701490-1497
Ellegren H Smith NGC Webster MT (2003) Mutation rate variation in the mammalian genome Current Opinion in Genetics amp Development 13562-568
Fay JC Wyckoff GJ Wu CI (2001) Positive and negative selection on the human genome Genetics 1581227-1234
Felsenstein J (1985) Confidence-Limits on Phylogenies - an Approach Using the Bootstrap Evolution 39783-791
Fu YX Li WH (1993) Statistical Tests of Neutrality of Mutations Genetics 133693-709
Fullerton SM Bond J Schneider JA Hamilton B Harding RM Boyce AJ Clegg JB (2000) Polymorphism and divergence in the beta-globin replication origin initiation region Molecular Biology and Evolution 17179-188
Garcia J Hankins WG (1975) The evolution of bitter and the acquisition of toxiphobia In Denton DA and Coghlan JP (eds) Olfaction and Taste V Proceedings of the 5th International Symposium in Melbourne Australia Academic Press New York pp 39-45
Gilad Y Man O Paabo S Lancet D (2003) Human specific loss of olfactory receptor genes Proceedings of the National Academy of Sciences of the United States of America 1003324-3327
85
Gilad Y Wiebel V Przeworski M Lancet D Paabo S (2004) Loss of olfactory receptor genes coincides with the acquisition of full trichromatic vision in primates Plos Biology 2120-125
Gimelbrant AA Skaletsky H Chess A (2004) Selective pressures on the olfactory receptor repertoire since the human-chimpanzee divergence Proceedings of the National Academy of Sciences of the United States of America 1019019-9022
Glendinning JI (1994) Is the Bitter Rejection Response Always Adaptive Physiology amp Behavior 561217-1227
Goren-Inbar N Alperson N Kislev ME Simchoni O Melamed Y Ben-Nun A Werker E (2004) Evidence of hominin control of fire at Gesher Benot Yaaqov Israel Science 304725-727
Harris DR (1992) Human diet and subsistence In Jones S Martin R and Pilbeam D (eds) The Cambridge Encyclopedia of Human Evolution Cambridge University Press Cambridge pp 69-74
Harris EE Hey J (1999) X chromosome evidence for ancient human histories Proceedings of the National Academy of Sciences of the United States of America 963320-3324
Hudson RR Kreitman M Aguade M (1987) A Test of Neutral Molecular Evolution Based on Nucleotide Data Genetics 116153-159
Hughes AL Nei M (1988) Pattern of Nucleotide Substitution at Major Histocompatibility Complex Class-I Loci Reveals Overdominant Selection Nature 335167-170
Kaessmann H Heissig F von Haeseler A Paabo S (1999) DNA sequence variation in a non-coding region of low recombination on the human X chromosome Nature Genetics 2278-81
Kim UK Jorgenson E Coon H Leppert M Risch N Drayna D (2003) Positional cloning of the human quantitative trait locus underlying taste sensitivity to phenylthiocarbamide Science 2991221-1225
Kinnamon SC Cummings TA (1992) Chemosensory Transduction Mechanisms in Taste Annual Review of Physiology 54715-731
Kumar S Tamura K Jakobsen IB Nei M (2001) MEGA2 molecular evolutionary genetics analysis software Bioinformatics 171244-1245
Leonard WR (2002) Food for thought - Dietary change was a driving force in human evolution Scientific American 287106-115
Liman ER Innan H (2003) Relaxed selective pressure on an essential component of pheromone transduction in primate evolution Proceedings of the National Academy of Sciences of the United States of America 1003328-3332
Lindemann B (1996) Taste reception Physiological Reviews 76719-766 Matsunami H Montmayeur JP Buck LB (2000) A family of candidate taste receptors
in human and mouse Nature 404601-+ Mcdonald JH Kreitman M (1991) Adaptive Protein Evolution at the Adh Locus in
Drosophila Nature 351652-654 Milton K (2003) The critical role played by animal source foods in human (Homo)
evolution Journal of Nutrition 1333886S-3892S Nance WE Kearsey MJ (2004) Relevance of connexin deafness (DFNB1) to human
evolution American Journal of Human Genetics 741081-1087
86
Niimura Y Nei M (2003) Evolution of olfactory receptor genes in the human genome Proceedings of the National Academy of Sciences of the United States of America 10012235-12240
Podlaha O Zhang JZ (2003) Positive selection on protein-length in the evolution of a primate sperm ion channel Proceedings of the National Academy of Sciences of the United States of America 10012241-12246
Rogers AR (1995) Genetic-Evidence for a Pleistocene Population Explosion Evolution 49608-615
Rozas J Sanchez-DelBarrio JC Messeguer X Rozas R (2003) DnaSP DNA polymorphism analyses by the coalescent and other methods Bioinformatics 192496-2497
Saitou N Nei M (1987) The Neighbor-Joining Method - a New Method for Reconstructing Phylogenetic Trees Molecular Biology and Evolution 4406-425
Shi P Zhang JZ Yang H Zhang YP (2003) Adaptive diversification of bitter taste receptor genes in mammalian evolution Molecular Biology and Evolution 20805-814
Surridge AK Osorio D Mundy NI (2003) Evolution and selection of trichromatic vision in primates Trends in Ecology amp Evolution 18198-205
Tajima F (1989) Statistical-Method for Testing the Neutral Mutation Hypothesis by DNA Polymorphism Genetics 123585-595
Wooding S Kim UK Bamshad MJ Larsen J Jorde LB Drayna D (2004) Natural selection and molecular evolution in PTC a bitter-taste receptor gene American Journal of Human Genetics 74637-646
Yu N Fu YX Sambuughin N Ramsay M Jenkins T Leskinen E Patthy L Jorde LB Kuromori T Li WH (2001) Global patterns of human DNA sequence variation in a 10-kb region on chromosome 1 Molecular Biology and Evolution 18214-222
Zhang JZ Kumar S Nei M (1997) Small-sample tests of episodic adaptive evolution A case study of primate lysozymes Molecular Biology and Evolution 141335-1338
Zhang JZ Rosenberg HF Nei M (1998) Positive Darwinian selection after gene duplication in primate ribonuclease genes Proceedings of the National Academy of Sciences of the United States of America 953708-3713
Zhang JZ Webb DM (2003) Evolutionary deterioration of the vomeronasal pheromone transduction pathway in catarrhine primates Proceedings of the National Academy of Sciences of the United States of America 1008337-8341
Zhang XM Rodriguez I Mombaerts P Firestein S (2004) Odorant and vomeronasal receptor genes in two mouse genome assemblies Genomics 83802-811
Zhao ZM Jin L Fu YX Ramsay M Jenkins T Leskinen E Pamilo P Trexler M Patthy L Jorde LB Ramos-Onsins S Yu N Li WH (2000) Worldwide DNA sequence variation in a 10-kilobase noncoding region on human chromosome 22 Proceedings of the National Academy of Sciences of the United States of America 9711354-11358
Zietkiewicz E Yotova V Jarnik M Korah-Laskowska M Kidd KK Modiano D Scozzari R Stoneking M Tishkoff S Batzer M Labuda D (1998) Genetic
87
structure of the ancestral population of modern humans Journal of Molecular Evolution 47146-155
88
CHAPTER 4
ADAPTIVE PSEUDOGENIZATION OF CASPASE12 IN HUMAN EVOLUTION
41 ABSTRACT
Pseudogenization is a widespread phenomenon in genome evolution and it has
been proposed to serve as an engine of evolutionary change especially during human
origins (the ldquoless-is-morerdquo hypothesis) Here we provide population genetic evidence that
positive selection drove the nearly complete fixation of a null allele of human
CASPASE12 a gene implicated in susceptibility to severe sepsis We estimate that the
selective advantage of the null allele is ~09 and the pseudogenization started shortly
before the out-of-Africa migration of modern humans This adaptive gene loss might
have occurred because of changes in our environment or genetic background that altered
the threat from or response to sepsis Our finding opens the door for understanding the
roles of gene losses in human origins and the demonstration that gene loss itself can be
adaptive supports and extends the ldquoless-is-morerdquo hypothesis
42 INTRODUCTION
Although humans are highly similar to chimpanzees at the genomic sequence and
protein sequence levels (Chen and Li 2001 Britten 2002 Ebersberger et al 2002
Wildman et al 2003 Watanabe et al 2004 The Chimpanzee Sequencing and Analysis
Consortium 2005) the two species differ dramatically in many aspects of their biology
89
such as bipedalism brain size languagespeech capability and susceptibility to the
humansimian immunodeficiency virus (HIVSIV) With rapid progress in human
genetics comparative genomics and molecular evolution the genetic basis of these
differences has begun to be unraveled For example the conserved transcriptional factor
FOXP2 is required for speech development in humans (Lai et al 2001) and it
experienced two adaptive amino acid replacements in hominin evolution suggesting that
these two substitutions were at least partially responsible for the emergence of human
speech and language (Enard et al 2002 Zhang et al 2002) Compared to such amino acid
replacements gene gains and losses are more dramatic genetic changes (Olson 1999
Olson and Varki 2003 Zhang 2003 Fortna et al 2004 Li and Saunders 2005) In
particular gene loss or pseudogenization leads to immediate loss of gene function
which probably affects organisms to a greater extent than most amino acid replacements
do A number of genes are known to have been lost in the human lineage since its
divergence from the chimpanzee lineage (Chou et al 1998 Szabo et al 1999 Winter et
al 2001 Gilad et al 2003 Hamann et al 2003 Meyer-Olson et al 2003 Stedman et al
2004 Wang et al 2004 Fischer et al 2005 Go et al 2005 Perry et al 2005) Recently
Olson (Olson 1999) and Olson and Varki (Olson and Varki 2003) proposed the ldquoless-is-
morerdquo hypothesis suggesting that gene loss may serve as an engine of evolutionary
change This hypothesis is particularly intriguing for human evolution as several human
gene losses have been proposed to provide opportunities for adaptations and be
responsible for human-specific phenotypes For example the pseudogenization of the
sarcomeric myosin gene MYH16 at the time of the emergence of the genus Homo is
thought to be responsible for the marked size reduction in hominin masticatory muscles
90
which may have allowed the brain-size expansion (Stedman et al 2004) (but see (Perry et
al 2005) In another example the human-specific inactivation of the gene encoding the
enzyme CMP-N-acetylneuraminic acid hydroxylase (CMAH) led to the deficiency of the
mammalian common sialic acid Neu5Gc (N-glycolylneuraminic acid) on the human cell
surface (Chou et al 1998) This inactivation was due to an Alu-mediated sequence
replacement (Hayakawa et al 2001) that occurred ~27 million years ago (Chou et al
2002) and may have had several important consequences to human biology and evolution
(Varki 2001)
There has been no demonstration of positive selection driving the loss of a human
gene although the loss may have subsequently allowed future adaptations Such passive
pseudogenization incidences are not themselves adaptations To explore the possibility of
adaptive pseudogenization we focus on CASPASE12 evolution in human population
CASPASE12 belongs to the caspase family which are cysteinyl aspartate proteinases
that play important roles in the processing of inflammatory cytokines and the initiation
and execution of apoptosis (Alnemri et al 1996 Lamkanfi et al 2002) In humans 11
functional caspase genes are known CASPASE1-10 and CASPASE14 Human
CASPASE12 (CASP12) was identified as a pseudogene following the cloning of mouse
Caspase12 (Fischer et al 2002) Compared with other mammalian orthologs human
CASP12 contains a premature stop codon due to a C to T nonsense mutation at nucleotide
position 629 of exon 4 (Fischer et al 2002 Saleh et al 2004) This mutation leads to the
production of truncated nonfunctional CASP12 in humans (Saleh et al 2004) The null T
allele is fixed in a sample of 347 non-Africans and has a frequency of 89 in 776
individuals of African descent (Saleh et al 2004) Interestingly the T allele is associated
91
with a reduced incidence and mortality of severe sepsis (Saleh et al 2004) suggesting
that the loss of functional CASP12 is beneficial to present-day humans In this work we
provide evidence that the nearly complete fixation of a null allele at CASPASE12 (Fischer
et al 2002 Saleh et al 2004 The Chimpanzee Sequencing and Analysis Consortium
2005) has been driven by positive selection probably because the allele confers lowered
susceptibility to severe sepsis
43 RESULTS
431 Adaptive loss of CASP12 in human evolution
To test whether the nearly complete fixation of the null allele at CASP12 has been
driven by positive selection we looked for signals of recent (incomplete) selective
sweeps by examining the intraspecific variation of putatively neutral regions surrounding
the CT polymorphism The positive selection hypothesis predicts that the level of
polymorphism in these regions is lower in the null T allele than in the C allele especially
in the proximity of the CT polymorphism due to the hitchhiking effect (Maynard Smith
and Haigh 1974) Furthermore the frequency distribution of the neutral polymorphisms
in the T allele should deviate from the neutral expectation generating negative values of
Tajimarsquos D (Tajima 1989) and Fay and Wursquos H (Fay and Wu 2000)
From a sample of 63 humans of African descent we identified 4 CC homozygotes
and 43 TT homozygotes We sequenced the 4 CC homozygotes and 4 randomly chosen
TT homozygotes in 9 noncoding regions of varying distances from the CT
polymorphism (Figure 41) The sequenced regions vary in size from ~600 to 2400
nucleotides In total 53 and 29 single nucleotide polymorphisms (SNPs) were identified
92
from 8925 nucleotide sites in CC and TT individuals respectively (Figure 42 Table
41) Although the T allele is much more prevalent than the C allele in the population the
T allele has a significantly lower number of SNPs per nucleotide than the C allele in the
linked regions (Plt001 Fisherrsquos exact test) Nucleotide diversity per site (π) is also lower
in the T alleles (πT=000131plusmn000019) than in the C alleles (πC=000218plusmn000031)
(P=002 two-tail Z test) More strikingly although the variation of πC across the 9
regions is more or less random that of πT exhibits a V shape with the bottom of the
valley located in region 4 which has its 3rsquo end only 607 nucleotides from the CT
polymorphism (Figure 41) When one moves ~10000 nucleotides from this
polymorphism πT rises to a level comparable to πC To exclude the possibility that the
low πT observed around the CT polymorphism was due to the use of a small sample we
sequenced 7 additional TT individuals of African descent in regions 4 5 and 6 The πT
values obtained from the combined data of 11 individuals were either lower than or
similar to those from the 4 individuals (Table 41) suggesting that the observation of low
πT is not due to a small sample In region 4 where the greatest reduction in
polymorphism is observed only 1 SNP is found across the 2413 nucleotide positions
among the 22 T alleles sequenced By contrast 19 SNPs were found in the same region
among 8 C alleles examined Region 4 was also sequenced in 6 non-Africans (all non-
Africans are TT homozygotes (Saleh et al 2004)) but no SNP was detected and all non-
African T alleles are identical to the predominant T allele from Africans This indicates a
common origin of African and non-African T alleles
In a formal test of the selective sweep hypothesis we used coalescent simulations
to examine whether the polymorphisms observed in region 4 can be explained by neutral
93
models of evolution Such tests require a sample that is representative of the population
under investigation We thus sequenced 20 additional African TT homozygotes so that
our sample comprises 6270=89 of T alleles and 870=11 C alleles expected in
populations of African descent (Saleh et al 2004) In the 70 chromosomes sequenced the
two most common haplotypes observed (with a total frequency of 6170) are both from T
alleles and these two haplotypes have only one nucleotide difference Let k1 be the
number of chromosomes with the most common haplotype in a sample and k2 be the
number of chromosomes with the most frequent haplotype among those that are one
nucleotide different from the most common haplotype in the sample We first simulated
the evolution of a population with a constant size In 0066 of the 50000 replications
we observed k1+k2ge61 We also simulated various demographic changes to mimic the
evolution of human populations and k1+k2ge61 was observed in fewer than 1 of
simulation replications in all models considered (Table 42) These demographic models
included ancient or recent population expansions severe bottleneck repeated bottlenecks
with subsequent expansion and population subdivision and admixture (Evans et al 2005)
(see Materials and Methods) Previous studies suggested that the models used here are
much more stringent than that associated with the real demographic history of humans
(Zietkiewicz et al 1998 Harpending and Rogers 2000) Hence our tests are
conservative
We also computed statistics D and H for regions 4 and 5 in the T allele as these
two regions have significantly lower πT than πC (Table 41) Both statistics were
significantly negative in region 5 (D=-208 Plt001 H=-471 Plt0025) consistent with
the expectations from a selective sweep D (-023 P=047) and H (-090 P=009) were
94
not significantly negative in region 4 probably because the number of SNPs is too small
for the statistic tests to be powerful It should be noted that the above tests are less
rigorous than the coalescent simulations because the tests are conducted on subsets of the
genealogy (Evans et al 2005) Linkage disequilibrium (LD) can also be used to test
recent selective sweeps if long-range haplotypes can be reliably inferred (Sabeti et al
2002) In the present case however long-range haplotypes are difficult to infer with
certainty due to the small number of CC homozygotes available But the genotypes
shown in Figure 42 provide a visual indication of longer LD in T alleles than in C alleles
and a decay of LD when one moves away from the CT polymorphism consistent with
the recent origin of T alleles Taken together our observations especially the proximity
of the πT valley to the CT polymorphism and the coalescent simulations strongly
suggest that the spread of the T allele among Africans and non-Africans has been driven
by positive selection and that the selective advantage was directly conferred by the CrarrT
nonsense mutation
432 Dating the pseudogenization event and selective sweep in CASP12
When did the pseudogenization of human CASP12 start We took two approaches
to estimate the age of the T allele In the first method we used the information of
noncoding region 4 which is longest among the 9 sequenced regions and is also closest
to the CT polymorphism The founding haplotype of T alleles is inferred and the
proportion (P) of present-day T alleles identical to the founding haplotype is estimated It
can be shown that P=(1-r)G where G is the age of the T allele in generation and r is the
total rate of mutation and recombination per sequence per generation (Stephens et al
95
1998) In the present case it is easy to infer the founding haplotype (for region 4) because
of the low polymorphism and the availability of an outgroup (chimpanzee) sequence P is
estimated to be 0811 based on the observation of 60 copies of the founding haplotype in
a total of 74 T alleles sequenced (including both Africans and non-Africans) The
mutation rate is estimated to be 23(12times106)times25 = 4792times10-5 per sequence per
generation Here 23 is the average number of nucleotide differences between human and
chimpanzee in region 4 12times106 is twice the divergence time in year between the two
species (Brunet et al 2002) and 25 is the average human generation time in years The
recombination rate is estimated to be 07times10-8times3720=2269times10-5 per sequence per
generation where 07times10-8 is the pedigree-based recombination rate per generation per
nucleotide at the CASP12 locus (Kong et al 2002) and 3720 is the number of nucleotides
between the 5rsquo end of region 4 and the CT polymorphism We thus estimated that
G=2970 generations (Figure 43A) which corresponds to 74250 years The 95
confidence interval for P is between 0647 to 1 If we consider the sampling error of P
the 95 confidence interval for the estimated time is from 0 to 154 thousand years The
standard error of the estimated mutation rate is 1 23 =21 of the estimate while the
error of the recombination rate is difficult to evaluate
In the second method we used a deterministic selection model (Hartl and Clark
1997) to estimate the number of generations required for the T allele to rise to its present-
day frequency among individuals of African descent It has been estimated that the
incidence of severe sepsis is I=059 and the mortality rate is M=265 among African
Americans (Alexander et al 2004) The genotype frequencies among individuals of
African descent are fCC =1675 fCT =186 and fTT =7977 respectively (Saleh et al
96
2004) Here we used the genotype frequency data from ref (Saleh et al 2004) because
their sample is considerably larger than ours The proportions of the three genotypes
among severe sepsis patients have been estimated to be P(CC | sepsis)=105 P(CT |
sepsis)=290 and P(TT | sepsis)=605 (Saleh et al 2004) Using Bayes theorem we
calculated the survival rate (S) for a given genotype X by SX=1-MP(sepsis | X) =1-IMP(X
| sepsis)fX and obtained SCC=09902 SCT=09976 and STT=09988 Here we assumed
that the pre-reproductive-age incidence of sepsis in much of the human history is
comparable to the total incidence of sepsis estimated today (Alexander et al 2004) The
relative fitness of CC to the fitness of TT is therefore WCC =SCCSTT=0991 Similarly
WCT =SCTSTT=0999 and WTT =1 The selective disadvantage of CC compared with
TT is s =1- WCC =0009 and the degree of dominance of the C allele relative to the T
allele is h=(1-WCT)(1-WCC)=011 The number of generations required for a given
change in allele frequency was calculated using the differential equation dpdt=p(1-
p)s[ph+(1-p)(1-h)] with the current T frequency p =0891 (Saleh et al 2004) and the
initial T frequency p0 =1(2N) where N is the effective population size of humans (Hartl
and Clark 1997) The calculated number of generations is t =2111 (Figure 43B) under
the assumption of an effective population size of 104 individuals (Takahata et al 1995
Harpending et al 1998) In this computation we ignored the effect of random genetic
drift because 2Ns =180gtgt1 and the behavior of the alleles is dominated by selection
(Kimura 1983) Because of the sampling error the 95 confidence interval of p is
[0875 0907] which gave the 95 confidence interval of the time required for the T
allele to reach todayrsquos frequency to be 51 to 55 thousand years Note that the actual error
of the time estimate may be considerably larger because the estimation errors of h and s
97
are difficult to assess Here we assumed that positive selection acted as soon as the null
allele appeared It is possible that the null allele was initially neutral but later became
beneficial due to a change in the genetic or environmental background If this is the case
the appearance of the T allele would be earlier than dated by this method
Strictly speaking the first approach we used was to date the appearance of the T
allele whereas the second approach was to date the onset of the selective sweep These
two events were not necessarily simultaneous although the appearance of the T allele
was a prerequisite for the selective sweep Despite the potentially large errors the two
estimates were close suggesting that the T allele might have been beneficial since its
appearance Because the T alleles of Africans and non-Africans share the same origin the
CrarrT nonsense mutation must predate the out-of-Africa migration of modern humans
which is believed to have occurred 40-60 thousand years ago (Cavalli-Sforza and
Feldman 2003) Our dating suggests that the pseudogenization of CASP12 began not long
before this migration As a comparison it is interesting to compute the mean time
required for a neutral allele to rise to the current frequency of p=0891 This can be
estimated by -4Np(lnp)(1-p) =37736 generations or 943000 years (Kimura and Ohta
1973) In the above N is the effective population size of humans and is assumed to be
104 Thus it would have taken a considerably longer time for the null allele to reach
todayrsquos frequency if it were neutral
44 DISCUSSION
Our population genetic study provided strong evidence that the nearly complete
fixation of a null allele at human CASP12 has been driven by positive selection possibly
98
because it confers resistance to severe sepsis CASP12 is a functional gene in all
mammals surveyed except humans (Saleh et al 2004) suggesting that it is indispensable
in a typical mammal The functional human CASP12 acts as a dominant-negative
regulator of essential cellular responses including the NF-κB and IL-1 pathways it
attenuates the inflammatory and innate immune response to endotoxins (Saleh et al
2004) Because an appropriate level of immune response that is neither excessive nor
insufficient is important to an organism one can imagine that the immune suppression
function of CASP12 becomes harmful when the immune system cannot fully respond to a
challenge It is likely that during human evolution alterations in our genetic andor
environmental background resulted in a malfunction of the immune response to
endotoxins which rendered the previously necessary function of CASP12 deleterious in
humans and the null allele advantageous over the functional one Identification of such
genetic andor environmental alterations will be valuable for understating human-specific
immune functions It is interesting to note that mouse Casp12 is implicated in amyloid-
induced neuronal apoptosis whereas the functional form of human CASP12 does not
have this function The reasons and consequences of this difference particularly in
relation to the human-specific pathology of Alzheimerrsquos disease are intriguing (The
Chimpanzee Sequencing and Analysis Consortium 2005)
The ldquoless-is-morerdquo hypothesis emphasized that gene loss can sometimes play an
active role in evolution (Olson 1999) with the premise that gene loss may provide
opportunities for future adaptations Our finding that gene loss itself can be adaptive
supports and extends the ldquoless-is-morerdquo hypothesis In the context of pathogenic threats
it is interesting to mention two examples where human null alleles are selected for in
99
certain geographic areas (Stephens et al 1998 Hamblin et al 2002) In the first example
a null allele generated by a 32-nucleotide deletion in the CCR5 chemokine receptor gene
was subject to positive selection in Caucasians in the recent human history (Stephens et
al 1998) (but see (Sabeti et al 2005) CCR5 is used by pathogens such as HIV as a
coreceptor to enter host cells the null allele protects humans from attacks of these
pathogens The exact pathogens that were responsible for the spread of the CCR5 null
allele however are still under debate (Galvani and Novembre 2005) In the second
example a null allele at the Duffy blood group locus was shown to be beneficial in some
Africans probably because it confers resistance to malaria (Hamblin et al 2002)
Nevertheless in both of these examples the null alleles appear to be less fit than the
functional alleles when the pathogens are rare or absent Thus the positive selection for
the null alleles is limited to small geographic areas and it is unlikely that they will lead to
the eventual loss of the two human genes By contrast CASP12 has been lost in non-
Africans and is nearly lost in Africans
How often does adaptive gene loss occur in general While this problem has not
been investigated systematically two non-human cases have been reported recently The
first occurred in a gene responsible for pheromone synthesis in insects and the
pseudogenization led to the origin of a partially reproductively isolated race of
Drosophila melanogaster (Takahashi et al 2001 Greenberg et al 2003) The second case
involves a gene whose functional product prevents selfing in plants and the
pseudogenization event allowed the evolution of self-pollination in Arabidopsis thaliana
(Shimizu et al 2004) Given the high frequency of pseudogenization in eukaryotic
genomes one may speculate that adaptive gene loss is not uncommon Interestingly two
100
of the three adaptive pseudogenizations so far documented happened to genes that are
involved in chemoreception or immunity consistent with the previous finding that genes
of these functions tend to evolve rapidly with high rates of turnover (Hughes 1999 Grus
et al 2005) Although detection of adaptive gene loss is restricted due to a rapid decay of
population genetic signals of selective sweeps (Przeworski 2003) it is possible that
adaptive gene loss is more frequent than previously thought especially from the above
two functional categories This said the study of the roles that gene losses play in
evolution has just begun more empirical evidence is needed to demonstrate the
importance of the ldquoless-is-morerdquo hypothesis during evolution in general and human
evolution in particular
45 MATERIALS AND METHODS
451 DNA amplification and sequencing of CASP12 alleles
All human genomic DNA samples were purchased from Coriell Cell Repositories
The genotypes of 63 individuals of African descent at the CT polymorphism (position
629 of exon 4) were determined by sequencing a portion of exon 4 These individuals
included 48 African Americans 6 African pygmies and 9 Africans (south of the Sahara)
Four CC homozygotes (3 African Americans and 1 African pygmy) 43 TT
homozygotes and 16 CT heterozygotes were identified The T allele has a frequency of
81plusmn0035 in our sample slightly lower than that (89) reported in a previous study
which was based on a much larger sample (Saleh et al 2004) All 4 CC individuals and 4
randomly picked TT individuals (3 African Americans and 1 African pygmy) were
sequenced in 9 noncoding regions as shown in Figure 41 To ensure that the low
101
polymorphism found among TT individuals in regions 4 5 and 6 was not due to the
small sample size we sequenced 7 additional TT individuals (all African Americans) in
the three regions The genotypes of 6 non-Africans (2 Caucasians 1 Chinese 2 Pacific
Islanders and 1 Andes) at the CT polymorphism were also determined by the same
approach and all were found to be TT homozygotes (Note that the fixation of the T
allele in non-Africans was previously demonstrated in a sample of 347 individuals (Saleh
et al 2004)) Region 4 was sequenced in these 6 non-Africans and no SNPs were found
For conducting coalescent simulations by the ms program (Hudson 2002) we sequenced
20 additional TT individuals of the African descent for region 4 so that our sample of
Africans comprised 4 CC and 31 TT individuals with the frequency of T alleles being
89 which is expected for Africans (Saleh et al 2004) Our sample can be treated as a
random sample under the reasonable assumption of random mating with respect to the
CT polymorphism
The experimental procedure was as follows Fragment-specific primers were
designed according to the human genome sequence Polymerase chain reactions (PCRs)
were performed with MasterTaq (Eppendorf) under conditions recommended by the
manufacturer PCR products were separated on 15 agarose gel and purified using the
Gel Extraction Kit (Qiagen) Amplified DNA fragments were sequenced from both
directions in an automated DNA sequencer using the dideoxy chain termination method
Sequencher (GeneCodes) was used to assemble the sequences and to identify DNA
polymorphisms All singletons were confirmed by an independent PCR and sequencing
experiment After removing the primer regions each sequenced fragment is 500-800
nucleotides long All the SNPs identified in this study are listed in Table 43
102
452 Population genetic analysis
Nucleotide diversity per site π (Tajima 1989) Tajimarsquos D (Tajima 1989) and Fay
and Wursquos H (Fay and Wu 2000) were computed by DnaSP (Rozas and Rozas 1999)
Gaps in the sequence alignments were excluded from the analysis The chimpanzee
genome sequence available in GenBank was used as an outgroup in computing H
Tajimarsquos test (Tajima 1989) and Fay and Wursquos test (Fay and Wu 2000) were conducted
by DnaSP using coalescent simulations with 50000 replications under the assumption of
no recombination which gave more conservative results than when recombination is
considered To test the hypothesis of selective sweeps more rigorously we modeled
various demographic scenarios of human populations by coalescent simulations (50000
replications per model) The parameters used in the coalescent simulations are described
in Supplementary Methods Two methods were used to estimate the age of the T allele as
described in detail in ResultsDiscussion
453 Demographic history simulation
Our sample for region 4 included 4 CC and 31 TT individuals of African descent
Thus the sample frequency of the T allele is 89 same as the expected value for humans
of African descent (Saleh et al 2004) In the 70 chromosomes sequenced 19 SNPs were
found The two most common haplotypes observed (with a total frequency of 6170) are
from T alleles and these two haplotypes have only one nucleotide difference Let k1 be the
number of copies of the most common haplotype in a sample and k2 be the number of
copies of the most frequent haplotype among those that are one nucleotide different from
103
the most common haplotype in the sample In coalescent simulations we calculated the
proportion of cases (out of 50000 replications) in which k1+k2ge61 We used the ms
program (Hudson 2002) to generate independent samples under a variety of neutral
models with different demographic histories The number of alleles and the number of
segregating sites were set to be 70 and 19 respectively The pedigree-based
recombination rate of R=07times10-8 per generation per nucleotide at the CASP12 locus
(Kong et al 2002) was used We examined 9 demographic models following Evans and
colleagues (Evans et al 2005) We assumed an effective population size of N=104
(Takahata et al 1995 Harpending et al 1998) as the genetic variants of non-Africans are
usually subsets of those of Africans In the following command lines 2413 is the length
of region 4 in nucleotide and 0675 is the population recombination rate for region 4
when N=104 is used (ρ=4NR=4times104times07times10-8times2413=0675)
The 9 models tested and the command lines used in the ms program are
1) Constant population with an effective size of 104
ms 70 50000 -s 19 -r 0675 2413
2) An ancient population expansion from 104 at 5000 generations ago exponentially to
107 today
ms 70 50000 -s 19 -r 675 2413 -G 5526204223 -eG 0000125 0
3) A recent population expansion from 104 at 1000 generations ago exponentially to 107
today
ms 70 50000 -s 19 -r 675 2413 -G 2763102112 -eG 0000025
4) A severe bottle neck starting 5000 generations ago that reduced the population from
104 instantly to 103
and lasted until 2500 generations ago at which point the population
104
started to expand exponentially to 107 today
ms 70 50000 -s 19 -r 675 2413 -G 147365446 -eG 00000625 0 -eN 0000125 0001
5) Repeated bottlenecks for five successive rounds starting 7000 generations ago each
from 104 instantly to 103
for 500 generations followed by exponential recovery back to
104 over another 500 generations except at the end of the fifth bottleneck 2500
generations ago which was followed by exponential growth to 107 today
ms 70 50000 -s 19 -r 675 2413 -G 147365446 -eG 00000625 0 -eN 0000075 0001 -eG 0000075
1842068074 -eG 00000875 0 -eN 00001 0001 -eG 00001 1842068074 -eG 00001125 0 -eN 0000125 0001 -eG
0000125 1842068074 -eG 00001375 0 -eN 000015 0001 -eG 000015 1842068074 -eG 00001625 0 -eN 0000175
0001
6) Population structure where the initial 70 chromosomes were split equally into 2
different subpopulations under constant population size with 1 migration per generation
ms 70 50000 -s 19 -r 0675 2413 -es 00 1 05 -eM 00 10
7) Population structure where the initial 70 chromosomes were split equally into 3
different subpopulations with 1 migration per generation
ms 70 50000 -s 19 -r 0675 2413 -es 00 1 03333 -es 00 1 05 -eM 00 10
8) Population structure where the initial 70 chromosomes were split equally into 4
different subpopulations with 1 migration per generation
ms 70 50000 -s 19 -r 0675 2413 -es 00 1 025 -es 00 1 0333 -es 00 1 05 -eM 00 10
9) Population structure where the initial 70 chromosomes were split equally into 5
different subpopulations with 1 migration per generation
ms 70 50000 -s 19 -r 0675 2413 -es 00 1 02 -es 00 1 025 -es 00 1 0333 -es 00 1 05 -eM 00 10
46 ACKNOWLEDGMENTS
We thank Soochin Cho Ondrej Podlaha Peng Shi and three referees for valuable
comments on an earlier version of the manuscript This work was supported by research
105
106
grants from University of Michigan and National Institutes of Health (R01GM067030) to
JZ
Figure 41 Intraspecific DNA sequence variation in noncoding regions linked with the human CASPASE12 gene CASPASE12 is shown in blue with the exons depicted by solid blue bars on the chromosome The premature stop codon generated by the CrarrT nonsense mutation is shown by an asterisk in exon 4 The 9 noncoding regions sequenced are indicated below the chromosome Exons introns the 9 noncoding regions and spaces between regions are drawn to scale as indicated Red circles (connected by the red dotted line) show nucleotide diversity per site among African T alleles (πT) and the red boxes shows πT plusmn one standard error of πT Green squares (connected by the green dotted line) show nucleotide diversity per site among African C alleles (πC) and the green boxes shows πC plusmn one standard error of πC The broken green line shows the mean πC across the 9 noncoding regions sequenced Black triangles (connected by the black solid line) show the ratio between πT and πC for each region πC is estimated from 8 alleles πT is estimated from 22 alleles for regions 4 5 and 6 and from 8 alleles for the other regions When only 8 alleles are used πT is 000018plusmn000007 000129plusmn000071 and 000145plusmn000057 for regions 4 5 and 6 respectively πT is significantly lower than πC in regions 4 and 5 (Table 41)
107
Figure 42 Genotypes of the 4 CC homozygotes and 4 TT homozygotes that were sequenced in all 9 noncoding regions Each row represents one human individual and each column represents one SNP site The top 4 individuals are homozygous for the functional CASP12 allele and the bottom 4 individuals are homozygous for the null allele Blue yellow and green squares indicate homozygotes for the ancestral allele homozygotes for the derived allele and heterozygotes respectively at each SNP site The nucleotide position of each SNP site is given at the bottom of the figure with the ancestralderived nucleotides indicated The nucleotide positions are relative to the start codon ATG On the top of the figure is the chromosome with the exons of CASP12 depicted by solid blue bars on the chromosome The premature stop codon generated by the CrarrT nonsense mutation is shown by an asterisk in exon 4 The 9 noncoding regions sequenced are indicated below the chromosome
1 CC2 CC3 CC4 CC
5 TT6 TT7 TT8 TT
CT
AG
CT
GA
CT
GA
CT
TCC
TA
GA
GTCTGC
AG
AA
GA
CC
TTCA
GG
AG
AC
TTATCA
TTAG
TTCC
TC
T
CT
TGC
GA
TC
AG
ATCA
TG
AG
AC
TG
TTCC
TTCA
TC
TG
ATCG
ATCC
TC
TTGA
CA
GC
GA
G
-9705-9612-9598-9548-9499-9150-5519-5194-5042-49932336572516262130003081314231483869395739804018404541114181423947064759485550835175
6025
83358453866794409586985499511016810239102501182311867119681464214771149591811218374184391871620030200932011820133202442029820516
108
Figure 43 Estimating the age of the null allele and the onset of the selective sweep (A) Decline of the frequency (P) of the founding haplotype of the null allele over generations (G) We used the formula P=(1-r)G with the sum of the mutation and recombination rate r being 7061times10-5 per generation The dashed line shows the estimated P at present and its corresponding G (B) The increase of the frequency (p) of the null allele over generations (t) by positive selection based on the differential equation dpdt=p(1-p)s[ph+(1-p)(1-h)] Here we used p0=000005 h=011 s=0009 The dashed line shows the estimated p at present and its corresponding t
A
B
109
Table 41 Intraspecific variations in 9 noncoding regions linked to human CASPASE12
Region1 Length (nucleotide) Allele2 of SNPs π Standard error of π Probability3
1 674 C (8) 5 000307 000067T (8) 5 000413 000050 0205
2 675 C (8) 3 000206 000049T (8) 3 000206 000035 1000
3 773 C (8) 2 000102 000033T (8) 1 000069 000016 0368
4 2413 C (8) 19 000280 000053T (8) 1 000018 000007 lt0001T (22) 1 000015 000004 lt0001
5 1553 C (8) 9 000233 000051T (8) 8 000129 000071 0234T (22) 10 000069 000033 0007
6 592 C (8) 3 000175 000071T (8) 2 000145 000057 0741T (22) 4 000155 000041 0807
7 730 C (8) 3 000127 000046T (8) 3 000176 000069 0555
8 738 C (8) 2 000106 000034T (8) 3 000126 000038 0695
9 777 C (8) 7 000267 000071T (8) 3 000179 000046 0298
1 The chromosomal locations of the 9 regions are shown in Figure 312 C is the (ancestral) functional allele and T is the (derived) null allele The number of chromosomessequenced is given in parentheses Eight T chromosomes were initially sequenced for all the regions Subsequently we sequenced another 14 T chromosomes for regions 4 5 and 63 The probability that the nucleotide diversity is identical between T and C alleles for the regionconcerned (two-tail Z test)
41
110
Table 42 Results from coalescent simulations
Demographic models1 Probability ()2
Constant population size 0066Ancient population expansion 0006Recent population expansion 0068Several bottlenecks 0232Repeated bottlenecks with subsequent expansion 0126Population structure with 2 subpopulations 0066Population structure with 3 subpopulations 0116Population structure with 4 subpopulations 0358Population structure with 5 subpopulations 08241 The parameters used are detailed in Materials and Methods2 Proportion of cases with k 1+k 2 ge 61 in 50000 simulation replications
See main text for details
111
Table 43 SNPs identified in the noncoding regions linked with CASP12
Nucleotide positions1 SNPs2 Allele frequency ()3 Sample size4
-9705 CT 375 8-9612 AG 125 8-9598 CT 625 8-9548 GA 437 8-9499 CT 375 8-9150 GA 63 8-5519 CT 63 8-5194 TC 375 8-5042 CT 625 8-4993 AG 188 8233 AG 250 8657 TC 313 8
2516 TG 14 352621 CA 14 352674 AG 14 353000 GA 914 353081 AG 957 353142 AC 914 353148 CT 914 353869 TC 14 353957 AG 86 353980 GA 86 354018 GA 914 354045 CT 14 354111 TA 700 354181 TC 14 354239 AT 71 354706 TA 914 354759 GT 14 354855 TC 14 355083 CT 14 355175 CT 86 358335 TG 767 158453 CG 767 158642 GA 67 158667 AT 33 158893 CT 67 159440 CA 133 159586 GA 233 159854 TC 233 159951 AT 767 1510168 GA 233 1510239 GA 33 1510250 CT 33 1511823 GT 33 1511867 TC 733 1511968 CT 200 1514642 TC 188 814771 AT 750 814959 CT 188 818112 GA 63 818374 TC 63 818439 GA 250 818716 TC 186 820030 CT 63 820093 CT 63 820118 TG 125 820133 AC 688 820244 AG 63 820298 CG 375 820516 AG 375 8
1 The nucleotide positions are relative to the start codon ATG of the CASP12 gene2 The ancestralderived nucleotides are given for each SNP3 Frequency of the derived allele estimated from individuals of African descent4 Number of sequenced human individuals with African descent
112
47 LITERATURE CITED
Alexander S Lilly E Angus D Barnato A Linde-Zwirbe W (2004) Racial variation in the incidence ICU utilization and mortality of severe sepsis Critical Care Medicine 32
Alnemri ES Livingston DJ Nicholson DW Salvesen G Thornberry NA Wong WW Yuan J (1996) Human ICECED-3 protease nomenclature Cell 87171
Britten RJ (2002) Divergence between samples of chimpanzee and human DNA sequences is 5 counting indels Proc Natl Acad Sci U S A 9913633-13635
Brunet M Guy F Pilbeam D Mackaye HT Likius A Ahounta D Beauvilain A et al (2002) A new hominid from the Upper Miocene of Chad Central Africa Nature 418145-151
Cavalli-Sforza LL Feldman MW (2003) The application of molecular genetic approaches to the study of human evolution Nat Genet 33 Suppl266-275
Chen FC Li WH (2001) Genomic divergences between humans and other hominoids and the effective population size of the common ancestor of humans and chimpanzees Am J Hum Genet 68444-456
Chou HH Hayakawa T Diaz S Krings M Indriati E Leakey M Paabo S Satta Y Takahata N Varki A (2002) Inactivation of CMP-N-acetylneuraminic acid hydroxylase occurred prior to brain expansion during human evolution Proc Natl Acad Sci U S A 9911736-11741
Chou HH Takematsu H Diaz S Iber J Nickerson E Wright KL Muchmore EA Nelson DL Warren ST Varki A (1998) A mutation in human CMP-sialic acid hydroxylase occurred after the Homo-Pan divergence Proc Natl Acad Sci U S A 9511751-11756
Ebersberger I Metzler D Schwarz C Paabo S (2002) Genomewide comparison of DNA sequences between humans and chimpanzees Am J Hum Genet 701490-1497
Enard W Przeworski M Fisher SE Lai CS Wiebe V Kitano T Monaco AP Paabo S (2002) Molecular evolution of FOXP2 a gene involved in speech and language Nature 418869-872
Evans PD Gilbert SL Mekel-Bobrov N Vallender EJ Anderson JR Vaez-Azizi LM Tishkoff SA Hudson RR Lahn BT (2005) Microcephalin a gene regulating brain size continues to evolve adaptively in humans Science 3091717-1720
Fay JC Wu CI (2000) Hitchhiking under positive Darwinian selection Genetics 1551405-1413
Fischer A Gilad Y Man O Paabo S (2005) Evolution of bitter taste receptors in humans and apes Mol Biol Evol 22432-436
Fischer H Koenig U Eckhart L Tschachler E (2002) Human caspase 12 has acquired deleterious mutations Biochem Biophys Res Commun 293722-726
Fortna A Kim Y MacLaren E Marshall K Hahn G Meltesen L Brenton M Hink R Burgers S Hernandez-Boussard T Karimpour-Fard A Glueck D McGavran L Berry R Pollack J Sikela JM (2004) Lineage-specific gene duplication and loss in human and great ape evolution PLoS Biol 2E207
Galvani AP Novembre J (2005) The evolutionary history of the CCR5-Delta32 HIV-resistance mutation Microbes Infect 7302-309
113
Gilad Y Man O Paabo S Lancet D (2003) Human specific loss of olfactory receptor genes Proc Natl Acad Sci U S A 1003324-3327
Go Y Satta Y Takenaka O Takahata N (2005) Lineage-specific loss of function of bitter taste receptor genes in humans and nonhuman primates Genetics 170313-326
Greenberg AJ Moran JR Coyne JA Wu CI (2003) Ecological adaptation during incipient speciation revealed by precise gene replacement Science 3021754-1757
Grus WE Shi P Zhang YP Zhang J (2005) Dramatic variation of the vomeronasal pheromone receptor gene repertoire among five orders of placental and marsupial mammals Proc Natl Acad Sci U S A 1025767-5772
Hamann J Kwakkenbos MJ de Jong EC Heus H Olsen AS van Lier RA (2003) Inactivation of the EGF-TM7 receptor EMR4 after the Pan-Homo divergence Eur J Immunol 331365-1371
Hamblin MT Thompson EE Di Rienzo A (2002) Complex signatures of natural selection at the Duffy blood group locus Am J Hum Genet 70369-383
Harpending H Rogers A (2000) Genetic perspectives on human origins and differentiation Annu Rev Genomics Hum Genet 1361-385
Harpending HC Batzer MA Gurven M Jorde LB Rogers AR Sherry ST (1998) Genetic traces of ancient demography Proc Natl Acad Sci U S A 951961-1967
Hartl D Clark A (1997) Principles of Populations Genetics Sinauer Sunderland Massachusetts
Hayakawa T Satta Y Gagneux P Varki A Takahata N (2001) Alu-mediated inactivation of the human CMP- N-acetylneuraminic acid hydroxylase gene Proc Natl Acad Sci U S A 9811399-11404
Hudson RR (2002) Generating samples under a Wright-Fisher neutral model of genetic variation Bioinformatics 18337-338
Hughes A (1999) Adaptive Evolution of Genes and Genomes Oxford University Press New York
Kimura M (1983) The Neutral Theory of Molecular Evolution Cambridge University Press Cambridge
Kimura M Ohta T (1973) Age of a Neutral Mutant Persisting in a Finite Population Genetics 75199-212
Kong A Gudbjartsson DF Sainz J Jonsdottir GM Gudjonsson SA Richardsson B Sigurdardottir S Barnard J Hallbeck B Masson G Shlien A Palsson ST Frigge ML Thorgeirsson TE Gulcher JR Stefansson K (2002) A high-resolution recombination map of the human genome Nat Genet 31241-247
Lai CS Fisher SE Hurst JA Vargha-Khadem F Monaco AP (2001) A forkhead-domain gene is mutated in a severe speech and language disorder Nature 413519-523
Lamkanfi M Declercq W Kalai M Saelens X Vandenabeele P (2002) Alice in caspase land A phylogenetic analysis of caspases from worm to man Cell Death Differ 9358-361
Li WH Saunders MA (2005) The chimpanzee and us Nature 43750-51 Maynard Smith J Haigh J (1974) The hitch-hiking effect of a favourable gene Genet Res
2323-35 Meyer-Olson D Brady KW Blackard JT Allen TM Islam S Shoukry NH Hartman K
Walker CM Kalams SA (2003) Analysis of the TCR beta variable gene repertoire
114
in chimpanzees identification of functional homologs to human pseudogenes J Immunol 1704161-4169
Olson MV (1999) When less is more gene loss as an engine of evolutionary change Am J Hum Genet 6418-23
Olson MV Varki A (2003) Sequencing the chimpanzee genome insights into human evolution and disease Nat Rev Genet 420-28
Perry GH Verrelli BC Stone AC (2005) Comparative analyses reveal a complex history of molecular evolution for human MYH16 Mol Biol Evol 22379-382
Przeworski M (2003) Estimating the time since the fixation of a beneficial allele Genetics 1641667-1676
Rozas J Rozas R (1999) DnaSP version 3 an integrated program for molecular population genetics and molecular evolution analysis Bioinformatics 15174-175
Sabeti PC Reich DE Higgins JM Levine HZ Richter DJ Schaffner SF Gabriel SB Platko JV Patterson NJ McDonald GJ Ackerman HC Campbell SJ Altshuler D Cooper R Kwiatkowski D Ward R Lander ES (2002) Detecting recent positive selection in the human genome from haplotype structure Nature 419832-837
Sabeti PC Walsh E Schaffner SF Varilly P Fry B Hutcheson HB Cullen M Mikkelsen TS Roy J Patterson N Cooper R Reich D Altshuler D OBrien S Lander ES (2005) The case for selection at CCR5-Delta32 PLoS Biol 3e378
Saleh M Vaillancourt JP Graham RK Huyck M Srinivasula SM Alnemri ES Steinberg MH Nolan V Baldwin CT Hotchkiss RS Buchman TG Zehnbauer BA Hayden MR Farrer LA Roy S Nicholson DW (2004) Differential modulation of endotoxin responsiveness by human caspase-12 polymorphisms Nature 42975-79
Shimizu KK Cork JM Caicedo AL Mays CA Moore RC Olsen KM Ruzsa S Coop G Bustamante CD Awadalla P Purugganan MD (2004) Darwinian selection on a selfing locus Science 3062081-2084
Stedman HH Kozyak BW Nelson A Thesier DM Su LT Low DW Bridges CR Shrager JB Minugh-Purvis N Mitchell MA (2004) Myosin gene mutation correlates with anatomical changes in the human lineage Nature 428415-418
Stephens JC Reich DE Goldstein DB Shin HD Smith MW Carrington M Winkler C et al (1998) Dating the origin of the CCR5-Delta32 AIDS-resistance allele by the coalescence of haplotypes Am J Hum Genet 621507-1515
Szabo Z Levi-Minzi SA Christiano AM Struminger C Stoneking M Batzer MA Boyd CD (1999) Sequential loss of two neighboring exons of the tropoelastin gene during primate evolution J Mol Evol 49664-671
Tajima F (1989) Statistical method for testing the neutral mutation hypothesis by DNA polymorphism Genetics 123585-595
Takahashi A Tsaur SC Coyne JA Wu CI (2001) The nucleotide changes governing cuticular hydrocarbon variation and their evolution in Drosophila melanogaster Proc Natl Acad Sci U S A 983920-3925
Takahata N Satta Y Klein J (1995) Divergence time and population size in the lineage leading to modern humans Theor Popul Biol 48198-221
The Chimpanzee Sequencing and Analysis Consortium (2005) Initial sequence of the chimpanzee genome and comparison with the human genome Nature 43769-87
115
Varki A (2001) Loss of N-glycolylneuraminic acid in humans Mechanisms consequences and implications for hominid evolution Am J Phys Anthropol Suppl 3354-69
Wang X Thomas SD Zhang J (2004) Relaxation of selective constraint and loss of function in the evolution of human bitter taste receptor genes Hum Mol Genet 132671-2678
Watanabe H Fujiyama A Hattori M Taylor TD Toyoda A Kuroki Y Noguchi H et al (2004) DNA sequence and comparative analysis of chimpanzee chromosome 22 Nature 429382-388
Wildman DE Uddin M Liu G Grossman LI Goodman M (2003) Implications of natural selection in shaping 994 nonsynonymous DNA identity between humans and chimpanzees enlarging genus Homo Proc Natl Acad Sci U S A 1007181-7188
Winter H Langbein L Krawczak M Cooper DN Jave-Suarez LF Rogers MA Praetzel S Heidt PJ Schweizer J (2001) Human type I hair keratin pseudogene phihHaA has functional orthologs in the chimpanzee and gorilla evidence for recent inactivation of the human gene after the Pan-Homo divergence Hum Genet 10837-42
Zhang J (2003) Evolution by gene duplication an update Trends Ecol Evolut 18292-298 Zhang J Webb DM Podlaha O (2002) Accelerated protein evolution and origins of
human-specific features Foxp2 as an example Genetics 1621825-1835 Zietkiewicz E Richer C Sinnett D Labuda D (1998) Monophyletic origin of Alu
elements in primates J Mol Evol 47172-182
116
- CHAPTER 3 RELAXATION OF SELECTIVE CONSTRAINT AND LOSS OF FUNCTION IN THE EVOLUTION OF HUMAN BITTER TASTE RECEPTOR GENEShelliphelliphelliphelliphelliphelliphelliphelliphelliphelliphelliphelliphelliphelliphelliphelliphelliphelliphelliphelliphelliphelliphelliphellip
- totalpdf
-
- CHAPTER 3 RELAXATION OF SELECTIVE CONSTRAINT AND LOSS OF FUNCTION IN THE EVOLUTION OF HUMAN BITTER TASTE RECEPTOR GENEShelliphelliphelliphelliphelliphelliphelliphelliphelliphelliphelliphelliphelliphelliphelliphelliphelliphelliphelliphelliphelliphelliphelliphellip
- totalpdf
-
- CHAPTER 3 RELAXATION OF SELECTIVE CONSTRAINT AND LOSS OF FUNCTION IN THE EVOLUTION OF HUMAN BITTER TASTE RECEPTOR GENEShelliphelliphelliphelliphelliphelliphelliphelliphelliphelliphelliphelliphelliphelliphelliphelliphelliphelliphelliphelliphelliphelliphelliphellip
- CHAPTER3pdf
-
- RELAXATION OF SELECTIVE CONSTRAINT AND LOSS OF FUNCTION IN THE EVOLUTION OF HUMAN BITTER TASTE RECEPTOR GENES
-
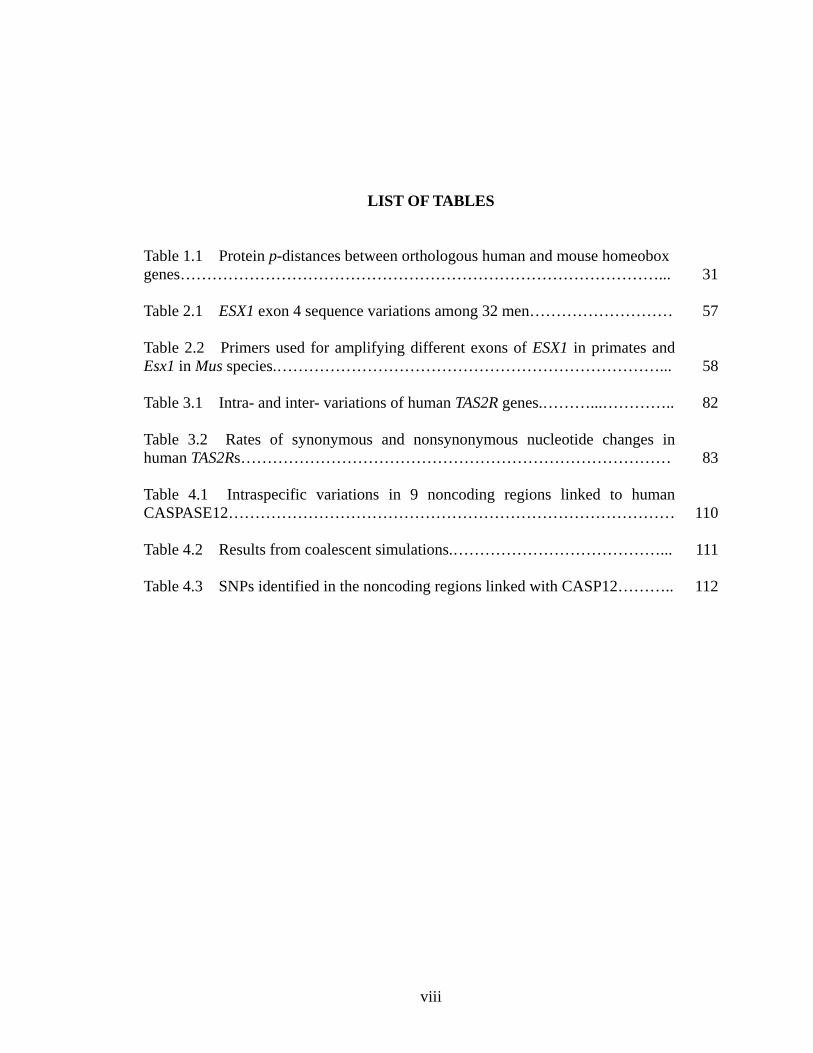