
Real Estate Securities Funds Monthly
Period End: May 2015
CONTENTS Page Summary 2
May 2015 Performance 3
YTD Performance 4
Focus: Fundamental Indices 5
Global Real Estate Funds 7
Global REIT Funds 8
US Real Estate Funds 9
European Real Estate Funds 10
Asian Real Estate Funds 11
Japanese Real Estate Funds 12
Global Infrastructure & Real Assets Funds 13
May 2015
Author: Alex Moss [email protected]
2
Consilia Capital www.consiliacapital.com
Real Estate Securities Funds Monthly
Summary This month we have divided the report into the following sections:
1) A summary of May performance by fund mandate and size (p3 )
2) A summary of YTD performance (p4)
3) Focus: Fundamental Indices (ps 5-6)
Last month we looked at two papers which showed how utilizing different Smart Beta strategies affect returns. Our paper, with Kieran Farrelly, took an initial look at the Global market, 2004-2014, and examined how a number of strategies (LTV, Price to Book Value, Total assets) provided superior returns. The other paper by C. Stace Sirmans and Professor G. Stacy Sirmans provided a model for determining the unexpected value in Market-to-Book ratios. Their long/short value strategy built on the unexpected component of the market-to-book ratio produced returns of 1.21% per month over 1985-2013, nearly three times as high and much more statistically robust than simply trading on the raw market-to-book ratio. This month we look at a specific aspect of Alternative Indexation, namely Fundamental Indices. In particular we examine two different styles of Indices which are currently on the market: They are: 1) The Kempen Global Property Fundamental Index ®Strategy, and 2) The Dow Jones Townsend Core US REIT Index. Next month we will be featuring papers from the forthcoming European Real Estate Society Conference in Istanbul
4) Detailed performance statistics by region (ps 7-13 ) for May 2015
For each mandate we show: the dispersion of returns by Fund AUM, popular benchmark returns and volatility, average, maximum and minimum fund returns, the best performing funds by size, for each mandate. For consistency, all returns are rebased in US$. Finally, it is important to note that there are no recommendations or investment advice contained in this publication, and that it is not intended for retail investors. This report represents only a very small summary of the outputs of our database, and the bespoke research and advisory service work we undertake for clients. For further details of our work please contact us.
Mandate May return US$%
US Real estate -0.67
Global Real Estate -1.93
Real Assets Fund -2.28
Global Infrastructure Fund -2.60
Global REIT -2.66
European real estate -2.91
Asian Real estate -2.96Japan Real Estate -3.38
Mandate YTD return US$%
European real estate 4.19
Asian Real estate 4.13Global Real Estate 0.68
Global Infrastructure Fund -0.21
Real Assets Fund -0.85
US Real estate -1.69
Global REIT -1.76Japan Real Estate -2.99
3
Consilia Capital www.consiliacapital.com
Real Estate Securities Funds Monthly
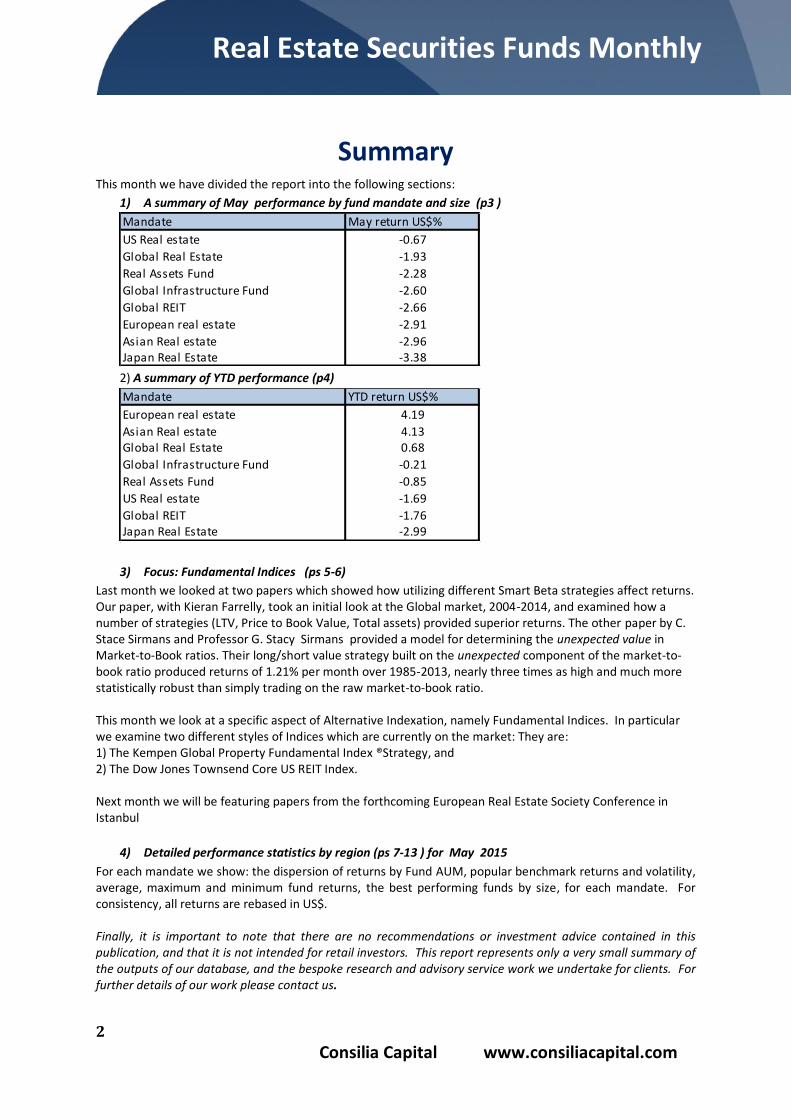
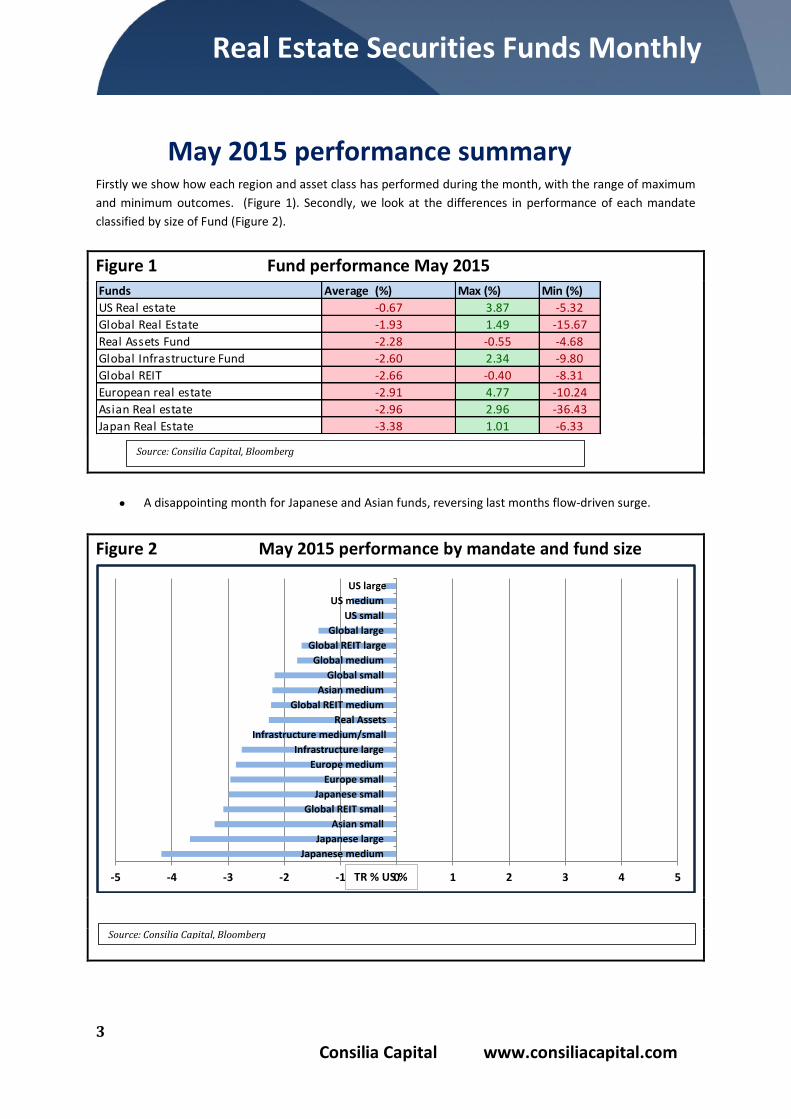
May 2015 performance summary Firstly we show how each region and asset class has performed during the month, with the range of maximum
and minimum outcomes. (Figure 1). Secondly, we look at the differences in performance of each mandate
classified by size of Fund (Figure 2).
Figure 1 Fund performance May 2015
A disappointing month for Japanese and Asian funds, reversing last months flow-driven surge.
Figure 2 May 2015 performance by mandate and fund size
Funds Average (%) Max (%) Min (%)
US Real estate -0.67 3.87 -5.32
Global Real Estate -1.93 1.49 -15.67
Real Assets Fund -2.28 -0.55 -4.68
Global Infrastructure Fund -2.60 2.34 -9.80
Global REIT -2.66 -0.40 -8.31
European real estate -2.91 4.77 -10.24
Asian Real estate -2.96 2.96 -36.43
Japan Real Estate -3.38 1.01 -6.33
-5 -4 -3 -2 -1 0 1 2 3 4 5
Japanese medium
Japanese large
Asian small
Global REIT small
Japanese small
Europe small
Europe medium
Infrastructure large
Infrastructure medium/small
Real Assets
Global REIT medium
Asian medium
Global small
Global medium
Global REIT large
Global large
US small
US medium
US large
TR % US %
Source: Consilia Capital, Bloomberg
Source: Consilia Capital, Bloomberg
4
Consilia Capital www.consiliacapital.com
Real Estate Securities Funds Monthly
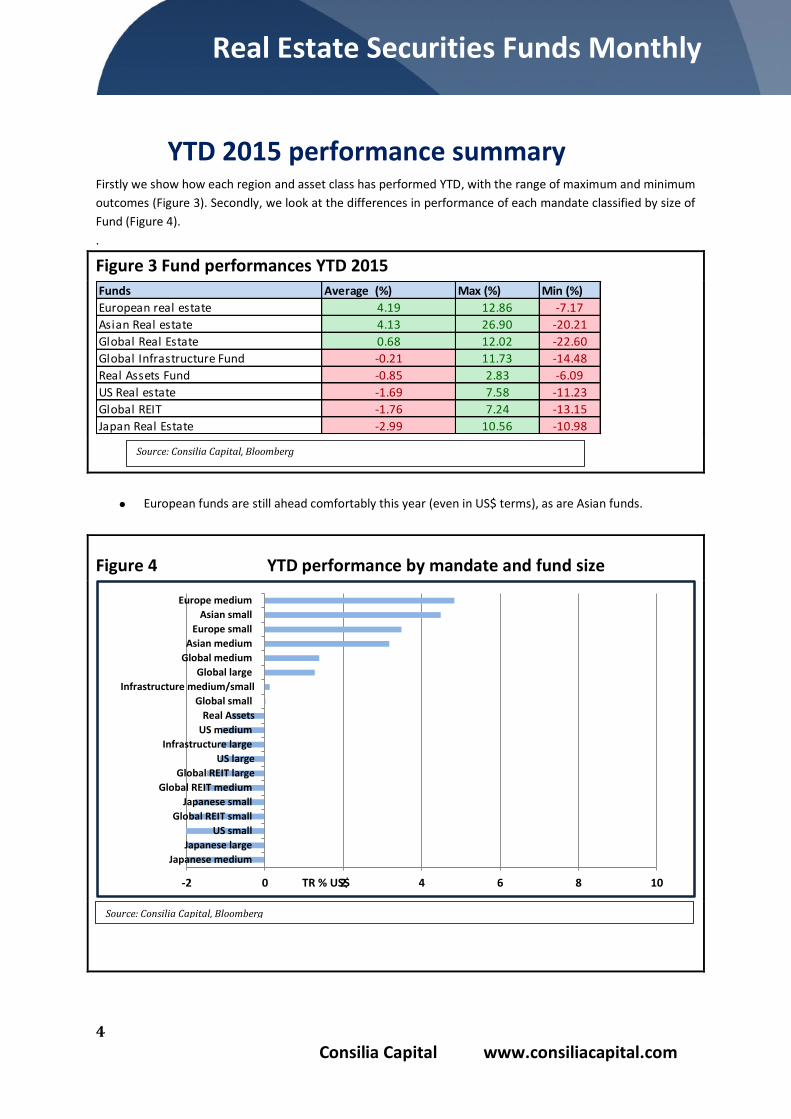
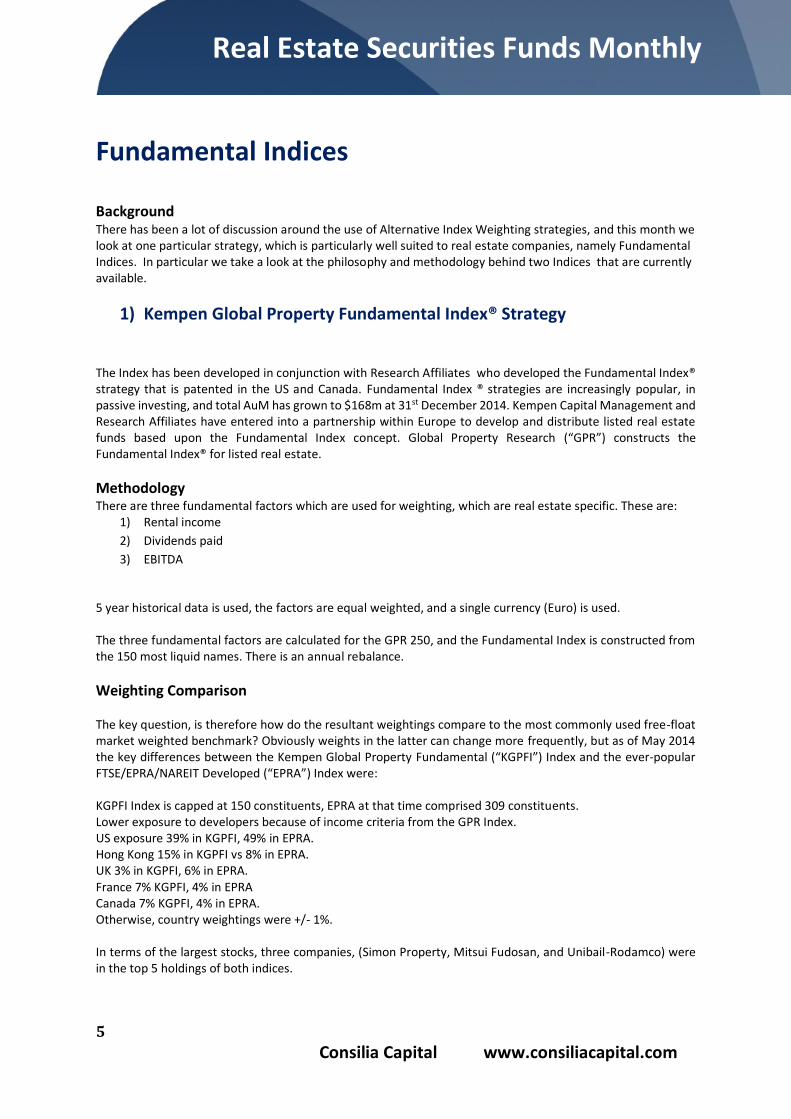
YTD 2015 performance summary Firstly we show how each region and asset class has performed YTD, with the range of maximum and minimum
outcomes (Figure 3). Secondly, we look at the differences in performance of each mandate classified by size of
Fund (Figure 4).
.
Figure 3 Fund performances YTD 2015
European funds are still ahead comfortably this year (even in US$ terms), as are Asian funds.
Figure 4 YTD performance by mandate and fund size
Funds Average (%) Max (%) Min (%)
European real estate 4.19 12.86 -7.17
Asian Real estate 4.13 26.90 -20.21
Global Real Estate 0.68 12.02 -22.60
Global Infrastructure Fund -0.21 11.73 -14.48
Real Assets Fund -0.85 2.83 -6.09
US Real estate -1.69 7.58 -11.23
Global REIT -1.76 7.24 -13.15
Japan Real Estate -2.99 10.56 -10.98
-2 0 2 4 6 8 10
Japanese medium
Japanese large
US small
Global REIT small
Japanese small
Global REIT medium
Global REIT large
US large
Infrastructure large
US medium
Real Assets
Global small
Infrastructure medium/small
Global large
Global medium
Asian medium
Europe small
Asian small
Europe medium
TR % US$
Source: Consilia Capital, Bloomberg
Source: Consilia Capital, Bloomberg
5
Consilia Capital www.consiliacapital.com
Real Estate Securities Funds Monthly
Fundamental Indices
Background There has been a lot of discussion around the use of Alternative Index Weighting strategies, and this month we look at one particular strategy, which is particularly well suited to real estate companies, namely Fundamental Indices. In particular we take a look at the philosophy and methodology behind two Indices that are currently available.
1) Kempen Global Property Fundamental Index® Strategy
The Index has been developed in conjunction with Research Affiliates who developed the Fundamental Index® strategy that is patented in the US and Canada. Fundamental Index ® strategies are increasingly popular, in passive investing, and total AuM has grown to $168m at 31st December 2014. Kempen Capital Management and Research Affiliates have entered into a partnership within Europe to develop and distribute listed real estate funds based upon the Fundamental Index concept. Global Property Research (“GPR”) constructs the Fundamental Index® for listed real estate.
Methodology There are three fundamental factors which are used for weighting, which are real estate specific. These are:
1) Rental income
2) Dividends paid
3) EBITDA
5 year historical data is used, the factors are equal weighted, and a single currency (Euro) is used. The three fundamental factors are calculated for the GPR 250, and the Fundamental Index is constructed from the 150 most liquid names. There is an annual rebalance.
Weighting Comparison The key question, is therefore how do the resultant weightings compare to the most commonly used free-float market weighted benchmark? Obviously weights in the latter can change more frequently, but as of May 2014 the key differences between the Kempen Global Property Fundamental (“KGPFI”) Index and the ever-popular FTSE/EPRA/NAREIT Developed (“EPRA”) Index were: KGPFI Index is capped at 150 constituents, EPRA at that time comprised 309 constituents. Lower exposure to developers because of income criteria from the GPR Index. US exposure 39% in KGPFI, 49% in EPRA. Hong Kong 15% in KGPFI vs 8% in EPRA. UK 3% in KGPFI, 6% in EPRA. France 7% KGPFI, 4% in EPRA Canada 7% KGPFI, 4% in EPRA. Otherwise, country weightings were +/- 1%. In terms of the largest stocks, three companies, (Simon Property, Mitsui Fudosan, and Unibail-Rodamco) were in the top 5 holdings of both indices.
6
Consilia Capital www.consiliacapital.com
Real Estate Securities Funds Monthly
2) Dow Jones Townsend Core US REIT Index
Objective The Dow Jones Townsend Core U.S. REIT Index aims to measure the performance of a basket of securities that could collectively serve as a public-market analog for privately-held institutional “core” real estate investments. The index is offered collaboratively by S&P Dow Jones Indices and The Townsend Group.
Key features To be eligible for the index, a company must have a REIT corporate structure and must be both an equity owner and operator of commercial and/or residential real estate. Companies also must meet minimum requirements for size and liquidity, and must be U.S.-domiciled. Included in the index are companies invested in “core” property types-Office, Industrial, Residential and Retail-and in “alternative” property types-Health Care, Self-Storage and Specialty. Specifically excluded are companies invested in the following property types: Factory Outlets, Hotels, Manufactured Homes, Mixed Industrial/Office and Suburban Office. The index is weighted by float-adjusted market capitalization, subject to restrictions that place upper limits on weightings.
The Dow Jones Townsend Core U.S. REIT Index was first calculated on November 19, 2012.
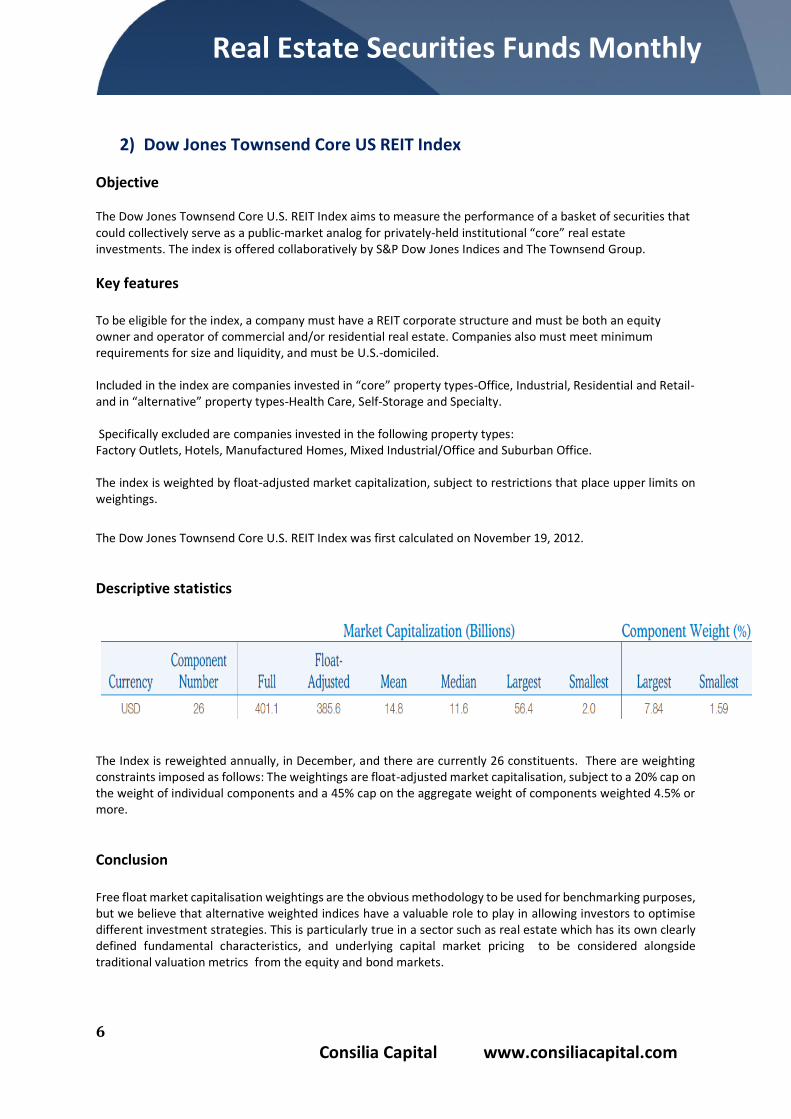
Descriptive statistics
The Index is reweighted annually, in December, and there are currently 26 constituents. There are weighting constraints imposed as follows: The weightings are float-adjusted market capitalisation, subject to a 20% cap on the weight of individual components and a 45% cap on the aggregate weight of components weighted 4.5% or more.
Conclusion Free float market capitalisation weightings are the obvious methodology to be used for benchmarking purposes, but we believe that alternative weighted indices have a valuable role to play in allowing investors to optimise different investment strategies. This is particularly true in a sector such as real estate which has its own clearly defined fundamental characteristics, and underlying capital market pricing to be considered alongside traditional valuation metrics from the equity and bond markets.
7
Consilia Capital www.consiliacapital.com
Real Estate Securities Funds Monthly
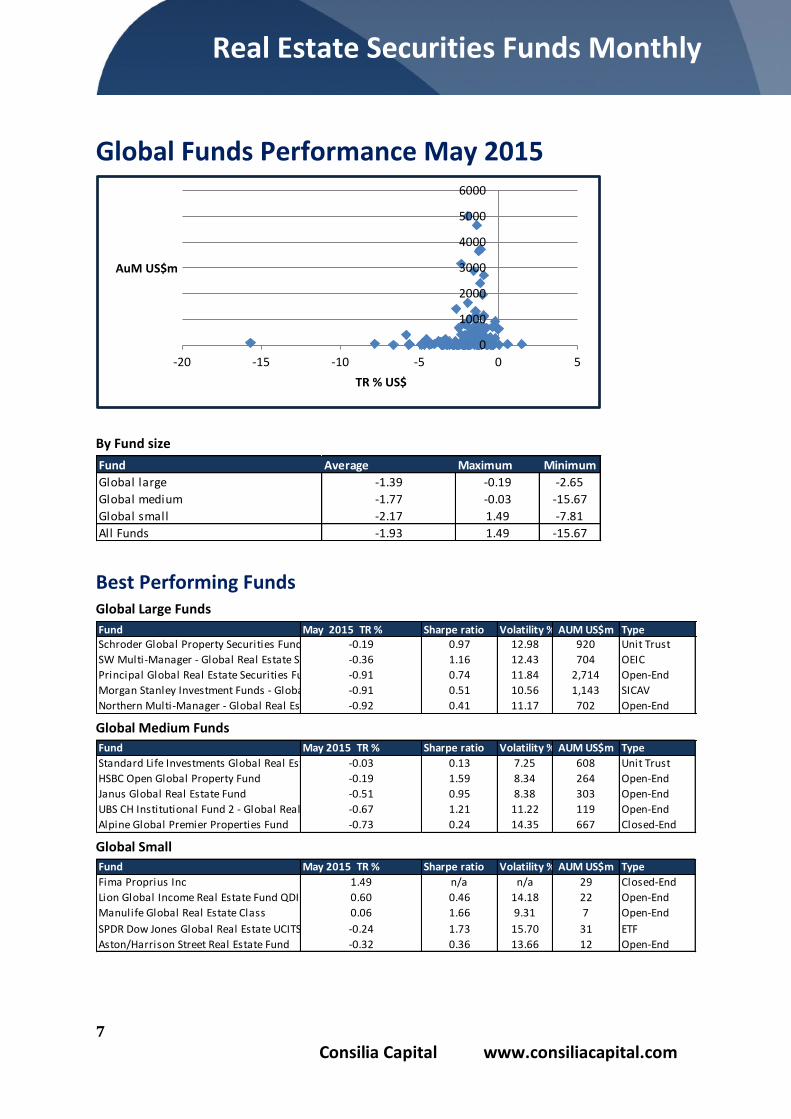
Global Funds Performance May 2015
By Fund size
Best Performing Funds Global Large Funds
Global Medium Funds
Global Small
0
1000
2000
3000
4000
5000
6000
-20 -15 -10 -5 0 5
AuM US$m
TR % US$
Fund Average Maximum Minimum
Global large -1.39 -0.19 -2.65
Global medium -1.77 -0.03 -15.67
Global small -2.17 1.49 -7.81
All Funds -1.93 1.49 -15.67
Fund May 2015 TR % Sharpe ratio Volatility % AUM US$m TypeSchroder Global Property Securities Fund -0.19 0.97 12.98 920 Unit Trust
SW Multi-Manager - Global Real Estate Securities Fund-0.36 1.16 12.43 704 OEIC
Principal Global Real Estate Securities Fund -0.91 0.74 11.84 2,714 Open-End
Morgan Stanley Investment Funds - Global Property Fund-0.91 0.51 10.56 1,143 SICAV
Northern Multi-Manager - Global Real Estate Fund -0.92 0.41 11.17 702 Open-End
Fund May 2015 TR % Sharpe ratio Volatility % AUM US$m Type
Standard Life Investments Global Real Estate Fund -0.03 0.13 7.25 608 Unit Trust
HSBC Open Global Property Fund -0.19 1.59 8.34 264 Open-End
Janus Global Real Estate Fund -0.51 0.95 8.38 303 Open-End
UBS CH Institutional Fund 2 - Global Real Estate Securities-0.67 1.21 11.22 119 Open-End
Alpine Global Premier Properties Fund -0.73 0.24 14.35 667 Closed-End
Fund May 2015 TR % Sharpe ratio Volatility % AUM US$m Type
Fima Proprius Inc 1.49 n/a n/a 29 Closed-End
Lion Global Income Real Estate Fund QDII 0.60 0.46 14.18 22 Open-End
Manulife Global Real Estate Class 0.06 1.66 9.31 7 Open-End
SPDR Dow Jones Global Real Estate UCITS ETF -0.24 1.73 15.70 31 ETF
Aston/Harrison Street Real Estate Fund -0.32 0.36 13.66 12 Open-End
8
Consilia Capital www.consiliacapital.com
Real Estate Securities Funds Monthly
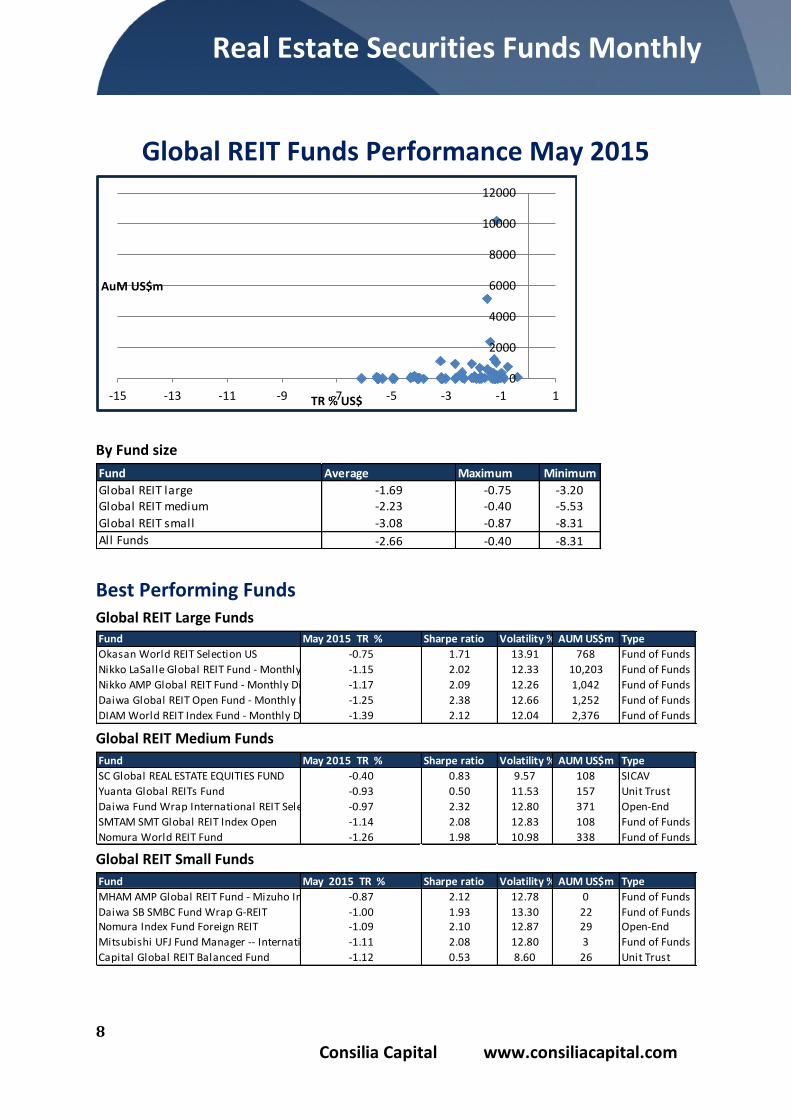
Global REIT Funds Performance May 2015
By Fund size
Best Performing Funds Global REIT Large Funds
Global REIT Medium Funds
Global REIT Small Funds
0
2000
4000
6000
8000
10000
12000
-15 -13 -11 -9 -7 -5 -3 -1 1
AuM US$m
TR % US$
Fund Average Maximum Minimum
Global REIT large -1.69 -0.75 -3.20Global REIT medium -2.23 -0.40 -5.53
Global REIT small -3.08 -0.87 -8.31
All Funds -2.66 -0.40 -8.31
Fund May 2015 TR % Sharpe ratio Volatility % AUM US$m Type
Okasan World REIT Selection US -0.75 1.71 13.91 768 Fund of Funds
Nikko LaSalle Global REIT Fund - Monthly Dividend-1.15 2.02 12.33 10,203 Fund of Funds
Nikko AMP Global REIT Fund - Monthly Dividend A - Non Hedged-1.17 2.09 12.26 1,042 Fund of Funds
Daiwa Global REIT Open Fund - Monthly Dividend -1.25 2.38 12.66 1,252 Fund of Funds
DIAM World REIT Index Fund - Monthly Dividend -1.39 2.12 12.04 2,376 Fund of Funds
Fund May 2015 TR % Sharpe ratio Volatility % AUM US$m Type
SC Global REAL ESTATE EQUITIES FUND -0.40 0.83 9.57 108 SICAV
Yuanta Global REITs Fund -0.93 0.50 11.53 157 Unit Trust
Daiwa Fund Wrap International REIT Select -0.97 2.32 12.80 371 Open-End
SMTAM SMT Global REIT Index Open -1.14 2.08 12.83 108 Fund of Funds
Nomura World REIT Fund -1.26 1.98 10.98 338 Fund of Funds
Fund May 2015 TR % Sharpe ratio Volatility % AUM US$m Type
MHAM AMP Global REIT Fund - Mizuho Investors SMA-0.87 2.12 12.78 0 Fund of Funds
Daiwa SB SMBC Fund Wrap G-REIT -1.00 1.93 13.30 22 Fund of FundsNomura Index Fund Foreign REIT -1.09 2.10 12.87 29 Open-End
Mitsubishi UFJ Fund Manager -- International REIT-1.11 2.08 12.80 3 Fund of Funds
Capital Global REIT Balanced Fund -1.12 0.53 8.60 26 Unit Trust
9
Consilia Capital www.consiliacapital.com
Real Estate Securities Funds Monthly
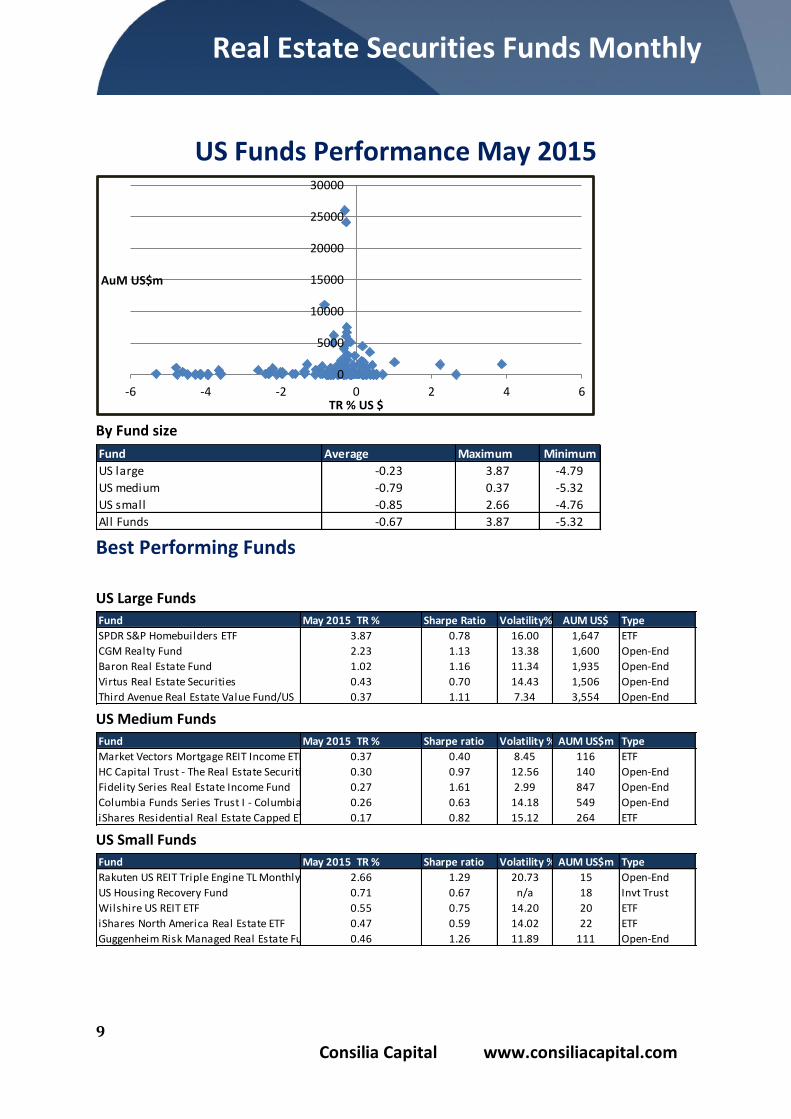
US Funds Performance May 2015
By Fund size
Best Performing Funds
US Large Funds
US Medium Funds
US Small Funds
0
5000
10000
15000
20000
25000
30000
-6 -4 -2 0 2 4 6
AuM US$m
TR % US $
Fund Average Maximum Minimum
US large -0.23 3.87 -4.79
US medium -0.79 0.37 -5.32
US small -0.85 2.66 -4.76
All Funds -0.67 3.87 -5.32
Fund May 2015 TR % Sharpe Ratio Volatility% AUM US$ Type
SPDR S&P Homebuilders ETF 3.87 0.78 16.00 1,647 ETF
CGM Realty Fund 2.23 1.13 13.38 1,600 Open-End
Baron Real Estate Fund 1.02 1.16 11.34 1,935 Open-End
Virtus Real Estate Securities 0.43 0.70 14.43 1,506 Open-End
Third Avenue Real Estate Value Fund/US 0.37 1.11 7.34 3,554 Open-End
Fund May 2015 TR % Sharpe ratio Volatility % AUM US$m Type
Market Vectors Mortgage REIT Income ETF 0.37 0.40 8.45 116 ETF
HC Capital Trust - The Real Estate Securities Portfolio0.30 0.97 12.56 140 Open-End
Fidelity Series Real Estate Income Fund 0.27 1.61 2.99 847 Open-End
Columbia Funds Series Trust I - Columbia Real Estate Equity Fund0.26 0.63 14.18 549 Open-End
iShares Residential Real Estate Capped ETF 0.17 0.82 15.12 264 ETF
Fund May 2015 TR % Sharpe ratio Volatility % AUM US$m Type
Rakuten US REIT Triple Engine TL Monthly Dividend 2.66 1.29 20.73 15 Open-End
US Housing Recovery Fund 0.71 0.67 n/a 18 Invt Trust
Wilshire US REIT ETF 0.55 0.75 14.20 20 ETF
iShares North America Real Estate ETF 0.47 0.59 14.02 22 ETF
Guggenheim Risk Managed Real Estate Fund 0.46 1.26 11.89 111 Open-End
10
Consilia Capital www.consiliacapital.com
Real Estate Securities Funds Monthly
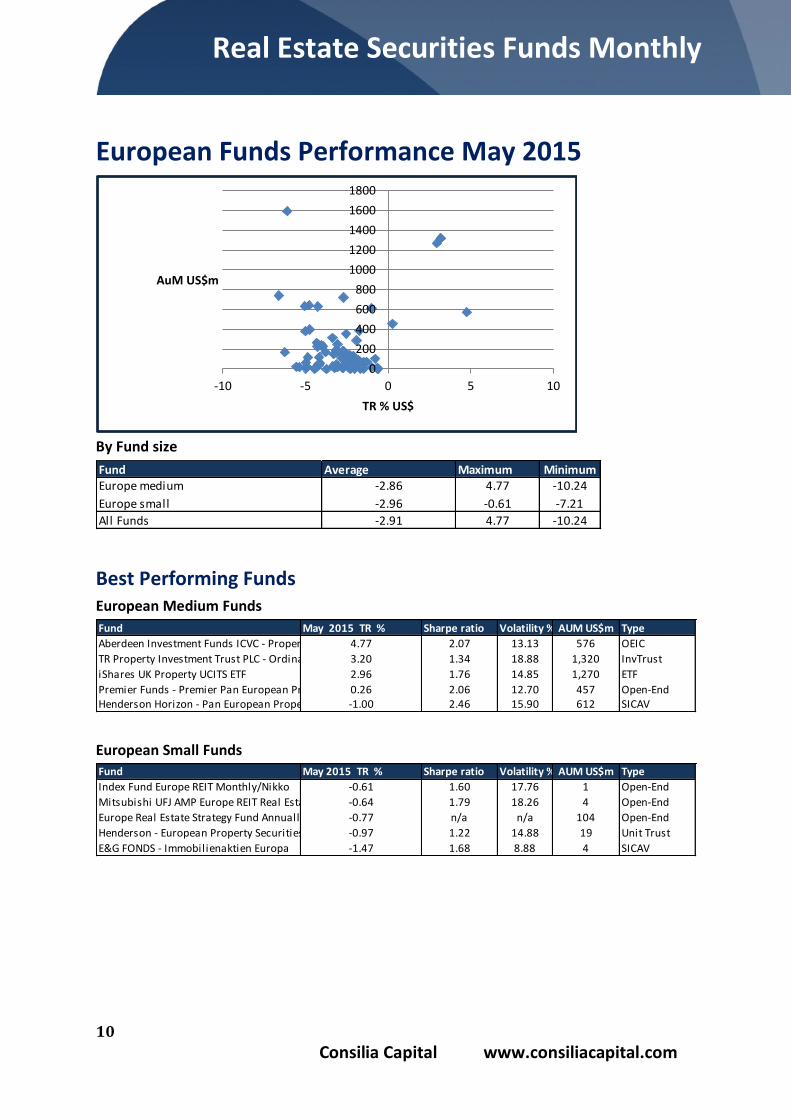
European Funds Performance May 2015
By Fund size
Best Performing Funds European Medium Funds
European Small Funds
0
200
400
600
800
1000
1200
1400
1600
1800
-10 -5 0 5 10
AuM US$m
TR % US$
Fund Average Maximum MinimumEurope medium -2.86 4.77 -10.24
Europe small -2.96 -0.61 -7.21
All Funds -2.91 4.77 -10.24
Fund May 2015 TR % Sharpe ratio Volatility % AUM US$m Type
Aberdeen Investment Funds ICVC - Property Share Fund4.77 2.07 13.13 576 OEIC
TR Property Investment Trust PLC - Ordinary Shares 3.20 1.34 18.88 1,320 InvTrust
iShares UK Property UCITS ETF 2.96 1.76 14.85 1,270 ETF
Premier Funds - Premier Pan European Property Share0.26 2.06 12.70 457 Open-End Henderson Horizon - Pan European Property Equities Fund-1.00 2.46 15.90 612 SICAV
Fund May 2015 TR % Sharpe ratio Volatility % AUM US$m Type
Index Fund Europe REIT Monthly/Nikko -0.61 1.60 17.76 1 Open-End
Mitsubishi UFJ AMP Europe REIT Real Estate Related Equity Annually-0.64 1.79 18.26 4 Open-End
Europe Real Estate Strategy Fund Annually/MHAM -0.77 n/a n/a 104 Open-End
Henderson - European Property Securities -0.97 1.22 14.88 19 Unit Trust
E&G FONDS - Immobilienaktien Europa -1.47 1.68 8.88 4 SICAV
11
Consilia Capital www.consiliacapital.com
Real Estate Securities Funds Monthly
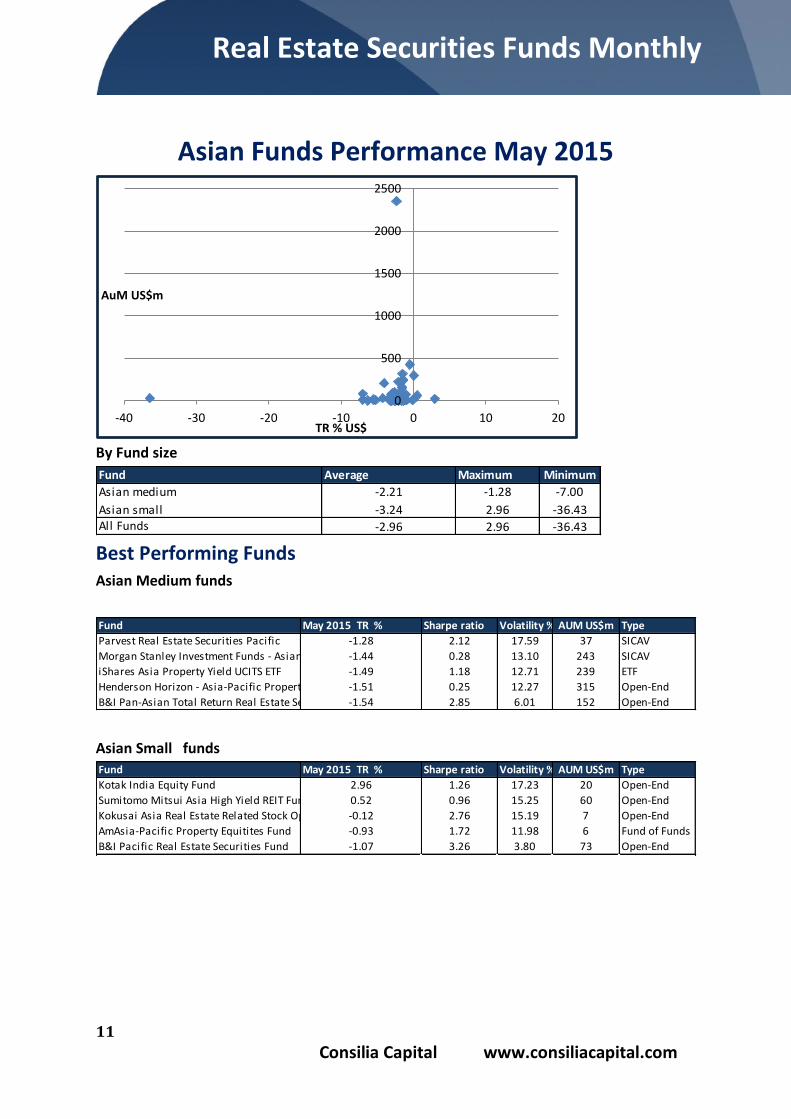
Asian Funds Performance May 2015
By Fund size
Best Performing Funds Asian Medium funds
Asian Small funds
0
500
1000
1500
2000
2500
-40 -30 -20 -10 0 10 20
AuM US$m
TR % US$
Fund Average Maximum Minimum
Asian medium -2.21 -1.28 -7.00
Asian small -3.24 2.96 -36.43All Funds -2.96 2.96 -36.43
Fund May 2015 TR % Sharpe ratio Volatility % AUM US$m Type
Parvest Real Estate Securities Pacific -1.28 2.12 17.59 37 SICAV
Morgan Stanley Investment Funds - Asian Property Fund-1.44 0.28 13.10 243 SICAV
iShares Asia Property Yield UCITS ETF -1.49 1.18 12.71 239 ETF
Henderson Horizon - Asia-Pacific Property Equities Fund-1.51 0.25 12.27 315 Open-End
B&I Pan-Asian Total Return Real Estate Securities Fund-1.54 2.85 6.01 152 Open-End
Fund May 2015 TR % Sharpe ratio Volatility % AUM US$m Type
Kotak India Equity Fund 2.96 1.26 17.23 20 Open-End
Sumitomo Mitsui Asia High Yield REIT Fund TRY 0.52 0.96 15.25 60 Open-End
Kokusai Asia Real Estate Related Stock Open -0.12 2.76 15.19 7 Open-End
AmAsia-Pacific Property Equitites Fund -0.93 1.72 11.98 6 Fund of Funds
B&I Pacific Real Estate Securities Fund -1.07 3.26 3.80 73 Open-End
12
Consilia Capital www.consiliacapital.com
Real Estate Securities Funds Monthly
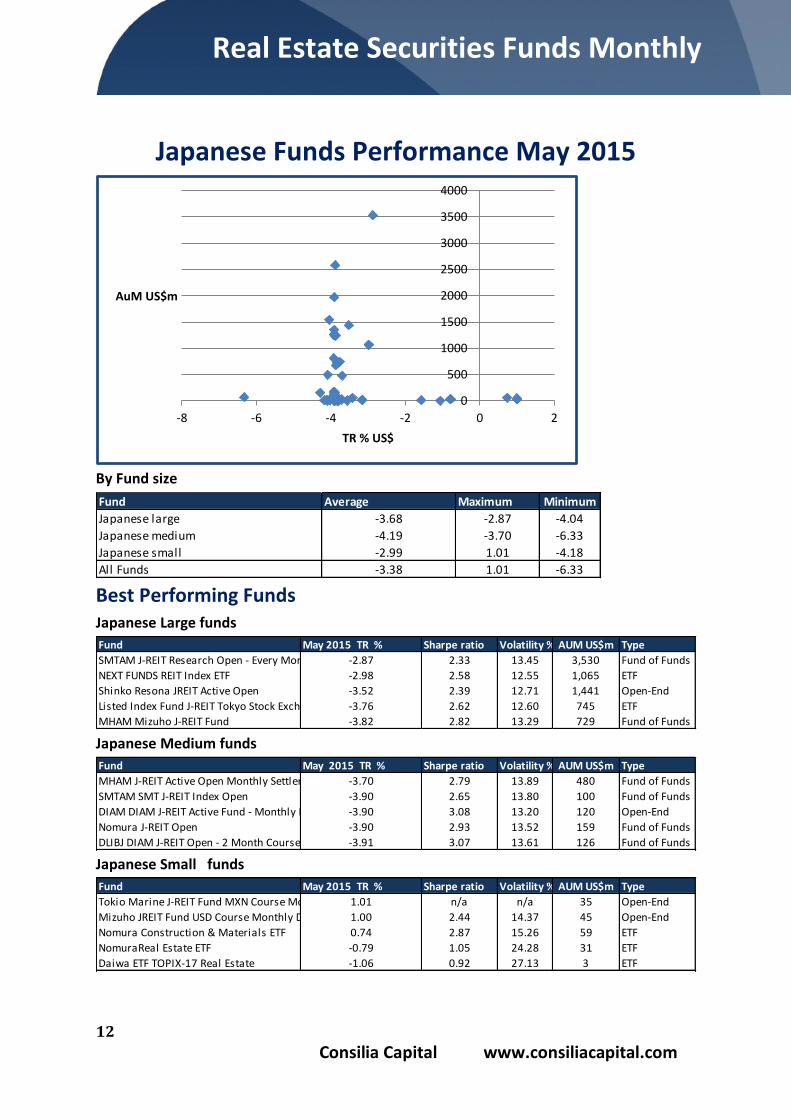
Japanese Funds Performance May 2015
By Fund size
Best Performing Funds Japanese Large funds
Japanese Medium funds
Japanese Small funds
0
500
1000
1500
2000
2500
3000
3500
4000
-8 -6 -4 -2 0 2
AuM US$m
TR % US$
Fund Average Maximum Minimum
Japanese large -3.68 -2.87 -4.04
Japanese medium -4.19 -3.70 -6.33
Japanese small -2.99 1.01 -4.18
All Funds -3.38 1.01 -6.33
Fund May 2015 TR % Sharpe ratio Volatility % AUM US$m Type
SMTAM J-REIT Research Open - Every Month -2.87 2.33 13.45 3,530 Fund of Funds
NEXT FUNDS REIT Index ETF -2.98 2.58 12.55 1,065 ETF
Shinko Resona JREIT Active Open -3.52 2.39 12.71 1,441 Open-End
Listed Index Fund J-REIT Tokyo Stock Exchange REIT Index - Bi Monthly Dividend-3.76 2.62 12.60 745 ETF
MHAM Mizuho J-REIT Fund -3.82 2.82 13.29 729 Fund of Funds
Fund May 2015 TR % Sharpe ratio Volatility % AUM US$m Type
MHAM J-REIT Active Open Monthly Settlement Course-3.70 2.79 13.89 480 Fund of Funds
SMTAM SMT J-REIT Index Open -3.90 2.65 13.80 100 Fund of Funds
DIAM DIAM J-REIT Active Fund - Monthly Dividend -3.90 3.08 13.20 120 Open-End
Nomura J-REIT Open -3.90 2.93 13.52 159 Fund of Funds
DLIBJ DIAM J-REIT Open - 2 Month Course - Owners Income 2M-3.91 3.07 13.61 126 Fund of Funds
Fund May 2015 TR % Sharpe ratio Volatility % AUM US$m Type
Tokio Marine J-REIT Fund MXN Course Monthly Dividend1.01 n/a n/a 35 Open-End
Mizuho JREIT Fund USD Course Monthly Dividend 1.00 2.44 14.37 45 Open-End
Nomura Construction & Materials ETF 0.74 2.87 15.26 59 ETF
NomuraReal Estate ETF -0.79 1.05 24.28 31 ETF
Daiwa ETF TOPIX-17 Real Estate -1.06 0.92 27.13 3 ETF
13
Consilia Capital www.consiliacapital.com
Real Estate Securities Funds Monthly
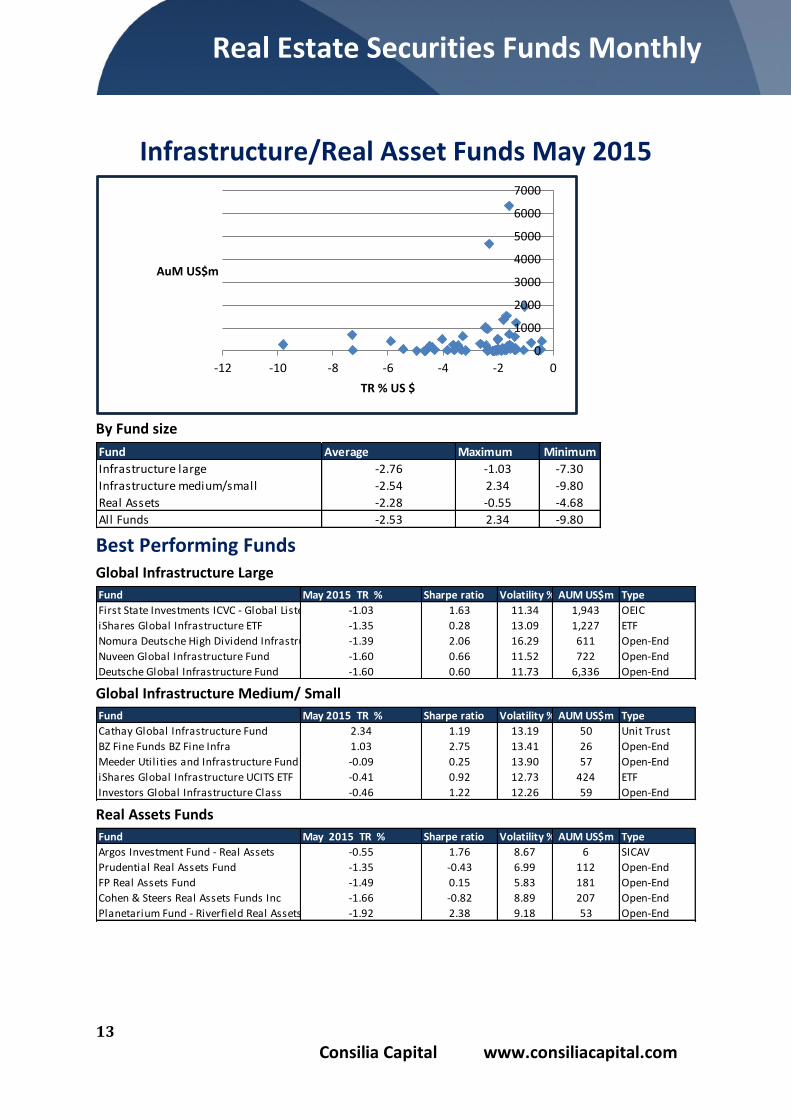
Infrastructure/Real Asset Funds May 2015
By Fund size
Best Performing Funds Global Infrastructure Large
Global Infrastructure Medium/ Small
Real Assets Funds
0
1000
2000
3000
4000
5000
6000
7000
-12 -10 -8 -6 -4 -2 0
AuM US$m
TR % US $
Fund Average Maximum Minimum
Infrastructure large -2.76 -1.03 -7.30
Infrastructure medium/small -2.54 2.34 -9.80
Real Assets -2.28 -0.55 -4.68
All Funds -2.53 2.34 -9.80
Fund May 2015 TR % Sharpe ratio Volatility % AUM US$m Type
First State Investments ICVC - Global Listed Infrastructure Fund-1.03 1.63 11.34 1,943 OEIC
iShares Global Infrastructure ETF -1.35 0.28 13.09 1,227 ETF
Nomura Deutsche High Dividend Infrastructure Related Stock Fund USD Semi Annual-1.39 2.06 16.29 611 Open-End
Nuveen Global Infrastructure Fund -1.60 0.66 11.52 722 Open-End
Deutsche Global Infrastructure Fund -1.60 0.60 11.73 6,336 Open-End
Fund May 2015 TR % Sharpe ratio Volatility % AUM US$m Type
Cathay Global Infrastructure Fund 2.34 1.19 13.19 50 Unit Trust
BZ Fine Funds BZ Fine Infra 1.03 2.75 13.41 26 Open-End
Meeder Utilities and Infrastructure Fund -0.09 0.25 13.90 57 Open-End
iShares Global Infrastructure UCITS ETF -0.41 0.92 12.73 424 ETF
Investors Global Infrastructure Class -0.46 1.22 12.26 59 Open-End
Fund May 2015 TR % Sharpe ratio Volatility % AUM US$m Type
Argos Investment Fund - Real Assets -0.55 1.76 8.67 6 SICAV
Prudential Real Assets Fund -1.35 -0.43 6.99 112 Open-End
FP Real Assets Fund -1.49 0.15 5.83 181 Open-End
Cohen & Steers Real Assets Funds Inc -1.66 -0.82 8.89 207 Open-End
Planetarium Fund - Riverfield Real Assets -1.92 2.38 9.18 53 Open-End
14
Consilia Capital www.consiliacapital.com
Real Estate Securities Funds Monthly
Disclaimer The information contained in this report was obtained from various sources. No representation or warranty, express or implied, is made, given or intended by or on behalf of Consilia Capital Limited or any of its directors, officers or employees and no responsibility or liability is accepted by Consilia Capital Limited or any of its directors, officers or employees as to the accuracy, completeness or fairness of any information, opinions (if any) or analysis (if any) contained in this report. Consilia Capital Limited undertakes no obligation to update or correct any information contained in this report or revise any opinions (if any) or analysis (if any) in the light of any new information. Notwithstanding the foregoing, nothing in this paragraph shall exclude liability for any representation or warranty made fraudulently. This report (including its contents) is confidential and is for distribution in the United Kingdom only to persons who are authorised persons or exempt persons within the meaning of the Financial Services and Markets Act 2000, or any Order made thereunder, or to persons of a kind described in Article 19(5) (Investment Professionals) of the Financial Services and Markets Act 2000 (Financial Promotion) Order 2005 (as amended) and, if permitted by applicable law, for distribution outside the United Kingdom to professionals or institutions whose ordinary business involves them in engaging in investment activities. It is not intended to be distributed or passed on, directly, indirectly, to any other class of persons. This report may not be copied, reproduced, further distributed to any other person or published, in whole or in part, for any purpose other than with the prior consent of Consilia Capital Limited. Whilst Consilia Capital Limited may at its sole and absolute discretion consent to the copying or reproduction of this report (whether in whole or in part) for your usual business purposes no representation or warranty, express or implied, is made, given or intended by or on behalf of Consilia Capital Limited or any of its directors, officers or employees as to the suitability or fitness of the report for the purpose to which you intend to put the report. The information, opinions (if any) and analysis (if any) contained in this report do not constitute, or form part of, any offer to sell or issue, or any solicitation of an offer to purchase or subscribe for, any securities or options, futures or other derivatives ("securities") nor shall this report, or any part of it, or the fact of its distribution, form the basis of, or be relied on, in connection with any contract. This report is intended to provide general information only. This document may not cover the issues which recipients may regard as important to their consideration, evaluation or assessment of the any of the securities mentioned herein, and where such issues have been covered herein no assurance can be given that they have been considered in sufficient detail for recipients’ purposes. This report does not have regard to any specific investment objectives, the financial situation or the particular requirements of any recipient. To the extent that this report contains any forward-looking statements, estimates, forecasts, projections and analyses with respect to future events and the anticipated future performance of the securities referred to herein, such forward-looking statements, estimates, forecasts, projections and analyses were prepared based upon certain assumptions and an analysis of the information available at the time this report was prepared and may or may not prove to be correct. No representation or warranty, express or implied, is made, given or intended by or on behalf of Consilia Capital Limited or any of its directors, officers or employees that any estimates, forecasts, projections or analyses that are used in this report will be realised. These statements, estimates, forecasts, projections and analyses are subject to changes in economic and other circumstances and such changes may be material. Potential investors should seek financial advice from a person authorised under the Financial Services and Markets Act 2000 who specialises in advising on the acquisition of securities. Investors should be aware that the value of and income in respect of any securities may be volatile and may go down as well as up and investors may therefore be unable to recover their original investment.