

2
This presentation contains “forward-looking statements” which are statements that refer to expectations and plans for the
future and include, without limitation, statements regarding Lenovo’s future results of operations, financial condition or
business prospects as well as other statements based on projections, estimates and assumptions. In some cases, these
statements can be identified by terms such as "expect," "intend," "plan," "believe," "estimate," "may," "will," "should" and
comparable words (including the negative of such words). These forward-looking statements, reflect the current expectations
and plans of the directors and management of Lenovo, which may not materialize or may change. Many risks, uncertainties
and other factors, some of which are unpredictable and beyond Lenovo’s control, could affect the matters discussed in these
forward-looking statements. These factors include, without limitation, economic and business conditions globally and in the
countries where we operate, Lenovo’s ability to predict and respond quickly to market developments, consumer demand,
pricing trends and competition; changes in applicable laws and regulations (including applicable tax and tariff rates). Any
variance from the expectations or plans on which these forward-looking statements are based could cause Lenovo’s actual
results or actions to differ materially from those expressed or implied in these statements. These forward-looking statements
are not guarantees of future performance and you are cautioned not to place undue reliance on these statements. Lenovo
undertakes no obligation to update any forward-looking statements in this presentation, whether as a result of new
information or any subsequent change, development or event. All forward-looking statements in this presentation are
qualified by reference to this paragraph.
Forward Looking Statement


4
PC sales grew 14 points faster than market
Market share of 15.3%, up 2.1 points YTY
Smartphone business in China more than doubled YTY
Improved profitability; PTI Margin up to 2.1%, Earnings up 90% YTY
Strong Fourth Quarter
PRC Smartphone Market Share (%)
FY 10/11 FY 11/12 FY 12/13
17.1
13.0
10.2 10.0 6.8
6.4
3Q 2Q 1Q 4Q 3Q 2Q 1Q 4Q 3Q 2Q 1Q 4Q
22
20
18
16
14
12
10
8
6
4
2
0
SOURCE: IDC, SINO, INTERNAL DATA
17.8
15.7
13.2
15.3
2
7
12
17
Q1 11/12
Q2 11/12
Q3 11/12
Q4 11/12
Q1 12/13
Q2 12/13
Q3 12/13
Q4 12/13
WW PC Market Share (%)
HP Lenovo Dell Acer ASUS
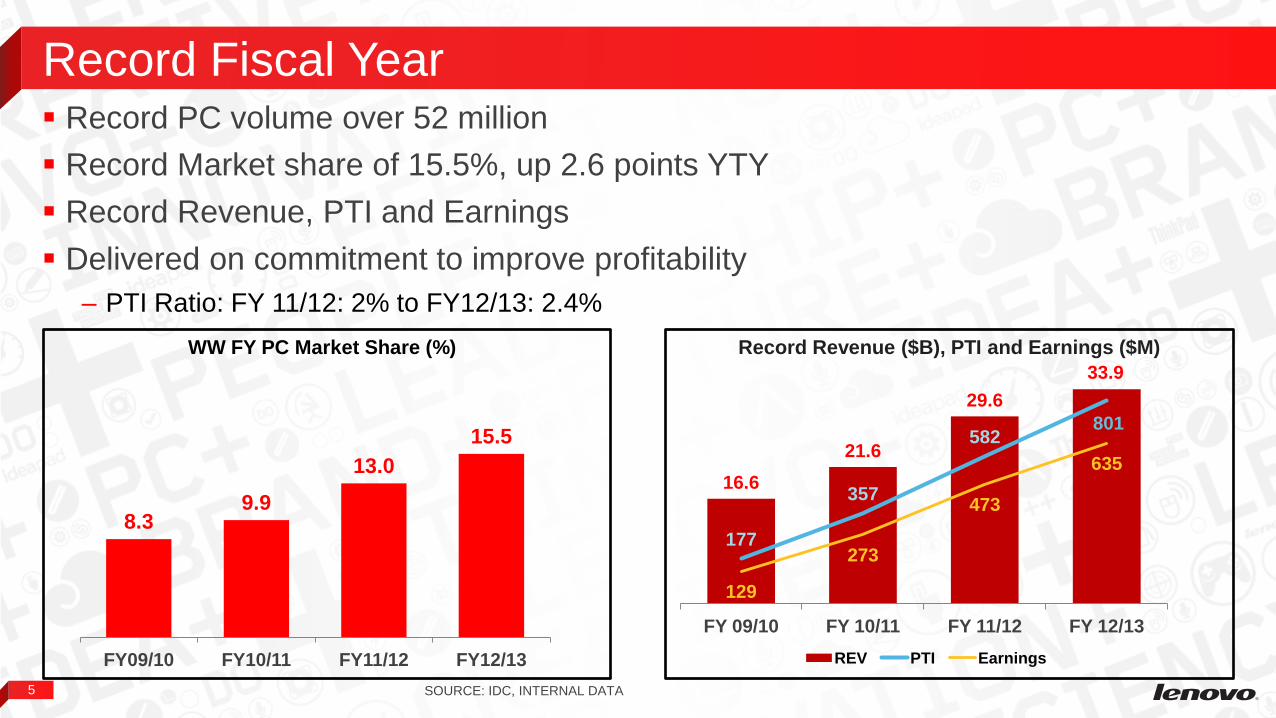
5
Record PC volume over 52 million
Record Market share of 15.5%, up 2.6 points YTY
Record Revenue, PTI and Earnings
Delivered on commitment to improve profitability
– PTI Ratio: FY 11/12: 2% to FY12/13: 2.4%
Record Fiscal Year
16.6
21.6
29.6
33.9
177
357
582 801
129
273
473
635
FY 09/10 FY 10/11 FY 11/12 FY 12/13
REV PTI Earnings
Record Revenue ($B), PTI and Earnings ($M)
8.3 9.9
13.0
15.5
FY09/10 FY10/11 FY11/12 FY12/13
WW FY PC Market Share (%)
SOURCE: IDC, INTERNAL DATA

6
EMEA: – Outgrew market by 37 points
– Record market share of 10.7%
– Segment profit up 77% YTY
APLA: – Outgrew market by 21 points
– Improved profitability YTY
NA: – Outgrew market by 20 points
– Record market share
– Strong profitability
China: – Protected profit pool, grew profitability
– Record market share of 34.6%
Outgrew Market in all Segments, Geos
Balanced Performance Across All Segments, Geos
SOURCE: IDC, INTERNAL DATA
7.1
8.8
FY11/12 FY12/13
+1.6 pts
32
34.6
FY11/12 FY12/13
+2.6 pts
PR
C N
A
7.6
10.7
FY11/12 FY12/13
+3.1 pts
EM
EA
9.3
11.4
FY11/12 FY12/13
+2.1pts
AP
LA
Lenovo PC Share in 4 GEOs(%)

7
China Smartphone volume grew almost 3.7x YTY; profitable last two quarters
WW Tablet volume increased by 74% YTY
MIDH contributed 9% of Lenovo’s overall revenue
#3 worldwide in Smart Connected Devices (PCs+Tablets+Smartphones)
PC+ Business Continued Rapid Growth
SOURCE: IDC, INTERNAL DATA
0
10
20
30
40
FY11/12 FY12/13
PC MIDH Other
Increasing MIDH Rev mix to Group (US$B)
$29.6
92%
$33.9
9%
88%
5%
+15%
+9%
+105%
YTY Growth
+62%
+19%
+37%
-23%
+99%
5.9
2010/11 2011/12 2012/13
Smart Connected Device Market Share (%)

8
Clear Strategy Key to Success
2013 LENOVO CONFIDENTIAL. ALL RIGHTS RESERVED.
Profit
Pools
Profitable
Growth Enterprise
Systems
China PC Leadership 1
2
3
Build scale in TM, esp. Consumer 1
2
Solidify China leadership position in Smartphone
and Tablet markets
Aggressively expand smartphone
into emerging markets while preparing
mature infrastructure
Jumpstart Tablets outside of China
1
2
Grow Server to a relevant global player
Drive Workstation to stronger Tier 1 player
1
2
Product Offerings & User Experience | New Categories & Businesses | Global Branding
Integrated Business Groups | Global-Local Business Model | Improve time-to-volume | Sustainable
Meet commitments/Take ownership | Build a world class organization
Protect PC Attack PC+
Innovation Leadership
Operational Effectiveness
Global Culture
Smartphone
and Tablet
3
Profitable
Growth Drive share in REM to 10%+
Deliver steady REL profits in all regions
Drive attachment of
Peripherals/Monetization/Services

9
Protect PC business, drive higher profitability
– Protect Leadership of China, Global Commercial
– Pursue Profitable Growth in Emerging Markets,
Consumer and SMB
Strategy: Protect PCs

10
Smartphones
– Become market leader in China
– Grow aggressively in Emerging Markets
Tablets
– Grow even faster
– Leverage Android and Windows
Grow Server/Storage to relevant global player in 3 years
Strategy: Attack PC+

11
Recent reorganization will drive better execution of strategy
Continue to strengthen vertical integration
Continue to improve efficiency
Business Model: Built for PC+
CH
INA
AM
ER
ICA
S
AS
IA P
AC
IFIC
EM
EA
THINK BUSINESS GROUP
Premium PCs +
Tablets + Enterprise
LENOVO
BUSINESS GROUP
Mainstream/Entry PCs +
Tablets + Smartphones + TV
INTEGRATED OPERATIONS
CU
ST
OM
ER
-DR
IVE
N
FR
ON
T E
ND
INT
EG
RA
TE
D
BA
CK
EN
D
NEW ORGANIZATION STRUCTURE

12
Product differentiation based on:
– Core breakthroughs
– Integrating hardware, software and services perfectly to provide best user experience
Innovation: Critical to Win in PC+ Era

13
GLOBAL HEADQUARTERS
MANUFACTURING
RESEARCH CENTER
REGIONAL HEADQUARTERS
COMPANY LOCATION
Our Foundation and Competitive Advantage
Diverse Global Culture
14
We are now in the PC+ Era
Will continue to improve profitability, outpace PC market
Ready to continue outpacing PC+ market
Outlook for the Year

16
Financial Summary
US$ Million Q4 FY2012/13 Q4 FY2011/12 Y/Y% Q/Q% FY2012/13 Y/Y%
Revenue 7,832 7,496 4% -16% 33,873 15%
Gross Profit 963 806 20% -13% 4,073 18%
Operating Expenses (794) (704) 13% -7% (3,273) 14%
Operating Profit 169 102 67% -31% 800 37%
Other Non-Operating (Expenses) / Income (3) 0 NA NA 1 NA
Pre-tax Income 166 102 63% -33% 801 38%
Taxation (42) (34) 22% -10% (170) 59%
Profit for the period 124 68 84% -38% 631 33%
Non-controlling interests 3 (1) NA -44% 4 NA
Profit attributable to Equity Holders 127 67 90% -38% 635 34%
EPS (US cents)
- Basic 1.22 0.65 0.57 (0.77) 6.16 1.49
- Diluted 1.20 0.63 0.57 (0.76) 6.07 1.50
Dividend per share (HK cents) 18.50 4.70
Q4 FY2012/13 Q4 FY2011/12 Q3 FY2012/13 FY2012/13 FY2011/12
Gross margin 12.3% 10.8% 11.8% 12.0% 11.7%
E/R ratio 10.1% 9.4% 9.2% 9.7% 9.7%
Operating margin 2.2% 1.4% 2.6% 2.4% 2.0%
PTI margin 2.1% 1.4% 2.6% 2.4% 2.0%
Net margin attributable to Equity Holders 1.6% 0.9% 2.2% 1.9% 1.6%

17
Condensed Balance Sheet US$ Million As at As at
Mar 31, 2013 Mar 31, 2012
Non-current assets 4,492 4,040
Property, plant and equipment 480 392
Intangible assets 3,326 3,092
Others 686 556
Current assets 12,390 11,820
Bank deposits and cash 3,573 4,172
Trade, notes and other receivables 6,694 6,297
Inventories 1,965 1,218
Others 158 133
Current liabilities 12,091 11,809
Short-term bank loans 176 63
Trade, notes and other payables 10,576 11,251
Others 1,339 495
Net current assets 299 11
Non-current liabilities 2,111 1,603
Total equity 2,680 2,448

18
Cash and Working Capital
US$ Million Q4 FY2012/13 Q4 FY2011/12 FY2012/13 FY2011/12
Bank deposits and cash 3,573 4,172 3,573 4172
Total Bank Borrowings 479 63 479 63
Net Cash Reserves 3,094 4,109 3,094 4,109
Days Inventory 26 18 21 17
Days Receivable 40 35 35 32
Days Payable 73 70 64 68
Cash Conversion Cycle -7 Days -17 days -8 Days -19 days
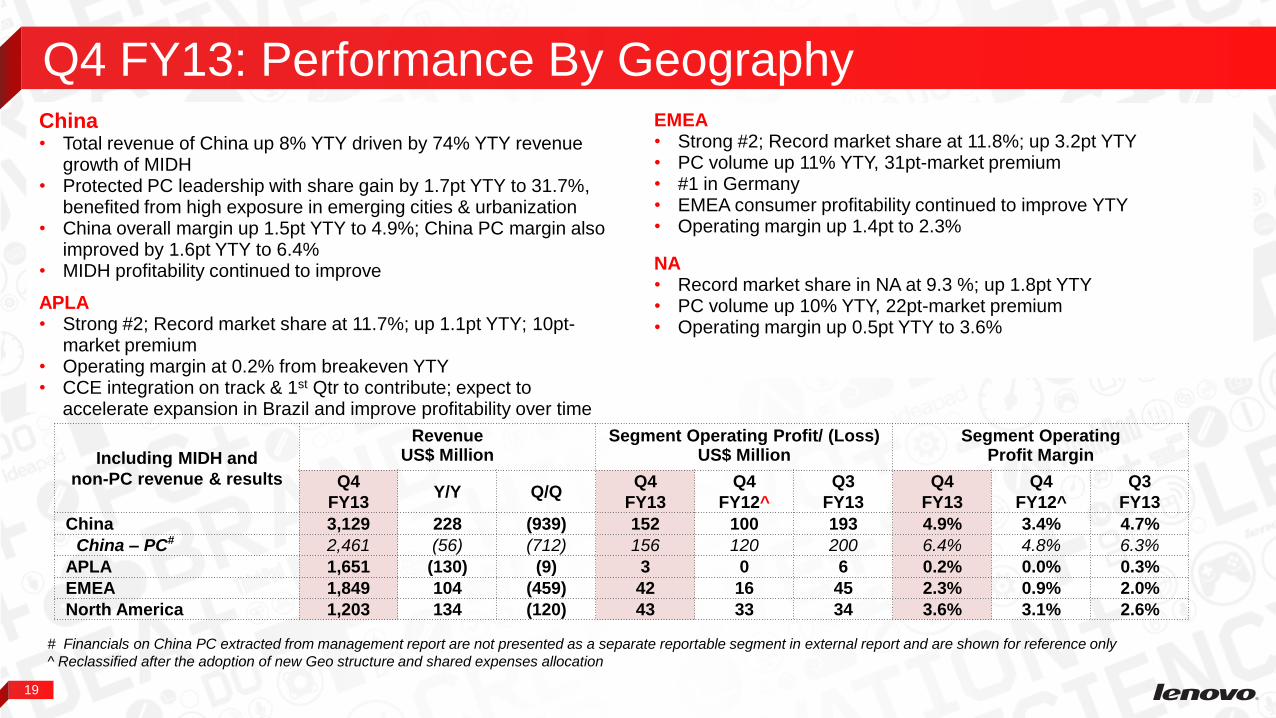
19
Q4 FY13: Performance By Geography
# Financials on China PC extracted from management report are not presented as a separate reportable segment in external report and are shown for reference only
^ Reclassified after the adoption of new Geo structure and shared expenses allocation
Including MIDH and
non-PC revenue & results
Revenue Segment Operating Profit/ (Loss) Segment Operating US$ Million US$ Million Profit Margin
Q4
FY13 Y/Y Q/Q
Q4
FY13
Q4
FY12^
Q3
FY13
Q4
FY13
Q4
FY12^
Q3
FY13
China 3,129 228 (939) 152 100 193 4.9% 3.4% 4.7%
China – PC# 2,461 (56) (712) 156 120 200 6.4% 4.8% 6.3%
APLA 1,651 (130) (9) 3 0 6 0.2% 0.0% 0.3%
EMEA 1,849 104 (459) 42 16 45 2.3% 0.9% 2.0%
North America 1,203 134 (120) 43 33 34 3.6% 3.1% 2.6%
China • Total revenue of China up 8% YTY driven by 74% YTY revenue
growth of MIDH • Protected PC leadership with share gain by 1.7pt YTY to 31.7%,
benefited from high exposure in emerging cities & urbanization • China overall margin up 1.5pt YTY to 4.9%; China PC margin also
improved by 1.6pt YTY to 6.4% • MIDH profitability continued to improve
APLA • Strong #2; Record market share at 11.7%; up 1.1pt YTY; 10pt-
market premium • Operating margin at 0.2% from breakeven YTY • CCE integration on track & 1st Qtr to contribute; expect to
accelerate expansion in Brazil and improve profitability over time
EMEA • Strong #2; Record market share at 11.8%; up 3.2pt YTY • PC volume up 11% YTY, 31pt-market premium • #1 in Germany • EMEA consumer profitability continued to improve YTY • Operating margin up 1.4pt to 2.3%
NA • Record market share in NA at 9.3 %; up 1.8pt YTY • PC volume up 10% YTY, 22pt-market premium • Operating margin up 0.5pt YTY to 3.6%

20
Q4 FY13: Performance By Product
Notebook – 15-pt market premium
– Market share at 15.8%, up 2.3pts YTY
Desktop
– 12-pt market premium
– Market share at 14.6%, up 1.8pts YTY
MIDH – MIDH Sales up 74% YTY
– MIDH mix increased from 6% to 9% group sales YTY with improving profitability
– Strong China smartphone shipments up +2.1x YTY; Second quarter to be profitable
– Encouraging initial feedback for smartphone roll-out in ROW
– WW tablet volume up 23% YTY
(5.6%)
MIDH
9.4%
Revenue by Product
Desktop
30.3%
(32.2%)
Notebook
53.0%
(56.3%)
(5.9%)
Others*
7.3%
* Note: miscellaneous businesses including servers, services and
software and Medion's non-PC business.

21
Acquisition/partnership integrations are on track and achieving aspirations
Acquisition Description
JV with NEC PC in Japan to become # 1
PC player in Japan
Acquisition of Consumer PC player in WE
to achieve market leadership
JV with Compal on PC Vertical
Integration to optimize manufacturing and
drive innovation
JV & strategic partnership that enhances
Lenovo’s position in industry standard
servers and networked storage solutions
Acquisition of cloud computing provider
to enhance and expand cloud computing
solutions
Acquisition of consumer PC+ player in
Brazil with aspiration to achieve market
leadership
Integration Progress
Announce Close Prelim
Integration Completed
Primary
Integration Obj.
Achieved
Close date
Jun
2011
Dec
2012
Dec
2012
Jan
2013
Apr
2012
Aug
2011
Joint entity is # 1 PC player in Japan with
>25% market share in FY 12/13
Consumer PC share in EMEA steadily
growing reaching >9% in FY 12/13;
Lenovo is now #2 PC player in EMEA
Five product families on scheduled mass
production; all project development
schedules on track
Completed integration into PC+ portfolio,
collaborating to expand cloud offerings
Completed initial integration for JV to
insure strong low-end NAS business;
leveraging EMC enterprise expertise
Integration of business functions to drive
revenue and cost synergies ongoing –
jointly we are already # 4 in the Brazil PC
market ahead of HP & Dell
Achievements
Market Share Source IDC.

23
Performance By Geography - FY13
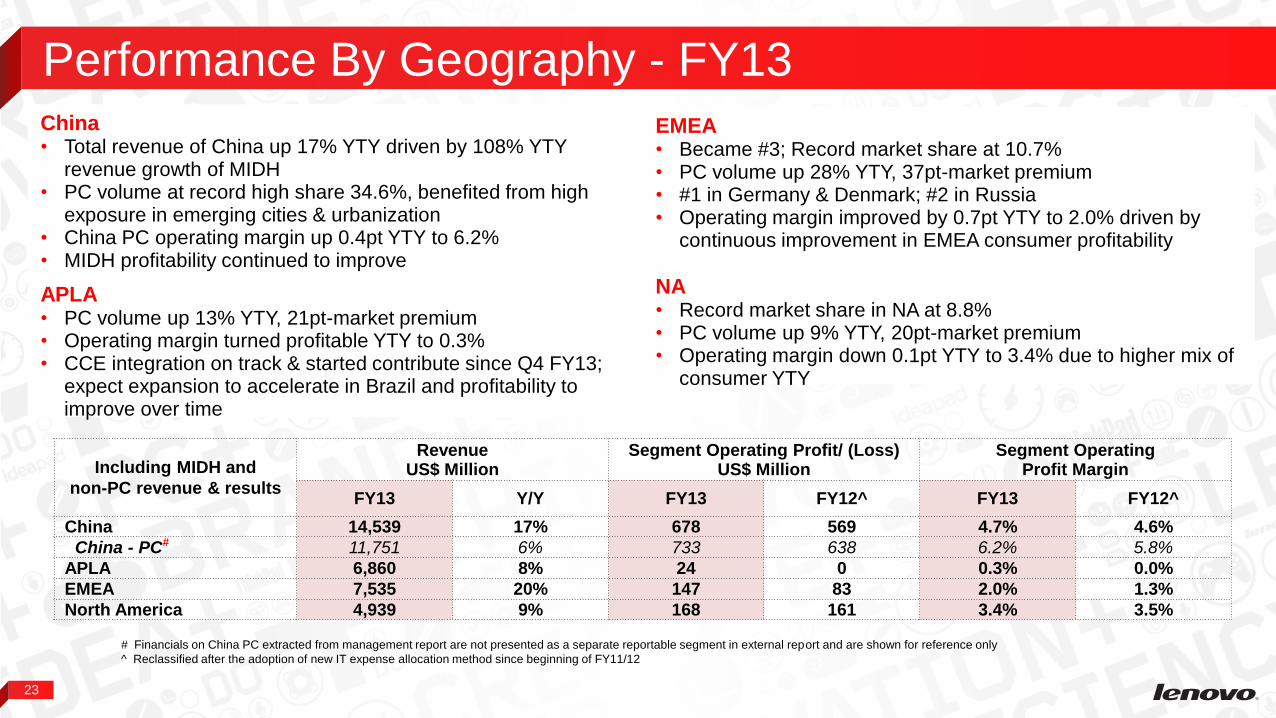
# Financials on China PC extracted from management report are not presented as a separate reportable segment in external report and are shown for reference only
^ Reclassified after the adoption of new IT expense allocation method since beginning of FY11/12
China • Total revenue of China up 17% YTY driven by 108% YTY
revenue growth of MIDH • PC volume at record high share 34.6%, benefited from high
exposure in emerging cities & urbanization • China PC operating margin up 0.4pt YTY to 6.2% • MIDH profitability continued to improve
APLA • PC volume up 13% YTY, 21pt-market premium • Operating margin turned profitable YTY to 0.3% • CCE integration on track & started contribute since Q4 FY13;
expect expansion to accelerate in Brazil and profitability to improve over time
EMEA • Became #3; Record market share at 10.7% • PC volume up 28% YTY, 37pt-market premium • #1 in Germany & Denmark; #2 in Russia • Operating margin improved by 0.7pt YTY to 2.0% driven by
continuous improvement in EMEA consumer profitability
NA • Record market share in NA at 8.8% • PC volume up 9% YTY, 20pt-market premium • Operating margin down 0.1pt YTY to 3.4% due to higher mix of
consumer YTY
Including MIDH and
non-PC revenue & results
Revenue Segment Operating Profit/ (Loss) Segment Operating US$ Million US$ Million Profit Margin
FY13 Y/Y FY13 FY12^ FY13 FY12^
China 14,539 17% 678 569 4.7% 4.6%
China - PC# 11,751 6% 733 638 6.2% 5.8%
APLA 6,860 8% 24 0 0.3% 0.0%
EMEA 7,535 20% 147 83 2.0% 1.3%
North America 4,939 9% 168 161 3.4% 3.5%
24
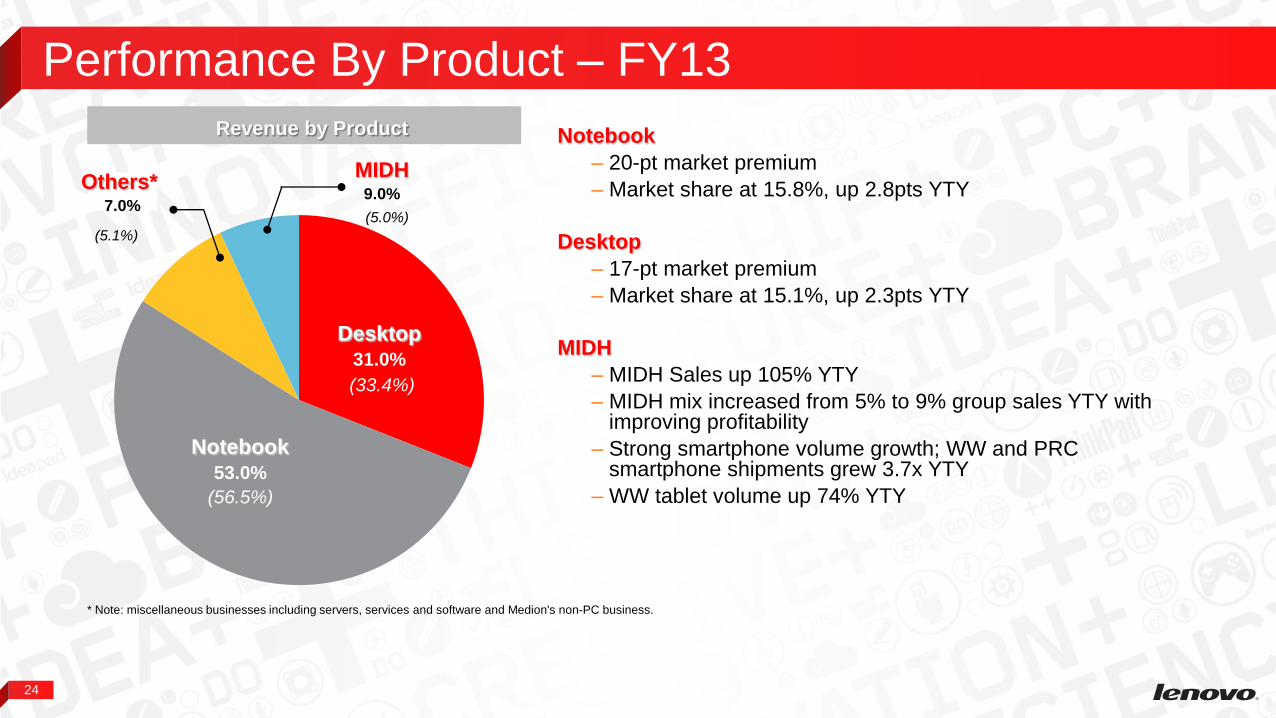
Performance By Product – FY13
Notebook
– 20-pt market premium
– Market share at 15.8%, up 2.8pts YTY
Desktop
– 17-pt market premium
– Market share at 15.1%, up 2.3pts YTY
MIDH
– MIDH Sales up 105% YTY
– MIDH mix increased from 5% to 9% group sales YTY with improving profitability
– Strong smartphone volume growth; WW and PRC smartphone shipments grew 3.7x YTY
– WW tablet volume up 74% YTY
(5.0%)
MIDH 9.0%
Revenue by Product
(5.1%)
Others* 7.0%
* Note: miscellaneous businesses including servers, services and software and Medion's non-PC business.
Notebook
53.0%
(56.5%)
Desktop
31.0%
(33.4%)

25
Consolidated Income Statement US$ Million Q4 FY2012/13 FY2012/13 Q4 FY2011/12 FY2011/12
Revenue 7,832 33,873 7,496 29,574
Cost of sales (6,869) (29,800) (6,690) (26,128)
Gross profit 963 4,073 806 3,446
Other income, net - 20 - 1
Selling and distribution expenses (417) (1,888) (425) (1,691)
Administrative expenses (228) (847) (189) (730)
Research and development expenses (173) (623) (139) (453)
Other operating income – net 24 65 49 11
Operating profit 169 800 102 584
Finance income 12 44 10 43
Finance costs (15) (42) (10) (44)
Share of losses of associated companies - (1) 0 (1)
Profit before taxation 166 801 102 582
Taxation (42) (170) (34) (107)
Profit for the period 124 631 68 475
Profit attributable to:
Equity holders of the company 127 635 67 473
Non-controlling interests (3) (4) 1 2
Dividend 248 183
Earnings per share (US cents)
- Basic 1.22 6.16 0.65 4.67
- Diluted 1.20 6.07 0.63 4.57

26
Condensed Consolidated Cash Flow Statement
US$ Million FY2012/13 FY2011/12
Net cash generated from operating activities 20 1,940
Net cash used in investing activities (245) (837)
Net cash used in financing activities (68) (316)
(Decrease)/Increase in cash and cash equivalents (293) 787
Effect of foreign exchange rate changes (10) 16
Cash and cash equivalents at the beginning of the period 3,757 2,954
Cash and cash equivalents at the end of the period 3,454 3,757


