LARGE-SCALE ACQUISITION TO INVEST
IN AGRICULTURE:TRENDS AND KEY ISSUES
MAIN RESULTS FROM A WORLD BANK STUDY
Presentation: Harris SELOD, World Bank
Climate change, land acquisition and food security in West Africa: New challenges, new opportunities Ouagadougou, Burkina Faso, 1-2 November 2010
AUDIO
What is happening? What is the impact & country policies’ role?Supply of land and potential for expansionPolicy Implications
Overview
AUDIO

What is happening?

It started with the commodity price hike…
AUDIO

Past area expansion & new ‘demand’ (million hectares)
Region 1961 1997 2007 61-97 97-07 Demand
SSA 134.6 192.2 218.5 1.6 2.6 39.7
LAC 102.6 160.9 168.0 1.6 0.7 3.2
EAP 183.9 235.7 262.8 1.4 2.7 8.0
SAS 197.9 212.9 213.5 0.4 0.1 0.7
Oceania 34.0 42.8 46.7 0.2 0.4 0.0
MENA 77.9 91.3 89.0 0.4 -0.2 1.4
ECA 282.9 263.6 241.7 -.0.2 -2.2 4.6
WEU 99.4 86.8 83.5 -0.4 -0.3 -
NAM 235.3 232.5 225.3 -0.1 -0.7 0.2
Total 103.5 1518.6 1549.0 11.5 3.0 57.8AUDIO

Lessons from past area expansion
Latin America Amazon: Policy-induced pasture, ⅓ utilized, monitor, beef Cerrado: Exceptional R&D but poverty impact reduced by capital
subsidies Agro-export growth in Peru: Significant impact based on auctions
Asia Oilpalm 2.9 to 6.3 M ha in Indonesia: Tree subsidies (18 Mn cut); tenure
issues Challenge of shifting expansion away from forest (alang alang; REDD) Rice exclusively smallholder; high poverty impact after tenure
regularization Eastern Europe:
Very variable post-decollectivization experience: Mega-farms in RUK after Russian area decline (> 30 Mha ) Highly concentrated due to market advantages; technology
Africa Policies: Taxation of ag. & exportables, low public investment (< 4%) Technology, infrastr., institutions limited success of investment in bulk
comm. Success limited to high value commodities; policies critical for evolution
AUDIO

Probability of being target of LS inv.
Dependent variable Interest Impl.
1 2 3
Suitable land nonf. 0.3049** 0.2987** 0.3916***
Suitable land forest 0.0503 0.0396 0.0770
Yield gap -0.3635 -0.2774 -1.7457**
Land tenure recognition -0.512*** -0.691*** -0.3416*
Investment protection +0.0058* 0.0033
Pseudo R-squared 0.311 0.339 0.268
AUDIO

Do press reports imply action?
Country All projects Domestic Foreign
Projects
(#)
Total area (1000
ha)
Median
(ha)
Projects
(#)
Area (Tha)
Median(ha)
Projects
(#)
Total area
(1000 ha)
Median(ha)
Ethiopia 406 1,190 700 383 582 616 23 607 4,000
Liberia 17 1,60259,37
42 117 58,323 15 1,485 98,179
Mozambique
405 2,670 2,225 274 1,402 2,000 131 1,268 3,800
Sudan 132 3,965 7,980 90 3,086 6,930 42 879 8,400
AUDIO

Inventory/policy framework
Gaps in process of investment processing/approval Expropriation/extinction of existing rights often
required Unclear/duplicative institutional responsibility Low land payments; rarely collected (biased project
choice) Neglect of economic/technical viability Limited capacity to do/monitor ESIAs Rudimentary boundary description/data management Asset & employment generation limited
Across countries policy a key determinant Tanzania vs. Mozambique – 50% not utilized Public auction, technical review, down-payment
AUDIO


Boundary misaligned with roadAllocation over existing smallholdersNo visible large-scale cultivation
An example from Zambia
Boundary of
allocated land
1 km
AUDIO

Case Study evidence
Near universal lack of consultation/neglect of property rights Even if consultations, agreements are not written/monitored Ill-informed decisions due to lack of information on rights/project Vulnerable people & women left out – implicit subsidy through land
price Limited consideration of economic viability
Non-viable projects may subsequently encroach on local rights Negative effects often shifted to locals (damage but no benefits) Conflict due to neglect of rights undermines profitability Requirements for liquidating non-profitable investments rarely
considered Different channels for benefits to materialize
Local public goods: Often compensation for land (comm dev funds) Employment: Crop specific, does not benefit all (skill-dependence) Technology & market spillovers: Not for the most destitute Need to tailor to local characteristics–this is rarely done
AUDIO

Is there potential?

Going beyond demand….
The AEZ methodology Simulation of climatic suitability for rainfed high intensity
cultivation 5 key crops (wheat, maize, soybean, sugarcane, oil palm)
Main uses considered here Estimate share of potential utilized on cultivated areas Quantify area available for potential expansion by
country/crop Identify the ‘optimum’ crop and gross revenue to be attained Link to a transport cost grid to establish land rental surface Check robustness by assessing impact of climate change
Considerable scope for policy at country level Anticipate demand for land & assess global competitiveness Provide information to potential investors/cluster
development Guide public good provision (technology, infrastr., property
rights), Objective reference for land valuation/price negotiations Simulation of infrastructure impact on land prices
AUDIO

Source: IIASA
Potential output
AUDIO

Yield gap, share of land used, area/rural person
Africa Latin America & Caribbean
AUDIO

Yield gap estimates
Region Maize Oil palm Soybean S. cane
S Asia 0.62 0.74 0.47 0.68
Europe 0.81 n.a. 0.84 n.a.
N&W Africa Asia 0.62 n.a. 0.91 0.95
N America 0.89 n.a. 0.77 0.72
Oceania 1.02 0.6 1.05 0.91
S America 0.65 0.87 0.67 0.93
SS Africa 0.20 0.32 0.32 0.54
AUDIO

Country level availability of uncult. land
Concentrated > 90% in 32
ctries 16 in Africa
Large relative to cult. area > double in 11
ctrs > triple in 6 Social disruption Other constraints
Non-cultivated, -forested, -protected land (1000 ha and relative)
Sudan 46,025 2.82 Tanzania 8,659 0.94
Brazil 45,472 0.73 Bolivia 8,317 2.92
Russian Fed. 38,434 0.32 Cent. Afr. Rep. 7,940 4.23
Argentina 29,500 1.05 Paraguay 7,269 1.34
Australia 26,167 0.57 Colombia 4,971 0.68
D.R. Congo 22,498 1.53 Ethiopia 4,726 0.34
Mozambique 16,256 2.85 Cameroon 4,655 0.68
Madagascar 16,244 4.63 Kenya 4,615 0.99
Chad 14,816 1.92 Mexico 4,360 0.17
Zambia 13,020 2.83 Mali 3,908 0.47
Indonesia 10,486 0.32 Papua N.G. 3,771 5.93
Angola 9,684 3.31 Burkina Faso 3,713 0.77
Uruguay 9,269 4.56 Belarus 3,691 0.61
Venezuela 8,966 2.29 South Africa 3,555 0.23
United States 8,756 0.05 Congo 3,476 6.79
Canada 8,684 0.17 Ukraine 3,442 0.10
World Total 445,858
445 Mn ha (< 25/km2)306 Mn ha (< 10/km2)198 Mn ha (< 5/km2)
AUDIO

Availability of land for rainfed crops
Sudan
DRC
Zambia
MozambiqueChad
Madagascar

CHN
MYS
PHL
VNM
EGY
JOR
INDPAKHUN
KAZ
LTUPOL
ROM RUS
SVN
TKMUKR
ARGBRA
CHL COL
SLV
GUY
MEX
PER
URY
AGOBEN
BDI
COGZAR
GHAMWI
MOZ
NGA
RWA
SDN
TZAZMB
Type 1 Type 2
Type 3 Type 4
.2.4
.6.8
1
Yie
ld G
ap
-10 -5 0 5Suitable relative to cultivated area (in logarithms) AUDIO

Typology: Implications for agrarian structure
Type 1 Smallholder path; mech. adjust to declining ag. pop. Larger operational areas through market transactions
Type 3 Public/private provision of technology & infrastructure (contract
farming); regulatory issues Land as important safety net & asset; not push out if no
alternative available Type 2
Economically sustainable large farm expansion (funds) Land markets can take care of it if distributional, environmental
& social issues are regulated Type 4
Increasing output requires mechanization & larger farms How will have long-term impacts (dualism vs. broad-based
growth) Challenges considerable; property rights & land markets not
defined
AUDIO

Policy implications

Good policy, legal & institutional framework essential for sustainable & equitable outcomes
Area of concern Key Issues
Property rights • Long established occupancy rights are recognized• Relevant rights are publicly recorded• An accountable & representative structure for local decision-making is in place
Voluntary transfers
• Expropriation not used to transfer land to private interests• Processes for transferring land involve informed consent by existing users• Proceeds from land transfers are fair and accrue to actual users
Transparency • Relevant information (land prices, contracts) publicly available• Agreements are understood by the parties and can be enforced• Public sector responsibilities add value, are clearly assigned, performed effectively
Economic viability
• Effective mechanisms to check technical viability & economic feasibility in place• Investments are consistent with local strategies for development• Adherence to agreed terms is monitored and enforced
Environmental &social sustainability
• Areas unsuitable for agricultural expansion are properly protected • Environmental policies are clearly defined and adhered to• Social safeguards are implemented
AUDIO

Roles by different stakeholders
1. Government: Integrate investment into agric. strategy Identify areas with potential & provide complementary public goods Recognize, register, and help enforce property rights (incl. valuation) Improve & streamline institutional framework
2. Private sector: Promote industry standards that integrate land rights Leading industry practice can provide basis for regulation Extend coverage/disclosure of existing approaches (e.g. Equator Principles) Explore multi-stakeholder initiatives (e.g. EITI) building on existing work
3. Civil society & academics: Contribute to greater transparency Advise, monitor, implement to build civil society & community capacity Give communities voice; empower them to negotiate & push enforcement Publicize promising examples; link back to policy
4. Global community: Capacity building support to interested governments Technical support & complementary infrastructure, institutional capacity Create fora to monitor impact & share examples of good practice In the context of a multi-stakeholder approach
AUDIO
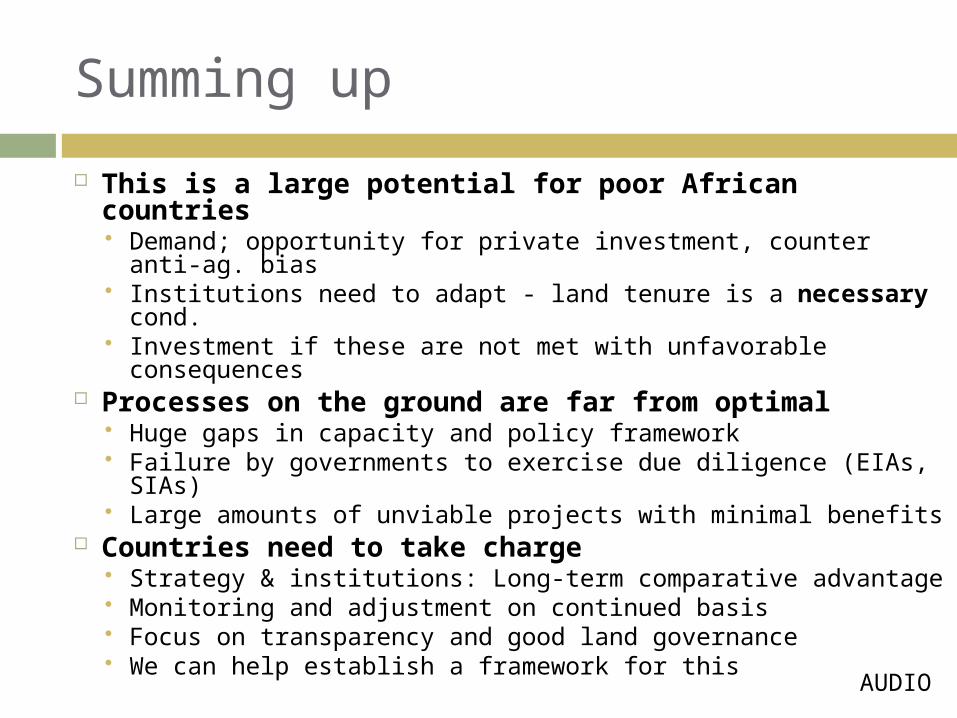
Summing up
This is a large potential for poor African countries Demand; opportunity for private investment, counter anti-
ag. bias Institutions need to adapt - land tenure is a necessary cond. Investment if these are not met with unfavorable
consequences Processes on the ground are far from optimal
Huge gaps in capacity and policy framework Failure by governments to exercise due diligence (EIAs, SIAs) Large amounts of unviable projects with minimal benefits
Countries need to take charge Strategy & institutions: Long-term comparative advantage Monitoring and adjustment on continued basis Focus on transparency and good land governance We can help establish a framework for this
AUDIO


