
“Monitoring of Energy Demand Trends and Energy
Efficiency in the EU” yRomania – new partner into ODYSSEE-MURE project
Kick-off meeting, October 11-12 Cork, Ireland
ROMANIAN AGENCY FOR ENERGY CONSERVATION
ENERGY RESEARCH AND MODERNIZING INSTITUTE
Romanian Workteam
Romanian Agency for
Energy Conservation
Ministry of Economy
and Finance
Energy Research and
Modernizing InstituteEnergy Conservation Modernizing Institute
National Energy Data Center - OEN
Implementation of the energy efficiency law 199/2000
…..• to implement and monitor the national policy and the programmes for the efficient use of energy • to develop the synthesis of the energy efficiency programmes on the national level
• to co-operate with the authorized institutions for developing energy databases, including the calculationof the energy efficiency indicators at the national level….
• Development/update of a complex national data baseon energy production and consumption
• Calculation of energy indicators on the basis of the methodologies adapted to the European ones in order to allow comparisons
• Development of scenarios and energy prognosis

RUE and environmental policies
National Strategy on Energy Efficiency (GD 163/2004)
- target: 40% reduction in primary energy intensity by 2015 in comparison with the reference year 2001with the reference year 2001
- energy savings 2,122 ktoe/year of which:
16%
39%15%
2%
28% Final industry
Residential
Transport
Tertiary
District Heating
RUE and environmental policies
Energy Efficiency Law 199/2000 - establishes a legal and institutional framework for the development and implementation of a national energy
efficiency policy in agreement with the provisions of the Energy Charter Treaty
M i i i dMain provisions as regards energy consumers:
- companies with an annual consumption > 1000toe and local authorities of cities with > 20000 inhabitants have to develop their own energy efficiency programmes;
- companies with an annual consumption > 1000toe have to appoint an energy manager and to have annualy an energy balance developed by an authorized person;
- companies with an annual consumption 200-1000toe are obliged to have an energy balance developed once every 2 years by an authorized person;

RUE and environmental policies
Energy Efficiency Law 199/2000-Main provisions as regards energy consumers(continue)
- transport companies and other companies as well as local and central authorities h h h 25 hi l h d l f l i i dthat have more than 25 vehicles have to develop fuel monitoring and management
programmes for their vehicles;
- building administrators have to implement the necessary measures for: the efficient use of heating and air conditioning systems, the use of efficient building materials, the use of energy metters and regulators, the development of an energy balance once every 5 years for the buildings with the surface > 1000m2 and having heating and air conditioning systems in operation.
RUE and environmental policies
Kyoto Protocol Ratification (Law 3/2001)
- target: 8% reduction in GHG emissions by 2012 in comparison with the reference year 1989with the reference year 1989
Establishment of the GHG emission trading scheme (GD 780/2006)legal framework for the implementation of the EU ETS in Romania
National Allocation Plan (august 2007)- the total amount of allowances for both periods (2007 and 2008 – 2012)- the distributon of the allowances among the installations covered by the
scheme

RUE and environmental policies
Strategy for Renewable Energy Sources use (GD 1535/2003) and the promotion of electricity generation from RES (GD 958/2005):
Targets:20102010 RE hRE h 11%11% h lh l2010 2010 –– RES share: RES share: 11%11% in the total primary energy sources;in the total primary energy sources;20102010 –– RES share: RES share: 33%33% from total of generated electricity.from total of generated electricity.
System for promoting electricity generation from RES (GD 1892/2004)
- mandatory quotas and green certificate trade system- RES eligible to receive green certificates: solar, wind, hydro ≤ 10MW,
biomass, geothermal energy
RUE and environmental policies in buildings
Romania succeed to transpose all the European legislation in the field of energy labeling for electrical appliances
RefrigeratorsRefrigerators, , ff dd
Laundry washing machinesLaundry washing machinesHGHG 12521252/ 200/ 2005 replace5 replace HG 598/ 2001HG 598/ 2001freezersfreezers and and
combinations of combinations of themthem
HG 972/2004HG 972/2004
HG HG 12521252/ 200/ 2005 replace 5 replace HG 598/ 2001HG 598/ 2001Laundry washing/drying machinesLaundry washing/drying machinesHG HG 230230/ 200/ 2005 replace 5 replace HG 671/ 2001HG 671/ 2001
Laundry drying machinesLaundry drying machinesHG 1274/ 2001HG 1274/ 2001
2004 market survey : energy savings 2004 market survey : energy savings 14000 toe/yr 14000 toe/yr

RUE and environmental policies in buildings Building Energy Performance Law 372/2005- transpose the Directive 2002/91/EC- issuing energy performance certificate from 2007 exception: the existing
residential buildings: EPC is mandatory starting with 2010
Special measures to for thermal rehabilitation of multi-level residential b ildi (UGO 174/2002 L 211/2003)buildings (UGO 174/2002, Law 211/2003)- development of annual programme for thermal rehabilitation- financial supporting scheme for the buildings included in the annual programme:
for energy audit and planning of thermal rehabilitation works: from the state budget
for thermal rehabilitation works:34% from the state budget33% from the municipality budget33% from the maintenance fund of the owner association
25% energy savings in comparison with the initial state
RUE and environmental policies in transport
Promoting the utilization of bio-fuels and other renewable fuels for transport(GD 1844/2005)target: minimum share 2% placed on the market by 2007;
minimum share 5 75% placed on the market by 2010minimum share 5,75% placed on the market by 2010.
+ GD 456/2007 that amends and completes GD 1844/2005- from 1 July 2007 diesel with a biofuel content of minimum 2% in volume;- from 1 Jan. 2008 diesel with a biofuel content of minimum 3% in volume;- from 1 July 2008 diesel with a biofuel content of minimum 4% in volume;- from 1 July 2009 petrol with a biofuel content of minimum 4% in volume.
biofuels in total fuels 2007: 35,000 t2008: 120,000 t2009: 280,000 t
energy savings 2007: 105,000 toe2008: 360,000 toe2009: 840,000 toe
Estimation:

National Energy Efficiency Action Plan
Average final energy consumption covered by ESD (2001-2005) 20,84020,840
9% b 2016 1 8 6*1 8 6*
[thou toe]
9% energy savings by 2016 1,876*1,876*
National energy saving target by 2016 2,800**2,800**
Intermediate energy saving target by 2010 940***940***
* * Minimum value according to the Directive 2006/32/EC**** 13,5 % of average finale energy consumption 2001 – 2005, respectively 1.5% annualy****** 4,5 % of average finale energy consumption 2001 – 2005, respectively 1.5% annualy
NEEAP - Measures for IndustryLTA implementationEnergy balances and energy demand managementon going: - certification by ARCE of the personnel responsible for energy management in industrial
companies with energy consumption>1000 toe- authorization by ARCE of the personnel that develop energy balances
new (2008-2010): - 50% cofinancing the development of energy balances for industrial companies
10-20% energy savings
g p gy pand public buildings (>1000 m2), from the state budget
- development of a state budget subsidy scheme to finance the industrial energy efficiency programmes
Financial support for investment projects in order to reduce energy demand actual stage: - Romanian Energy Efficiency Fund implementing GEF/IBRD programme:
from 2003 - 18 financing contracts 28,106 toe; 70,438 tCO2on going: - REEF – 2007: 8 financing contract, 1 for ESCO
- PHARE project to develop the mechanisms of financial incentives for energy efficiency (to be completed in 2008)
Cofinancing the investment projects for energy efficient equipments from European funds2008-2010: Application for the Structural Funds

NEEAP - Measures for Residential and Tertiary Sectors
Thermal insulation for multi-level residential buildings constructed in the period 1950-1990actual stage: -2005: energy audits and thermal rehabilitation projects for 23 buildings
-2006: energy audits for 614 buildingson going: - starting 2007: thermal rehabilitation works for the energy audited buildings
2007-2010: energy savings 3,000 toe/yr- energy performance certificates: new buildings – starting date 2007
existing buildings – starting date 2010
Increasing energy efficiency in heating/cooling systems of individual residential dwellings on going: - inspections by ARCE and ISCIR of air-conditioning equipments and boilers
(upon placing on the market) - REMODECE project
Promoting highly efficient cogenerationactual stage: legislation – GD 219/2007 – transposes Directive 2004/8/EC new: - harmonised and corrected reference values to be applied at the national level (2007)
- development of bonus-type support scheme for highly efficient cogeneration (2008)
NEEAP - Measures for Residential and Tertiary Sectors (cont.)
Improving public lighting system:on going: replacement of old lighting devices, continuation of replacement of inneficient equipment,
use of devices to reduce the luminous flux on the main city roads during the light trafic periods – municipalities Cluj-Napoca and Brasov (completition date 2009)
El i i i 40%
Promoting the use of energy efficient household electrical appliances and lamps:on going: CEECAP project (completition date 2008)new: introduction of a bonus scheme to support the replacement of refrigerators, washing
machines and air conditioners (50 Euro bonus upon purchasing A/A+ energy class appliances) (2009)
Promoting the ESCO development:new: legislation framework development, financial incentives (2008)
RES use:new: - promoting the investments in RES use for heat and electricity generation (GD – 2008)
- structural funds for RES projects
Electricity savings: 40%

NEEAP - Measures for Transport
Modernisation of rail transport: passenger and goods
Modenisation of the underground systemEnergy savings in rail transport of goods: 10,000 toe/yrf g y m
Promoting biofuels:new: direct payment scheme for energy crops (45 Euro/ha) – Order of the Minister of Agriculture
and Rural Development
Total energy savings 2007-2010: 5,850 toe
INDICATORS - GDP
6510
7395
6057
54585013
44072
51073
44745
42574
402783944939928
41942
44666
42990
40140
38633
38062
5000
6000
7000
8000
euro 2000/capita
40000
50000
60000
Meuro 2000
1698 17661895 1860 1774 1757 1795 1900
2053 2024
2356
1976
1670
476738633
0
1000
2000
3000
4000
1992 1993 1994 1995 1996 1997 1998 1999 2000 2001 2002 2003 2004
year
0
10000
20000
30000
GDPEuro 2000/capita GDPEuro pps2000/capita GDP Meuro 2000ppp

INDICATORS - TPES
Coal
Fire woods and agricultural waste
Hydroelectric energy
Nuclear energy40000
50000
60000
Natural gases
Mineral oil and petroleum products
0
10000
20000
30000
1992 1993 1994 1995 1996 1997 1998 1999 2000 2001 2002 2003 2004
year
kto
e
Natural gases Mineral oil and petroleum products Coal
Fire woods and agricultural waste Hydroelectric energy Nuclear energy
Other energy forms
INDICATORS – Final Energy Consumption
Transports
Services
Agriculture and Silviculture
20000
25000
30000
35000
Processing industry & construction
Household
Transports
0
5000
10000
15000
1992 1993 1994 1995 1996 1997 1998 1999 2000 2001 2002 2003 2004
year
kto
e
Processing industry & construction Household Transports Services Agriculture and Silviculture

MACROINDICATORS – Energy intensities 1,290
0,798
1,273
0,766
1,157 1,145 1,1281,106
1,051
0,9520,928 0,915
0,838 0,850
0,7780,800
1,000
1,200
1,400
2000
0,7140,678
0,714 0,710
0,654
0,351
0,578
0,213
0,332
0,575
0,206
0,319
0,551
0,192
0,284
0,545
0,185
0,264
0,556
0,173
0,248
0,519
0,165
0,000
0,200
0,400
0,600
,
kgoe/
Euro
2
1992 1993 1994 1995 1996 1997 1998 1999 2000 2001 2002 2003 2004year
Primary energy intensity ER Primary energy intensity PPS Final energy intensity ER Final energy intensity PPSPPP PPP
INDICATORS – Energy intensities in industry
5
6
7
8
2000
1,158 1,239 1,090 1,139 1,098 1,063 0,956 0,900 0,980 1,0271,2901,191
0
1
2
3
4
1992 1993 1994 1995 1996 1997 1998 1999 2000 2001 2002 2003 2004
year
kgoe/e
uro
Food, beverages, tabacco Textiles Chemicals Primary metals Equipments Media
1.010

INDICATORS – Energy consumption in transport
160
143 145
136
187 190
177
140
156
177
198 198204
3252 3294
3087
4226 4284
3985
3139
3508
3975
4311 43194415
3657
150
200
250
pit
a
3000
3500
4000
4500
5000
0
50
100
1992 1993 1994 1995 1996 1997 1998 1999 2000 2001 2002 2003 2004
year
kgo
e/ca
p
0
500
1000
1500
2000
2500
kto
e
kgoe/ cap Final energy consumption in Transports
INDICATORS – Energy intensity in transport
0,096
0,084 0,082
0,0950,102 0,1
0,080,087
0,0930,096
0,0920,086
0,08
0,1
0,12
0,072
0
0,02
0,04
0,06
1992 1993 1994 1995 1996 1997 1998 1999 2000 2001 2002 2003 2004
[koe
/Eur
o200
0]

INDICATORS – Unit energy consumption in road transport
0,95 0,94
1,16
1,06
0,98 0,971,01 0,99 1,00
1,16
1,00
1,20
1,40[toe/vehicle]
0,650,62 0,64
0,52
0,68 0,680,64
0,50 0,51
0,640,68
0,60 0,59
0,81
0,72
0,80
0,00
0,20
0,40
0,60
0,80
1992 1993 1994 1995 1996 1997 1998 1999 2000 2001 2002 2003 2004
unit consumption per car unit consumption per road vehicle
INDICATORS – Energy consumption in households
424414
389
470 469 463
434420
366380
408397
415
96529408
8818
10618 10573 10412
97579433
8197 8278
88798610
9452
300
350
400
450
500
ap
8000
10000
12000
0
50
100
150
200
250
1992 1993 1994 1995 1996 1997 1998 1999 2000 2001 2002 2003 2004
year
kg
oe/c
a
0
2000
4000
6000
kto
e
kgoe/cap final energy consumption in Households
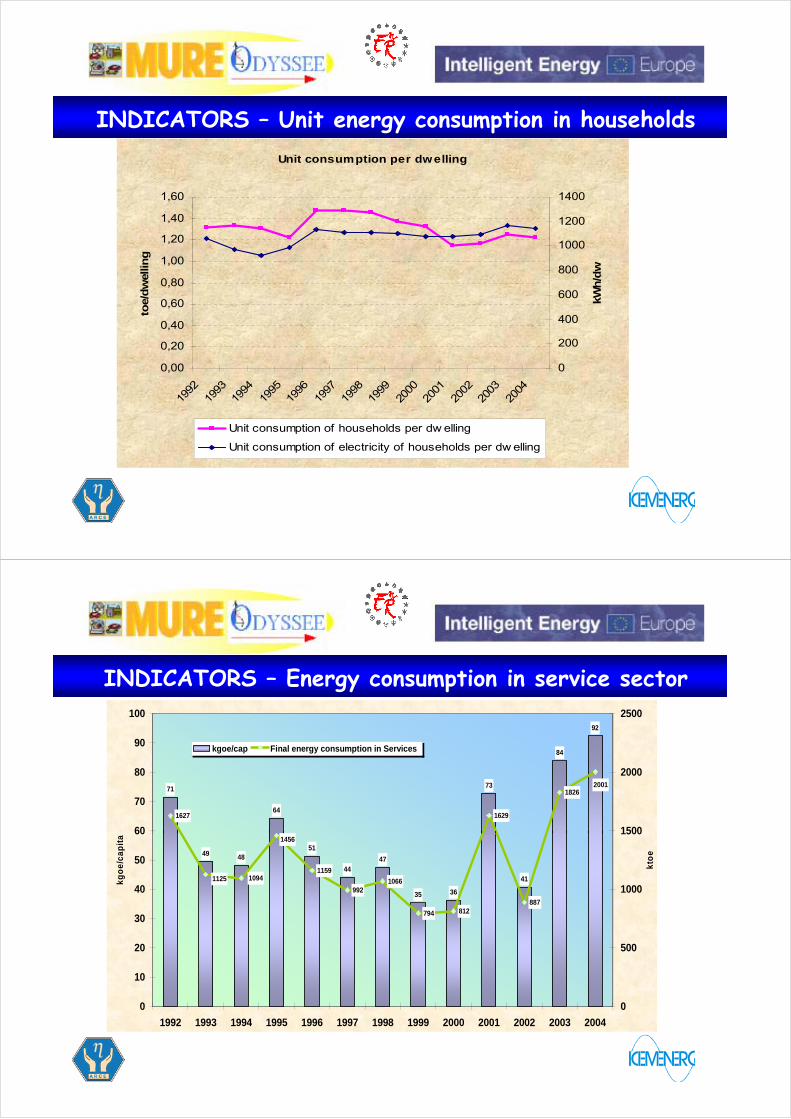
INDICATORS – Unit energy consumption in householdsUnit consumption per dwelling
1,00
1,20
1,40
1,60
llin
g
800
1000
1200
1400
dw
0,00
0,20
0,40
0,60
0,80
1992
1993
1994
1995
1996
1997
1998
1999
2000
2001
2002
2003
2004
toe/
dw
e
0
200
400
600 kWh
/d
Unit consumption of households per dw elling
Unit consumption of electricity of households per dw elling
INDICATORS – Energy consumption in service sector
71
64
73
84
92
1627 1629
18262001
60
70
80
90
100
1500
2000
2500
kgoe/cap Final energy consumption in Services
49 4851
4447
35 36
411159
9921066
794 812887
1456
10941125
0
10
20
30
40
50
60
1992 1993 1994 1995 1996 1997 1998 1999 2000 2001 2002 2003 2004
kg
oe
/ca
pit
a
0
500
1000
1500
kto
e

INDICATORS – Energy intensity in service sector
0,156
0,129 0,130,134
0,101
0,116
0,106 0,1080,12
0,14
0,16
[koe/Euro2000]
0,082 0,08
0,058 0,057 0,057
0
0,02
0,04
0,06
0,08
0,1
1992 1993 1994 1995 1996 1997 1998 1999 2000 2001 2002 2003 2004
CONCLUSIONS
ODYSSEE indicators:• lack of data particularly for transport and services • increasing the coverage and quality of the data together with better
stim ti nsestimations • integrating the data from surveys currently under development (REMODECE, El-tertiary)
MURE database:• development of data base for Romania• evaluation of the impact of the measures


