
Judicial Nomination Statistics and Analysis:
U.S. Circuit and District Courts, 1977-2020
Updated May 18, 2021
Congressional Research Service
https://crsreports.congress.gov
R45622

Congressional Research Service
SUMMARY
Judicial Nomination Statistics and Analysis: U.S. Circuit and District Courts, 1977-2020 In recent decades, the process for appointing judges to the U.S. circuit courts of appeals and the
U.S. district courts has been of continuing Senate interest. The President and the Senate share
responsibility for making these appointments. Pursuant to the Constitution’s Appointments
Clause, the President nominates persons to fill federal judgeships, with the appointment of each
nominee also requiring Senate confirmation. Although not mentioned in the Constitution, an
important role is also played midway in the appointment process by the Senate Judiciary
Committee.
The statistics presented in this report reflect congressional interest in issues related to the confirmation process for lower
federal court nominees. Statistics are provided for each stage of the nomination and confirmation process—from the
frequency of judicial vacancies that require a presidential nomination for a judgeship to be filled to the frequency of roll call
votes (rather than the use of unanimous consent or voice votes) to confirm judicial nominees. Statistics are also provided
related to the length of the confirmation process itself. Additional statistics provided relate to the demographic characteristics
of circuit and district court nominees confirmed by the Senate.
The period covered by the report, 1977 through 2020, includes every Administration from the Carter presidency to the Trump
presidency. This period also includes every Congress from the 95th (1977-1978) through the 116th (2019-2020).
This report will be next updated by CRS at the conclusion of the 117th Congress.
R45622
May 18, 2021
Barry J. McMillion Analyst in American National Government
Judicial Nomination Statistics and Analysis: U.S. Circuit and District Courts, 1977-2020
Congressional Research Service
Contents
Introduction ..................................................................................................................................... 1
Overview of the U.S. Courts of Appeals and U.S. District Courts .................................................. 2
U.S. Circuit Courts .................................................................................................................... 2 U.S. District Courts ................................................................................................................... 2
U.S. Circuit and District Court Vacancies ....................................................................................... 3
Number and Percentage of Nominees Confirmed ........................................................................... 5
By Presidency............................................................................................................................ 5 U.S. Circuit Court Nominees .............................................................................................. 5 U.S. District Court Nominees ............................................................................................. 6
By Congress .............................................................................................................................. 6 U.S. Circuit Court Nominees .............................................................................................. 6 U.S. District Court Nominees ............................................................................................. 7 Influence of Unified and Divided Party Control ................................................................. 8
Multiple Nominations of the Same Person Prior to Final Action by the Senate ............................. 9
U.S. Circuit Court Nominees .................................................................................................... 9 U.S. District Court Nominees ................................................................................................. 10
Nominees Whose Nominations Were Returned at the End of a Congress ..................................... 11
U.S. Circuit Court Nominees ................................................................................................... 11 U.S. District Court Nominees ................................................................................................. 13
Time from Nomination to Confirmation ....................................................................................... 13
By Presidency.......................................................................................................................... 14 U.S. Circuit Court Nominees ............................................................................................ 14 U.S. District Court Nominees ........................................................................................... 17
By Congress ............................................................................................................................ 19 U.S. Circuit Court Nominees ............................................................................................ 20 U.S. District Court Nominees ........................................................................................... 20
By Presidency and Congress ................................................................................................... 20 U.S. Circuit Court Nominees ............................................................................................ 21 U.S. District Court Nominees ........................................................................................... 21
Time from Nomination to Committee Hearing ............................................................................. 22
U.S. Circuit Court Nominees .................................................................................................. 22 U.S. District Court Nominees ................................................................................................. 23
Time from Committee Report to Confirmation ............................................................................. 24
U.S. Circuit Court Nominees .................................................................................................. 25 U.S. District Court Nominees ................................................................................................. 26
Ratings by the American Bar Association for Confirmed Nominees ............................................ 26
U.S. Circuit Court Nominees .................................................................................................. 27 U.S. District Court Nominees ................................................................................................. 28
Frequency of Roll Call Votes Used to Confirm Nominees ............................................................ 28
U.S. Circuit Court Nominees .................................................................................................. 29 U.S. District Court Nominees ................................................................................................. 30
Number of Nay Votes Received at Time of Confirmation ............................................................ 31
U.S. Circuit Court Nominees .................................................................................................. 31 U.S. District Court Nominees ................................................................................................. 33
Judicial Nomination Statistics and Analysis: U.S. Circuit and District Courts, 1977-2020
Congressional Research Service
Demographic Characteristics of Confirmed Nominees ................................................................. 34
Gender ..................................................................................................................................... 34 U.S. Circuit Court Nominees ............................................................................................ 34 U.S. District Court Nominees ........................................................................................... 35
Race ......................................................................................................................................... 36 U.S. Circuit Court Nominees ............................................................................................ 36 U.S. District Court Nominees ........................................................................................... 38
Figures
Figure 1. U.S. Circuit Court Nominees: Number of Days from Nomination to
Confirmation .............................................................................................................................. 16
Figure 2. U.S. District Court Nominees: Number of Days from Nomination to
Confirmation .............................................................................................................................. 18
Figure 3. U.S. Circuit and District Court Nominees: Median Number of Days from
Nomination to Confirmation, by Presidency and Congress ....................................................... 21
Figure 4. U.S. Circuit Court Nominees: Percentage Confirmed by Roll Call Vote ....................... 29
Figure 5. U.S. District Court Nominees: Percentage Confirmed by Roll Call Vote ...................... 30
Figure 6. U.S. Circuit and District Court Nominees: Number of Nay Votes Received at
Time of Confirmation ................................................................................................................. 32
Figure 7. U.S. Circuit Court Nominees: Percentage of Nominees Confirmed, by Gender ........... 35
Figure 8. U.S. District Court Nominees: Percentage Confirmed, by Gender ................................ 36
Tables
Table 1. Percentage of U.S. Circuit and District Court Judgeships Vacant on January 1
Prior to Beginning of Each Congress and Four-Year Presidential Term ...................................... 3
Table 2. U.S. Circuit and District Court Nominees of Seven Most Recent Presidents:
Number Nominated, Number Confirmed, Percentage Confirmed ............................................... 5
Table 3. Nominees to U.S. Circuit and District Court Judgeships During Each Congress:
Number Nominated, Number Confirmed, Percentage Confirmed ............................................... 7
Table 4. Number of U.S. Circuit Court Nominees Who Were Nominated Two or More
Times Prior to Final Action and Percentage of All Confirmed U.S. Circuit Court
Nominees Nominated Two or More Times Prior to Being Confirmed ...................................... 10
Table 5. Number of U.S. District Court Nominees Who Were Nominated Two or More
Times Prior to Final Action and Percentage of All Confirmed U.S. District Court
Nominees Nominated Two or More Times Prior to Being Confirmed ....................................... 11
Table 6. U.S. Circuit and District Court Nominees: Number Whose Nominations Were
Returned at End of Each Congress and the Percentage of All Nominees Whose
Nominations Were Returned at End of Each Congress .............................................................. 12
Table 7. U.S. Circuit and District Court Nominees: Median Number of Days from
Nomination to Confirmation, by Presidency .............................................................................. 15
Table 8. U.S. Circuit and District Court Nominees: Median Number of Days from
Nomination to Confirmation, by Congress ................................................................................ 19
Judicial Nomination Statistics and Analysis: U.S. Circuit and District Courts, 1977-2020
Congressional Research Service
Table 9. U.S. Circuit and District Court Nominees: Median Number of Days from
Nomination to Committee Hearing ............................................................................................ 23
Table 10. U.S. Circuit and District Court Nominees: Median Number of Days from
Committee Report to Confirmation ............................................................................................ 25
Table 11. U.S. Circuit and District Court Nominees: Official Ratings by the American Bar
Association for Nominees Confirmed by the Senate ................................................................. 28
Table 12. U.S. Circuit Court Nominees: Percentage Confirmed, by Race .................................... 37
Table 13. U.S. District Court Nominees: Percentage Confirmed, by Race ................................... 38
Contacts
Author Information ........................................................................................................................ 39

Judicial Nomination Statistics and Analysis: U.S. Circuit and District Courts, 1977-2020
Congressional Research Service 1
Introduction Under the Appointments Clause of the Constitution,1 the President and the Senate share
responsibility for making appointments to the Supreme Court, as well as to various lower courts
of the federal judiciary. While the President nominates persons to fill federal judgeships, the
appointment of each nominee also requires Senate confirmation.2
Historically, the vast majority of appointments to federal judgeships (other than to the Supreme
Court) have typically not involved much public disagreement between the President and the
Senate or between the parties within the Senate.3 Debate in the Senate over particular lower court
nominees, or over the lower court appointment process itself, was uncommon. Typically, such
nominations were both reported out of the Judiciary Committee and confirmed by the Senate
without any recorded opposition.
In recent decades, however, appointments to two kinds of lower federal courts—the U.S. circuit
courts of appeals4 and the U.S. district courts—have often been the focus of heightened Senate
interest and debate, as has the process itself for appointing judges to these courts.5
Given congressional interest in the subject, this report provides statistics and analysis related to
the nomination and confirmation of U.S. circuit and district court judges from 1977 (the
beginning of the Carter presidency) through 2020 (the end of the Trump presidency).6
The report’s exclusive focus are the U.S. circuit courts of appeals and U.S. district courts.
Excluded from the scope of the report are the U.S. Supreme Court; the U.S. Court of International
Trade; the U.S. Court of Federal Claims; and territorial district courts (e.g., the District Court of
Guam).
1 Article II, Section 2, clause 2 of the Constitution—often referred to as the Appointments Clause—provides that the
President “shall nominate, and by and with the Advice and Consent of the Senate, shall appoint ... Judges of the
supreme Court, and all other Officers of the United States, whose Appointments are not herein otherwise provided for,
and which shall be established by Law.... ”
2 The Constitution also, in its Recess Appointments Clause (Article II, Section 2, clause 3), authorizes the President to
make temporary appointments unilaterally during periods when the Senate is in recess. This was rarely done, however,
during the presidencies discussed in this report. For example, over the past 25 years, “there have been only three recess
appointments to fill Article III judgeships”—one such appointment to a circuit court judgeship by President William J.
Clinton in 2000 and two to circuit court judgeships by President George W. Bush in 2004. CRS Report RS21308,
Recess Appointments: Frequently Asked Questions, by Henry B. Hogue.
3 In this vein, one scholar has noted that, relative to Supreme Court appointments, appointments to the lower federal
courts “have not, for most of our history, engaged remotely similar public interest. Nor as a historical matter has the
Senate played the same role in considering nominations to those courts.” Stephen B. Burbank, “Politics, Privilege &
Power; The Senate’s Role in the Appointment of Federal Judges,” Judicature, vol. 86 (July/August 2002), p. 25.
4 The U.S. courts of appeals are routinely referred to as “circuit courts” throughout the text of this report.
5 For discussion by scholars of the Senate’s increased interest in the judicial appointment process in recent decades, see
Nancy Scherer, Scoring Points; Politicians, Activists, and the Lower Federal Court Appointment Process (Stanford,
CA: Stanford University Press, 2005), p. 271 (hereinafter cited as Scherer, Scoring Points). See also Sarah A. Binder
and Forrest Maltzman, Advice & Dissent: The Struggle to Shape the Federal Judiciary (Washington: Brookings
Institution Press, 2009), p. 198. For two relatively recent forums in which numerous Senators in detailed statements
expressed their views concerning the lower court appointment process, see U.S. Congress, Senate Committee on the
Judiciary, Subcommittee on Administrative Oversight and the Courts, The Judicial Nomination and Confirmation
Process, Hearings, 107th Cong., 1st sess., June 26 and September 4, 2001, S.Hrg. 107-463 (Washington: GPO, 2002),
276 pp.; and U.S. Congress, Senate Committee on the Judiciary, Subcommittee on Constitution, Civil Rights and
Property Rights, Judicial Nominations, Filibusters, and the Constitution: When a Majority Is Denied Its Right to
Consent, Hearing, 108th Cong., 1st sess., May 6, 2003, S.Hrg. 108-227 (Washington: GPO, 2003), p. 393.
6 This period includes the 95th Congress through the 116th Congress.
Judicial Nomination Statistics and Analysis: U.S. Circuit and District Courts, 1977-2020
Congressional Research Service 2
Overview of the U.S. Courts of Appeals and U.S.
District Courts
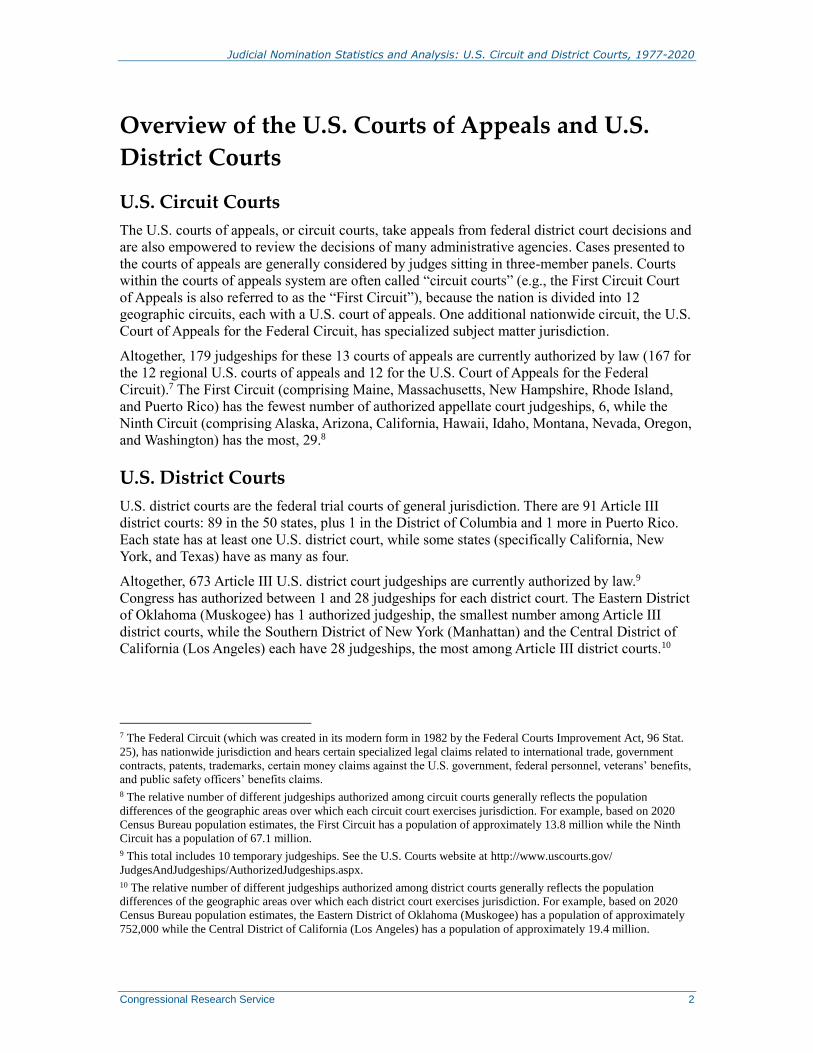
U.S. Circuit Courts
The U.S. courts of appeals, or circuit courts, take appeals from federal district court decisions and
are also empowered to review the decisions of many administrative agencies. Cases presented to
the courts of appeals are generally considered by judges sitting in three-member panels. Courts
within the courts of appeals system are often called “circuit courts” (e.g., the First Circuit Court
of Appeals is also referred to as the “First Circuit”), because the nation is divided into 12
geographic circuits, each with a U.S. court of appeals. One additional nationwide circuit, the U.S.
Court of Appeals for the Federal Circuit, has specialized subject matter jurisdiction.
Altogether, 179 judgeships for these 13 courts of appeals are currently authorized by law (167 for
the 12 regional U.S. courts of appeals and 12 for the U.S. Court of Appeals for the Federal
Circuit).7 The First Circuit (comprising Maine, Massachusetts, New Hampshire, Rhode Island,
and Puerto Rico) has the fewest number of authorized appellate court judgeships, 6, while the
Ninth Circuit (comprising Alaska, Arizona, California, Hawaii, Idaho, Montana, Nevada, Oregon,
and Washington) has the most, 29.8
U.S. District Courts
U.S. district courts are the federal trial courts of general jurisdiction. There are 91 Article III
district courts: 89 in the 50 states, plus 1 in the District of Columbia and 1 more in Puerto Rico.
Each state has at least one U.S. district court, while some states (specifically California, New
York, and Texas) have as many as four.
Altogether, 673 Article III U.S. district court judgeships are currently authorized by law.9
Congress has authorized between 1 and 28 judgeships for each district court. The Eastern District
of Oklahoma (Muskogee) has 1 authorized judgeship, the smallest number among Article III
district courts, while the Southern District of New York (Manhattan) and the Central District of
California (Los Angeles) each have 28 judgeships, the most among Article III district courts.10
7 The Federal Circuit (which was created in its modern form in 1982 by the Federal Courts Improvement Act, 96 Stat.
25), has nationwide jurisdiction and hears certain specialized legal claims related to international trade, government
contracts, patents, trademarks, certain money claims against the U.S. government, federal personnel, veterans’ benefits,
and public safety officers’ benefits claims.
8 The relative number of different judgeships authorized among circuit courts generally reflects the population
differences of the geographic areas over which each circuit court exercises jurisdiction. For example, based on 2020
Census Bureau population estimates, the First Circuit has a population of approximately 13.8 million while the Ninth
Circuit has a population of 67.1 million.
9 This total includes 10 temporary judgeships. See the U.S. Courts website at http://www.uscourts.gov/
JudgesAndJudgeships/AuthorizedJudgeships.aspx.
10 The relative number of different judgeships authorized among district courts generally reflects the population
differences of the geographic areas over which each district court exercises jurisdiction. For example, based on 2020
Census Bureau population estimates, the Eastern District of Oklahoma (Muskogee) has a population of approximately
752,000 while the Central District of California (Los Angeles) has a population of approximately 19.4 million.
Judicial Nomination Statistics and Analysis: U.S. Circuit and District Courts, 1977-2020
Congressional Research Service 3
U.S. Circuit and District Court Vacancies Opportunities for a President to make circuit and district court appointments arise when
judgeships are vacant or are scheduled to become vacant. Various factors influence the number of
such opportunities a President will have during his tenure in office, including the frequency with
which judicial departures occur; whether any new judgeships are statutorily created by Congress
(which consequently provide a President with the opportunity to nominate individuals to the new
judgeships);11 the number of judicial nominations submitted by a President; and the speed by
which the Senate considers such nominations.
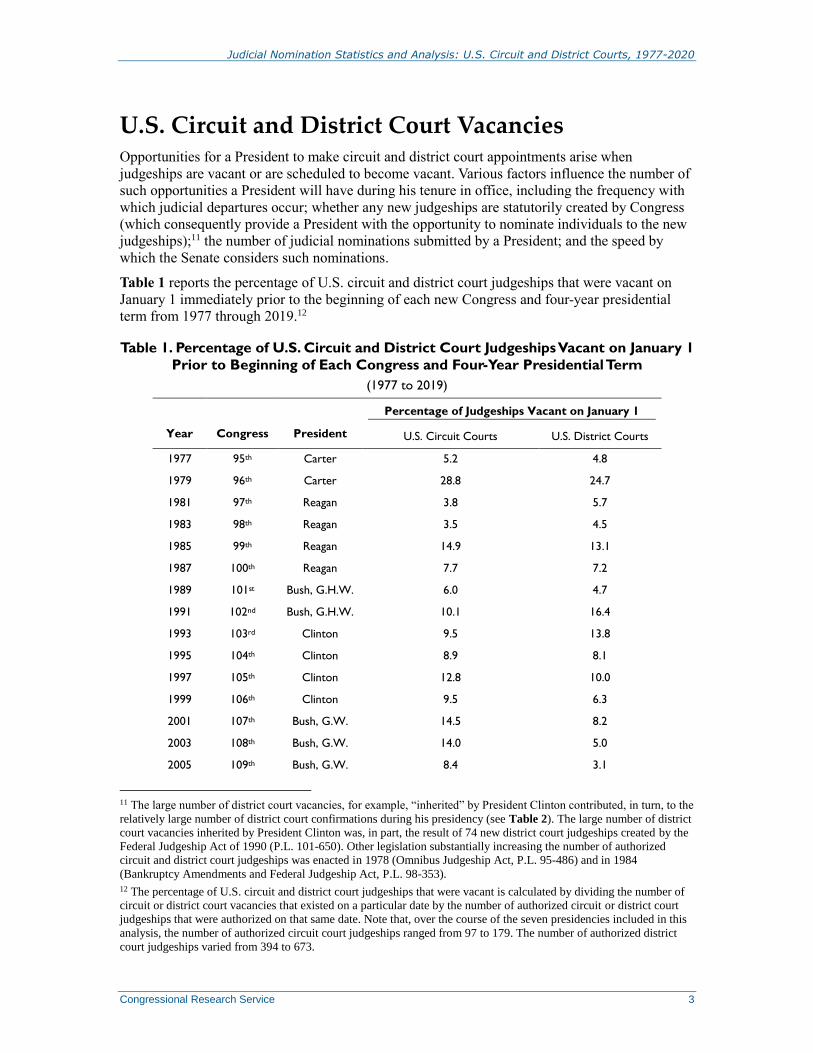
Table 1 reports the percentage of U.S. circuit and district court judgeships that were vacant on
January 1 immediately prior to the beginning of each new Congress and four-year presidential
term from 1977 through 2019.12
Table 1. Percentage of U.S. Circuit and District Court Judgeships Vacant on January 1
Prior to Beginning of Each Congress and Four-Year Presidential Term
(1977 to 2019)
Year Congress President
Percentage of Judgeships Vacant on January 1
U.S. Circuit Courts U.S. District Courts
1977 95th Carter 5.2 4.8
1979 96th Carter 28.8 24.7
1981 97th Reagan 3.8 5.7
1983 98th Reagan 3.5 4.5
1985 99th Reagan 14.9 13.1
1987 100th Reagan 7.7 7.2
1989 101st Bush, G.H.W. 6.0 4.7
1991 102nd Bush, G.H.W. 10.1 16.4
1993 103rd Clinton 9.5 13.8
1995 104th Clinton 8.9 8.1
1997 105th Clinton 12.8 10.0
1999 106th Clinton 9.5 6.3
2001 107th Bush, G.W. 14.5 8.2
2003 108th Bush, G.W. 14.0 5.0
2005 109th Bush, G.W. 8.4 3.1
11 The large number of district court vacancies, for example, “inherited” by President Clinton contributed, in turn, to the
relatively large number of district court confirmations during his presidency (see Table 2). The large number of district
court vacancies inherited by President Clinton was, in part, the result of 74 new district court judgeships created by the
Federal Judgeship Act of 1990 (P.L. 101-650). Other legislation substantially increasing the number of authorized
circuit and district court judgeships was enacted in 1978 (Omnibus Judgeship Act, P.L. 95-486) and in 1984
(Bankruptcy Amendments and Federal Judgeship Act, P.L. 98-353).
12 The percentage of U.S. circuit and district court judgeships that were vacant is calculated by dividing the number of
circuit or district court vacancies that existed on a particular date by the number of authorized circuit or district court
judgeships that were authorized on that same date. Note that, over the course of the seven presidencies included in this
analysis, the number of authorized circuit court judgeships ranged from 97 to 179. The number of authorized district
court judgeships varied from 394 to 673.
Judicial Nomination Statistics and Analysis: U.S. Circuit and District Courts, 1977-2020
Congressional Research Service 4
Year Congress President
Percentage of Judgeships Vacant on January 1
U.S. Circuit Courts U.S. District Courts
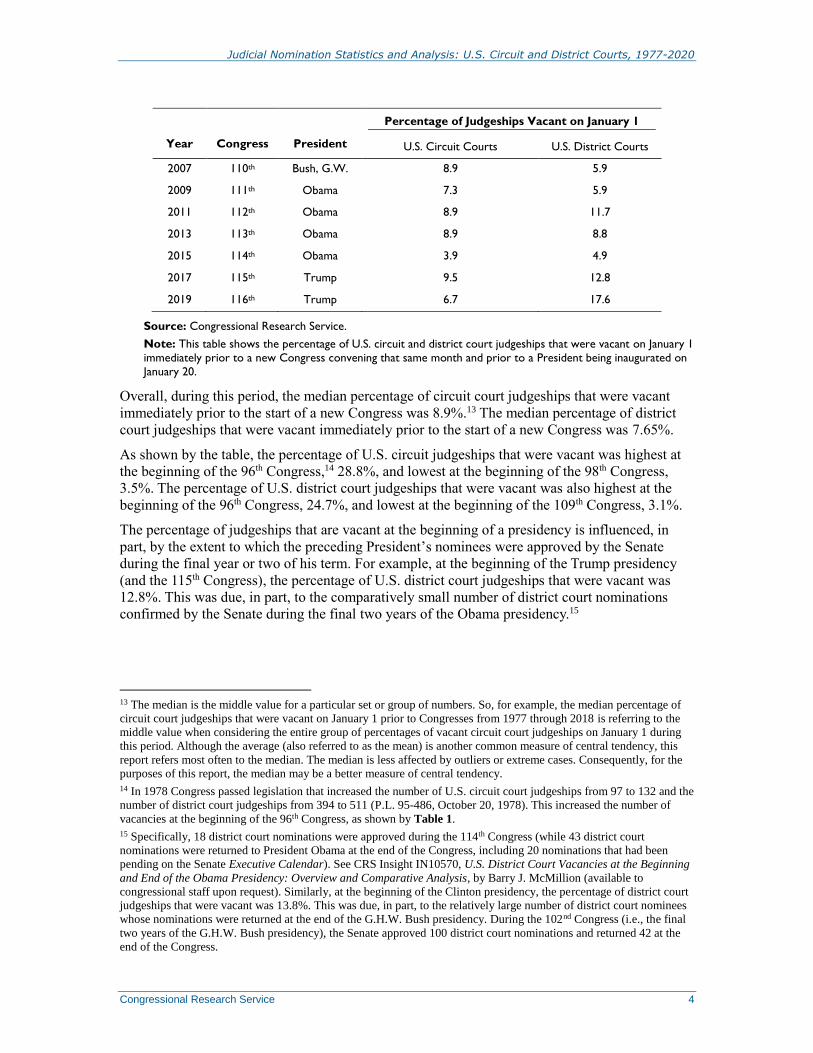
2007 110th Bush, G.W. 8.9 5.9
2009 111th Obama 7.3 5.9
2011 112th Obama 8.9 11.7
2013 113th Obama 8.9 8.8
2015 114th Obama 3.9 4.9
2017 115th Trump 9.5 12.8
2019 116th Trump 6.7 17.6
Source: Congressional Research Service.
Note: This table shows the percentage of U.S. circuit and district court judgeships that were vacant on January 1
immediately prior to a new Congress convening that same month and prior to a President being inaugurated on
January 20.
Overall, during this period, the median percentage of circuit court judgeships that were vacant
immediately prior to the start of a new Congress was 8.9%.13 The median percentage of district
court judgeships that were vacant immediately prior to the start of a new Congress was 7.65%.
As shown by the table, the percentage of U.S. circuit judgeships that were vacant was highest at
the beginning of the 96th Congress,14 28.8%, and lowest at the beginning of the 98th Congress,
3.5%. The percentage of U.S. district court judgeships that were vacant was also highest at the
beginning of the 96th Congress, 24.7%, and lowest at the beginning of the 109th Congress, 3.1%.
The percentage of judgeships that are vacant at the beginning of a presidency is influenced, in
part, by the extent to which the preceding President’s nominees were approved by the Senate
during the final year or two of his term. For example, at the beginning of the Trump presidency
(and the 115th Congress), the percentage of U.S. district court judgeships that were vacant was
12.8%. This was due, in part, to the comparatively small number of district court nominations
confirmed by the Senate during the final two years of the Obama presidency.15
13 The median is the middle value for a particular set or group of numbers. So, for example, the median percentage of
circuit court judgeships that were vacant on January 1 prior to Congresses from 1977 through 2018 is referring to the
middle value when considering the entire group of percentages of vacant circuit court judgeships on January 1 during
this period. Although the average (also referred to as the mean) is another common measure of central tendency, this
report refers most often to the median. The median is less affected by outliers or extreme cases. Consequently, for the
purposes of this report, the median may be a better measure of central tendency.
14 In 1978 Congress passed legislation that increased the number of U.S. circuit court judgeships from 97 to 132 and the
number of district court judgeships from 394 to 511 (P.L. 95-486, October 20, 1978). This increased the number of
vacancies at the beginning of the 96th Congress, as shown by Table 1.
15 Specifically, 18 district court nominations were approved during the 114th Congress (while 43 district court
nominations were returned to President Obama at the end of the Congress, including 20 nominations that had been
pending on the Senate Executive Calendar). See CRS Insight IN10570, U.S. District Court Vacancies at the Beginning
and End of the Obama Presidency: Overview and Comparative Analysis, by Barry J. McMillion (available to
congressional staff upon request). Similarly, at the beginning of the Clinton presidency, the percentage of district court
judgeships that were vacant was 13.8%. This was due, in part, to the relatively large number of district court nominees
whose nominations were returned at the end of the G.H.W. Bush presidency. During the 102nd Congress (i.e., the final
two years of the G.H.W. Bush presidency), the Senate approved 100 district court nominations and returned 42 at the
end of the Congress.

Judicial Nomination Statistics and Analysis: U.S. Circuit and District Courts, 1977-2020
Congressional Research Service 5
Number and Percentage of Nominees Confirmed Various factors influence the number and percentage of judicial nominees confirmed during any
given presidency or Congress. These factors include, but are not limited to, the frequency with
which judges depart the bench; the speed with which a presidential Administration vets and
selects nominees for vacant judgeships; whether a President is of the same political party as the
majority party in the Senate; whether a congressional session coincides with a presidential
election year; and the point in a congressional session when nominations arrive in the Senate.
By Presidency
U.S. Circuit Court Nominees
As shown by Table 2, the number of U.S. circuit court nominees confirmed during a completed
presidency ranged from a high of 83 during the Reagan presidency to a low of 42 during the
single four-year term of George H. W. Bush. Of two-term Presidents, the high ranged from a high
of 83 (Reagan) to a low of 55 during the Obama presidency.
In terms of the percentage of circuit court nominees confirmed during a completed presidency,
which takes into account the number of circuit court nominations submitted to the Senate, the
greatest percentage of nominees were confirmed during the single four-year term of the Trump
presidency (94.7%), and the smallest percentage were confirmed during the George W. Bush
presidency (71.8%). Of two-term Presidents, the high ranged from 88.3% during the Reagan
presidency to a low of 71.8% (George W. Bush).
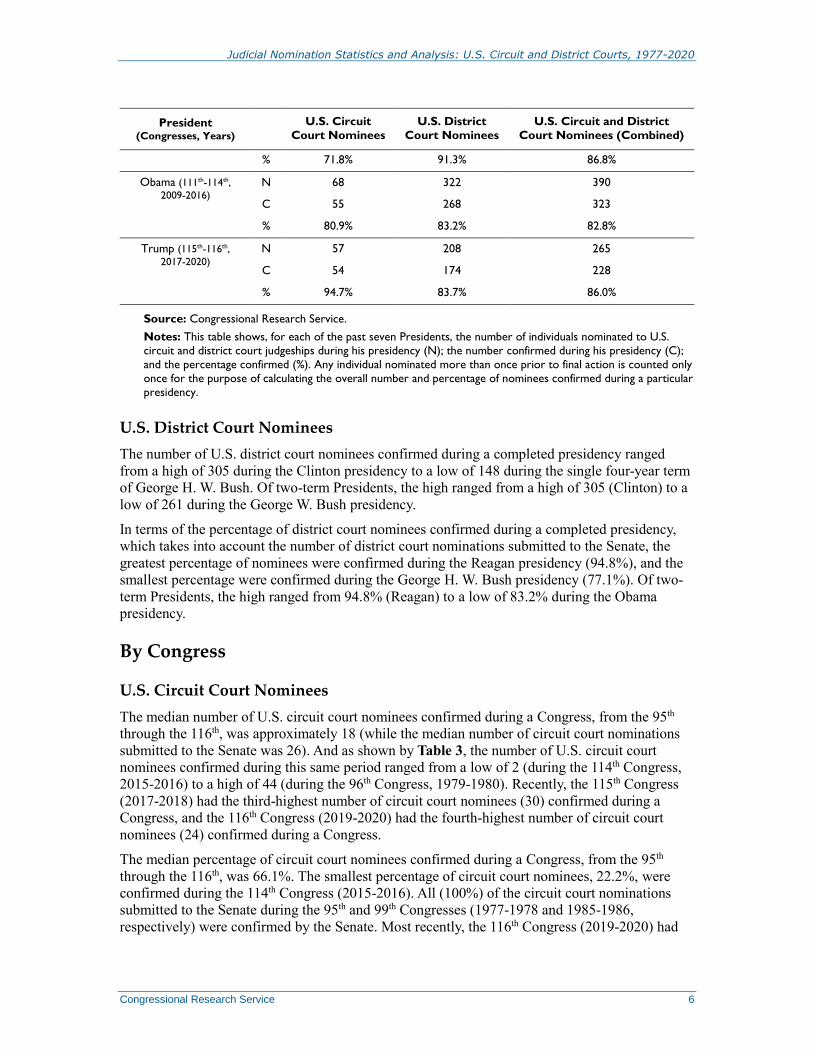
Table 2. U.S. Circuit and District Court Nominees of Seven Most Recent Presidents:
Number Nominated, Number Confirmed, Percentage Confirmed
(1977 to 2020)
President (Congresses, Years)
U.S. Circuit
Court Nominees
U.S. District
Court Nominees
U.S. Circuit and District
Court Nominees (Combined)
Carter (95th-96th, 1977-
1980)
N 60 218 278
C 56 202 258
% 93.3% 92.7% 92.8%
Reagan (97th-100th, 1981-
1988)
N 94 306 400
C 83 290 373
% 88.3% 94.8% 93.2%
Bush, G.H.W. (101st-
102nd, 1989-1992)
N 53 192 245
C 42 148 190
% 79.2% 77.1% 77.6%
Clinton (103rd-106th,
1993-2000)
N 90 350 440
C 65 305 370
% 72.2% 87.1% 84.1%
Bush, G.W. (107th-110th,
2001-2008)
N 85 286 371
C 61 261 322
Judicial Nomination Statistics and Analysis: U.S. Circuit and District Courts, 1977-2020
Congressional Research Service 6
President (Congresses, Years)
U.S. Circuit
Court Nominees
U.S. District
Court Nominees
U.S. Circuit and District
Court Nominees (Combined)
% 71.8% 91.3% 86.8%
Obama (111th-114th,
2009-2016)
N 68 322 390
C 55 268 323
% 80.9% 83.2% 82.8%
Trump (115th-116th,
2017-2020)
N 57 208 265
C 54 174 228
% 94.7% 83.7% 86.0%
Source: Congressional Research Service.
Notes: This table shows, for each of the past seven Presidents, the number of individuals nominated to U.S.
circuit and district court judgeships during his presidency (N); the number confirmed during his presidency (C);
and the percentage confirmed (%). Any individual nominated more than once prior to final action is counted only
once for the purpose of calculating the overall number and percentage of nominees confirmed during a particular
presidency.
U.S. District Court Nominees
The number of U.S. district court nominees confirmed during a completed presidency ranged
from a high of 305 during the Clinton presidency to a low of 148 during the single four-year term
of George H. W. Bush. Of two-term Presidents, the high ranged from a high of 305 (Clinton) to a
low of 261 during the George W. Bush presidency.
In terms of the percentage of district court nominees confirmed during a completed presidency,
which takes into account the number of district court nominations submitted to the Senate, the
greatest percentage of nominees were confirmed during the Reagan presidency (94.8%), and the
smallest percentage were confirmed during the George H. W. Bush presidency (77.1%). Of two-
term Presidents, the high ranged from 94.8% (Reagan) to a low of 83.2% during the Obama
presidency.
By Congress
U.S. Circuit Court Nominees
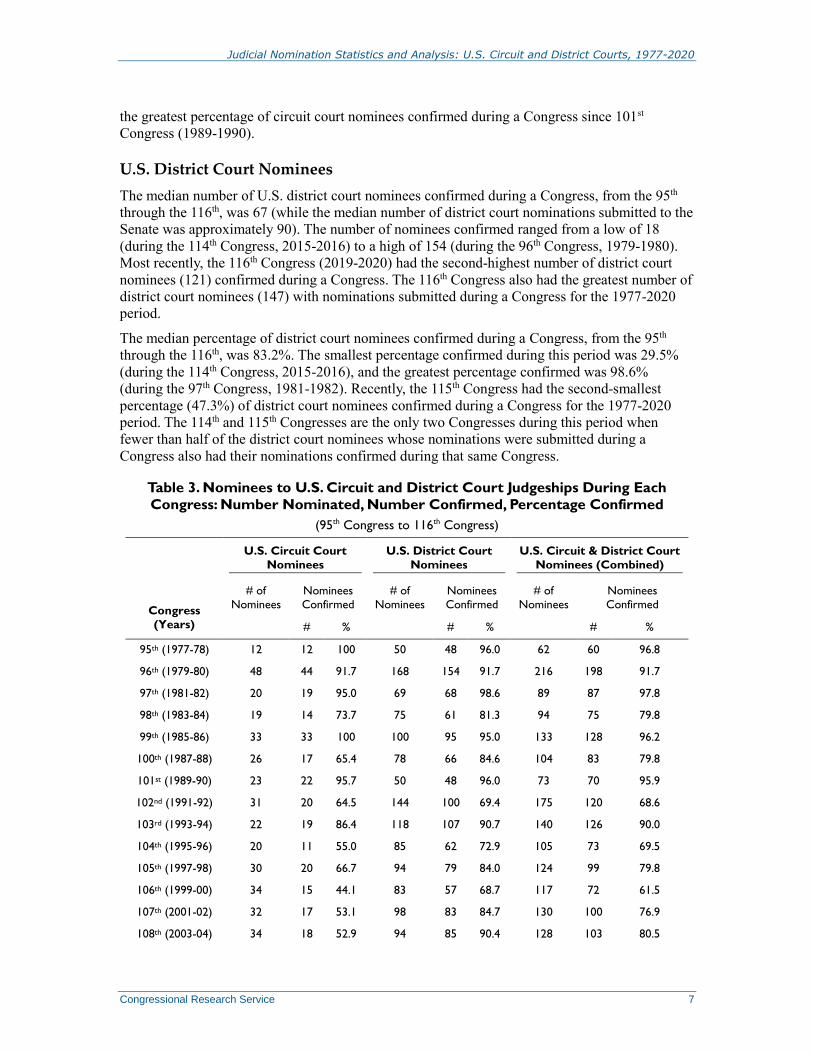
The median number of U.S. circuit court nominees confirmed during a Congress, from the 95th
through the 116th, was approximately 18 (while the median number of circuit court nominations
submitted to the Senate was 26). And as shown by Table 3, the number of U.S. circuit court
nominees confirmed during this same period ranged from a low of 2 (during the 114th Congress,
2015-2016) to a high of 44 (during the 96th Congress, 1979-1980). Recently, the 115th Congress
(2017-2018) had the third-highest number of circuit court nominees (30) confirmed during a
Congress, and the 116th Congress (2019-2020) had the fourth-highest number of circuit court
nominees (24) confirmed during a Congress.
The median percentage of circuit court nominees confirmed during a Congress, from the 95th
through the 116th, was 66.1%. The smallest percentage of circuit court nominees, 22.2%, were
confirmed during the 114th Congress (2015-2016). All (100%) of the circuit court nominations
submitted to the Senate during the 95th and 99th Congresses (1977-1978 and 1985-1986,
respectively) were confirmed by the Senate. Most recently, the 116th Congress (2019-2020) had
Judicial Nomination Statistics and Analysis: U.S. Circuit and District Courts, 1977-2020
Congressional Research Service 7
the greatest percentage of circuit court nominees confirmed during a Congress since 101st
Congress (1989-1990).
U.S. District Court Nominees
The median number of U.S. district court nominees confirmed during a Congress, from the 95th
through the 116th, was 67 (while the median number of district court nominations submitted to the
Senate was approximately 90). The number of nominees confirmed ranged from a low of 18
(during the 114th Congress, 2015-2016) to a high of 154 (during the 96th Congress, 1979-1980).
Most recently, the 116th Congress (2019-2020) had the second-highest number of district court
nominees (121) confirmed during a Congress. The 116th Congress also had the greatest number of
district court nominees (147) with nominations submitted during a Congress for the 1977-2020
period.
The median percentage of district court nominees confirmed during a Congress, from the 95th
through the 116th, was 83.2%. The smallest percentage confirmed during this period was 29.5%
(during the 114th Congress, 2015-2016), and the greatest percentage confirmed was 98.6%
(during the 97th Congress, 1981-1982). Recently, the 115th Congress had the second-smallest
percentage (47.3%) of district court nominees confirmed during a Congress for the 1977-2020
period. The 114th and 115th Congresses are the only two Congresses during this period when
fewer than half of the district court nominees whose nominations were submitted during a
Congress also had their nominations confirmed during that same Congress.
Table 3. Nominees to U.S. Circuit and District Court Judgeships During Each
Congress: Number Nominated, Number Confirmed, Percentage Confirmed
(95th Congress to 116th Congress)
Congress
(Years)
U.S. Circuit Court
Nominees
U.S. District Court
Nominees
U.S. Circuit & District Court
Nominees (Combined)
# of
Nominees
Nominees
Confirmed
# of
Nominees
Nominees
Confirmed
# of
Nominees
Nominees
Confirmed
# % # % # %
95th (1977-78) 12 12 100 50 48 96.0 62 60 96.8
96th (1979-80) 48 44 91.7 168 154 91.7 216 198 91.7
97th (1981-82) 20 19 95.0 69 68 98.6 89 87 97.8
98th (1983-84) 19 14 73.7 75 61 81.3 94 75 79.8
99th (1985-86) 33 33 100 100 95 95.0 133 128 96.2
100th (1987-88) 26 17 65.4 78 66 84.6 104 83 79.8
101st (1989-90) 23 22 95.7 50 48 96.0 73 70 95.9
102nd (1991-92) 31 20 64.5 144 100 69.4 175 120 68.6
103rd (1993-94) 22 19 86.4 118 107 90.7 140 126 90.0
104th (1995-96) 20 11 55.0 85 62 72.9 105 73 69.5
105th (1997-98) 30 20 66.7 94 79 84.0 124 99 79.8
106th (1999-00) 34 15 44.1 83 57 68.7 117 72 61.5
107th (2001-02) 32 17 53.1 98 83 84.7 130 100 76.9
108th (2003-04) 34 18 52.9 94 85 90.4 128 103 80.5

Judicial Nomination Statistics and Analysis: U.S. Circuit and District Courts, 1977-2020
Congressional Research Service 8
Congress
(Years)
U.S. Circuit Court
Nominees
U.S. District Court
Nominees
U.S. Circuit & District Court
Nominees (Combined)
# of
Nominees
Nominees
Confirmed
# of
Nominees
Nominees
Confirmed
# of
Nominees
Nominees
Confirmed
# % # % # %
109th (2005-06) 28 16 57.1 65 35 53.8 93 51 54.8
110th (2007-08) 23 10 43.5 79 58 73.4 102 68 66.7
111th (2009-10) 25 16 64.0 78 44 56.4 103 60 58.3
112th (2011-12) 25 14 56.0 127 97 76.4 152 111 73.0
113th (2013-14) 26 23 88.5 123 109 88.6 149 132 88.6
114th (2015-16) 9 2 22.2 61 18 29.5 70 20 28.6
115th (2017-18) 43 30 69.8 112 53 47.3 155 83 53.5
116th (2019-20) 26 24 92.3 147 121 82.3 173 145 83.8
Source: Congressional Research Service.
Notes: This table shows, for the 95th Congress through the 116th Congress, the number of individuals
nominated to U.S. circuit and district court judgeships during each Congress; the number of nominees confirmed
during each Congress (#); and the percentage of nominees confirmed during the same Congress (%). An
individual is counted during any Congress for which he or she had a nomination submitted for a particular
judgeship. Consequently, if an individual was nominated during more than one Congress prior to final action on
his or her nomination, he or she is counted for each Congress during which he or she had a nomination
submitted.
Influence of Unified and Divided Party Control
In general, both a greater number and percentage of circuit and district court nominees were
confirmed during Congresses in which the party of the President was the same as the majority
party in the Senate.16 During Congresses in which there was unified party control (i.e., the party
of the President and the majority party in the Senate were the same),17 the median number of
circuit court nominees confirmed was 19, and the median percentage of nominees confirmed was
86.4%. In contrast, during Congresses in which there was divided party control (i.e., the party of
the President was different than the majority party in the Senate),18 the median number of circuit
court nominees confirmed was 16, and the median percentage of nominees confirmed was 59.8%.
During Congresses in which there was unified party control, the median number of district court
nominees confirmed was 85, and the median percentage of nominees confirmed was 88.6%. In
contrast, during Congresses in which there was divided party control, the median number of
district court nominees confirmed was 60, and the median percentage of nominees confirmed was
73.2%.19
16 This part of the analysis omits the 107th Congress (during which the majority party in the Senate changed prior to the
end of the Congress).
17 These Congresses include the 95th, 96th, 97th, 98th, 99th, 103rd, 108th, 109th, 111th, 112th, 113th, 115th, and 116th.
18 These Congresses include the 100th, 101st, 102nd, 104th, 105th, 106th, 110th, and 114th.
19 There was also a notable difference in the number of district court nominations submitted to the Senate during
Congresses in which there was unified or divided party control. During Congresses with unified control the median
number of nominations submitted by a President was 100, while during Congresses with divided control the median
number of nominations submitted was 81. In contrast, there was not a comparatively large difference in the number of

Judicial Nomination Statistics and Analysis: U.S. Circuit and District Courts, 1977-2020
Congressional Research Service 9
Multiple Nominations of the Same Person Prior to
Final Action by the Senate Over the last several presidencies, it has become increasingly common for a President to
nominate an individual two or more times to a U.S. circuit or district court judgeship prior to final
action on the nomination by the Senate (irrespective of whether the Senate ultimately approved
the nomination).20 Consequently, the percentage of nominees confirmed during a presidency who
were nominated two or more times prior to being approved by the Senate has also increased in
recent years.
U.S. Circuit Court Nominees
As shown by Table 4, the total number of circuit court nominees who were nominated two or
more times prior to final action, whether confirmed or not, ranged from a low of 1 (during the
Carter and George H. W. Bush presidencies) to a high of 39 (during the George W. Bush
presidency).
The number of circuit court nominees who were nominated more than once and ultimately
confirmed by the Senate ranged from a low of 0 (during the George H. W. Bush presidency) to a
high of 28 (during the George W. Bush presidency). And the number of nominees who were
nominated more than once but not confirmed by the Senate ranged from a low of 0 (during the
Carter presidency) to a high of 11 (during the George W. Bush presidency).
Overall, of the seven presidencies listed in Table 4, President George W. Bush had the greatest
percentage of confirmed circuit court nominees who were nominated more than once prior to
being confirmed by the Senate (45.9%).
During the Obama presidency, the percentage of confirmed circuit court nominees who were
nominated more than once prior to being approved by the Senate declined to 36.4% (representing
the second-highest percentage of circuit court nominees nominated more than once prior to
Senate approval).
More recently, during the Trump presidency, the percentage of confirmed circuit court nominees
who were nominated more than once prior to Senate confirmation declined to 33.3%
(representing the third-highest percentage of circuit court nominees nominated more than once
prior to Senate approval). However, during the Trump presidency, only a single individual was
nominated more than once prior to final action and not ultimately confirmed by the Senate
(representing the fewest number of such nominees since the George H. W. Bush presidency).
circuit court nominations submitted during Congresses with unified or divided control (25 and 26, respectively).
20 Senate rules provide that “nominations neither confirmed nor rejected during the session at which they are made shall
not be acted upon at any succeeding session without being again made to the Senate by the President…” In practice,
such nominations, whether for the executive or judicial branch, have sometimes been returned to the President at the
end of the first session and are always returned to the President at the end of the Congress. Nominations also may be
returned automatically to the President at the beginning of a recess of more than 30 days, but the Senate rule providing
for this return has often been waived. See CRS Report R44083, Appointment and Confirmation of Executive Branch
Leadership: An Overview, by Henry B. Hogue and Maeve P. Carey.

Judicial Nomination Statistics and Analysis: U.S. Circuit and District Courts, 1977-2020
Congressional Research Service 10
Table 4. Number of U.S. Circuit Court Nominees Who Were Nominated Two or
More Times Prior to Final Action and Percentage of All Confirmed U.S. Circuit
Court Nominees Nominated Two or More Times Prior to Being Confirmed
President
Number of Nominees
Nominated Two or More Times
Prior To Final Action
Percentage of President’s
Confirmed Nominees Who Were
Nominated Two or More Times
Prior to Being Confirmed Confirmed Not Confirmed Total
Carter 1 0 1 1.8%
Reagan 6 1 7 7.2%
Bush, G.H.W. 0 1 1 0.0%
Clinton 12 10 22 18.5%
Bush, G.W. 28 11 39 45.9%
Obama 20 5 25 36.4%
Trump 18 1 19 33.3%
Source: Congressional Research Service.
Notes: This table shows the number of U.S. circuit court nominees who were nominated two or more times prior to final action on their nominations (and whether confirmed or not by the Senate). The table also provides
the overall percentage of circuit court nominees who were confirmed during a presidency and nominated two or
more times prior to being confirmed by the Senate.
U.S. District Court Nominees
As shown by Table 5, the total number of district court nominees who were nominated two or
more times prior to final action ranged from a low of 3 (during the George H. W. Bush
presidency) to a high of 111 (during the Obama presidency).
The number of district court nominees who were nominated more than once and ultimately
confirmed by the Senate ranged from a low of 2 (during the George H. W. Bush presidency) to a
high of 104 (during the Obama presidency). And the number of nominees who were nominated
more than once but not confirmed by the Senate ranged from a low of 1 (during the Carter and
George H. W. Bush presidencies) to a high of 13 (during the Trump presidency).
Overall, of the seven presidencies listed in Table 5, President Trump had the greatest percentage
of confirmed district court nominees who were nominated more than once prior to being
confirmed by the Senate (40.8%). This was an increase from the Obama presidency, when 38.8%
of district court nominees were nominated more than once prior to being confirmed (which
represents the second-highest percentage of district court nominees nominated more than once
prior to Senate approval).

Judicial Nomination Statistics and Analysis: U.S. Circuit and District Courts, 1977-2020
Congressional Research Service 11
Table 5. Number of U.S. District Court Nominees Who Were Nominated Two or
More Times Prior to Final Action and Percentage of All Confirmed U.S. District
Court Nominees Nominated Two or More Times Prior to Being Confirmed
President
Number of Nominees Nominated
Two or More Times Prior to Final
Action
Percentage of All Confirmed
Nominees Who Were
Nominated Two or More Times
Prior to Being Confirmed Confirmed Not Confirmed Total
Carter 4 1 5 2.0%
Reagan 24 2 26 8.3%
Bush, G.H.W. 2 1 3 1.4%
Clinton 21 9 30 6.9%
Bush, G.W. 62 6 68 23.8%
Obama 104 7 111 38.8%
Trump 71 13 84 40.8%
Source: Congressional Research Service.
Notes: This table shows the number of U.S. district court nominees who were nominated two or more times prior to final action on their nominations (and whether confirmed or not by the Senate). The table also provides
the overall percentage of district court nominees who were confirmed during a presidency and nominated two
or more times prior to being confirmed by the Senate.
Nominees Whose Nominations Were Returned at
the End of a Congress Table 6 provides data related to the number of U.S. circuit and district court nominees whose
nominations were returned by the Senate to the President at the end of each Congress, from the
95th through the 116th.21 The table also indicates how many of these nominees had been given a
hearing (or not) by the Judiciary Committee as well as how many had their nominations reported
by the committee and pending on the Executive Calendar prior to being returned to the President.
For a Congress that did not coincide with the last two years of a presidency, it was not uncommon
for a nominee whose nomination was returned at the end of it to be resubmitted during a
subsequent Congress and eventually be approved by the Senate.22 For a Congress, however, that
did coincide with the last two years of a presidency, a nominee whose nomination was returned at
the end of it was not confirmed by the Senate.
U.S. Circuit Court Nominees
The median number of U.S. circuit court nominees whose nominations were returned to a
President at the end of a Congress during this period was 7, while the median number of district
court nominees whose nominations were returned at the end of a Congress was 14. For the 14
21 These data do not include nominations that were returned to a President at times other than at the end of a Congress
or that were withdrawn by a President himself. It also excludes nominations that were rejected by the Senate in up-or-
down roll call votes.
22 For example, each of the 13 district court nominations returned at the end of the 98th Congress (1983-1984) was later
approved by the Senate during a subsequent Congress. Similarly, 22 of 24 district court nominations returned at the end
of the 112th Congress (2011-2012) were later approved during a subsequent Congress.
Judicial Nomination Statistics and Analysis: U.S. Circuit and District Courts, 1977-2020
Congressional Research Service 12
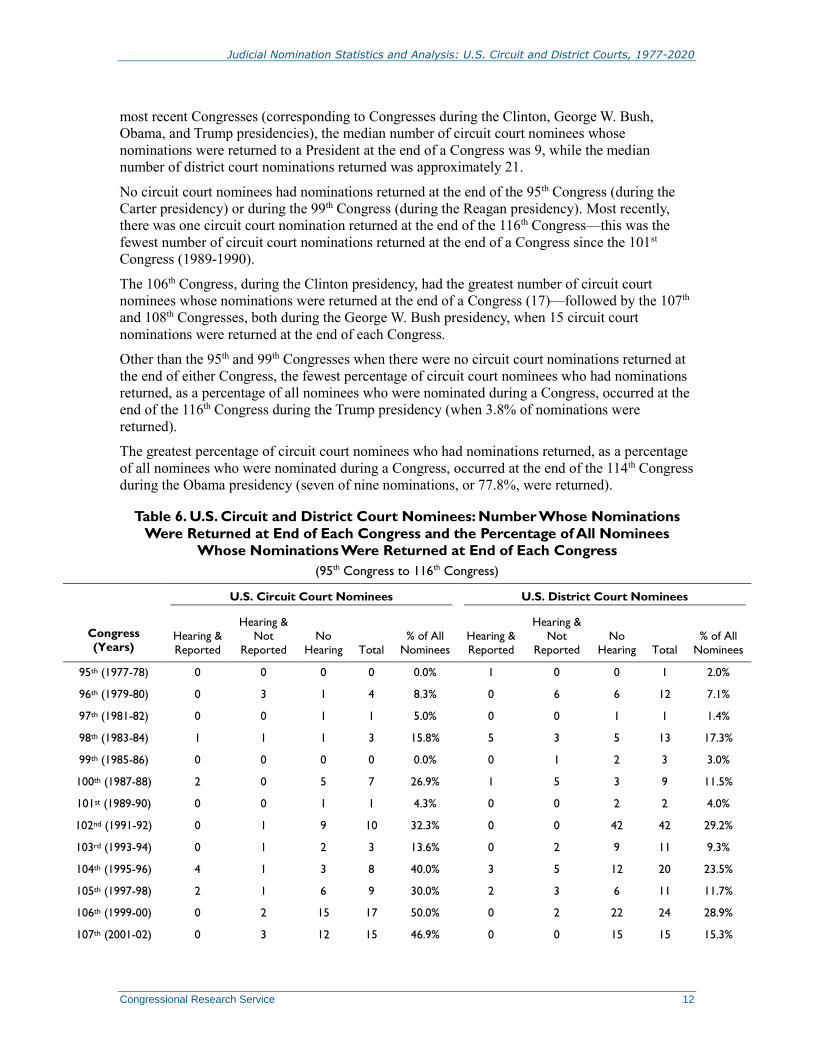
most recent Congresses (corresponding to Congresses during the Clinton, George W. Bush,
Obama, and Trump presidencies), the median number of circuit court nominees whose
nominations were returned to a President at the end of a Congress was 9, while the median
number of district court nominations returned was approximately 21.
No circuit court nominees had nominations returned at the end of the 95th Congress (during the
Carter presidency) or during the 99th Congress (during the Reagan presidency). Most recently,
there was one circuit court nomination returned at the end of the 116th Congress—this was the
fewest number of circuit court nominations returned at the end of a Congress since the 101st
Congress (1989-1990).
The 106th Congress, during the Clinton presidency, had the greatest number of circuit court
nominees whose nominations were returned at the end of a Congress (17)—followed by the 107th
and 108th Congresses, both during the George W. Bush presidency, when 15 circuit court
nominations were returned at the end of each Congress.
Other than the 95th and 99th Congresses when there were no circuit court nominations returned at
the end of either Congress, the fewest percentage of circuit court nominees who had nominations
returned, as a percentage of all nominees who were nominated during a Congress, occurred at the
end of the 116th Congress during the Trump presidency (when 3.8% of nominations were
returned).
The greatest percentage of circuit court nominees who had nominations returned, as a percentage
of all nominees who were nominated during a Congress, occurred at the end of the 114th Congress
during the Obama presidency (seven of nine nominations, or 77.8%, were returned).
Table 6. U.S. Circuit and District Court Nominees: Number Whose Nominations
Were Returned at End of Each Congress and the Percentage of All Nominees
Whose Nominations Were Returned at End of Each Congress
(95th Congress to 116th Congress)
Congress
(Years)
U.S. Circuit Court Nominees U.S. District Court Nominees
Hearing &
Reported
Hearing &
Not
Reported
No
Hearing Total
% of All
Nominees
Hearing &
Reported
Hearing &
Not
Reported
No
Hearing Total
% of All
Nominees
95th (1977-78) 0 0 0 0 0.0% 1 0 0 1 2.0%
96th (1979-80) 0 3 1 4 8.3% 0 6 6 12 7.1%
97th (1981-82) 0 0 1 1 5.0% 0 0 1 1 1.4%
98th (1983-84) 1 1 1 3 15.8% 5 3 5 13 17.3%
99th (1985-86) 0 0 0 0 0.0% 0 1 2 3 3.0%
100th (1987-88) 2 0 5 7 26.9% 1 5 3 9 11.5%
101st (1989-90) 0 0 1 1 4.3% 0 0 2 2 4.0%
102nd (1991-92) 0 1 9 10 32.3% 0 0 42 42 29.2%
103rd (1993-94) 0 1 2 3 13.6% 0 2 9 11 9.3%
104th (1995-96) 4 1 3 8 40.0% 3 5 12 20 23.5%
105th (1997-98) 2 1 6 9 30.0% 2 3 6 11 11.7%
106th (1999-00) 0 2 15 17 50.0% 0 2 22 24 28.9%
107th (2001-02) 0 3 12 15 46.9% 0 0 15 15 15.3%
Judicial Nomination Statistics and Analysis: U.S. Circuit and District Courts, 1977-2020
Congressional Research Service 13
Congress
(Years)
U.S. Circuit Court Nominees U.S. District Court Nominees
Hearing &
Reported
Hearing &
Not
Reported
No
Hearing Total
% of All
Nominees
Hearing &
Reported
Hearing &
Not
Reported
No
Hearing Total
% of All
Nominees
108th (2003-04) 11 3 1 15 44.1% 0 2 6 8 8.5%
109th (2005-06) 0 1 9 10 35.7% 13 1 14 28 43.1%
110th (2007-08) 0 0 10 10 43.5% 0 3 17 20 25.3%
111th (2009-10) 4 0 5 9 36.0% 16 1 17 34 43.6%
112th (2011-12) 4 0 3 7 28.0% 6 4 14 24 18.9%
113th (2013-14) 0 0 2 2 7.7% 0 1 10 11 8.9%
114th (2015-16) 2 1 4 7 77.8% 18 10 15 43 70.5%
115th (2017-18) 0 6 6 12 27.9% 31 17 8 56 50.0%
116th (2019-20) 0 1 0 1 3.8% 3 0 18 21 14.3%
Source: Congressional Research Service.
Notes: This table shows, for the 95th Congress through the 116th Congress, the number of nominees whose
nominations were returned at the end of a Congress (as well as how many of the nominees had received a
Judiciary Committee hearing, or not, and how many had their nominations reported by the committee).
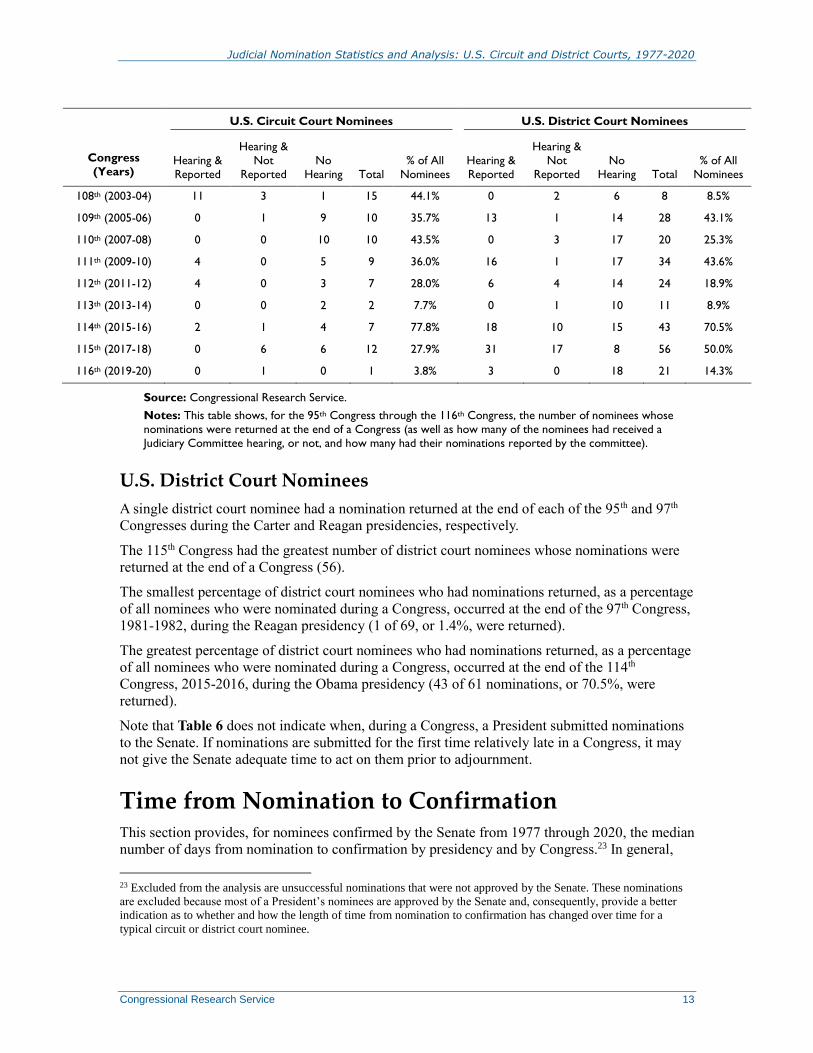
U.S. District Court Nominees
A single district court nominee had a nomination returned at the end of each of the 95th and 97th
Congresses during the Carter and Reagan presidencies, respectively.
The 115th Congress had the greatest number of district court nominees whose nominations were
returned at the end of a Congress (56).
The smallest percentage of district court nominees who had nominations returned, as a percentage
of all nominees who were nominated during a Congress, occurred at the end of the 97th Congress,
1981-1982, during the Reagan presidency (1 of 69, or 1.4%, were returned).
The greatest percentage of district court nominees who had nominations returned, as a percentage
of all nominees who were nominated during a Congress, occurred at the end of the 114th
Congress, 2015-2016, during the Obama presidency (43 of 61 nominations, or 70.5%, were
returned).
Note that Table 6 does not indicate when, during a Congress, a President submitted nominations
to the Senate. If nominations are submitted for the first time relatively late in a Congress, it may
not give the Senate adequate time to act on them prior to adjournment.
Time from Nomination to Confirmation This section provides, for nominees confirmed by the Senate from 1977 through 2020, the median
number of days from nomination to confirmation by presidency and by Congress.23 In general,
23 Excluded from the analysis are unsuccessful nominations that were not approved by the Senate. These nominations
are excluded because most of a President’s nominees are approved by the Senate and, consequently, provide a better
indication as to whether and how the length of time from nomination to confirmation has changed over time for a
typical circuit or district court nominee.

Judicial Nomination Statistics and Analysis: U.S. Circuit and District Courts, 1977-2020
Congressional Research Service 14
the length of time from when a President nominates an individual to a vacant circuit or district
court judgeship to when the Senate approves that nomination has steadily increased, for most
nominees, since 1977.24
In addition to the general increase in the length of time of the confirmation process itself, an
individual nominee might experience a relatively longer period of time from nomination to
confirmation due to opposition to the nomination by the nonpresidential party in the Senate;
committee and floor scheduling decisions unrelated to partisan opposition to the nomination; and
delays in receiving requested background information from the nominee.25
By Presidency
U.S. Circuit Court Nominees
As shown by Table 7, the median number of days from nomination to confirmation for U.S.
circuit court nominees ranged from a low of 45.0 days during the Reagan presidency to a high of
229.0 days during the Obama presidency.
Following the Reagan presidency, the median number of days from nomination to confirmation
increased during each successive presidency with the recent exception of the Trump presidency—
increasing by 176% from 83 days during the George H. W. Bush presidency to 229 days during
the Obama presidency, and then declining by 42% to 133.5 days during the Trump presidency.
The decline from the Obama to the Trump presidencies in the median number of days from
nomination to confirmation for U.S. circuit court nominations likely reflects the prioritization of
processing circuit court nominations during the 116th Congress.26
If the average, rather than the median, is used to measure the length of time a President’s circuit
court nominees waited from nomination to confirmation,27 the average number of days from
24 If a nominee was nominated more than once by a President, prior to the nominee’s eventual confirmation by the
Senate, the first date on which he or she was nominated was used to calculate the days elapsed from nomination to
confirmation.
25 There may be several consequences to the relatively longer waiting times from nomination to confirmation
experienced by many judicial nominees, including an increase in the vacancy rates of circuit and district court
judgeships; detrimental effects on judicial administration, such as caseload management; fewer highly qualified
nominees who are willing to undergo a more lengthy, and potentially more combative, confirmation process; and an
excessive emphasis on the ideological or partisan predisposition of nominees. For further discussion of these factors,
see CRS Report R43316, Length of Time from Nomination to Confirmation for U.S. Circuit and District Court
Nominees: Overview and Policy Options to Shorten the Process, by Barry J. McMillion.
26 The prioritization given to the processing of circuit court nominations was likely facilitated in part by the earlier
reinterpretation of Senate Rule XXII during the 113th Congress to allow cloture to be invoked on most nominations by
a majority of Senators voting (a quorum being present), as well as by the change surrounding the Senate Judiciary
Committee’s blue slip policy for circuit court nominees during the first year of the Trump presidency itself. This
change permitted the Judiciary Committee to consider circuit court nominees whose nominations lacked the support
from one or both of their home state Senators. See Congressional Record, daily edition, vol. 159 (November 21, 2013),
pp. S8417-S8418; CRS Report R43331, Majority Cloture for Nominations: Implications and the “Nuclear”
Proceedings of November 21, 2013, by Valerie Heitshusen; and see Sen. Chuck Grassley, Congressional Record, daily
edition, vol. 163 (November 16, 2017), pp. S7285-S7287. See also Joseph P. Williams, “Sen. Grassley Opts to Ignore
Blue Slips Against Trump Judicial Nominees,” U.S. News & World Report, November 16, 2017, at
https://www.usnews.com/news/politics/articles/2017-11-16/sen-grassley-opts-to-ignore-blue-slips-against-trump-
judicial-nominees.
27 The average number of days from nomination to confirmation increases, relative to the median number of days from
nomination to confirmation, because during each presidency there are nominees whose wait times from nomination to
confirmation were particularly long relative to a President’s other nominees who were confirmed by the Senate. The
Judicial Nomination Statistics and Analysis: U.S. Circuit and District Courts, 1977-2020
Congressional Research Service 15
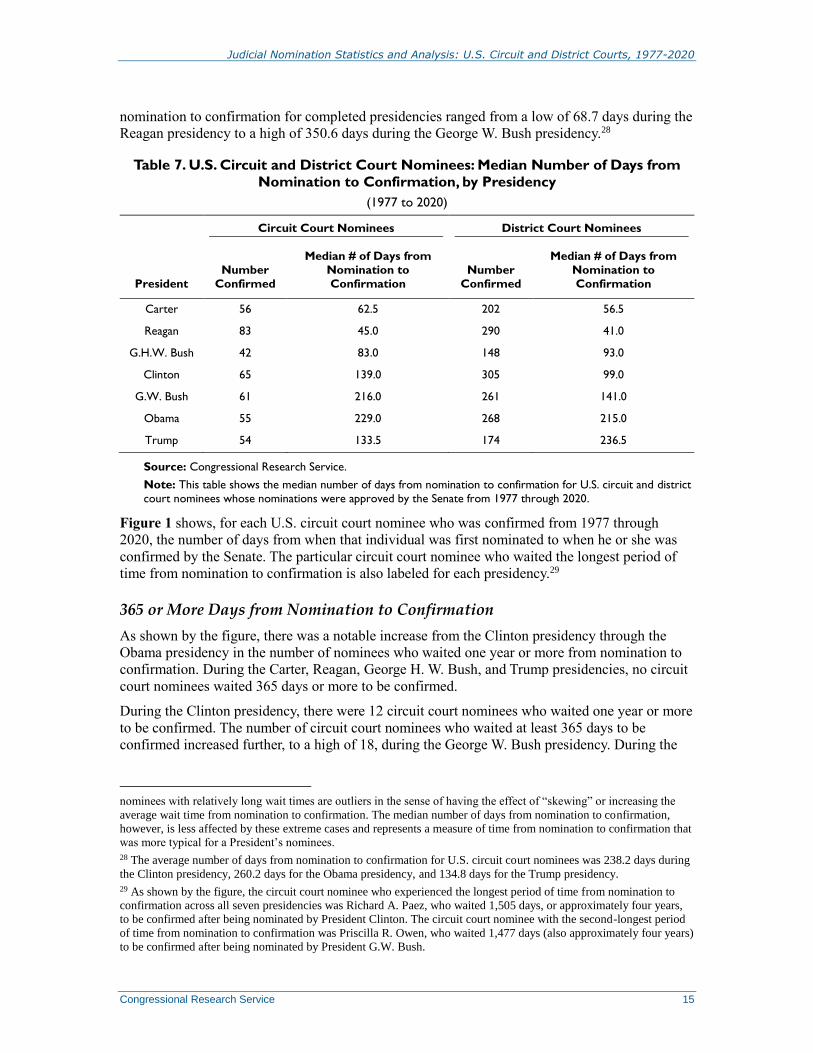
nomination to confirmation for completed presidencies ranged from a low of 68.7 days during the
Reagan presidency to a high of 350.6 days during the George W. Bush presidency.28
Table 7. U.S. Circuit and District Court Nominees: Median Number of Days from
Nomination to Confirmation, by Presidency
(1977 to 2020)
Circuit Court Nominees District Court Nominees
President
Number
Confirmed
Median # of Days from
Nomination to
Confirmation
Number
Confirmed
Median # of Days from
Nomination to
Confirmation
Carter 56 62.5 202 56.5
Reagan 83 45.0 290 41.0
G.H.W. Bush 42 83.0 148 93.0
Clinton 65 139.0 305 99.0
G.W. Bush 61 216.0 261 141.0
Obama 55 229.0 268 215.0
Trump 54 133.5 174 236.5
Source: Congressional Research Service.
Note: This table shows the median number of days from nomination to confirmation for U.S. circuit and district
court nominees whose nominations were approved by the Senate from 1977 through 2020.
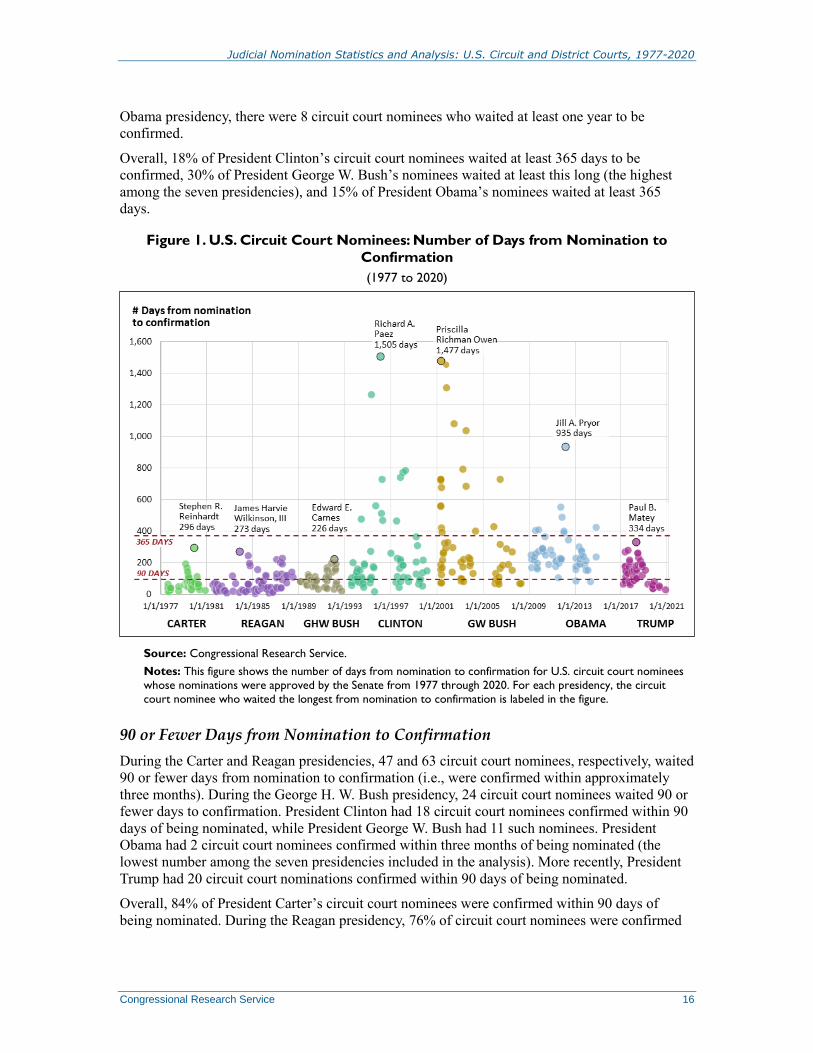
Figure 1 shows, for each U.S. circuit court nominee who was confirmed from 1977 through
2020, the number of days from when that individual was first nominated to when he or she was
confirmed by the Senate. The particular circuit court nominee who waited the longest period of
time from nomination to confirmation is also labeled for each presidency.29
365 or More Days from Nomination to Confirmation
As shown by the figure, there was a notable increase from the Clinton presidency through the
Obama presidency in the number of nominees who waited one year or more from nomination to
confirmation. During the Carter, Reagan, George H. W. Bush, and Trump presidencies, no circuit
court nominees waited 365 days or more to be confirmed.
During the Clinton presidency, there were 12 circuit court nominees who waited one year or more
to be confirmed. The number of circuit court nominees who waited at least 365 days to be
confirmed increased further, to a high of 18, during the George W. Bush presidency. During the
nominees with relatively long wait times are outliers in the sense of having the effect of “skewing” or increasing the
average wait time from nomination to confirmation. The median number of days from nomination to confirmation,
however, is less affected by these extreme cases and represents a measure of time from nomination to confirmation that
was more typical for a President’s nominees.
28 The average number of days from nomination to confirmation for U.S. circuit court nominees was 238.2 days during
the Clinton presidency, 260.2 days for the Obama presidency, and 134.8 days for the Trump presidency.
29 As shown by the figure, the circuit court nominee who experienced the longest period of time from nomination to
confirmation across all seven presidencies was Richard A. Paez, who waited 1,505 days, or approximately four years,
to be confirmed after being nominated by President Clinton. The circuit court nominee with the second-longest period
of time from nomination to confirmation was Priscilla R. Owen, who waited 1,477 days (also approximately four years)
to be confirmed after being nominated by President G.W. Bush.
Judicial Nomination Statistics and Analysis: U.S. Circuit and District Courts, 1977-2020
Congressional Research Service 16
Obama presidency, there were 8 circuit court nominees who waited at least one year to be
confirmed.
Overall, 18% of President Clinton’s circuit court nominees waited at least 365 days to be
confirmed, 30% of President George W. Bush’s nominees waited at least this long (the highest
among the seven presidencies), and 15% of President Obama’s nominees waited at least 365
days.
Figure 1. U.S. Circuit Court Nominees: Number of Days from Nomination to
Confirmation
(1977 to 2020)
Source: Congressional Research Service.
Notes: This figure shows the number of days from nomination to confirmation for U.S. circuit court nominees
whose nominations were approved by the Senate from 1977 through 2020. For each presidency, the circuit
court nominee who waited the longest from nomination to confirmation is labeled in the figure.
90 or Fewer Days from Nomination to Confirmation
During the Carter and Reagan presidencies, 47 and 63 circuit court nominees, respectively, waited
90 or fewer days from nomination to confirmation (i.e., were confirmed within approximately
three months). During the George H. W. Bush presidency, 24 circuit court nominees waited 90 or
fewer days to confirmation. President Clinton had 18 circuit court nominees confirmed within 90
days of being nominated, while President George W. Bush had 11 such nominees. President
Obama had 2 circuit court nominees confirmed within three months of being nominated (the
lowest number among the seven presidencies included in the analysis). More recently, President
Trump had 20 circuit court nominations confirmed within 90 days of being nominated.
Overall, 84% of President Carter’s circuit court nominees were confirmed within 90 days of
being nominated. During the Reagan presidency, 76% of circuit court nominees were confirmed
Judicial Nomination Statistics and Analysis: U.S. Circuit and District Courts, 1977-2020
Congressional Research Service 17
within 90 days of nomination, while during the George H. W. Bush presidency 57% of circuit
court nominees were confirmed within this time frame.
During the Clinton presidency, the percentage of circuit court nominees approved by the Senate
within 90 days fell below half of all circuit court nominees confirmed (to 26%). The percentage
of nominees confirmed in 90 or fewer days decreased further during both the George W. Bush
presidency (to 16%) and the Obama presidency (to 4%, the lowest percentage among the six
completed presidencies). During the Trump presidency, 37% of confirmed circuit court nominees
were confirmed within 90 days of being nominated.
U.S. District Court Nominees
As shown by Table 7, the median number of days from nomination to confirmation for U.S.
district court nominees ranged from a low of 41.0 days during the Reagan presidency to a high of
236.5 days during the Trump presidency.
Following the Reagan presidency, the median number of days from nomination to confirmation
increased during each successive completed presidency, increasing by 154% from 93.0 days
during the George H. W. Bush presidency to 236.5 days during the Trump presidency.30
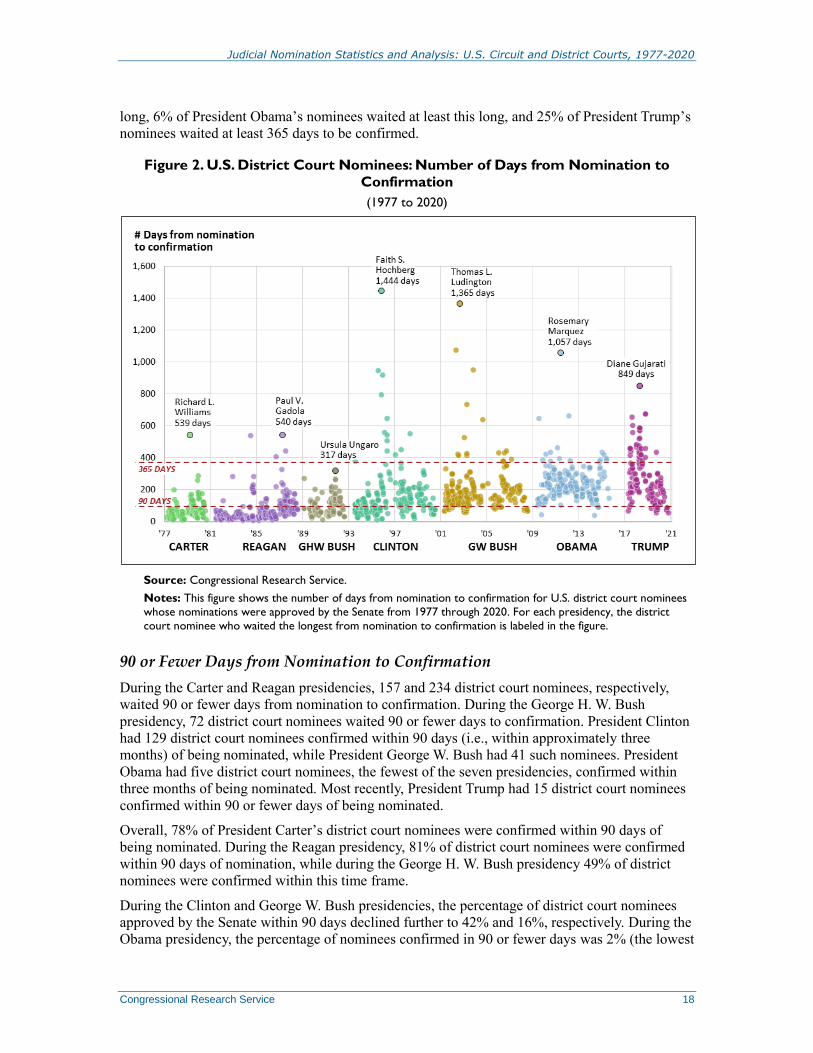
Figure 2 shows, for each U.S. district court nominee who was confirmed from 1977 through
2020, the number of days from when that individual was first nominated to when he or she was
confirmed by the Senate. The particular district court nominee who waited the longest period of
time from nomination to confirmation is also labeled for each presidency.31
365 or More Days from Nomination to Confirmation
As shown by the figure, there was a notable increase after the George H. W. Bush presidency in
the number of nominees who waited one year or more from nomination to confirmation. During
the Carter and Reagan presidencies, a combined total of five district court nominees waited 365
days or more to be confirmed.32 No district court nominees during the George H. W. Bush
presidency waited 365 or more days from nomination to confirmation.
During the Clinton presidency, there were 14 district court nominees who waited one year or
more to be confirmed. The number of district court nominees who waited at least 365 days to be
confirmed increased further, to a high of 17, during the George W. Bush presidency. During the
Obama presidency, there were 16 district court nominees who waited at least 365 days to be
confirmed (which was the second highest among the seven presidencies). Most recently, during
the Trump presidency, 44 district court nominees waited at least 365 days from nomination to
confirmation (this was the highest for the same presidencies).
Overall, 5% of President Clinton’s district court nominees waited at least 365 days from
nomination to confirmation, 7% of President George W. Bush’s nominees waited at least this
30 The average wait time from nomination to confirmation for U.S. district court nominees was 67.5 days (Reagan);
70.5 days (Carter); 103.0 days (G.H.W. Bush); 135.6 days (Clinton); 178.0 days (G.W. Bush); 224.9 days (Obama);
and 275.7 days (Trump).
31 As shown by the figure, the district court nominee who experienced the longest period of time from nomination to
confirmation (across all seven presidencies) was Faith S. Hochberg, who waited 1,444 days, or nearly four years, to be
confirmed after being nominated by President Clinton. The district court nominee who waited the second-longest
period of time from nomination to confirmation was Thomas L. Ludington, who waited 1,365 days (or approximately
3.7 years) to be confirmed after being nominated by President G.W. Bush.
32 One district court nominee during the Carter presidency waited 365 or more days from nomination to confirmation,
while four nominees during the Reagan presidency waited this long.
Judicial Nomination Statistics and Analysis: U.S. Circuit and District Courts, 1977-2020
Congressional Research Service 18
long, 6% of President Obama’s nominees waited at least this long, and 25% of President Trump’s
nominees waited at least 365 days to be confirmed.
Figure 2. U.S. District Court Nominees: Number of Days from Nomination to
Confirmation
(1977 to 2020)
Source: Congressional Research Service.
Notes: This figure shows the number of days from nomination to confirmation for U.S. district court nominees
whose nominations were approved by the Senate from 1977 through 2020. For each presidency, the district
court nominee who waited the longest from nomination to confirmation is labeled in the figure.
90 or Fewer Days from Nomination to Confirmation
During the Carter and Reagan presidencies, 157 and 234 district court nominees, respectively,
waited 90 or fewer days from nomination to confirmation. During the George H. W. Bush
presidency, 72 district court nominees waited 90 or fewer days to confirmation. President Clinton
had 129 district court nominees confirmed within 90 days (i.e., within approximately three
months) of being nominated, while President George W. Bush had 41 such nominees. President
Obama had five district court nominees, the fewest of the seven presidencies, confirmed within
three months of being nominated. Most recently, President Trump had 15 district court nominees
confirmed within 90 or fewer days of being nominated.
Overall, 78% of President Carter’s district court nominees were confirmed within 90 days of
being nominated. During the Reagan presidency, 81% of district court nominees were confirmed
within 90 days of nomination, while during the George H. W. Bush presidency 49% of district
nominees were confirmed within this time frame.
During the Clinton and George W. Bush presidencies, the percentage of district court nominees
approved by the Senate within 90 days declined further to 42% and 16%, respectively. During the
Obama presidency, the percentage of nominees confirmed in 90 or fewer days was 2% (the lowest
Judicial Nomination Statistics and Analysis: U.S. Circuit and District Courts, 1977-2020
Congressional Research Service 19
percentage of the seven presidencies), while 9% of district court nominees during the Trump
presidency were confirmed within 90 or fewer days.
By Congress
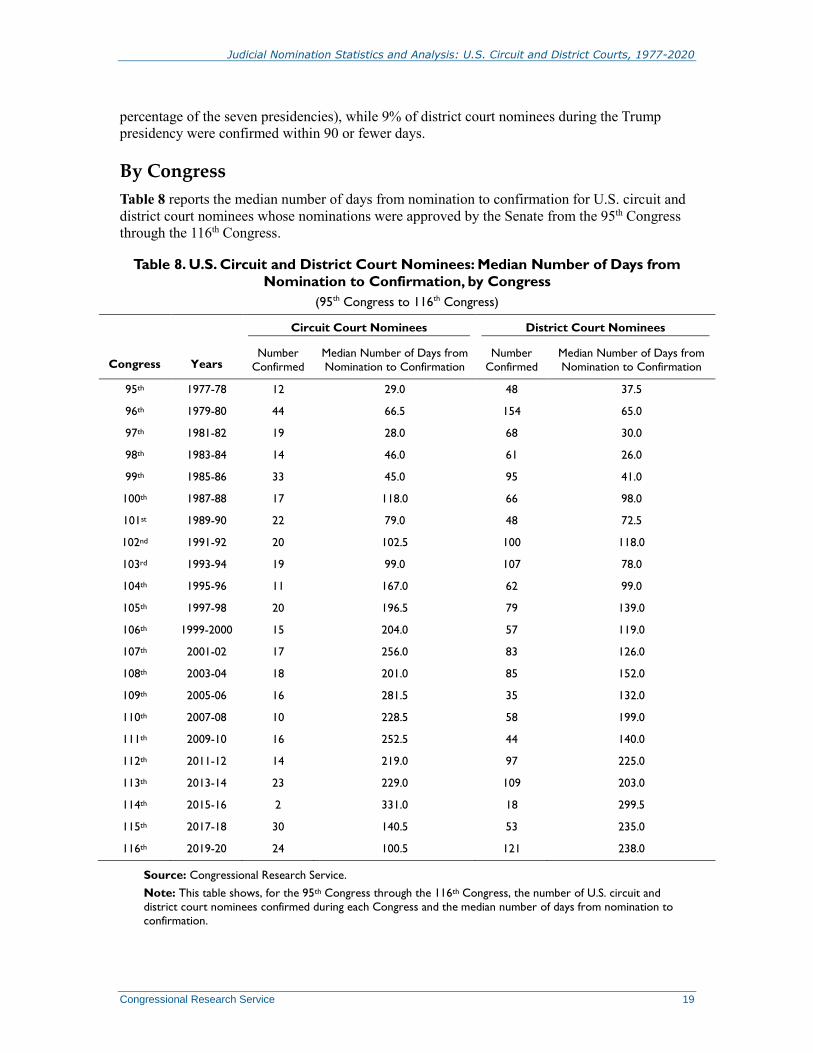
Table 8 reports the median number of days from nomination to confirmation for U.S. circuit and
district court nominees whose nominations were approved by the Senate from the 95th Congress
through the 116th Congress.
Table 8. U.S. Circuit and District Court Nominees: Median Number of Days from
Nomination to Confirmation, by Congress
(95th Congress to 116th Congress)
Congress Years
Circuit Court Nominees District Court Nominees
Number
Confirmed
Median Number of Days from
Nomination to Confirmation
Number
Confirmed
Median Number of Days from
Nomination to Confirmation
95th 1977-78 12 29.0 48 37.5
96th 1979-80 44 66.5 154 65.0
97th 1981-82 19 28.0 68 30.0
98th 1983-84 14 46.0 61 26.0
99th 1985-86 33 45.0 95 41.0
100th 1987-88 17 118.0 66 98.0
101st 1989-90 22 79.0 48 72.5
102nd 1991-92 20 102.5 100 118.0
103rd 1993-94 19 99.0 107 78.0
104th 1995-96 11 167.0 62 99.0
105th 1997-98 20 196.5 79 139.0
106th 1999-2000 15 204.0 57 119.0
107th 2001-02 17 256.0 83 126.0
108th 2003-04 18 201.0 85 152.0
109th 2005-06 16 281.5 35 132.0
110th 2007-08 10 228.5 58 199.0
111th 2009-10 16 252.5 44 140.0
112th 2011-12 14 219.0 97 225.0
113th 2013-14 23 229.0 109 203.0
114th 2015-16 2 331.0 18 299.5
115th 2017-18 30 140.5 53 235.0
116th 2019-20 24 100.5 121 238.0
Source: Congressional Research Service.
Note: This table shows, for the 95th Congress through the 116th Congress, the number of U.S. circuit and
district court nominees confirmed during each Congress and the median number of days from nomination to
confirmation.
Judicial Nomination Statistics and Analysis: U.S. Circuit and District Courts, 1977-2020
Congressional Research Service 20
U.S. Circuit Court Nominees
For circuit court nominees, the median number of days from nomination to confirmation ranged
from a low of 28.0 days during the 97th Congress (1981-1982) to a high of 331.0 days during the
114th Congress (2015-2016). The second-shortest median number of days from nomination to
confirmation was 29.0 days during the 95th Congress (1977-1978), while the second-highest
median number of days was 281.5 days during the 109th Congress (2005-2006).
The median number of days from nomination to confirmation for U.S. circuit court nominees
stayed above 200 days from the 106th through the 114th Congress. In contrast, for the 115th
Congress, the median number of days from nomination to confirmation (140.5 days, or 4.6
months) fell below 200 days for the first time since the 105th Congress (1997-1998). Additionally,
the median number of days from nomination to confirmation for the 24 circuit court nominees
approved by the Senate during the 116th Congress (i.e., 100.5 days) represented the fewest
number of days from nomination to confirmation for circuit court nominees since the 103rd
Congress (1993-1994).
If the average, rather than the median, is used to measure the length of time circuit court
nominees waited from nomination to confirmation, the average number of days from nomination
to confirmation ranged from a low of 32.6 days during the 95th Congress to a high of 562.9 days
during the 109th Congress. Additionally, the average time from nomination to confirmation for
U.S. circuit court nominees increases by more than 30 days, relative to the median, for the 106th
Congress (to 373.9 days); 105th Congress (303.1 days); 108th Congress (287.2 days); 113th
Congress (281.2 days); and 110th Congress (268.8 days).33
U.S. District Court Nominees
For U.S. district court nominees, the median number of days from nomination to confirmation
ranged from a low of 26 days during the 98th Congress (1983-1984) to a high of 299.5 days
during the 114th Congress (2015-2016). The second-shortest median was 30 days during the 97th
Congress (1981-1982), while the second-longest median was 238 days during the 116th Congress
(2019-2020).34
The median number of days from nomination to confirmation during the 116th Congress was the
fifth consecutive Congress for which the median wait time from nomination to confirmation for
district court nominees was greater than 200 days. The first Congress during which the median
wait time for district court nominees exceeded 200 days was the 112th Congress (2011-2012).
By Presidency and Congress
Figure 3 displays, by presidency and Congress, the median number of days from nomination to
confirmation for U.S. circuit and district court nominees who were confirmed during the 1977 to
2020 period.
33 As discussed above, the average number of days from nomination to confirmation is more greatly affected, relative to
the median number of days from nomination to confirmation, by nominees during a presidency or Congress who
experienced atypically long wait times from nomination to confirmation. The effect of these relatively long wait times
is to increase the overall average time from nomination to confirmation that is reported for all of a President’s
nominees.
34 The average number of days from nomination to confirmation for U.S. district court nominees during this period
ranged from a low of 32.8 days during the 97th Congress to a high of 302.1 days during the 114th Congress. The
second-lowest average wait time for district court nominees occurred during the 98th Congress (37.1 days), and the
second-longest average wait time occurred during the 116th Congress (284.5 days).
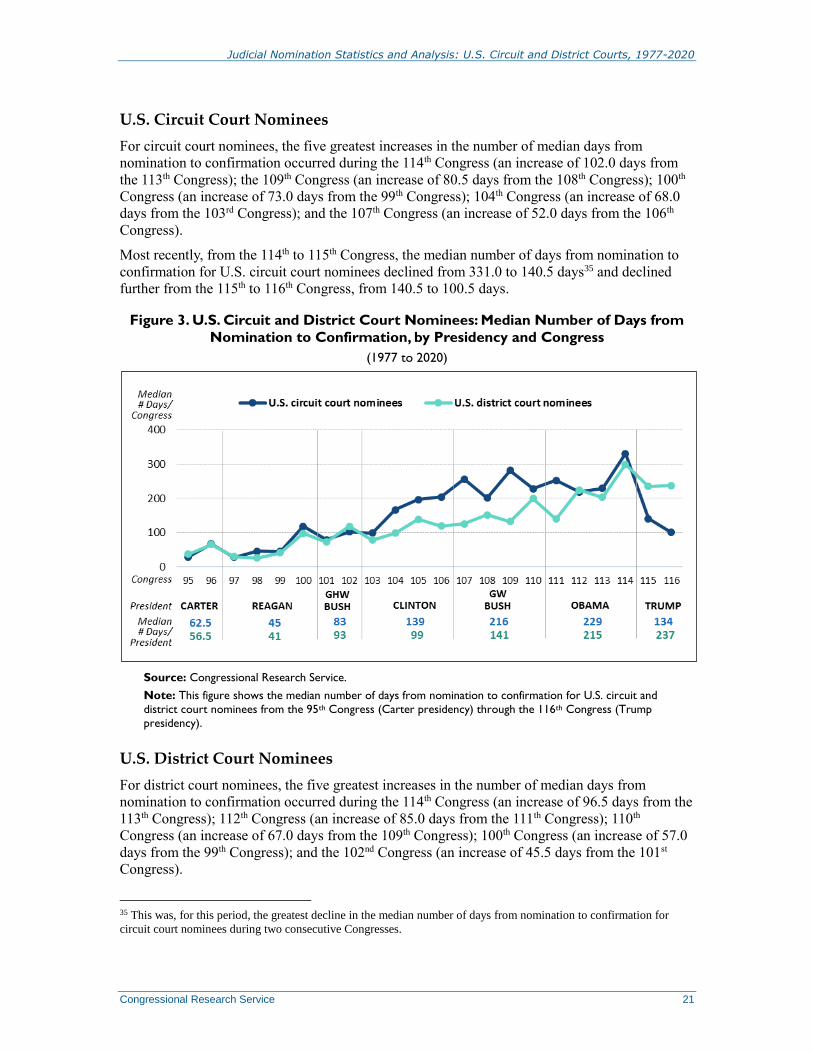
Judicial Nomination Statistics and Analysis: U.S. Circuit and District Courts, 1977-2020
Congressional Research Service 21
U.S. Circuit Court Nominees
For circuit court nominees, the five greatest increases in the number of median days from
nomination to confirmation occurred during the 114th Congress (an increase of 102.0 days from
the 113th Congress); the 109th Congress (an increase of 80.5 days from the 108th Congress); 100th
Congress (an increase of 73.0 days from the 99th Congress); 104th Congress (an increase of 68.0
days from the 103rd Congress); and the 107th Congress (an increase of 52.0 days from the 106th
Congress).
Most recently, from the 114th to 115th Congress, the median number of days from nomination to
confirmation for U.S. circuit court nominees declined from 331.0 to 140.5 days35 and declined
further from the 115th to 116th Congress, from 140.5 to 100.5 days.
Figure 3. U.S. Circuit and District Court Nominees: Median Number of Days from
Nomination to Confirmation, by Presidency and Congress
(1977 to 2020)
Source: Congressional Research Service.
Note: This figure shows the median number of days from nomination to confirmation for U.S. circuit and
district court nominees from the 95th Congress (Carter presidency) through the 116th Congress (Trump
presidency).
U.S. District Court Nominees
For district court nominees, the five greatest increases in the number of median days from
nomination to confirmation occurred during the 114th Congress (an increase of 96.5 days from the
113th Congress); 112th Congress (an increase of 85.0 days from the 111th Congress); 110th
Congress (an increase of 67.0 days from the 109th Congress); 100th Congress (an increase of 57.0
days from the 99th Congress); and the 102nd Congress (an increase of 45.5 days from the 101st
Congress).
35 This was, for this period, the greatest decline in the median number of days from nomination to confirmation for
circuit court nominees during two consecutive Congresses.
Judicial Nomination Statistics and Analysis: U.S. Circuit and District Courts, 1977-2020
Congressional Research Service 22
Most recently, from the 114th to 115th Congress, the median number of days from nomination to
confirmation for U.S. district court nominees declined from 299.5 to 235.0 days36 and increased
slightly, from 235.0 to 238.0 days, during the 116th Congress.
Time from Nomination to Committee Hearing The President customarily transmits a circuit or district court nomination to the Senate in the form
of a written nomination message. Once received, the nomination is numbered by the Senate
executive clerk, read on the floor, and then immediately referred to the Judiciary Committee.37
The Judiciary Committee’s processing of the nomination typically consists of three phases—a
prehearing phase, the holding of a hearing on the nomination, and voting on whether to report the
nomination to the Senate.38 During a hearing on the nomination, lower court nominees engage in
a question-and-answer session with members of the Senate Judiciary Committee. The hearing
typically is held for more than one judicial nominee at a time.
As shown in Table 9, the median length of time from nomination to committee hearing for circuit
and district court nominees has varied across presidencies.39 For individuals nominated during
more recent presidencies (with the exception of the Trump presidency), the length of time from
nomination to committee hearing has been relatively longer than the median for all nominees
from 1977 through 2020.
U.S. Circuit Court Nominees
Overall, from 1977 through 2020, the median length of time from when an individual was first
nominated to a circuit court judgeship to when he or she received a hearing by the Judiciary
Committee was 58.0 days (or 1.9 months).40
By presidency, the median number of days from nomination to committee hearing for U.S. circuit
court nominees ranged from a low of 23.0 days (during the Reagan presidency) to a high of 145.0
36 This was, for this period, the greatest decline in the median number of days from nomination to confirmation for
district court nominees during two consecutive Congresses.
37 The nomination is referred to the Judiciary Committee in conformance with two Senate rules—specifically Rule
XXXI, which provides that nominations shall be referred to appropriate committees “unless otherwise ordered,” and
Rule XXV, paragraph 2(m), which outlines the jurisdiction of the Judiciary Committee. See CRS Report RL31980,
Senate Consideration of Presidential Nominations: Committee and Floor Procedure, by Elizabeth Rybicki (under
heading “Receipt and Referral”).
Senate rules also permit the Senate to discharge the Judiciary Committee from a nomination by unanimous consent or
by motion or resolution (although CRS has found no instances, at least going back to the early 1940s, of the Judiciary
Committee being discharged of a circuit or district court nomination). For further discussion of this issue, see CRS
Report R43762, The Appointment Process for U.S. Circuit and District Court Nominations: An Overview, by Barry J.
McMillion.
38 For additional discussion of these three phases, see CRS Report R43762, The Appointment Process for U.S. Circuit
and District Court Nominations: An Overview, by Barry J. McMillion.
39 The median length of time has also varied by Congress. These data are not reported for this particular section of the
report but are available to congressional staff upon request from the author.
40 Overall, from 1977 through 2020, the average length of time from nomination to committee hearing for U.S. circuit
court nominees was 100.5 days. For the relatively rare instance when a circuit court nominee had more than one
hearing (during the same presidency), the nominee’s first hearing date is used to calculate the length of time from his or
her nomination date to his or her committee hearing—and it is this calculation that is used to determine the average and
median for all nominees.

Judicial Nomination Statistics and Analysis: U.S. Circuit and District Courts, 1977-2020
Congressional Research Service 23
days (during the George W. Bush presidency).41 For the most recent presidency included in the
analysis (i.e., the Trump presidency), the median number of days from nomination to committee
hearing for U.S. circuit court nominees was 55 days.
Table 9. U.S. Circuit and District Court Nominees: Median Number of Days from
Nomination to Committee Hearing
(1977-2020)
President
Circuit Court Nominees District Court Nominees
Median Number of Days
from Nomination to Hearing
Median Number of Days from
Nomination to Hearing
Carter 39.0 38.0
Reagan 23.0 22.0
G.H.W. Bush 65.5 65.0
Clinton 91.0 68.0
G.W. Bush 145.0 86.0
Obama 76.0 78.0
Trump 55.0 65.0
Source: Congressional Research Service.
Note: This table shows, by presidency, the median number of days from nomination to hearing for U.S. circuit
and district court nominees from 1977 through 2020.
U.S. District Court Nominees
During this same period, the median length of time from when an individual was nominated to a
district court judgeship to when he or she received a hearing was 62.0 days (or approximately 2
months).42
The median number of days from nomination to committee hearing for U.S. district court
nominees ranged from a low of 22.0 days (during the Reagan presidency) to a high of 86.0 days
(during the George W. Bush presidency).43
41 The data provided in Table 9 include all nominees who received a hearing by the Judiciary Committee (including
nominees whose nominations were not eventually approved by the Senate). For the seven presidencies, the average
number of days from nomination to committee hearing for U.S. circuit court nominees ranged from a low of 42.3 days
during the Carter presidency to a high of 246.8 days during the G.W. Bush presidency. The second-shortest average
wait time from nomination to hearing for circuit court nominees was during the Reagan presidency (43.1 days), while
the second-longest was during the Clinton presidency (120.2 days). During the most recent presidency (i.e., the Trump
presidency), the average number of days from nomination to committee hearing for U.S. circuit court nominees was
66.6 days.
42 Overall, from 1977 through 2020, the average length of time from nomination to committee hearing for U.S. district
court nominees was 80.7 days. For the relatively rare instance when a district court nominee had more than one hearing
(during the same presidency), the nominee’s first hearing date is used to calculate the length of time from his or her
nomination date to his or her committee hearing—and it is this calculation that is used to determine the average and
median for all nominees.
43 For the seven presidencies, the average number of days from nomination to committee hearing for U.S. district court
nominees ranged from a low of 43.2 days during the Reagan presidency to a high of 119.8 days during the G.W. Bush
presidency. The second-shortest average wait time from nomination to hearing for district court nominees was during
the Carter presidency (50.7 days), while the second-longest was during the Clinton presidency (96.6 days). During the

Judicial Nomination Statistics and Analysis: U.S. Circuit and District Courts, 1977-2020
Congressional Research Service 24
Time from Committee Report to Confirmation After a nominee receives a hearing by the Judiciary Committee, she awaits a vote by the
committee on whether her nomination will be reported to the Senate as a whole.44 If the
nomination is not put to the committee for a vote, or if the committee votes against reporting it
(i.e., rejects the nomination),45 the nomination will not move forward, ultimately failing to receive
Senate confirmation.
The committee, in reporting a nomination to the Senate as a whole, has three options—to report a
nomination favorably, unfavorably, or without recommendation. Almost always, when the
committee votes on a nomination, it votes to report favorably. The committee, however, may vote
(as it has done in the past, but only on rare occasions) to report unfavorably or without
recommendation.46 Such a vote advances the nomination for Senate consideration despite the lack
of majority support for it in committee. After it is reported by the Judiciary Committee, a circuit
or district court nomination is listed on the Executive Calendar and is eligible for floor
consideration.47
The nominees who are included in this part of the analysis all had their nominations reported by
the Judiciary Committee (i.e., their nominations advanced to the full Senate for consideration)
and were confirmed by the Senate.48
most recent presidency (i.e., the Trump presidency), the average length from nomination to committee hearing for
district court nominees was 73.7 days.
44 Under Senate rules, a judicial nomination pending in the Judiciary Committee could also reach the Senate floor
without being reported out of committee—if the Senate agreed to discharge the committee from consideration of the
nomination. A CRS report explains that, under Senate Rule XVII, a Senator is allowed “to submit a motion or
resolution to discharge a committee from consideration of a nomination. Such a motion or resolution would itself be
subject to debate and potentially to a cloture process. The Senate does not, in current practice, employ a discharge
procedure in relation to nominations, except in agreeing to unanimous consent to discharge a committee from
consideration of a noncontroversial nomination.” CRS Report R43331, Majority Cloture for Nominations: Implications
and the “Nuclear” Proceedings of November 21, 2013, by Valerie Heitshusen (footnote to text under heading “Other
Potential Effects on Presidential Nominations”).
According to another CRS report, it is “fairly common for committees to be discharged from noncontroversial
nominations by unanimous consent, with the support of the committee, as a means of simplifying the process.” CRS
Report RL31980, Senate Consideration of Presidential Nominations: Committee and Floor Procedure, by Elizabeth
Rybicki (under heading “Reporting”).
Nonetheless, in a database search of judicial nominations dating back to the mid-1940s, CRS research has identified no
instances in which the Senate has discharged the Judiciary Committee of a judicial nomination.
45 Usually, a judicial nominee rejected by the Judiciary Committee is not nominated again by the President. However,
in some instances, a President has waited until a subsequent Congress to renominate, in the hope of a more favorable
outcome in committee for the previously rejected nominee.
46 The most recent example of the Judiciary Committee voting to report a judicial nomination other than favorably
occurred on May 1, 2003. The committee that day approved, by a 10-9 roll call vote, a motion to report without
recommendation the nomination of J. Leon Holmes to the U.S. District Court for the Eastern District of Arkansas.
Subsequently, on July 6, 2004, the Senate confirmed the nomination by a 51-46 vote. For discussion of this and earlier
instances of lower court nominations reported by the Judiciary Committee other than favorably, see CRS Report
R40470, U.S. Circuit and District Court Nominations: Senate Rejections and Committee Votes Other Than to Report
Favorably, 1939-2013, by Barry J. McMillion.
47 For an in-depth discussion of the floor procedure related to judicial nominations, see CRS Report RL31980, Senate
Consideration of Presidential Nominations: Committee and Floor Procedure, by Elizabeth Rybicki; and CRS Report
R43762, The Appointment Process for U.S. Circuit and District Court Nominations: An Overview, by Barry J.
McMillion.
48 Note, though, that not all nominees who are reported by the Senate Judiciary Committee are ultimately confirmed by

Judicial Nomination Statistics and Analysis: U.S. Circuit and District Courts, 1977-2020
Congressional Research Service 25
U.S. Circuit Court Nominees
Overall, from 1977 through 2020, the median length of time from when a U.S. circuit court
nominee had his nomination reported by the Judiciary Committee to when he was confirmed by
the Senate was 12.0 days.49
There was variation across presidencies in how long circuit court nominees waited to be
confirmed once their nominations were reported by the Judiciary Committee—with nominees
during more recent presidencies waiting longer to be confirmed once their nominations were
reported by the committee.50 Specifically, for presidencies during this period, the median number
of days from committee report to confirmation for U.S. circuit court nominees ranged from a low
of a single day (during the George H. W. Bush presidency) to a high of 98.0 days (during the
Obama presidency).51 For the most recent presidency included in the analysis (i.e., the Trump
presidency), the median number of days from committee report to confirmation for U.S. circuit
court nominees was 25.0 days.
Table 10. U.S. Circuit and District Court Nominees: Median Number of Days from
Committee Report to Confirmation
(1977-2020)
President
Circuit Court Nominees District Court Nominees
Median Number of Days from
Committee Report to
Confirmation
Median Number of Days from
Committee Report to
Confirmation
Carter 2.0 2.0
Reagan 4.0 4.0
G.H.W. Bush 1.0 1.0
Clinton 13.0 8.0
G.W. Bush 14.0 19.0
Obama 98.0 84.0
Trump 25.0 110.0
Source: Congressional Research Service.
Note: This table shows, by presidency, the median number of days from committee report to confirmation for
U.S. circuit and district court nominees from 1977 through 2020.
the Senate.
49 Overall, from 1977 through 2020, the average length of time from committee report to confirmation for U.S. circuit
court nominees was 32.3 days.
50 The median length of time has also varied by Congress. These data are not reported for this particular section of the
report but are available to congressional staff upon request from the author.
51 The data provided in Table 10 include all nominees whose nominations were reported by the Judiciary Committee
and confirmed by the Senate. For the seven presidencies, the average number of days from committee report to
confirmation for U.S. circuit court nominees ranged from a low of 4.9 days during the Carter presidency to a high of
104.4 days during the Obama presidency. The second-shortest average wait time from committee report to
confirmation for circuit court nominees was during the G.H.W. Bush presidency (7.8 days), while the second-longest
was during the Clinton presidency (39.0 days). During the most recent presidency (i.e., the Trump presidency), the
average number of days from committee report to confirmation for U.S. circuit court nominees was 29.5 days.
Judicial Nomination Statistics and Analysis: U.S. Circuit and District Courts, 1977-2020
Congressional Research Service 26
U.S. District Court Nominees
Overall, from 1977 through 2020, the median length of time from when a U.S. district court
nominee had his nomination reported by the Judiciary Committee to when he was confirmed by
the Senate was 12.0 days.52
As was the case with circuit court nominees, there was variation across presidencies in how long
district court nominees waited to be confirmed once their nominations were reported by the
Judiciary Committee.53 Specifically, for presidencies during this period, the median number of
days from committee report to confirmation for U.S. district court nominees ranged from a low of
a single day (during the George H. W. Bush presidency) to a high of 110.0 days (during the
Trump presidency).54
Ratings by the American Bar Association for
Confirmed Nominees Since 1953, every presidential Administration, except those of George W. Bush, Donald Trump,
and Joe Biden, has sought prenomination evaluations of its candidates for district and circuit
court judgeships by the American Bar Association (ABA).55
The committee that performs this evaluation, the ABA’s Standing Committee on the Federal
Judiciary, is made up of 15 lawyers with various professional experiences. The stated objective of
the committee is to assist the White House in assessing whether prospective judicial nominees
should be nominated.56 It seeks to do so by providing what it describes as an “impartial peer-
52 Overall, from 1977 through 2020, the average length of time from committee report to confirmation for U.S. circuit
court nominees was 37.8 days.
53 The median length of time has also varied by Congress. These data are not reported for this particular section of the
report but are available to congressional staff upon request from the author.
54 The data provided in Table 10 include all nominees whose nominations were reported by the Judiciary Committee
and confirmed by the Senate. For the seven presidencies, the average number of days from committee report to
confirmation for U.S. district court nominees ranged from a low of 4.4 days during the Carter presidency to a high of
112.0 days during the Trump presidency. The second-shortest average wait time from committee report to confirmation
for district court nominees was during the G.H.W. Bush presidency (4.6 days), while the second longest was during the
Obama presidency (89.8 days).
55 In 2009, the Obama Administration reinstituted the White House practice, discontinued by the previous
Administration of George W. Bush, of informing the ABA committee of judicial candidates under consideration and
seeking the committee’s evaluation of these candidates before making nomination decisions. Bringing the ABA
committee investigation back into the prenomination stage, one scholar noted, injected into that stage an “additional 30
to 45 days typically consumed” by an ABA committee investigation of a nominee. Russell Wheeler, “Judicial
Nominations in the First 14 Months of the Obama and Bush Administrations,” Governance Studies at Brookings, April
7, 2010, at https://www.brookings.edu/wp-content/uploads/2016/06/0407_judicial_nominations_wheeler.pdf.
Following the end of the Obama presidency, the Trump Administration adopted the policy of the G.W. Bush
Administration of not including the ABA committee investigation in the prenomination stage for judicial nominees. It
was announced at the beginning of the Biden presidency that his Administration would also not include the ABA
investigation in the prenomination stage. See Debra Cassens Weiss, “Like Trump, Biden asks ABA to start judicial
ratings process after nominations are made,” ABA Journal, February 3, 2021, at https://www.abajournal.com/news/
article/like-trump-biden-asks-aba-to-start-judicial-ratings-process-after-nominations-are-made.
56 The ABA committee’s explanation of its role and the standards and procedures it uses in rating candidates for lower
federal court judgeships is presented in the booklet American Bar Association Standing Committee on the Federal
Judiciary; What It Is and How It Works, at http://www.americanbar.org/content/dam/aba/uncategorized/GAO/
Backgrounder.authcheckdam.pdf (hereinafter cited as ABA Standing Committee; What It Is).
Judicial Nomination Statistics and Analysis: U.S. Circuit and District Courts, 1977-2020
Congressional Research Service 27
review evaluation” of each candidate’s professional qualifications. This evaluation, according to
the committee, focuses strictly on a candidate’s “integrity, professional competence and judicial
temperament” and does not take into account the candidate’s “philosophy, political affiliation or
ideology.”57 In evaluating professional competence, the committee assesses the prospective
nominee’s “intellectual capacity, judgment, writing and analytical abilities, knowledge of the law,
and breadth of professional experience.”58
Following the multistep evaluation process by the committee,59 a nominee is given an official
rating of “well qualified,” “qualified,” or “not qualified.”60 A rating is provided strictly on an
advisory basis; it is solely in the President’s discretion as to how much weight to place on a
judicial candidate’s ABA rating in deciding whether to nominate him or her.61
U.S. Circuit Court Nominees
As shown by Table 11, for each of the seven presidencies, a majority of a President’s circuit court
nominees received a well qualified rating from the ABA. There is, however, some variation
across presidencies in the percentage of confirmed U.S. circuit court nominees who received a
particular rating by the ABA. For example, the percentage who received a well qualified rating
ranged from a low of 56.6% during the Reagan presidency to a high of 80.0% during the Obama
presidency.
Six of the seven presidencies listed in the table had no U.S. circuit court nominees rated as not
qualified by the ABA. Most recently, the Trump presidency had three circuit court nominees rated
as not qualified.62
57 ABA Standing Committee; What It Is, p. 1.
58 ABA Standing Committee; What It Is, p. 1.
59 For an in-depth discussion of this process, see CRS Report R43762, The Appointment Process for U.S. Circuit and
District Court Nominations: An Overview, by Barry J. McMillion.
60 When the committee vote is not unanimous, it is noted which rating received a majority of the committee’s votes and
which rating received a minority, as well as whether the majority and minority votes were or were not “substantial.”
ABA Standing Committee; What It Is, p. 7. The majority vote is considered by the ABA to be the official rating of the
nomination. The official rating is the rating that is used to calculate the data reported in Table 11. The data reported in
the table do not indicate whether or not that rating was unanimous.
61 If a President waits to submit a nomination until after he receives notice from the ABA about a potential nominee
being rated as not qualified, he might decide not to nominate that individual. Because ABA ratings at this stage of the
process are confidential, there is no public information as to how often this might occur during an administration that
waits for the ABA to finish its evaluation of a potential nominee prior to submitting a nomination to the Senate.
62 These nominees were Leonard S. Grasz (confirmed to the Eighth Circuit); Jonathan A. Kobes (also confirmed to the
Eighth Circuit); and Lawrence VanDyke (confirmed to the Ninth Circuit). For additional information on these
particular nominees, see Don Walton, “American Bar Association defends its negative rating of Nebraska judge
nominee,” Lincoln Journal Star, November 15, 2017, at https://journalstar.com/news/state-and-regional/federal-
politics/american-bar-association-defends-its-negative-rating-of-nebraska-judge/article_cc58f4b1-24be-501f-a671-
a93683184ae0.html; Patrick L. Gregory, “ABA Rates Another Trump 8th Circuit Nominee ‘Not Qualified,’”
Bloomberg BNA, September 17, 2018, at https://www.bna.com/aba-rates-trump-n73014482574; and Madison Alder
and Ellen M. Gilmer, “‘Not Qualified’ Nominee for Ninth Circuit Likely To Be Confirmed,” Bloomberg Law,
December 11, 2019, at https://news.bloomberglaw.com/us-law-week/not-qualified-nominee-for-ninth-circuit-likely-to-
be-confirmed.
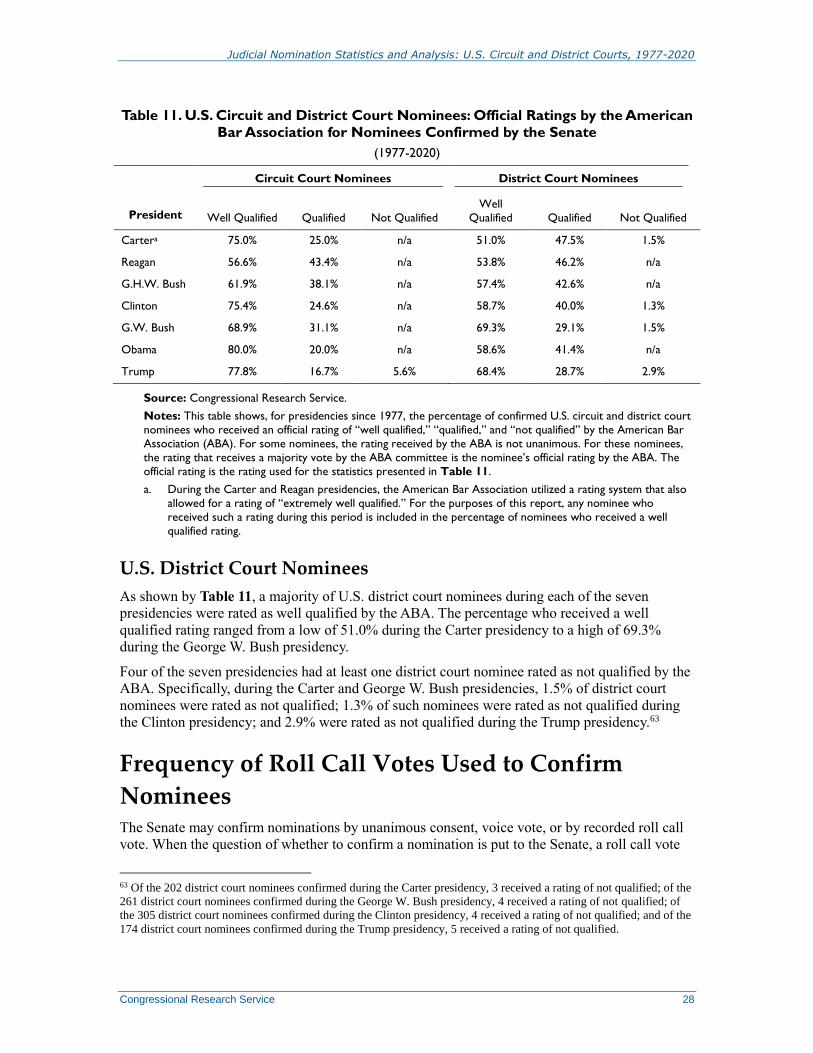
Judicial Nomination Statistics and Analysis: U.S. Circuit and District Courts, 1977-2020
Congressional Research Service 28
Table 11. U.S. Circuit and District Court Nominees: Official Ratings by the American
Bar Association for Nominees Confirmed by the Senate
(1977-2020)
President
Circuit Court Nominees District Court Nominees
Well Qualified Qualified Not Qualified
Well
Qualified Qualified Not Qualified
Cartera 75.0% 25.0% n/a 51.0% 47.5% 1.5%
Reagan 56.6% 43.4% n/a 53.8% 46.2% n/a
G.H.W. Bush 61.9% 38.1% n/a 57.4% 42.6% n/a
Clinton 75.4% 24.6% n/a 58.7% 40.0% 1.3%
G.W. Bush 68.9% 31.1% n/a 69.3% 29.1% 1.5%
Obama 80.0% 20.0% n/a 58.6% 41.4% n/a
Trump 77.8% 16.7% 5.6% 68.4% 28.7% 2.9%
Source: Congressional Research Service.
Notes: This table shows, for presidencies since 1977, the percentage of confirmed U.S. circuit and district court
nominees who received an official rating of “well qualified,” “qualified,” and “not qualified” by the American Bar
Association (ABA). For some nominees, the rating received by the ABA is not unanimous. For these nominees,
the rating that receives a majority vote by the ABA committee is the nominee’s official rating by the ABA. The
official rating is the rating used for the statistics presented in Table 11.
a. During the Carter and Reagan presidencies, the American Bar Association utilized a rating system that also
allowed for a rating of “extremely well qualified.” For the purposes of this report, any nominee who
received such a rating during this period is included in the percentage of nominees who received a well
qualified rating.
U.S. District Court Nominees
As shown by Table 11, a majority of U.S. district court nominees during each of the seven
presidencies were rated as well qualified by the ABA. The percentage who received a well
qualified rating ranged from a low of 51.0% during the Carter presidency to a high of 69.3%
during the George W. Bush presidency.
Four of the seven presidencies had at least one district court nominee rated as not qualified by the
ABA. Specifically, during the Carter and George W. Bush presidencies, 1.5% of district court
nominees were rated as not qualified; 1.3% of such nominees were rated as not qualified during
the Clinton presidency; and 2.9% were rated as not qualified during the Trump presidency.63
Frequency of Roll Call Votes Used to Confirm
Nominees The Senate may confirm nominations by unanimous consent, voice vote, or by recorded roll call
vote. When the question of whether to confirm a nomination is put to the Senate, a roll call vote
63 Of the 202 district court nominees confirmed during the Carter presidency, 3 received a rating of not qualified; of the
261 district court nominees confirmed during the George W. Bush presidency, 4 received a rating of not qualified; of
the 305 district court nominees confirmed during the Clinton presidency, 4 received a rating of not qualified; and of the
174 district court nominees confirmed during the Trump presidency, 5 received a rating of not qualified.
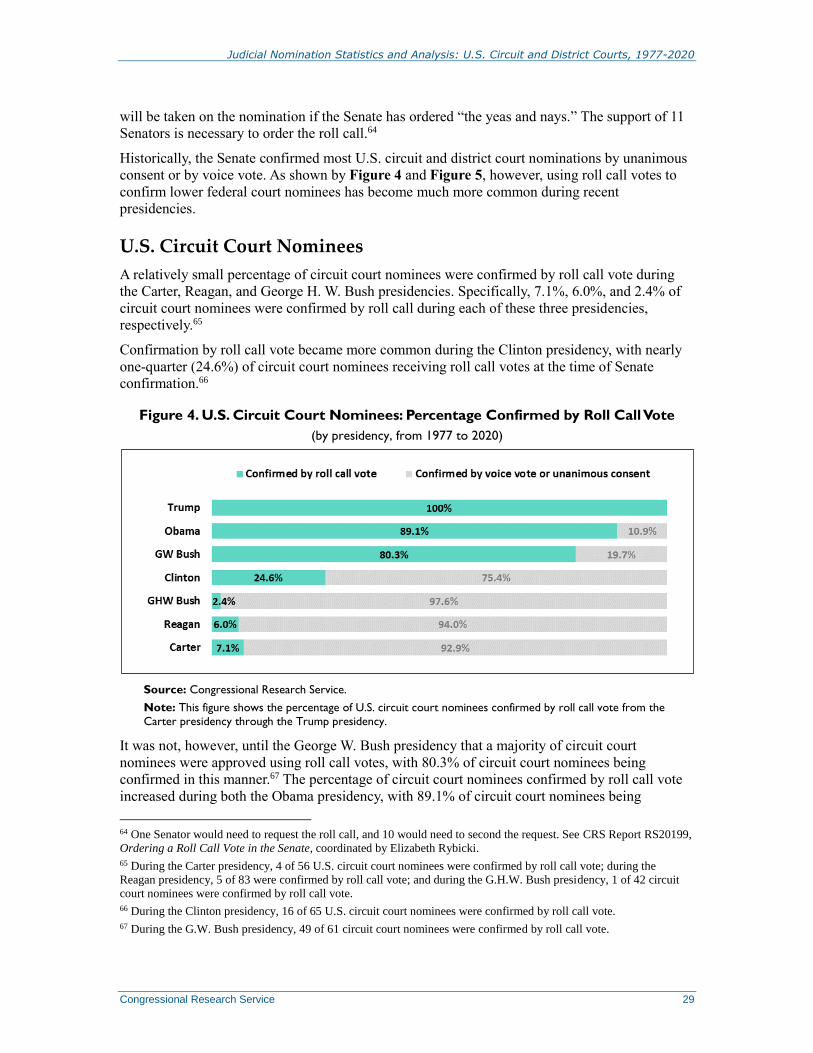
Judicial Nomination Statistics and Analysis: U.S. Circuit and District Courts, 1977-2020
Congressional Research Service 29
will be taken on the nomination if the Senate has ordered “the yeas and nays.” The support of 11
Senators is necessary to order the roll call.64
Historically, the Senate confirmed most U.S. circuit and district court nominations by unanimous
consent or by voice vote. As shown by Figure 4 and Figure 5, however, using roll call votes to
confirm lower federal court nominees has become much more common during recent
presidencies.
U.S. Circuit Court Nominees
A relatively small percentage of circuit court nominees were confirmed by roll call vote during
the Carter, Reagan, and George H. W. Bush presidencies. Specifically, 7.1%, 6.0%, and 2.4% of
circuit court nominees were confirmed by roll call during each of these three presidencies,
respectively.65
Confirmation by roll call vote became more common during the Clinton presidency, with nearly
one-quarter (24.6%) of circuit court nominees receiving roll call votes at the time of Senate
confirmation.66
Figure 4. U.S. Circuit Court Nominees: Percentage Confirmed by Roll Call Vote
(by presidency, from 1977 to 2020)
Source: Congressional Research Service.
Note: This figure shows the percentage of U.S. circuit court nominees confirmed by roll call vote from the
Carter presidency through the Trump presidency.
It was not, however, until the George W. Bush presidency that a majority of circuit court
nominees were approved using roll call votes, with 80.3% of circuit court nominees being
confirmed in this manner.67 The percentage of circuit court nominees confirmed by roll call vote
increased during both the Obama presidency, with 89.1% of circuit court nominees being
64 One Senator would need to request the roll call, and 10 would need to second the request. See CRS Report RS20199,
Ordering a Roll Call Vote in the Senate, coordinated by Elizabeth Rybicki.
65 During the Carter presidency, 4 of 56 U.S. circuit court nominees were confirmed by roll call vote; during the
Reagan presidency, 5 of 83 were confirmed by roll call vote; and during the G.H.W. Bush presidency, 1 of 42 circuit
court nominees were confirmed by roll call vote.
66 During the Clinton presidency, 16 of 65 U.S. circuit court nominees were confirmed by roll call vote.
67 During the G.W. Bush presidency, 49 of 61 circuit court nominees were confirmed by roll call vote.
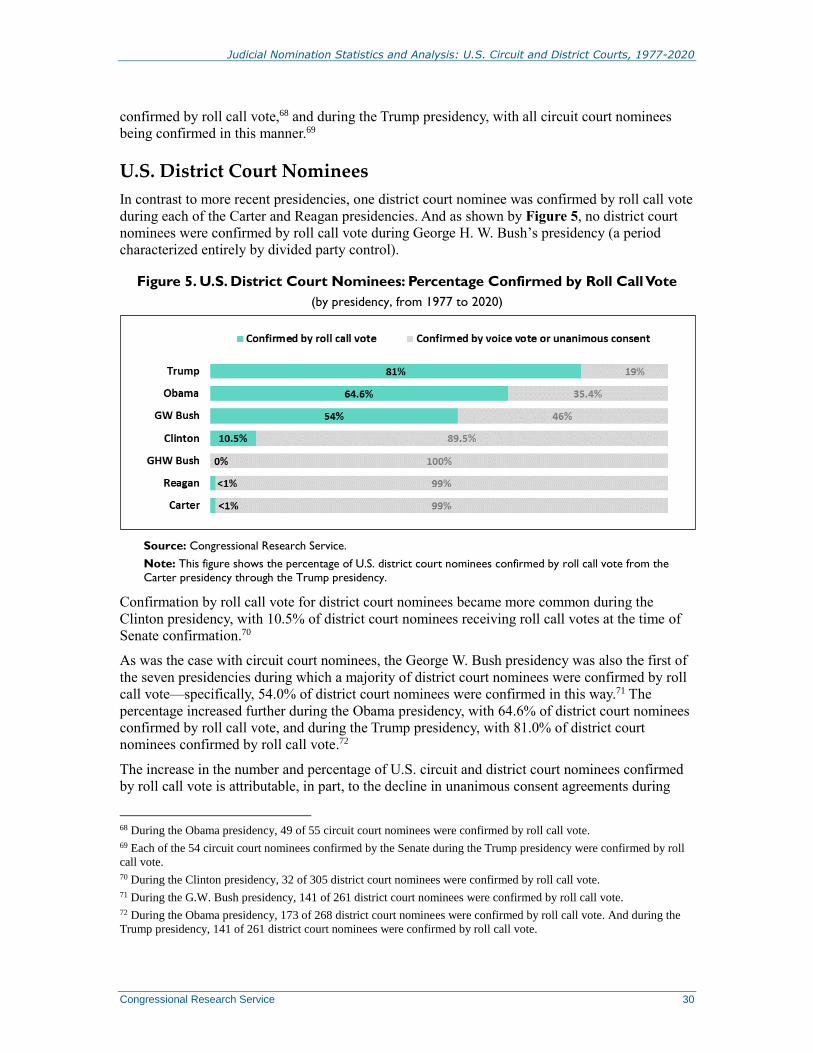
Judicial Nomination Statistics and Analysis: U.S. Circuit and District Courts, 1977-2020
Congressional Research Service 30
confirmed by roll call vote,68 and during the Trump presidency, with all circuit court nominees
being confirmed in this manner.69
U.S. District Court Nominees
In contrast to more recent presidencies, one district court nominee was confirmed by roll call vote
during each of the Carter and Reagan presidencies. And as shown by Figure 5, no district court
nominees were confirmed by roll call vote during George H. W. Bush’s presidency (a period
characterized entirely by divided party control).
Figure 5. U.S. District Court Nominees: Percentage Confirmed by Roll Call Vote
(by presidency, from 1977 to 2020)
Source: Congressional Research Service.
Note: This figure shows the percentage of U.S. district court nominees confirmed by roll call vote from the
Carter presidency through the Trump presidency.
Confirmation by roll call vote for district court nominees became more common during the
Clinton presidency, with 10.5% of district court nominees receiving roll call votes at the time of
Senate confirmation.70
As was the case with circuit court nominees, the George W. Bush presidency was also the first of
the seven presidencies during which a majority of district court nominees were confirmed by roll
call vote—specifically, 54.0% of district court nominees were confirmed in this way.71 The
percentage increased further during the Obama presidency, with 64.6% of district court nominees
confirmed by roll call vote, and during the Trump presidency, with 81.0% of district court
nominees confirmed by roll call vote.72
The increase in the number and percentage of U.S. circuit and district court nominees confirmed
by roll call vote is attributable, in part, to the decline in unanimous consent agreements during
68 During the Obama presidency, 49 of 55 circuit court nominees were confirmed by roll call vote.
69 Each of the 54 circuit court nominees confirmed by the Senate during the Trump presidency were confirmed by roll
call vote.
70 During the Clinton presidency, 32 of 305 district court nominees were confirmed by roll call vote.
71 During the G.W. Bush presidency, 141 of 261 district court nominees were confirmed by roll call vote.
72 During the Obama presidency, 173 of 268 district court nominees were confirmed by roll call vote. And during the
Trump presidency, 141 of 261 district court nominees were confirmed by roll call vote.
Judicial Nomination Statistics and Analysis: U.S. Circuit and District Courts, 1977-2020
Congressional Research Service 31
some of this period that arranged for circuit and district court nominees to be confirmed by voice
vote or unanimous consent.73
Number of Nay Votes Received at Time of
Confirmation The increased frequency with which roll call votes have been used to confirm U.S. circuit and
district court nominations has not always been correlated with Senators using roll call votes to
express opposition to a nominee by voting against his or her nomination. As shown by Figure 6,
there is notable variation in the number of nay votes received by circuit and district court
nominations when they have been confirmed by roll call vote.
The figure shows the number of nominations that received zero nay votes at the time of
confirmation. For nominations that received at least one nay vote, the roll call data are presented
using five ranges to reflect the number of nay votes received by a President’s nominees: (1) 1 to
10 nay votes; (2) 11 to 20 nay votes; (3) 21 to 30 nay votes; (4) 31 to 40 nay votes; and (5) more
than 40 nay votes.
U.S. Circuit Court Nominees
Of the 10 circuit court nominees confirmed by roll call vote, in total, during the Carter, Reagan,
and George H. W. Bush presidencies, only 2 received fewer than 10 nay votes (with 1 receiving
zero nay votes). The other 8 circuit court nominees received at least 11 nay votes at the time of
confirmation (with 5 of the 8 receiving at least 31 nay votes). This likely reflects the practice, at
least during this era, of roll call votes generally being limited to confirming nominations for
which there was more than nominal opposition by more than a handful of Senators.74
During the Clinton presidency, 12 (75.0%) of 16 circuit court nominees confirmed by roll call
vote received at least 1 nay vote (with 9 of 16, or 56.2%, receiving more than 20 nay votes). As
with circuit court nominees during the three earlier presidencies included in the analysis, this may
reflect the practice of generally using roll call votes to confirm nominees for whom there was
more than minimal opposition in the Senate.
In contrast, while the number of circuit court nominees confirmed by roll call vote increased
during the George W. Bush and Obama presidencies, a majority of circuit court nominees
approved by roll call during both presidencies were nonetheless confirmed without receiving any
nay votes. Specifically, during the Bush presidency, 30 (61.2%) of 49 circuit court nominees
confirmed by roll call vote received zero nay votes. And during the Obama presidency, 26
(53.1%) of 49 circuit court nominees confirmed by roll call vote received zero nay votes.
73 For additional information on the procedural tracks followed by the Senate in confirming lower federal court
nomination, see CRS Report R43762, The Appointment Process for U.S. Circuit and District Court Nominations: An
Overview, by Barry J. McMillion.
74 Or at least the desire by more than a handful of Senators to be formally on the record in opposition to a nomination.

Judicial Nomination Statistics and Analysis: U.S. Circuit and District Courts, 1977-2020
Congressional Research Service 32
Figure 6. U.S. Circuit and District Court Nominees: Number of Nay Votes Received
at Time of Confirmation
(by presidency, from 1977 to 2020)
Source: Congressional Research Service.
Notes: This figure shows the number of U.S. circuit and district court nominations that received zero nay votes
at the time of confirmation. Additionally, for nominations that received at least one nay vote, the roll call data
are presented using five ranges to reflect the number of nay votes received by a President’s nominees: (1) 1 to
10 nay votes; (2) 11 to 20 nay votes; (3) 21 to 30 nay votes; (4) 31 to 40 nay votes; and (5) more than 40 nay
votes. This figure does not include any nominations during this period that were rejected by roll call vote in the
Senate.
During the Trump presidency, many circuit court nominees were confirmed with historically high
levels of opposition by the Senate minority party.75 Specifically, only 2 (3.7%) of 54 circuit court
75 At least some of this opposition might be attributable to the change in the blue slip process used for U.S. circuit court
nominees during the 115th and 116th Congresses (i.e., some Senators may have cast nay votes in opposition to the
change in the blue slip process rather than in opposition to particular nominees). This change enabled circuit court
nominations to be considered by the Senate Judiciary Committee (and, if voted favorably out of committee, considered
by the full Senate) without the support of both of a circuit court nominee’s home-state Senators. See Sen. Chuck
Grassley, Congressional Record, daily edition, vol. 163 (November 16, 2017), pp. S7285-S7287; Jordain Carney,
“Grassley says he’s nixing blue slips for pair of nominees,” The Hill, November 16, 2017, at https://thehill.com/
homenews/senate/360791-grassley-says-hes-nixing-blue-slips-for-pair-of-nominees; and Trish Turner, “Trump,
ignoring Democratic senators, set to name 2 judges in California,” ABC News, March 13, 2019, at
https://abcnews.go.com/Politics/trump-make-appointments-9th-circuit-court-democratic-objections/story?id=
61637165.
Judicial Nomination Statistics and Analysis: U.S. Circuit and District Courts, 1977-2020
Congressional Research Service 33
nominees confirmed by roll call vote received zero nay votes. Instead, a majority of circuit court
nominees (35 of 54, or 64.8%) approved during the Trump presidency were confirmed after
having received more than 40 nay votes. An additional 6 nominees (or 11.1% of nominees)
received 31 to 40 nay votes at the time of confirmation.
By presidency, the circuit court nominee who received the greatest number of nay votes—and the
court to which he was nominated—when confirmed by the Senate was Abner J. Mikva, D.C.
Circuit, 31 nay votes (Carter); Daniel A. Manion, Seventh Circuit, 46 nay votes (Reagan);
Edward E. Carnes, Eleventh Circuit, 36 nay votes (George H. W. Bush); William A. Fletcher,
Ninth Circuit, 41 nay votes (Clinton); William H. Pryor Jr., Eleventh Circuit, 45 nay votes
(George W. Bush); David J. Barron, First Circuit, 45 nay votes (Obama); and Jonathan A. Kobes,
Eighth Circuit, 50 nays (Trump).76
U.S. District Court Nominees
Of the two U.S. district court nominees confirmed by roll call vote, in total, during the Carter and
Reagan presidencies, one received 21 to 30 nay votes and the other received 31 to 40 nay votes.
As with the confirmation of circuit court nominees during this era, the use of roll call votes was in
general likely limited to confirming nominations for which there was more than nominal
opposition by a handful of Senators.
There was a notable shift from the George H. W. Bush presidency, during which no district court
nominees were confirmed by roll call vote, to the Clinton presidency, during which 32 district
court nominees were confirmed by roll call vote. Despite the increase in the number of district
court nominees who were confirmed by roll call vote, 26 (81.3%) of the 32 nominees who were
confirmed by roll call vote received 10 or fewer nay votes (with 14, or 43.8%, of 32 nominees
receiving zero nay votes).
The number of district court nominees confirmed by roll call vote continued to increase during
both the George W. Bush and Obama presidencies. But, as was the case with circuit court
nominees during these two presidencies, a majority of nominees confirmed by roll call vote
received zero nay votes. Specifically, during the Bush presidency, 136 of 141, or 96.5%, of
district court nominees confirmed by roll call received zero nay votes. And during the Obama
presidency, 95 (54.9%) of 173 district court nominees confirmed by roll call vote received zero
nay votes (while another 36, or 20.8%, received only 1 to 10 nay votes).
During the Trump presidency, in contrast to the two immediately preceding presidencies, only 15
(10.6%) of 141 district court nominees confirmed by roll call vote received zero nay votes at the
time of confirmation. A plurality of nominees (36, or 25.5%, of 141) received more than 40 nay
votes when confirmed by the Senate, while another 20 nominees, or 14.2%, received 31 to 40 nay
votes at the time of confirmation.
By presidency, the district court nominee who received the greatest number of nay votes—and the
court to which he or she was nominated—when confirmed by the Senate was Lyonel T. Senter,
Jr., Northern District of Mississippi, 25 nay votes (Carter); Sidney A. Fitzwater, Northern District
of Texas, 43 nay votes (Reagan); there were no recorded roll call votes on district court nominees
during the George H. W. Bush presidency; Gerald E. Lynch, Southern District of New York, 36
nay votes (Clinton); J. Leon Holmes, Eastern District of Arkansas, 46 nays (George W. Bush);
and Victor A. Bolden, District of Connecticut, 46 nays (Obama).
76 On December 11, 2018, former Vice President Michael Pence cast a tie-breaking vote and the Senate approved the
Kobes nomination by a vote of 51-50.
Judicial Nomination Statistics and Analysis: U.S. Circuit and District Courts, 1977-2020
Congressional Research Service 34
For the Trump presidency, five nominees each received 47 nay votes (the most nay votes received
by any of President Trump’s district court nominees): J. Campbell Barker (Eastern District of
Texas); Andrew L. Brasher (Middle District of Alabama); Katherine A. Crytzer (Eastern District
of Tennessee); Howard C. Nielson, Jr. (District of Utah); and Patrick R. Wyrick (District of
Western Oklahoma).
Demographic Characteristics of Confirmed
Nominees This section provides data related to the gender and race of U.S. circuit and district court
nominees confirmed by the Senate during each presidency since the Carter Administration. These
particular demographic characteristics of judicial nominees are of ongoing interest to Congress.
Such interest is demonstrated especially at the time circuit and district court nominations are
considered by the Senate.77 For example, floor statements by Senators in support of circuit or
district court nominees frequently emphasize the particular demographic characteristics of
nominees who would enhance the diversity of the federal judiciary.78
Gender
U.S. Circuit Court Nominees
Figure 7 shows, for the seven presidencies during this period,79 that the percentage of confirmed
U.S. circuit court nominees who were women ranged from a low of 7.2% during the Reagan
presidency to a high of 43.6% during the Obama presidency.80
77 Although Members of the U.S. House of Representatives do not have a formal constitutional role in the confirmation
of federal judges, the demographic characteristics of judicial nominees are also of interest to Members of the House.
See, for example, Rep. Mike Honda, “Asian Pacific American Heritage Month,” Remarks in the House, Congressional
Record, daily edition, May 19, 2010, p. H3652 (stating that the President has “demonstrated commitment to judicial
diversity through the nomination of high caliber Asian American and other minority jurists at all levels of the Federal
bench”). See also Rep. Charlie Gonzalez, “Nomination of Miguel Estrada,” Remarks in the House, Congressional
Record, daily edition, February 13, 2003, p. H685 (stating that the Congressional Hispanic Caucus “will actively work
to identify and recommend qualified Hispanic candidates to fill Federal court vacancies”). Additionally, in 2014, the
Congressional Black Caucus released a letter to urge President Obama to appoint a greater number of African
American judges, particularly to certain judicial districts (e.g., the three judicial districts located in Alabama). For the
text of the letter, see https://www.documentcloud.org/documents/1009668-cbc-judges-letter-to-the-president.html.
78 For recent examples, see Sen. Lisa Murkowski, “Executive Session,” Remarks in the Senate, Congressional Record,
daily edition, November 15, 2011, p. S7426; Sen. Ben Cardin, “Executive Session,” Remarks in the Senate,
Congressional Record, daily edition, April 4, 2011, p.S2079; Sen. Roger Wicker, “Executive Session,” Remarks in the
Senate, Congressional Record, daily edition, November 4, 2013, p.S7791; Sen. Pat Toomey, “Executive Session,”
Remarks in the Senate, Congressional Record, daily edition, January 11, 2016; Sen. Amy Klobuchar, “Executive
Session,” Remarks in the Senate, Congressional Record, daily edition, January 19, 2016, p. S84; and Sen. Cory
Booker, “Executive Session,” Remarks in the Senate, Congressional Record, daily edition, January 27, 2016, p. S242.
79 Note that the Carter presidency is the first presidency during which women comprised a notable number and
percentage of confirmed circuit and district court nominees. During the Carter presidency, 12 of 59 confirmed circuit
court nominees and 29 of 203 confirmed district court nominees were women. Prior to the Carter presidency, there had
been two women appointed as circuit court judges and six appointed as district court judges. The first female U.S.
circuit court judge, Florence E. Allen, was appointed to the Sixth Circuit by President Franklin D. Roosevelt in 1934.
The first female U.S. district court judge, Burnita S. Matthews, was appointed to the U.S. District Court for the District
of Columbia by President Truman in 1949.
80 Conversely, the percentage of confirmed U.S. circuit court nominees who were male ranged from a low of 56.4%
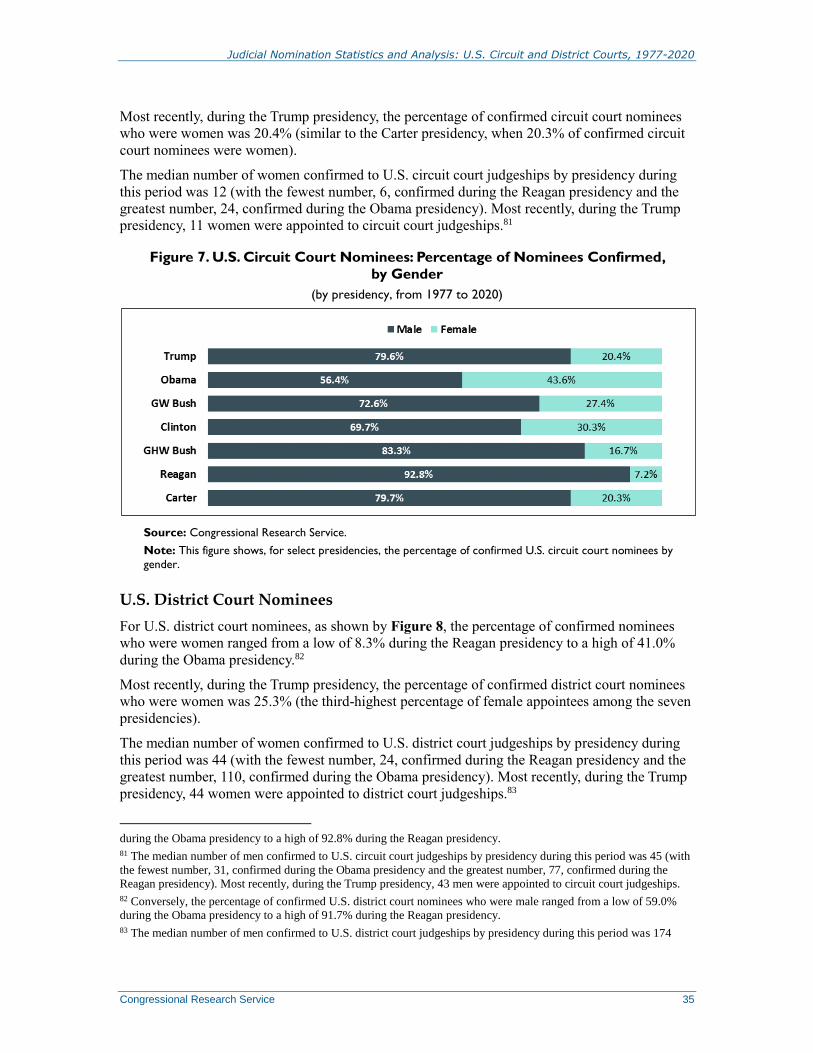
Judicial Nomination Statistics and Analysis: U.S. Circuit and District Courts, 1977-2020
Congressional Research Service 35
Most recently, during the Trump presidency, the percentage of confirmed circuit court nominees
who were women was 20.4% (similar to the Carter presidency, when 20.3% of confirmed circuit
court nominees were women).
The median number of women confirmed to U.S. circuit court judgeships by presidency during
this period was 12 (with the fewest number, 6, confirmed during the Reagan presidency and the
greatest number, 24, confirmed during the Obama presidency). Most recently, during the Trump
presidency, 11 women were appointed to circuit court judgeships.81
Figure 7. U.S. Circuit Court Nominees: Percentage of Nominees Confirmed,
by Gender
(by presidency, from 1977 to 2020)
Source: Congressional Research Service.
Note: This figure shows, for select presidencies, the percentage of confirmed U.S. circuit court nominees by
gender.
U.S. District Court Nominees
For U.S. district court nominees, as shown by Figure 8, the percentage of confirmed nominees
who were women ranged from a low of 8.3% during the Reagan presidency to a high of 41.0%
during the Obama presidency.82
Most recently, during the Trump presidency, the percentage of confirmed district court nominees
who were women was 25.3% (the third-highest percentage of female appointees among the seven
presidencies).
The median number of women confirmed to U.S. district court judgeships by presidency during
this period was 44 (with the fewest number, 24, confirmed during the Reagan presidency and the
greatest number, 110, confirmed during the Obama presidency). Most recently, during the Trump
presidency, 44 women were appointed to district court judgeships.83
during the Obama presidency to a high of 92.8% during the Reagan presidency.
81 The median number of men confirmed to U.S. circuit court judgeships by presidency during this period was 45 (with
the fewest number, 31, confirmed during the Obama presidency and the greatest number, 77, confirmed during the
Reagan presidency). Most recently, during the Trump presidency, 43 men were appointed to circuit court judgeships.
82 Conversely, the percentage of confirmed U.S. district court nominees who were male ranged from a low of 59.0%
during the Obama presidency to a high of 91.7% during the Reagan presidency.
83 The median number of men confirmed to U.S. district court judgeships by presidency during this period was 174
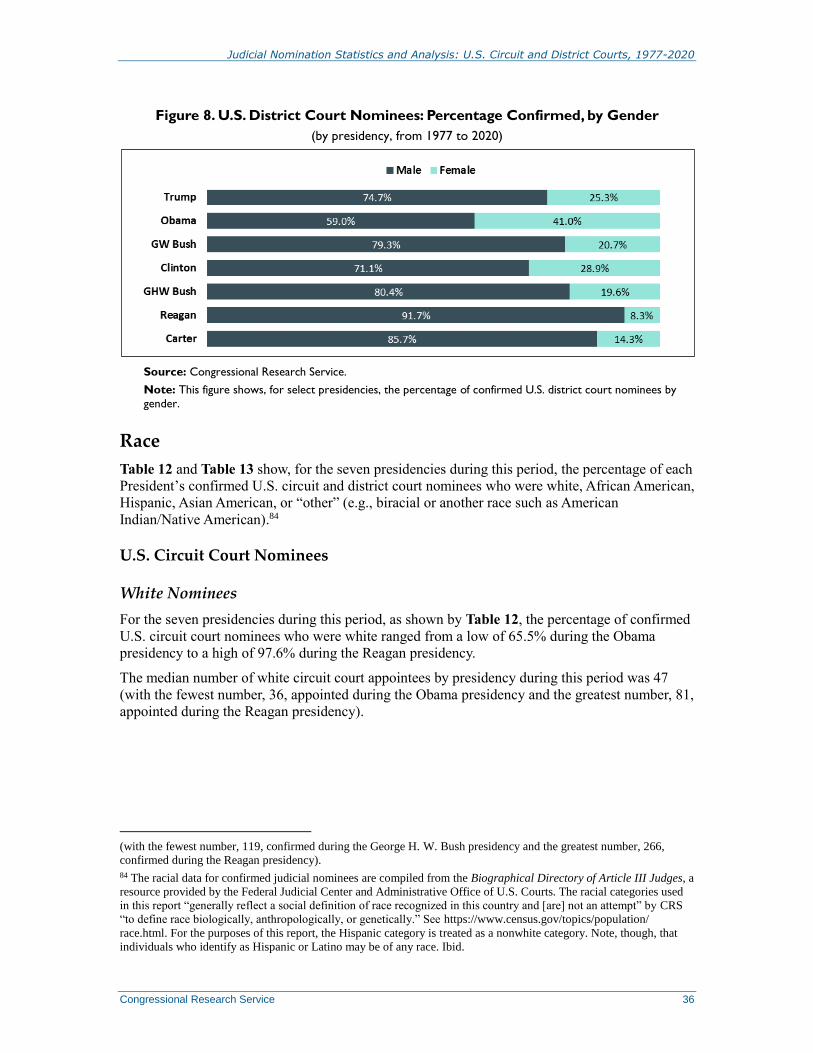
Judicial Nomination Statistics and Analysis: U.S. Circuit and District Courts, 1977-2020
Congressional Research Service 36
Figure 8. U.S. District Court Nominees: Percentage Confirmed, by Gender
(by presidency, from 1977 to 2020)
Source: Congressional Research Service.
Note: This figure shows, for select presidencies, the percentage of confirmed U.S. district court nominees by
gender.
Race
Table 12 and Table 13 show, for the seven presidencies during this period, the percentage of each
President’s confirmed U.S. circuit and district court nominees who were white, African American,
Hispanic, Asian American, or “other” (e.g., biracial or another race such as American
Indian/Native American).84
U.S. Circuit Court Nominees
White Nominees
For the seven presidencies during this period, as shown by Table 12, the percentage of confirmed
U.S. circuit court nominees who were white ranged from a low of 65.5% during the Obama
presidency to a high of 97.6% during the Reagan presidency.
The median number of white circuit court appointees by presidency during this period was 47
(with the fewest number, 36, appointed during the Obama presidency and the greatest number, 81,
appointed during the Reagan presidency).
(with the fewest number, 119, confirmed during the George H. W. Bush presidency and the greatest number, 266,
confirmed during the Reagan presidency).
84 The racial data for confirmed judicial nominees are compiled from the Biographical Directory of Article III Judges, a
resource provided by the Federal Judicial Center and Administrative Office of U.S. Courts. The racial categories used
in this report “generally reflect a social definition of race recognized in this country and [are] not an attempt” by CRS
“to define race biologically, anthropologically, or genetically.” See https://www.census.gov/topics/population/
race.html. For the purposes of this report, the Hispanic category is treated as a nonwhite category. Note, though, that
individuals who identify as Hispanic or Latino may be of any race. Ibid.
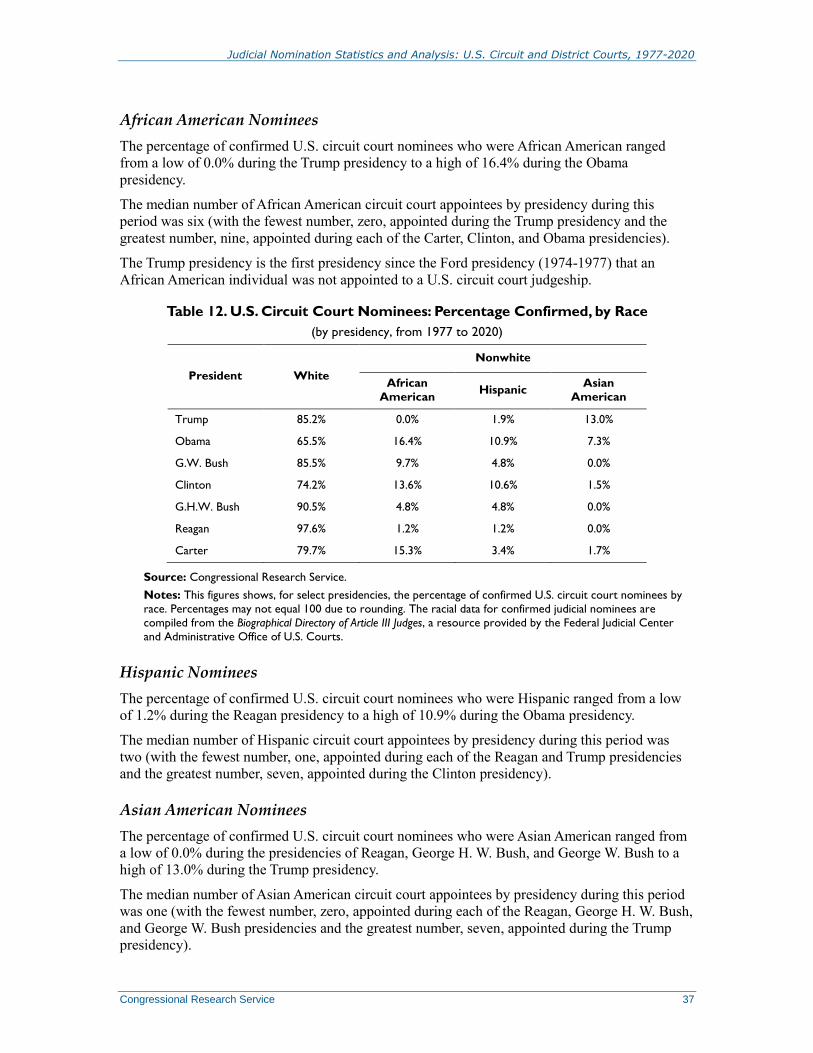
Judicial Nomination Statistics and Analysis: U.S. Circuit and District Courts, 1977-2020
Congressional Research Service 37
African American Nominees
The percentage of confirmed U.S. circuit court nominees who were African American ranged
from a low of 0.0% during the Trump presidency to a high of 16.4% during the Obama
presidency.
The median number of African American circuit court appointees by presidency during this
period was six (with the fewest number, zero, appointed during the Trump presidency and the
greatest number, nine, appointed during each of the Carter, Clinton, and Obama presidencies).
The Trump presidency is the first presidency since the Ford presidency (1974-1977) that an
African American individual was not appointed to a U.S. circuit court judgeship.
Table 12. U.S. Circuit Court Nominees: Percentage Confirmed, by Race
(by presidency, from 1977 to 2020)
President White
Nonwhite
African
American Hispanic
Asian
American
Trump 85.2% 0.0% 1.9% 13.0%
Obama 65.5% 16.4% 10.9% 7.3%
G.W. Bush 85.5% 9.7% 4.8% 0.0%
Clinton 74.2% 13.6% 10.6% 1.5%
G.H.W. Bush 90.5% 4.8% 4.8% 0.0%
Reagan 97.6% 1.2% 1.2% 0.0%
Carter 79.7% 15.3% 3.4% 1.7%
Source: Congressional Research Service.
Notes: This figures shows, for select presidencies, the percentage of confirmed U.S. circuit court nominees by
race. Percentages may not equal 100 due to rounding. The racial data for confirmed judicial nominees are
compiled from the Biographical Directory of Article III Judges, a resource provided by the Federal Judicial Center
and Administrative Office of U.S. Courts.
Hispanic Nominees
The percentage of confirmed U.S. circuit court nominees who were Hispanic ranged from a low
of 1.2% during the Reagan presidency to a high of 10.9% during the Obama presidency.
The median number of Hispanic circuit court appointees by presidency during this period was
two (with the fewest number, one, appointed during each of the Reagan and Trump presidencies
and the greatest number, seven, appointed during the Clinton presidency).
Asian American Nominees
The percentage of confirmed U.S. circuit court nominees who were Asian American ranged from
a low of 0.0% during the presidencies of Reagan, George H. W. Bush, and George W. Bush to a
high of 13.0% during the Trump presidency.
The median number of Asian American circuit court appointees by presidency during this period
was one (with the fewest number, zero, appointed during each of the Reagan, George H. W. Bush,
and George W. Bush presidencies and the greatest number, seven, appointed during the Trump
presidency).

Judicial Nomination Statistics and Analysis: U.S. Circuit and District Courts, 1977-2020
Congressional Research Service 38
U.S. District Court Nominees
White Nominees
For the seven presidencies during this period, as shown by Table 13, the percentage of confirmed
U.S. district court nominees who were white ranged from a low of 63.4% during the Obama
presidency to a high of 92.8% during the Reagan presidency.
The median number of white district court appointees by presidency during this period was 170
(with the fewest number, 132, appointed during the George H. W. Bush presidency and the
greatest number, 269, appointed during the Reagan presidency).
African American Nominees
The percentage of confirmed U.S. district court nominees who were African American ranged
from a low of 2.1% during the Reagan presidency to a high of 18.7% during the Obama
presidency.
The median number of African American district court appointees by presidency during this
period was 18 (with the fewest number, 6, appointed during the Reagan presidency and the
greatest number, 53, appointed during the Clinton presidency).
Table 13. U.S. District Court Nominees: Percentage Confirmed, by Race
(by presidency, from 1977 to 2020)
President White
Nonwhite
African
American Hispanic
Asian
American Other
Trump 83.3% 5.2% 4.6% 3.4% 3.4%
Obama 63.4% 18.7% 9.3% 5.2% 3.4%
G.W. Bush 81.2% 6.9% 10.3% 1.5% 0.0%
Clinton 75.1% 17.4% 5.9% 1.3% 0.3%
G.H.W. Bush 89.2% 6.8% 4.1% 0.0% 0.0%
Reagan 92.8% 2.1% 4.5% 0.7% 0.0%
Carter 77.8% 13.8% 6.9% 0.5% 0.5%
Source: Congressional Research Service.
Notes: This figures shows, for select presidencies, the percentage of confirmed U.S. district court nominees by
race. Percentages may not equal 100 due to rounding. The racial data for confirmed judicial nominees are
compiled from the Biographical Directory of Article III Judges, a resource provided by the Federal Judicial Center
and Administrative Office of U.S. Courts.
Hispanic Nominees
The percentage of confirmed U.S. district court nominees who were Hispanic ranged from a low
of 4.1% during the George H. W. Bush presidency to a high of 10.3% during the George W. Bush
presidency.
The median number of Hispanic district court appointees by presidency during this period was 14
(with the fewest number, 6, appointed during the George H. W. Bush presidency and the greatest
number, 27, appointed during the George W. Bush presidency).
Judicial Nomination Statistics and Analysis: U.S. Circuit and District Courts, 1977-2020
Congressional Research Service R45622 · VERSION 3 · UPDATED 39
Asian American Nominees
The percentage of confirmed U.S. district court nominees who were Asian American ranged from
a low of 0.0% during the George H. W. Bush presidency to a high of 5.2% during the Obama
presidency.
The median number of Asian American district court appointees by presidency during this period
was 4 (with the fewest number, 0, appointed during the George H. W. Bush presidency and the
greatest number, 14, appointed during the Obama presidency).
Other Nominees
The percentage of confirmed U.S. district court nominees in the “other” category (e.g., biracial,
etc.) ranged from a low of 0.0% during the Reagan, George H. W. Bush, and George W. Bush
presidencies to a high of 3.4% during the Obama and Trump presidencies.
The median number of “other” district court appointees by presidency during this period was one
(with the fewest number, zero, appointed during the Reagan, George H. W. Bush, and George W.
Bush presidencies and the greatest number, nine, appointed during the Obama presidency).
Author Information
Barry J. McMillion
Analyst in American National Government
Acknowledgments
Amber Wilhelm, Graphics Specialist in the CRS Office of Publishing, prepared figures included in this
report. Sarah J. Eckman, Analyst in American National Government, and Raymond Williams, former
Research Assistant for the Congress and Judiciary Section, assisted with data presented in this report.
Disclaimer
This document was prepared by the Congressional Research Service (CRS). CRS serves as nonpartisan
shared staff to congressional committees and Members of Congress. It operates solely at the behest of and
under the direction of Congress. Information in a CRS Report should not be relied upon for purposes other
than public understanding of information that has been provided by CRS to Members of Congress in
connection with CRS’s institutional role. CRS Reports, as a work of the United States Government, are not
subject to copyright protection in the United States. Any CRS Report may be reproduced and distributed in
its entirety without permission from CRS. However, as a CRS Report may include copyrighted images or
material from a third party, you may need to obtain the permission of the copyright holder if you wish to
copy or otherwise use copyrighted material.


