
INTERMODAL CONNECTIVITY FOR DESTINATIONS
This policy paper is prepared by the OECD Centre for Entrepreneurship, SMEs and Local Development, as part of the Tourism Committee’s Programme of Work for 2015-2016.

2
This paper builds on Chapter 2 of OECD Tourism Trends and Policies 2016, Seamless Transport to Enhance the Visitor Experience. It further examines the role of intermodal and multimodal transport systems in enhancing the visitor experience, and how integrated transport and tourism responses, including innovations in information provision and ICT, can better facilitate intermodal connectivity and influence destination and regional development.
This policy paper is published under the responsibility of the Secretary-General of the OECD. The opinions expressed and the arguments employed herein do not necessarily reflect the official views of OECD countries.
Peter Haxton led the drafting of the report, under the direction of Alain Dupeyras, Head of the OECD Tourism Unit.
The publication of this document has been authorised by Lamia Kamal-Chaoui, Director, Centre for Entrepreneurship, SMEs, Local Development and Tourism.
This document and any map included herein are without prejudice to the status of or sovereignty over any territory, to the delimitation of international frontiers and boundaries and to the name of any territory, city or area.
This document has been declassified on the responsibility of the Tourism Committee under the OECD reference number CFE/TOU(2015)12/FINAL.
© OECD 2016 You can copy, download or print OECD content for your own use, and you can include excerpts from OECD publications, databases and multimedia products in your own documents, presentations, blogs, websites and teaching materials, provided that suitable acknowledgment of OECD as source and copyright owner is given. All requests for commercial use and translation rights should be submitted to [email protected].

3
TABLE OF CONTENTS
INTERMODAL CONNECTIVITY FOR DESTINATIONS ......................................................................... 4
Summary and policy considerations ............................................................................................................ 4 General trends in tourism and transport ...................................................................................................... 6 Intermodal and multimodal transport systems .......................................................................................... 10
Major transport hubs .............................................................................................................................. 10 Influencing destination and regional development ................................................................................ 16 Influencing more sustainable transport choices ..................................................................................... 20
Seamless transport to enhance the visitor experience ............................................................................... 23 Network design ...................................................................................................................................... 25 Information provision ............................................................................................................................ 26 Information and communications technology ....................................................................................... 28 Accessibility/universal design ............................................................................................................... 30
References ................................................................................................................................................. 32 Figures
Figure 1. International arrivals by mode of transport ............................................................................. 8 Figure 2. Forecast inbound arrivals by mode of transport to 2030 ......................................................... 8 Figure 3. Components of sustainable transport .................................................................................... 20
Boxes
Box 1. Examples of integrated multimodal transport hubs .................................................................. 11 Box 2. Transport hubs as showcases for local tourism attractions ....................................................... 13 Box 3. New Tools for Design and Operation of Urban Transport Interchanges (NODES) ................. 15 Box 4. Aviation and cruise hubs in Singapore as catalysts for tourism ................................................ 17 Box 5. Tourism as a catalyst to improve the performance of transport systems .................................. 18 Box 6. Tourist routes: invigorating rural and regional communities .................................................... 19 Box 7. Facilitating sustainable mobility ............................................................................................... 22 Box 8. Improving the passenger arrival experience at borders ............................................................. 24 Box 9. “Next Stop Paris” smartphone app ............................................................................................ 26 Box 10. “Legible London” way-finding system ..................................................................................... 27 Box 11. Information provision for driver safety ..................................................................................... 28 Box 12. Integrated payment systems to improve traveller convenience ................................................ 30 Box 13. Improving accessibility to enhance seamless transport in Japan .............................................. 31
Summary and policy considerations
4
INTERMODAL CONNECTIVITY FOR DESTINATIONS
Summary and policy considerations
Transport policy aims to achieve strong connectivity and seamless transport where there is demand. However, the economic and social geography that determines demand for mobility does not necessarily align with the geographic boundaries of the various authorities involved in developing transport policy. Transport policies affect not only the travel experience of locals, but also tourists as they navigate the ‘last-mile’ in the journeys; from arriving at transport hubs until reaching their final destinations. Providing seamless transport between cities or across borders requires co-ordinated responses to technical, institutional and financial issues from a variety of stakeholders.
Many of the underlying difficulties in meeting the associated infrastructure challenges can be attributed to governance issues that span infrastructure planning, policy, regulation, financing, procurement and management. The importance of institutional co-ordination cannot be stressed enough when it comes to the seamless operation of multimodal transport systems. Good governance at all levels of government and co-operation with the private sector is needed to improve decision-making and create incentives to invest in connectivity. There is a need to think in terms of mobility systems rather than modes and modal networks. An integrated governance structure is critical, which can be driven by a political champion, an integrated authority, and/or stronger national government involvement.
The multi-scalar, multi-agency, and multi-jurisdictional complexity of transport and tourism policy areas, present significant challenges to understanding the various inter-linkages and synergies. At a national level, rail, road, cruise and aviation policies are usually developed within separate agencies in relatively compartmentalised processes, although there is often a range of consultative mechanisms that facilitate communication and co-ordination. Planning for airport infrastructure, for example, requires not only forecasting of international and domestic travel growth, but also an understanding of the characteristics of these markets in order to determine the level of services required and the need for connectivity between the transport hub and destinations. The effectiveness of information exchange, learning, communication and co-ordination across policy sectors therefore determines how transport interests are balanced in tourism policies, and vice-versa.
Managed effectively, transport and tourism synergies can improve visitor mobility to and within destinations, enhance visitor satisfaction, and help to secure the economic viability of local transport systems and services by servicing both residents and tourists. Ensuring that the medium- to long-term needs of the tourism industry are considered by governments as part of transport access and infrastructure planning can help to maximise and spread the socio-economic benefits of tourism more widely and manage visitor impacts over time.
By promoting the development of intermodal hubs and gateways, transport policies (e.g. integrated multimodal transport systems) at the national and sub-national level can not only help attract, manage or direct visitor flows but also facilitate a shift to more eco-friendly transport options, which can help consolidate a destination’s reputation as sustainable. However, if transport and tourism development strategies are not well synchronised, destinations may not be able to accommodate actual or potential

Summary and policy considerations
5
visitor numbers and flows, and mobility around the destination will be restricted, potentially decreasing the quality of visitor experiences.
There is much that tourism policy makers and promotional organisations can do to help ensure that strategic transportation planning supports tourism goals. Improving institutional co-ordination with transport policy makers and operators, and adopting strategies such as those outlined below can help facilitate the development of transport systems that will enhance the experience of tourists and locals alike:
• Ensure that the medium- to long-term needs of the tourism industry are considered as part of the transport access and infrastructure planning process. Encourage tourism and transport policy-makers to work closer together to design transport services and infrastructure that respond to the needs of all travellers;
• Better understand and communicate the economic importance of tourism to transport officials, including the travel demands and fare revenues generated by tourists and tourism industry employees.
• Identify factors that affect tourist travel demand, including daily, weekly and annual cycles, as well as the effects of holidays, weather, economic conditions and special events. Work with transport officials and operators to improve forecasting and develop strategies that take such factors into account.
• Investigate latent demand (travel that would occur if conditions were changed), to determine, for example, if potential visitors have concerns/perceptions of inadequate or expensive transport.
• Encourage integrated ticketing/pricing and destination smart cards to provide a convenient and comfortable travel experience. The relevant destination marketing and government agencies should work together to create the right collaborative conditions and physical infrastructure so that greater coherence of the destination experience can be achieved.
• Apply accessibility-based analysis, which recognizes the important roles that walking, cycling and public transportation (bus, light rail, train, etc.) can play in an efficient and equitable transport system, and contribute to mitigating negative environmental impacts and managing seasonal peaks.
• Promote the benefits of timely and accurate information and way-finding (e.g. signs, maps, websites, apps, available in multiple languages) to accommodate people with limited communications abilities and to help tourists confidently navigate a city or region.
• Apply universal design principles to cater for tourists of all levels of mobility, and encourage transport providers to offer appropriate services, such as wheelchair accessible buses and taxis.
• Encourage critical evaluation of the total transport experience, including the quality of connections between travel modes, the convenience, comfort and attractiveness of transport hubs, and solicit feedback from tourists through existing mechanisms to better understand the problems they encounter and potential ways to enhance their experience.

General trends in tourism and transport
6
General trends in tourism and transport
Tourism represents a significant share of the services economy for many countries around the world. In 2014, it accounted for, on average, around 4.1% of GDP and 5.9% of employment and 21.3% of exports of services in OECD member countries. At around 80%, tourism exports also generate higher than average domestic value added.
International tourism demand closely tracks economic conditions in the major generating source markets. When economies grow, levels of disposable income also increase, resulting in higher spending on tourism and travel. As such tourism was not able to avoid the impacts of the global financial crisis. Apart from depressing overall tourism demand, the crisis contributed to shifts in tourism flows, with less long haul travel from major European source markets, and an international trend for more holidays to be taken closer to home. The relative values of major currencies continue to fluctuate, with impacts on the relative competitiveness of destinations.
According to the United Nations World Tourism Organization (UNWTO), the number of international arrivals reached a record 1.1 billion in 2014. A resurgence in travel to advanced economies saw arrivals to the OECD (6.4%) increasing at a faster rate than the global average (4.2%). Notwithstanding this, arrivals to emerging economies are projected to grow at double the rate for advanced tourism economies up to 2030, when international arrivals are expected to reach 1.8 billion. More specifically, the UNWTO’s long-term forecast – Tourism Towards 2030 – envisages above average growth for Asia, the Pacific, the Middle East and Africa, while the more mature tourism regions of Europe and the Americas are anticipated to show lower than average growth rates.
In line with the shift in global economic balance towards emerging economies, the rapid growth of tourism in countries such as Brazil, China, India, Indonesia, the Russian Federation and South Africa, is altering patterns of travel flows and demand. These require new marketing and servicing skills and appropriate product development. Simultaneously, in developed countries, changing social values, lifestyles and demographics are reflected in changes in tourism demand. For example, travellers are also getting older, with 23% aged over 55 in 2012, and holidays remain by far the major reason for taking an international trip (71%) ahead of business travel and visiting friends and relatives (IPK International 2012).
The effects of these changes can be seen in the growing fragmentation of tourism markets, and in the emergence of new niche markets. In OECD economies, for example, holidays for singles, the retired, and money-rich/time-poor short-break travellers, are developing into major market segments. Other emerging niches include trends for adventure experiences, indulgent and luxury travel (e.g. cruise tourism), a search for unique experiences, self-fulfilment, and a demand for authenticity. Customers are increasingly experimental, willing to try new products, foods and attractions, and less willing to give a second chance to destinations providing poor products or services. For many tourism consumers, fewer holidays are being taken because of less discretionary spending and there is also a greater emphasis on value for money.
Transport is a key enabler of tourism and plays a vital role in moving tourists from their place of residence to their final destination and on to various attractions. Transport connects the markets in tourism generating regions to destinations and facilitates the internal movement of visitors between components of the tourist experience (e.g. attractions, accommodation, commercial services, etc.), and can be a major element of the attraction or an experience in their own right (e.g. Queen Mary II, the Orient Express, world heritage listed Semmering Railway). The location, capacity, efficiency and connectivity of transport can therefore play an important role in how a destination physically develops, and significantly influence the mobility of visitors and the connectivity of tourist experiences within destinations. At the same time the growing number of tourists creates numerous challenges in terms of transport infrastructure and capacity, including border crossings, intermodality, information provision, accessibility and seamless connections
General trends in tourism and transport
7
between the various transport service providers. As a result, governments have an important role to play in addressing the linkages between these policy areas.
Transport, like tourism, is a complex area of policy-making, incorporating multiple levels of government and multiple agencies responsible for different modes including land, sea and air transport. There is also an increasing array of public-private partnerships and governance arrangements associated with transport infrastructure provision and service delivery. In addition, there are a range of new business models which enable the provision of innovative and more personalised transport services. The emergence of transportation network companies, providing a platform for matching drivers and passengers along with other less formal ride sharing approaches, are revolutionising how mobility is provided.
A major objective of government transport policy is to achieve a co-ordinated and integrated transport system that is efficient, safe, secure, sustainable, accessible, financially viable and competitive, and meets both the short and long-term needs of the economy and the community. Transport policy is therefore closely aligned with economic development policies (including tourism), given that an efficient, competitive and sustainable transport system is a prerequisite for the movement of goods and/or people, and ultimately the efficient and competitive functioning of the economy. Within this context, governments, working closely with the private sector, have a significant role to play in facilitating and enabling the provision of transport infrastructure and the regulation of transport networks and services.
Data, whether covering home and work, leisure destinations and demand for travel to, from and between these locations, are increasingly essential to this process. Much of transport-related data (a large proportion of which is now collected by the private sector), has a geospatial and temporal component that allows for a more detailed understanding of where people are at any given time, where and when they are travelling, and in some cases the mode of transport and purpose. Sensor-generated data, largely via the growth in mobile phones, on-board navigation devices and vehicle-to-vehicle communication, is quickly replacing infrastructure-generated data. With this shift in the way data is being collected, processed and stored, decision makers have the opportunity to influence and shape this process. New forms of data collection and new data types can help to identify infrastructure requirements and support more flexible regulation.
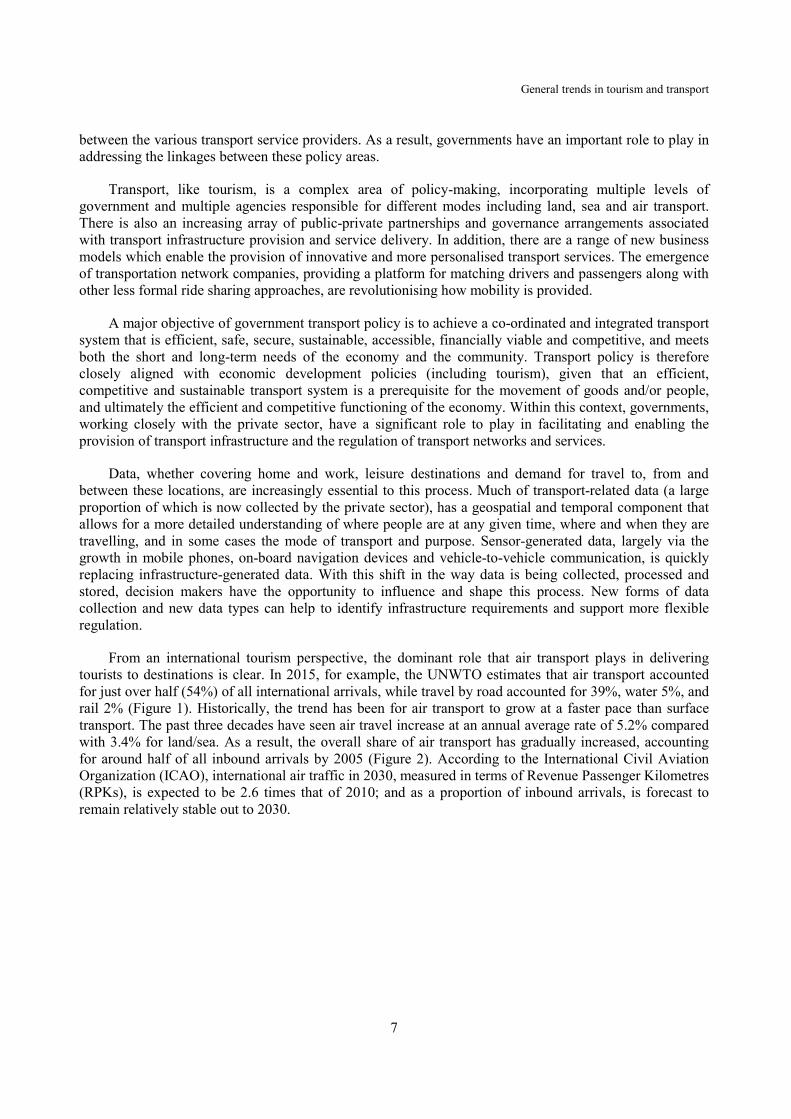
From an international tourism perspective, the dominant role that air transport plays in delivering tourists to destinations is clear. In 2015, for example, the UNWTO estimates that air transport accounted for just over half (54%) of all international arrivals, while travel by road accounted for 39%, water 5%, and rail 2% (Figure 1). Historically, the trend has been for air transport to grow at a faster pace than surface transport. The past three decades have seen air travel increase at an annual average rate of 5.2% compared with 3.4% for land/sea. As a result, the overall share of air transport has gradually increased, accounting for around half of all inbound arrivals by 2005 (Figure 2). According to the International Civil Aviation Organization (ICAO), international air traffic in 2030, measured in terms of Revenue Passenger Kilometres (RPKs), is expected to be 2.6 times that of 2010; and as a proportion of inbound arrivals, is forecast to remain relatively stable out to 2030.

General trends in tourism and transport
8
Figure 1. International arrivals by mode of transport (2015)
Source: UNWTO 2016
Figure 2. Forecast inbound arrivals by mode of transport to 2030
Source: OECD, adapted from UNWTO 2011
The high proportion of international arrivals by road (39%) is not surprising given the level of convenience that private vehicles afford the user, including the ability to travel point to point without the need for intermodal connections (the interchange between two or more different modes of transport). While air and road are by far the primary choices of transport for international tourists, rail and water, and by extension, cruise terminals and international train stations, have an important role to play in distributing visitors to and around their destination of choice (whether that be for leisure, business or visiting friends and relatives).
Air54%
Water 5%
Rail2%
Road39%
277
435528
674797
940
1360
1809
0%
10%
20%
30%
40%
50%
60%
70%
1975 1980 1985 1990 1995 2000 2005 2010 2015 2020 2025 2030 2035
Market share by air (%) Market share by over surface (%) International Tourist Arrivals generated (million)

General trends in tourism and transport
9
According to the International Transport Forum (ITF), forecast growth in global road and rail passenger travel to 2050 ranges from 120% to 230%, depending on future fuel prices and urban transport policies. This growth is driven by non-OECD economies, where passenger volumes are projected to grow between 240% and 450%. Similarly, the cruise industry has enjoyed strong growth over a period of 30 years, driven initially by demand from North America and more recently by growing demand from Europe and the rest of the world. Cruise Lines International (CLIA), estimates that over the ten years 2004/2014 demand for cruising worldwide has increased from 13.1 million passengers to 22 million (+68%) with 3.4% growth achieved in 2014. In 2018 global passengers are expected to exceed 25 million before reaching 30 million in 2024 (CLIA 2015).
ICAO argues that the rapid growth in tourism and air transport in particular, in recent decades, is in response to two major factors i) higher incomes and an emerging middle class in emerging economies, which encourage greater consumption expenditure, including travel (by all modes) and; ii) the fact that air travel has become better value for money, as a result of improved aerospace technology and market liberalisation. The air passenger is rapidly evolving, with many people now viewing air travel as routine. Passengers of full-service airlines expect the industry to offer a homogeneous experience, with uniform levels of customer service worldwide. However, most are very price- and value-conscious, and are willing to use unfamiliar carriers, routings and airports to get the best fares – including low-cost carriers to smaller or regional airports, which tend not to be as well connected as airport hubs near major cities.
Aviation liberalisation has encouraged competition, fostered the creation of new routes and enabled new airline business models to emerge, such as charter and low-cost carriers, which injected a greater level of competition in the airline industry. Some countries have embraced aviation liberalisation as a means to connect their economy with the rest of the world, including Australia, Chile, Finland, Morocco, New Zealand and the United States. For example, Australia’s liberal approach towards foreign ownership of airlines serving the Australian domestic market has led to foreign investment which has benefitted both Australian and international passengers. Also on an international level it has opened access for international services, which has stimulated connectivity and economic growth.
However, like tourism, the centre of gravity of air transport demand is changing. New air routes are fast developing, on the back of new trade flows, and new aviation hubs have emerged. Against this background, some countries have fully integrated aviation into their economic development policies by establishing a policy and regulatory framework which is extremely supportive of aviation growth (e.g. Panama, Qatar, Singapore, Turkey, and the United Arab Emirates). As a result, some existing hubs are increasingly at risk of being by-passed as enablers of direct global connectivity, and this has led some governments to reconsider policies towards liberalisation.
The future growth of tourism and air transport are very much interlinked, and will depend largely on sustained world economic and trade growth, a growing middle class in developing economies, as well as declining ticket prices and airline operating costs, which will be impacted by aircraft technology, improvements in airline resource management and the price of fuel. Airspace and airport congestion could also constrain the growth of selected markets.
Intermodal and multimodal transport systems
10
Intermodal and multimodal transport systems
The purpose of transport systems are to connect people to each other and to provide opportunities for work and leisure. They involve multiple modes across space and therefore affect a variety of geographic areas, users, and governments at the national and sub-national level. A lack of co-ordination among the many actors involved can result in an inefficient use of resources. For example, fragmented revenue streams and a lack of consensus between the tourism industry and policy makers on the most effective funding solutions can present significant challenges. The need for institutional and stakeholder co-ordination across space, function, and funding is critical to developing an integrated and comprehensive transport system.
In an urban context, where a significant proportion of tourism-related transport activities take place, the challenges of co-ordination across multiple institutions (both public and private) are also evident. In Latin America, for instance, transport systems in cities like Mexico City or Sao Paulo can stretch across as many as 50 municipalities, each led by mayors with potentially different political agendas. As such, there is often a mismatch between political cycles and the time frames necessary for most transport infrastructure developments, therefore adding a ‘time’ dimension to consider in developing an integrated approach. In the regional and rural context, the challenges of co-ordination remain; however, they are often exacerbated due to dispersed destinations and lower demand.
Multimodal infrastructure refers to the network of airports, seaports, roads, railways, public-transport systems, and human powered mobility options that are integrated and coordinated to form a transport system to move people or freight from one point to another. While a seamless multimodal experience, might include, for instance, travelling on two or more forms of transport with a single ticket (e.g. rail and air). In general, the more effectively these modes support and interconnect with one another, and the more seamless the intermodal connections (the movement of passengers or freight between modes of transport), the less congestion and stress there will be on any individual component.
In the case of tourism this includes the journey from a tourist’s place of residence until their arrival at their final or primary destination, and then on to supporting attractions in the area. While many tourists use private or rental vehicles ‘point to point’, often due to the convenience they afford, the majority of those travelling internationally, travel from their home to an airport, port or train station, and then on from their point of arrival to their destination – for those taking cruises, the ship is also a large part of the experience. These different segments are often referred to as the first- and last-miles of the journey. For the purposes of this report the focus is on ways to enhance the visitor transport experience between the point of arrival at a major transport hub and the final destination, or the last-mile of a tourist’s journey; although many of approaches examined will also be relevant for the first-mile of the journey and would also benefit local users of transport services.
Major transport hubs
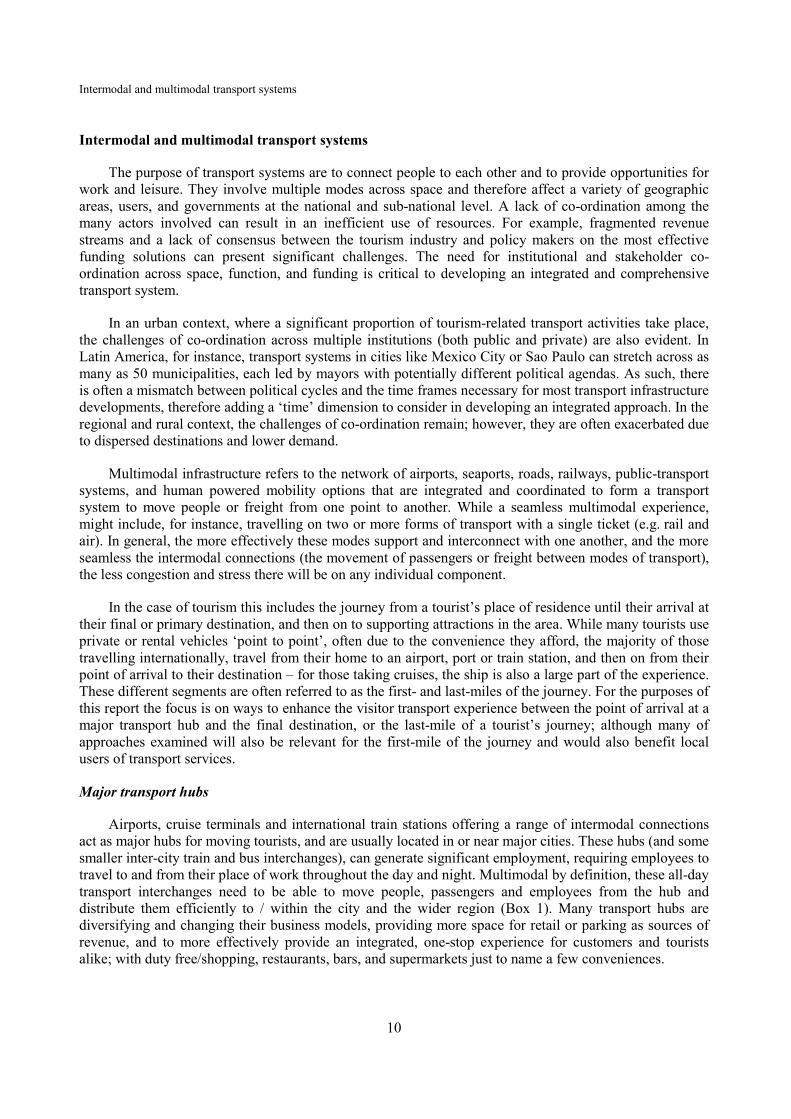
Airports, cruise terminals and international train stations offering a range of intermodal connections act as major hubs for moving tourists, and are usually located in or near major cities. These hubs (and some smaller inter-city train and bus interchanges), can generate significant employment, requiring employees to travel to and from their place of work throughout the day and night. Multimodal by definition, these all-day transport interchanges need to be able to move people, passengers and employees from the hub and distribute them efficiently to / within the city and the wider region (Box 1). Many transport hubs are diversifying and changing their business models, providing more space for retail or parking as sources of revenue, and to more effectively provide an integrated, one-stop experience for customers and tourists alike; with duty free/shopping, restaurants, bars, and supermarkets just to name a few conveniences.

Intermodal and multimodal transport systems
11
Box 1. Examples of integrated multimodal transport hubs
Hong Kong International Airport (HKIA): Opened in 1998, HKIA is an integrated multimodal transport hub serviced by over 100 airlines operating flights to about 180 locations worldwide. It is regularly included in the internationally recognised Skytrax World Airport Awards Top 10. HKIA employs approximately 65 000 staff and operates 24 hours a day. In 2014, the airport handled more than 4 million tonnes of air cargo and catered to the diverse needs of more than 63 million customers. The airport is served by 2 in-terminal hotels, and from a retail or customer experience perspective, passengers have access to free wifi, over 280 retail and 80 catering outlets, in addition to an Aviation Discovery Centre, and an IMAX theatre. From a multimodal transport perspective, the airport has over 3 300 car parking spaces and 36 pick-up bays for coaches (www.hongkongairport.com). It provides connections with:
1. local destinations via:
• the Airport Express Line train service, which arrives in Central downtown in 24 minutes,
• franchised bus companies operating 45 routes,
• local tour coaches making around 700 trips a day from HKIA to downtown;
2. the Pearl River Delta (PRD) via:
• mainland Coaches making 550 trips between HKIA and over 110 mainland cities and towns every day,
• ferries at SkyPier arriving at ports in the PRD in 30-90 minutes,
• SkyLimo operating a fleet of 280 vehicles serving HKIA and the PRD cities every day.
Vancouver Cruise Ship Terminal: A mixed use facility, Canada Place is home to Vancouver’s cruise ship terminal, Port Metro Vancouver corporate offices, the Vancouver Convention Centre East, the World Trade Centre Office Complex, and a 500-room hotel. The cruise terminal, owned and operated by Port Metro Vancouver, welcomes upwards of 900 000 passengers each year as the homeport for many of the Alaska cruises. The 3-berth terminal can service up to 4 luxury cruise ships at one time. It is estimated that each cruise ship that docks in Vancouver contributes approximately CAD 2 million to the local economy. In addition to direct pedestrian access to downtown Vancouver, Canada Place and the cruise terminal benefit from a variety of connections to the city and beyond (http://www.canadaplace.ca):
• Car/taxi - a 24-hour 770 space car parking facility (with its own free ‘park and bike’ programme),
• Train - TransLink provides city transit seven days a week via its rapid transit system – the SkyTrain – from Waterfront Station,
• Boat - The SeaBus connects downtown Vancouver at Waterfront Station to the North Shore. BC Ferries provides daily services between Vancouver, Victoria and Nanaimo.

Intermodal and multimodal transport systems
12
Box 1. Examples of integrated multimodal transport hubs (cont')
King’s Cross and St Pancras International train stations, London: There has been over GBP 2.5 billion invested in transport infrastructure in King’s Cross over the past ten years (including significant upgrades to both King’s Cross and St Pancras International), providing commuters and visitors a variety of transport options to explore the city of London, and beyond to the wider United Kingdom and continental Europe. London’s five international airports (Heathrow, Gatwick, City, Stansted and Luton) are all within one hour travel, with direct connections to Heathrow, Gatwick and Luton.
St Pancras International station was originally opened in 1863, as a masterpiece of Victorian gothic architecture, and re-opened in 2007 as St Pancras International after painstaking restoration and renovation and the home of Eurostar high-speed rail services. The revitalised station is now a retail and hospitality destination in its own right; it provides free wifi and over 30 retail stores and over 20 food and beverage outlets to service both the travelling and general public. The station allows connections between:
• Underground - King’s Cross St Pancras underground station links six London Underground lines (Circle, Piccadilly, Hammersmith and City, Northern, Metropolitan and Victoria); making it the biggest interchange in the city.
• National and high-speed rail - St Pancras International is home to Eurostar which connects the United Kingdom to continental Europe by high-speed rail. There are direct services to Paris, Brussels and Lille. The Eurostar now carries more passengers than all the airlines combined on the same routes. In 2016 these routes will be complimented by high-speed rail to Germany and the Netherlands on the Inter City Express (ICE) trains. St Pancras and King’s Cross stations provide access to many of the United Kingdom’s major cities via the national rail network.
• Car/Taxi/Bus - Dedicated pick up and set down points and a long-stay car park are provided for private vehicles. In addition, there are four car rental companies and two dedicated taxi ranks. King’s Cross and St Pancras stations are served by 14 bus routes.
• Bicycle - The London bike sharing scheme has several docking stations in the King’s Cross area and a new bike interchange will be located between King’s Cross and St Pancras stations, making bike parking at the stations easy and secure (www.kingscross.co.uk/transport and www.stpancras.com).
The Plaza Castilla Interchange, Madrid: successfully redesigned in 2004, the the Plaza Castilla was one of five interchanges constructed as part of the Madrid Interchange Plan, developed and supervised by the local transport consortium Consorcio Regional de Transportes de Madrid. The interchange provides connections with sixty towns in the region and serves over 270 000 passengers every day. it has an underground terminal (over 3 levels) receiving dozens of regional bus lines using the A-1 motorway and the M-607, while a surface terminal is used for urban bus lines that service the north of Madrid. Buses enter and exit the underground terminal (completed in 2008) through tunnel entrances located approximately 1km from the Plaza. Two levels of the interchange are dedicated for buses with a total of 30 bays, while the other level provides seamless connection with three underground lines (1, 9 and 10). The interchange station also has a public car park with capacity for 450 vehicles, good accessibility and provides effective signage and real-time information for passengers. (www.metromadrid.es).
In fact, according to the Airports Council International (ACI), 43% of total airport revenues worldwide were generated by non-aeronautical activities in 2012. This integrated concept not only generates new sources of revenue for the operators but in certain circumstances can also position hubs as tourism attractions in their own right and, with ‘captive’ audiences, have the potential to showcase the heritage, arts and culture of the region and/or country (Box 2).
Intermodal and multimodal transport systems
13
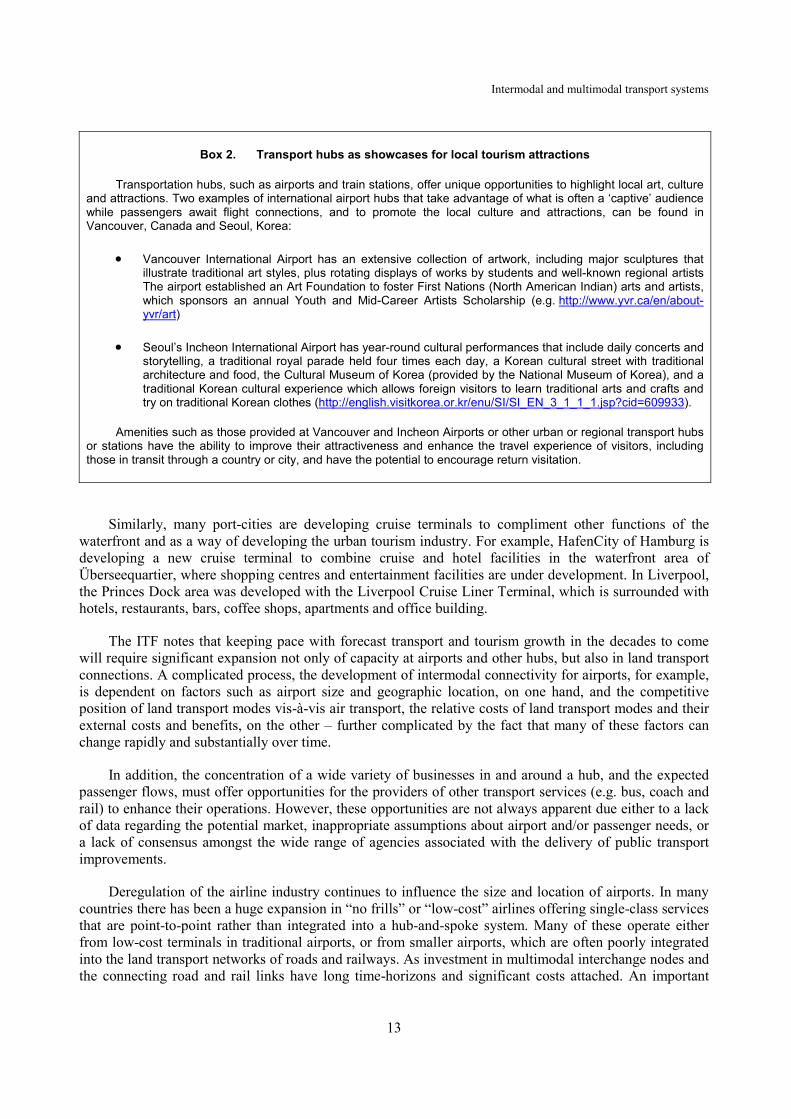
Box 2. Transport hubs as showcases for local tourism attractions
Transportation hubs, such as airports and train stations, offer unique opportunities to highlight local art, culture and attractions. Two examples of international airport hubs that take advantage of what is often a ‘captive’ audience while passengers await flight connections, and to promote the local culture and attractions, can be found in Vancouver, Canada and Seoul, Korea:
• Vancouver International Airport has an extensive collection of artwork, including major sculptures that illustrate traditional art styles, plus rotating displays of works by students and well-known regional artists The airport established an Art Foundation to foster First Nations (North American Indian) arts and artists, which sponsors an annual Youth and Mid-Career Artists Scholarship (e.g. http://www.yvr.ca/en/about-yvr/art)
• Seoul’s Incheon International Airport has year-round cultural performances that include daily concerts and storytelling, a traditional royal parade held four times each day, a Korean cultural street with traditional architecture and food, the Cultural Museum of Korea (provided by the National Museum of Korea), and a traditional Korean cultural experience which allows foreign visitors to learn traditional arts and crafts and try on traditional Korean clothes (http://english.visitkorea.or.kr/enu/SI/SI_EN_3_1_1_1.jsp?cid=609933).
Amenities such as those provided at Vancouver and Incheon Airports or other urban or regional transport hubs or stations have the ability to improve their attractiveness and enhance the travel experience of visitors, including those in transit through a country or city, and have the potential to encourage return visitation.
Similarly, many port-cities are developing cruise terminals to compliment other functions of the waterfront and as a way of developing the urban tourism industry. For example, HafenCity of Hamburg is developing a new cruise terminal to combine cruise and hotel facilities in the waterfront area of Überseequartier, where shopping centres and entertainment facilities are under development. In Liverpool, the Princes Dock area was developed with the Liverpool Cruise Liner Terminal, which is surrounded with hotels, restaurants, bars, coffee shops, apartments and office building.
The ITF notes that keeping pace with forecast transport and tourism growth in the decades to come will require significant expansion not only of capacity at airports and other hubs, but also in land transport connections. A complicated process, the development of intermodal connectivity for airports, for example, is dependent on factors such as airport size and geographic location, on one hand, and the competitive position of land transport modes vis-à-vis air transport, the relative costs of land transport modes and their external costs and benefits, on the other – further complicated by the fact that many of these factors can change rapidly and substantially over time.
In addition, the concentration of a wide variety of businesses in and around a hub, and the expected passenger flows, must offer opportunities for the providers of other transport services (e.g. bus, coach and rail) to enhance their operations. However, these opportunities are not always apparent due either to a lack of data regarding the potential market, inappropriate assumptions about airport and/or passenger needs, or a lack of consensus amongst the wide range of agencies associated with the delivery of public transport improvements.
Deregulation of the airline industry continues to influence the size and location of airports. In many countries there has been a huge expansion in “no frills” or “low-cost” airlines offering single-class services that are point-to-point rather than integrated into a hub-and-spoke system. Many of these operate either from low-cost terminals in traditional airports, or from smaller airports, which are often poorly integrated into the land transport networks of roads and railways. As investment in multimodal interchange nodes and the connecting road and rail links have long time-horizons and significant costs attached. An important

Intermodal and multimodal transport systems
14
question is whether recent changes in market structure will be long-lasting or whether a level of equilibrium is yet to be achieved. However, it is clear that the smaller the airports, and the greater their distance from trunk transportation lines, the harder it will be to contain or reduce the predominance of private cars in connecting air and land transport, with perhaps the exception of bus services to major centres. This is because other modes, such as trains, depend on a high level of activity, given their high fixed costs and economies of scale.
While air-rail connectivity may provide a range of mobility, economic, and environmental benefits, the financial cost of building or expanding these connections can be substantial. This is particularly the case for connections between high-speed rail and air, which can both complement and compete with one another. The International Union of Railways (UIC) suggests that high-speed rail can be an effective competitor to the airline industry for distances up to 800kms, with routes such as Barcelona-Madrid and London-Paris, for example, having proven to be a real alternative to scheduled air services. However, where high-speed and/or inter-regional rail services are available as an intermodal connection at international airports, the opportunities to distribute the economic benefits of tourism beyond major cities are increased. For example, Thalys (Belgium) and SNCF (France) have partnered with airlines to provide combined high-speed ‘Rail & Air’ tickets for travel between and departure from Brussels and Paris-Charles de Gaulle airports (and on to/from 12 other city destinations in France), which enables customers to simplify travel between France, Belgium and the rest of the world. Similarly, in 2015, Renfe (Spain) and Iberia launched a joint ticket combining a trip by AVE (high-speed train) from several locations in Spain to over 80 international destinations utilising the Iberia, Air Nostrum and Iberia Express networks. Rail-air intermodality illustrates clearly many of the challenges posed by intermobility, including the reservation and issuing of tickets valid for both modes of transport (compatible timetables and updating of availability etc.), the practical aspects of the journey itself (checking in, embarking, signage, baggage handling etc.), and administration (e-tickets, payment, real-time information etc.) (UIC 2011 and 2014).
A similar combined ticket is also being offered in Athens, Greece to provide a more convenient and seamless connection for passengers travelling by rail, with the railway operator, TrainOSE introducing the Trainotaxi service, which enables customers to purchase a door-to-door combined train and taxi service for services. In an example of a public-private initiative, Uber began a pilot programme with five cities in the US state of Florida in 2016. As part of this programme, and in an effort to boost ridership on inter-city rail services, eliminate concerns over parking availability, and provide greater accessibility for individuals unable to drive, the cities subsidise 20% of the cost of every trip beginning and ending within the city limits. In addition, all trips that begin or end at a SunRail station receive a 25% subsidy.
Despite the obvious benefits of air-rail connectivity, in 2005, the ITF noted that private car remained the dominant mode of travel to all types of airport and its share was increasing, even at airports with frequent rail connections, such as Gatwick in the United Kingdom. Public transport, as a share of total transport to and from airports, was greatest in metropolitan areas with airports relatively close to the city centre (e.g. Oslo, Zurich, Amsterdam and Munich). The average patronage of public transport was 21%, 12% for buses and 9% for rail connections. Taxis accounted for a higher share than the average public transport share (ECMT 2005), although it’s unclear what impact the emergence of service providers such as Uber has had on taxi’s share of total transport to and from airports in recent years.
The use of transport infrastructure is characterised by periods of excess capacity punctuated by peaks of excess demand. A key consideration for transport planners and operators of hubs, therefore, is whether the benefits of investing in additional forms of connectivity (air-rail, cycle-rail etc.) outweigh the often high financial cost involved. However, infrastructure expansion is not the only option to increase mobility and connectivity. There is room to more efficiently utilise existing infrastructure, although improvements are often dependent upon the availability of data on traffic, and user behaviour/preferences, combined with forecast demand. The availability of such data allows the development of new strategies to better co-
Intermodal and multimodal transport systems
15
ordinate scheduling, ticketing, payment and information provision, to influence user preference and ultimately direct passengers to travel off-peak or utilise modes of transport that they may not have otherwise considered (e.g. local or intercity bus, walking, cycling) to reach their final destination.
Investment in transport infrastructure
Insufficient investment in transport infrastructure has the ability to slow economic development. However, for many developed economies, with a well-developed and connected network of transport infrastructure, further investment in that infrastructure will not on its own result in economic growth, but rather investment needs to be targeted and demand driven.
It can be argued that three conditions must be present in order for investment in transport infrastructure to induce economic development. Transport investment such as a new interchange must be of a significant size in order to provide new accessibility and new connections between transport modes. There must be underlying positive economic externalities, such as agglomeration and labour market economies, and access to a high quality labour force at the local, regional or national level. The third condition is the existence of political willingness to implement complementary policies in order to provide a better environment and to boost the transport investment to generate economic development.
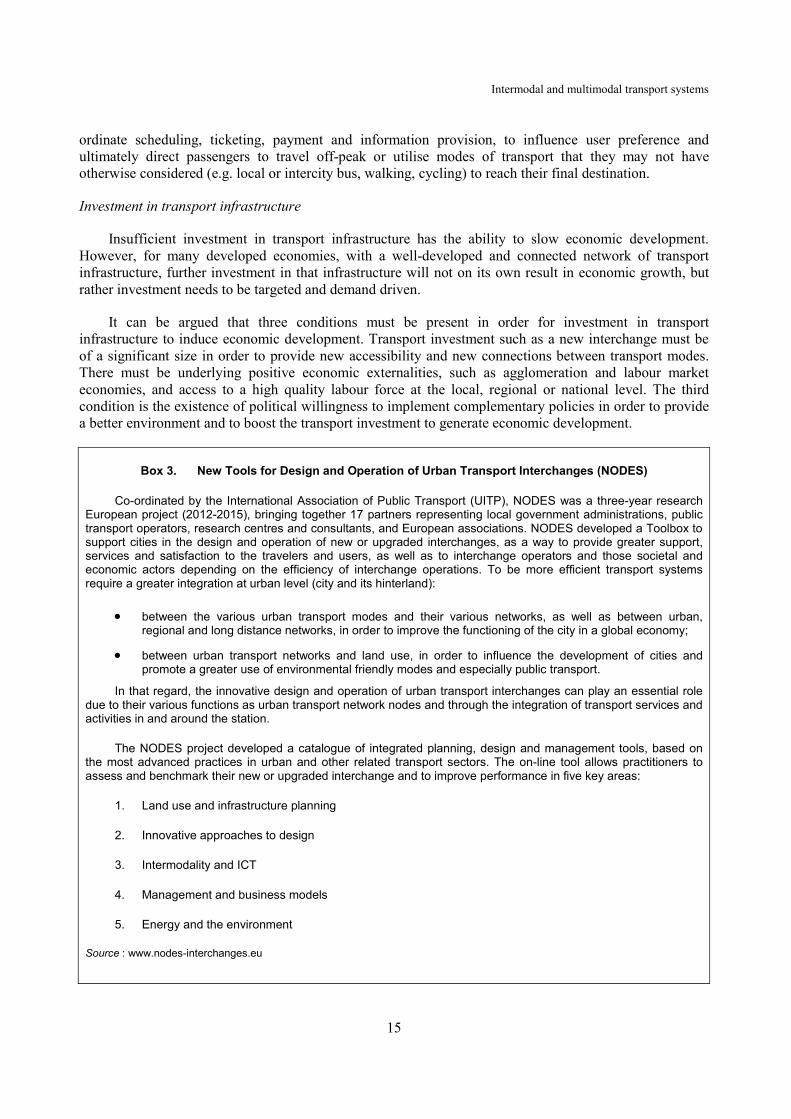
Box 3. New Tools for Design and Operation of Urban Transport Interchanges (NODES)
Co-ordinated by the International Association of Public Transport (UITP), NODES was a three-year research European project (2012-2015), bringing together 17 partners representing local government administrations, public transport operators, research centres and consultants, and European associations. NODES developed a Toolbox to support cities in the design and operation of new or upgraded interchanges, as a way to provide greater support, services and satisfaction to the travelers and users, as well as to interchange operators and those societal and economic actors depending on the efficiency of interchange operations. To be more efficient transport systems require a greater integration at urban level (city and its hinterland):
• between the various urban transport modes and their various networks, as well as between urban, regional and long distance networks, in order to improve the functioning of the city in a global economy;
• between urban transport networks and land use, in order to influence the development of cities and promote a greater use of environmental friendly modes and especially public transport.
In that regard, the innovative design and operation of urban transport interchanges can play an essential role due to their various functions as urban transport network nodes and through the integration of transport services and activities in and around the station.
The NODES project developed a catalogue of integrated planning, design and management tools, based on the most advanced practices in urban and other related transport sectors. The on-line tool allows practitioners to assess and benchmark their new or upgraded interchange and to improve performance in five key areas:
1. Land use and infrastructure planning
2. Innovative approaches to design
3. Intermodality and ICT
4. Management and business models
5. Energy and the environment
Source : www.nodes-interchanges.eu

Intermodal and multimodal transport systems
16
The impact of improved transport links on local and regional economies is context-specific and as such must be assessed on an individual basis. While not all transport investments will be equally effective in enhancing economic development and growth, the quality of transport links can affect the relative competitiveness of one area over another area, because of quality of life, lower costs to access resources and markets, and access to larger markets (Box 3). By improving safety or other aspects of the transport experience for users (including freight carriers or visitors to a region), transport investments can generate longer-term benefits (Heddebaut and Palmer, 2014; Banister and Berechman, 2001; New Zealand Ministry of Transport, 2016).
Influencing destination and regional development
While tourism is defined as the activities of persons travelling to and staying in places away from their usual place of residence for not more than one consecutive year for leisure, business and other purposes, it is much more than this definition suggests. Tourism involves a host community, a physical setting, accommodation, transport, built and natural attractions, commercial services and infrastructure, and it is the particular combination of these components that make a destination unique, and that contribute to its success and competitiveness. The choice of a destination for leisure tourists depends primarily on its attractiveness (e.g. natural, cultural, and local resources), but is also highly dependent on the costs and time necessary to reach the destination.
Transport, specifically, provides connections between regions (domestically and internationally), and links all other elements of tourism – attractions, accommodation and commercial services etc. – at destinations. Good accessibility is instrumental for the overall competitiveness of destinations. The provision of suitable infrastructure and adequate means of transportation are fundamental requirements to facilitate the mobility of tourists. In order for tourism to deliver on its potential as an engine for economic growth, it is dependent on multimodal transport systems that offer convenience, capacity, reliability and connectivity to suit specific destination types (e.g. integrated seaside resort, or small scale isolated eco lodge). The efficient operation of these transport systems directly reduces costs and opens up new opportunities for further tourism development.
Public transport hubs in cities and regions are designed for different purposes and scale but all play an important role in increasing access to cities and beyond. They can provide new functions and determine new roles for national rail and road network accessibility, creating significant opportunities for cities when connected by high-speed trains or motorways. They can play a very important role within the regional planning context providing new centralities for cities. For example, previously at the end of the French transport networks, Lille is now placed at the crossroads of the northern high-speed train network, and is, consequently, more central within the French transport network, with connections between different sub-regional areas and access to regional trains, intercity buses and even access to international services (Heddebaut and Palmer, 2014).
The market liberalisation of civil aviation since the 1970s is a clear illustration of transport’s ability to influence destination development (Graham, Papatheodorou, and Forsyth, 2008), with the overall effect of these policies being an increase in air services and passenger capacity. In addition, the emergence of low-cost and charter carriers has contributed enormously to the accessibility and range of destinations available. At a national level, the effect of these policies has enabled destinations (many supported by regional airports) and their local economies to grow. Many countries recognise the potential economic benefits associated with international air access to regional destinations. In Australia, for instance, the government’s Tourism Access Working Group (TAWG), developed awareness packages on the Government’s Regional Air Access initiative to encourage more international passenger services to regional airports.

Intermodal and multimodal transport systems
17
In many countries, and particularly those economies heavily dependent on international tourism, aviation policy and tourism policy are tightly bound. Tourism destinations that adopt a position as an aviation gateway and are well serviced by air connections and have access to a wide range of markets, can play an important role in stimulating the development of regional and national economies. In much the same way that air travellers can be enticed to spend a stopover in a hub destination, maritime transport policies can encourage the development of cruise hubs as gateways to port cities and into nearby destinations. Singapore is an example of a destination that has been successful at utilising the development of both aviation and cruise hubs to maximise the economic impacts of tourism (Box 4).
Box 4. Aviation and cruise hubs in Singapore as catalysts for tourism
Changi airport, as an aviation hub, has transformed Singapore into a significant destination by leveraging tourism/transport policy synergies. Opened in 1981, Changi airport is characterised by three factors critical to its transformation: i) strategic geographic location between markets, ii) good airport facilities, and iii) a high level of co-ordination of air schedules. The airport originally functioned as a node in long haul services between Europe and Asia. Aviation and tourism policy makers recognised that the high numbers of transit passengers moving through the airport represented significant potential for the development of tourism. However, the extent to which the airport hub could assist in the development of tourism, and stimulate the local economy was dependent upon the capacity of the destination to create the right environment for investment and the development of tourism infrastructure, services and facilities.
With visitor numbers, tourism receipts, room revenue and average length of stay showing consistent year on year growth. Singapore is now recognised as an important destination for leisure and business travel and not simply a transit node. This has been achieved through liberal air transport policy as a catalyst for aviation growth coupled with extensive development of hotels, resorts, retail precincts and attractions driven by the Singapore Tourism Board. The airport serves as a multimodal transport hub providing visitors with access to the city and beyond by train, bus, taxi or limousine.
Singapore’s approach to maximising synergies between aviation and tourism has also been extended to cruise tourism. Taking advantage of global growth in the cruise industry, Singapore has completed an upgrade of its existing terminal facilities and the development of new facilities. The Marina Bay cruise facility has the capacity to accommodate new generation cruise ships, and includes a terminal of 28 000 m2 with over 80 check-in counters and 27 coach bays to facilitate the mobility of visitors within the destination. The success of these developments clearly demonstrates the importance of considering tourism/transport policy synergies and taking a long term-approach to transport infrastructure planning and development.
However, apart for aviation, the link between tourism and transport policy is not always clear. For example, local public transport is often the mode of choice for tourists, with accessibility, cost, efficiency and other dimensions of service quality having important implications on the visitor experience. Yet network planning and scheduling is often undertaken with consideration only to residents’ needs and often only minimal attention is placed on the needs of visitors or their impact on demand (Albalate and Bel, 2010).
Tourism is a key element in promoting national and regional economies but it is a highly seasonal activity. As a result, demand and supply for transport services often don’t align, placing pressure on existing transport services and infrastructure, particularly at the local level. There is often overwhelming demand during high seasons, or during an event, followed by reduced demand in low seasons. Cities and regions are, therefore, faced with absorbing seasonal tourist flows while delivering adequate transport network performance. Many rural and particularly isolated tourism areas, with smaller populations and lower levels of year round travel demand, face additional challenges in the form of limited or no scheduled transport services from urban centres, and in providing and maintaining sustainable and seamless transport systems serving both locals and tourists in the long run.
Improving co-ordination between transport and tourism policy can improve visitor mobility to and within destinations, enhance visitor satisfaction, and help to secure the economic viability of local transport
Intermodal and multimodal transport systems
18
systems by servicing both residents and tourists. However, obstacles to improved co-ordination, and particularly in rural areas, include the fact that transport services are generally administered, purchased and financed by different authorities. However, if different institutional and management systems can be overcome, there is significant potential for savings and economies of scale through improved co-ordination, and for tourism to improve the performance of local and regional transport systems (Box 5).
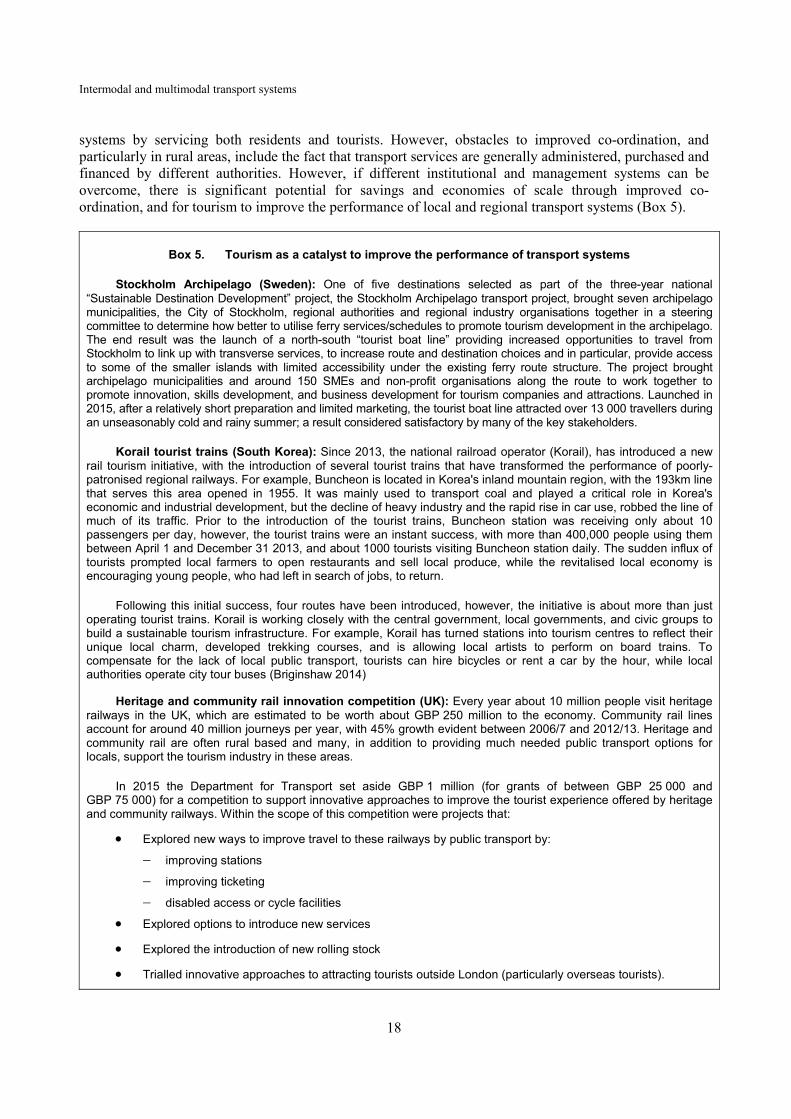
Box 5. Tourism as a catalyst to improve the performance of transport systems
Stockholm Archipelago (Sweden): One of five destinations selected as part of the three-year national “Sustainable Destination Development” project, the Stockholm Archipelago transport project, brought seven archipelago municipalities, the City of Stockholm, regional authorities and regional industry organisations together in a steering committee to determine how better to utilise ferry services/schedules to promote tourism development in the archipelago. The end result was the launch of a north-south “tourist boat line” providing increased opportunities to travel from Stockholm to link up with transverse services, to increase route and destination choices and in particular, provide access to some of the smaller islands with limited accessibility under the existing ferry route structure. The project brought archipelago municipalities and around 150 SMEs and non-profit organisations along the route to work together to promote innovation, skills development, and business development for tourism companies and attractions. Launched in 2015, after a relatively short preparation and limited marketing, the tourist boat line attracted over 13 000 travellers during an unseasonably cold and rainy summer; a result considered satisfactory by many of the key stakeholders.
Korail tourist trains (South Korea): Since 2013, the national railroad operator (Korail), has introduced a new rail tourism initiative, with the introduction of several tourist trains that have transformed the performance of poorly-patronised regional railways. For example, Buncheon is located in Korea's inland mountain region, with the 193km line that serves this area opened in 1955. It was mainly used to transport coal and played a critical role in Korea's economic and industrial development, but the decline of heavy industry and the rapid rise in car use, robbed the line of much of its traffic. Prior to the introduction of the tourist trains, Buncheon station was receiving only about 10 passengers per day, however, the tourist trains were an instant success, with more than 400,000 people using them between April 1 and December 31 2013, and about 1000 tourists visiting Buncheon station daily. The sudden influx of tourists prompted local farmers to open restaurants and sell local produce, while the revitalised local economy is encouraging young people, who had left in search of jobs, to return.
Following this initial success, four routes have been introduced, however, the initiative is about more than just operating tourist trains. Korail is working closely with the central government, local governments, and civic groups to build a sustainable tourism infrastructure. For example, Korail has turned stations into tourism centres to reflect their unique local charm, developed trekking courses, and is allowing local artists to perform on board trains. To compensate for the lack of local public transport, tourists can hire bicycles or rent a car by the hour, while local authorities operate city tour buses (Briginshaw 2014)
Heritage and community rail innovation competition (UK): Every year about 10 million people visit heritage railways in the UK, which are estimated to be worth about GBP 250 million to the economy. Community rail lines account for around 40 million journeys per year, with 45% growth evident between 2006/7 and 2012/13. Heritage and community rail are often rural based and many, in addition to providing much needed public transport options for locals, support the tourism industry in these areas.
In 2015 the Department for Transport set aside GBP 1 million (for grants of between GBP 25 000 and GBP 75 000) for a competition to support innovative approaches to improve the tourist experience offered by heritage and community railways. Within the scope of this competition were projects that:
• Explored new ways to improve travel to these railways by public transport by:
− improving stations
− improving ticketing
− disabled access or cycle facilities
• Explored options to introduce new services
• Explored the introduction of new rolling stock
• Trialled innovative approaches to attracting tourists outside London (particularly overseas tourists).
Intermodal and multimodal transport systems
19
Another area where governments at the national level can more efficiently utilise existing infrastructure to influence destination development by seeking to spread the economic benefits more widely and manage visitor impacts over time, is in the area of tourist routes. In its most basic guise, and utilising existing roads, tourist routes are a relatively low-cost approach, with four main steps: i) identify routes with high levels of natural or cultural attraction; ii) develop branding and identity; iii) implement a way-finding strategy and signage; iv) implement a marketing and communications strategy. From this position, and depending on their length, tourist routes can be further tailored by the development of rest areas or points of interest, or sub-route experiences (Box 6). One of the objectives for developing tourist routes is to invigorate villages and towns in those rural and regional areas with limited or no transport access other than by road, through increased demand for tourist services such as hotels and restaurants, and the wider supply chain opportunities to support these services.
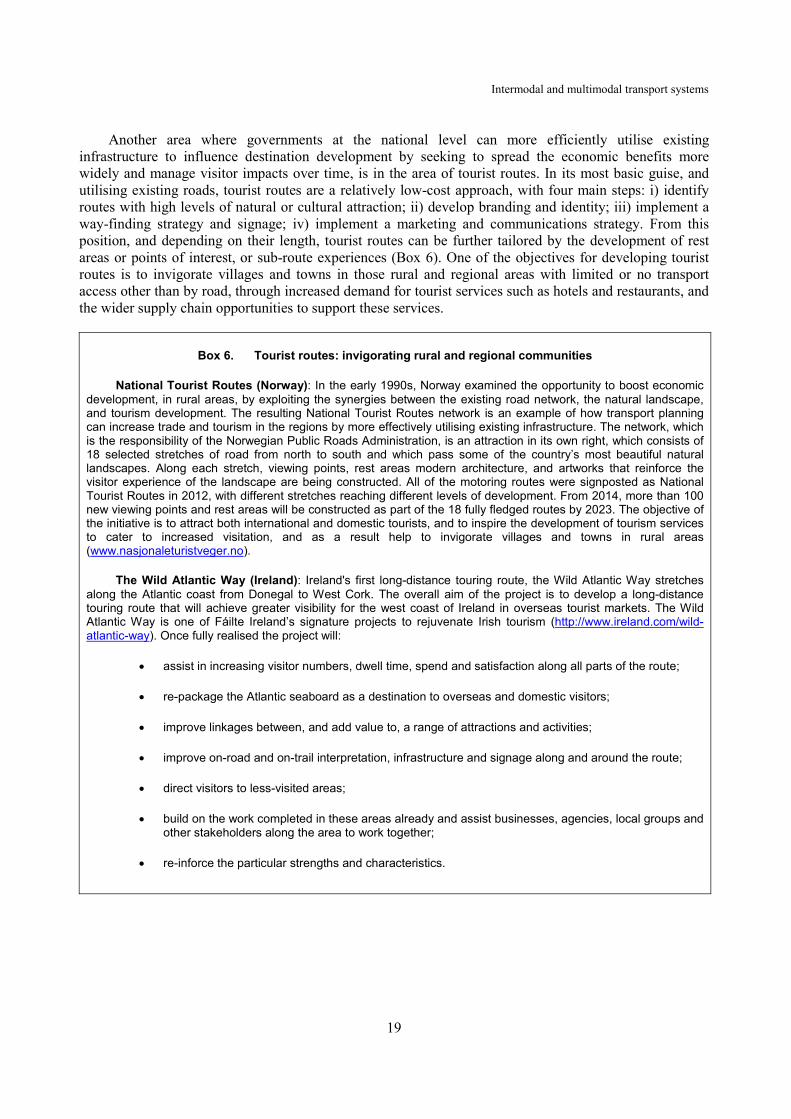
Box 6. Tourist routes: invigorating rural and regional communities
National Tourist Routes (Norway): In the early 1990s, Norway examined the opportunity to boost economic development, in rural areas, by exploiting the synergies between the existing road network, the natural landscape, and tourism development. The resulting National Tourist Routes network is an example of how transport planning can increase trade and tourism in the regions by more effectively utilising existing infrastructure. The network, which is the responsibility of the Norwegian Public Roads Administration, is an attraction in its own right, which consists of 18 selected stretches of road from north to south and which pass some of the country’s most beautiful natural landscapes. Along each stretch, viewing points, rest areas modern architecture, and artworks that reinforce the visitor experience of the landscape are being constructed. All of the motoring routes were signposted as National Tourist Routes in 2012, with different stretches reaching different levels of development. From 2014, more than 100 new viewing points and rest areas will be constructed as part of the 18 fully fledged routes by 2023. The objective of the initiative is to attract both international and domestic tourists, and to inspire the development of tourism services to cater to increased visitation, and as a result help to invigorate villages and towns in rural areas (www.nasjonaleturistveger.no).
The Wild Atlantic Way (Ireland): Ireland's first long-distance touring route, the Wild Atlantic Way stretches along the Atlantic coast from Donegal to West Cork. The overall aim of the project is to develop a long-distance touring route that will achieve greater visibility for the west coast of Ireland in overseas tourist markets. The Wild Atlantic Way is one of Fáilte Ireland’s signature projects to rejuvenate Irish tourism (http://www.ireland.com/wild-atlantic-way). Once fully realised the project will:
• assist in increasing visitor numbers, dwell time, spend and satisfaction along all parts of the route;
• re-package the Atlantic seaboard as a destination to overseas and domestic visitors;
• improve linkages between, and add value to, a range of attractions and activities;
• improve on-road and on-trail interpretation, infrastructure and signage along and around the route;
• direct visitors to less-visited areas;
• build on the work completed in these areas already and assist businesses, agencies, local groups and other stakeholders along the area to work together;
• re-inforce the particular strengths and characteristics.

Intermodal and multimodal transport systems
20
Box 6. Tourist routes: invigorating rural and regional communities (cont')
Nga Haerenga, the New Zealand Cycle Trail (NZCT): The NZCT was established in 2009 with the aim of addressing the economic downturn by stimulating regional economies and creating jobs and new tourism flows. The Government has since contributed NZD 54 million, with a further NZD 30 million from local communities to create 23 off-road cycle trails, covering some 2 500 km. A rigorous assessment and selection process was used to determine which regions received funding for trails, with selection influenced by the ability to showcase landscapes, culture and heritage. Sixteen trails are now complete, creating 1 200 jobs during the construction phase, and many ongoing economic benefits including the creation of new business opportunities in the form of cafes, cycle shops, transport operators and accommodation providers. Trail use has grown rapidly, with a 56% growth in the year ended January 2014 and 97 000 recorded users in the month of January 2014 alone, many of whom were overseas visitors. Governance of the NZCT has now passed from the Ministry of Business, Innovation and Employment, to an independent, membership-based organisation, although the Ministry continues to administer an ongoing fund to maintain and enhance the trail infrastructure.
EuroVelo Cycle Routes: The European Cyclists’ Federation is co-ordinating the development of a network of high-quality cycling routes that connect 46 countries across Europe. The routes promote economically, environmentally and socially sustainable travel and can be used by long-distance cycle tourists, as well as by local residents making daily journeys. EuroVelo currently comprises 14 routes and it is envisaged that when complete (approximately 2020), the network will total over 70 000 km. At 10 400 km, EuroVelo route 13 – the Iron Curtain Trail – is the longest route, while EuroVelo route 15 – the Rhine route – is the first to be awarded the European Route Certification Standard, ensuring an exemplary level of infrastructure throughout (http://www.eurovelo.com).
Influencing more sustainable transport choices
Sustainable transportation planning recognises the integrated nature of human activities and therefore the need to balance economic, social and environmental objectives (Figure 3). It strives to ensure that individual, short-term planning decisions support strategic, long-term goals.
Figure 3. Components of sustainable transport
Source: Litman and Burwell (2006)
EconomicEfficient mobility
Local economic developmentOperational efficiency
SocialSocial Equity (Fairness)
Human safety and healthAffordability
Community cohesionCultural preservation
EnvironmentalAir, noise and water pollution reductions
Climate change emissionsResource conservation
Open-space preservationBiodiversity protection

Intermodal and multimodal transport systems
21
This has important implications for tourism transport planning. To be sustainable, tourism transport must be resource efficient, sensitive to cultural and environmental impacts, and benefit (or at least avoid harming) disadvantaged groups. Sustainable transport planning should:
• reflect comprehensive evaluation which considers all significant economic, social and environmental impacts, including those that are long-term, indirect and non-market;
• favour win-win solutions, which help solve multiple problems, such as congestion reduction strategies that also help reduce parking problems, and emission reduction strategies that improve mobility options for non-drivers;
• apply accessibility-based analysis, which recognises the important roles that walking, cycling and public transportation can play in an efficient and equitable transport system, and the impacts of land use factors such as development density and mix;
• favour resource-efficient modes (walking, cycling and public transport), transportation demand management, and smart growth land use policies that help increase transport system efficiency;
• apply least-cost planning, which implements the most efficient solutions to transportation problems, considering all impacts.
By promoting the development of intermodal hubs and gateways, transport policies can be used to attract, manage or direct visitor flows to particular destinations, and facilitate change to eco-friendly transport options, which can help consolidate a destination’s reputation as sustainable. For example, in Austria, the government has introduced a range of initiatives aimed at improving accessibility, connectivity and transport for tourists, including conferences and workshops designed to improve the linkage between tourism and (sustainable) transport and the organisation of a yearly “Tourism-Mobility-Day”, bringing together three ministries (the Federal Ministry of Agriculture, Forestry, Environment and Water Management, the Federal Ministry of Science, Research and Economy, and the Austrian Ministry for Transport, Innovation and Technology) and tourism and transport service providers such as the federal railways (ÖBB), to promote the development and implementation of sustainable mobility solutions.
However, if transport and tourism development strategies are not well synchronised, destinations may not be able to accommodate actual or potential visitor numbers and flows, and mobility around the destination will be restricted decreasing the quality of visitor experiences. Making public transport easier to use by tourists and encouraging greater use of human powered mobility options (e.g. bicycles, walking) can help to mitigate negative environmental impacts and manage seasonal peaks. However, the environmental impact of long distance transport remains a significant challenge.
Transport systems and services themselves can be at the heart of tourist activities. This includes sustainable tourism based around rail, walking and cycling. In Switzerland, the benefits for both visitors and service providers of promoting sustainable mobility options are widely recognised. With virtually no detectible emissions, the extensive non-motorised transport network, SwitzerlandMobility has helped to enhance the perception of Switzerland as an “environmentally friendly” destination, offering tourism service providers access to a promising new market. The rediscovery of human powered mobility as form of transport and tourism is growing significantly and shifting tourism from traditional urban locations to natural sites. The promotion of this new form of tourism requires close collaboration between transport providers, and local and regional authorities to provide the appropriate infrastructure, services (including the provision of space for bicycles on trains and buses), connectivity, signage on walking and cycling routes, attractions and accommodation options. Ensuring good linkages (information and physical connections) with traditional transport services for intercity travel is fundamental to encouraging a sustainable and also memorable tourism experience (Box 7).
Intermodal and multimodal transport systems
22
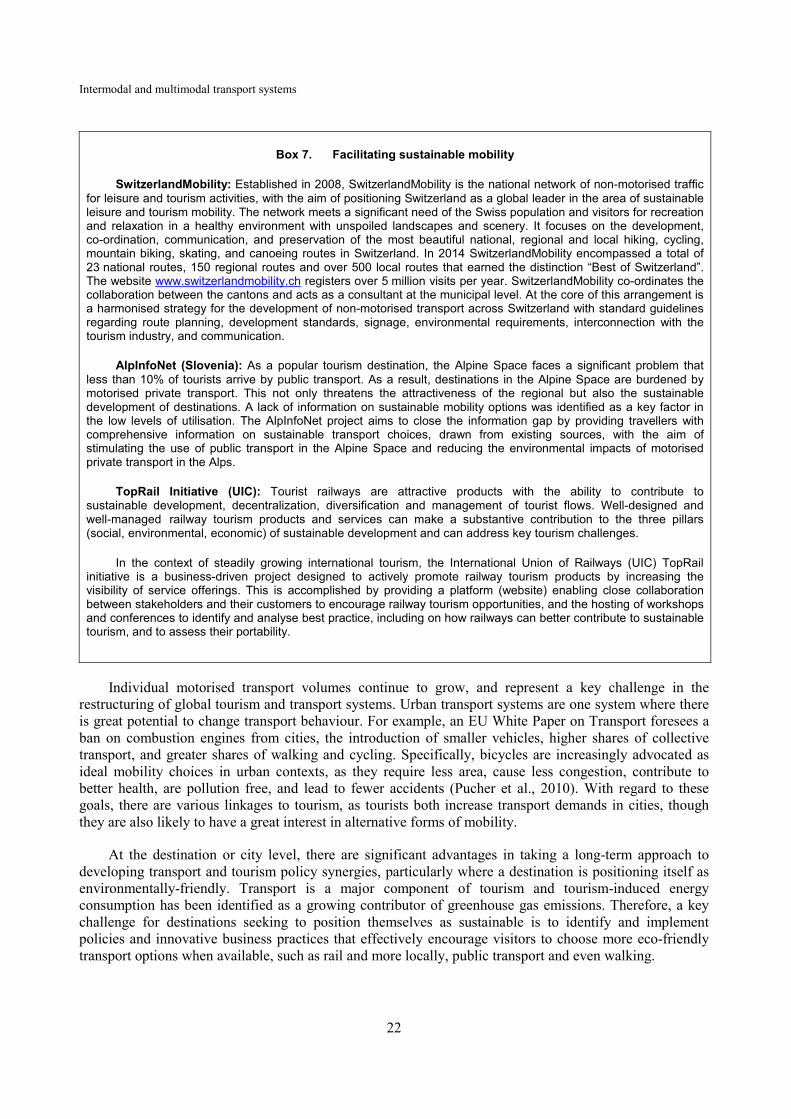
Box 7. Facilitating sustainable mobility
SwitzerlandMobility: Established in 2008, SwitzerlandMobility is the national network of non-motorised traffic for leisure and tourism activities, with the aim of positioning Switzerland as a global leader in the area of sustainable leisure and tourism mobility. The network meets a significant need of the Swiss population and visitors for recreation and relaxation in a healthy environment with unspoiled landscapes and scenery. It focuses on the development, co-ordination, communication, and preservation of the most beautiful national, regional and local hiking, cycling, mountain biking, skating, and canoeing routes in Switzerland. In 2014 SwitzerlandMobility encompassed a total of 23 national routes, 150 regional routes and over 500 local routes that earned the distinction “Best of Switzerland”. The website www.switzerlandmobility.ch registers over 5 million visits per year. SwitzerlandMobility co-ordinates the collaboration between the cantons and acts as a consultant at the municipal level. At the core of this arrangement is a harmonised strategy for the development of non-motorised transport across Switzerland with standard guidelines regarding route planning, development standards, signage, environmental requirements, interconnection with the tourism industry, and communication.
AlpInfoNet (Slovenia): As a popular tourism destination, the Alpine Space faces a significant problem that less than 10% of tourists arrive by public transport. As a result, destinations in the Alpine Space are burdened by motorised private transport. This not only threatens the attractiveness of the regional but also the sustainable development of destinations. A lack of information on sustainable mobility options was identified as a key factor in the low levels of utilisation. The AlpInfoNet project aims to close the information gap by providing travellers with comprehensive information on sustainable transport choices, drawn from existing sources, with the aim of stimulating the use of public transport in the Alpine Space and reducing the environmental impacts of motorised private transport in the Alps.
TopRail Initiative (UIC): Tourist railways are attractive products with the ability to contribute to sustainable development, decentralization, diversification and management of tourist flows. Well-designed and well-managed railway tourism products and services can make a substantive contribution to the three pillars (social, environmental, economic) of sustainable development and can address key tourism challenges.
In the context of steadily growing international tourism, the International Union of Railways (UIC) TopRail initiative is a business-driven project designed to actively promote railway tourism products by increasing the visibility of service offerings. This is accomplished by providing a platform (website) enabling close collaboration between stakeholders and their customers to encourage railway tourism opportunities, and the hosting of workshops and conferences to identify and analyse best practice, including on how railways can better contribute to sustainable tourism, and to assess their portability.
Individual motorised transport volumes continue to grow, and represent a key challenge in the restructuring of global tourism and transport systems. Urban transport systems are one system where there is great potential to change transport behaviour. For example, an EU White Paper on Transport foresees a ban on combustion engines from cities, the introduction of smaller vehicles, higher shares of collective transport, and greater shares of walking and cycling. Specifically, bicycles are increasingly advocated as ideal mobility choices in urban contexts, as they require less area, cause less congestion, contribute to better health, are pollution free, and lead to fewer accidents (Pucher et al., 2010). With regard to these goals, there are various linkages to tourism, as tourists both increase transport demands in cities, though they are also likely to have a great interest in alternative forms of mobility.
At the destination or city level, there are significant advantages in taking a long-term approach to developing transport and tourism policy synergies, particularly where a destination is positioning itself as environmentally-friendly. Transport is a major component of tourism and tourism-induced energy consumption has been identified as a growing contributor of greenhouse gas emissions. Therefore, a key challenge for destinations seeking to position themselves as sustainable is to identify and implement policies and innovative business practices that effectively encourage visitors to choose more eco-friendly transport options when available, such as rail and more locally, public transport and even walking.

Seamless transport to enhance the visitor experience
23
The International Association of Public Transport (2016) highlights that facilitating and coordinating different forms of human powered mobility, such as cycling and walking, with public transport is mutually beneficial. Doing so not only encourages more bicycling and walking, but it also encourages greater use of public transport. Access to public transport helps cyclists and pedestrians make longer, more complex trips and can also provide convenient alternatives when people encounter bad weather, difficult topography, gaps in the bikeway network and mechanical failures, all of which are particularly important for tourists wishing to utilise active travel modes.
In Copenhagen the city has sought to involve tourism in its vision of a bicycle city, with specific brochures addressing visitors. Bicycle tours are also available, and the city’s free bike system is very popular, with an estimated half of all available bikes used by tourists. Notably, an increase in cyclists also changes the character of the city, which becomes more relaxed, less noisy, less polluted – all attributes making Copenhagen a more attractive tourism destination (Gössling, 2013).
Similarly, tourism businesses can also encourage customers to make sustainable transport choices by offering incentives to utilising public transport and/or resource efficient transport modes. For example, in Vienna, the Boutique Hotel Stadthalle, markets itself as “the world’s first city hotel with a zero-energy balance”, and offers a 10% Green Bonus (discount) to guests arriving at the hotel via eco-friendly transport (e.g. train, electric vehicle, bicycle – not including public transport from the airport). The hotel stores bicycles and recharges guests electric vehicles free of charge, and also uses local, organic food and rents out bicycles and electric scooters for the use of guests.
Seamless transport to enhance the visitor experience
Tourists, like any other users of the transport system, seek to move safely from origin to destination with an adequate trade-off between speed, comfort and cost. In an ideal world, tourists could complete this travel using a single mode of transport point to point. While certainly the preferred option for tourists, this outcome may not be compatible with the structure of the available transportation network and therefore, tourists are forced to add one of more intermodal connections. The aim, therefore, from a tourism transport planning perspective, is to minimise connections and where necessary, make them as efficient as possible. For example, multimodal transport hubs should enable users (both commuters and tourists) to make their way from one mode of transport to another as quickly as possible while at the same time providing a positive traveller experience. Comfort, the availability of a wide variety of services, and detailed on-time information and accessibility all play a key role in creating a seamless experience where passenger flows meet and disperse at transport interchanges.
While almost every trip starts and ends with walking, and most involve one or several other modes, transport is rarely organised along the lines of one single, seamless, door-to-door transport experience. Arguably, private vehicles (cars and motorcycles) most closely approach the “seamless transport” ideal and this goes some way to explaining their enduring attraction. In reality, providing a seamless transport experience is more a function of adapting infrastructure, operations, fare structures and payment systems, and providing the necessary information to deliver a more convenient travel experience. Countries are increasingly recognising that the visitor experience and perceptions of the destination are influenced from the moment international tourists disembark at their point of arrival. In response, many countries are modifying entry processes to enhance the passenger experience while maintaining or improving security at borders (Box 8).
Seamless transport to enhance the visitor experience
24
Box 8. Improving the passenger arrival experience at borders
Australia/New Zealand: SmartGate is a two-step automated passenger clearance system that is available to Australian and New Zealand ePassport holders over 16 years of age: i) arriving at and leaving major international airports in New Zealand; and ii) arriving at Australia’s eight international airports. At special kiosks, SmartGate reads a microchip embedded in ePassports to validate the passport. At the SmartGate gate biometric data and photo-matching technology are used to confirm that the passenger is the passport holder to provide accurate and fast automated clearance. It takes SmartGate users 17 minutes on average from leaving the plane to clearing passport control, compared with 20 minutes for non-SmartGate users. Passengers are subject to the same alert or watch list checks as for manual processes.
United States: In 2015, the United States Department of Commerce (DOC) and Homeland Security (DHS) launched a new national goal to “provide a best-in-class international arrivals experience, as compared to our global competitors, to an ever-increasing number of international visitors.” To meet the new national goal, the DOC and DHS are establishing an interagency task force, co-chaired by the Deputy Secretaries of both agencies, that will leverage the expertise of industry stakeholders to identify the key factors that drive a traveller’s perception of the international arrivals experience – from the moment they step off the plane, through primary passport inspection, until they collect their bags and exit through final baggage inspection – and how it influences decisions to travel to the United States. A range of other initiatives to facilitate smoother arrivals for international travellers to the United States, include:
• Developing and implementing new Action Plans at 17 of the largest international airports – accounting for nearly three out of four international travellers to the United States – to improve the arrivals process for international travellers.
• Announcing USD 20 million in public-private partnerships supporting the Airport Action Plans to install 340 additional automated passport control kiosks that reduce wait times by up to 30%.
• The DHS taking steps to improve the arrivals process at all airports, including eliminating the need for air passengers to complete the paper 6059b Customs Declaration form upon arrival by the end of 2016.
It may be argued that convenience is related to ‘absence of effort’ in utilising transport services that are ‘fit for purpose’ in the way they are operated. Key to improving the convenience and seamlessness of public transport and more broadly multimodal transport systems, is minimising i) walking time at any stage of the journey; ii) waiting time, including time spent transferring between services or modes; iii) being bound to scheduled/limited services; iv) having to transfer within or between modes; v) variability in travel time; vi) a lack of relevant information, and; vii) crowding (Wardman 2014).
The issue of convenience is important to a variety of stakeholders including existing and potential public transport users, policy makers and regulators, funding bodies, and operators for the following reasons (Wardman 2014):
• It is a significant element of the overall attractiveness of public transport, directly impacting on the wellbeing of travellers;
• Poor performance provides a significant barrier to use, thereby thwarting policy efforts to switch more people to sustainable modes of travel;
• There are ever-rising expectations for convenience;
• Improving convenience is particularly important in efforts to attract discretionary travellers, such as those who would otherwise drive, to public transport, and therefore contribute to strategic planning objectives to reduce traffic and parking congestion, vehicle accidents and pollution emissions;

Seamless transport to enhance the visitor experience
25
• There is a relationship between improved convenience and the financial performance of public transport;
• Transportation planning in practice often involves trade-offs between public transport convenience and other objectives.
The core challenge in providing seamless urban mobility is overcoming the mismatch between the way in which customers approach trips – as single, end-to-end journeys – and the way in which transport authorities plan and allocate resources to various networks. As such, achieving seamless transport is as much a function of moving minds as it is moving people; whether they are commuters, or tourists visiting a city, region or country.
Improving planning and co-ordination among levels of governments and across ministries is crucial in order to provide well connected transport modes and more seamless transport services, to meet the needs of all user groups. In the post global financial crisis era, limited public or private finances remain available to invest in transport infrastructure. This has resulted in a shift in transport policy, with a greater focus on maintaining existing infrastructure, complimented by low-cost improvements, including integrated ticketing, installing wifi in public transport, providing better information, better accessibility, combined payment/smart cards, co-ordinated scheduling, cross-mode reservations and even developing co-located exchange facilities.
There are very sensible reasons why modal operators should focus only on their own mode, however, from a tourism policy perspective there are significant benefits in taking a horizontal approach to understand and improve intermodal connections in order to facilitate access to destinations, and enhance the visitor experience. Tourism at the destinations level requires an efficient, integrated transport system that responds to diverse tourist, employee and freight travel demands. This does not necessarily require special facilities or services, as tourists typically use the same airports, roads, footpaths, taxis and public transport services as local residents. However, tourists have a variety of special needs that can impact the overall visitor experience and where possible should be considered, including: convenient multimodal transport options to reach their final destination; efficient connections between interregional and local modes; integrated ticketing; multilingual user information and signage; baggage transfers and storage, and; increasingly ease of access based on universal design principles.
The following areas of focus can help ensure that transport systems respond to the increasingly diverse demands of customers and provide a positive and seamless transport experience for tourists and locals alike.
Network design
Network design is a fundamental aspect that needs to be carefully considered to provide a seamless transport experience, particularly because public transport exhibits network economies. This means that the unit cost of delivering a service decreases as the number of passengers increase. A careful public transport network design that exploits network economies can help turn a ‘vicious cycle’, where declining demand translates into less convenient service, into a ‘virtuous cycle’, where higher demand allows better, more seamless services and where routes and timetables of various modes (e.g. train and bus) are co-ordinated with each other to provide convenient transfer services.
For example, when adding one more buses on a particular link (e.g. one which connects a major intercity transportation hub to a specific tourist destination or area with a high concentration of hotels), the frequency of service rises for all passengers using the route, including locals, and waiting and transfer times decline. Similarly, adding stops reduces walking times, and using bigger buses saves on operating
Seamless transport to enhance the visitor experience
26
costs per passenger. Opportunities to reap network benefits are often missed, perhaps because of a lack of focus on cost-effectiveness in the network design stage.
There are two kinds of approach for linking one place to another in a public transport network: hub-and-spoke and point-to-point. In general, passengers may be better off if they can travel without transfer, based on the point-to-point approach, but services may be less frequent unless there is enough demand. On the other hand, the hub-and-spoke approach can share trunk lines and provide frequent services between hubs. However, this is not always economically viable because it implies higher investment as well as operation costs and it cannot respond flexibly to changing demand.
Developing the surrounding environment and providing facilities for a range of transport modes (including, walking, cycling/bike scheme, local buses and rental or private cars) can enhance access to public transport terminals. In particular, bike- and car-sharing programmes can significantly improve access while integrating public transport terminal development with land-use planning can also contribute to improved accessibility.
Information provision
In addition to good accessibility, efficient connections between modes, and convenient baggage accommodation and traveller services, tourists’ require convenient user information and signage. From the point of arrival until the return departure, tourists in general, suffer from a transport information deficit when compared to local residents. Whether due to a lack of familiarity with the surroundings or a language barrier, tourists require additional assistance to navigate their way around or between different transport networks.
Box 9. “Next Stop Paris” smartphone app
Next Stop Paris (Formally Visit Paris by Metro) is a smartphone app, which is available free of charge and provides access to a wide range of services that help visitors utilise the Paris metro and wider public transport system with confidence during their stay. An initiative of the RATP (Régie Autonome des Transports Parisiens/Autonomous Operator of Parisian Transports), the app is fully translated into ten languages (English, German, Dutch, Italian, Spanish, Japanese, Chinese, Brazilian Portuguese and Russian), with most of the app’s functionalities accessible offline, increasing the convenience for those not wishing to utilise data roaming. For example the app allows the user to:
• find out about the various types of tickets issued by the RATP and, using the simulator, choose the most suitable ticket for each journey;
• access information on tourist attractions, the metro system, and transfers to railway stations and airports (available offline);
• check railway routes (available offline) and calculate itineraries from metro stations to key tourist locations;
• access useful phrases translated into English, German, Italian, Spanish, Dutch and Japanese, such as “Excuse me, where is the Metro?” and “I want to buy a ticket to ”.
The application also provides information on many top tourist attractions, with visuals, descriptions, websites, and phone numbers. It also presents the Paris Visite travel pass’ 13 partners, and the advantages offered to passholders. The application can also be used to share information via Facebook (www.ratp.fr/en/ratp/r_90747/next-stop-paris/).
In response to this need, local authorities and transport operators can provide clear information on ticketing and payment options, way-finding travel guidance, including websites, smartphone apps, maps, guidebooks, and signage in predictable locations such as airports, railway and bus stations, walking trails, and roads, that both help visitors to navigate new and unfamiliar surrounds and feel welcome. As much as
Seamless transport to enhance the visitor experience
27
possible, signage should use symbols rather than words, and translate information into multiple languages to accommodate people with limited communications abilities (Box 9). Real-time information, such as in-transit announcements provided in multiple languages and indicating the next stop and how to access local attractions, can also help tourists to confidently navigate a city or region. Similarly, information provided on public transport web-sites and mobile applications, which highlight journey times and/or CO2 emissions utilising alternative forms of transport, can help locals and visitors to make informed transport decisions.
Effective signage and way-finding in urban areas has the potential to provide win-win solutions for policy makers, because by making walking (and even cycling in those cities with bicycle hire schemes) more convenient and attractive for visitors, it encourages the use of these resource-efficient modes, and as such helps achieve multiple planning objectives. These include reduced congestion on roads and public transport, energy conservation and pollution emission reductions, while at the same time enhancing the visitor experience and increasing opportunities for greater visitor expenditure on local attractions and in local retail stores. For example, Legible London is city-wide pedestrian way-finding system with more than 1 300 signs designed to encourage visitors to navigate the city by foot. It has won multiple design awards and has become a model for other cities (Box 10).
Box 10. “Legible London” way-finding system
Legible London is a city-wide pedestrian way-finding system managed by Transport for London. It provides an integrated set of maps and signs with distinctive and intuitive design features. These include freestanding signs, called ‘monoliths’, located at tube stations and bus shelters. These signs are topped with a distinctive yellow beacon cap and walking person icon. These features makes the signs easy to spot within the urban environment and when viewed from a distance. Each monolith has two maps, a finder map which displays a 5-minute walking circle, and a planner map which displays a 15-minute walking circle. The maps illustrate significant landmarks in 3D, helping users identify the urban environment and also serving as ‘mental navigational tools’. Both planner maps and finder maps are ‘heads–up’ (as opposed to ‘north–up’), which many people find easier to use. (www.tfl.gov.uk/info-for/boroughs/legible-london)
For some countries, road safety for visiting drivers is a serious issue, whether as a result of tourists driving in unfamiliar territory or conditions, or simply driving on the opposite side of the road to that which they are familiar. In response, countries can take a variety of steps to address this issue, including information provision and educating drivers to the potential risks. In Iceland, for instance, the sheer growth in tourism numbers in recent years has had an impact on road safety as a large number of visitors rent vehicles, and particularly during the winter when most tourists do not have experience in driving on icy roads. As a result, improving road safety for foreign tourists has become a priority in Iceland with traffic signs to be improved, particularly at narrow (i.e. one-lane) bridges, and safety recommendations to be given at car rental desks. Similarly, in New Zealand the Visiting Drivers Project, was established with the aim of improving road safety for all road users including visitors (both domestic and international), while maintaining New Zealand’s reputation as an attractive and safe tourist destination (OECD/ITF 2016) (Box 11).

Seamless transport to enhance the visitor experience
28
Box 11. Information provision for driver safety
The New Zealand Visiting Drivers Project was established in March 2014 under the Signature Programme which is part of the government’s road safety strategy to 2020, Safer Journeys. The project is led by the NZ Transport Agency on behalf of the government.
The purpose of the project is to improve road safety for and of, domestic and international visitors, while maintaining New Zealand’s reputation as an attractive and safe tourist destination. The project aims to reach all international visitors to New Zealand (and domestic visitors where appropriate) when they’re planning, booking, in-flight, on arrival, and when driving on New Zealand’s roads. The project has a roads and roadside focus in Otago, Southland and the West Coast where international visiting drivers make up a significantly large proportion of the summer traffic.
Together, the fifteen project partners from all levels of government and industry developed an action plan with a package of short, medium and long-term initiatives intended to strengthen all parts of the road transport system – safe vehicles, safe speeds, safe roads and roadsides, and safe users – and complement each other to collectively achieve a more beneficial impact.
The initiatives cover the entire tourism supply chain: planning, booking, in-flight, arrival and journey, reflecting New Zealand’s key host responsibilities to:
• ensure drivers are well informed; they have made good choices based on driving experience, correct travel times, speeds, road types and conditions; and have chosen a suitable vehicle and are prepared for New Zealand driving conditions
• ensure roads and roadsides support a safe journey and experience, with good rest spots and opportunities for photography stops, and increased safety measures on key tourist routes to protect all road users when a mistake on the road happens
• ensure New Zealand actively looks after its visitors, supporting them to enjoy their experience, and to rescue and care for them when crashes occur.
Source : New Zealand Transport Agency (www.saferjourneys.govt.nz)
Information and communications technology
Digital platforms now play a significant role in bringing together end consumers and transport providers, using the power of digitalisation to enable new user experiences and create networked mobility. This also provides the chance for transport providers to access new customers, not just digital natives and young people used to doing everything with their smartphone, but all travellers, including occasional users of public transport, and tourists. For instance, this has led to the emergence of a range of online and app-based tools enabling users to identify the quickest and/or most environmentally friendly intermodal transport options. Ecopassenger (www.ecopassenger.org) and Green Travel Choice (www.greentravelchoice.com) are examples of tools enabling users to measure the energy consumption of an intermodal journey, and identify the most efficient routes. The increased availability and use of transport based smartphone apps enables users to plan or change their journeys en route and react to information that they receive in real-time.
The emergence of transportation network companies providing a platform for matching drivers and passengers and of other, less formal, ride sharing approaches, including car-pooling, ride-hailing and bike-sharing, are revolutionising how mobility is provided. For example Uber, Lyft and Blablacar are among the most prominent transformative models in the tourism sector (OECD 2016). Car-sharing platform Uber operates in over 400 cities worldwide and was valued at approximately USD 62.5 billion in January 2016; it is one of the most lucrative start-up firms in history. Uber has gained prominence with business

Seamless transport to enhance the visitor experience
29
travellers, while car-pooling platform Blablacar caters to the leisure market and inter-city travellers. These services facilitate the movement of people and offer an alternative to, and may lead to improvements in, taxi and other transport services, particularly where supply or quality is inadequate.
Sensor-generated data, largely via the growth in mobile phones, on-board navigation devices and vehicle-to-vehicle communication, typically provides both a geospatial and temporal component allowing for a more detailed understanding of where people are at any given time, where and when they are travelling, and in some cases the mode of transport and purpose. An innovative example of the potential application of this data can be seen in New Zealand’s Visiting Drivers Project, where a trial of Bluetooth technology began in July 2016 on one of the main tourist routes in the South Island between Christchurch and Queenstown. Around 50 roadside transmitters are being installed on the main highway to send real-time safety messages to visiting international drivers using dedicated devices fitted to rental vehicles from participating companies.
Integrated ticketing/smart cards
To improve traveller convenience (both commuters and tourists), many jurisdictions are creating integrated electronic payment systems, including smart card and mobile phone apps, which can be used to pay for various transport services, including public transportation, taxis, parking and tolls, and attractions such as museums and recreation centres. For example, a fully integrated multimodal transport app encompassing all of the city and public transport networks in Finland was launched in the summer of 2016. The Whim app (http://maas.global/our-solutions/), allows users to plan their route and purchase their tickets via bus, train, bike, taxi or through an agreement with a participating hire car company.
From a purely transport perspective, smart cards are creating new opportunities to plan and manage transport systems and can help strike a balance between providing affordable services and attaining financial sustainability, for example enabling subsidies to be directed to those most in need. Electronic ticketing with smart cards has reduced waiting times in front of ticket offices and machines to buy paper tickets, and reduced boarding times on buses. A major benefit of smart cards is that, unlike conventional paper tickets, they allow operators to know where, when, and how people travel. Using this information, operators can optimise services according to anticipated travel demand. E-ticketing continues to evolve, and while available in some cities now, will likely become more integrated into bank cards (e.g. on Transport for London services) and smartphones (e.g. Madrid – currently in pilot phase). In the future it is likely that users will not need to hold separate smart cards for public transport and will pay credit card or smart phone bills that include ticketing costs.
Potential synergies between tourism and local transport are also well demonstrated in the development of destination smart cards (e.g. also known as welcome cards, adventure cards and city cards), as outlined in Box 12. Widely available in many large cities in Australia, Europe, the United States, and some destinations in Asia and Africa, some destination smart cards offer an integrated ticketing system often combining multimodal local transport and entry into selected/major visitor or cultural attractions. They can also be used to promote the use of more environmentally friendly modes of transport and reduce congestion. For example, the TirolWest Card, in Austria, provides access to the regional bus network and inclusive offers with attractions in the region, for those visitors booking accommodation for one or more nights. Similarly, the Leap Visitor Card, available only from Dublin Airport Leap Card outlets, offers tourists 72 hours of unlimited travel on the services of the Luas (light rail), Irish Rail DART and commuter rail, and Dublin Bus, and includes transfers to and from the city.

Seamless transport to enhance the visitor experience
30
Box 12. Integrated payment systems to improve traveller convenience
Integrated electronic transport ticketing in the form of smart cards such as the Swiss Travel Pass, the Dutch Trans Links System and the Korea Smart Card (at the national level), combined with city-based initiatives such London’s Oyster Card make travel more convenient and can encourage visits to regional and local tourist destinations respectively. At the city or local level, destination smart cards such as the Oslo Pass, which incorporate additional tourism related services, can enhance the attractiveness of destinations, encourage the use of public transport, and reduce congestion on roads.
Swiss Travel Pass: With arguably the densest public transport network in the world; train, bus, ship and mountain railway services operate with closely co-ordinated timetables. From a tourism perspective, the aim for authorities is to reduce individual motorised traffic (e.g. rental cars), while generating income to help cover the costs of the Swiss public transport network infrastructure. The Swiss Travel System comprises over 250 transport companies and is marketed by the Swiss Rail Service. The Swiss Travel Pass is advertised as the flagship ticket and provides foreign guests with unlimited travel throughout the entire network during a specified period (3 to 30 days). It has become one of the best-selling unlimited transport passes in the world.
Oslo Pass: in addition to travel on all public transport in the city, includes (for a set fee based on 1, 2 or 3-day use): i) entry to more than 30 museums and attractions; ii) parking in municipal car parks; iii) entry to outdoor swimming pools; iv) participation in walking tours; v) discounts on sightseeing, a ski simulator, Tusenfryd Amusement Park, concert tickets, climbing, ski and bike rental; and vi) special offers in restaurants, shops, entertainment and leisure venues (www.visitoslo.com/en/activities-and-attractions/oslo-pass).
For tourists, the benefits of smart cards (and particularly those that do not require a refundable deposit and are disposable) is that they simplify the visitors’ experience by providing cashless access to local transport and attractions; they extend visitors’ knowledge of the range of attractions available; and they allow visitors to focus on the attraction and experience rather than on how to get there. From the suppliers’ perspective, smart card technologies can increase market reach, provide marketing intelligence and can be used to bundle products and influence consumer choices by delivering additional benefits such as information, discounts, loyalty schemes and other benefits. From a policy perspective, the implementation of destination smart cards requires collaboration between a range of transport and tourism policy agencies and stakeholders that may have divergent objectives for participation.
Although destination smart cards have received widespread support and have been instrumental in developing tourism in many cities, it can be difficult to establish and consolidate the wide variety of collaborations across different sectors necessary to make the card attractive to consumers. For this reason, destination smart cards have sometimes taken a partial approach, e.g. remaining limited to attractions and/or transport within one location or extended through supplementary modules. Issues such as the challenges associated with the distribution of income between transport operators and the difficulty of horizontal co-operation (e.g. co-operation between attractions) within a destination are challenges to the implementation of the destination smart card. The relevant destination marketing and government agencies (e.g. transport, culture and heritage, treasury) need to work together to create the right collaborative conditions and physical infrastructure so that greater coherence of the destination experience can be achieved.
Accessibility/universal design
Universal design refers to transport systems that accommodate diverse abilities and needs. This ensures that facilities (airports, terminals, footpaths, etc.) and transport services (planes, trains, buses and taxis) accommodate travellers with limited mobility (including older tourists and those with a disability), limited communications ability, heavy baggage, and other special needs. Universal design can expand potential tourist markets to include people with special needs, whilst also benefitting travellers without mobility impairment. For example, walkway ramps provide access for those tourists with limited mobility

Seamless transport to enhance the visitor experience
31
or wheelchair users, but also convenience for those with wheeled luggage or parents travelling with a child in a push chair.
For example, according to research undertaken on the Australian market for accessible tourism (Frye, 2015):
• some 88% of people with a disability in Australia take a holiday each year; accounting for 8.2 million overnight trips;
• the average travel group size for people with a disability is 2.8 people for a domestic overnight trip and 3.4 for a day trip;
• the total tourism expenditure attributable to the group is AUD 8 billion per year or 11% of overall tourism expenditure;
• if including expenditure by people travelling with a disabled person, this figure increases to AUD 24 billion or 30% of total tourism expenditure.
Similarly, a recent study commissioned by the European Commission highlights the growth potential for accessible tourism in Europe. The study shows that accessible tourism demand by people with special access needs from the European Union currently generates a total economic contribution of EUR 786 billion in terms of total output and EUR 356 billion in terms of gross value added or EUR 394 billion in terms of GDP within the European Union. This scale is equivalent to about 3% of total GDP of EU27 in 2012. Furthermore, it estimates that if European Union tourism destinations were improved to achieve almost complete accessibility of buildings, hotels, restaurants, museums, and various accessible services, by 2020 demand would increase almost 44% resulting in a potential rise of 39% in economic contribution (Miller, 2014).
With an ageing global population, public transport terminals need to be carefully designed and operated to cater for customers with limited mobility. For example, the ITF highlights evidence from Korea that shows some of the major impediments to the use of high-speed trains by travellers with reduced mobility are poor access to stations and inconvenient transfers from trains to local transport modes (OECD ITF 2012c). Better access to and from terminals as well as convenient transfer design and operation between modes can boost passenger use and make destinations more accessible and attractive to tourists with limited mobility (Box 13).
Box 13. Improving accessibility to enhance seamless transport in Japan
Under Japan’s New Barrier-free Law 2006, newly-built or renovated public transport facilities (vehicles and stations) must conform to the Accessibility Standards so that elderly or disabled users can travel smoothly. The standards demand, for example, that railway stations provide step-free access from street level to the platform, adequate lighting and accessible lavatories; buses must accommodate wheelchairs, be low-floor vehicles and be equipped with visible and audible information systems. Transport operators are also requested to make best efforts to upgrade existing stations and that cars be compliant with the standards. The Law also demands that certain categories of roads, buildings, parking facilities, and parks be accessible for elderly and disabled persons. Examples of accessibility improvements include:
• Stations (air, rail, bus, and ferry) with more than 5 000 passengers per day; 85.5% with step-free access vehicles in 2011, up from 28.9% in 2001; 83.2% with accessible lavatories in 2011, up from 0.1% in 2001.
• 27.9% of buses with low-floor access in 2011, compared with 2.2% in 2001.
• 379 Local Accessibility Plans in 2011, up from 249 in 2006 – an increase of over 50%.
Source: OECD/ITF (2012c).

References
32
References
Albalate, D., & Bel, G. (2010), Tourism and urban public transport: Holding demand pressure under supply constraints. Tourism Management, 31(3), pp. 425-433.
Banister, D., & Berechman, Y., (2001). Transport investment and the promotion of economic growth. Journal of Transport Geography, 9(2001) 209-218.
Bringinshaw, D. (2014), Korail hails new tourist services. International Railway Journal, at http://www.railjournal.com/
Cruise Lines International Association (2015), State of the Cruise Industry Report, Washington DC: CLIA Europe.
European Conference on Mobility Management (ECOMM) (2002), 15 – 17 May 2002, Gent.
European Conference of Ministers of Transport (2005), Airports as Multimodal Interchange Nodes, Round Table 126, OECD Publishing/ITF.
Frye, A. (2015), “Capitalising on the Grey-haired Globetrotters: Economic Aspects of Increasing Tourism among Older and Disabled People”, International Transport Forum Discussion Papers, No. 2015-11, OECD Publishing, Paris.
Gössling, S. (2013), National emissions from tourism: an overlooked policy challenge? Energy Policy 59: pp. 433-442.
Graham, A., Papatheodorou, A., and Forsyth, P. (2008), Aviation and Tourism: Implications for leisure travel. Surrey: Ashgate.
Heddebaut, O. and Palmer, D. (2014), Multimodal city-hubs and their impact on local economy and land use, Transport Research Arena 2014, Paris.
International Association of Public Transport (UITP) (2016), Policy Brief: Public Transport at the Heart of the Integrated Urban Mobility Solution, April 2016, UITP.
International Civil Aviation Organization (ICAO) (2013), Global Air Transport Outlook to 2030 and trends to 2040. Montréal, Canada.
International Union of Railways (UIC) (2014), Rethinking Stations for Future Intermobility, UIC.
International Union of Railways (UIC) (2011), Stations for High Speed Systems: Toolbox for the design and /or renovation of major interchanges, UIC.
IPK International (2012), World Travel Trends Report 2012/2013, prepared on behalf of ITB Berlin, Messe Berlin GmbH.
Litman, T., and Burwell, D. (2006), “Issues in Sustainable Transportation,” International Journal of Global Environmental Issues, Vol. 6, No. 4, pp. 331-347; at www.vtpi.org/sus_iss.pdf.

References
33
Miller, G. (2014), Economic Impact and Travel Patterns of Accessible Tourism in Europe Service, Contract SI2.ACPROCE052481700, European Commission, DG Enterprise and Industry; at http://tinyurl.com/lzc6962.
New Zealand Ministry of Transport (2016), Contribution of transport to economic development, Economic development and transport project: Summary Report, NZ Ministry of Transport.
OECD (forthcoming), National Tourism Policy Review of Mexico. OECD Publishing, Paris.
OECD (2016), OECD Tourism Trends and Policies 2016, OECD Publishing, Paris.
OECD (2015), “A Review of Effective Policies for Tourism Growth”, OECD Tourism Papers, 2015/01, OECD Publishing, Paris.
OECD (2014a), OECD Tourism Trends and Policies 2014, OECD Publishing, Paris.
OECD (2014b), The Competitiveness of Global Port-Cities, OECD Publishing, Paris. DOI: doi.org/10.1787/9789264205277-en.
OECD (2013), “Green Innovation in Tourism Services”, OECD Tourism Papers, No. 2013/01, OECD Publishing. doi: 10.1787/5k4bxkt1cjd2-en.
OECD/ITF (2016), Road Safety Annual Report 2016, OECD Publishing, Paris. DOI: http://dx.doi.org/10.1787/irtad-2016-en
OECD/ITF (2016), 2016 ITF Annual Summit Highlights, Green and Inclusive Transport: Session summaries, OECD Publishing/ITF.
OECD/ITF (2015a), ITF Transport Outlook 2015, OECD Publishing/ITF. http://dx.doi.org/10.1787/9789282107782-en.
OECD/ITF (2015b), “Tourism Facilitation as part of Transport Policy: Summary of International Experiences”, International Transport Forum Discussion Papers, No. 2015-15, OECD Publishing, Paris.
OECD/ITF (2015c), International Experiences on Public Transport Provision in Rural Areas, OECD Publishing/ITF.
OECD/ITF (2014), 2014 ITF Annual Summit Highlights, Transportation for a Changing World: Session summaries, OECD Publishing/ITF.
OECD/ITF (2012a), 2012 ITF Annual Summit, Seamless Transport: Making Connections: Highlights, OECD Publishing/ITF.
OECD/ITF (2012b), 2012 ITF Annual Summit, Seamless Transport: Making Connections: Session Summaries, OECD Publishing/ITF.
OECD/ITF (2012c), 2012 ITF Annual Summit, Seamless Transport: Making Connections: Case Study Compendium, OECD Publishing/ITF.
OECD/UNEP (2011), Climate Change and Tourism Policy in OECD Countries, OECD Studies on Tourism, OECD Publishing. doi: 10.1787/9789264119598-en.

References
34
Pallis, T. (2015), “Cruise Shipping and Urban Development: State of the Art of the Industry and Cruise Ports”, International Transport Forum Discussion Papers, No. 2015-14, OECD Publishing, Paris.
Pucher, J., Dill, J. and Handy, S. (2010), Infrastructure, programs, and policies to increase bicycling: An international review. Preventive Medicine 50: S106-S125.
UNECE (2011), Transport For Sustainable Development In The ECE Region, United Nations Economic Commission for Europe (www.unece.org); at http://tinyurl.com/ns9jozp.
UN World Tourism Organization (2016), UNWTO Tourism Highlights, 2016 Edition. Madrid, Spain.
UNWTO (2013), Background paper on tourism and air transport policies: 20th Session of the UNWTO General Assembly. Madrid, Spain.
UNWTO (2011), Tourism Towards 2030: Global Overview. Madrid, Spain.
Wardman, M. (2014), "Valuing Convenience in Public Transport: Roundtable Summary and Conclusions", International Transport Forum Discussion Papers, No. 2014/02, OECD Publishing, Paris. DOI: http://dx.doi.org/10.1787/5jz40rk8h2f0-en


