© OECD/IEA 2010
Dr Milou BeerepootDr Milou Beerepoot
Senior analyst, International Energy Agency Senior analyst, International Energy Agency
Interim resultsInterim resultsIEA technology roadmap: IEA technology roadmap: geothermal heat and power geothermal heat and power

© OECD/IEA 2010 © IEA/OECD 2010
Share of non-hydro renewables in electricity production of IEA countries
Between 1990 and 2009, total electricity production from geothermal remained stable, reaching a 0.3% generation share in 2009
Source: IEA, 2010

© OECD/IEA 2010 © IEA/OECD 2010
Key technologies for reducing global CO2emissions
A wide range of technologies will be necessary to reduce energy-related CO2 emissions
BLUE Map scenario: 50% CO2 reduction by 2050
0
5
10
15
20
25
30
35
40
45
50
55
60
2010 2015 2020 2025 2030 2035 2040 2045 2050
Gt C
O2
CCS 19%
Renewables 17%
Nuclear 6%
Power generation efficiency and fuel switching 5%End-use fuel switching 15%
End-use fuel and electricity efficiency 38%
BLUE Map emissions 14 Gt
Baseline emissions 57 Gt
WEO 2009 450 ppmcase ETP2010 analysis Source: IEA, 2010 (ETP 2010)
© OECD/IEA 2010 © IEA/OECD 2010
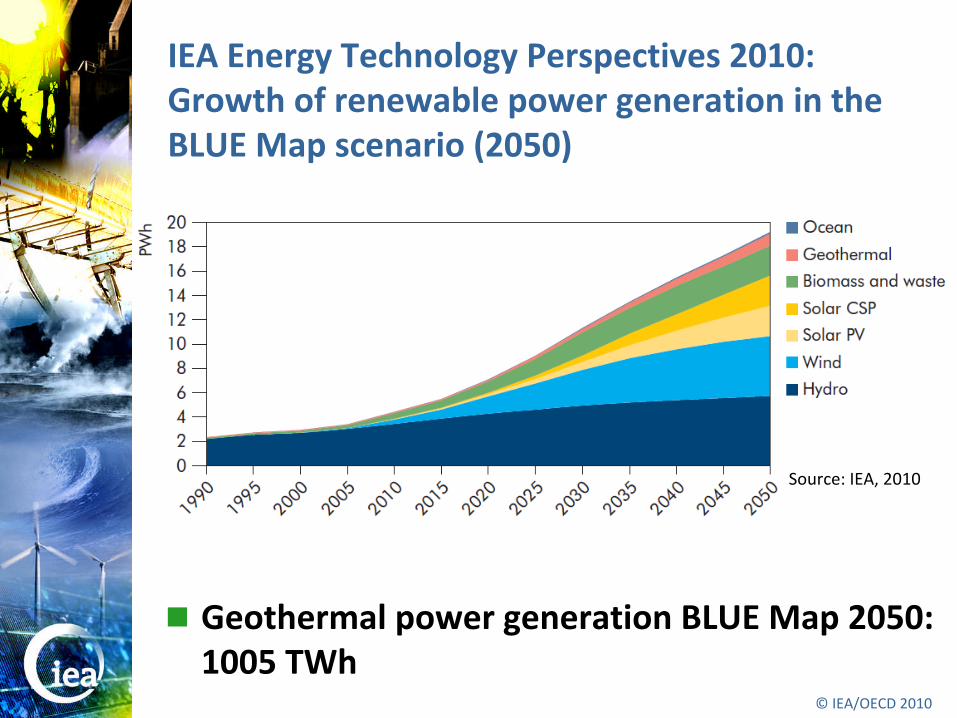
IEA Energy Technology Perspectives 2010: Growth of renewable power generation in the BLUE Map scenario (2050)
Geothermal power generation BLUE Map 2050: 1005 TWh
Source: IEA, 2010

© OECD/IEA 2010 © IEA/OECD 2010
IEA Energy Technology Perspectives 2010
6.12%
31.82%
1.13%5.62%
6.47%12.34%
5.47%
7.21%
23.82%
Africa Other Developing Asia India
China Central and South America Economies in Transition
OECD Pacific OECD Europe OECD North America
Geothermal power generation Blue Map 2050: 1005 TWh Geothermal power generation High-REN 2050: 1411 TWh
Blue Map scenario, shares per region
© OECD/IEA 2010 © IEA/OECD 2010
©O
ECD
/IEA
200
9
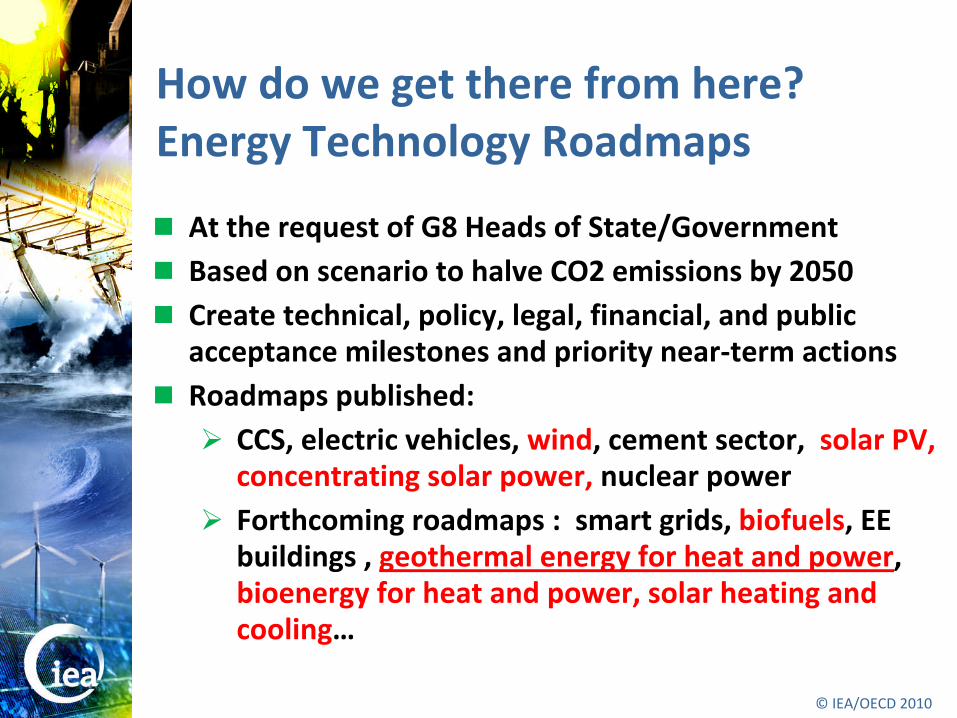
At the request of G8 Heads of State/Government Based on scenario to halve CO2 emissions by 2050 Create technical, policy, legal, financial, and public
acceptance milestones and priority near-term actions Roadmaps published:
CCS, electric vehicles, wind, cement sector, solar PV, concentrating solar power, nuclear power
Forthcoming roadmaps : smart grids, biofuels, EE buildings , geothermal energy for heat and power, bioenergy for heat and power, solar heating and cooling…
How do we get there from here? Energy Technology Roadmaps

© OECD/IEA 2010 © IEA/OECD 2010
What is an energy technology roadmap?
GW/TWh
2011 20xx
Goals
Gaps and barriers
Action items
Priorities & timelines
Source: Adjusted from (IEA, 2010)
© OECD/IEA 2010 © IEA/OECD 2010
Stakeholders consulted
Three workshops, over 100 participants
Involvement IEA Geothermal Impl. Agreement
Involvement European Geothermal Energy
Council (EGEC)
Involvement International Geothermal
Association
Involvement authors of IPCC Special Report
Renewable Energy, Geothermal chapter
© OECD/IEA 2010 © IEA/OECD 2010
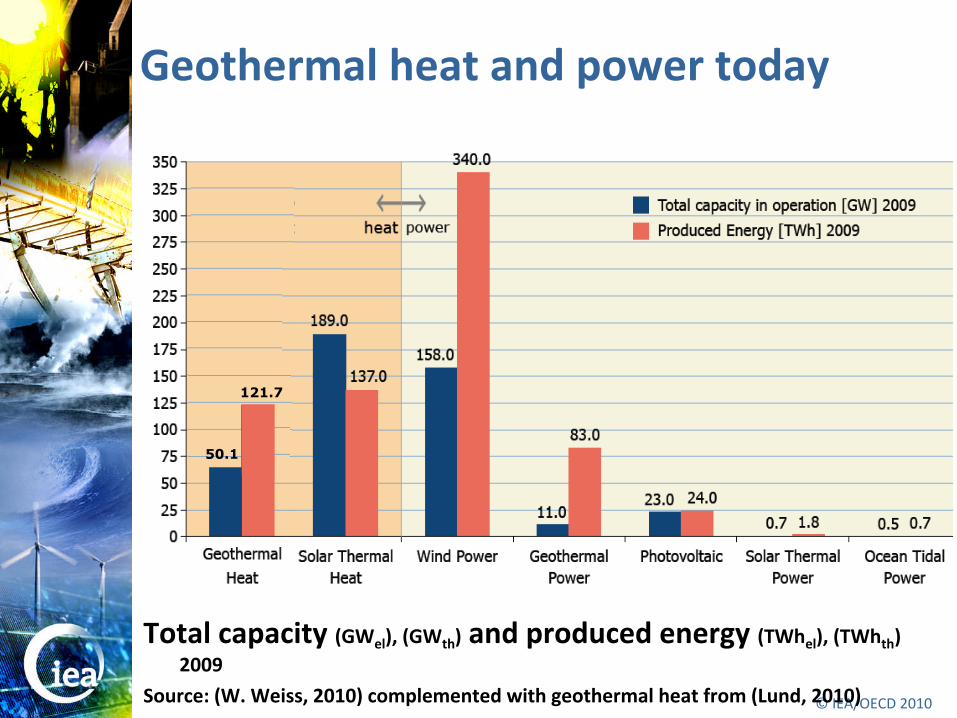
Geothermal heat and power today
121.7
50.1
Total capacity (GWel), (GWth) and produced energy (TWhel), (TWhth) 2009
Source: (W. Weiss, 2010) complemented with geothermal heat from (Lund, 2010)

© OECD/IEA 2010 © IEA/OECD 2010
Geothermal resources, part 1
Least favourable Most favourable
Most well known geothermal resources: high temperature hydrothermal resources, often tectonic plate boundaries
Source: (Hamza et al., 2008) used with kind permission from Springer Science+Business Media B.V.
© OECD/IEA 2010 © IEA/OECD 2010
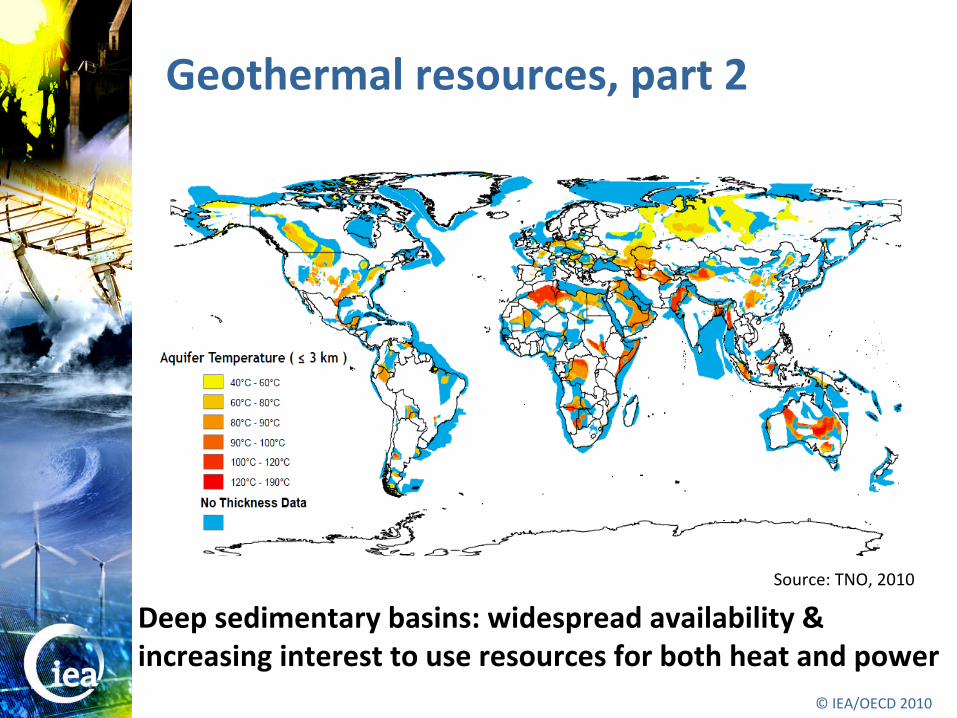
Geothermal resources, part 2
Deep sedimentary basins: widespread availability & increasing interest to use resources for both heat and power
Source: TNO, 2010
© OECD/IEA 2010 © IEA/OECD 2010
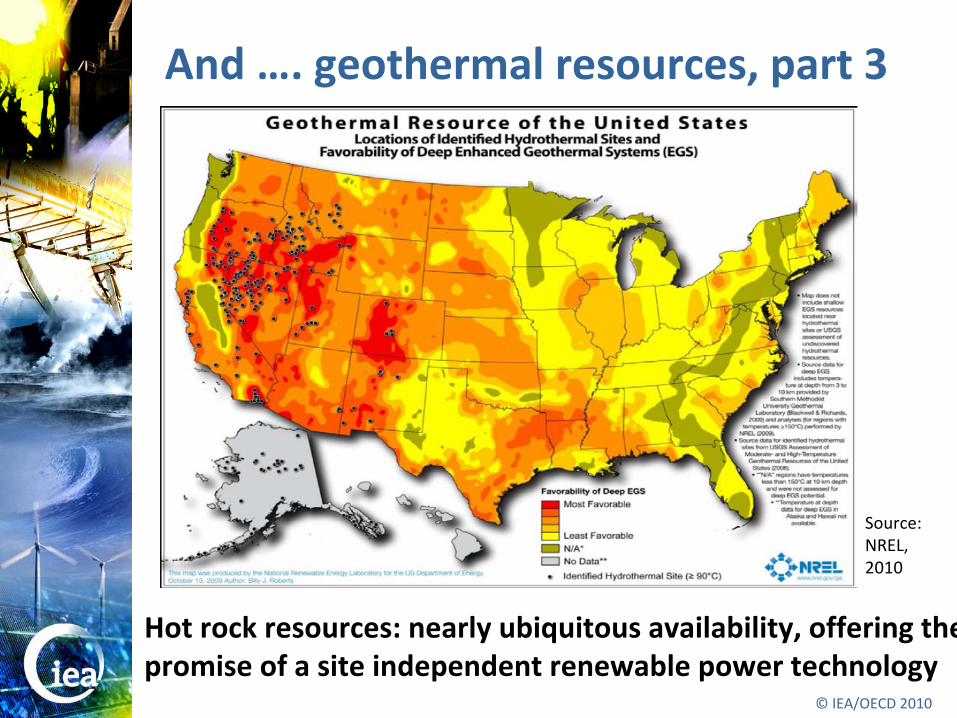
And …. geothermal resources, part 3
Hot rock resources: nearly ubiquitous availability, offering thepromise of a site independent renewable power technology
Source: NREL, 2010

© OECD/IEA 2010 © IEA/OECD 2010
Geothermal roadmap
Technologies included in roadmap:
Hydrothermal: high temperatures (flash plants)
Hydrothermal: low temperatures (binary plants)
Hot rock resources: EGS (mainly binary plants)
Technologies excluded in roadmap:
Ground source heat pumps
Alternative technologies discussed, but not included in projections

© OECD/IEA 2010 © IEA/OECD 2010
Vision for geothermal power 2050
Geothermal electricity capacity could reach 200 gigawatts by 2050, providing 1400 TWh per year (3.5% of electricity production): ETP 2010 Blue Map Hi-REN scenario
Draft IEA geothermal roadmap, March ‘11

© OECD/IEA 2010 © IEA/OECD 2010
Vision for geothermal heat 2050(heat pumps excluded)
Geothermal heat could contribute to 5.8 EJ annually by 2050 (heat demand EU today = 22.5 EJ)
Draft IEA geothermal roadmap, March ‘11
© OECD/IEA 2010 © IEA/OECD 2010
Technological challenges
Geological data & improvement exploration methods needed (potential mapping and risk reduction)
Drilling technology development and costs reduction needed
Geothermal should benefit from its potential to offer both power and heat
Draft IEA geothermal roadmap, March ‘11

© OECD/IEA 2010 © IEA/OECD 2010
Geological data mapping and geosciences exploration methods
Underground temperature in Germany at 2500 m below sea level (screenshot from www.geotis.de)
© OECD/IEA 2010 © IEA/OECD 2010
Technological challenges
Development of advanced technologies exploiting hot rock resources (e.g. EGS) is essential to realize roadmap vision
Improving EGS technology and address environmental issues is crucial
Explore potential alternative hot rock and hydrothermal technologies
Draft IEA geothermal roadmap, March ‘11
© OECD/IEA 2010 © IEA/OECD 2010
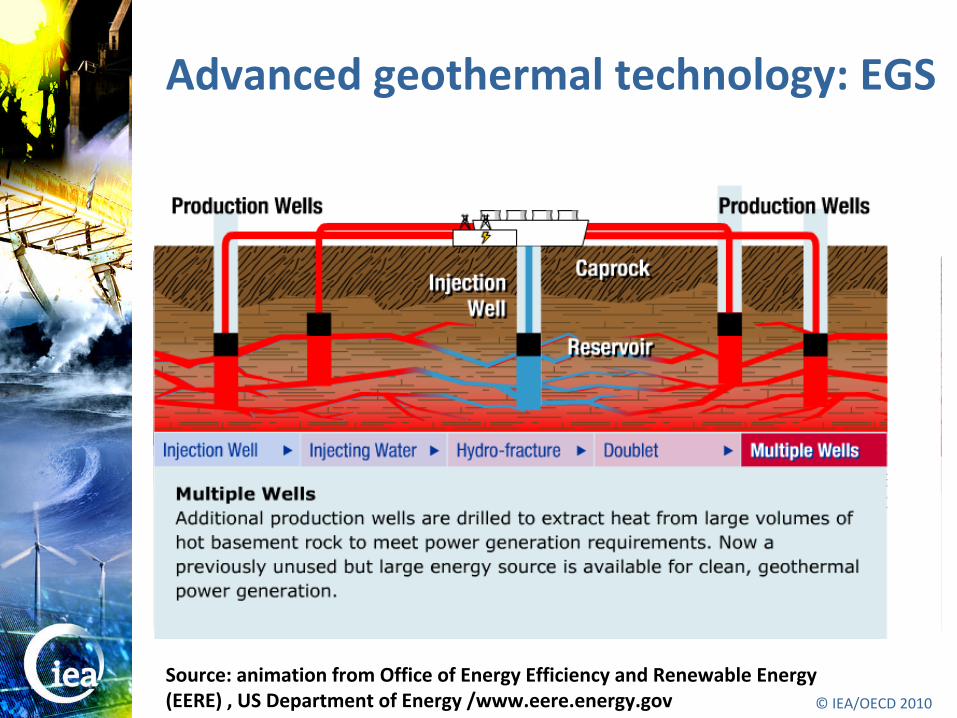
Advanced geothermal technology: EGS
Source: animation from Office of Energy Efficiency and Renewable Energy (EERE) , US Department of Energy /www.eere.energy.gov
© OECD/IEA 2010 © IEA/OECD 2010
Advanced geothermal technology : EGS
Projection for 2050 assumes EGS to become commercially viable soon after 2030
In the next 10 years, many more EGS pilot plants of 10 MW needed (currently 10)
In the longer term, up scaling of plants to 50 to 200+ MW at single site
EGS offers the promise of a site independent renewable power base load technology

© OECD/IEA 2010 © IEA/OECD 2010
Status quo geothermal policies
Policies for high enthalpy hydrothermal in place (e.g. renewables obligations) or not needed
Europe (mainly binary): policy incentives not completely developed (FIT in some EU countries)
Insufficient policy incentives for geothermal direct heat, e.g. geothermal district heating
Specific challenges geothermal to be addressed in policies
© OECD/IEA 2010 © IEA/OECD 2010
Policy framework: actions & milestones
Draft IEA geothermal roadmap, March ‘11
Set long-term targets for geothermal electricity and heat
Introduce market facilitation schemes: transparent and predictable framework
Consider introducing market facilitation schemes for geothermal heat use
Introduce streamlined and time-effective permit procedures
Develop and use protocol for community support for EGS
© OECD/IEA 2010 © IEA/OECD 2010
Policy framework: actions & milestonesDraft IEA geothermal roadmap, March ‘11
Consider guarantee schemes for geothermal exploration risks
Enhance training, education and awareness for skilled workforce
Increase and sustain public RD&D funding Expand international R&D collaboration Develop mechanisms to support geothermal
deployment in developing countries Encourage multilateral development banks
(MDBs) to target clean energy deployment
© OECD/IEA 2010 © IEA/OECD 2010
Conclusions
Global geothermal power: 1400 TWh in 2050
Global geothermal heat: 5.8 EJ in 2050
Deployment of hot rock resources is essential for realizing this vision (commercial after 2030)
EGS is still in demonstration phase: in the next 10 years, many more EGS pilot plants needed
In order to do so, substantial more R&D needed
More awareness and information is needed for different types of geothermal resources
More awareness is needed for potential of geothermal heat


