
Interactive 2-D ProjectionCross Coverage Viewer for Coverage Hole Analysis
Keisuke [email protected]
Tomohisa IidaVerifore, [email protected]
Tomohisa IidaVerifore, [email protected]

Outline
Introduction and motivation Related work Cross coverage and views Our 2-D viewer “Room for improvement” factor Results Limitations and future improvement Summary

Introduction
Constrained-random verification (CRV) methodology such as VMM and OVM becomes widely accepted
The random nature of the methodology requires functional coverage metrics to monitor what has been tested Reaching 100% coverage is one of the goals
Identifying the root cause of the coverage holes is crucial Especially when dealing with multi-
dimensional cross coverage that tends to have a huge coverage space

Motivation
Synopsys Unified Report Generator (URG) presents cross coverage comprehensively, but Not easy to grasp the big picture of the
coverage Not easy to recognize hidden patterns of
the coverage holes URG focuses on displaying the entire
coverage results We wanted a tool to discover coverage
holes and their patterns

URG
Related Work
Hole analysis for functional coverage data [Lachish, DAC ‘02]
Defining coverage views to improve functional coverage analysis [Asaf, DAC ‘04] Selection Projection Grouping
We focus on interactivity so that the users can see the coverage results from different view points

Cross Coverage Example
Cross coverage with 3 coverage points Each coverage point has 4 bins This makes 4x4x4 cross bins
Coverage Point A
Coverage Point BCov
erag
e
Point C
Bin

Coverage Hole Analysis
Determine the areas that have not been tested
Is there a pattern here?
Coverage hole
Covered cross bin

Coverage View: List View
Exhaustive, but loses patterns This is what URG basically provides
List View
List View: URG
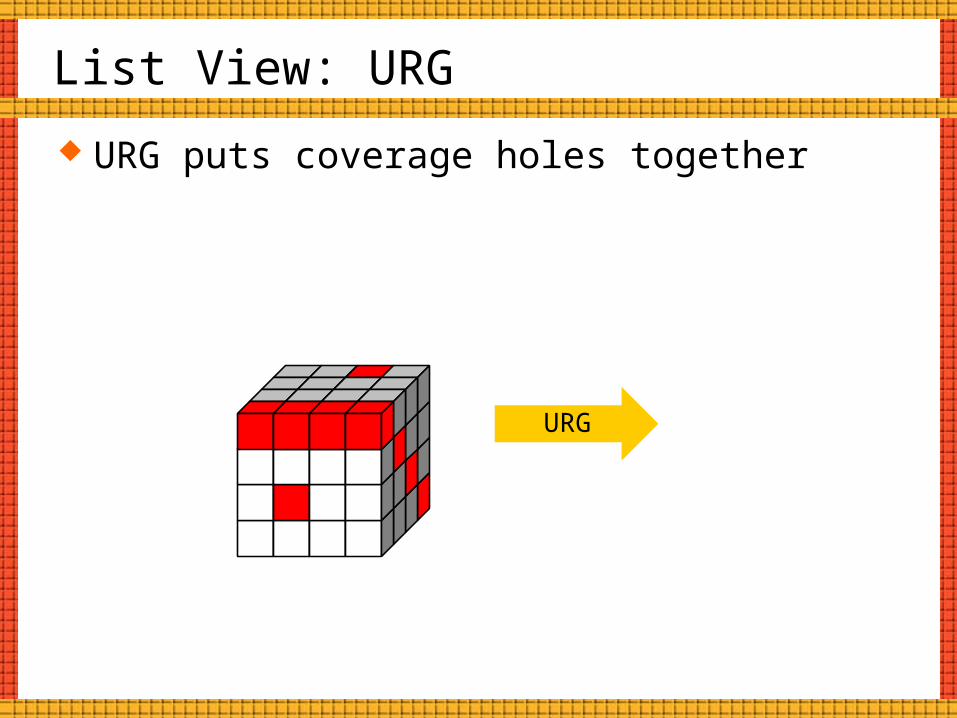
URG puts coverage holes together
URG

Coverage View: 2-D Projection
Add bin counts of coverage points you do not focus on
Projec
tion
Cov
erag
e P
oint
A
Coverage Point B
Coverage View: 2-D Projection
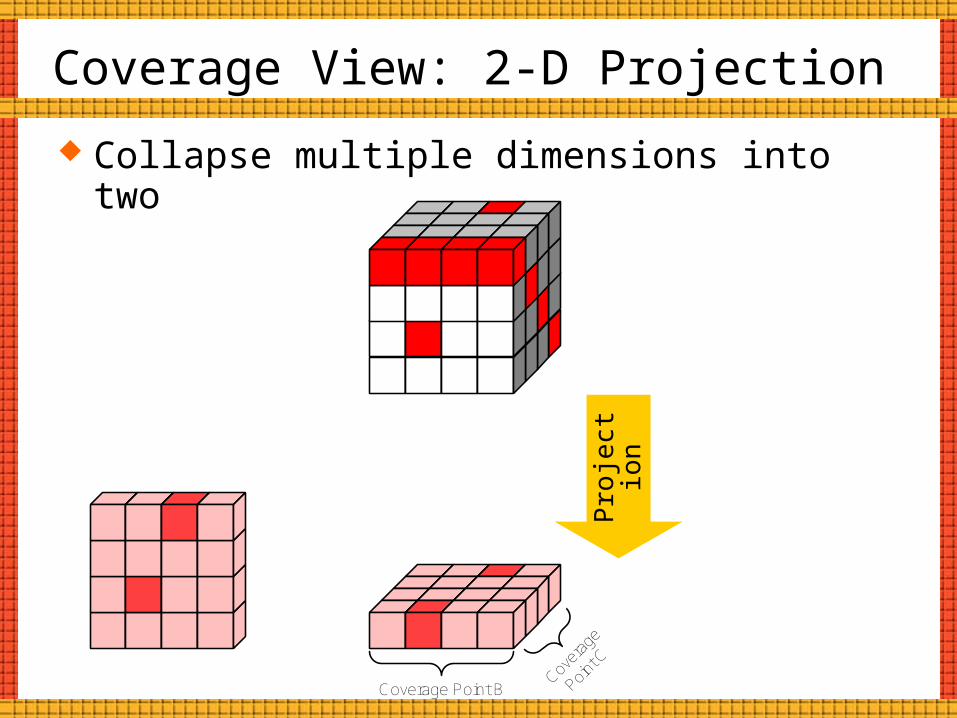
Collapse multiple dimensions into two
Pro
ject
ion
Cover
age
Point C
Coverage Point B

Coverage View: 2-D Projection
We get C(n, 2) projections,where n is # ofcoverpoints ina cross
Projection
Cov
erag
e P
oint
A
Cover
age
Point C

Coverage View: Bin Selection
Another way to see the coverage point relation
Selection

Coverage View: Bin Selection
Select a bin of a coverage point
Selec
tion

Coverage View: Bin Selection
Can be combined with the 2-D projection
Selection

How the 2-D Viewer Works
VCS
Coverage Database
(vdb)
Preprocess
XML
HTML Browser
UserViews
Interactive2-D projections/bin selections
2-D Viewer
JavaScript
URG

Intermediate XMLtestbench
data
cgcgcg
cumulative
cpbncpcp bnbn
cccccc
bnbnbn
namedbins
crosspoints axisaxisaxis bnbnbn
illegal_auto_crosses domaindomaindomain axisaxisaxis
excluded_crosses domaindomaindomain axisaxisaxis
<text>
instinstinst
cpcpcp
cccccc

Coverage Example
Design under Test SoC interconnect
Proprietary BusMemory Arbiter
Proprietary Bus
AXI BridgeAHB
BridgeProcessor
BridgeAHB
BridgePeripheral
BridgeDMA
Controller
Memory Controller
Verification Environment
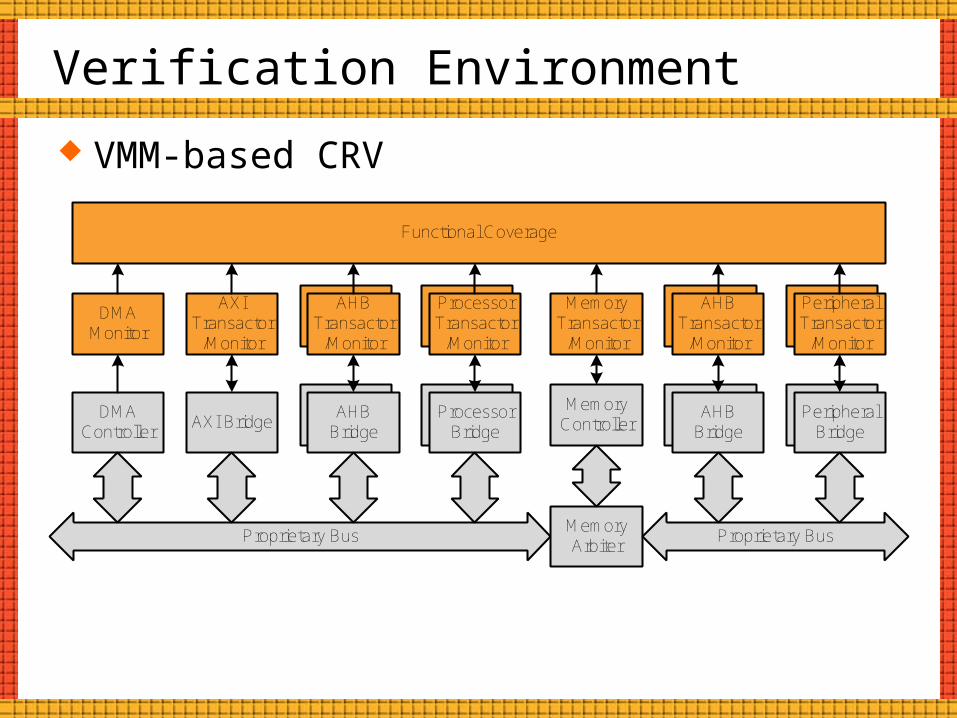
VMM-based CRV
Proprietary BusMemory Arbiter
Proprietary Bus
AXI BridgeAHB
BridgeProcessor
BridgeAHB
BridgePeripheral
BridgeDMA
Controller
Memory Controller
AXI Transactor
/Monitor
AHB Transactor
/Monitor
Processor Transactor
/Monitor
Memory Transactor
/Monitor
Peripheral Transactor
/Monitor
AHB Transactor
/Monitor
Functional Coverage
DMA Monitor

Coverage Data
256 coverage group instances 196 cross coverage instances 4,789 coverage bins in total (excluding
illegal bins) Cross coverage example:
Initiator vs. Target vs. Direction (Read/Write)
36x26x2 bins (including illegal bins)
Target
Initiator Directi
on

Projection: Initiator vs. Target
Target
Initiator
Directi
on

Bin Selection
Target
Initiator
Directi
on

Projection: Initiator vs. Direction
Initiator Directi
on
Target

Projection: Target vs. Direction
Target
Directi
on
Initiator

Which coverage group to tackle first?
Motivation Now that we can analyze coverage holes
more efficiently But which coverage group should we look at
first? Traditional “coverage score” measures
how many bins are covered within a coverage group This metric does not show relative
importance on the overall coverage

Coverage Group Comparison
Which coverage group is more important? Coverage report displays the coverage
group A to the top because it is least covered, but…
Coverage Group A B C
Number of total bins 10 20 170
Number of bins hit 2 8 136
Coverage score 20% 40% 80%

“Room for Improvement” Factor
Coverage Group A B C
Number of total bins 10 20 170
Number of bins hit 2 8 136
Coverage score 20% 40% 80%
“Room for Improvement” factor
4% 6% 17%
Coverage score shows coverage group A is least covered, but …
Coverage group A would increase overall coverage merely by 4%, whereas coverage group C would increase by 17% Assuming Wg =number of bins in coverage group
g(see next page)

The Factor Definition
Shows the impact on the overall coverage “How many more percentages the overall
coverage would increase if this coverage group were covered ”
Cg is the score of coverage group g in percent g set of coverage groups Wg is the weight associated with coverage
group g
gg
ggg W
WCF
)100(
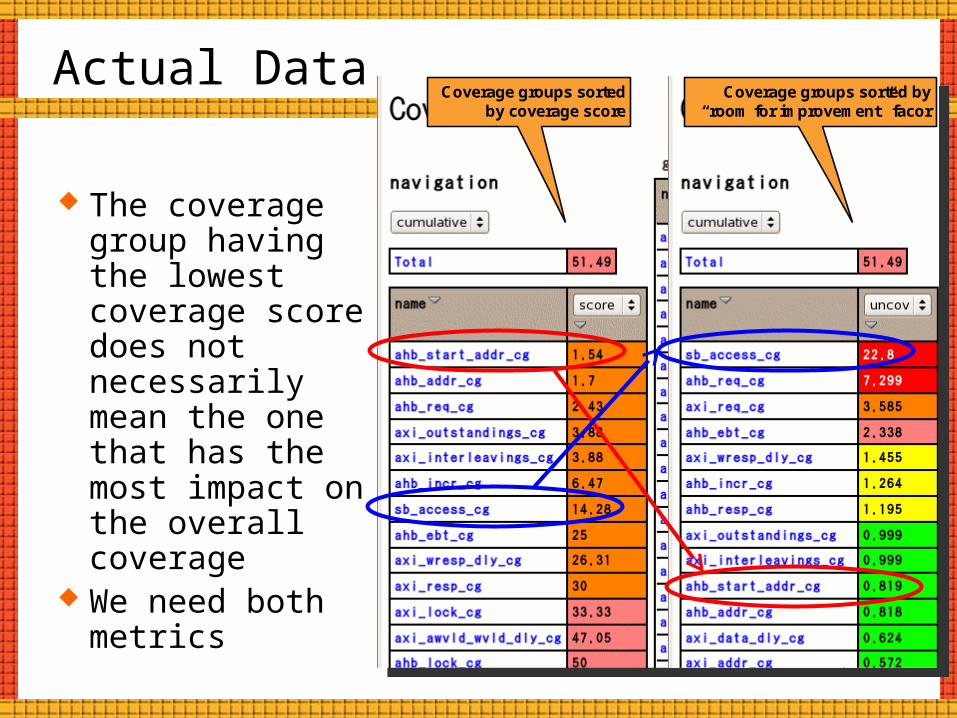
Actual Data
The coverage group having the lowest coverage score does not necessarily mean the one that has the most impact on the overall coverage
We need both metrics
Coverage groups sorted by coverage score
Coverage groups sorted by “room for improvement” facor
Coverage groups sorted by coverage score
Coverage groups sorted by “room for improvement” facor

Results
Using the 2-D Viewer, we found several verification/coverage bugs including: Illegal access to targets
Boundary crossingAccess to a reserved area
Missing burst length values Illegal byte enable patterns

Byte Enable Coverage

Limitations
There exists non-obvious coverage holes New approach is required to uncover the
root causes of the hard to spot holes Currently only VCS coverage database is
supported

Future Improvement
Rewrite the 2-D Viewer preprocessor using Unified Coverage Database API UCAPI – to support VCS without worrying
about future database format changes UCDB API – to support simulators other than
VCS Add “grouping feature” of coverage bins 3-D Viewer?

Summary
The interactive 2-D Viewer gives variable views for multi-dimensional cross coverage hole analysis The interactive features sometimes reveals
unexpected coverage hole patterns The “room for improvement” factor
enables us to identify the coverage groups which make the most impact on the overall coverage score

References S. Asaf, E. Marcus, and A. Ziv. Defining coverage views
to improve functional coverage analysis. In Proceedings of the 41st Conference on Design Automation, pages 41–44, Jun 2004.
J. Bergeron, E. Cerny, A. Hunter, and A. Nightingale. Verification Methodology Manual for SystemVerilog. Springer, 2005.
Cadence Design Systems, Inc. and Mentor Graphics, Inc. Open Verification Methodology User Guide Product Version 2.0.1, Oct 2008.
Cadence Design Systems, Inc. and Mentor Graphics, Inc. UCDB API Reference Version 1.1, Feb 2009.
O. Lachish, E. Marcus, S. Ur, and A. Ziv. Hole Analysis for Functional Coverage Data. In Proceedings of the 39th Conference on Design Automation, pages 807-812, Jun 2002.
Synopsys, Inc. Unified Coverage Database API Reference Manual Version B-2008.12, Dec 2008.
Synopsys, Inc. Unified Coverage Reporting User Guide Version B-2008.12, Dec 2008.

Live Demo


![y Keisuke Asai arXiv:1708.08500v2 [physics.flu-dyn] 25 Oct](https://cdn.vdocuments.site/doc/165x107/61f6f0115fca5b61ec6aa7ef/y-keisuke-asai-arxiv170808500v2-25-oct-.jpg)


