International Journal of Sciences: Basic and Applied Research
(IJSBAR)
ISSN 2307-4531 (Print & Online)
http://gssrr.org/index.php?journal=JournalOfBasicAndApplied
---------------------------------------------------------------------------------------------------------------------------
286
Influence of Working Capital Management Practices on
Financial Performance of Small and Medium Enterprises
in Machakos Sub-County, Kenya
Thomas Nyakundia*, Ombuki Charlesb, Evusa Zablonc, Ariemba Jaredd
a,bMachakos University College, Kenya c,dSouth Easten Kenya University, Kenya
aEmail: [email protected] bEmail: [email protected]
cEmail: [email protected] dEmail: [email protected]
Abstract
Working capital can be considered as source of existence for all types of organizations, whether profit or non-
profit organizations, therefore, it is a vital component for any profit making organizations for it influences
operational level and sales volume. The purpose of this study was to assess the influence of Working Capital
Management Practices on Financial Performance of SMEs in Machakos Sub-County, Kenya. This study was
based on these objectives: assessment of the influence of cash management practices on financial performance,
determination of the influence of receivables management practices on financial performance and the analysis of
the extent to which inventory management practices influences financial performance of SMEs. The study
adopted a cross-sectional survey research design which allowed the collection of primary quantitative data
through structured questionnaires and interview methods. The target population was 159 Owners / Managers of
SMEs trading in Machakos Sub-County. Random sampling technique was used to obtain a sample of 22 SMEs
trading in Machakos Sub-County. The data was analyzed using both descriptive and inferential statistics.
------------------------------------------------------------------------
* Corresponding author.

International Journal of Sciences: Basic and Applied Research (IJSBAR) (2016) Volume 30, No 4, pp 286-309
287
The findings of the study revealed that; working capital management practices were low amongst the SMEs,
since majority had not adopted formal Working Capital Management Practices and there Financial Performance
was on a low average. The study further revealed that SMEs financial performance was positively related to
efficient cash management, efficient receivable management and efficient inventory management at 0.01
significance level. The coefficient of determination (R2) indicated that 0.507 or 50.7% of the variables in F.P
could be explained by the changes ECM, ERM and EIM. This study concluded that WCMPs have an influence
on the F.P of SMEs; therefore, there is need for SMEs owners / managers to embrace EWCMPs as a strategy to
improve their F.P in order to survive in the turbulent business environment. This study corroborates extant
literature findings that established a positive relationship between WCMP and F.P
Keywords: working capital; financial performance; small and micro enterprises.
1. Introduction
1.1 Background of the Study
Working Capital is the difference between a firm’s Current Assets and Current Liabilities [44]. Working Capital
(WC) is defined as all the short-term assets used in daily operations of a firm. This primarily consists of Cash,
Receivables, Inventory and Payables [32]. Working Capital, the money needed for the day-to-day, operations of
a firm, is described as investment of a firm’s capital Current Assets and the use of Current Liabilities to fund
part of the investment.
Working Capital Management focuses on the coordinated control of the firm’s current assets and liabilities [27].
Working Capital Management is concerned with the problems that arise in attempting to manage the Current
Assets, the Current Liabilities and the interrelationship that exists between them [47]. Current Assets are those
assets which in ordinary course of business can be or will be converted into cash within one year without
undergoing a diminution in value and without disrupting the operations of the firm [47]. Current liabilities are
those liabilities which are intended at their inception, to be paid in the ordinary course of business, within a year,
out of current assets or earnings of the concern [47]. The goal of Working Capital Management is to manage the
firm’s current assets and liabilities in such a way that a satisfactory level of working capital is maintained [7].
The interaction between current asset and current liabilities is therefore the main theme of the theory of working
capital management [39].
However [6] observed that there is evidence that many SMEs are not very good at managing working capital
despite their high investments in current assets, and this has been a major cause of their high failure rates as
compared to LSEs. According to him, majority of the SMEs operate with no credit department, implying that
both the expertise and the information required to make sound judgments concerning terms of sales may not be
available. They also lack proper debt collection procedures, hence they tend to experience increased risks of late
payments and default by debtors who tend to increase where there is an exclusive concern for growth, and in the
case SMEs may not be too willing to extend credit to customers who have poor credit risks. Also a study by [10]
found that debt collection was identified by 55% to be among the top five major challenges facing micro and

International Journal of Sciences: Basic and Applied Research (IJSBAR) (2016) Volume 30, No 4, pp 286-309
288
small business.
Research studies have been undertaken on WCM in India, Pakistan, Mauritian, U.K, US, Belgium, Ghana and
Nigeria to identify the push factors for firms to adopt good WCMPs and to investigate the association between
WCMPs and profitability of both SMEs and LSEs [53]. However, in Kenya, specific research studies
exclusively on the influence of WCM on corporate financial performance of SMEs are very scanty, in particular
for the case of Machakos Sub-County, Kenya.
A study by [10]s to establish the role of SMEs in economic growth indicated countries with a large share of
SMEs employment have higher economic growth than their counterparts. Small and Medium Enterprises, in
Kenya, are generally acknowledged as vital and significant contributors to economic development through their
perceived critical role in providing job opportunities, poverty reduction, and entrepreneurship development and
their acting as intermediaries in trade [49]. This agrees with a study of UK SMEs by [12] that those SMEs, make
a major contribution to the health of the economy and help to diversify opportunity in the society. SMEs in the
UK have increased in importance, measured in terms of their share of manufacturing, employment and output.
The number of SMEs continues to rise as does the number of people classified as self-employed.
According to the economic survey of 2006, SMEs contributed over 50% of new jobs created in the year 2005
and 20% of the GDP of Kenya. The government also estimates that SMEs employment is growing at the rate of
11% p.a. [24]. In recognition of this indispensable role of SMEs, many micro-finance institutions have been on
the forefront in providing these enterprises with micro-credit. This has seen their access to micro-credit increase
from 7.5% in 2006 to 17.9% in 2009 [24].
Despite their significant and increased efforts to ensure the success of SME, [34] estimates that two-thirds of the
SMEs were generating income equal or below the minimum wage, a sobering finding that must temper one’s
enthusiasm for the growth of SMEs as a solution to the county’s poverty and employment problems. A study by
[10], also established that up to 50% of the SMEs in operation have a deteriorating performance and are said to
stagnate at “Small” level, hence do not progressively grow into medium or even large enterprise as envisaged in
their conceptual plans.. Some of the most important internal problems identified by [11] which contributes to
SMEs failure are inadequate Capital, Cash Flow Management, Receivables Management and Inventory Control.
1.2 Problem Statement
In Machakos Sub-County, Kenya, data available from the County Registrar of Business Office, Ministry of
Industrialization and Enterprise Development, indicates that more than 96% of registered companies in 2013 are
Small and Medium Enterprises. This target group is identified as the catalyst for the economic development in
the county. However, this data also shows that more than three out of five newly registered SMEs yearly, close
business operations within the first three years of business operation, this is because this sector has continued to
face challenges; among them lack of proper financial management practices. This observation agrees with [16]
study which established that lack of proper working capital management practices as the most important reason
for business closures in Kenya. Therefore, the purpose of this study is to assess the influence of working capital
International Journal of Sciences: Basic and Applied Research (IJSBAR) (2016) Volume 30, No 4, pp 286-309
289
management practices on financial performance of SMEs in Machakos Sub-County, Kenya.
1.3 Research Objectives
The specific objectives of this study are:
(i) To assess the influence of Cash Management Practices on Financial Performance of SMEs in
Machakos Sub-County, Kenya.
(ii) To determine the influence of Receivables Management Practices on Financial Performance of SMEs
in Machakos Sub-county County, Kenya.
(iii) To analyze the extent to which Inventory Management Practices influences Financial Performance of
SMEs in Machakos Sub-County, Kenya.
1.4 Significance of this Research Study
The findings of this study if adopted will assist all stakeholders, especially, owner/managers, county and
national governments and scholars. This study will help owners/managers of the SMEs to appreciate the
relevance of efficient working capital management practices.
1.5 Limitations of the Study
The study limited itself to only SMEs in Machakos Sub-County, Kenya, registered by the year 2009, with the
County Registrar of Business, Ministry of Industrialization and Enterprise Development. For a more conclusive
result, all SMEs in all counties in Kenya should have been studied. However this was not possible due to
financial shortages and other constraints such as time and accessibility. It was not possible to cover the opinions
of all SMEs Owners/Managers in Machakos Sub-County, because tracing them would have required
considerable time, resources and other logistics. Also there was a limitation due to the use of questionnaire,
interview and observation of owners/ managers as data collection tools, ignoring other stakeholders like the
workers who actually do work in SMEs; customers and suppliers.
2. Literature review
2.1 Theoretical Literature
Searching for a definition of Small and Medium Enterprises (SMEs) can be frustrating for there are as many
definitions as there are authors on this subject. Over the years there have been many attempts at defining what
constitutes Small and Medium Enterprises. Researchers and policy makers have used a variety of criteria
including; total worth; relative size within the industry, number of employees, value of products, annual sales or
receipts and net worth [1]. Therefore the benchmarks vary considerably. Research study by [6], defined Small
and Medium Enterprises as enterprises having less than 50 employees as recommended by the African
Development Bank. This study will define SMEs as those firms employing less than 20 workers with an
investment of Ksh.200, 000 to Ksh.2000, 000, excluding land and buildings.
International Journal of Sciences: Basic and Applied Research (IJSBAR) (2016) Volume 30, No 4, pp 286-309
290
Medium and Small companies tend to have relatively larger amount of capital tied in Current Assets and
Liabilities than Large Companies [7]. In a study of Spanish SMEs, it was discovered that Current Assets
comprise 69% and Current Liabilities over 52% of total assets and liabilities [25]. WCM involves the planning
and controlling of Current Assets and Liabilities in a manner that eliminates the risk of inability to meet short-
term obligations and avoid excessive investments in these assets [45]. Reference [7] has argued that inadequate
planning and control of WC are one of the main causes of business failures.
The objective of WCM is to maintain the level of net capital that maximizes the owner’s wealth, in the firm
[42]. Owners wealth maximization or profit maximization theory assumes that efficient working capital
management under competitive market conditions, results into profitability, which is considered as the most
appropriate measure of a firm’s performance [54]. According to [6] there is evidence that many SMEs are not
good at managing their working capital and this has been cited as a major cause of their high failure rate
compared with that of large business.
In this study, the researcher used Cash Conversion Cycle and Economic Order Quantity Models in studying the
influence of working capital management practices on financial performance of SMEs in Machakos sub-county.
Cash Conversion Cycle (CCC) is a model that expresses the length of time in days, that it takes a firm to convert
resource inputs into cash flows [7]. The Cash Conversion Cycle attempts to measure the amount of time each
net input in shillings is tied up in the production and sales process before it is converted into cash through sales
to the customers (Charterjee, 2010). Cash conversion cycle (CCC) is a popular measure of working capital
management, Deloof (2003) for example, found that, the longer the time lag, the larger the investment in
working capital.
2.2 Empirical Literature
To test the relationship between working capital management and corporate profitability [15] used a sample of
Belgian firms for a period of 1992 – 1996. By using correlation and regression tests, he found significant
negative relationship, between gross operating income and receivables management, inventory management and
cash management practices of Belgian firms.
Reference [17] empirically examined the relationship between profitability and liquidity as measured by current
ratio and cash conversion cycle on a sample of 929 firms in Saudi Arabia.Using correlation and regression
analysis, he found significant negative relationship between the firm’s profitability and its liquidity level as
measured by liquidity ratio.
Reference [58] studied the effect of different variables of working capital management on the operating
profitability of firms listed on Pakistani Stock Exchange. They selected a sample of 94 Pakistani firms in
Karachi city for a period of six years from 1999 – 2004 and found a strong negative relationship between
variables of working capital management and profitability of the firm. They found out that as the cash
conversion cycle increases, it leads to decreasing profitability of the firm; therefore they suggest that managers
can create a positive value for the shareholders by reducing the cash conversion cycle to a possible minimum

International Journal of Sciences: Basic and Applied Research (IJSBAR) (2016) Volume 30, No 4, pp 286-309
291
level.
Reference [65] researched on the relationship between working capital management and financial performance
of Indian firms, using a sample of 58,985 firms covering the period of 1975 – 1994. The standard measure of
working capital management is the cash conversion cycle. They examined this relationship by using correlation
and regression analysis. They found a strong negative relationship between the length of cash conversion cycle
and financial performance as measured by growth in sales, net income and market share.
Reference [25] examined the effects of working capital management on SMEs profitability on a sample of 8,872
small and medium enterprises in Spain covering the period of 1996 – 2002. Using correlation and regression
analysis they demonstrated that managers could create value for their firms by efficient management of cash,
receivables and inventories.
Reference [59] analyzed the impact of working capital management on firms’ performance in a sample of 204
firms listed on Pakistani Stock Exchange for the period 1998 – 2007. They used Pearson and Spearman’s
correlations and the results indicate that cash conversion cycle and inventory turnover in days are significantly
affecting the firm’s performance.
Reference [64] examined the effect of working capital on profitability of a sample of 263 Indian firms listed at
Bombay stock exchange from 2000 to 2008, using multiple regressions. The results revealed that working
capital management practices and profitability is positively correlated in Indian firms.
Reference [50] examined the implications of a firm’s working capital on its profitability. The study focused on
a sample of 12 firms quoted on the Nigeria stock exchange over five years period 2002 – 2006 using both
Pearson correlation and regression techniques, they observed that the shorter cash conversion cycle promotes
high corporate profitability, therefore, they suggested that firms should formulate and follow a policy that
encourages credit customers to pay their debts the shortest possible time.
Reference [48] examined the effect of working capital management practices on the financial performance of
small scale enterprises (SSEs) in Kisii South District using a sample of 113 SSEs. They used Pearson’s
correlation co-efficients and multiple regression analysis techniques to analyze data. The findings of the study
were that working capital management practices were low amongst SSEs as majority had not adopted formal
working capital routines and their financial performance was positively related to efficiency of cash
management, (ECM) efficiency of receivables management (ERM) and efficiency of inventory management
(EIM).
2.3 Conceptual Framework
Based on the literature under review the researcher has conceptualized the model variables interrelationship as
shown in figure 2.1. The model hypothesizes that efficiency in working capital management practices as
measured by efficiency in cash management, efficiency in receivables management and efficiency in inventory
management has an influence on financial performance of SMEs, as proxied by the growth in sales.

International Journal of Sciences: Basic and Applied Research (IJSBAR) (2016) Volume 30, No 4, pp 286-309
292
Independent variables (WCMP)
Figure No. 2.1: Conceptual Framework for the research
Source: Researcher, (2015)
Dependent variable
Moderating variables
3. Research methodology
3.1 Research Design
This study adopted a cross-sectional survey design, centered on working capital management practices. Cross-
sectional survey is a study in which a population is sampled and studied over the course of only a single contact
period by the use of, one survey, one questionnaire or one observation. [46] studied working capital
management practices of SSEs in six towns in the central Region of Ghana, using cross-sectional survey design,
in which he obtained faster and efficient results, In this current study, the researcher preferred this design since
it provides a quick, efficient and accurate means of accessing information about the population and is
appropriate where there is lack of secondary data, as it is the case of SMEs of Machakos sub-county.
3.2 Target Population
The target population of this study was 159 owners/ managers of trading SMEs operating and registered by the
year 2009, within Machakos Sub- County. All SMEs are privately owned and registered with the County
Registrar of Business, Ministry of Industrialization and Enterprise Development for the period 2011-2015,
(Government of Machakos County).
3.3 Sample size and Sampling Technique

International Journal of Sciences: Basic and Applied Research (IJSBAR) (2016) Volume 30, No 4, pp 286-309
293
According to [49] the sample size should neither be excessively large nor too small, it should be optimal. As a
result 20% of 159 SMEs, that is 32, trading SMEs were selected by random sampling technique to constitute the
study sample, from the following five areas of Machakos town: Machakos Kitui Road 6, Machakos Kangundo
Road 6, Ngei Road 7, Syokimau Avenue 7, and Wote Road 6. The principal factor that influenced the selection
of the five areas was their nature of business.
3.4 Data Collection Procedures and Research Instrument
The questionnaire eliciting the details of working capital management practices were dropped physically at the
owners/managers offices of the 32- SMEs selected randomly. The respondents of this study were
owners/managers. The accompanying letter requested an interview or telephone conversation; because most of
the respondent’s do not have financial background, the researcher had to explain most of the technical terms to
help in obtaining the appropriate responses. Also to prevent the situation whereby some of the respondents
(Owners/Managers) may try to hide information, the researcher visited each and examined the documents
requested for. The coding technique was only used for the matching purpose of the returned completed
questionnaires with those delivered to the respondents.
3.5 Data Analysis
The data collected were quantitative and it was analyzed by descriptive statistics: weighted average, mean and
standard deviation. Correlation and multiple regression analysis were used to measure the relationship between
Working Capital Management Practices and Financial Performance of SMEs in Machakos Sub-County. The
Financial Performance Model that was adopted for this study is as summarized below:
FP=β0+β1ECM+β2EIM+β3ERM+e,
Where, FP= indicator,
Β0, β1, β2&β3=Coefficients,
EMC=Efficiency in Cash Management
EIM=Efficiency in Inventory Management
ERM=Efficiency in Receivables Management and
e =Error Variable.
4. Data analysis, results and discussion
4.1 Cash Management Practices and SMEs Financial Performance
The first objective of this study was to assess the influence of cash management practices on financial

International Journal of Sciences: Basic and Applied Research (IJSBAR) (2016) Volume 30, No 4, pp 286-309
294
performance of SMEs in Machakos Sub-County, Kenya. The results are shown in tables below:
Table No. 4.2: Frequency of occurrence of Cash Management Practices
The analysis is based on the scores scales:
1 - Strongly disagree
2 - Disagree
3 - Undecided
4 - Agree
5 - Strongly agree
Sources: Survey data 2015
Table No. 4.3: Investment of temporary cash surplus
Source: Survey data 2015
International Journal of Sciences: Basic and Applied Research (IJSBAR) (2016) Volume 30, No 4, pp 286-309
295
The study on Cash Management Practices focused on the frequency of cash budgeting, target cash balance
determination, occurrence of cash surpluses, cash shortages and investment of cash surpluses.
On the frequency of preparation of cash budget, the findings are as indicated in Table No. 4.2 .On the average
SMEs’ owners/Managers prepared cash budget; weighted average = 2.50. The majority of respondents (13
respondents representing 59.09% of all respondents) rarely prepared cash budgets (score 1 and 2) on the scale.
Only 5, SMEs, representing 22.72% of all SMEs often prepared cash budgets (Score 4 and 5) on the scale. This
finding indicates that SMEs in Machakos Sub-county did not embrace cash budgeting as a tool to plan and
control cash flows of the businesses, contradictory views were expressed by [42] who established that over
56.23% of the SMEs studied prepared cash budgets on daily basis and used them to plan for shortage and
surplus of cash.
On the frequency of determination of target cash balances, the results of the study is as indicated in Table No.
4.2, indicating that on average 3 SMEs, representing 13.63% of the SMEs indicated that they often determined
their cash balances; (scores 4 and 5) on the scale as compared to 68.18% who indicated that they hardly
determined their target cash balance (score 1 and 2) on the scale. These results imply that on average, majority
of the SMEs rarely determined the appropriate amount of cash to hold in hand. These findings is in agreement
with the pronouncements by [48] who established that small firms rarely pay attention to setting up a cash
policy, but simply consider cash balance in hand as a result of differences in cash inflows and outflows without
any guidelines.
On how regularly SMEs experienced cash surpluses as compared to cash shortages Table No. 4.2 indicated that
on average SMEs experienced cash surpluses regularly and experienced cash shortages irregularly as indicated
by their weighted averages of 3.59 and 2.36 respectively. The majority of the SMEs; (13 representing 59.09% of
all the SMEs) regularly experienced cash surpluses compared to only 1, representing 4.55% of all SMEs that
experienced cash shortages regularly (score 4 and 5) on the scale. This finding supports the assertion by [62]
that established that small firms reserve cash and maintain relatively high current ratios to ensure that they do
not run out of cash, therefore, the conclusion that the management of cash surpluses rather than cash shortages is
a problem for SMEs.
Table No. 4.3, indicates that 45.45% of all the SMEs studied, experienced cash surpluses reported that they
deposited it in bank accounts for earning interest, while 9.09% reported that they had it lying idle in the
business office safe locker. This implies that up to 54.54% of the SMEs did not invest temporary Cash surpluses
for meaningful interest earnings. This finding is in agreement with [48] which established that majority of the
small firms do not invest their cash surpluses in marketable securities.
4.2 Receivables Management Practices and SMEs Financial Performance
The second objective of this study was to determine the influence of receivables management practices on
financial performance of SMEs in Machakos Sub-County, Kenya. The results are as shown in the table below:
International Journal of Sciences: Basic and Applied Research (IJSBAR) (2016) Volume 30, No 4, pp 286-309
296
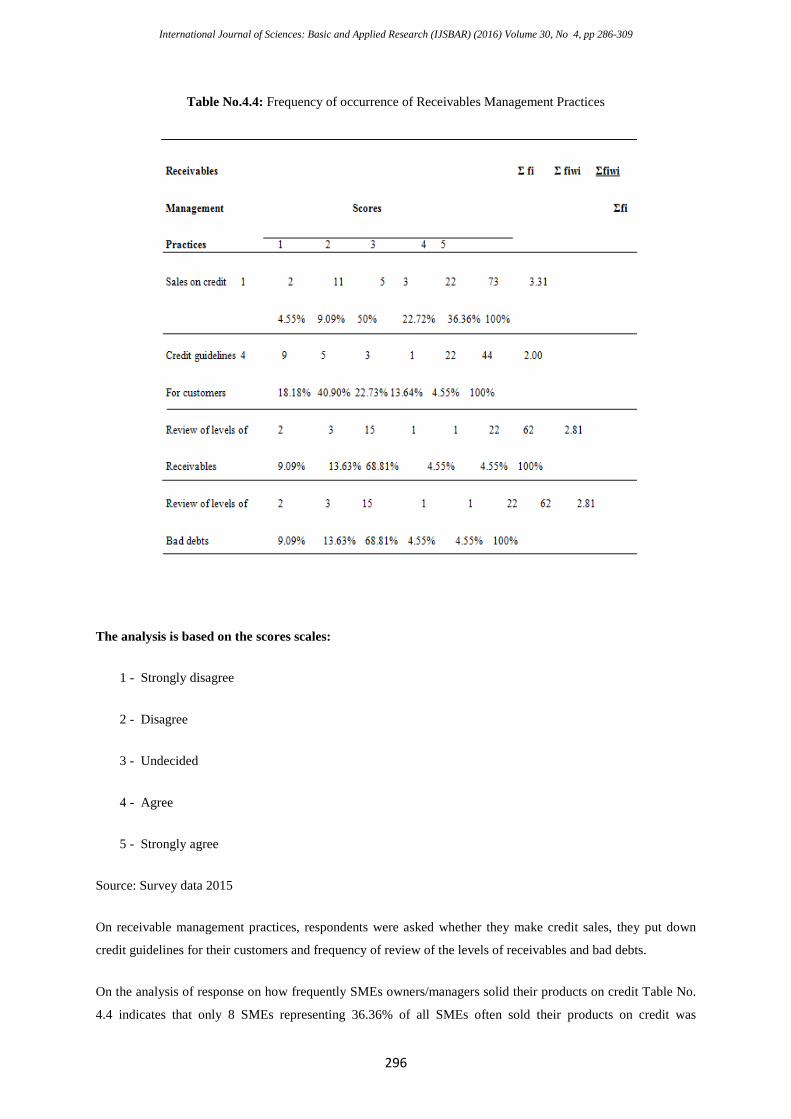
Table No.4.4: Frequency of occurrence of Receivables Management Practices
The analysis is based on the scores scales:
1 - Strongly disagree
2 - Disagree
3 - Undecided
4 - Agree
5 - Strongly agree
Source: Survey data 2015
On receivable management practices, respondents were asked whether they make credit sales, they put down
credit guidelines for their customers and frequency of review of the levels of receivables and bad debts.
On the analysis of response on how frequently SMEs owners/managers solid their products on credit Table No.
4.4 indicates that only 8 SMEs representing 36.36% of all SMEs often sold their products on credit was

International Journal of Sciences: Basic and Applied Research (IJSBAR) (2016) Volume 30, No 4, pp 286-309
297
averagely practiced by SMEs in Machakos sub- county. This is contrary to the findings by [42] which showed
that small businesses always sold their products on credit. The low use of credit sales can be attributed to the
lack of sound policies since majority (14 SMEs representing 63.63% of the SMEs) seem not to set credit
guidelines for their credit customers. As established by [44] pursuing reduced receivables account, causes
diminished financial performance for firms.
On the frequency of review of the levels of receivables and bad debts, Table No.4.4 shows that a substantial
number of respondents (15 SMEs which represents 68.18% of all SMEs) reviewed their levels of receivable and
bad debts regularly. This finding is at variance with [42] finding that most small scale businesses review their
levels of receivables and bad debts irregularly.
4.3 Inventory Management Practices and SMEs Financial Performance
The third objective of this study was to analyze the extent to which inventory management practices influence
financial performance of SMEs in Machakos Sub-County, Kenya.
On inventory management practices, the respondents, were asked how frequently they prepared inventory
budgets, reviewed their inventory levels and the basis on which they determined their inventory levels and their
frequency of inventory replacement. The results are as shown in the tables below:
Table No. 4.5: Frequency on Inventory Management Practices
The analysis is based on the scores scales:
1 - Strongly disagree
2 - Disagree
3 - Undecided
International Journal of Sciences: Basic and Applied Research (IJSBAR) (2016) Volume 30, No 4, pp 286-309
298
4 - Agree
5 - Strongly agree
Source: Survey data 2015
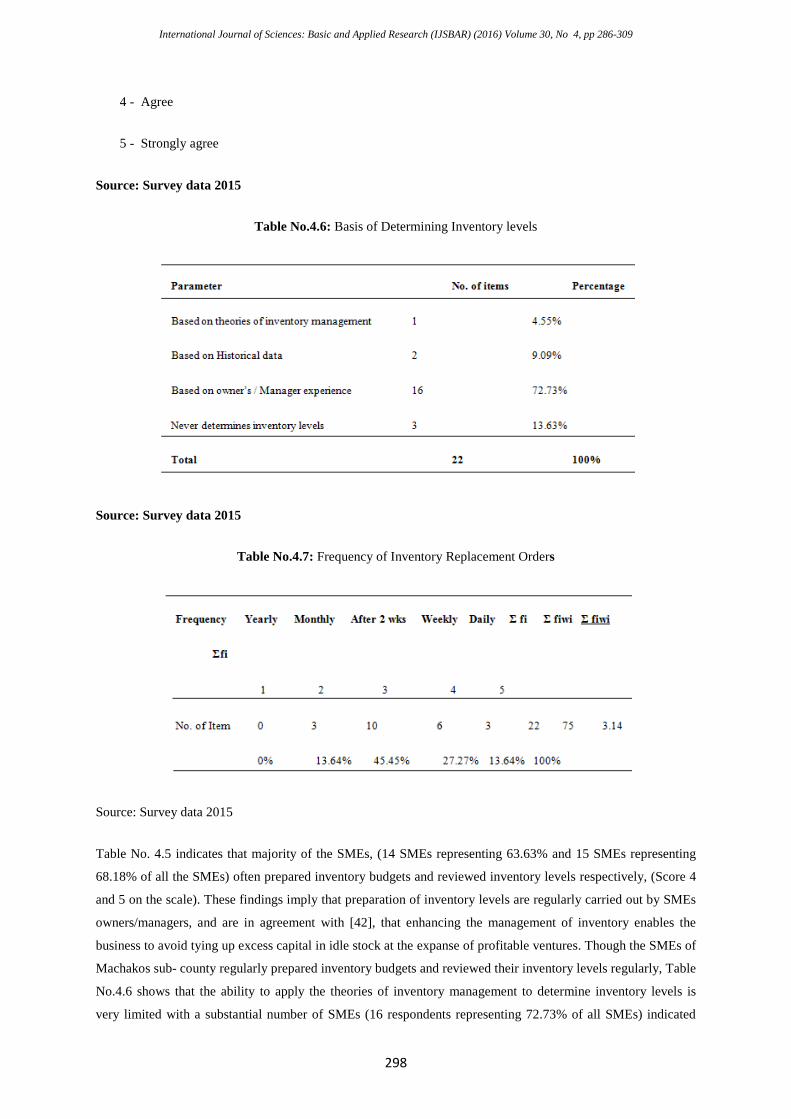
Table No.4.6: Basis of Determining Inventory levels
Source: Survey data 2015
Table No.4.7: Frequency of Inventory Replacement Orders
Source: Survey data 2015
Table No. 4.5 indicates that majority of the SMEs, (14 SMEs representing 63.63% and 15 SMEs representing
68.18% of all the SMEs) often prepared inventory budgets and reviewed inventory levels respectively, (Score 4
and 5 on the scale). These findings imply that preparation of inventory levels are regularly carried out by SMEs
owners/managers, and are in agreement with [42], that enhancing the management of inventory enables the
business to avoid tying up excess capital in idle stock at the expanse of profitable ventures. Though the SMEs of
Machakos sub- county regularly prepared inventory budgets and reviewed their inventory levels regularly, Table
No.4.6 shows that the ability to apply the theories of inventory management to determine inventory levels is
very limited with a substantial number of SMEs (16 respondents representing 72.73% of all SMEs) indicated

International Journal of Sciences: Basic and Applied Research (IJSBAR) (2016) Volume 30, No 4, pp 286-309
299
that they determined their inventory levels on the basis of owner’s/Manager’s experience. A study by [42]
established similar results which showed that up to 90% of owner’s/ Manager’s experience counted a lot in the
management of working capital. The findings that majority of SMEs determined their inventory levels on the
basis of owner’s/Manager’s experience, could be the basis for the findings in Table No.4.7; that 19 SMEs
representing 86.36%, regularly replenished their inventories (Score 3, 4 and 5 on the scale), an indication that
majority of the SMEs in Machakos sub-county do not stock optimal quantities of inventory and do not
determine appropriate re-order levels or points.
4.5 Efficiency of Working Capital Management Practice
Table No. 4.8: Mean and Standard Deviations for Indexed EWCM Variables
Source: Survey data 2015
On the efficiency of working capital Management Practices Table No.4.8 indicates that efficiency in cash
management rated the lowest on average with a mean index of 14.7491 with responses deviating from this mean
by a standard margin of 3.4872. This was followed by receivable management practices with the mean of
15.3381, with a standard deviation of 3.3204, and inventory management practices with the mean of 22.523 and
standard deviation of 5.4414 in that order. This ordering could be interpreted to mean that SMEs in Machakos
Sub- County were more efficient in the management of inventory. Conversely they were less efficient in the
management of their cash. On average, the efficiency levels were low, thus indicating that majority of the SMEs
have not embraced capital management practices in their business operations. These results collaborate with
assertions by [48,42,55] that small firms are not good in the management of their working capital.
4.8 Financial Performance of the SMEs
On the financial performance of the SMEs, respondents were asked to rate their perceived extent of growth in
their businesses’ sales, total assets, net income and market share. The results are shown in the tables below:

International Journal of Sciences: Basic and Applied Research (IJSBAR) (2016) Volume 30, No 4, pp 286-309
300
Table No.4.9: Respondents’ perception on the extent of growth of financial performance Indicators
The analysis is based on the scores scales:
1 - Strongly disagree
2 - Disagree
3 - Undecided
4 - Agree
5 - Strongly agree
Source: Survey data 2015
Table No.4.10: Descriptive statistics for Financial Performance
Source: Survey data 2015

International Journal of Sciences: Basic and Applied Research (IJSBAR) (2016) Volume 30, No 4, pp 286-309
301
Table No. 4.9, indicates that on the average the extent of growth of sales, total assets, net income and market
share was moderate and had weighted average of 2.72,2.77,2.09 and 3.00 respectively. However as indicated in
Table No.4.9 a greater number of SMEs had a growth rate that could be considered low (score 1 and 2 on the
scale) as compared to the number of SMEs whose growth rate could be considered high (score 4and 5 on the
scale). The various ratings of the extent of growth of each financial performance indicator were summed up to
obtain a single financial performance index which ranged from 3 lowest, to 16 highest. The higher the points a
business scored, the higher its financial performance was. Table No.4.10 shows the descriptive statistics for
financial performance of SMEs. The result shows that financial performance from value 5 lowest to value 12
maximum. These results also show an average of financial performance of 9.3236, with the scores deviating
from the mean score by 1.75386. This average score is less than 10; hence the performance of SMEs in
Machakos sub- County was on a low average, similar results were established by [48,10] who established that
over 50.9% of the SMEs studied reported a failing financial performance.
4.9 The Relationship between Working Capital Management Practices and Financial Performance
Table No.4.11: Regression coefficients and collinearity statistics (N= 22)
Predictors (constant); efficient cash management, efficient receivables management, efficient inventory
management.
Dependent variable: financial performance.
Source: Survey data 2015

International Journal of Sciences: Basic and Applied Research (IJSBAR) (2016) Volume 30, No 4, pp 286-309
302
Table No. 4.12: Model summary (N=22)
a) Predictor (constant): Efficient cash management, efficient receivables management, efficient inventory
management.
b) Dependant variable: Financial performance.
Source: Survey 2015
On the relationship between working capital management and financial performance, Pearson’s correlation
coefficients and multiple regression analysis techniques were used to address this objective. Before the
correlation and regression procedures were carried out, the basic assumptions of multiple regression analysis
were verified and they were satisfactorily met as follows; the concern for multicoli-nearity was tested by
observing the variance inflation factors (VIF’s) subject to the rule of thumb that the number should be less than
10 [66]. All the VIFs entries as shown in Table No.4.11were adequately low hence the possibility of
multicolnearity did not exist. The normality of the dependent variable was checked by the use of normal
probability plots (Histo-gram and normal P-P. Plot) which both indicated that the residuals were normally
distributed. The test for the linearity assumption was done by the use of scatter plots and none of the plots
demonstrated a non linear pattern. Constant variance (homoscedasticity) assumption was checked by virtual
examination of a plot of the standardized residuals (the errors) by the regression standardized predicted value.
The residuals were randomly scattered around O (the horizontal line) providing a relatively even distributing
and hence no violations of homoscedasticity were detected.
4.10 Pearson’s Correlation Coefficient Results
The person’s correlation results as indicated in Table No.4.13, shows that there was a strong positive
relationship between SMEs financial performance and efficient cash management (R= 0.4896, F.P< 0.01). Also
a strong positive relationship was established between financial performance and efficient Receivables
management (R= 0.4936, F.P< 0.01).On the other hand, a very strong positive relationship was established
between Financial Performance and Efficient Inventory Management (R=0.5936,FP<0.01).
4.11 Multiple Regression Analysis
The multiple regression analysis was used to deduce a model that could be used to explain the influence of
working capital management practices on financial performance of SMEs. Table No. 4.11 indicates the

International Journal of Sciences: Basic and Applied Research (IJSBAR) (2016) Volume 30, No 4, pp 286-309
303
contribution of each variable in explaining financial performance as shown by standardized beta values which
assess the contribution of each variable towards the prediction of the dependant variable.
Table No.4.13: Correlation Results (N=22)
*Correlation is significant at the 0.01 level (2 tailed)
Source: Survey data 2015
Efficiency in Inventory management had the highest influence on financial performance with a unit change in
the ECM, holding ERM constant, resulting to a 40.4% increase in financial performance, while Efficiency in
Receivables management had the least influence with a unit change in ERM, holding ECM and EIM constant,
resulting to a 12.60% increase in financial performance. The overall equation as suggested in the conceptual
framework can be represented as under:-
F.P = 2.9744+ 0.0976 ECM + 0.06136 ERM +0.1200 EIM
This implies that even without the three variables under study, financial performance is expected to be 2.9744.
Table No.4.12, summarizes the regression model R2 = 0.507 shows 50.7% of the variability of financial
performance could be attributed to changes in Efficiency of Cash Management, Efficiency of Receivables
Management and Efficiency in Inventory Management practices. Comparing the value of R2 and adjusted R2
gives a difference of 0.008 which is too small. This indicates that validity of the model is very good since its
shrinkage is less than the 0.5 threshold suggested by Field (2005).
Table No. 4.12, indicates the F- statistics which indicates that the set of independent variables were as a whole
contributing to the variance in the dependant variable and that there was statistically significant relationship
between Financial Performance and the set of predictor variables (ECM,ERM and EIM) as shown by its F-
statistic (FP =48.989, FP < 0.04).

International Journal of Sciences: Basic and Applied Research (IJSBAR) (2016) Volume 30, No 4, pp 286-309
304
These findings indicate that there is a relatively high support for the existence of a positive significant
relationship between financial performance and working capital management practices. Generally many
researchers have established a positive relationship between efficiency in Working Capital Management
Practices and business performance, ([41,53,45,42,55]). Moreover, based on the findings of this study the
central role of working capital management to the success of SMEs has been demonstrated by the empirical
data from SMEs in Machakos sub- county Kenya. The data analysis indicated that those businesses whose
owners / managers were more efficient in managing working capital elements had a higher financial
performance; hence emphasizing the pronouncement that efficient working capital management is an
indispensable component for the success of SMEs. These findings also reinforce the establishment by [15]
which showed that the way working capital is managed has a significant influence on the overall performance of
a business.
5. Summary, conclusion and recommendations
5.1 Summary of Findings
This study aimed at establishing the influence of working capital management practices on financial
performance of SMEs in Machakos sub-county, Kenya. The study design was cross-sectional survey, centered
on working capital management practices, and it used structured questionnaire and interview methods to collect
primary data.
The population was 159 SMEs operating and registered by the year 2009 within Machakos Sub-County, with
the county registrar of Businesses, Ministry of industrialization and enterprise development. The respondents
who are the owners / managers of the SMEs were selected randomly. The questionnaire was distributed to 32
respondents and 22 returned, yielding a 68.75% response rate. Majority of the respondents (45.45%) were in the
36-45 year age bracket, (31.82%) were in the 46-55 year age bracket, and (22.73%) were in the over 55 year age
bracket. Age bracket 18-25 and 26-35 had no response, an indication that many youths in Machakos sub-county
do not own or manage SMEs. Majority of the respondents (45.45%) had secondary education, while (27.27%)
had diploma education, (9.1%) graduate, (4.54%),(postgraduate and (13.64%) others. This indicates that there is
need for professional training in management for the owners / managers of SMEs, in order to improve
performance of SMEs in general.
5.2 Conclusion
The study established that majority of the SMEs in Machakos Sub-County were not good in managing their
working capital. This was revealed by their low weighted averages or means of efficiency levels in cash,
receivables and inventory management practices. Owners experience was found more important than such
theories as economic order quantity and cash conversation cycle. On this premise this study concludes that
working capital management might be the cause of small and medium enterprises failure in Machakos Sub-
County, this collaborates to a greater extend with previous studies which indicated that careless working capital
management practices is a major cause of SMEs failure [55].

International Journal of Sciences: Basic and Applied Research (IJSBAR) (2016) Volume 30, No 4, pp 286-309
305
5.3 Recommendations
5.3.1: Cash Management
Based on the establishment of the fact that majority of SMEs in Machakos Sub-County experienced surplus cash
regularly the researcher suggests that surplus cash should be invested in overnight call account which yields
high interest returns.
5.3.2 Inventory Management
Based on the establishment that efficient inventory management practices had the greatest influence on financial
performance as indicated by its largest mean and standard statistics, this researcher suggests that SMEs should
pay more attention to the management of inventory since it has a larger influence on financial performance of
SMEs. This study, therefore suggests that SMEs should ensure that stocks are sufficient to meet customer
demands at all times while at the same time avoiding holding unnecessary surplus stocks that may increase stock
holding costs.
5.3.3 Receivables Management
On receivables management practices, this study established the fact that a few of all SMEs under the study sold
their products on credit. The low use of credit sales was attributed to the lack of sound credit policies, since
63.63% of all SMEs studied had not set credit guidelines for their customers. Based on this fact this researcher
suggests that SMEs in Machakos Sub-County should establish credit control department or section with a full-
time responsible officer as already suggested above under inventory management.
5.3.4 Training and Education
Based on the establishment of the fact that majority of the owners/managers of SMEs in Machakos Sub-County
had secondary level of education and financial performance of SMEs had a low average due to inefficient of
working capital management practices, this study suggests that the small and medium enterprises sector needs
effective and dynamic management skills in order to be successful.
References
[1] Abanis, T Arthur, S. and Derick, S (2013) Financial Management Practices and Business Performance
of Small and Medium Enterprises in Western Uganda.” African Journal of Business management vol. 7
(38) pp.3875-3885.
[2] Abdul Rahman, R & Mohamed Ali, F.H (2006) “Board, Audit committee, culture and earnings
management; Malaysian Evidence.”Managerial Auditing Journal, 27 (7), 783-804.
[3] Afza,T,& Nazir, M.S. (2007) Working Capital Management Policies of firms: Empirical Evidence
from Pakistan.
[4] Akoto, R.K. Awunyo – Victor D. 7 Augmor, P.L. (2013). Working Capital Management and
International Journal of Sciences: Basic and Applied Research (IJSBAR) (2016) Volume 30, No 4, pp 286-309
306
profitability: Evidence from Ghanaian listed manufacturing firms. Journal of economics and
international finance, 5(9), 373-379.
[5] Arnold, G. (2008) “ Corporate Financial Management.” Pearson educational limited, 4th edition.ALM,
J. (2000) what is an optimal tax system? In tax policy in the real world.
[6] Atril P (2006). Financial Management For Decision Makers (4th edition) Prentice Hall.International
Inc. New Jersey.
[7] Ben-Horim, M. & Levy, H (1994) “Management of Accounts Receivable under inflation “Financial
management vol. 1.
[8] Bhattacharya, H. (2001). “Working Capital Management Strategies and Techniques”. Prentice Hall,
New Delhi.
[9] Blinder, A.S Macini & L. J, (1991) “The Resurgence of Inventory Research”: What have we learned?
Journal of Economic Survey volume 5, page 291-32
[10] Bowen, M., Morara,M., Murith,S.,(2009). Management of Business Challenges among Small and
Micro Enterprises in Nairobi, Kenya. Retrieved from http//wwkcajournals.com. KCA
J.Bus.manag.2:1
[11] ChatterJee ,B (2010), “Finance for Non-Finance.Fourth Edition,JAICO Publishing House, Mumbai,
India.
[12] Chittendend, F, & Poutziours N. (1998). “Financial Management and Working Capital Practices in UK
SMEs” Manchester”. Manchester Business School.
[13] Clark, R. & Aram, J. (1997). “Universal Values, Business Ethics on Financial Performance of SMEs”
Journal of Business Ethics, Vol. 1 (16) No. 561-572 Cunningham, R.B. Nikolai, L.A and Bazley J.D.
(2000) “Accounting Information and for Business Decisions. New York: Harcourt College Publishers.
[14] Daniel, M.M. & Ambrose, J. (2013). Working Capital Management and Firm Productivity: Empirical
evidence from manufacturing and contribution firms listed on Nairobi securities 1 (1), 11 – 21
[15] Deloof M. (2003) “Does Working Capital Management Affect Profitability of Belgian Firms?” Journal
of Business Finance and Accounting, 30(314):573-587.
[16] Dunn P. & Cheatham L (1993). “Fundamentals of small business Financial Management for start-up,
Survival, Growth and Changing Economic Circumstances”. Management Finance, Vol.19.No.8 pg.1-
13.
[17] Eljelly A. (2004). Liquidity – Profitability trade-off. An empirical investigation in an emerging
market. International Journal of commerce and management 14 (2), pp.48 - 61.
[18] Emergy GW, (1987) An Optimal Finance Response to variable Demand. Journal of Financial and
Quantitative Analysis volume 22, page 209-225
[19] Erik Rehn (2012) Effects of Working Capital Management on Company Profitability: An Industry-
wise Study of Finish and Swedish Public Companies.
[20] Eugene F Brigham & Joel F Houston,(2010) “Financial Management”: Theory and practice, 11th
Edition pg. 742-782.
[21] Falope O.I, Ajilore O.I, (2009). Working Capital Management components and corporate profitability:
Evidence from power data analysis of selected quoted companies in Nigeria. Research Journal of
Business Management; 3:73 – 84
International Journal of Sciences: Basic and Applied Research (IJSBAR) (2016) Volume 30, No 4, pp 286-309
307
[22] Field A (2005). Discovering Statistics using SPSS, 2nd Edition. SAGE Publications London
[23] Finan Bank Report (2007) Why Small Business Fail Nairobi Kenya. FSD (2009). National Survey of
Financial Services Assess. Finances, Kenya.
[24] FSD (2009) National Survey of Financial Services Assess. Finances, Nairobi, Kenya.
[25] Garcia – Turuel P.J. & Martinez-Solano PM, (2007). Effects of WCM on SME profitability.
International Journal of Management Finance 3; 164 – 177.
[26] Garlick, P. C. (1971). “African Traders and Economic Development in Ghana”. London of Oxford
University Press.
[27] George, F. (2010) Essentials of Financial Management 13rd Edition. Peason Prentice Hall.
[28] Gilem, A, & Giliem, R. (2003) Calculating, Interpreting and Reporting Cronbachs Alpha Reliability
coefficient for Likert-Type Scales.Nairobi: ICEG.
[29] Gitman, L.A (2005). Principles of Managerial Finance (11th Edition) New Yolk: Addison Wesley
Publishers
[30] Gitman, L.J (1994). Principles of Managerial Finance, 7th Edition. Harper Collins pg 573-
587Environment, Nairobi: ICEG.
[31] Grablowisky, B.T. & Rowell, D.R. (1980) “Small Business Financial Management. Theory and
Practice”, New folk: Old Dominion University.
[32] Hawawin, G. Viallet, C. & Vora, A. (1986). “Industry influence an corporate working capital
decisions”. Sloan Management Review, Vol. 27 No. 4, PP 15 – 24.
[33] Hossain, S. Z. & Akon M.H.R (197). “Financing of working capital: Case study of Bangladesh
Textile Mills Corporation”. Journal of Financial Management and Analysis, 10 (2), 37 – 42
[34] Ilo (2010) Voucher Program for Training and Business Development Services, Kenya Micro and Small
Enterprise Training and Technology project.
[35] John, J. Hampton (2009). Financial Decisions Making. “Concepts, Problems and Cases” 4th Edition
PHI Learning Private Ltd. New Delhi, India.
[36] Jose, M. (1996) Corporate Return and Cash Conversion Cycle, Journal of Economics and Finance,
volume 20, page 33-46.
[37] Kasenja, D., Mihajlow (2012). Impact of Accounts Receivable management On Profitability during the
Financial Crisis; Evidence from Serbia.
[38] KASNEB Newsline October- December (2012).
[39] Karen, P. Schoenebeck, Mark P. Holtzen (2010) Interpreting and Analyzing Financial statements 5th
Edition. Prentice Hall, New York.
[40] Kenya National Bureau of statistics (2007). Micro and small Enterprises survey, Nairobi, Kenya.
[41] Kotut, P.K. (2003) Working Capital Management Practices by Kenyan Firms. A case study of firms
listed in the NSE, unpublished MBA project. Egerton University.
[42] Kwame, K. (2007) Working Capital Management Practices of Small Firms in the Ashant Region of
Ghana.
[43] Lamberg, S.&, Sandra V. (2009). Impact of Liquidity Management on Profitability. A study of the
adaption of liquidity strategies in a financial crisis.
[44] Lazarids, I, & Tryfonidis, D. (2006). Relationship between working capital management and

International Journal of Sciences: Basic and Applied Research (IJSBAR) (2016) Volume 30, No 4, pp 286-309
308
profitability of listed companies in the Athens stock exchange. Journal of Financial Management and
Analysis 19:26 – 25
[45] Lizarids & Dimitrios Tryfonid, (2006) “Relationship Between Working Capital Management and
Analysis”, Vol.18 no.1 pg. 26-35.
[46] Marfo-Yiadom, E. (2003). “Working capital Management practices of SMEs in Central Religion of
Ghana”. Asian Journal of Business and Management Sciences. Vol. 1 No. 4 (29 – 47)
[47] Mathuva, D. (2010). The influence of WCM components in corporate profitability: A survey on
Kenyan listed firms. Research. Journal of Business Management, 3: 1
[48] Nyabwanga, R. N., Odera, P. Luminba M. Odondo, A.J. & Otieno, S. (2012) Effects of working
Capital Management Practices on Financial Performance: A study of Small Scale Enterprises in Kisii
south District, Kenya. African Journal of Business Management 6 (18) 5807 – 581
[49] Oketch Ho, (2000). Micro and Small Enterprises in Kenya; Agenda for improving the Policy
Environment. Nairobi , ICEG.
[50] Oladipupo, R. N. & Okafor, C.A (2013) Relative contribution of working capital management to
corporate profitability and dividend payout ratio: Evidence from Nigeria, International journal of
Business and Finance Research, 3 (2), 11 – 20
[51] Oso, WY, & Onen, D. (2005). A General Guide to writing Research Proposal and Reports. A hand
book for beginning researchers.2nd Edition. Makerere University Press, Kampala, Uganda.
[52] O`Regan,N.,(2012) Strategic Positioning and grand strategies for high-technology SMEs, Strategic
Change, 21,199-215.
[53] Padachi, K. (2006) Trends in Working Capital Management and its Effects on Firms’ Performance.An
Analysis of Mauritian Small Manufacturing Firms. Business Research 2(2):45-58
[54] Panday, I.M. (2004). Financial Management 9th Edition. Vikas Publishing House Private Ltd.
[55] Peel, M. & Wilson,N. (1996). Working Capital and Financial Management Practices in the Small Firm
Sector.
[56] Peterson, M,& Rajan R (1997). “Trade Credit; Theories and Evidence. Review of Financial Studies”
Volume 10, page 661-691.
[57] P. Garcia-Teruel & P. Martinez-Solon (2007) “Effects of Working Capital Management on SMEs
Profitability” international Journal of Managerial Finance,Vol.3 no.2 pg. 174 .
[58] Raheman, A., Afza, T., Qayyam, A.& A. Bodle (2010). Working Capital Management and Corporate
performance of manufacturing sector in Pakistani. Internal Research Journal of Finance and
Economics, Issue 47, 151 – 163
[59] Raheman, A. & Nasri M. (2007). Working Capital Management and profitability – case of Pakistani
Firms. International Review of Business Research papers, 3 (1), 279-300
[60] Robert,M. & Geoffrey N. (2010). Financial Management, 1st Edition,Focus Publishers,Nairobi,
Kenya.
[61] Salawati Sahari, Micheal Tinggi, & Norlina, K. (2012). Inventory Management In Malysian
Construction Firms: Impact on Performance.
[62] Scarborough, NM, & Zimmere, T.W. (2003). Effective Small Business Management.
[63] Sehgal, S., Sahay, B.S. and Goyal, S.K. (2006) “Reengineering the supply chain in a paint company”.

International Journal of Sciences: Basic and Applied Research (IJSBAR) (2016) Volume 30, No 4, pp 286-309
309
International Journal of productivity and performance management, 55(8),655 – 670.
[64] Sharma, A. K. & Kumar, S. (2011). Effects of Working Capital Management on firm profitability:
Empirical Evidence from India, Global Business Review, 12 (1) 159 – 173
[65] Shin & Soenen (1998). “Efficiency of working capital management and corporate profitability”.
Practice and Education.
[66] Storey, D.J. (1994). Understanding the Small Business Sector: Routledge London.
[67] Sushma, V.&. Bhupesh, S. (2007). Effect of Working Capital Management Policies on Corporate
Performance an Empirical Study.
[68] Smith, K. (1980). Profitability verses Liquidity Trade-offs in Working Capital Management.
[69] Wood, A. (1993).“Efficient Consumer Response”. Logistics Information Management, 6(4),38– 40.
[70] Woodward, J. (1965), “Industrial Organization, Theory and Practice”. London, U.K. Oxford
University Press.
[71] Zanyawati, M.A, Annura, M.N. Taufiz, H. & Rahimu A.S.A (2008) Working Capital Management and
corporate performance: A case of Malaysia. Journal of modern accounting and Auditing, 5 (11), 47 –
54.


