1
Department of Business Economics
Doctorate in Entrepreneurship and Management
DOCTORAL THESIS
FROM MARKET ORIENTATION TO ORIENTATION TOWARDS INTERNATIONAL MARKETS (OIM) OF BORN GLOBAL FIRMS:
EVALUATING THE IMPACT OF OIM ON BORN GLOBAL FIRMS' PERFORMANCE
By:
Rosalina Torres Ortega
Supervisor:
Prof. Josep Rialp Criado
UAB - Campus Bellaterra, (Cerdanyola del Vallès),
November 2015, Barcelona, Spain.
2
ABSTRACT
Although there is a considerable amount of research on market orientation, research on
this concept in the context of born global firms is still lacking a precise definition and
full operationalization. This research aims to investigate how the market orientation
(MO) concept could be understood for a specific type of firm: the born global firm. The
thesis is framed around three studies.
First, an exploratory study that was developed by performing qualitative interviews in a
sample of five Spanish firms from different sectors which had international activity. The
data were analyzed using cross-case analysis. The results suggests that the market
orientation concept should be developed into the concept of orientation towards
international markets (OIM) for born global firms. This study also provides the
components for measuring this orientation in this type of firm.
Second, using samples of born global firms from the Nordic countries and Spain, we
assess the dimensionality of OIM by considering the optimal number of scale items,
with the exception of the network construct, and assess the measurement invariance of
the construct across the samples. The results support the conceptualization of OIM as a
multidimensional construct, using customer orientation, competitor orientation,
interfunctional coordination, and innovativeness and technological capability.
Measurement invariance was assessed using multi-group confirmatory factor analysis.
The factors outlined above have a similar dimensionality and factor structure across
countries.
Finally the third study, examines how the extended concept of market orientation for
born global firms that we have called OIM affects business performance, as measured
by customer performance and financial performance, in the context of born global firms,
and whether this effect varies between countries. The results show that the OIM
components have a positive and significant effect on business performance in born
global firms in both contexts (Nordic and Spanish companies) through customer and
financial performance.
Based on these research findings, the thesis‘s main theoretical contribution is the
suggestion of how MO should be conceptualized for BG firms. Our findings provide
evidence that it is necessary to incorporate components that relate to the international
scope of this type of firm, with the concept of OIM. From a business practice
perspective, this dissertation suggested that the scale we have developed can provide a
reliable and valid analytical tool for assessing the orientation towards international
markets of these firms. Thus born global managers may adopt the scale for a better
understanding of the reality of foreign markets and to develop effective strategies to
attract and retain customers in different markets overseas.
Keywords: Born global firms, market orientation, orientation towards international
markets, performance, scale validation, multi-country approach, structural equation
model.

3
DEDICATION TO MY MOTHER AND FATHER,
BROTHERS, SISTER AND TO MY FOUR LOVELY KIDS.

4
ACKNOWLEDGEMENTS
The writing of this doctoral dissertation has allowed me to meet wonderful people, who
have always given me support and advice. First, I would like to thank my supervisor
Josep Rialp. It has been a privilege to have you involved in my research, and with your
advice and guidance I have been able to face every challenge during the preparation of
this thesis.
I have been lucky to have great professors at the Business Department of Economics at
the Autonomous University of Barcelona during my PhD courses, who have always
shared their experience and knowledge in every class, and provided insights that guided
the development of this research.
Next I wish to thank Prof. Tage Koed Madsen from the University of Southern
Denmark and Niina Nummela from the Turku School of Economics for believing in my
research project and allowing me to complete my data collection of born global firms as
a visiting scholar in your universities. Thank you for your excellent comments and
suggestions for the development of this research. I would also like to thank the external
examiners of my thesis. I greatly appreciate your taking the time to review my
dissertation and for your constructive suggestions for further improvements, which have
been extremely useful to improve the dissertation.
During my doctoral studies I have received funding from various sources, and I want to
express my warmest thanks for this to the following institutions: the MAEC-AECID
Scholarship Program, CIMO and the Turku School of Economics.
Many thanks to the Owners, CEO and export managers of the born global firms from
Denmark, Finland and Spain, who involved in the survey, interviews and activities
related to the research. Without their involvement, this dissertation would not have been
possible.
I want to take this opportunity to thank all my friends for their unconditional support
during the hardest times: Aina, Mile, David, Graciela, Irisbelsy, Anabeth, Claudia,
Alejandro, Miriam, Aurora, Eduardo, Margarita, Fiona, Williams, Luis and Hernán.
Finally, I want to thank my family for their infinite love and support at every stage of
this research. Last but not least, to God for giving me the strength every day.
5
TABLE OF CONTENTS 1 CHAPTER ONE: INTRODUCTION .................................................................... 11
1.1 RESEARCH QUESTION .................................................................................. 13
1.2 RESEARCH OBJECTIVES ............................................................................... 13
1.3 RESEARCH METHODOLOGY ....................................................................... 15
1.3.1 Research approach .................................................................................... 16
1.4 THE STRUCTURE OF THE STUDY ............................................................... 19
1.5 REFERENCES ................................................................................................... 21
2 CHAPTER TWO .................................................................................................... 26
2.1 INTRODUCTION .............................................................................................. 27
2.2 LITERATURE REVIEW ................................................................................... 29
2.2.1 Literature review of born global firms ..................................................... 29
2.2.2 Market orientation .................................................................................... 38
2.3 RESEARCH QUESTIONS ................................................................................ 54
2.4 METHODOLOGY ............................................................................................. 54
2.4.1 Research method: Exploratory study ........................................................ 55
2.4.2 Research design ........................................................................................ 56
2.4.3 Data collection .......................................................................................... 57
2.4.4 Protocol development ............................................................................... 58
2.4.5 Qualitative data analysis ........................................................................... 59
2.5 FINDINGS ......................................................................................................... 60
2.5.1 Within analysis ......................................................................................... 60
2.5.2 Cross-case analysis ................................................................................... 64
2.6 CONCLUSIONS, LIMITATIONS AND FUTURE RESEARCH .................... 76
2.7 REFERENCES ................................................................................................... 79
3 CHAPTER THREE ................................................................................................ 99
3.1 INTRODUCTION ............................................................................................ 100
3.2 LITERATURE REVIEW ................................................................................. 100
3.2.1 Scale development and validation .......................................................... 100
3.2.2 The procedure/stages .............................................................................. 101
3.2.3 The statistical methods ........................................................................... 104
3.3 RESEARCH METHODOLOGY ..................................................................... 108
3.3.1 Research context ..................................................................................... 108
6
3.3.2 Data collection and sample ..................................................................... 108
3.3.3 Common method bias ............................................................................. 110
3.4 DISCUSSION AND CONCLUSIONS ............................................................ 124
3.4.1 LIMITATIONS AND FUTURE RESEARCH ...................................... 128
3.5 REFERENCES ................................................................................................. 129
4 CHAPTER FOUR ................................................................................................ 143
4.1 INTRODUCTION ............................................................................................ 144
4.2 LITERATURE REVIEW ................................................................................. 144
4.2.1 Born global firms and strategic orientation ............................................ 145
4.2.2 Measurement of performance in the context of born global firms ......... 146
4.2.3 Orientation towards international markets and performance: Using the
approaches of the resource based view and dynamic capability .......................... 151
4.3 METHODOLOGY ........................................................................................... 155
4.3.1 Sample .................................................................................................... 155
4.3.2 Data analysis technique .......................................................................... 155
4.3.3 Data analysis tools/issues with SEM ...................................................... 157
4.3.4 Measurements of constructs ................................................................... 159
4.3.5 Performance ............................................................................................ 160
4.4 DATA ANALYSIS AND RESULTS .............................................................. 161
4.4.1 Assessment of the construct of performance .......................................... 161
4.4.2 Complete measurement model (six constructs) ...................................... 167
4.4.3 Configural and metric invariance of full measurement model ............... 173
4.4.4 Structural Model ..................................................................................... 174
4.4.5 Hypothesis Testing ................................................................................. 176
4.5 DISCUSSION AND CONCLUSION .............................................................. 177
4.5.1 Limitations and future research .............................................................. 179
4.6 REFERENCES ................................................................................................. 181
5 CHAPTER FIVE: CONCLUSIONS .................................................................... 198
5.1 INTRODUCTION .............................................................................................. 198
5.2 THEORETICAL CONTRIBUTIONS ................................................................ 200
5.3 MANAGERIAL IMPLICATIONS .................................................................... 204
5.4 STUDY LIMITATIONS .................................................................................... 205
5.5 SUGGESTIONS FOR FUTURE RESEARCH .................................................. 205
5.6 REFERENCES ................................................................................................... 208

7
LIST OF APPENDICES
APPENDIX 1 MO in the international context of the firms ..................................... 25
APPENDIX 2 Interview protocol (Spanish version) ................................................ 91
APPENDIX 3 Interview protocol (English version)................................................. 96
APPENDIX 4 Scale development and validation ................................................... 138
APPENDIX 5 Summary of model fit indices ......................................................... 141
APPENDIX 6 The proposed scale for measuring the OIM of BG firms ................ 142
APPENDIX 7 Performance measurement of empirical studies of BG firms ......... 193
APPENDIX 8 MKTOR scale with born global firms sample ................................ 195
APPENDIX 9 Survey Spanish version ................................................................... 210
APPENDIX 10 Survey English version.................................................................... 214
8
LIST OF FIGURES
Figure 1The research wheel (adapted from Rudestam and Newton, 2007 p. 5) ............ 18
Figure 2 Overview of the Chapters of the Thesis ........................................................... 20
Figure 3 Diverse perspectives of Market Orientation (Adapted from Becker, and
Homburg, 1999) ............................................................................................................. 40
Figure 4 The Ladder of Analytical Abstraction (Miles & Huberman, 1994). ................ 56
Figure 5 Network View: Market Orientation and Born Global Firms ........................... 65
Figure 6 Market Orientation and Performance in Born Global Firms ........................... 67
Figure 7 Items Proposed by Born Global Firms ............................................................. 73
Figure 8 Scale Development Process for OIM ............................................................. 112
Figure 9 Original Measurement Model of OIM of BG Firms ...................................... 118
Figure 10 Features of the SEM ..................................................................................... 159
Figure 11 Final Measurement Model of Performance.................................................. 165
Figure 12 Full Measurement Model of OIM and Performance .................................... 168
Figure 13 Structural Model of OIM of Born Global Firms .......................................... 175
Figure 14 Traditional Market Orientation, and Orientation towards International
Markets of Born Global Firms...................................................................................... 204
9
LIST OF TABLES
Table 1The major differences between inductive and deductive approaches to research
(Adapted from Saunders et al. 2009, p. 127) .................................................................. 17
Table 2 The studies on Internationalization of the firms during 46 years ...................... 29
Table 3 Born global firms: relevant studies ................................................................... 31
Table 4 Features on Born Global Firms ......................................................................... 32
Table 5 Differences between traditional and born-Global firms (Adapted from Chetty
and Campell-Hunt, 2004) ............................................................................................... 33
Table 6 Selected classifications of Born Globals approaches ........................................ 36
Table 7 Description of MKTOR (Adapted from Narver and Slater (1990) ................... 43
Table 8 MKTOR scale (Adapter from Narver and Slater 1990, p.24) ........................... 43
Table 9 Description of MARKOR (Adapted from Kohli and Jaworski, 1990) ............. 44
Table 10 The MARKOR Scale (Adapted from Kohli et al. 1993, p. 476) ..................... 45
Table 11 The two main measurement of Market Orientation: different studies focus on
the MARKOR and MKTOR .......................................................................................... 47
Table 12 Empirical studies of born global firms/international new ventures and market
orientation ....................................................................................................................... 53
Table 13 The five born global Firms: general overview ............................................... 62
Table 14 Market orientation: Scales and items selection by Born Global firms ............ 70
Table 15 The Scale proposed: OIM ................................................................................ 74
Table 16 Data collection process and final answers identified .................................... 109
Table 17 Characteristics of the BG firms: Nordic firms and Spain firms (percentage) 110
Table 18 KMO and Bartlett's Test of Sphericity .......................................................... 114
Table 19 Exploratory Factor Analysis .......................................................................... 116
Table 20 Goodness-of-Fit Summary of the OIM Scale ................................................ 120
10
Table 21 Internal consistency and convergent validity ................................................ 121
Table 22 Discriminant validity of the theoretical construct measures ......................... 122
Table 23 Measurement invariance test ......................................................................... 124
Table 24 Scale of orientation towards international markets of Born Global firms..... 125
Table 25 Structural Equation Model stages to OIM of BGs (Adapted from Andersen &
Gerbing, 1988 and Hair et al. 2010) ............................................................................. 156
Table 26 Performance of Born Global firms ................................................................ 161
Table 27 KMO and Bartlett's test of sphericity of performance .................................. 162
Table 28 Performance Factors ...................................................................................... 164
Table 29 Goodness-of-fit Summary of the Performance.............................................. 165
Table 30 Internal consistency and convergent validity of the Performance ................. 166
Table 31 Discriminant validity of the Performance ..................................................... 166
Table 32 Measurement invariance test of performance................................................ 167
Table 33 Full measurement model: OIM and performance ......................................... 169
Table 34 Internal consistency and convergent validity of full measurement model .... 171
Table 35 Discriminant validity of the full measurement model ................................... 172
Table 36 Measurement invariance of the full measurement model ............................. 173
Table 37 Measures of the fit in the structural model .................................................... 176
Table 38 Structural results: OIM of BG firms impacted on performance ................... 176
Table 39 Measurement results of the final model of Spanish and Nordics subsamples:
OIM of BGs impacted on performance ........................................................................ 177
Table 40 Orientation towards international markets of born global firms: research
conclusions ................................................................................................................... 201
11
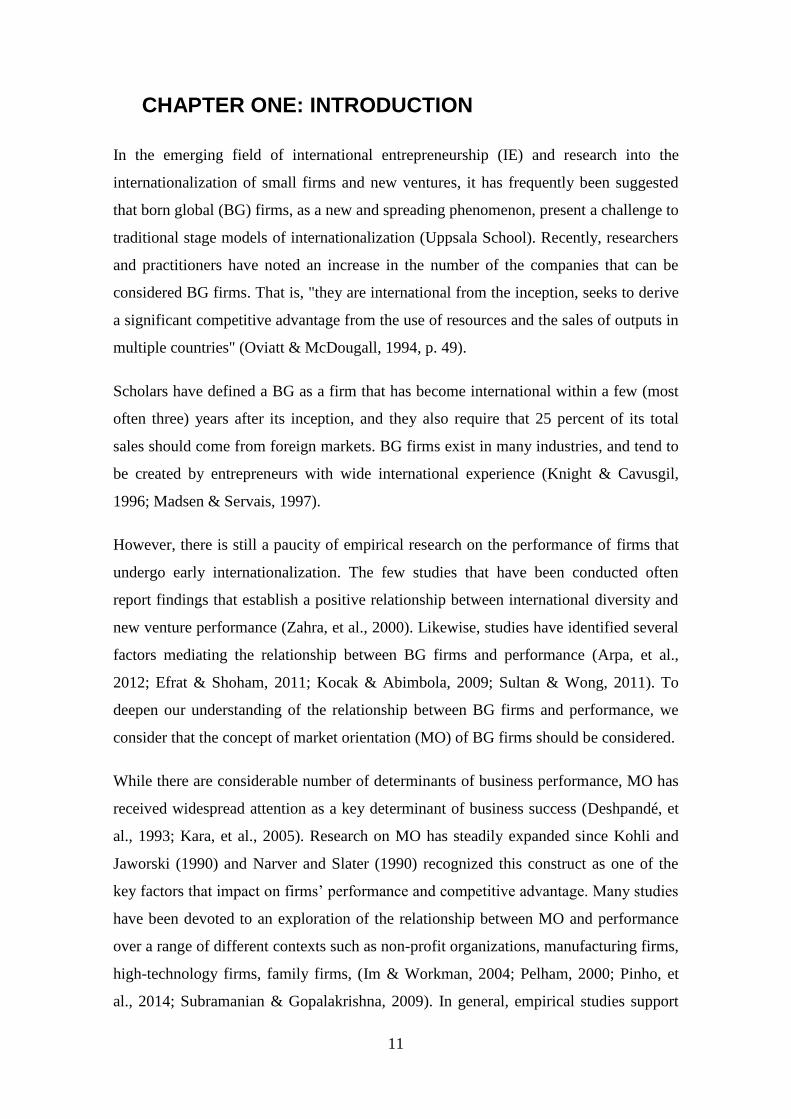
1 CHAPTER ONE: INTRODUCTION
In the emerging field of international entrepreneurship (IE) and research into the
internationalization of small firms and new ventures, it has frequently been suggested
that born global (BG) firms, as a new and spreading phenomenon, present a challenge to
traditional stage models of internationalization (Uppsala School). Recently, researchers
and practitioners have noted an increase in the number of the companies that can be
considered BG firms. That is, "they are international from the inception, seeks to derive
a significant competitive advantage from the use of resources and the sales of outputs in
multiple countries" (Oviatt & McDougall, 1994, p. 49).
Scholars have defined a BG as a firm that has become international within a few (most
often three) years after its inception, and they also require that 25 percent of its total
sales should come from foreign markets. BG firms exist in many industries, and tend to
be created by entrepreneurs with wide international experience (Knight & Cavusgil,
1996; Madsen & Servais, 1997).
However, there is still a paucity of empirical research on the performance of firms that
undergo early internationalization. The few studies that have been conducted often
report findings that establish a positive relationship between international diversity and
new venture performance (Zahra, et al., 2000). Likewise, studies have identified several
factors mediating the relationship between BG firms and performance (Arpa, et al.,
2012; Efrat & Shoham, 2011; Kocak & Abimbola, 2009; Sultan & Wong, 2011). To
deepen our understanding of the relationship between BG firms and performance, we
consider that the concept of market orientation (MO) of BG firms should be considered.
While there are considerable number of determinants of business performance, MO has
received widespread attention as a key determinant of business success (Deshpandé, et
al., 1993; Kara, et al., 2005). Research on MO has steadily expanded since Kohli and
Jaworski (1990) and Narver and Slater (1990) recognized this construct as one of the
key factors that impact on firms‘ performance and competitive advantage. Many studies
have been devoted to an exploration of the relationship between MO and performance
over a range of different contexts such as non-profit organizations, manufacturing firms,
high-technology firms, family firms, (Im & Workman, 2004; Pelham, 2000; Pinho, et
al., 2014; Subramanian & Gopalakrishna, 2009). In general, empirical studies support
12
the view that MO has a positive effect on firm performance (Morgan et al., 2009). Our
review indicates that in recent years the definition and measurement of MO for
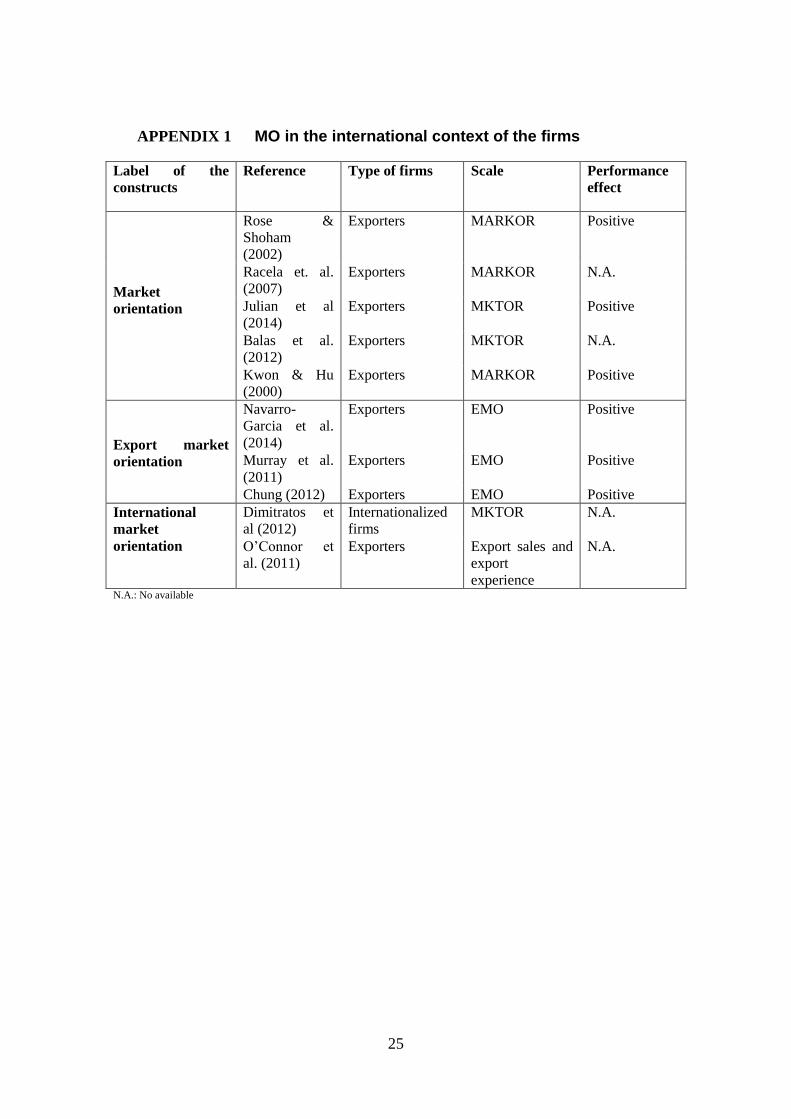
international firms has varied in different pieces of empirical research (see Appendix 1).
Some studies (for example, Kwon & Hu, 2000; Rose & Shoham, 2002) have focused on
the relationship between MO and export performance, while other scholars have
decided to build on the work of Cadogan et al. (1999) and emphasize export market
orientation (Murray, et al., 2011; Chung, 2012); another stream of research refers to
international market orientation (Dimitratos et al., 2012). Based on exporting firms,
most of these studies that investigated the relationship of MO with performance found a
positive effect.
Although there seems to be a consensus on the positive impact of MO on business
performance, to date the literature has not settled on a consistent operationalization for
BG firms. Some research contributions indicate a positive relationship between firms
that operate in the international context and the adoption of MO (Armario, et al., 2008;
Brännback, et al., 2007; He & Wei, 2011; Kropp et al., 2006; Odorici & Presutti, 2013).
For instance, Odorici and Presutti (2013), based on eight Italian BG start-ups, show a
successful market-oriented mindset among the entrepreneurs. With a focus on the
entrepreneurial experience, the authors studied how different strategic orientations
(entrepreneurial, learning and market orientation) influence foreign growth and
performance abroad. However, the nature of the relationship between MO and its
components and the business performance of BG firms is still under-researched.
Kirpalani and Gabrielsson (2012), in their review of the research areas that still need to
be covered in the field of BG firms, concluded that only a few empirical studies look at
the consequence of MO in BG firms. Past research on IE shows some key differences
between BG firms and other types of international firms (Moen, 2002; Li et al., 2012)
and, as a result, one could expect the role of MO in BG firms to be quite distinct from
its role in companies that have followed a gradual process of internationalization.
Taking these observations into account, in this thesis we aim to contribute to the IE
literature with a more detailed examination of how MO is conceptualized for BG firms
and whether it affects the business performance of the firm.
13
1.1 RESEARCH QUESTION
Small and medium-sized enterprises (SMEs) seek to enter international markets for
different reasons including, for instance, to survive and grow (Autio et al., 2000). A
large amount of the recent literature on international business has dealt primarily with
the internationalization pattern of BG firms. Kuivalainen et al. (2007) argue that
―despite the recent increase in ‗born-global‘ studies, there has been little research on
how the scale and scope of being a born global firm affects performance‖ (p. 253).
On the other hand, the relationship between MO and performance has been investigated
by many researchers (Greenley, 1995; Han et al., 1998; Ngo & O‗Cass, 2012), but
previous research has not addressed this relationship in the context of BG firms.
Consequently, the general research question of this doctoral dissertation is: How the
market orientation concept can be transferred to the context of Born-global firms and
which are the implications on performance for this type of firms?
1.2 RESEARCH OBJECTIVES
The significance of MO as a phenomenon has fostered a steady stream of research in the
marketing literature since the works of Kohli and Jaworski (1990) and Narver and Slater
(1990) were published. However, the existing literature indicates that an area of
research that continues to captivate the attention of scholars involves the validation of
measurement scales (Oczkowski & Farrell, 1998; Schlosser & McNaughton, 2009;
Siguaw & Diamantopoulos, 1994). The MO measurements were first used in the
context of the domestic market, and some modification of the components as well as the
items should perhaps be made when the interest is to measure the MO in early
international firms. So, the first research objective formulated in this research was the
following:
(1) Explore the adequacy of the traditional market orientation measurement
scales for born global firms.
The dissertation adopts an integrated perspective to search for insights into the adequacy
of the traditional MO measurement scales for BG firms. In other words, the first
14
research aim was to obtain an impression from BG firms regarding the traditional MO
concept, the usefulness of the traditional scales for measuring MO and whether these
scales are useful in the specific context of firms that undergo early internationalization.
These underpinnings may serve as a basis for creating the MO concept for firms that
have been focused on international markets since the very beginning, as well as for the
scale that should be statistically tested among BG firms. Therefore, the second research
objective is:
(2) Validate the proposed scale that taking into account the scope of the born
global firms in cross-country comparison.
The cross-country examination tested the psychometric properties of the proposed scale
with samples from Denmark, Finland, and Spain. These countries have been the focus
of numerous studies of the phenomenon of BG firms (Anderssson & Wictor, 2003;
Blesa et al., 2008; Larimo, 2003; Madsen & Servais, 1997). Although there have been
many calls for the cross-cultural validation of measures used in international research,
these calls have mostly gone unanswered (Murray et al., 2007). Consequently, there is a
need to identify and validate the proposed measurement tool in many countries in which
a strong presence of firms that have been internationalized early has been detected.
In addition, the third research aim, which is confirmatory in nature, attempts to assess
the impact of the studied concept on the results of these rapidly internationalized firms.
(3) Analyzing the impact the proposed measure of market orientation on
performance of firms that have been focused on international markets since their
very beginnings.
The influence of MO tends to result in better business performance (Kirca et al., 2005).
There has been little empirical investigation of the relationship between market
orientation and performance in the context of BG firms. Therefore, the third objective
examines the relationship of MO and performance of firms that have undergone early
internationalization.
15
1.3 RESEARCH METHODOLOGY
This thesis follows a sequential mixed method design procedure to reap the benefits of
both qualitative and quantitative analyses (Bryman, 2006; Cameron & Molina-Azorin,
2011; Molina-Azorin & López-Gamero, 2012; Prashantham & Birkinshaw, 2015; Sale
et al., 2002; Tashakkori & Teddie, 1998). Given the nature of the research questions,
which relate to BG firms and the MO perspective, the qualitative research design was
complemented with a quantitative approach. Mixed methods have been said to involve
―philosophical assumptions that guide the direction of the collection and analysis of
data and the mixture of qualitative and quantitative data in a single study‖ (Creswell &
Plano Clark, 2007, p. 5). According to Creswell (2003), mixed methods research has
certain advantages, for a number of reasons, and it can be helpful to researchers to
elaborate on the findings of one method by following through with another method.
To address our research aims appropriately, we first conducted a qualitative study by
analyzing a sample of five Spanish BG firms. More precisely, we identified which MO
scale is more adequate for dealing with BG firms. Once we had decided on which scale
is more appropriate, and in order to accomplish the second aim, we checked the external
validity of the scale, taking into account the assessments collected from a sample of
European BG firms using a quantitative approach. Finally, we determined the impact of
the proposed scale on the performance of European BG firms. We believe this multi-
country approach is one of the aspects of this study that adds more value.
The quantitative approach was conducted by, first, collecting data from the web-based
survey adopted as the research instrument. A web-based survey offers several
advantages over traditional mail surveys. The Internet is more frequently used by
researchers in different fields to collect data (Boyer & Pagell, 2000; Sheehan &
McMillan, 1999). It has been found that ―much existing literature has noted that
electronic surveys are attractive to researchers, both academically and commercially
because of the potential that they have to reduce the expense of survey work‖ (Boyer et
al., 2002, p. 358).
The web-based survey offers such benefits as speed of response, response rate and cost
(Sheehan & McMillan, 1999; Parker, 1992). According to a comparative study of mail,
fax, and web-based methods developed by Cobanoglu et al. (2001), web-based surveys
have several advantages, such as the percentage of surveys returned, the response
16
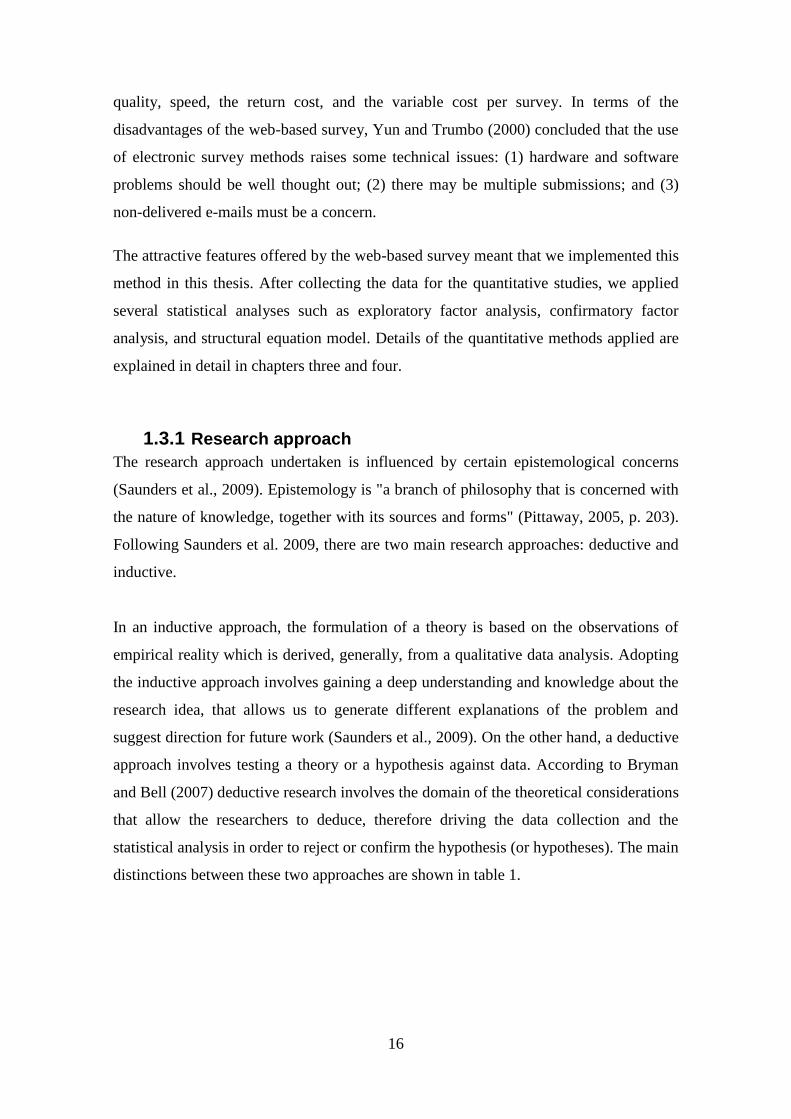
quality, speed, the return cost, and the variable cost per survey. In terms of the
disadvantages of the web-based survey, Yun and Trumbo (2000) concluded that the use
of electronic survey methods raises some technical issues: (1) hardware and software
problems should be well thought out; (2) there may be multiple submissions; and (3)
non-delivered e-mails must be a concern.
The attractive features offered by the web-based survey meant that we implemented this
method in this thesis. After collecting the data for the quantitative studies, we applied
several statistical analyses such as exploratory factor analysis, confirmatory factor
analysis, and structural equation model. Details of the quantitative methods applied are
explained in detail in chapters three and four.
1.3.1 Research approach
The research approach undertaken is influenced by certain epistemological concerns
(Saunders et al., 2009). Epistemology is "a branch of philosophy that is concerned with
the nature of knowledge, together with its sources and forms" (Pittaway, 2005, p. 203).
Following Saunders et al. 2009, there are two main research approaches: deductive and
inductive.
In an inductive approach, the formulation of a theory is based on the observations of
empirical reality which is derived, generally, from a qualitative data analysis. Adopting
the inductive approach involves gaining a deep understanding and knowledge about the
research idea, that allows us to generate different explanations of the problem and
suggest direction for future work (Saunders et al., 2009). On the other hand, a deductive
approach involves testing a theory or a hypothesis against data. According to Bryman
and Bell (2007) deductive research involves the domain of the theoretical considerations
that allow the researchers to deduce, therefore driving the data collection and the
statistical analysis in order to reject or confirm the hypothesis (or hypotheses). The main
distinctions between these two approaches are shown in table 1.
17
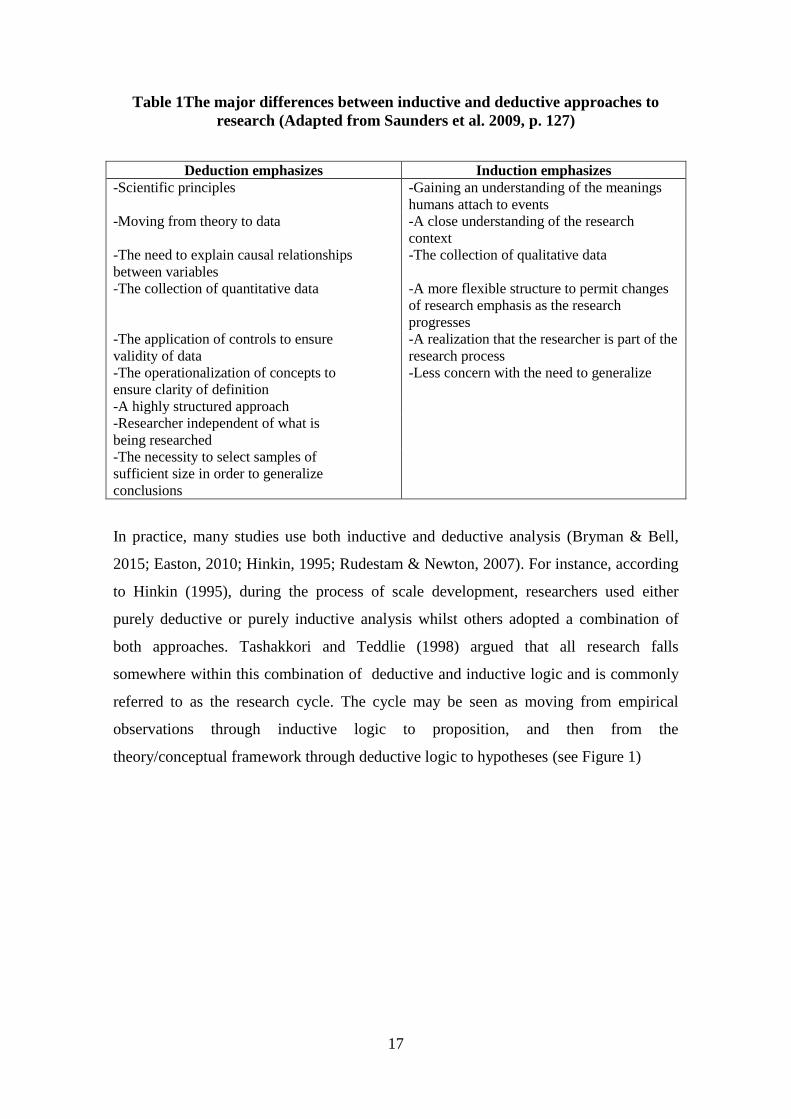
Table 1The major differences between inductive and deductive approaches to
research (Adapted from Saunders et al. 2009, p. 127)
Deduction emphasizes Induction emphasizes
-Scientific principles -Gaining an understanding of the meanings
humans attach to events
-Moving from theory to data -A close understanding of the research
context
-The need to explain causal relationships
between variables
-The collection of qualitative data
-The collection of quantitative data -A more flexible structure to permit changes
of research emphasis as the research
progresses
-The application of controls to ensure
validity of data
-A realization that the researcher is part of the
research process
-The operationalization of concepts to
ensure clarity of definition
-Less concern with the need to generalize
-A highly structured approach
-Researcher independent of what is
being researched
-The necessity to select samples of
sufficient size in order to generalize
conclusions
In practice, many studies use both inductive and deductive analysis (Bryman & Bell,
2015; Easton, 2010; Hinkin, 1995; Rudestam & Newton, 2007). For instance, according
to Hinkin (1995), during the process of scale development, researchers used either
purely deductive or purely inductive analysis whilst others adopted a combination of
both approaches. Tashakkori and Teddlie (1998) argued that all research falls
somewhere within this combination of deductive and inductive logic and is commonly
referred to as the research cycle. The cycle may be seen as moving from empirical
observations through inductive logic to proposition, and then from the
theory/conceptual framework through deductive logic to hypotheses (see Figure 1)
18
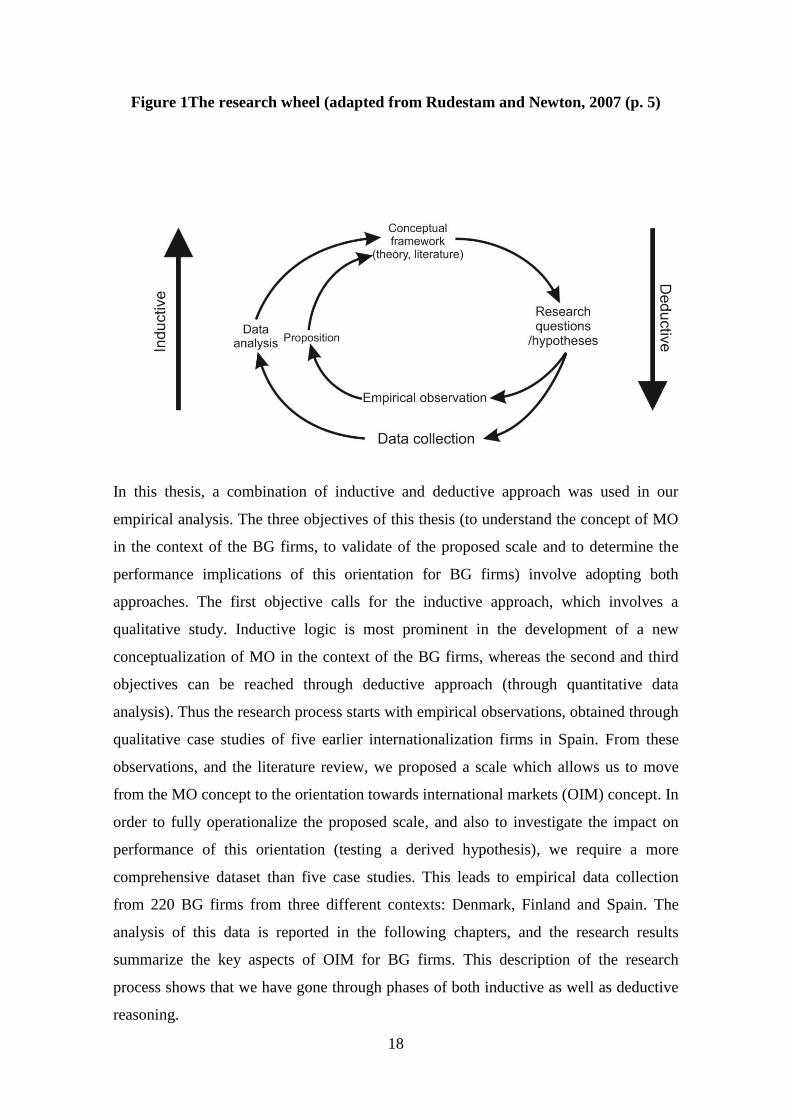
Figure 1The research wheel (adapted from Rudestam and Newton, 2007 (p. 5)
In this thesis, a combination of inductive and deductive approach was used in our
empirical analysis. The three objectives of this thesis (to understand the concept of MO
in the context of the BG firms, to validate of the proposed scale and to determine the
performance implications of this orientation for BG firms) involve adopting both
approaches. The first objective calls for the inductive approach, which involves a
qualitative study. Inductive logic is most prominent in the development of a new
conceptualization of MO in the context of the BG firms, whereas the second and third
objectives can be reached through deductive approach (through quantitative data
analysis). Thus the research process starts with empirical observations, obtained through
qualitative case studies of five earlier internationalization firms in Spain. From these
observations, and the literature review, we proposed a scale which allows us to move
from the MO concept to the orientation towards international markets (OIM) concept. In
order to fully operationalize the proposed scale, and also to investigate the impact on
performance of this orientation (testing a derived hypothesis), we require a more
comprehensive dataset than five case studies. This leads to empirical data collection
from 220 BG firms from three different contexts: Denmark, Finland and Spain. The
analysis of this data is reported in the following chapters, and the research results
summarize the key aspects of OIM for BG firms. This description of the research
process shows that we have gone through phases of both inductive as well as deductive
reasoning.
19
1.4 THE STRUCTURE OF THE STUDY
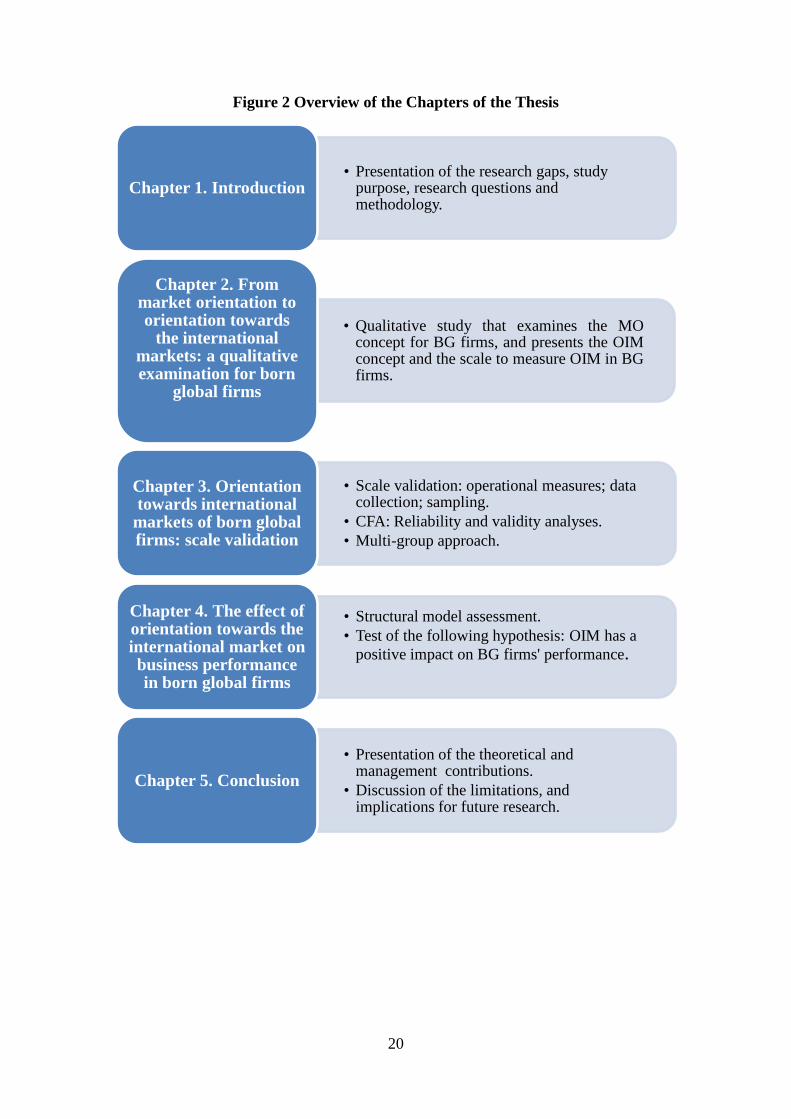
This study is organized into five chapters, which will now be briefly outlined. This
introductory chapter helps identify the general research area and present the research
question that we want to answer. We give a description of the objectives of the study
and the research methodology adopted for each chapter. The main topics and contents of
each chapter are listed in Figure 2.
The second chapter presents a qualitative study based on five BG firms from Spain.
More specifically, based on the literature review and the case study approach, we
developed a measure of the firms‘ OIM, instead of a measure of their market
orientation. The third chapter describes our assessment of the validity of the scale,
drawing upon insights from the literature on scale validation. We assessed the
invariance of the scale across Nordic and Spanish firms. Once the validity of the scale
for OIM had been assessed, we tested, as reported in chapter four, the hypothesis that
relates OIM to the performance of BG firms. In order to test the formulated hypothesis,
structural equation modeling with multi-countries was applied. Finally, chapter five
includes the final discussion and the conclusions of the study. In particular, we present
some concluding remarks that address theoretical and managerial contributions, study
limitations, and recommendations for future research.
20
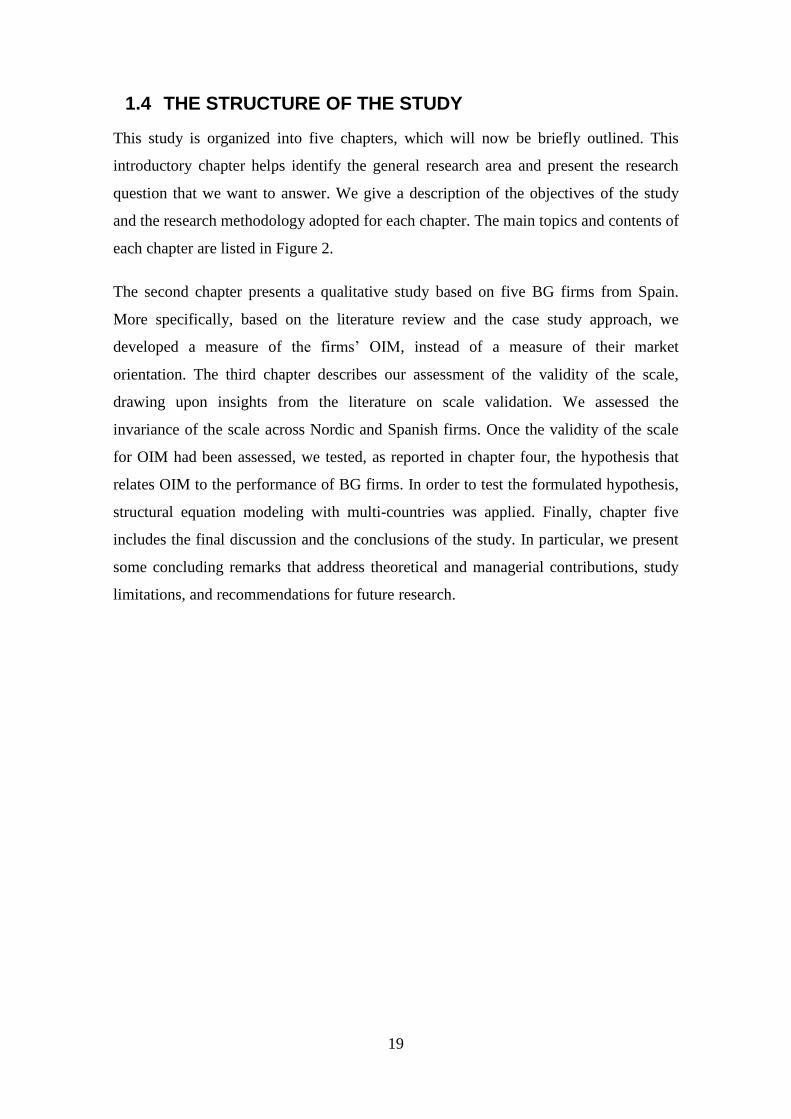
Figure 2 Overview of the Chapters of the Thesis
• Presentation of the research gaps, study purpose, research questions and methodology.
Chapter 1. Introduction
• Qualitative study that examines the MOconcept for BG firms, and presents the OIMconcept and the scale to measure OIM in BGfirms.
Chapter 2. From market orientation to orientation towards
the international markets: a qualitative examination for born
global firms
• Scale validation: operational measures; data collection; sampling.
• CFA: Reliability and validity analyses.
• Multi-group approach.
Chapter 3. Orientation towards international
markets of born global firms: scale validation
• Structural model assessment.
• Test of the following hypothesis: OIM has a
positive impact on BG firms' performance.
Chapter 4. The effect of orientation towards the international market on business performance in born global firms
• Presentation of the theoretical and management contributions.
• Discussion of the limitations, and implications for future research.
Chapter 5. Conclusion
21
1.5 REFERENCES
Andersson, S., & Wictor, I. (2003). Innovative internationalisation in new firms:
born globals–the Swedish case. Journal of International Entrepreneurship,1 (3), 249-
275.
Armario, J., Ruiz, D. & Armario, E. (2008). Market orientation and
internationalization in small and medium-sized enterprises. Journal of Small Business
Management, 46 (4), 485-511.
Arpa, C., Tiernan, S., & O'Dwyer, M. (2012). Entrepreneurial orientation,
market orientation and internationalisation in born global small and micro–businesses.
International Journal of Entrepreneurship and Small Business, 16 (4), 455-470.
Autio, E., Sapienza, H., & Almeida, J. G. (2000). Effects of Age At Entry ,
Knowledge Intensity, and Imitability on International Growth. Academy of Management
Journal, 43 (5), 909-924.
Balas, A. N., Colakoglu, S. N., & Gokus, O. (2012). Examining the relationship
between the three components of market orientation and innovativeness in export
ventures. International Journal of Entrepreneurship, 16, 1-17.
Bell, E., & Bryman, A. (2007). The ethics of management research: an
exploratory content analysis. British Journal of Management, 18 (1), 63-77.
Blesa A. & Ripollés M. (2008). The influence of marketing capabilities on
economic international performance. International Marketing Review, 6 (25), 651-673.
Boyer, K. K., & Pagell, M. (2000). Measurement issues in empirical research:
improving measures of operations strategy and advanced manufacturing technology.
Journal of Operations Management, 18 (3), 361-374.
Boyer, K. K., Hallowell, R., & Roth, A. V. (2002). E-services: operating
strategy—a case study and a method for analyzing operational benefits. Journal of
Operations Management, 20 (2), 175-188.
Brännback, M., Carsrud, A. & Renko, M. (2007). Exploring the born global
concept in the biotechnology context. Journal of Enterprising Culture, 15 (1), 70-100.
Bryman, A. (2006). Integrating quantitative and qualitative research: how is it
done?.Qualitative research, 6 (1), 97-113.
Bryman, A., & Bell, E. (2015). Business research methods. Oxford university
press.
Cadogan, J. W., Diamantopoulos, A., & De Mortanges, C. P. (1999). A measure
of export market orientation: scale development and cross-cultural validation. Journal
of International Business Studies, 689-707.
Cameron, R., & Molina-Azorin, J. F. (2011). The acceptance of mixed methods
in business and management research. International Journal of Organizational
Analysis, 19 (3), 256-271.
Chung, H. F. (2012). Export market orientation, managerial ties, and
performance. International Marketing Review, 29 (4), 403-423.
Chung, H. F. L. (2012). Export market orientation, managerial ties, and
performance. International Marketing Review, 29 (4), 403-423.
Cobanoglu, C., Warde, B., & Moreo, P. J. (2001). A comparison of mail, fax and
web-based survey methods. International journal of market research, 43 (4), 441-452.
Creswell, J. W. (2003). A framework for design. Research design: Qualitative,
quantitative, and mixed methods approaches, 9-11.
Creswell, J. W., & Clark, V. L. P. (2007). Designing and conducting mixed
methods research. Thousand Oaks : SAGE Publications, p. 457
22
Deshpandé, R., Farley, J. U., & Webster Jr, F. E. (1993). Corporate culture,
customer orientation, and innovativeness in Japanese firms: a quadrad analysis. Journal
of Marketing, 57 (1) 23-37.
Dimitratos, P., Voudouris, I., Plakoyiannaki E.& Nakos G. (2012). International
Entrepreneurial Culture - Toward A Comprehensive Opportunity-Based
Operationalization of International Entrepreneurship. International Business Review, 21
(4), 708-721.
Easton, G. (2010). Critical realism in case study research. Industrial Marketing
Management, 39 (1), 118-128.
Efrat, K., & Shoham, A. (2012). Born global firms: the differences between their
short-and long-term performance drivers. Journal of World Business, 47 (4), 675-685.
Greenley, G. E. (1995). Forms of market orientation in UK companies. Journal
of Management Studies, 32 (1), 47-66.
Han K.J., Kim N. & Srivastava R.K. (1998). Market Orientation and
Organizational Performance: Is Innovation a Missing Link? Journal of Marketing, 62
(4), 30- 45.
He, X., & Wei, Y. (2011). Linking market orientation to international market
selection and international performance. International Business Review, 20 (5), 535-
546.
Hinkin, T. R. (1995). A review of scale development practices in the study of
organizations. Journal of management, 21 (5), 967-988.
Im, S., & Workman Jr, J. P. (2004). Market orientation, creativity, and new
product performance in high-technology firms. Journal of marketing, 68 (2), 114-132.
Julian, C. C., Mohamad, O., Ahmed, Z. U., & Sefnedi, S. (2014). The market
orientation–performance relationship: The empirical link in export ventures.
Thunderbird International Business Review, 56 (1), 97-110.
Kara, A., Spillan, J. E. & DeShields, O. W. (2005), The effect of a market
orientation on business performance: a study of small-sized service retailers using
MARKOR scale. Journal of Small Business Management, 43, 105-118.
Kirca, A. H., Jayachandran, S., & Bearden, W. O. (2005). Market orientation: a
meta-analytic review and assessment of its antecedents and impact on performance.
Journal of Marketing, 69 (2), 24-41.
Kirpalani, V. M., & Gabrielsson, M. (2012). Born Globals: Research Areas that
Still Need to be Covered More Fully. Handbook Of Research On Born Globals, Edward
Elgar Publishing, 99-127.
Knight, G.A. and Cavusgil, S.T. (1996) 'The Born Global Firm: A Challenge to
Traditional Internationalization Theory', in S.T. Cavusgil and T. Madsen (eds.)
Advances in International Marketing, 8 JAI Press: Greenwich, CT. pp. 11-26.
Kocak, A., & Abimbola, T. (2009). The effects of entrepreneurial marketing on
born global performance. International Marketing Review, 26 (4/5), 439-452.
Kohli, A., & Jaworski B. (1990). Market orientation: the construct, research
propositions, managerial implications. Journal of Marketing, 54, 1-18.
Kropp, F., Lindsay, N. & Shoham, A. (2006). Entrepreneurial, market and
learning orientations and international entrepreneurial business venture performance in
South African firms. International Marketing Review, 23 (6), 504-523.
Kuivalainen, O., Sundqvist, S., & Servais, P. (2007). Firms‘ degree of born-
globalness, international entrepreneurial orientation and export performance. Journal of
World Business, 42 (3), 253-267.
Kwon, Y. C., & Hu, M. Y. (2000). Market orientation among small Korean
exporters. International Business Review, 9 (1), 61-75.
23
Larimo, J. (2003). Form of investment by Nordic firms in world markets.
Journal of Business Research, 56 (10), 791-803.
Li, L. Qian, G., & Qian, Z. (2012). Early internationalization and performance
of small high-tech ―born-globals‖. International Marketing Review, 29 (5), 536-561.
Madsen, T. K., & Servais, P. (1997). The internationalization of born globals: an
evolutionary process?. International business review, 6 (6), 561-583.
Moen, Ø. (2002). The born globals: a new generation of small European
exporters. International Marketing Review, 19 (2), 156-175.
Molina-Azorín, J. F., López-Gamero, M. D., Pereira-Moliner, J., & Pertusa-
Ortega, E. M. (2012). Mixed methods studies in entrepreneurship research: Applications
and contributions. Entrepreneurship & Regional Development, 24 (5-6), 425-456.
Morgan, M., Vorhies, D.W. & Mason, C.H. (2009). Market orientation,
marketing capabilities, and firm performance. Strategic Management Journal, 30, 909-
920.
Murray, J. Y., Gao, G. Y., & Kotabe, M. (2011). Market orientation and
performance of export ventures: the process through marketing capabilities and
competitive advantages. Journal of the Academy of Marketing Science, 39 (2), 252-269.
Murray, J. Y., Gao, G. Y., Kotabe, M., & Zhou, N. (2007). Assessing
measurement invariance of export market orientation: a study of Chinese and non-
Chinese firms in China. Journal of International Marketing, 15 (4), 41-62.
Narver, J. C., & Slater, S. F. (1990). The effect of a market orientation on
business profitability. Journal of Marketing, 20-35.
Navarro-García, A., Arenas-Gaitán, J., & Rondán-Cataluña, F. J. (2014).
External environment and the moderating role of export market orientation. Journal of
Business Research, 67 (5), 740-745.
Ngo, L. V., & O'Cass, A. (2012). In search of innovation and customer‐related
performance superiority: The role of market orientation, marketing capability, and
innovation capability interactions. Journal of Product Innovation Management, 29 (5),
861-877.
O‘Connor, N. G., Vera-Muñoz, S. C., & Chan, F. (2011). Competitive forces
and the importance of management control systems in emerging-economy firms: The
moderating effect of international market orientation. Accounting, Organizations and
Society, 36 (4), 246-266.
Oczkowski, E., & Farrell, M. A. (1998). An examination of the form of market
orientation in Australian companies. Australasian Marketing Journal , 6 (2), 3-12.
Odorici, V., & Presutti, M. (2013). The entrepreneurial experience and strategic
orientation of high-tech born global start-ups: An analysis of novice and habitual
entrepreneurs. Journal of International Entrepreneurship, 11 (3), 268-291.
Oviatt, B. M., & McDougall, P. P. (1994). Toward a theory of international new
ventures. Journal of international business studies, 45-64.
Parker, L. (1992). Collecting data the e-mail way. Training & Development, 46
(7), 52-54.
Pinho, J., Rodrigues, P.A., & Dibb, S. (2014). The role of corporate culture,
market orientation and organisational commitment in organisational performance: the
case of non-profit organisations. Journal of Management Development, 33 (4), 374-398.
Pittaway, L. (2005). Philosophies in entrepreneurship: a focus on economic
theories. International Journal of Entrepreneurial Behavior & Research, 11 (3), 201-
221.
24
Prashantham, S., & Birkinshaw, J. (2015). Choose Your Friends Carefully:
Home-Country Ties and New Venture Internationalization. Management International
Review, 55 (2), 207-234.
Racela, O. C, Chaikittisilpa, C., & Thoumrungroje, A. (2007). Market
orientation, international business relationships and perceived export performance.
International Marketing Review, 24, (2), 144-163.
Rose, G. M., & Shoham, A. (2002). Export performance and market orientation:
establishing an empirical link. Journal of Business Research, 55 (3), 217-225.
Rudestam, K., E, & Newton, R., R (2007). Surviving your dissertation: a
comprehensive guide to content and process (3 ed.). California: Sage Publications Inc.
Sale, J. E., Lohfeld, L. H., & Brazil, K. (2002). Revisiting the quantitative-
qualitative debate: Implications for mixed-methods research. Quality and quantity, 36
(1), 43-53.
Saunders, M., Lewis, P. & Thornhill, A. (2009) Research methods for business
students, 5th ed., Harlow, Pearson Education.
Schlosser, F. K., & McNaughton, R. B. (2009). Using the I-MARKOR scale to
identify market-oriented individuals in the financial services sector. Journal of Services
Marketing, 23 (4), 236-248.
Sheehan, K. B., & McMillan, S. J. (1999). Response variation in e-mail surveys:
An exploration. Journal of advertising research, 39 (4), 45-54.
Siguaw J., Brown G., & Widing R. (1994). The influences of the market
orientation of the firm on sales force behavior and attitudes. Journal of Marketing
Research, 31, 106-116.
Subramanian, R., & Gopalakrishna, P. (2009). Relationship between market
orientation and performance in family owned firms: a context-specific investigation.
International Journal of Business Innovation and Research, 3 (5), 500-514.
Sultan, P., & Wong, H. Y. (2011). The success of born global firms: a
conceptual model. Journal for Global Business Advancement, 4 (3), 224-241.
Tashakkori, A., & Teddlie, C. (1998). Mixed methodology: Combining
qualitative and quantitative approaches (Vol. 46). Sage.
Yun, G. W., & Trumbo, C. W. (2000). Comparative Response to a Survey
Executed by Post, E‐mail, & Web Form. Journal of Computer‐Mediated
Communication, 6 :0 .
Zahra, S., Duane, R. & Hitt, M. (2000). International Expansion by New
Venture Firms: International Diversity, Model of Market Entry, Technological
Learning, and Performance. Academy of Management Journal, 43 (5), 925-950.
25
APPENDIX 1 MO in the international context of the firms
Label of the
constructs
Reference Type of firms Scale Performance
effect
Market
orientation
Rose &
Shoham
(2002)
Exporters MARKOR Positive
Racela et. al.
(2007)
Exporters MARKOR N.A.
Julian et al
(2014)
Exporters MKTOR Positive
Balas et al.
(2012)
Exporters MKTOR N.A.
Kwon & Hu
(2000)
Exporters MARKOR Positive
Export market
orientation
Navarro-
Garcia et al.
(2014)
Exporters EMO Positive
Murray et al.
(2011)
Exporters EMO Positive
Chung (2012) Exporters EMO Positive
International
market
orientation
Dimitratos et
al (2012)
Internationalized
firms
MKTOR N.A.
O‘Connor et
al. (2011)
Exporters Export sales and
export
experience
N.A.
N.A.: No available
26
2 CHAPTER TWO FROM MARKET ORIENTATION TO ORIENTATION
TOWARDS INTERNATIONAL MARKETS: A QUALITATIVE EXAMINATION FOR BORN GLOBAL
FIRMS
ABSTRACT
Purpose- The impact of market orientation on performance has been addressed widely
in the academic literature; however, the connection between the concept of market
orientation and born global firms has not yet been considered. This research aims to
investigate how the market orientation concept could be understood for a specific type
of firm: the born global firm.
Design/Methodology/Approach-This is an exploratory study that was developed by
performing qualitative interviews in a sample of five Spanish firms from different
sectors which had international activity. The data were analyzed using cross-case
analysis.
Findings-This research suggests that the market orientation concept should be
developed into the concept of orientation towards international markets (OIM) for born
global firms. It also provides the components for measuring this orientation in this type
of firm.
Research limitations/Implications-More born global firms, ideally from different
contexts, should be considered in order to develop the concept and the measurement of
orientation towards international markets, and quantitative studies, using confirmatory
factor analysis, should be implemented for assessing the validity of the proposed scale.
Originality/Value- Although the concept of market orientation is very well known in
the marketing literature, as are the traditional scales that have been used for measuring
it, the value of this research is the extension of this concept to the international context
and the proposal of a measure for a specific type of firm: those acting internationally
from their inception.
Keywords: Born global firms, market orientation, and small enterprises.
Paper type: Research paper.
JEL Classification: M13, M31, L25.
27
2.1 INTRODUCTION
The internationalization of firms has received particular attention in international
entrepreneurship (IE) theory, and one of the most promising areas of research is focused
on born global firms, or firms that internationalize almost from inception. This type of
firm has been given different names in the literature: International New Venture
(McDougall, et al., 1994; Oxtorp, 2014), Global Start-up (Oviatt & McDougall, 1994),
Instant International, High Technology Start-up (Jolly et al., 1992), Global High-Tech
Firm, and Born Global (BG) Firm. In spite of the debate about the terminology in the
research field, we will just refer to this type of company as BG firms because this term
appears most frequently in the current body of research literature (Brännback et al.,
2007; Cavusgil & Knight, 2015; Hashai & Almor 2004; Madsen & Servais, 1997;
Zahra, 2014).
Recently, researchers and practitioners have noted an increase in the number of
companies that can be considered to be BG firms. BG firms are described as
follows:―they are international from the inception, seeks to derive a significant
competitive advantage from the use of resources and the sales of outputs in multiple
countries‖ (Oviatt & McDougall, 1994, p. 49).
The desire to expand is inherent in any firm‘s international plan, but the degree and pace
differ considerably between firms for which it is a gradual process and BG firms. It has
been traditional for small firms to follow an incremental path of internationalization, but
BG firms represent a modification: they start their internationalization process almost
from inception and simultaneously use multiple and different internationalization modes
(Melén & Nordman, 2009).
As we have mentioned, the phenomenon of BG is becoming increasingly common
(Sharma & Blomstermo, 2003). Some scholars focus on the conceptualization (Knight
& Cavusgil 1996; Madsen & Servais, 1997; Oviatt & McDougall, 1994) and some on
the characteristics of BG firms (Gleason et al., 2006); some identify the factors
influencing the strategies of BG firms (Efrat & Shoham, 2013; Luostarinen &
Gabrielsson, 2004), while still others study the development of the phases that BG firms
follow: ―introductory, growth and resource accumulation and break-out to independent
growth‖( Gabrielsson et al., 2008, p. 385).
28
Previous research on BG firms indicates that ―this type of firms seeks superior
performance from or near their founding‖ (Kocak & Abimbola, 2009, p. 439). Zahra et
al. (2000) argue that there is a positive relationship between international diversity and
new venture performance. Consequently, it is evident that for BG firms international
diversity becomes crucial.
However, from our perspective, a gap remains in the knowledge about BG firms and
their performance. Many recent studies have argued that market orientation (MO) has a
positive effect on firms‘ performance (Harris, 2001; Kumar et al., 1998; Lee et al.,
2015; Noble et al., 2002; Ruekert, 1992; Sin et al., 2005). According to Rose and
Shoham (2002), firms that are oriented toward the market should recognize and respond
to global changes and opportunities better in their competitive environment. However,
most studies focused on MO have been developed in the context of domestic markets
(e.g. Slater & Narver 2000; Sin et al., 2005), as well as in industrial economies, with a
focus on manufacturing firms (Matsumo et al., 2002). We are interested in the
relationship between the measurement of MO and the performance of BG firms. As can
be imagined, this implies that we must have a clear understanding and measurement of
the MO of BG firms. In addition, a growing number of contributions in the marketing
field have been devoted to identifying the dominant scale for measuring MO: these
include MARKOR, developed by Kohli et al. (1993), and MKTOR, developed by
Narver and Slater (1990) (Deshpande & Farley, 1998; Oczkowski & Farrell, 1998;
Tomášková, 2009).
This study contributes to the existing knowledge about MO and BG firms in two ways.
First, we develop the concept of MO in the domain of BG firms, suggesting that a more
appropriate concept (orientation towards international markets) and measure should be
taken into account in this context. Second, we start exploring the connection between
this extended concept and the performance of BG firms, in a qualitative way. With a
few exceptions (e.g. Johansen & Knight, 2010), this relationship has not been studied in
the BG context. As a result, we can get a better insight into, and understanding of, the
phenomenon of BG firms. Consequently, we respond to the call to develop the
knowledge of certain aspects in the continuing internationalization of BG firms (Liesch
et al., 2007).
29
To achieve both purposes, the research is structured in the following way: the second
section provides a review of the relevant literature on BG firms and MO offered by
international business and marketing scholars. After the literature review, our research
questions will be presented in the third section. This will be followed by the
methodology of the study and a description of the research design. More precisely, the
ways in which the cases have been chosen and how the information will be analyzed are
presented in section four. The empirical results of the in-depth case analysis of five
firms in Spain are presented and discussed in section five, with a focus on the
development of the MO concept for BG firms and the possible impact of this orientation
on performance. Finally, the main results of the case study are summarized and
implications are drawn in section six. The final section ends with some suggestions for
future studies.
2.2 LITERATURE REVIEW
2.2.1 Literature review of born global firms
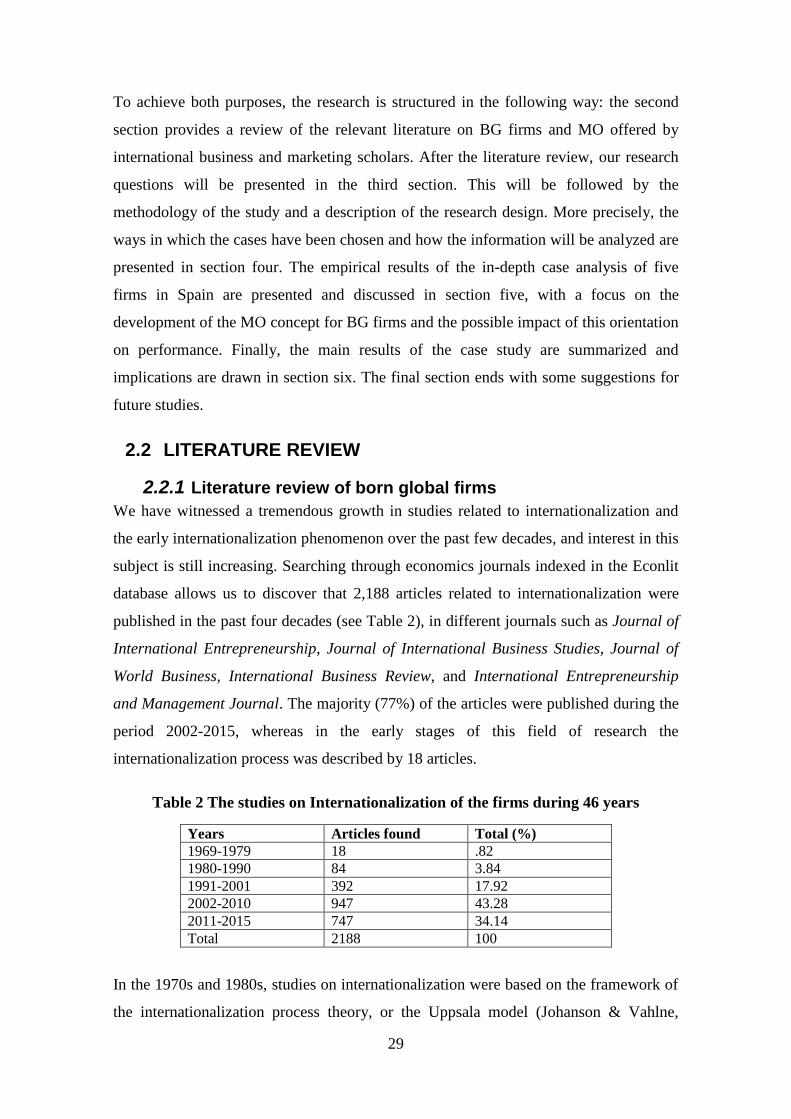
We have witnessed a tremendous growth in studies related to internationalization and
the early internationalization phenomenon over the past few decades, and interest in this
subject is still increasing. Searching through economics journals indexed in the Econlit
database allows us to discover that 2,188 articles related to internationalization were
published in the past four decades (see Table 2), in different journals such as Journal of
International Entrepreneurship, Journal of International Business Studies, Journal of
World Business, International Business Review, and International Entrepreneurship
and Management Journal. The majority (77%) of the articles were published during the
period 2002-2015, whereas in the early stages of this field of research the
internationalization process was described by 18 articles.
Table 2 The studies on Internationalization of the firms during 46 years
Years Articles found Total (%)
1969-1979 18 .82
1980-1990 84 3.84
1991-2001 392 17.92
2002-2010 947 43.28
2011-2015 747 34.14
Total 2188 100
In the 1970s and 1980s, studies on internationalization were based on the framework of
the internationalization process theory, or the Uppsala model (Johanson & Vahlne,
30
1977). It was not until the mid-1990s that an increased emphasis was placed on the
early internationalization process, and at this time the concept of BG firms took hold.
The identification of BG firms by McKinseys (1993) showed how young firms could be
characterized by their foreign operations at the time they were formed.
A review of the literature on BG firms was carried out in order to determine factors such
as the contexts and the research methodology adopted, and to obtain a general overview
of BG firms research. To identify relevant articles on BG firms, we conducted a
keyword search for born global firms on the Scopus database. We established three
criteria for selecting the articles on BG firms. First, after introducing the keywords, we
selected the subject area as business, management and accountancy. Second, we
selected the document type as just articles. As a result, after introducing these two
criteria, we found 199 articles. Thereafter, following Senglen (1997), we selected five
articles with the highest number of citations between 190 and 519.
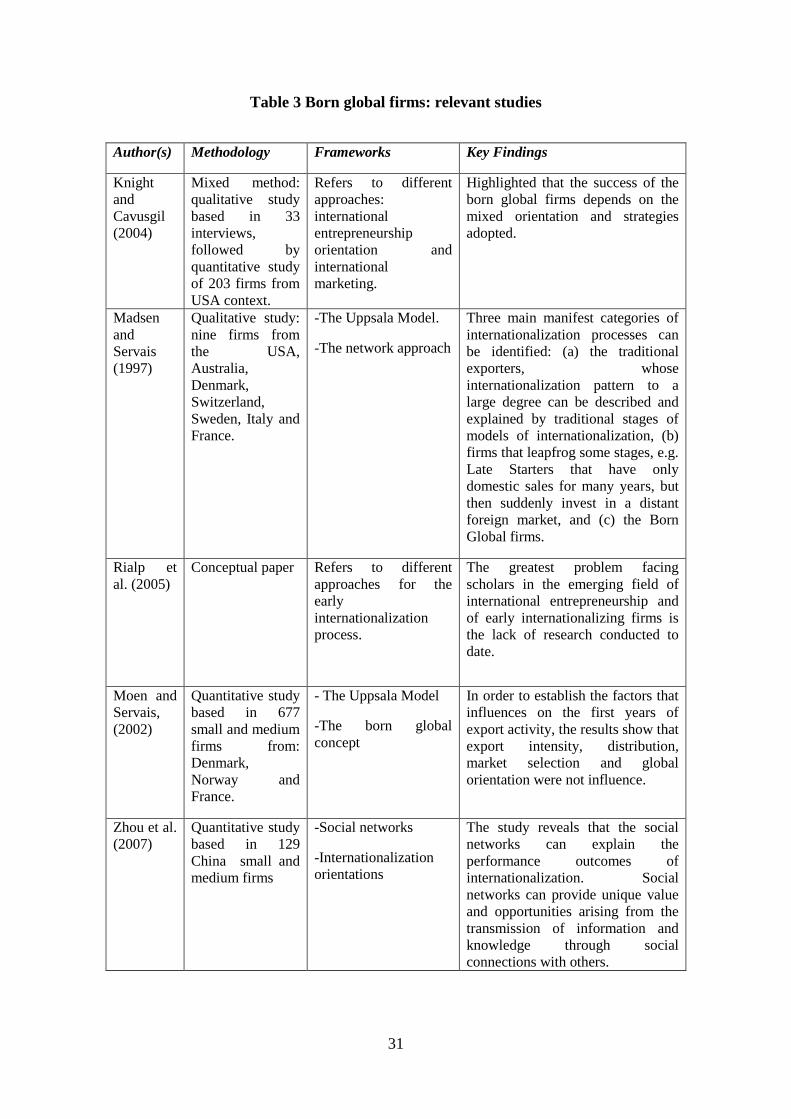
As demonstrated theoretically and illustrated in some of the papers in Table 3, it seems
that BG firms are mainly examined by combining and integrating different theoretical
perspectives. From the sample of studies provided in Table 3, it can be seen that the
studies use both methodologies (quantitative and qualitative) in different contexts,
mainly in European countries and the USA.
31
Table 3 Born global firms: relevant studies
Author(s) Methodology Frameworks Key Findings
Knight
and
Cavusgil
(2004)
Mixed method:
qualitative study
based in 33
interviews,
followed by
quantitative study
of 203 firms from
USA context.
Refers to different
approaches:
international
entrepreneurship
orientation and
international
marketing.
Highlighted that the success of the
born global firms depends on the
mixed orientation and strategies
adopted.
Madsen
and
Servais
(1997)
Qualitative study:
nine firms from
the USA,
Australia,
Denmark,
Switzerland,
Sweden, Italy and
France.
-The Uppsala Model.
-The network approach
Three main manifest categories of
internationalization processes can
be identified: (a) the traditional
exporters, whose
internationalization pattern to a
large degree can be described and
explained by traditional stages of
models of internationalization, (b)
firms that leapfrog some stages, e.g.
Late Starters that have only
domestic sales for many years, but
then suddenly invest in a distant
foreign market, and (c) the Born
Global firms.
Rialp et
al. (2005)
Conceptual paper Refers to different
approaches for the
early
internationalization
process.
The greatest problem facing
scholars in the emerging field of
international entrepreneurship and
of early internationalizing firms is
the lack of research conducted to
date.
Moen and
Servais,
(2002)
Quantitative study
based in 677
small and medium
firms from:
Denmark,
Norway and
France.
- The Uppsala Model
-The born global
concept
In order to establish the factors that
influences on the first years of
export activity, the results show that
export intensity, distribution,
market selection and global
orientation were not influence.
Zhou et al.
(2007)
Quantitative study
based in 129
China small and
medium firms
-Social networks
-Internationalization
orientations
The study reveals that the social
networks can explain the
performance outcomes of
internationalization. Social
networks can provide unique value
and opportunities arising from the
transmission of information and
knowledge through social
connections with others.
32
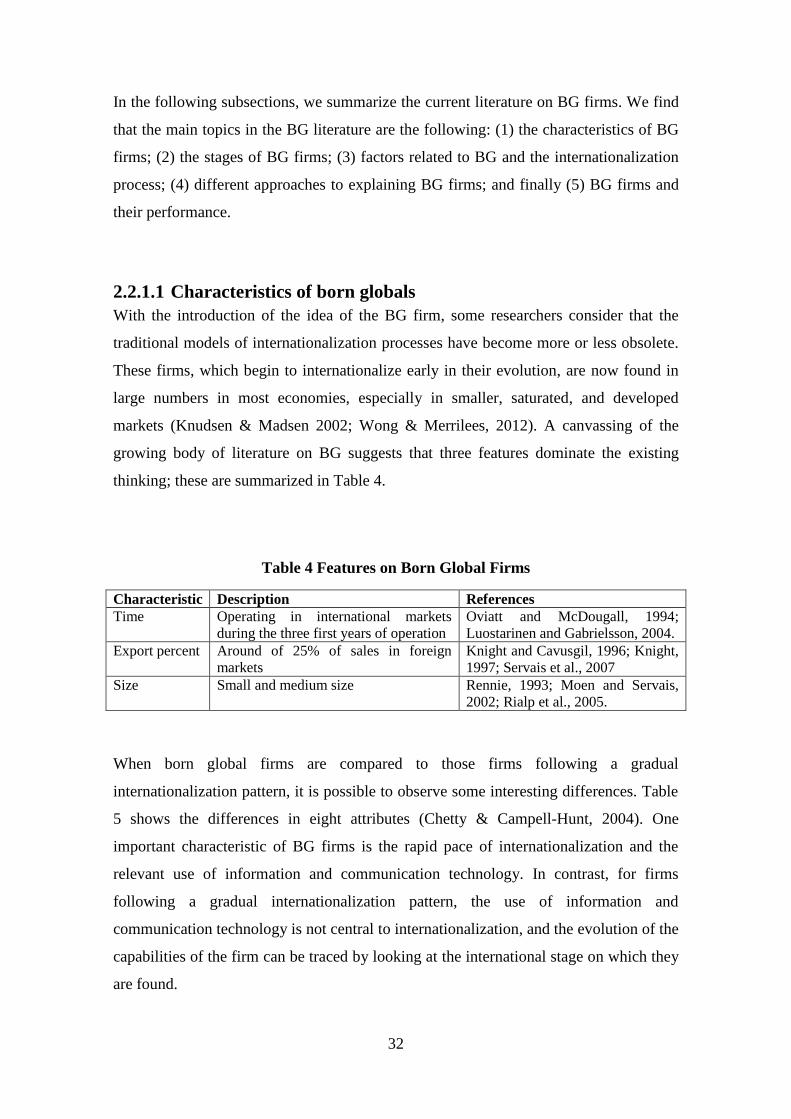
In the following subsections, we summarize the current literature on BG firms. We find
that the main topics in the BG literature are the following: (1) the characteristics of BG
firms; (2) the stages of BG firms; (3) factors related to BG and the internationalization
process; (4) different approaches to explaining BG firms; and finally (5) BG firms and
their performance.
2.2.1.1 Characteristics of born globals
With the introduction of the idea of the BG firm, some researchers consider that the
traditional models of internationalization processes have become more or less obsolete.
These firms, which begin to internationalize early in their evolution, are now found in
large numbers in most economies, especially in smaller, saturated, and developed
markets (Knudsen & Madsen 2002; Wong & Merrilees, 2012). A canvassing of the
growing body of literature on BG suggests that three features dominate the existing
thinking; these are summarized in Table 4.
Table 4 Features on Born Global Firms
Characteristic Description References
Time Operating in international markets
during the three first years of operation
Oviatt and McDougall, 1994;
Luostarinen and Gabrielsson, 2004.
Export percent Around of 25% of sales in foreign
markets
Knight and Cavusgil, 1996; Knight,
1997; Servais et al., 2007
Size Small and medium size Rennie, 1993; Moen and Servais,
2002; Rialp et al., 2005.
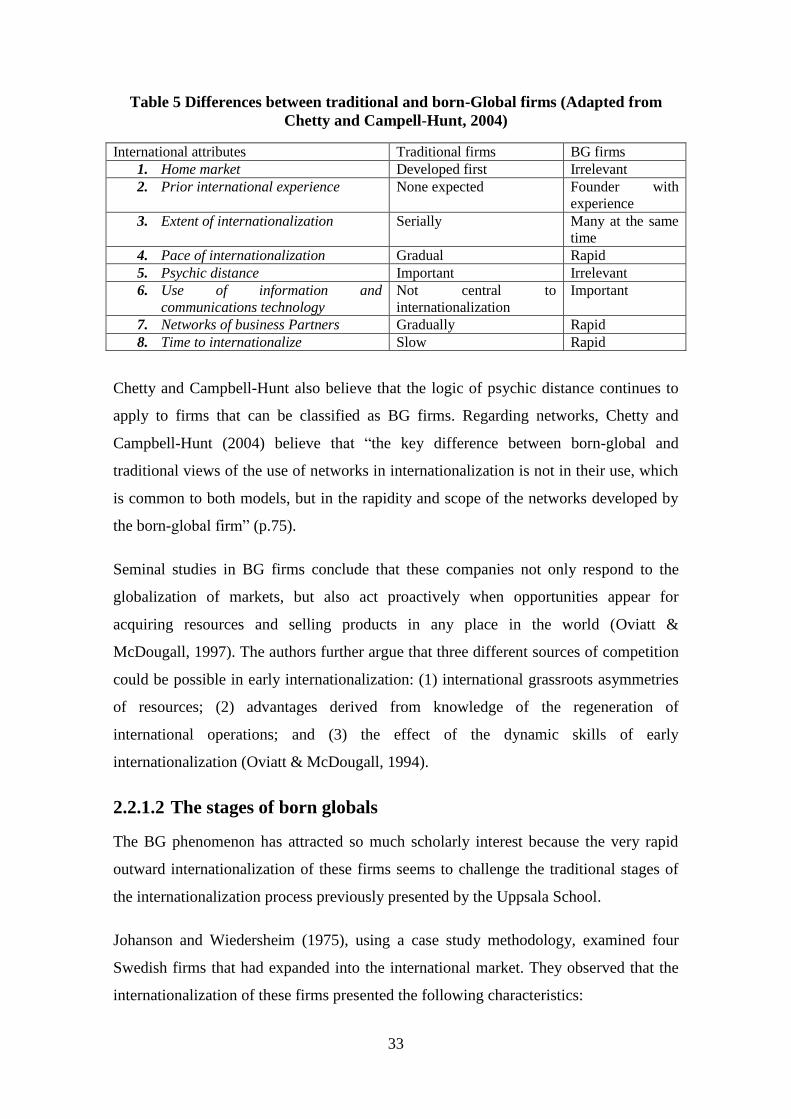
When born global firms are compared to those firms following a gradual
internationalization pattern, it is possible to observe some interesting differences. Table
5 shows the differences in eight attributes (Chetty & Campell-Hunt, 2004). One
important characteristic of BG firms is the rapid pace of internationalization and the
relevant use of information and communication technology. In contrast, for firms
following a gradual internationalization pattern, the use of information and
communication technology is not central to internationalization, and the evolution of the
capabilities of the firm can be traced by looking at the international stage on which they
are found.
33
Table 5 Differences between traditional and born-Global firms (Adapted from
Chetty and Campell-Hunt, 2004)
International attributes Traditional firms BG firms
1. Home market Developed first Irrelevant
2. Prior international experience None expected Founder with
experience
3. Extent of internationalization Serially Many at the same
time
4. Pace of internationalization Gradual Rapid
5. Psychic distance Important Irrelevant
6. Use of information and
communications technology
Not central to
internationalization
Important
7. Networks of business Partners Gradually Rapid
8. Time to internationalize Slow Rapid
Chetty and Campbell-Hunt also believe that the logic of psychic distance continues to
apply to firms that can be classified as BG firms. Regarding networks, Chetty and
Campbell-Hunt (2004) believe that ―the key difference between born-global and
traditional views of the use of networks in internationalization is not in their use, which
is common to both models, but in the rapidity and scope of the networks developed by
the born-global firm‖ (p.75).
Seminal studies in BG firms conclude that these companies not only respond to the
globalization of markets, but also act proactively when opportunities appear for
acquiring resources and selling products in any place in the world (Oviatt &
McDougall, 1997). The authors further argue that three different sources of competition
could be possible in early internationalization: (1) international grassroots asymmetries
of resources; (2) advantages derived from knowledge of the regeneration of
international operations; and (3) the effect of the dynamic skills of early
internationalization (Oviatt & McDougall, 1994).
2.2.1.2 The stages of born globals
The BG phenomenon has attracted so much scholarly interest because the very rapid
outward internationalization of these firms seems to challenge the traditional stages of
the internationalization process previously presented by the Uppsala School.
Johanson and Wiedersheim (1975), using a case study methodology, examined four
Swedish firms that had expanded into the international market. They observed that the
internationalization of these firms presented the following characteristics:
34
1. No steady state activity
2. Export via manufacturer‘s agents
3. Sales offices abroad
4. International production
The Uppsala model has been considered as a gradual development process, but now
recent studies have identified firms that do not adopt a gradual and incremental
approach but instead exhibit a rapid internationalization and high market commitment
soon after inception (Knight & Cavusgil, 2004; Knudsen & Madsen, 2002). For this
reason, some researchers consider that the ―existing models of the internationalization
process have not captured the important phenomenon of accelerated international
growth of BG firms‖ (Freeman et al., 2010, p.70).
Luostarinen and Gabrielsson (2006), in their study of 89 Finnish firms, argue that BG
firms present three preliminary stages: research and development, domestic phase, and
foreign market entry. They also identify four major stages: starting, development,
growth, and maturity. They establish that mature BG firms pass rapidly through the
formal internationalization stages and even more quickly through other stages.
2.2.1.3 Factors related to born globals and their internationalization
Distinct elements have been considered to increase the speed of a company's
internationalization process. Rialp et al. (2005) indicated different factors facilitating the
expansion of BG firms. These factors include: (1) a manager or founders who have a
global vision and international business experience; (2) a manager with a high level of
global knowledge; (3) a loyal managerial commitment; (4) broad personal business
networks; (5) wide knowledge of, and commitment to, markets; (6) unique intangible
assets within the company for knowledge management; (7) the generation of high value
offerings of leading technology products with an emphasis on high quality; (8) a focus
on a global niche strategy that extends to markets in numerous countries; (9) the
important role of customer orientation and close customer relationships; and (10) the
flexibility to adapt to rapidly changing external conditions and circumstances especially
in foreign markets.
Moreover, the existing literature has identified numerous factors influencing the
internationalization process of BG firms. Among these it is possible to highlight market
35
knowledge, financial conditions, innovation and technology, and, finally, the role of the
manager.
Regarding market knowledge, if a business tends to treats the knowledge of the external
market as an important, this can be used to develop the internationalization process of
the BG at a faster pace. Furthermore, actively seeking knowledge about international
markets, potential customers and competitors, and solving issues of operations across
national borders, allows firms to improve their ability to learn and to obtain a greater
entrepreneurial orientation (Knight et al., 2004; Rialp et al., 2005; Shook et al., 2003).
However, we cannot forget that BG firms often face limited financial resources for
funding and supporting the needs of their fast growth. These companies can choose to
strengthen their internal resources or to cooperate with external partners (Luostarinen &
Gabrielsson, 2004). To strengthen the financial resources by looking to external partners
such as business angels, venture capitalists, and strategic investors with experience in
specific sectors, has been shown to have positive effects in many cases (Gabrielsson &
Kirpalani, 2004). The managers of BG firms select financial aides whose philosophy
coincides with the vision and strategies of the company, to avoid negative consequences
(Kocak & Abimbola, 2009).
One factor that is recognized in the specific literature to affect the internationalization
process of BG firms is their level of innovation and technology development.
Innovative companies develop their own knowledge and capacities, and this constitutes
a source of competitive advantage. Younger companies are more flexible, less
bureaucratic, and, in general, benefit from the internal conditions that boost innovation
(Knight & Cavusgil, 2004). BG firms have shown that operating in dynamic markets,
where market conditions change rapidly, forces them to learn to adapt themselves
quickly to new market conditions abroad and, as a consequence, forces them to innovate
(Freeman et al., 2006; Zhang & Dodgson, 2007; Zhara, et al., 2000).
Finally, many managers and founders of BG companies have earned international
experience and competence during their previous working experiences (Moen, 2002).
Some of the BG managers that have influence in the rapid internationalization process
use their international work experience, foreign language skills, international education,
and their understanding of letters of credit, exchange rate risks and communication and
36
cultural difficulties. All of these have been recognized by the literature as requirements
for successful expansions to foreign markets (Madsen & Servais, 1997; Oviatt &
McDougall, 1995; Reuber & Fisher, 2002).
2.2.1.4 Different approaches to explaining born globals
The process of the internationalization of businesses has been described previously by
the Uppsala model, which suggests that firms follow a gradual process in their
internationalization (Johanson & Wiedersheim, 1975). Recent studies have considered
the existing models of the early internationalization process. The studies have focused
on explaining the phenomenon, from different viewpoints. In fact, according to our
literature analysis, there are at least six salient approaches relating to BG firms (see
Table 6). For this reason, some authors have considered the influence of dynamic
capabilities on internationalization in BG firms (Weerawardena et al., 2007). Some
studies have incorporated the ―knowledge-based view‖, which involves the combination
of the acquisition of knowledge and the commitment of resources (Grant, 1996).
Table 6 Selected classifications of Born Globals approaches
According to Sharma and Blomstermo (2003), the internationalization process can
depend on the networks in which the company operates. Likewise, according to Rialp et
al. (2010), the BG phenomenon has become a subject of study in a wide variety of
disciplines, and thereby there has been a combination of the approaches of schools in
strategic management and international entrepreneurship. Karra et al. (2008) suggested
Approaches Reference
Dynamic
Capabilities
Knight and Cavusgil (2004); Knudsen and Madsen (2002);
Weerawardena et al. (2007).
Knowledge-Based view
Autio et al. (2000); Freeman et al. (2010); Knight and
Cavusgil (2004); Nordman and Melén (2008).
Networks
Coviello (2006); Evers and Knight (2008); Freeman et al.
(2006); Hadley and Wilson (2003); Mort and
Weerawardena (2006); Sharma and Blomstermo (2003).
Strategies perspective
Gabrielsson (2005); Gabrielsson and Gabrielsson (2011);
Jantunen et al. (2008); Luostarinen and Gabrielsson (2006);
Rialp et al. (2010).
International
Entrepreneurship
Andersson and Evangelista (2006); Fletcher (2004); Jones
and Coviello (2005); Jones and Nummela (2008); Karra et
al.(2008); Knight (2001); Kocak and Abimbola (2009);
Mathews and Zander (2007); Zhou (2007).
Resource-Based
View
Cavusgil (2004); Chetty and Campbell-Hunt (2004);
Freeman and Cavusgil (2007); Gassmann and Keupp
(2007).
37
that the process of BG firms should be understood using the theory of the strategy-
making process. Based on their studies on smaller BG firms, Chetty and Campbell-Hunt
(2004) emphasized the importance of including the Resource-Based View to explain,
more comprehensively, the non-path-dependent behavior of BG firms.
The phenomenon of BG firms presents a significant challenge for traditional theories of
internationalization (Knight et al., 2004), because:
(i) The internationalization of the BG tends to happen after the establishment of the
company;
(ii) The initial foreign sales will be aimed at numerous markets simultaneously,
without involving progressive phases;
(iii) Target markets are, in some cases, an important physical distance from the home
country;
(iv) The initial way of entering the foreign markets is not fixed: there are several
routes, including exports, licenses, joint ventures, and direct foreign investment;
(v) Several of the companies studied show high levels of entrepreneurship in
international activities and do not show risk aversion.
Nevertheless, although BG research is well developed, certain aspects remain
fragmented and still lacking a comprehensive theoretical explanation (Knight &
Cavusgil, 1996; Servais & Rasmussen, 2000). Although scholars have studied this field
from different approaches, there is no unified ―theory of BGs‖. Rialp et al. (2005)
emphasized the importance of developing theory, theoretical constructs and conceptual
frameworks to interpret rapidly internationalizing firms better.
2.2.1.5 Born global firms and performance
The analysis of the literature also revealed that some emphasis has been placed on the
export performance (Kocak & Abimbola, 2009), organizational performance (Liu & Fu,
2011), international performance (Jantunen et al., 2008; McDougall & Oviatt, 1996),
and financial performance (Gleason & Wiggenhorn, 2007) of BG firms.
Despite the increase in BG studies, ―the consequences of the changes for BG firms and
their performance need more research‖ (Sharma & Blomstermo, 2003, p.750). In
response to this concern, Pangarkar (2008) suggests examining the performance of
38
individual internationalization initiatives and trying to correlate this with the
characteristics of the market. Other researchers have aimed to follow this idea by
studying the relation between BGs‘ performance and entrepreneurial marketing (Kocak
& Abimbola, 2009).
2.2.2 Market orientation
This section examines the second topic of relevance for the current research: the
concept of market orientation (MO). Our interest is to develop this concept in relation to
companies that are facing serious academic and managerial challenges related to instant
or rapid internationalization. We have detected, from the literature analysis performed,
that the MO concept and its consequences have been considered a relevant topic for
study by marketing academics since the 1990s. A key factor in this interest was the
introduction of Market Orientation as a research line by the Marketing Science Institute.
The importance of MO in marketing science has been recognized as being at ―the heart
of the theory and practice of marketing management and is believed to be the
foundation for a firm‘s competitive strategy‖ (Appiha-Adu & Ranchhod, 1998 p. 197).
The remainder of this section is structured as follows: first, a literature review on the
concept of MO and its evolution is presented. Interestingly, although various research
efforts have provided different conceptualizations for MO, most studies are based on
Narver and Slater‘s and Kohli and Jaworski‘s conceptualizations (Green et al., 2015;
Wren et al., 2000). Different views on MO (namely the cultural, behavioral and system-
based perspectives) are presented (González & González, 2005; Helfert et al., 2002;
Lafferty & Hult, 2001). Second, the measurement scales of MO are considered. The
most widely used scales (MKTOR, developed by Narver and Slater (1990) and
MARKOR, developed by Kohli et al. (1993)) are presented. Finally, the findings for the
relationship between MO and performance are highlighted (Harris, 2001; He & Wei,
2011; Noble et al., 2002; Voss & Voss 2000).
2.2.2.1 The evolution of the concept of market orientation and the
different perspectives
MO has been recognized as a successful business strategy by academics and
practitioners. Until the end of 1990s, the concept of MO was connected to marketing
philosophy; it was understood as an implementation of this philosophy, and the studies
were focused on different determinants of its implementation (for instance, different
39
organizational factors). Horng and Chen (1998), for example, considered that the term
MO is consistent with the implementation of a marketing concept. These authors
explained the reasons for this: (1) intelligence generation (a requirement for MO) is the
search for and collection of information from the marketplace, which should include
consumer behavior and competitive actions; and (2) customer focus (an element of the
marketing concept) should be consistent with intelligence generation and thus with MO.
Needless to say, different researchers have developed distinct definitions for MO.
Ruekert (1992), for instance, considered that MO is the degree to which a business unit
obtains and uses information from customers, develops a strategy that will discover
customers‘ needs, and implements that strategy by being responsive to customers‘
requests and desires. Another definition was used by Shapiro (1998), who suggested
that three features mark out a market-driven company: (1) information on all important
buying influences and permeates every corporate function; (2) strategic and tactical
decisions are interfunctional and interdivisional; and finally (3) divisions and functions
create well-coordinated decisions that are executed with a sense of commitment.
However, two definitions dominate MO research (Noble et al., 2002): the definitions
proposed by Narver and Slater (1990) and Kohli and Jaworski (1990). Narver and Slater
(1990) define MO as a construct consisting of the three behavioral dimensions of
customer orientation, interfunctional coordination and competitor orientation. The
conceptualization of Kohli and Jaworski (1990) focuses more on MO as a process
having three stages: intelligence generation, intelligence dissemination and
responsiveness. Although the two concepts focus on different dimensions, they contain
a similar view of the concept of MO (Haugland et al., 2007).
Mavondo and Farrell (2000) presented a combination of these two definitions. In fact
they developed three main intersections between the two, considered to be the main
definitions for MO, which are that:
1. Both focus on the central role of the customer in the manifestation of MO.
2. Both include an external orientation.
3. Both recognize the importance of being responsive to customers at an
organizational level.
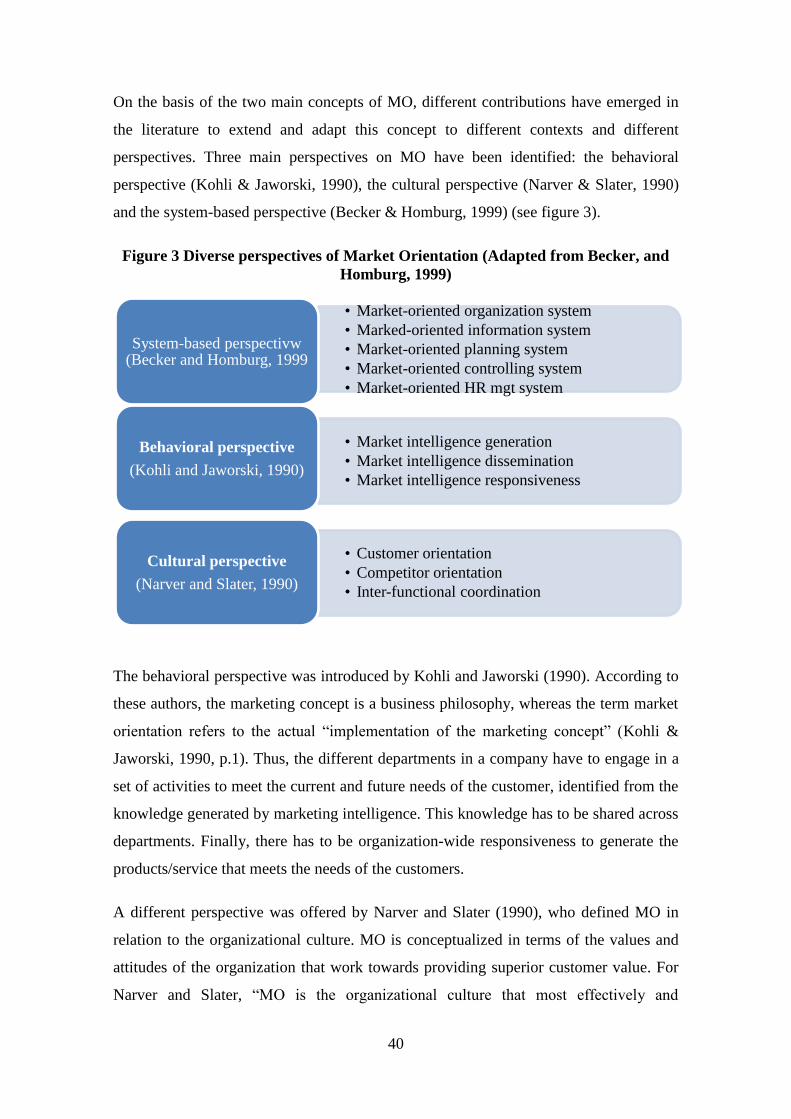
40
On the basis of the two main concepts of MO, different contributions have emerged in
the literature to extend and adapt this concept to different contexts and different
perspectives. Three main perspectives on MO have been identified: the behavioral
perspective (Kohli & Jaworski, 1990), the cultural perspective (Narver & Slater, 1990)
and the system-based perspective (Becker & Homburg, 1999) (see figure 3).
Figure 3 Diverse perspectives of Market Orientation (Adapted from Becker, and
Homburg, 1999)
The behavioral perspective was introduced by Kohli and Jaworski (1990). According to
these authors, the marketing concept is a business philosophy, whereas the term market
orientation refers to the actual ―implementation of the marketing concept‖ (Kohli &
Jaworski, 1990, p.1). Thus, the different departments in a company have to engage in a
set of activities to meet the current and future needs of the customer, identified from the
knowledge generated by marketing intelligence. This knowledge has to be shared across
departments. Finally, there has to be organization-wide responsiveness to generate the
products/service that meets the needs of the customers.
A different perspective was offered by Narver and Slater (1990), who defined MO in
relation to the organizational culture. MO is conceptualized in terms of the values and
attitudes of the organization that work towards providing superior customer value. For
Narver and Slater, ―MO is the organizational culture that most effectively and
• Market-oriented organization system
• Marked-oriented information system
• Market-oriented planning system
• Market-oriented controlling system
• Market-oriented HR mgt system
System-based perspectivw (Becker and Homburg, 1999
• Market intelligence generation
• Market intelligence dissemination
• Market intelligence responsiveness
Behavioral perspective
(Kohli and Jaworski, 1990)
• Customer orientation
• Competitor orientation
• Inter-functional coordination
Cultural perspective
(Narver and Slater, 1990)
41
efficiently creates the necessary behaviors for the creation of superior value for buyers‖
(Narver & Slater, 1990, p.21). They believed that MO is composed of the following
three components: customer orientation, competitor orientation and interfunctional
coordination.
Apart from these three components, they also discussed two criteria to be met if firms
are to achieve MO. They referred to the first one as long-term focus, which is necessary
in order to implement the components of MO and to generate profits; and the second
one as profitability, which can be measured with a high degree of fidelity. Narver and
Slater (1990) showed that being market-oriented is the basis for creating superior value
for the buyer.
Becker and Homburg (1999) developed the third perspective of MO. They considered a
system-based perspective that is concerned with ―how the redesign of organizational
structures can lead to an increased market orientation‖ (p.24). They studied how
different management systems can be designed to promote MO. The management
system is divided into five subsystems, namely the organizational, information,
planning, controlling and human resources subsystems.
According to Becker and Homburg (1999), the organizational system requires the
reduction of levels of hierarchy in order to force the top executives to develop closer
contact with customers‘ needs. On the other hand, fewer decision-making levels will
allow fast problem solving. The second requirement for being market-oriented is the
possession of an information system that captures exact data about customers and
competitors. Planning is the third subsystem, and should be based on establishing
specific targets that are relevant for increasing customer satisfaction and developing
durable competitive advantage. Fourth, the controlling system allows managers to
control internal and market-related figures, and compare current performance with
targets. Fifth, the human resource management system offers a large range of
opportunities to implement market orientation, ranging from the recruitment process to
the incentive structure (Becker & Homburg, 1999).
Despite the widespread acceptance of the three perspectives of MO (the cultural,
system-based and behavioral perspectives (Becker & Homburg, 1999; Helfert et al.,
2002)), a review of the literature demonstrates that the two predominant visions are the
42
cultural perspective and the behavioral one (Carr & Lopez, 2007; Elg, 2003; McClure,
2010; Sorensen, 2009). However, these two views have developed a conceptual and
operational overlap. Elg (2003) suggested that ―the two dominant approaches to MO are
similar in that both highlight the organization's capability to follow the marketing
concept, and stress the impact of market information within the organization‖ (p. 108).
However, some criticisms of the behavioral and cultural perspectives have also been
detected. For instance, Avlonitis and Gounaris (1997) have shown that a dissociation
between the cultural and the behavioral approaches should be avoided. In contrast,
McClure (2010) found that the behavioral and the cultural perspectives arrive at a fairly
unified concept in independent ways.
The importance of the three perspectives for MO that have been mentioned is that they
give a central classification in contemporary marketing literature. However, the focus of
this literature, in terms both of theory and the unit of empirical observation, is the
seminal contributions on MO by Narver and Slater (1990) and Jaworski and Kohli
(1990).
2.2.2.2 The measurement of market orientation
The literature on MO argues that the two dominant measures of MO are the MKTOR
measure of Narver and Slater (1990) and the MARKOR scale (e.g. Jaworski & Kohli,
1993; Liao et al., 2011; Sin et al., 2005). It is crucial for this research to remark that
these two original measures were created and developed to be used in domestic
environments. The majority of research into MO examines its determinants and its
impacts in a United States domestic setting. Chan and Ellis (1998) observed that the
strongest MO effects were typically found in the USA. Other positive results have been
recorded in a variety of non-US settings including Australia (Farrell, 2000), Spain
(Lado et al., 1998) and Ireland (O‘Sullivan & Butler, 2009), among others.
Other studies have examined different samples with the MKTOR and MARKOR
instruments (Moorman & Rust, 1999). This study considers these two measures, which
are the most prominent and which could be the basis for measuring the extended MO
concept for BG firms. Therefore, we consider it relevant to present both scales in detail.
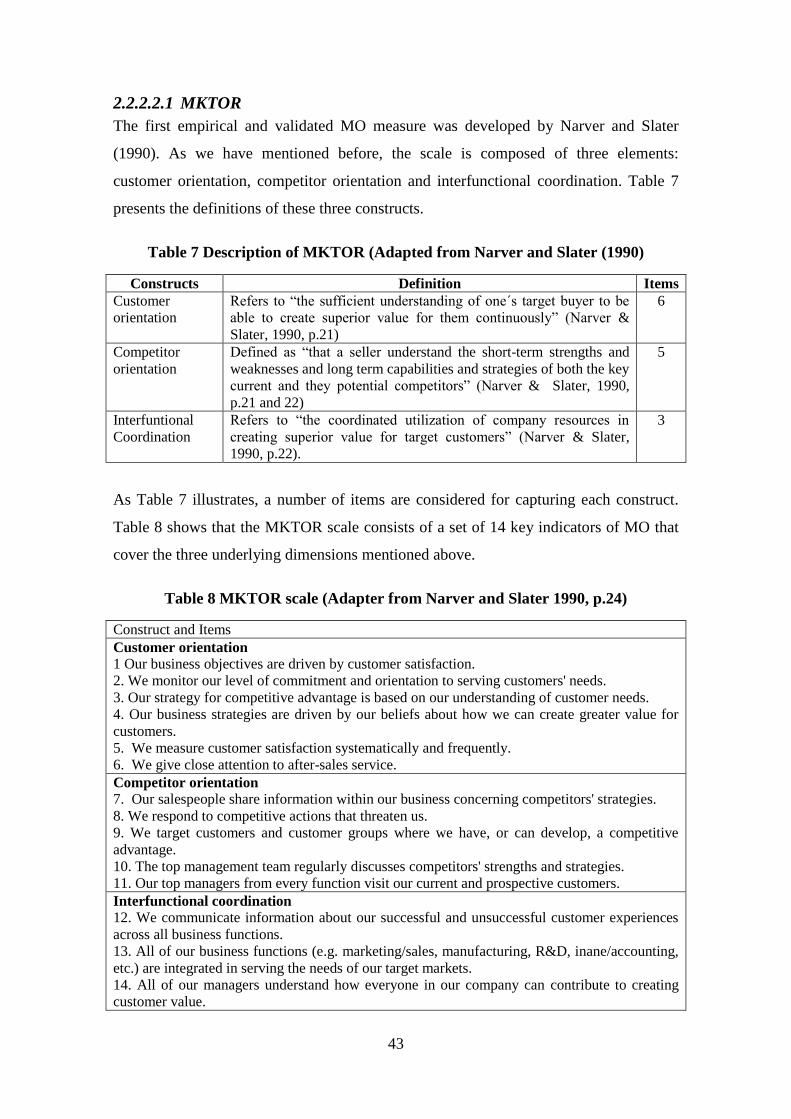
43
2.2.2.2.1 MKTOR
The first empirical and validated MO measure was developed by Narver and Slater
(1990). As we have mentioned before, the scale is composed of three elements:
customer orientation, competitor orientation and interfunctional coordination. Table 7
presents the definitions of these three constructs.
Table 7 Description of MKTOR (Adapted from Narver and Slater (1990)
Constructs Definition Items
Customer
orientation
Refers to ―the sufficient understanding of one´s target buyer to be
able to create superior value for them continuously‖ (Narver &
Slater, 1990, p.21)
6
Competitor
orientation
Defined as ―that a seller understand the short-term strengths and
weaknesses and long term capabilities and strategies of both the key
current and they potential competitors‖ (Narver & Slater, 1990,
p.21 and 22)
5
Interfuntional
Coordination
Refers to ―the coordinated utilization of company resources in
creating superior value for target customers‖ (Narver & Slater,
1990, p.22).
3
As Table 7 illustrates, a number of items are considered for capturing each construct.
Table 8 shows that the MKTOR scale consists of a set of 14 key indicators of MO that
cover the three underlying dimensions mentioned above.
Table 8 MKTOR scale (Adapter from Narver and Slater 1990, p.24)
Construct and Items
Customer orientation
1 Our business objectives are driven by customer satisfaction.
2. We monitor our level of commitment and orientation to serving customers' needs.
3. Our strategy for competitive advantage is based on our understanding of customer needs.
4. Our business strategies are driven by our beliefs about how we can create greater value for
customers.
5. We measure customer satisfaction systematically and frequently.
6. We give close attention to after-sales service.
Competitor orientation
7. Our salespeople share information within our business concerning competitors' strategies.
8. We respond to competitive actions that threaten us.
9. We target customers and customer groups where we have, or can develop, a competitive
advantage.
10. The top management team regularly discusses competitors' strengths and strategies.
11. Our top managers from every function visit our current and prospective customers.
Interfunctional coordination
12. We communicate information about our successful and unsuccessful customer experiences
across all business functions.
13. All of our business functions (e.g. marketing/sales, manufacturing, R&D, inane/accounting,
etc.) are integrated in serving the needs of our target markets.
14. All of our managers understand how everyone in our company can contribute to creating
customer value.
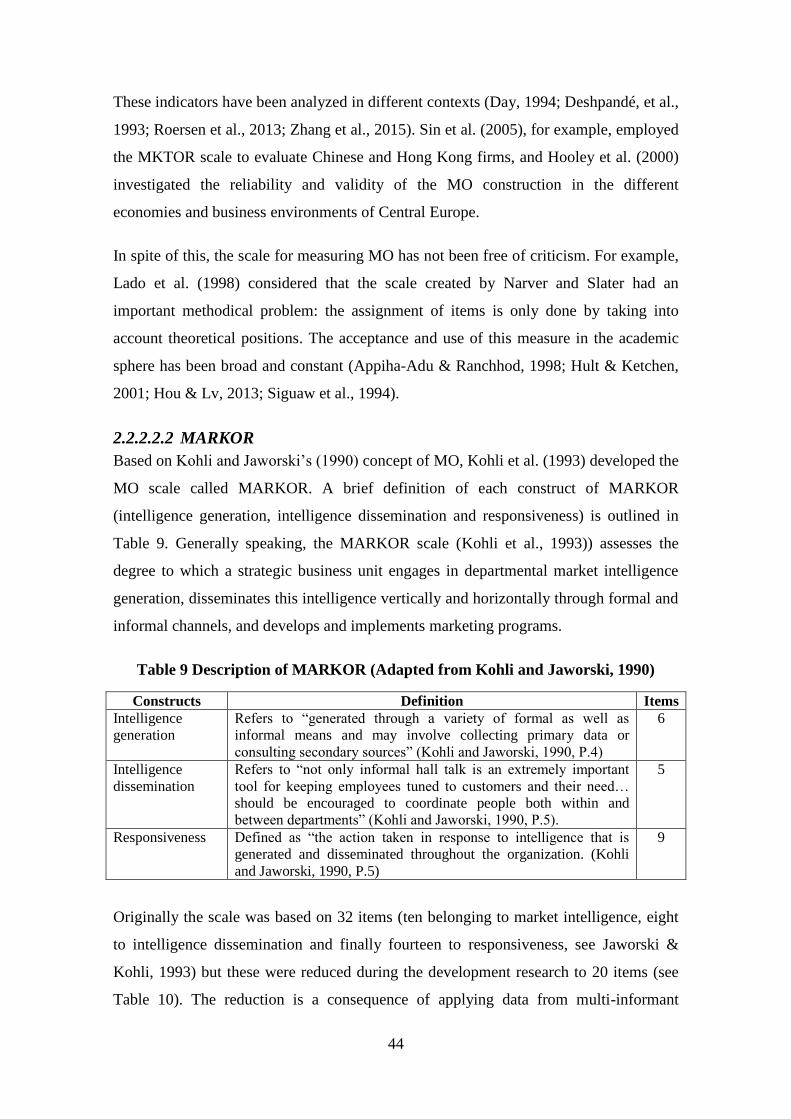
44
These indicators have been analyzed in different contexts (Day, 1994; Deshpandé, et al.,
1993; Roersen et al., 2013; Zhang et al., 2015). Sin et al. (2005), for example, employed
the MKTOR scale to evaluate Chinese and Hong Kong firms, and Hooley et al. (2000)
investigated the reliability and validity of the MO construction in the different
economies and business environments of Central Europe.
In spite of this, the scale for measuring MO has not been free of criticism. For example,
Lado et al. (1998) considered that the scale created by Narver and Slater had an
important methodical problem: the assignment of items is only done by taking into
account theoretical positions. The acceptance and use of this measure in the academic
sphere has been broad and constant (Appiha-Adu & Ranchhod, 1998; Hult & Ketchen,
2001; Hou & Lv, 2013; Siguaw et al., 1994).
2.2.2.2.2 MARKOR
Based on Kohli and Jaworski‘s (1990) concept of MO, Kohli et al. (1993) developed the
MO scale called MARKOR. A brief definition of each construct of MARKOR
(intelligence generation, intelligence dissemination and responsiveness) is outlined in
Table 9. Generally speaking, the MARKOR scale (Kohli et al., 1993)) assesses the
degree to which a strategic business unit engages in departmental market intelligence
generation, disseminates this intelligence vertically and horizontally through formal and
informal channels, and develops and implements marketing programs.
Table 9 Description of MARKOR (Adapted from Kohli and Jaworski, 1990)
Constructs Definition Items
Intelligence
generation
Refers to ―generated through a variety of formal as well as
informal means and may involve collecting primary data or
consulting secondary sources‖ (Kohli and Jaworski, 1990, P.4)
6
Intelligence
dissemination
Refers to ―not only informal hall talk is an extremely important
tool for keeping employees tuned to customers and their need…
should be encouraged to coordinate people both within and
between departments‖ (Kohli and Jaworski, 1990, P.5).
5
Responsiveness Defined as ―the action taken in response to intelligence that is
generated and disseminated throughout the organization. (Kohli
and Jaworski, 1990, P.5)
9
Originally the scale was based on 32 items (ten belonging to market intelligence, eight
to intelligence dissemination and finally fourteen to responsiveness, see Jaworski &
Kohli, 1993) but these were reduced during the development research to 20 items (see
Table 10). The reduction is a consequence of applying data from multi-informant
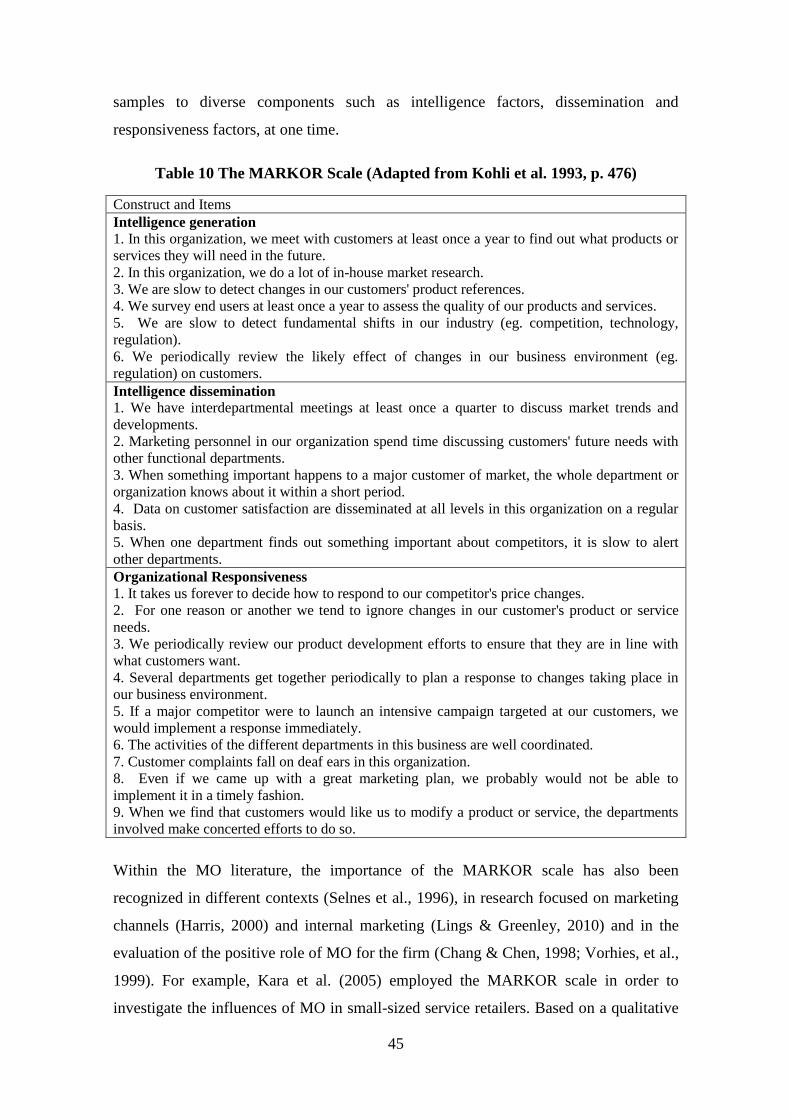
45
samples to diverse components such as intelligence factors, dissemination and
responsiveness factors, at one time.
Table 10 The MARKOR Scale (Adapted from Kohli et al. 1993, p. 476)
Construct and Items
Intelligence generation
1. In this organization, we meet with customers at least once a year to find out what products or
services they will need in the future.
2. In this organization, we do a lot of in-house market research.
3. We are slow to detect changes in our customers' product references.
4. We survey end users at least once a year to assess the quality of our products and services.
5. We are slow to detect fundamental shifts in our industry (eg. competition, technology,
regulation).
6. We periodically review the likely effect of changes in our business environment (eg.
regulation) on customers.
Intelligence dissemination
1. We have interdepartmental meetings at least once a quarter to discuss market trends and
developments.
2. Marketing personnel in our organization spend time discussing customers' future needs with
other functional departments.
3. When something important happens to a major customer of market, the whole department or
organization knows about it within a short period.
4. Data on customer satisfaction are disseminated at all levels in this organization on a regular
basis.
5. When one department finds out something important about competitors, it is slow to alert
other departments.
Organizational Responsiveness
1. It takes us forever to decide how to respond to our competitor's price changes.
2. For one reason or another we tend to ignore changes in our customer's product or service
needs.
3. We periodically review our product development efforts to ensure that they are in line with
what customers want.
4. Several departments get together periodically to plan a response to changes taking place in
our business environment.
5. If a major competitor were to launch an intensive campaign targeted at our customers, we
would implement a response immediately.
6. The activities of the different departments in this business are well coordinated.
7. Customer complaints fall on deaf ears in this organization.
8. Even if we came up with a great marketing plan, we probably would not be able to
implement it in a timely fashion.
9. When we find that customers would like us to modify a product or service, the departments
involved make concerted efforts to do so.
Within the MO literature, the importance of the MARKOR scale has also been
recognized in different contexts (Selnes et al., 1996), in research focused on marketing
channels (Harris, 2000) and internal marketing (Lings & Greenley, 2010) and in the
evaluation of the positive role of MO for the firm (Chang & Chen, 1998; Vorhies, et al.,
1999). For example, Kara et al. (2005) employed the MARKOR scale in order to
investigate the influences of MO in small-sized service retailers. Based on a qualitative
46
study the scale was used to determine the dimensions of a market-oriented organization.
The findings detected by these authors suggest that the MARKOR scale provided a
good measure of MO in this setting. Likewise, building on the MARKOR scale, Hoe
and McShane (2010) observed how informal knowledge acquisition and informal
knowledge dissemination increase with the level of shared vision.
As we mentioned before, the marketing literature provides numerous papers that
examine the two measures of the MO construct, MARKOR and MKTOR. Table 11
provides an overview of prior studies on the constructs of MO. Two eligibility criteria
were included in the papers listed in Table 11. First, they had to measure MO using
items inspired by either MARKOR or MKTOR. Second, the studies had to have been
conducted and published between 1993 and 2011. A systematic search of the Thomson
Reuters Web of Science (formerly ISI Web of Knowledge), and the ABI/Inform
databases was conducted using the following keywords: MKTOR and MARKOR.
Based on the citation range (≥10), a final sample of 13 studies was selected, and these
contained sufficient information for our analysis. However, this review is intended as a
current overview of the application of MO scales and not as a review of the entire
population of works. Quantitative works dominate the literature, although conceptual
studies and literature reviews are also reasonably well represented.
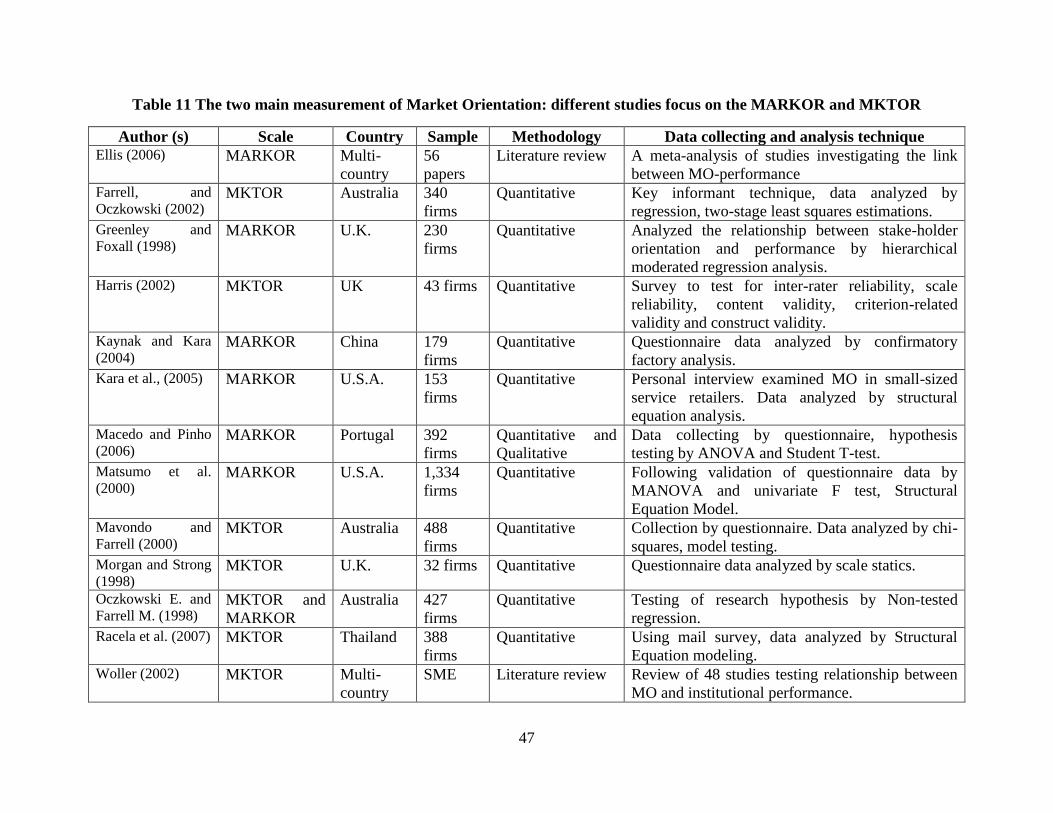
47
Table 11 The two main measurement of Market Orientation: different studies focus on the MARKOR and MKTOR
Author (s) Scale Country Sample Methodology Data collecting and analysis technique Ellis (2006) MARKOR Multi-
country
56
papers
Literature review A meta-analysis of studies investigating the link
between MO-performance Farrell, and
Oczkowski (2002) MKTOR Australia 340
firms
Quantitative Key informant technique, data analyzed by
regression, two-stage least squares estimations. Greenley and
Foxall (1998) MARKOR U.K. 230
firms
Quantitative Analyzed the relationship between stake-holder
orientation and performance by hierarchical
moderated regression analysis. Harris (2002) MKTOR UK 43 firms Quantitative Survey to test for inter-rater reliability, scale
reliability, content validity, criterion-related
validity and construct validity. Kaynak and Kara
(2004) MARKOR China 179
firms
Quantitative Questionnaire data analyzed by confirmatory
factory analysis. Kara et al., (2005) MARKOR U.S.A. 153
firms
Quantitative Personal interview examined MO in small-sized
service retailers. Data analyzed by structural
equation analysis. Macedo and Pinho
(2006) MARKOR Portugal 392
firms
Quantitative and
Qualitative
Data collecting by questionnaire, hypothesis
testing by ANOVA and Student T-test. Matsumo et al.
(2000) MARKOR U.S.A. 1,334
firms
Quantitative Following validation of questionnaire data by
MANOVA and univariate F test, Structural
Equation Model. Mavondo and
Farrell (2000) MKTOR Australia 488
firms
Quantitative Collection by questionnaire. Data analyzed by chi-
squares, model testing. Morgan and Strong
(1998) MKTOR U.K. 32 firms Quantitative Questionnaire data analyzed by scale statics.
Oczkowski E. and
Farrell M. (1998) MKTOR and
MARKOR
Australia 427
firms
Quantitative Testing of research hypothesis by Non-tested
regression. Racela et al. (2007) MKTOR Thailand 388
firms
Quantitative Using mail survey, data analyzed by Structural
Equation modeling. Woller (2002) MKTOR Multi-
country
SME Literature review Review of 48 studies testing relationship between
MO and institutional performance.
48
From the papers that report results‘ using the existing scales (see Table 11), it is difficult to
justify the selection of either MARKOR or MKTOR for studying the MO of BG firms. Gauzente
(1999) argued that the use of one scale or the other will show a specific theoretical orientation,
with MARKOR more centered on the organizational aspects of MO and MKTOR on the
customer dimension. A meta-analysis by Ellis (2006) aggregating empirical evidence from the
extensive MO literature concluded that the MKTOR has a strong nomological relationship with
customer value. By contrast, ―MARKOR is more narrowly defined in terms of intelligence
gathering and disseminating activities, activities that may be less well linked with performance‖
(p. 1098).
Likewise, both scales have been tested with various adaptations and reductions in items. The
main achievements have been synthesized in the study presented by Farrell and Oczkowski
(1997). In fact, from their research these authors suggested that an eight-item MKTOR measure
produces a better fit of the model, while they prefer the MARKOR measure with ten items
because it allows a balance between the various sub-constructs.
2.2.2.3 Examining the impact of market orientation on firms’ performance
Many scholars have demonstrated a link between a higher MO level and better performance
(Hooley et al., 2003; Jaworski & Kohli, 1993; Narver & Slater, 1990). Moreover, they have
identified several variables that influence the effects of MO on performance. These variables
included relative size, relative cost, ease of entry, supplier power, buyer power, market growth,
competitive intensity, market turbulence, and technological turbulence.
Marketing academics suggest that the two main classical and empirical works explain the
relationship between MO and performance. Thus, Kohli and Jaworski (1990)offered a theoretical
foundation for the probability that this orientation should lead to higher firm performance.
Jaworski and Kohli (1993, p.64) stated that ―managers should strive to improve the market
orientation of their businesses in their efforts to attain higher business performance‖. Narver and
Slater (1990) provided the first empirical evidence linking MO and profitability in the strategic
business units of a large firm. Since these empirical papers were published, a large body of
studies has appeared that show the positive effect of MO on business performance. However
49
Haugland et al.(2007) confirm that ―most empirical studies testing the MO-performance link
utilize the MKTOR‖ (p. 1193).
In general, empirical studies in this field show that MO has a positive impact on organizational
performance. For instance, controlling by size of firm, the evidence presented by Pelham (2000)
establishes a positive association between MO and performance; Pelham also analyzed the effect
on the growth strategy of the firms. He also considered that MO is one of several ingredients of
success for small firms.
In sum, using Narver and Slater‘s (1990) and/or Kohli et al.‘s (1993) scales, many empirical
studies have tested the MO–performance link. However, to the best of our knowledge, the impact
of MO on BG firms‘ performance has not yet been addressed. Our review of MO and the
international new ventures literature shows an absence of theoretical and empirical work
extending MO research to the quickly internationalizing firms, although some authors recognize
its relevance. Only a relatively small number of empirical works have expanded MO research to
include international new ventures (INVs) and BG firms (Wood et al., 2011; Ripollés et al.,
2012). For instance, Ripollés et al. (2012) highlighted the influence of the international learning
effort of INVs through their international MO. Other studies address the role of MO as a strategy
that influences the success of INVs when combined with entrepreneurial orientation and learning
orientation (Frishammar & Andersson 2009; Ruokonen & Saarenketo 2009; Ripollés et al.,
2012). Although past studies have made significant progress toward understanding MO in early
internationalizing firms, conceptual and measurement issues for BG firms require further
exploration (Blesa et al., 2008). As Knight and Cavusgil (2004) point out, MO may be especially
important in the performance of BG firms.
2.2.2.4 Market orientation in the context of international firms, and its impact
on performance
The role of MO in the international business environment was initially explored by the seminal
research of Cadogan et al. (1999), drawing on traditional exporter firms; these authors developed
a measurement scale called ―export market orientation‖ (EMO). This scale was based on the
MARKOR items and adapted to the export context by adding three constructs: export
intelligence generation, export intelligence dissemination and export intelligence responsiveness.
The EMO scale has been empirically tested on exporter firms (Cadogan, et al., 2001; Cadogan et
50
al., 2002; Cadogan et al., 2003; Ju, et al., 2011; Chung, 2012; Nagy & Beracs, 2012; Boso et al.,
2013).
However, other researchers who have been focused on traditional exporter firms (e.g. He & Wei,
2011; Küster &Vila, 2011) and other types of firm (which have been called new entrepreneurial
ventures, new exporter ventures, small software firms, smaller firms with international activity
and exporter ventures) have been studying the influence of MO in an international context based
on the original MARKOR or MKTOR scales (Balas et al., 2012; Brettel et al., 2009; Dimitratos
et al., 2012; Evers, 2011; He & Wei, 2011; Ruokonen et al., 2008).
Although a growing body of literature has attempted to explain the role of MO in BG
firms/INVs, research in this area has been scarce. As pointed out by Kirpalani and Gabrielsson
(2012), ―it is important that many more studies be done on the effect of enhanced MO in many
different markets and on the many different products/services that BGs and other categories of
SMEs have‖ (p.122).
In order to identify the intellectual voids and confirm the research gaps, we reviewed the
literature on MO in the context of BG firms/INVs, utilizing a keyword search of available online
journal databases: Thomson Reuters Web of Science (formerly ISI Web of Knowledge), and
Scopus. We searched with the major keywords phrase, “market orientation and born global
firms/ international new ventures "on December 4, 2014 to provide an overview mainly of the
methodologies and scales that had been used (e.g. EMO, MKTOR or MARKOR) and whether
the researchers analyzed the impact of MO on performance.
After introducing the keywords, we had approximately one hundred articles. The full text of each
article was reviewed to eliminate those articles that were not related to MO linked with BG
firms/INVs. The selection criteria were as follows:
(1) Only those articles that had been published in the research areas: business economics or
business, management and accounting were selected, as these were the most appropriate
outlets for research into MO and BG firms/INVs (Li & Cavusgil, 1995).
(2) We chose articles that were focused only on BG firms/INVs and analyzed MO.
51
(3) Articles about other types of firms such as SMEs, multinational companies, domestic
joint ventures, new ventures, etc. were ignored.
(4) Articles that were only focused on other orientations, like entrepreneurial orientation,
learning orientation or marketing orientation, were ignored.
After filtering these original articles, we selected five pieces of research that took into account
the impact of MO on INVs and BG firms (Table 12) and that had been published within the
previous five years (2009 to 2014). In spite of the relevance of MO in the context of international
markets Dong et al. (2013) say that ―MO has been advocated and recognized as one of the most
important strategic orientations in international markets‖ (p. 591), the amount of MO research in
the context of firms that have undergone early internationalization has been small. A similar
result was found by Cadogan (2012), who performed an extensive review of MO research over
20 years. He found around 800 papers and confirmed the positive performance outcomes, but
stated that research with internationalizing firms had been limited.
MO plays a vital role in the internationalization of firms (Dong et al., 2013). Previous studies
refer to MO as strategic orientation (Odorici & Presutti, 2013) and organizational capability
(Kocak & Ambibola, 2009), and as an element of the international entrepreneurship culture
(Gabrielsson et al., 2014). Many studies (e.g. Liao et al., 2011) have treated MO as a composite
construct and explored its relationship with other variables. In a similar vein, the five studies in
our review analyzed MO by looking at it in combination with other strategies, mostly with
entrepreneurial orientation (e.g. Gabrielsson et al., 2014; Kocak & Ambibola 2009; Odorici &
Presutti, 2013). Thus we observed that none of these studies modeled the individual components
of MO and investigated their impact on performance.
As can be seen in Table 12, the methodology selected in the studies was mainly case studies. For
instance, Arpa et al. (2012), based on the perceptions of the owners/managers of four BG firms
from Ireland, proposed a theoretical model that combines the internationalization and orientation
approaches (entrepreneurial/market orientations). Kocak and Abimbola (2009) conducted a
multi-case analysis with five BG firms, and found that entrepreneurial capital,
entrepreneurial/market orientation and innovation were the main sources of positive performance
for BG firms. In spite of the predominance of the qualitative studies, only the research of
52
Ripollés et al. (2012) used quantitative methodology based on structural equation modeling in
order to test how early international entry, entrepreneurial orientation and international market
orientation influence the entry mode to foreign markets. The results highlighted that MO is a key
element of a firm‘s choice of entry mode, involving a higher commitment of resources.
Many of the studies do not mention the scale of MO that is employed – only two of them refer to
this. Gabrielsson et al. (2014) adopted the MKTOR scale as an element of the scale measuring
international entrepreneurial culture (IEC). The study indicated that IEC positively affects the
early growth of INVs. Ripolles et al. (2012) measured the degree of MO, based on MKTOR and
MARKOR, of INVs in the international market.
In general, the literature on MO has established that it has a positive effect on business
performance (Kirca et al., 2005). As we can see in Table 12, of these five articles, only one
examined the impact of MO on performance. In the qualitative exploration, Kocak and Ambibola
(2009) refers to the positive effect of MO on performance. Indeed, given the level of attention
that the link between MO and performance receives in the literature, the other four articles did
not consider it to be within their objectives to study this relationship. These studies call for
research exploring the effects of MO on performance of INVs/BG firms (e.g. Gabrielsson et al.,
2014; Hallbäck & Gabrielsson, 2013; Odorici & Presutti, 2013).
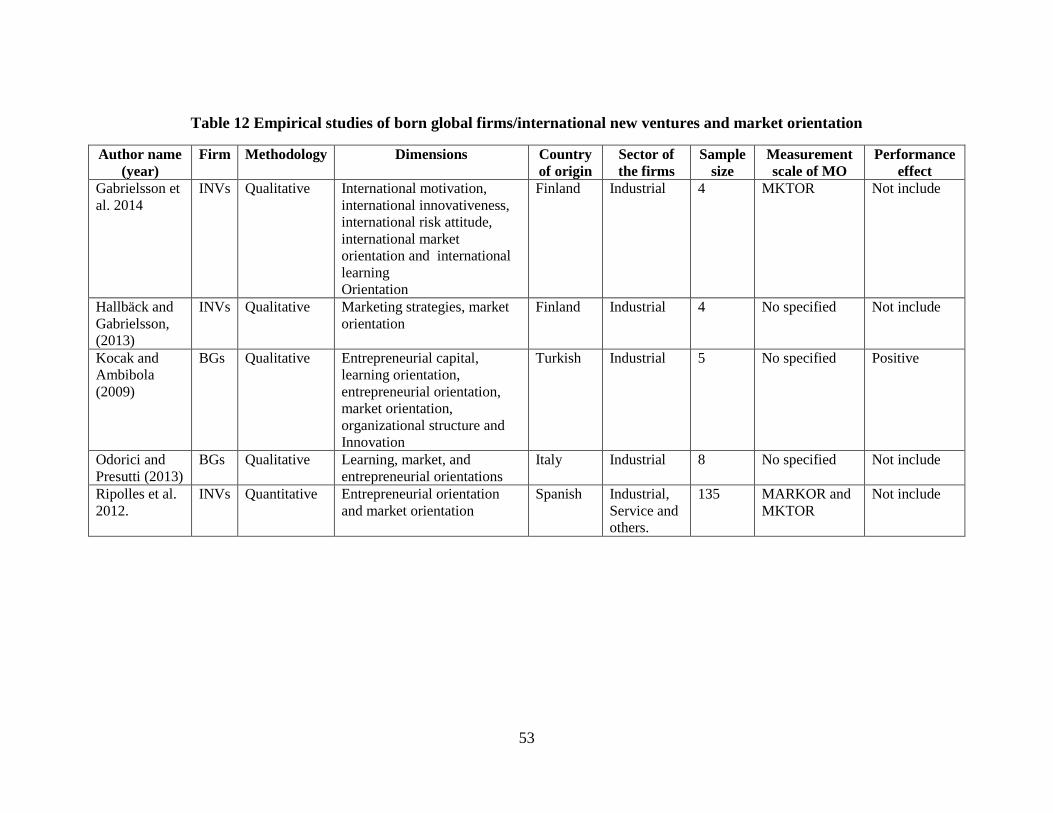
53
Table 12 Empirical studies of born global firms/international new ventures and market orientation
Author name
(year)
Firm Methodology Dimensions Country
of origin
Sector of
the firms
Sample
size
Measurement
scale of MO
Performance
effect
Gabrielsson et
al. 2014
INVs Qualitative International motivation,
international innovativeness,
international risk attitude,
international market
orientation and international
learning
Orientation
Finland Industrial 4 MKTOR Not include
Hallbäck and
Gabrielsson,
(2013)
INVs Qualitative Marketing strategies, market
orientation
Finland Industrial 4 No specified Not include
Kocak and
Ambibola
(2009)
BGs Qualitative Entrepreneurial capital,
learning orientation,
entrepreneurial orientation,
market orientation,
organizational structure and
Innovation
Turkish Industrial 5 No specified Positive
Odorici and
Presutti (2013)
BGs Qualitative Learning, market, and
entrepreneurial orientations
Italy Industrial 8 No specified Not include
Ripolles et al.
2012.
INVs Quantitative Entrepreneurial orientation
and market orientation
Spanish Industrial,
Service and
others.
135 MARKOR and
MKTOR
Not include
54
2.3 RESEARCH QUESTIONS
Taking into account the general conclusion of our literature review, the main research
aim of this study is to enhance the comprehension of the impact of MO on BG firms‘
performance.
The significance of MO as a phenomenon has fostered a steady stream of research in the
marketing literature since the works of Kohli and Jaworski and Narver and Slater were
published. However, the extant literature indicates that an area of research that
continues to captivate the attention of scholars involves the validation of measurement
scales (Oczkowski & Farrell, 1998; Schlosser & McNaughton, 2009; Siguaw &
Diamantopoulos, 1994).
Therefore, our first step towards achieving our purpose is to validate the suitability of
the traditional concept of MO, as well as the measurement scales for MO, for a specific
type of firm: a firm that becomes international almost from inception. As we have seen,
MO measurements have been designed in the context of the domestic market, and some
modification of the items should perhaps be observed when the interest is in measuring
the consequence of MO on the performance of firms that have undergone rapid
internationalization.
This is translated into the specific research questions (RQ) for this research:
RQ1: Are the traditional MO concept and measurement scales adequate for BG firms?
RQ2: If they are not, how should they be modified? Is it necessary to extend the
traditional concept of MO by considering other constructs? Should some item or items
of the traditional scales be removed or other items be added and, if so, which item or
items should these be?
RQ3: What is the impact of MO, or the impact of the extended MO concept, on the
performance of BG firms?
2.4 METHODOLOGY
To explore, first of all, the adequacy of the traditional MO concept and the measurement
scales for BG firms, and then to obtain an impression of the consequences of MO on the
55
performance of this type of firm, we believe that a qualitative methodology, and
especially case study research, is convenient.
Autio et al. (2000) and Rialp et al. (2005) called for deeper case studies in order to
move one step forward and try to do a more fine-grained analysis related to BG firms.
Following these recommendations, this study will implement case studies for clarifying
the MO concept for BG firms and for anticipating its effect on firms‘ performance.
According to Eisenhardt (1989, p.548), ―case study research is likely to have important
strengths like novelty, testability and empirical validity‖.
This section is focused on presenting the methodology used in this research. First, we
would like to emphasize some fundamental reasons for the selection of our research
method; second, we will describe the different stages of this study; third, we will
discuss the development of the process for the selection of firms, and finally, we will
focus on the issues arising from the interviews, and their analysis.
2.4.1 Research method: Exploratory study
Exploratory study is appropriate when the interest is to obtain the first knowledge about
an unexplored aspect that could also be a context-specific phenomenon. By employing a
case study approach it is possible to obtain deeper information and understand the
reasons why we observe the phenomenon under observation. In this case, the research
method selected has to be able to tell us if the traditional concept of MO and the scales
for measuring it are useful in the specific context of BG firms.
Yin (2003) considers the case study method to be appropriate for topics that are
relatively new. Furthermore, the method can be used when the following distinctive
features are present: (i) a contemporary phenomenon is to be examined and investigated
in its actual environment; (ii) the boundaries between the phenomenon and its context
are not clearly evident, (iii) multiple sources of data are considered, and(iv) a unique
case or multiple cases could be considered. In this research we are going to use multiple
cases (we will analyze five firms). Eisenhardt (1989) argues that the minimum number
of study cases in the sample can be four: ―if there is no ideal number of cases, a number
between four and ten cases usually works well‖ (p. 545).
Despite all its challenges (it is time-consuming and laborious, it needs skilled
interviewers, and general conclusions are not usually obtained), the results of choosing
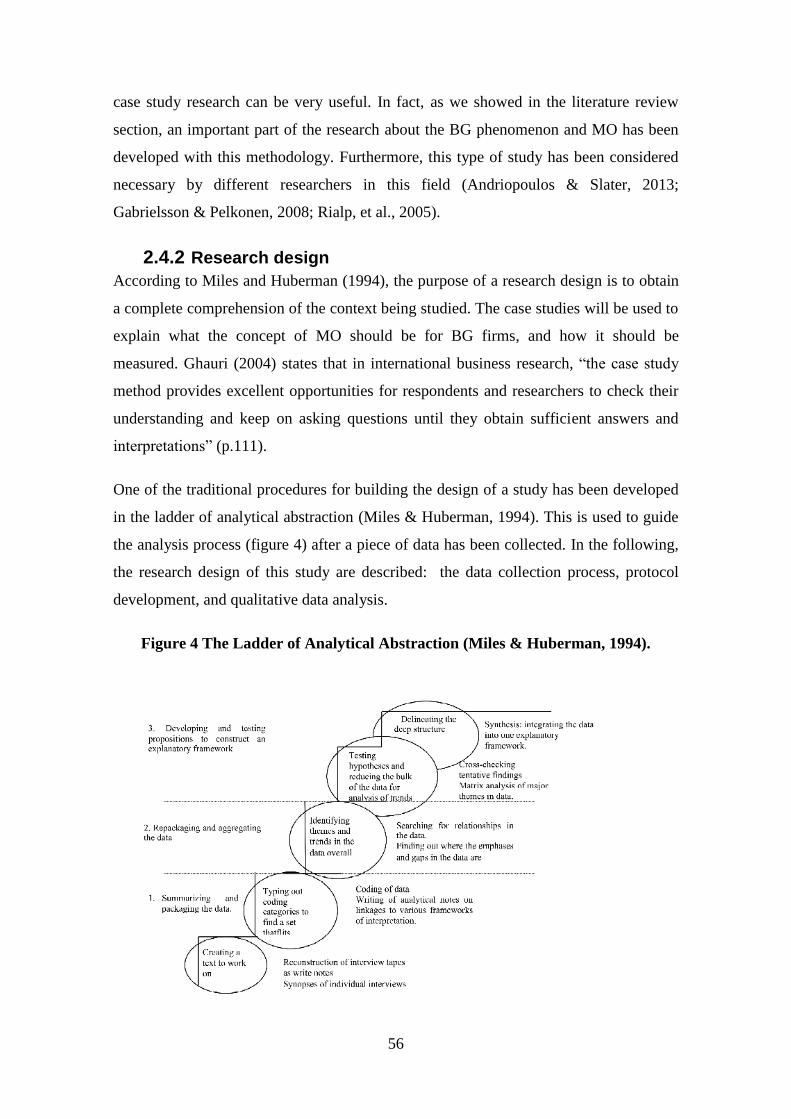
56
case study research can be very useful. In fact, as we showed in the literature review
section, an important part of the research about the BG phenomenon and MO has been
developed with this methodology. Furthermore, this type of study has been considered
necessary by different researchers in this field (Andriopoulos & Slater, 2013;
Gabrielsson & Pelkonen, 2008; Rialp, et al., 2005).
2.4.2 Research design
According to Miles and Huberman (1994), the purpose of a research design is to obtain
a complete comprehension of the context being studied. The case studies will be used to
explain what the concept of MO should be for BG firms, and how it should be
measured. Ghauri (2004) states that in international business research, ―the case study
method provides excellent opportunities for respondents and researchers to check their
understanding and keep on asking questions until they obtain sufficient answers and
interpretations‖ (p.111).
One of the traditional procedures for building the design of a study has been developed
in the ladder of analytical abstraction (Miles & Huberman, 1994). This is used to guide
the analysis process (figure 4) after a piece of data has been collected. In the following,
the research design of this study are described: the data collection process, protocol
development, and qualitative data analysis.
Figure 4 The Ladder of Analytical Abstraction (Miles & Huberman, 1994).
57
2.4.3 Data collection
Spain was chosen as the test site. This context has previously been adopted in the BG
firms and MO literature. Regarding the early internationalization phenomenon, for
example, some researchers have described and explained aspects of internationalization
(Rialp & Rialp, 1996), others have compared the rapid internationalization process and
the gradual one (Pla-Barber & Cobos, 2002), and others have analyzed export activity in
Spanish firms (Alonso & Danoso, 2000; Valenzuela, 2000).
In studies focused on MO based on Spanish firms, different aspects have been tested;
for instance Lado et al. (1998) developed an operational measure of MO that measures
this theoretical construct as closely as possible. Based on the Inditex-Zara case, Mazaira
et al. (2003) ―examined the effects of organizational culture in general and MO on the
behavior and results of managerial organizations‖ (p. 220). Accordingly, there is
existing support in previous research for using the Spanish context, and in our case we
will present empirical results from Spanish firms in order to answer our research
questions.
The sample for the study was drawn from the ―Sistema Anual de Balances Ibéricos‖
(SABI) database, which contains business accounts, ratios, activities, and shareholdings
for 1,249,005 Spanish companies. Since we are only interested in studying BG firms,
we first subtracted a sub-sample using the next three criteria:
1. Firms should be SMEs: according to the European Commission definition, the
number of employees is considered when establishing the size of a firm: A)
medium-sized:< 250, B) small: < 50 C) micro:< 10.
2. Firms should have started their international activity within three years after
inception, if they are to be considered born global (Knight et al., 2004).
3. Firms must be exporting 25% of their sales (Knight & Cavusgil 1996; Knight,
1997; Madsen et al., 2000).
Under these three criteria, 231 firms were identified. As we mentioned before, we chose
five of these companies. The case firms were chosen using a number of different
characteristics, as suggested by Eisenhardt (1989), such as representing one of the three
58
categories of manufacturing company, service company or research organization, and
having grown and survived during their international expansion. The firms were drawn
from the low-tech and high-tech industry sectors. Firms from traditional industries such
as design, decoration and medical instruments were included, as were one firm using
advanced technology to develop telecommunication systems and another using
information technology to provide advertising services. This sample thus enabled us to
explore the phenomena of interest across industry sectors, which was recently identified
as a desirable approach (Mort & Weerawardena, 2006; Kocak & Abimbola, 2009).
Between June and July 2010 we conducted interviews with the general manager and/or
chief marketing officer in each business. We chose to conduct interviews with the
managers that had been responsible for managing the firms‘ internationalization
processes and marketing activities. Consistent with the guidelines recommended by
Gray (1997), which have been widely adopted (Ever & Knight, 2008; Sullivan-Mort &
Weerawardena, 2006), the use of a single respondent enables the opinion of the key
informant to be collected, in order to avoid data distortion, ―due to the fact that for
SMEs, the decision making competence on internationalization falls only on one
person‖ (Casillas et al., 2010 p. 166).
The interviews ranged in time from40 to 60 minutes. The interviews were recorded, and
transcripts of our field notes and observations were kept. A database was created to
maintain the prepared case study protocol1. In addition to in-depth interviews, we
utilized different sources to collect information about the firms (Yin, 2003).
2.4.4 Protocol development
Taking into account the main purpose of this research (to determine the usefulness of
the traditional MO concept and the scales for measuring it for BG firms), the scales that
were identified in the literature (the MARKOR and MKTOR scales) were used as
starting point. We then developed the interview protocol. Respondents were asked about
aspects regarding the international activity of their firms (the role of international
operations, the international experience of the management and the percentage of
international sales) and about how they evaluated the MO of their firms; finally, they
1 Although we acknowledge that use of the case study concept is not enough because we only conducted
the in-deep interview with key managers of the company, following other scholars (e.g. Kocak &
Abimbola, 2009; Odorici & Presutti, 2013; Sullivan-Mort et al., 2012) we will refer to case study within
our qualitative analysis.
59
were asked to assess both scales (to check the suitability of each item). See the protocol
in Appendix 2 (Spanish version) and Appendix 3 (English version) .
2.4.5 Qualitative data analysis
Once the data were collected, the next step in the process was the qualitative data
analysis (QDA). This process was carried out with the help of a well-known software
application for text analysis (Muhr & Friese 2004).Computer aided qualitative analysis
software (CAQDAS) has been developed for this exact purpose and is being used more
frequently owing to the increasing popularity of qualitative methods as a whole.
ATLAS.ti is a software program that is suitable for helping researchers to code, sort and
analyze qualitative data. In this research, ATLAS.ti 6.1computer software based on the
grounded theory techniques (Strauss & Corbin 1990, 1994) was used for optimizing the
QDA process.
ATLAS.ti is a powerful tool that supports the researcher in handling large amounts of
data during the process of QDA. According to Muhr (2004), different types of data can
be analyzed, including textual, graphical, audio, and video data. Within this software,
various quotations, codes and memos can be respectively selected, assigned, or created,
in the process of refining data from interviews. In general, the QDA in this research was
addressed as follows:
A) Assigning documents: When we started the ATLAS.ti application, we were
presented with the concept of a hermeneutic unit (HU). The HU contains all the
entire primary documents (texts and sound files) for this project. Primary
documents play a major role in the ATLAS.ti framework. They are the interface
between the HU and the data.
B) Creating quotations and codes: We can select specific quotations and assign
codes. A total of 33 codes were created. Some of them were ―In-vivo‖ code (e.g.
―propose items‖, ―technological competence‖). The term ―In-vivo‖ in this
context stems from grounded theory, and draws the researchers‘ attention to
expressions used by the interviewees themselves. Other codes were created with
―open coding‖, which assigns the selected code to the current data segment. This
is efficient for the consecutive coding of segments using the most recently used
code, such as ―MKTOR or MARKOR‖. The 33 codes were later divided into
four family codes that grouped together codes related to the same theme.
60
C) Creating networks: The relationships between the codes became clearer by
creating networks and coding them after reading the whole text. ATLAS.ti uses
networks to help represent and explore conceptual structures.
The use of ATLAS.ti allowed us to read the whole texts, create free quotations, and link
them with codes in order to enrich our QDA. The findings that emerge from the QDA
are presented and discussed in the next section.
2.5 FINDINGS
This section presents an analysis of the data obtained through the protocol implemented
for obtaining information related to the MO of BG firms. It begins with a within
analysis of our five cases, and then we discuss our cross-case analysis for answering our
research questions.
As we have already mentioned, data and interview notes were coded by the author using
the ATLAS.ti 6.1software.This was done for each firm for a number of dimensions.
This program makes it easier to identify the different statements that represent each
dimension that is being studied, because in the left margin of the document you see the
code words, and the corresponding statement is then marked. In the within analysis
section the firms and their BG profiles were described. The cases were then classified
according to the three dimensions that were deemed to be most important for exploring
their MO. Finally, in this section, we present a comparison between the five cases
studied.
2.5.1 Within analysis
As has already been established, the BG enterprises constitute the units of analysis. As
we illustrate in Table 12, the protocol was answered by the CEO or the marketing
manager of the company. They were requested to provide information to prove the BG
profile of the firm, to give their views on the effect of MO on performance, to evaluate
the usefulness of the traditional MO concept and the scales measuring the MO of a
company in foreign markets, and, based on their experience and if they considered it
necessary, to add another construct or constructs to the scale or to make any
modifications in the current constructs and items for evaluating MO in this type of firm.
Therefore, as a previous step and in order to investigate their international involvement,

61
it was necessary to obtain a characterization of the individual firms. We briefly describe
each company below.
Table 13 summarizes the main relevant characteristics of the firms analyzed in this
research. Next we present a brief description of the five companies.
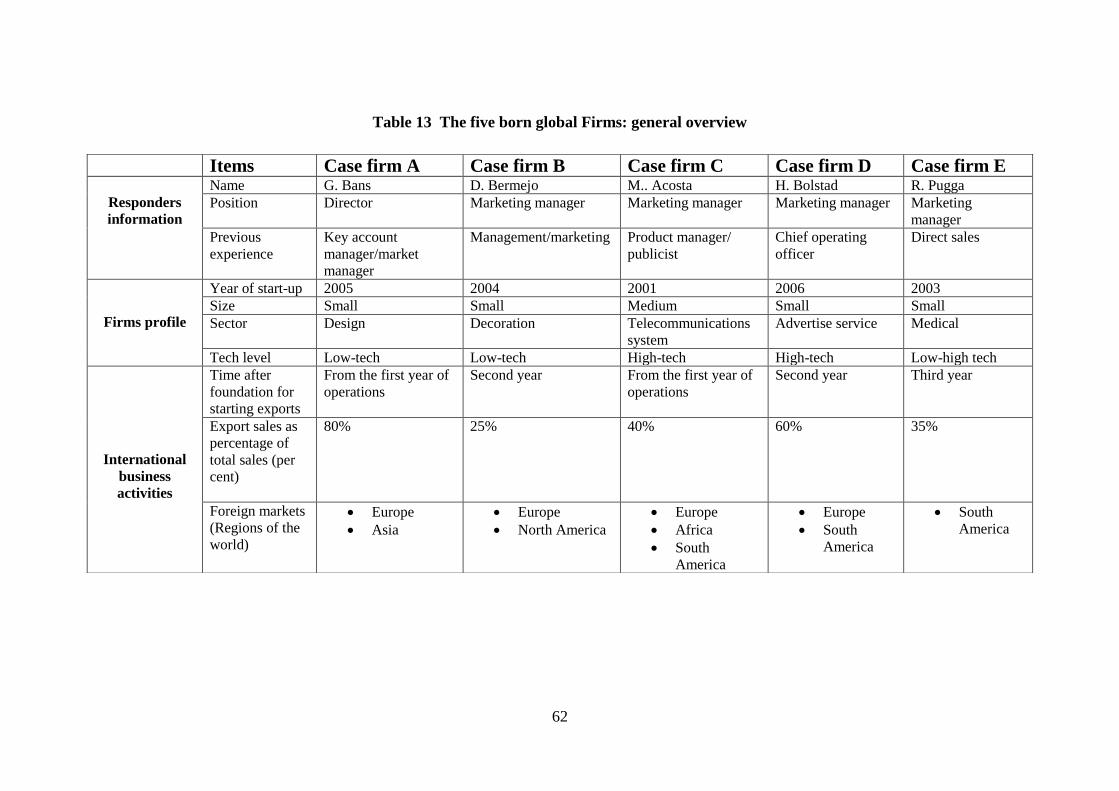
62
Table 13 The five born global Firms: general overview
Items Case firm A Case firm B Case firm C Case firm D Case firm E
Responders
information
Name G. Bans D. Bermejo M.. Acosta H. Bolstad R. Pugga
Position Director Marketing manager Marketing manager Marketing manager Marketing
manager
Previous
experience
Key account
manager/market
manager
Management/marketing Product manager/
publicist
Chief operating
officer
Direct sales
Firms profile
Year of start-up 2005 2004 2001 2006 2003
Size Small Small Medium Small Small
Sector Design Decoration Telecommunications
system
Advertise service Medical
Tech level Low-tech Low-tech High-tech High-tech Low-high tech
International
business
activities
Time after
foundation for
starting exports
From the first year of
operations
Second year From the first year of
operations
Second year Third year
Export sales as
percentage of
total sales (per
cent)
80% 25% 40% 60% 35%
Foreign markets
(Regions of the
world)
Europe
Asia
Europe
North America
Europe
Africa
South
America
Europe
South
America
South
America
63
2.5.1.1 Case summaries:
Case firm A
Established in 2005, the firm produces and exports fine earthenware, kitchen articles
and other pottery products. The firm exports 80% of its annual turnover of less than €.5
million per annum, and operates in a high-value niche market in the global design
industry. The manager of this firm is very proactive in searching for international
markets: for instance, the company works in Sweden, Germany, Portugal, Japan,
France, and the UK. The company‘s commitment to its customers is to make excellent
products, to be innovative and to ensure accessibility for the purchase of the products.
Case firm B
This firm was established in 2004 and specializes in creating and designing printed and
wallpaper and fabrics within the interior design framework. The company designs and
produces decorative concepts. It is always innovative. The firm has grown rapidly since
its inception in 2004, and annual turnover has grown to between €.5 million and under
€1 million (with an average growth of 10-15 percent per year). One quarter of the
production is exported to 36 markets. The company employs 30 workers, most of whom
are involved in the production of wallpaper.
Case firm C
Founded in 2001, this is a private Spanish aerospace company providing high-quality
engineering solutions as well as high-technology and added-value systems. The
Technology Transfer Division capitalizes on the knowledge acquired within the
aerospace field in other business sectors at the forefront of technology like
telecommunications, transport or industry, becoming a primary source of development
for the firm. The firm exports 40 percent of its annual turnover of more than €1.5
million per year. It is currently present in Europe, Africa and America (France,
Germany, England, Portugal, Angola, Algeria, Morocco, Ivory Coast, Iraq, Chile,
Bolivia, Brazil, and Venezuela).
With 230 employees, this firm is engaged in projects with the largest and most
important European space companies (EADS Astrium, Alcatel Alenia Space, etc.), and
has even succeeded in diversifying towards non-institutional customers (Eutelsat) and
other high-technology sectors, such as Civil Air Navigation (Eurocontrol).
64
Case firm D
Having begun its operations in 2006, this firm provides services to media groups, media
agencies, advertisers, brands and mobile operators. Its internationalization allows it to
have a presence in Europe, the United States, Latin America and the Middle East. Its
annual turnover has grown to between €.5 million and €1 million, and 20 percent is
exported. This business is conceived as a global, market-driven, technology-based and
dynamic company, with the capability of adapting advertising products and services to
the new and changing needs of the market. The firm employs 10 workers, and operates
in a high-value niche market in the global advertising industry.
Case firm E
This firm was created in 2003, and employs 13 people who combine the results of
knowledge and experience. This company started exporting in the third year after it was
founded, and the export rate is currently 35 percent; the company has a turnover in the
range of €.5 million to €1 million. This firm enables research and development to be
conducted specifically for projects oriented towards the medical/surgical market. This is
an innovative and technology-based company dedicated to the research and
development of surgical products through the creation, analysis, design, production, and
commercialization of innovative medical equipment. This company has a great deal of
prestige and is a certified producer of medical devices, implementing the complete ISO
9001-2000 and ISO 13485-2003/AC: 2007 quality systems. This firm researches,
develops, produces and commercializes medical devices that contribute to improving
the quality of life, thanks to advances in the medical techniques that facilitate surgery
and patient treatment.
2.5.2 Cross-case analysis
To analyze the data from the five case studies, we used cross-case analysis. This
technique treats each individual case as a separate study, and the analysis can reveal
similarities as well as differences between the firms (Yin, 2003). All the interviews
were transcribed and codified with ATLAS.ti 6.1 software. The codification permitted
us to identify a list of issues and links between them. From this analysis, figure 5 shows
the links between the five BG firms across the three key insights: (1) impact of market
orientation on performance in born global firms; (2) selection and evaluation of
measurement scales; and (3) proposed scale items for the extended concept of market
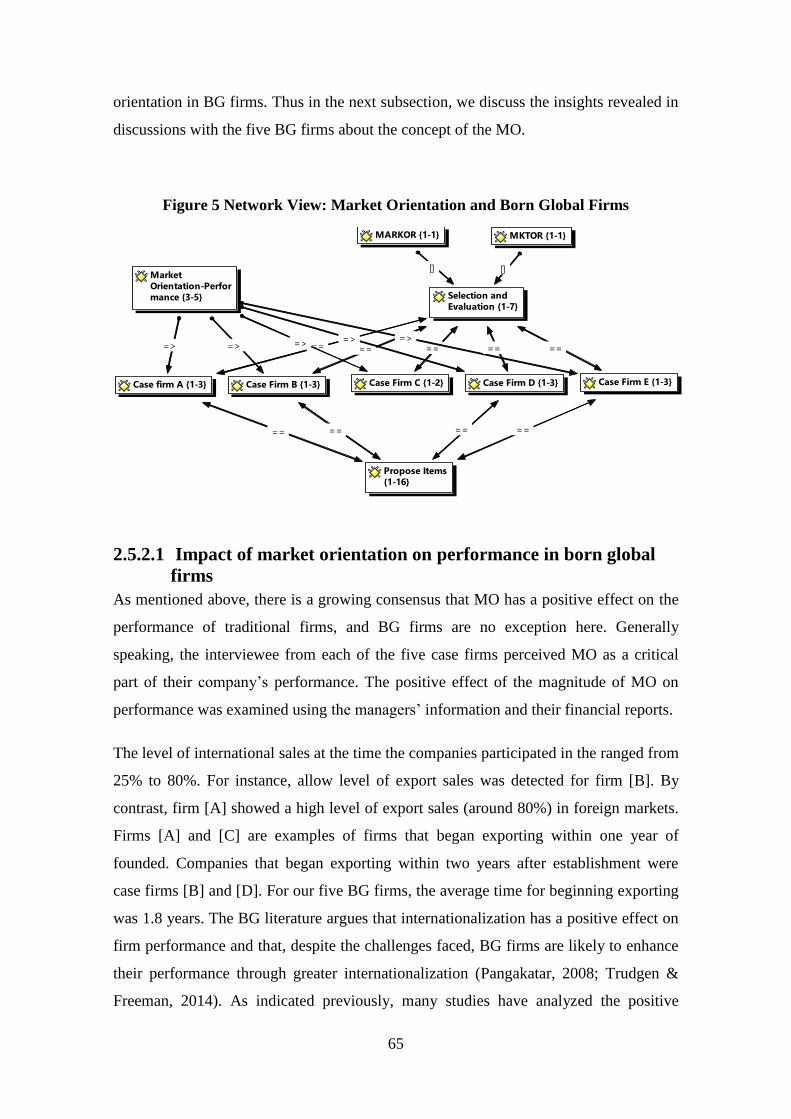
65
orientation in BG firms. Thus in the next subsection, we discuss the insights revealed in
discussions with the five BG firms about the concept of the MO.
Figure 5 Network View: Market Orientation and Born Global Firms
2.5.2.1 Impact of market orientation on performance in born global
firms
As mentioned above, there is a growing consensus that MO has a positive effect on the
performance of traditional firms, and BG firms are no exception here. Generally
speaking, the interviewee from each of the five case firms perceived MO as a critical
part of their company‘s performance. The positive effect of the magnitude of MO on
performance was examined using the managers‘ information and their financial reports.
The level of international sales at the time the companies participated in the ranged from
25% to 80%. For instance, allow level of export sales was detected for firm [B]. By
contrast, firm [A] showed a high level of export sales (around 80%) in foreign markets.
Firms [A] and [C] are examples of firms that began exporting within one year of
founded. Companies that began exporting within two years after establishment were
case firms [B] and [D]. For our five BG firms, the average time for beginning exporting
was 1.8 years. The BG literature argues that internationalization has a positive effect on
firm performance and that, despite the challenges faced, BG firms are likely to enhance
their performance through greater internationalization (Pangakatar, 2008; Trudgen &
Freeman, 2014). As indicated previously, many studies have analyzed the positive
====
===>
==
=>== ==
[]
=> ==
==
=>
[]
=>==
Selection and
Evaluation {1-7}
MKTOR {1-1}MARKOR {1-1}
Market
Orientation-Perfor
mance {3-5}
Propose Items
{1-16}
Case firm A {1-3} Case Firm B {1-3} Case Firm C {1-2} Case Firm D {1-3} Case Firm E {1-3}
66
relationship between MO and performance. Our five BG firms highlight similar results.
The measurement of performance varies across different empirical pieces of research.
Scholars have selected different concepts of financial performance, including sales
growth (e.g. Sin et al., 2005) and return on assets (e.g. Narver & Slater, 1990),
according to the objective of their empirical study.
In line with this reasoning, Ellis (2006) identified several studies that focused on the
relation between MO and performance and that relied on both financial measures (return
on assets and sales growth). We asked each responder to evaluate his or her company‘s
current business performance with respect to these two measures. The managers from
companies [B] and [E] reported only that there was a favorable situation for their
respective companies regarding the relation between MO and performance. The
interviewees from the rest of the companies gave more extensive opinions:
Under the perspective that our company operates in international
markets for indices of ROA, and growth in sales related to market
orientation, we reported a strong positive relationship, because from
the beginning our company has been profitable every year (Bans).
Yes, because the market orientations are necessary to achieve to
ensure optimum performance in this company. This is a young
Spanish aerospace company, born out the vision and enthusiasm of a
group of professionals in the space sector. Subsequently, we are
planning to continue with our positive profit (Acosta).
Talking about our performance, I would say we are dependent upon
new technologies within mobile phone-technologies and the fact that
the MO allows us to have a favorable profit in our sales levels on
domestic and international markets in addition we are small firm
playing on the global market with competitors and customers of all
sizes (Bolstad).
Regarding sales growth, we reviewed the financial reports of all the case companies,
which indicated the range of percentage sales growth among the companies was 17% to
46%. In summary, our study suggests that the general effect of MO on performance is

67
perceived to be positive for BG firms, in spite of the different levels of technology
development (Madsen & Servais, 1997). We show these relationships between MO and
performance in figure 6.
Figure 6 Market Orientation and Performance in Born Global Firms
2.5.2.2 Selection and evaluation of market orientation scales
As we mentioned earlier, there is wide consensus about the relevance of the MARKOR
and MKTOR scales for the measurement of MO for companies. Given that the aim of
this study is the exploration of the preference of BG managers for different scales of
MO, the data analysis reveals that for BG firms the MKTOR scale is preferred to the
MARKOR one. The greater importance given to customers could be related to the
selection of MKTOR, according to the responder from case firm [A]:
After that we examined the items list of the MO measures presented, in
our company we chose MKTOR because it’s more suitable because
the items in this scale allow us to identify who are potential
customers, supplier and distributors...in our company we operate
much within customers' needs. (Bans)
==
==
==
==
==
Market
Orientation-Perfor
mance {3-0}
Case firm A
Under the
perspective that
our company
operates in
international
markets for indices
of ROA, and
growth in sales
related to market
orientation, we
reported a strong
positive
relationship,
because from the
beginning our
company has been
profitable every year
Case firm B
We consider a
positive
relationship with
our
implementation of
market orientation
regarding our sales
growth (national
and international
markets) and the
return on assets
also is good.
Case firm C
Yes, because the
market orientation
are necessary to
achieve to ensure
optimum
performance in
this company. This
is a young Spanish
aerospace
company, born
out the vision and
enthusiasm of a
group of
professionals in
the space sector.
Subsequently, we
are planning to
continue with our
positive profit.
Case firm D
Talking about our
performance, I
would say we are
dependent upon
new technologies
within mobile
phone-technologie
s and that fact
that the MO allow
us have a favorable
profit in our sales
levels on domestic
and international
markets in addition
we are small firm
playing on the
global market with
competitors and
customers of all
sizes.
Case firm E
Well, our company
is successfull...our
financial results
are favorable, the
implementation of
market orientation
has been a major
factor of influence.
68
The MO literature has created a link between MKTOR and customer orientation.
Company [ A] has a well-established customer base in multiple sectors that is spread
around the world (e.g. Desigual, Panasonic, Hewlett-Packard, Seat, etc.). The
recognition by customers that products from this company are user-friendly is the result
of the high creativity level of this BG firm. According to Campo et al. (2014) and
Wrenn (1997), MKTOR tends to be considered as a measurement related to customer
orientation.
Company [B] has direct relationships with most of the end users of its products, and
provided empirical evidence that the items of MKTOR are well accepted and evaluated;
the company‘s marketing manager stated:
Decision to internationalize the firm’s, require country knowledge and
as result our customer orientation, is reflected by MKTOR constructs.
It was reinforced by the business that we started doing well right from
the start of our operation followed the MO. This company applied
every item of MKTOR but also we incorporate other issues as
internationalization factors (Bermejo).
All the sampled cases displayed a high degree of internationalization; from inception
they had products targeting international markets. MO enables BG firms to connect with
their potential customers and their customers‘ needs. For example, the marketing
manager of case firm [C], when selecting and evaluating the traditional measurements
of MO, took both.
Yes, because the two measures are necessary to achieve a market
orientation to ensure optimum performance of a company. One of the
measures analyzed the behavior of the environment that affects the
market (MKTOR) and the other measure (MARKOR) analyzes the
characteristics of the firms across the market. (Acosta)
Company [C] is present in foreign markets, and its interaction with foreign customers is
absolutely necessary. It started with customers from different sectors such as space (e.g.
the European Space Agency, Thales Alenia Space), and currently its key customers are
growing in other industries: telecommunications (e.g. Orange, Telefónica, Nokia, and
69
Ericsson), transportation (e.g. ADIF, FGC, and RENFE Cercanias), public
administration (the European Union), and others.
The other hi-tech company (firm [D]) is similar to company C in that it has also
increased its presence in foreign markets during its continuing internationalization.
Company [D] expanded its customer base between 2006 and 2008 so that it has a
commercial presence in Mexico, Colombia, Bolivia, Ecuador, Honduras, Portugal,
France, Germany, Sweden, Finland, the UK, South Africa, Russia, Italy, and Austria.
Company reported a preference for the MKTOR scale:
The items referred are working in the evaluation of the MO, in our
opinion the three constructs of the MKTOR are perfect... and all are
necessary for evaluation of the MO (Bolstad).
The MKTOR scale selected by company [D]responds to its wide spread connections, its
global presence with highly specialized knowledge, and its clients. Currently this firm
works with various companies, operators, advertisers, and publishers (e.g. Adidas,
Toyota, Nokia, Red Bull, and Carrefour).
Finally, when the responder for case firm [E] considered the selection and evaluation of
the measuring scales for the MO concept, he reported favorably on the general
usefulness of MKTOR scale:
We are depending upon new technologies within medical technologies
and in our case we select the MKTOR because we need to work very
closely with our customer to create a product. We work for them…The
fourteen items presented by MKTOR are really fundamental in our
business (Pugga).
The research results from the exploratory study provide evidence of the preference of
BG firms for the MKTOR scale over the MARKOR scale (see Table 14). According to
O‘Sullivan and Butler (2009), for instance, the MKTOR instrument is more
comprehensive as it includes a range of control and moderator variables. Many recent
studies have based their study on the selection of MKTOR for exploring the association
of MO and business performance; the influence of alternative orientations has been
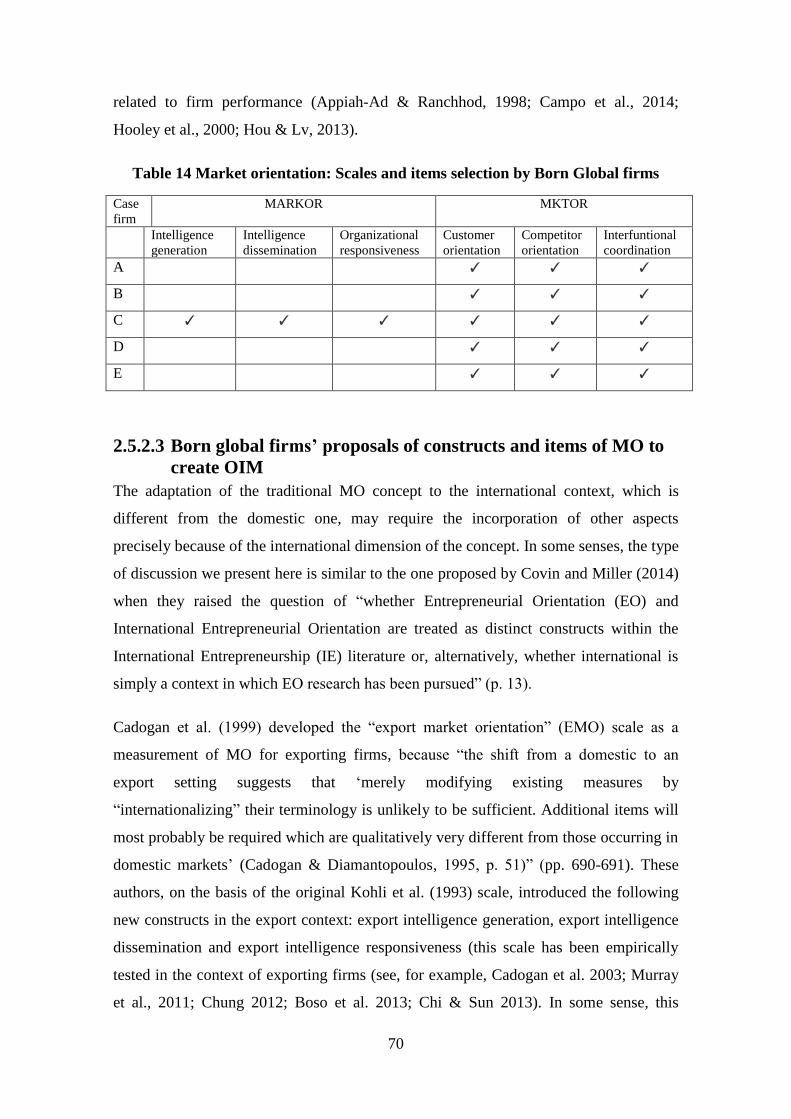
70
related to firm performance (Appiah-Ad & Ranchhod, 1998; Campo et al., 2014;
Hooley et al., 2000; Hou & Lv, 2013).
Table 14 Market orientation: Scales and items selection by Born Global firms
Case
firm
MARKOR MKTOR
Intelligence
generation
Intelligence
dissemination
Organizational
responsiveness
Customer
orientation
Competitor
orientation
Interfuntional
coordination
A ✓ ✓ ✓
B ✓ ✓ ✓
C ✓ ✓ ✓ ✓ ✓ ✓
D ✓ ✓ ✓
E ✓ ✓ ✓
2.5.2.3 Born global firms’ proposals of constructs and items of MO to
create OIM
The adaptation of the traditional MO concept to the international context, which is
different from the domestic one, may require the incorporation of other aspects
precisely because of the international dimension of the concept. In some senses, the type
of discussion we present here is similar to the one proposed by Covin and Miller (2014)
when they raised the question of ―whether Entrepreneurial Orientation (EO) and
International Entrepreneurial Orientation are treated as distinct constructs within the
International Entrepreneurship (IE) literature or, alternatively, whether international is
simply a context in which EO research has been pursued‖ (p. 13).
Cadogan et al. (1999) developed the ―export market orientation‖ (EMO) scale as a
measurement of MO for exporting firms, because ―the shift from a domestic to an
export setting suggests that ‗merely modifying existing measures by
―internationalizing‖ their terminology is unlikely to be sufficient. Additional items will
most probably be required which are qualitatively very different from those occurring in
domestic markets‘ (Cadogan & Diamantopoulos, 1995, p. 51)‖ (pp. 690-691). These
authors, on the basis of the original Kohli et al. (1993) scale, introduced the following
new constructs in the export context: export intelligence generation, export intelligence
dissemination and export intelligence responsiveness (this scale has been empirically
tested in the context of exporting firms (see, for example, Cadogan et al. 2003; Murray
et al., 2011; Chung 2012; Boso et al. 2013; Chi & Sun 2013). In some sense, this
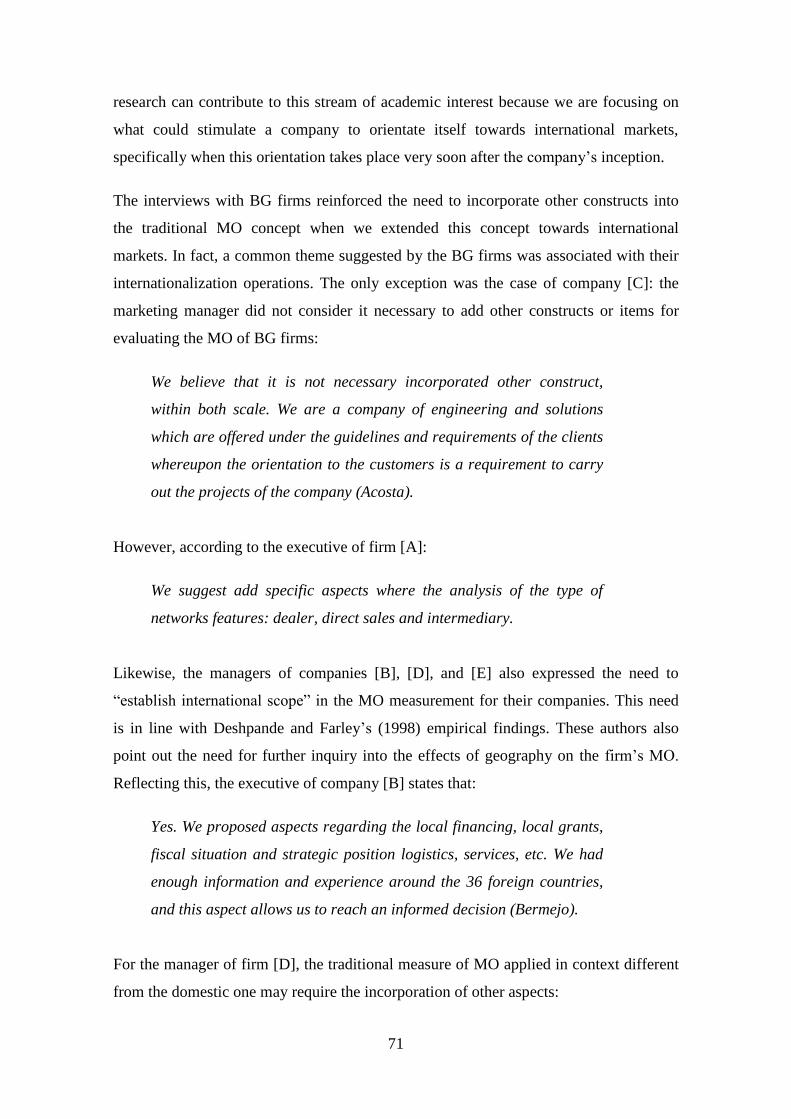
71
research can contribute to this stream of academic interest because we are focusing on
what could stimulate a company to orientate itself towards international markets,
specifically when this orientation takes place very soon after the company‘s inception.
The interviews with BG firms reinforced the need to incorporate other constructs into
the traditional MO concept when we extended this concept towards international
markets. In fact, a common theme suggested by the BG firms was associated with their
internationalization operations. The only exception was the case of company [C]: the
marketing manager did not consider it necessary to add other constructs or items for
evaluating the MO of BG firms:
We believe that it is not necessary incorporated other construct,
within both scale. We are a company of engineering and solutions
which are offered under the guidelines and requirements of the clients
whereupon the orientation to the customers is a requirement to carry
out the projects of the company (Acosta).
However, according to the executive of firm [A]:
We suggest add specific aspects where the analysis of the type of
networks features: dealer, direct sales and intermediary.
Likewise, the managers of companies [B], [D], and [E] also expressed the need to
―establish international scope‖ in the MO measurement for their companies. This need
is in line with Deshpande and Farley‘s (1998) empirical findings. These authors also
point out the need for further inquiry into the effects of geography on the firm‘s MO.
Reflecting this, the executive of company [B] states that:
Yes. We proposed aspects regarding the local financing, local grants,
fiscal situation and strategic position logistics, services, etc. We had
enough information and experience around the 36 foreign countries,
and this aspect allows us to reach an informed decision (Bermejo).
For the manager of firm [D], the traditional measure of MO applied in context different
from the domestic one may require the incorporation of other aspects:
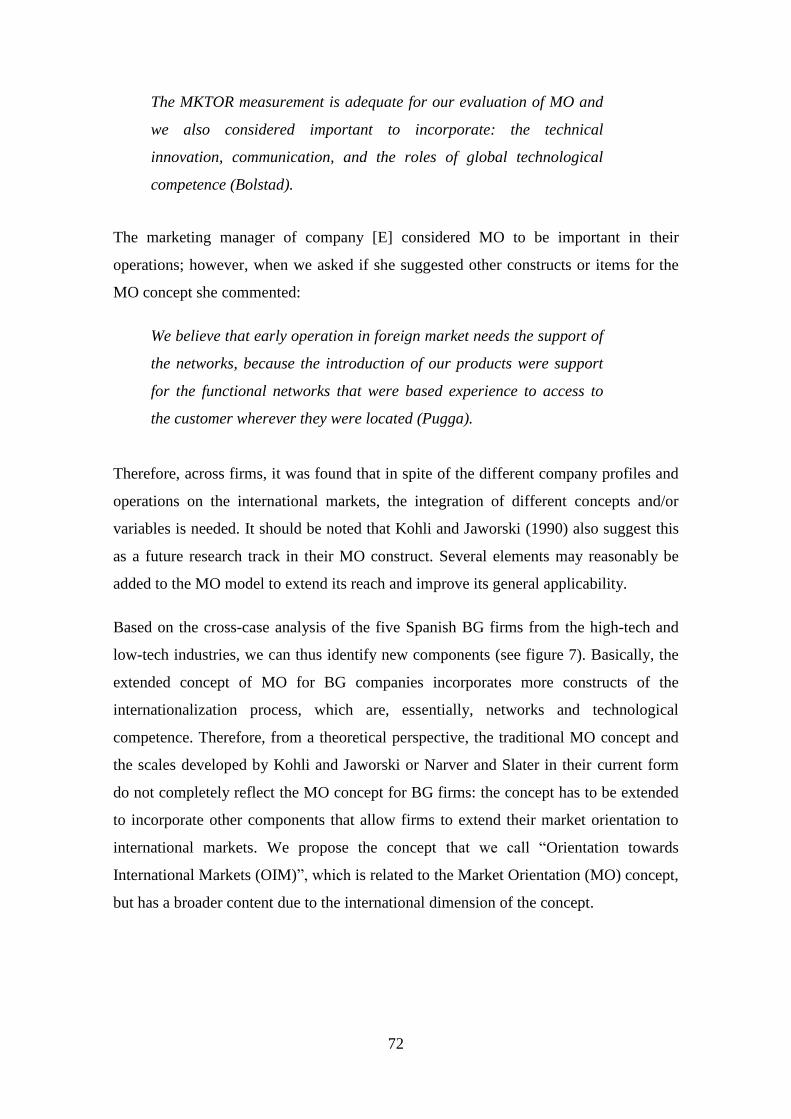
72
The MKTOR measurement is adequate for our evaluation of MO and
we also considered important to incorporate: the technical
innovation, communication, and the roles of global technological
competence (Bolstad).
The marketing manager of company [E] considered MO to be important in their
operations; however, when we asked if she suggested other constructs or items for the
MO concept she commented:
We believe that early operation in foreign market needs the support of
the networks, because the introduction of our products were support
for the functional networks that were based experience to access to
the customer wherever they were located (Pugga).
Therefore, across firms, it was found that in spite of the different company profiles and
operations on the international markets, the integration of different concepts and/or
variables is needed. It should be noted that Kohli and Jaworski (1990) also suggest this
as a future research track in their MO construct. Several elements may reasonably be
added to the MO model to extend its reach and improve its general applicability.
Based on the cross-case analysis of the five Spanish BG firms from the high-tech and
low-tech industries, we can thus identify new components (see figure 7). Basically, the
extended concept of MO for BG companies incorporates more constructs of the
internationalization process, which are, essentially, networks and technological
competence. Therefore, from a theoretical perspective, the traditional MO concept and
the scales developed by Kohli and Jaworski or Narver and Slater in their current form
do not completely reflect the MO concept for BG firms: the concept has to be extended
to incorporate other components that allow firms to extend their market orientation to
international markets. We propose the concept that we call ―Orientation towards
International Markets (OIM)‖, which is related to the Market Orientation (MO) concept,
but has a broader content due to the international dimension of the concept.
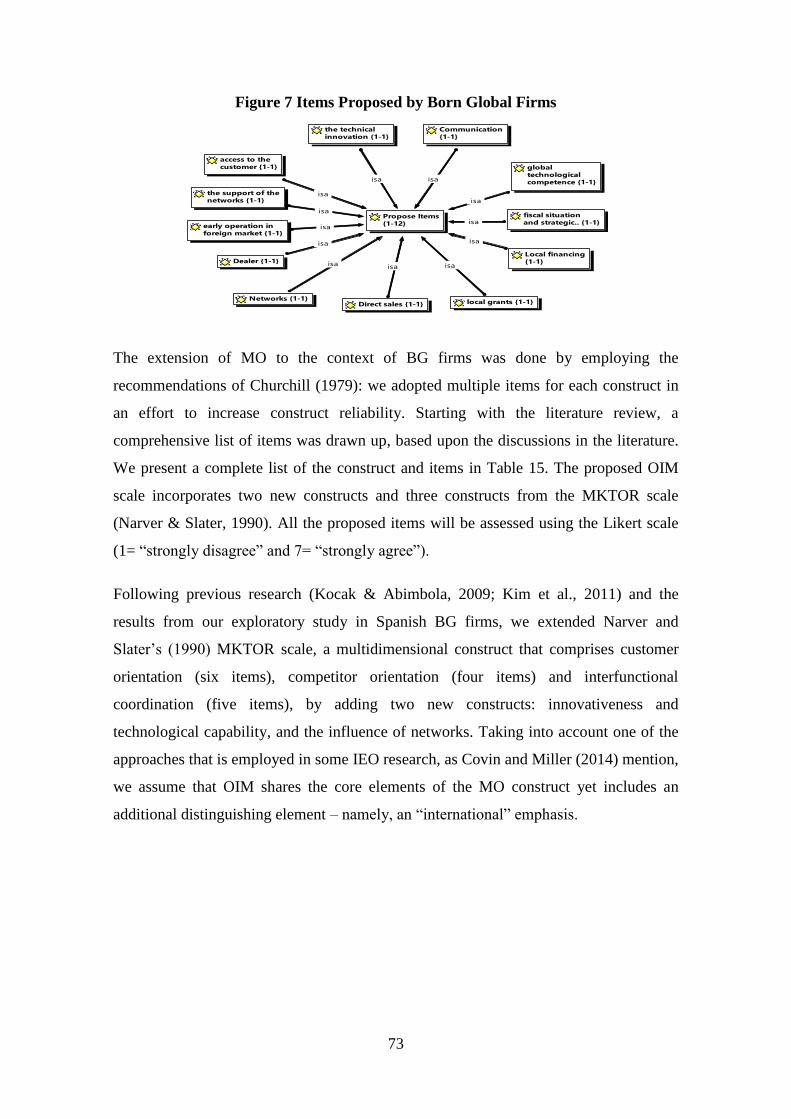
73
Figure 7 Items Proposed by Born Global Firms
The extension of MO to the context of BG firms was done by employing the
recommendations of Churchill (1979): we adopted multiple items for each construct in
an effort to increase construct reliability. Starting with the literature review, a
comprehensive list of items was drawn up, based upon the discussions in the literature.
We present a complete list of the construct and items in Table 15. The proposed OIM
scale incorporates two new constructs and three constructs from the MKTOR scale
(Narver & Slater, 1990). All the proposed items will be assessed using the Likert scale
(1= ―strongly disagree‖ and 7= ―strongly agree‖).
Following previous research (Kocak & Abimbola, 2009; Kim et al., 2011) and the
results from our exploratory study in Spanish BG firms, we extended Narver and
Slater‘s (1990) MKTOR scale, a multidimensional construct that comprises customer
orientation (six items), competitor orientation (four items) and interfunctional
coordination (five items), by adding two new constructs: innovativeness and
technological capability, and the influence of networks. Taking into account one of the
approaches that is employed in some IEO research, as Covin and Miller (2014) mention,
we assume that OIM shares the core elements of the MO construct yet includes an
additional distinguishing element – namely, an ―international‖ emphasis.
isa
isa
isa
isa
isa
isa
isa
isa
isa
isa
isa
isa
Propose Items
{1-12}
Dealer {1-1}
Networks {1-1}Direct sales {1-1}
fiscal situation
and strategic.. {1-1}
Local financing
{1-1}
local grants {1-1}
global
technological
competence {1-1}
Communication
{1-1}
the technical
innovation {1-1}
access to the
customer {1-1}
the support of the
networks {1-1}
early operation in
foreign market {1-1}
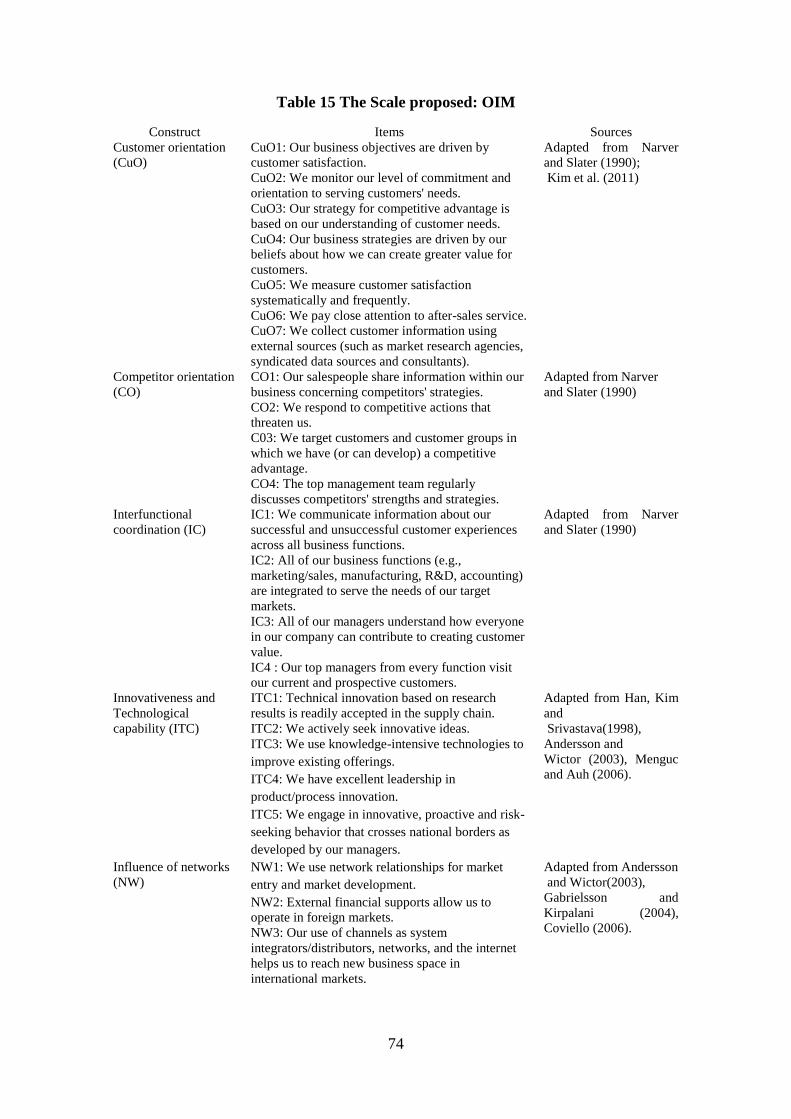
74
Table 15 The Scale proposed: OIM
Construct Items Sources
Customer orientation
(CuO)
CuO1: Our business objectives are driven by
customer satisfaction.
CuO2: We monitor our level of commitment and
orientation to serving customers' needs.
CuO3: Our strategy for competitive advantage is
based on our understanding of customer needs.
CuO4: Our business strategies are driven by our
beliefs about how we can create greater value for
customers.
CuO5: We measure customer satisfaction
systematically and frequently.
CuO6: We pay close attention to after-sales service.
CuO7: We collect customer information using
external sources (such as market research agencies,
syndicated data sources and consultants).
Adapted from Narver
and Slater (1990);
Kim et al. (2011)
Competitor orientation
(CO)
CO1: Our salespeople share information within our
business concerning competitors' strategies.
CO2: We respond to competitive actions that
threaten us.
C03: We target customers and customer groups in
which we have (or can develop) a competitive
advantage.
CO4: The top management team regularly
discusses competitors' strengths and strategies.
Adapted from Narver
and Slater (1990)
Interfunctional
coordination (IC)
IC1: We communicate information about our
successful and unsuccessful customer experiences
across all business functions.
IC2: All of our business functions (e.g.,
marketing/sales, manufacturing, R&D, accounting)
are integrated to serve the needs of our target
markets.
IC3: All of our managers understand how everyone
in our company can contribute to creating customer
value.
IC4 : Our top managers from every function visit
our current and prospective customers.
Adapted from Narver
and Slater (1990)
Innovativeness and
Technological
capability (ITC)
ITC1: Technical innovation based on research
results is readily accepted in the supply chain.
ITC2: We actively seek innovative ideas.
ITC3: We use knowledge-intensive technologies to
improve existing offerings.
ITC4: We have excellent leadership in
product/process innovation.
ITC5: We engage in innovative, proactive and risk-
seeking behavior that crosses national borders as
developed by our managers.
Adapted from Han, Kim
and
Srivastava(1998),
Andersson and
Wictor (2003), Menguc
and Auh (2006).
Influence of networks
(NW)
NW1: We use network relationships for market
entry and market development.
NW2: External financial supports allow us to
operate in foreign markets.
NW3: Our use of channels as system
integrators/distributors, networks, and the internet
helps us to reach new business space in
international markets.
Adapted from Andersson
and Wictor(2003),
Gabrielsson and
Kirpalani (2004),
Coviello (2006).
75
nnovativeness and technological capability has previously been identified in the BG
literature as one of the factors that has a strong influence on the BG internationalization
process (Zahra et al., 2000; Freeman et al., 2006; Zhang & Dodgson 2007).
Furthermore, Kim et al. (2011) analyze the relationship for BG firms between customer
orientation, which is one of the traditional components of the MO scale, and
innovativeness and technological capability for customer relationship management
(CRM) and external customer information management. The innovativeness measure
was proposed in accordance with Menguc and Auh‘s (2006) construct. This construct
included the elements of technical innovation, searching for innovative ideas and the
acceptance of innovation. According to Knight and Cavusgil (2004), ―The literature
specifies numerous approaches for achieving international business success, but
innovative processes that drive the development of superior, unique products appear
particularly important to born-global success‖ (p.137). We based our technological
capability measure on Han et al. (1998) proposal. This construct captures two items
related to the use and importance of technology. Several studies have described the
importance of the role of technological capability in BG firms (for example,
technological knowledge may be used to sell the firm‘s products in the international
markets; there may be a high impact of changes in technology on the firm‘s processes
and operations; or success in introducing a product rapidly into the market may depend
upon technological knowledge) (Almor et al., 2014; Blomqvist et al., 2008; Madsen &
Servais, 1997; Moen & Servais, 2002; Nordman & Melén, 2008).
On the other hand, the previous literature has also identified financial conditions and the
networks in which companies operate as factors that heavily influence the
internationalization process of BG firms (Sharma & Blomstermo 2003; Gabrielsson et
al., 2004; Kocak & Abimbola 2009). In this regard, some authors, such as, for example,
Cadogan et al. (2003) or Ellis (2010), also relate MO and networks. Cadogan et al.
(2003) included network capabilities in the scale they developed to measure a firm‘s
marketing capabilities. We included the influence of networks by a multi-item scale.
The construct was adapted from Kim et al. (2011) and Coviello (2006). We proposed
asking managers for their perception of the impact of networks on each indicator
(customer information using external source; and the relationship between networks and
market entry and market development). These proposed network items are similar to
76
those found in previous studies (e.g. Camuffo et al., 2006; Mort & Weerawardena,
2006; Sharma & Blomstermo, 2003), and highlight the role of networking in the
internationalization process for BG firms. We believe the addition of these new
components allows us to pass from the general market orientation concept to the
orientation towards international markets concept. Therefore, based on the literature
review and the qualitative study, we proposed 23 items to measure the five components
of the proposed scale for assessing OIM.
It is precisely the fact of being focused on this type of company that justifies our
decision not to adopt EMO directly. First of all, BG firms may simultaneously use many
internationalization modes, and not just exports. Besides, these firms are small and
entrepreneurial in terms of ownership and organization (Almor & Hashai 2004; Melén
& Nordman 2009), which renders their mode of functioning essentially different from
that of traditional gradual exporters. Moreover, EMO was developed on the basis of the
MARKOR scale, which did not measure the construct of customer orientation, and this
construct is considered a key factor for BG firms (Aspelund & Moen 2001; Kim et al.,
2011). These are the reasons why we do not propose to use EMO for measuring OIM
for BG firms, and why we have worked on a new scale for OIM based on the
conceptualization of MO.
2.6 CONCLUSIONS, LIMITATIONS AND FUTURE RESEARCH
This study contributes to the MO literature by extending this concept into the context of
BG firms. We have explored whether the traditional MO concept and scales (MARKOR
and/or MKTOR) are adequate for applying the MO construct in the context of BG
firms, or whether they require modifying before they can be applied to these firms.
The results of the study indicate that when we think about BG firms we should refer to
OIM instead of to MO; OIM shares the core elements of the MO construct yet includes
an additional distinguishing element – namely, an ―international‖ emphasis. That is the
reason why the components of the MKTOR scale can be used (the utility of the
components of the MKTOR scale for BG firms in the past may have been due to the
fact that all of the BG firms had a very high level of customer orientation (Kim et., al
2011; Knight et al., 2004; Wong & Merrilees, 2012)). In fact, the Narver and Slater
(1990) scale has been considered to be more accurate because it explicitly encapsulates
77
concern with both customers and competitors (Wrenn, 1997), but these components
have to be completed with two new constructs: (1) innovativeness and technological
capability, which have previously been identified in the BG literature as factors with a
strong influence on the BG internationalization process; and (2) financial conditions and
the networks in which companies operate, which have similarly been recognized as
factors with a large influence.
Our empirical results also indicated that it might be useful to incorporate or modify
items in the constructs of the traditional MKTOR scale when we are focusing on BG
firms. For instance, we modified the construct of customer orientation by adding the
item CuO7: ―We collect customer information using external sources (such as market
research agencies, syndicated data sources and consultants)‖ and we incorporated two
constructs: (1) innovativeness and technological capability and (2) networks. This
enabled us to consider the factors that facilitate the internationalization process of BG
firms and that have been considered by scholars to be sources of positive performance
for BG firms (Kocak & Abimbola, 2009; McDougall & Oviatt, 1996; Nordman &
Melén, 2008; Sharma & Blomstermo, 2003). This finding is in line with the results of
Kirca et al., (2005), who showed that market orientation is still an area in need of
further investigation, especially in international contexts.
On the other hand, the well-researched connection between market orientation and
performance allowed us to explore this relationship in the specific field of BG firms.
Even though the five BG firms analyzed were not from the same industry, all of them
confirmed the relationship between OIM and performance. Similar findings were
reported by Verbees and Meulenberg (2004), who confirmed that the relationship holds
for small firms ―in line with the growing amount of evidence about the positive impact
of the MO on company performance‖ (p.147).
Keeping in mind the fact that this study focuses on BG firms from a specific context,
more empirical work is needed before the relation between the extended concept of
OIM and performance can be generalized. Further studies should be made to investigate
a larger sample of those firms that have undergone early internationalization, but it must
be noted that the aim of the research was not to obtain general results but to explain the
evaluation of the MO concept and its measures in the context of BG firms, with the
78
purpose of building the theory. Addressing these limitations should lead to fruitful
avenues for future research.
From our perspective, further empirical research is needed to test our proposed scale for
measuring OIM. Constructs validity and reliability must be assessed using
psychometrical procedures in line with the recommendations of Nunnally (1978) and
Churchill (1979). Secondly, further empirical research should be focused on testing the
following hypothesis:
The higher the orientation towards international markets of a born global firm, the
higher the performance of this company.
79
2.7 REFERENCES
Almor, T., & Hashai, N. (2004). The competitive advantage and strategic
configuration of knowledge-intensive, small-and medium-sized multinationals: a
modified resource-based view. Journal of International Management, 10 (4), 479-500.
Almor, T., Tarba, S. Y., & Margalit, A. (2014). Maturing, Technology-Based,
Born-Global Companies: Surviving Through Mergers and Acquisitions. Management
International Review, 54 (4), 421-444.
Alonso, J., & Donoso, V. (2000). Modernización del comportamiento de la
empresa exportadora española. Información Comercial Española, 788, 35-58.
Andersson, S., & Evangelista, F. (2006). The entrepreneur in the Born Global
firm in Australia and Sweden. Journal of Small Business and Enterprise Development,
13 (4), 642- 659.
Andriopoulos, C., & Slater, S. (2013). Exploring the landscape of qualitative
research in international marketing: Two decades of IMR. International Marketing
Review, 30 (4), 384-412.
Appiah-Adu K., & Ranchhod A. (1998). Market orientation and performance in
the biotechnology industry: an exploratory empirical analysis. Technology Analysis an
Strategic Management, 10 (2), 197-210.
Arpa, C., Tiernan, S., & O‘Dwyer, M. (2012). Entrepreneurial orientation,
market orientation and internationalisation in born global small and micro-businesses.
International Journal of Entrepreneurship and Small Business, 16 (4), 455-470.
Aspelund, A., & Moen, Ø. (2001). A generation perspective on small firm
internationalization: From traditional exporters and flexible specialists to born globals.
In C. N. Axinn, & P. Matthyssens (Eds.), Reassesing the Internationalization of the
Firm (pp. 197-225). Emerald Group Publishing Limited.
Autio, E., Sapienza, H.J., & Almeida J.G. (2000). Effects of age at entry,
knowledge intensity and imitability on international growth. Academic Management
Journal, 43 (5), 909-92.
Avlonitis, G. J., & Gounaris, S. P. (1997). Marketing orientation and its
determinants: an empirical analysis. European Journal of Marketing, 33 (11-12), 1003-
1037.
Balas, A. N., Colakoglu, S. N., & Gokus, O. (2012). Examining the relationship
between the three components of market orientation and innovativeness in export
ventures. International Journal of Entrepreneurship, 16, 1-17.
Becker, J., & Homburg, C. (1999). Market-oriented management: a system-
based perspective. Journal of Market-Focused Management, 4, 17-41.
Blesa, A., Monferrer, D., Nauwelaerts, Y., & Ripollés, M. (2008). The effect of
early international commitment on international positional advantages in Spanish and
Belgian international new ventures. Journal of International Entrepreneurship, 6 (4),
168-187.
Blomqvist, K., Hurmelinna, P., Nummela, N., & Saarenketo, S. (2008). The role
of trust and contracts in the internationalization of born globals. Journal of Engineering
and Technology Management, 25 (1-2), 123-135.
Boso, N., Story, V. M., & Cadogan, J. W. (2013). Entrepreneurial orientation,
market orientation, network ties, and performance: Study of entrepreneurial firms in a
developing economy. Journal of Business Venturing, 28 (6), 708-727.
Brännback M., Carsrud A., & Renko M. (2007). Exploring the born global
concept in the biotechnology context. Journal of Enterprising Culture, 15 (1), 79-100.
80
Brettel, M., Engelen, A., & Heinemann, F. (2009). New entrepreneurial ventures
in a globalized world: The role of market orientation. Journal of International
Entrepreneurship, 7 (2), 88-110.
Cadogan, J. W. (2012). International marketing, strategic orientations and
business success: reflections on the path ahead. International Marketing Review, 29 (4),
340-348.
Cadogan, J. W., & Diamantopoulos, A. (1995). Narver and Slater, Kohli and
Jaworski and the market orientation construct: integration and internationalization.
Journal of Strategic Marketing, 3 (1), 41-60.
Cadogan, J. W., Cui, C. C., & Kwok Yeung Li, E. (2003). Export market-
oriented behavior and export performance: The moderating roles of competitive
intensity and technological turbulence. International marketing review, 20 (5), 493-513.
Cadogan, J. W., Diamantopoulos, A., & De Mortanges, C. P. (1999). A measure
of export market orientation: scale development and cross-cultural validation. Journal
of International Business Studies, 30 (4), 689-707.
Cadogan, J. W., Diamantopoulos, A., & Siguaw, J. A. (2002). Export market-
oriented activities: their antecedents and performance consequences. Journal of
International Business Studies, 33 (3), 615-626.
Campo, S., Díaz, A. M., & Yagüe, M. J. (2014). Market orientation in mid-range
service, urban hotels: How to apply the MKTOR instrument. International Journal of
Hospitality Management, 43, 76-86
Camuffo, A., Furlan, A., Romano, P., & Vinelli A. (2006). The process of
supply network internationalization. Journal of Purchasing & Supply Management, 12,
135-147.
Carr, J.T., & López T.B. (2007). Examining market orientation as both culture
and conduct: modeling the relationships between market orientation and employee
responses. Journal of Marketing Theory and Practice, 15, 113-126.
Casillas, J. C., Acedo, F. J., & Barbero, J. L. (2010). Learning, unlearning and
internationalisation: Evidence from the pre-export phase. International Journal of
Information Management, 30, 162-173.
Cavusgil, S. T., & Knight, G. (2015). The born global firm: An entrepreneurial
and capabilities perspective on early and rapid internationalization. Journal of
International Business Studies, 46 (1), 3-16.
Chan, H.N., & Ellis, P. (1998). Market orientation and business performance:
some evidence from Hong Kong. International Marketing Review, 15 (2), 119-139.
Chang, T., & Chen, S.(1998). Market orientation, service quality and business
profitability: a conceptual model and empirical evidence. Journal of Services
Marketing, 12 (4), 246-264.
Chetty S., & Campell-Hunt, C. (2004). A strategic approach to
internationalization: a traditional versus a born global approach. Journal of
International Marketing, 12 (1), 57-81.
Chi, T., & Sun, Y. (2013). Development of firm export market oriented
behavior: Evidence from an emerging economy. International Business Review, 22 (1),
339-350.
Chung, H. F. (2012). Export market orientation, managerial ties, and
performance. International Marketing Review, 29 (4), 403-423.
Churchill, G. A., Jr. (1979). A Paradigm for developing better measures of
marketing constructs. Journal of Marketing Research, 16, 64-73.
Coviello N.E. (2006). The network dynamics of international new ventures.
Journal of International Business Studies, 37 (5), 713-731.
81
Covin, J. G., & Miller, D. (2014). International entrepreneurial orientation:
Conceptual considerations, research themes, measurement issues, and future research
directions. Entrepreneurship Theory and Practice, 38 (1), 11-44.
Day, G. S. (1994). The capabilities of market-driven organizations. Journal of
Marketing, 58, 37-52.
Deshpande R., & Farley J.U. (1998). Measuring market orientation:
generalization and synthesis. Journal of Market-Focused Management, 2 (3), 213-232.
Deshpande, R., Farley, J.U., & Webster, F.E. (1993). Corporate culture,
customer orientation, and innovativeness in Japanese firms: a quadrad analysis. Journal
of Marketing, 57, 23-27.
Dimitratos, P., Voudouris, I., Plakoyiannaki, E., & Nakos, G. (2012).
International entrepreneurial culture—Toward a comprehensive opportunity-based
operationalization of international entrepreneurship. International Business Review, 21
(4), 708-721.
Dong, X., Andrew Hinsch, C., Zou, S., & Fu, H. (2013). The effect of market
orientation dimensions on multinational SBU's strategic performance: An empirical
study. International Marketing Review, 30 (6), 591-616.
Efrat, K., & Shoham, A. (2013). The interaction between environment and
strategic orientation in born globals‘ choice of entry mode. International Marketing
Review, 30 (6), 536-558.
Eisenhardt, K. (1989). Building theories from case study research. Academy of
Management Review, 14 (4), 532-550.
Elg, U. (2003). Retail market orientation: a preliminary framework.
International Journal of Retail & Distribution Management, 31 (2), 107-117.
Ellis, P. D. (2010). International trade intermediaries and the transfer of
marketing knowledge in transition economies. International Business Review, 19 (1),
16-33.
Ellis, P.D. (2006). Market orientation and performance: a meta-analysis and
cross-national comparisons. Journal of Management Studies, 43 (5), 1089-1107.
Evers, N. (2011). International new ventures in ―low tech‖ sectors: a dynamic
capabilities perspective. Journal of Small Business and Enterprise Development, 18 (3),
502-528.
Evers, N., & Knight, J. (2008). Trade shows and small firm internationalization:
a network perspective. International Marketing Review, 25 (5), 544-562.
Farrell M., &Oczkowski E. (1997). An analysis of the MKTOR and MARKOR
measures of market orientation: and Australian perspective. Marketing Bulleting, 8, 30-
40.
Farrell, M.A. (2000). Developing a market-oriented learning organization.
Australian Journal of Management, 25 (2), 201-23.
Farrell, M.A., & Oczkowski, E. (2002). Are market orientation and learning
orientation necessary for superior organizational performance?. Journal of Market-
Focused Management, 5, 197-217.
Fletcher, D. (2004). International entrepreneurship and the small business.
Entrepreneurship and Regional Development, 16 (4), 289-305.
Freeman, S., & Cavusgil, S.T. (2007). Toward a typology of commitment states
among managers of born-global firms: A study of accelerated internationalization.
Journal of International Marketing, 15 (4), 1-40.
Freeman, S., Edwards, R., &Schroder, B. (2006). How smaller born-global firms
use networks and alliances to overcome constraints to rapid internationalization.
Journal of International Marketing, 14 (3), 33-63.
82
Freeman, S., Hutchings, K., Lazaris, M.,& Zyngier, S (2010). A model of rapid
knowledge development: The smaller born-global firm. International Business Review,
19 (1), 70-84.
Frishammar, J., & Andersson, S. (2009). The overestimated role of strategic
orientations for international performance in smaller firms. Journal of International
Entrepreneurship, 7 (1), 57-77.
Gabrielsson M.,& Pelkonen T. (2008). Born internationals: market expansion
and business operation mode strategies in the digital media field. Journal of
International Entrepreneurship, 6 (2), 49-71.
Gabrielsson, M. (2005). Branding Strategies of Born Globals. Journal of
International Entrepreneurship, 3 (3), 199-222.
Gabrielsson, M., & Gabrielsson, P. (2011). Internet-based sales channel
strategies of born global firms. International Business Review, 20 (1), 88-99.
Gabrielsson, M., & Kirpalani, M. (2004). Born globals: how to reach new
business space rapidly. International Business Review, 13 (5), 555-571.
Gabrielsson, M., Gabrielsson, P., & Dimitratos, P. (2014). International
entrepreneurial culture and growth of international new ventures. Management
International Review, 54. (4), 445-471.
Gabrielsson, M., Kirpalani, V. H. M., Dimitratos, P., Solberg, C.A., &
Zucchella, A. (2008). Born globals: Propositions to help advance the theory.
International Business Review, 17 (4), 385-401.
Gabrielsson, M., Sasi, V., & Darling, J. (2004). Finance strategies of rapidly-
growing Finnish SMEs: Born Internationals and Born Globals. European Business
Review, 16 (6), 590-604.
Gassmann, O., & Keupp, M.M. (2007). The competitive advantage of early and
rapidly internationalising SMEs in the biotechnology industry: A knowledge-based
view. Journal of World Business, 42 (3), 350-366.
Gauzente C. (1999). Comparing Market Orientation Scales: A Content Analysis.
The Marketing Bulletin, 10, 76-82 [online: http://marketing-bulletin.massey.ac.nz]
Ghauri, P. N., Designing and Conducting Case Studies in International Business
Research, in Marschan-Piekkari, R./Welch, C. (eds.), Handbook of Qualitative Research
Methods for International Business, Cheltenham: Edward Elgar 2004, 109-124
Gleason K., & Wiggenhom J. (2007). Born globals, the choice of globalization
strategy, and the market's perception of performance. Journal of World Business, 42 (3),
322-335.
Gleason K., Madura J., & Wiggenhorn J. (2006). Operating characteristics, risk,
and performance of born-global firms. International Journal of Managerial Finance, 2
(2), 96-120.
González B. O., & González B. J. (2005). Cultural vs. Operational Market
Orientation and Objective vs. Subjective Performance: Perspective of Production and
Operations. Industrial Marketing Management, 34 (8), 797-829.
Grant, R. (1996). Toward a knowledge-based theory of the firm. Strategic
Management Journal, 17, 109-122.
Gray, B.J. (1997). Profiling managers to improve export promotion targeting.
Journal of Small Business Management, 28 (2), 287-321.
Green, K. W., Toms, L., & Clark, J. (2015). Impact of market orientation on
environmental sustainability strategy. Management Research Review, 38 (2), 217-238.
Greenley, G., & Fox all, G. (1998). External moderation of association among
stake holder orientation and company performance. International Journal of Research
in Marketing, 15, 51-69.
83
Hadley, R. D., & Wilson H. I. M. (2003). The network model of
internationalization and experiential knowledge. International Business Review, 12 (6),
697-71.
Hallbäck, J., & Gabrielsson, P. (2013). Entrepreneurial marketing strategies
during the growth of international new ventures originating in small and open
economies. International Business Review, 22 (6), 1008-1020.
Han J., Kim N., & Srivastava R. (1998). Market orientation and organizational
performance: Is innovation a missing link?. Journal of Marketing, 62 (4), 30-45.
Harris, L. (2000). The organizational barriers to developing market orientation.
European Journal of Marketing, 34 (5/6), 598-624.
Harris, L. (2001). Market orientation and performance: objective and subjective
empirical evidence from UK companies. Journal of Management Studies, 38 (1), 17-43.
Harris, L. (2002). Measuring market orientation: exploring a market oriented
approach. Journal of Market-Focused management, 5, 239-270.
Hashai, N., & Almor, T. (2004). Gradually internationalizing ‗born global‘
firms: an Oxymoron?. International Business Review, 13 (4), 465-483.
Haugland S.A., Myrtveit, I., & Nygaard A. (2007). Market orientation and
performance in the service industry: a data envelopment analysis. Journal of Business
Research, 60 (11), 1191-1197.
He, X., & Wei, Y. (2011). Linking market orientation to international market
selection and international performance. International Business Review, 20 (5), 535-
546.
Helfert, G., Ritter, T., & Walter, A. (2002). Redefining market orientation from
a relationship perspective, theoretical considerations and empirical results. European
Journal of Marketing, 36 (9/10), 1119-1139.
Hoe, S.L., & McShane, S. (2010). Structural and informal knowledge
acquisition and dissemination in organizational learning: An exploratory analysis. The
Learning Organization, 17 (4), 364-386.
Hooley G., Cox T., Fahy J., Shipley D., Beracs J., Fonfara K., & Snoj B. (2000).
Market orientation in the transition economies of central Europe: test of the Narver and
Slater market orientation scales. Journal of Business Research, 50, 273-285.
Hooley, G., Fahy, J., Greenley, G., Beracs, J., Fonfara, K., & Snoj, B. (2003).
Market orientation in the service sector of the transition economies of central Europe.
European Journal of Marketing, 37 (1/2), 86-106.
Horng, S., & Chen, A. (1998). Market orientation of small- and medium-sized
firms in Taiwan. Journal of Small Business Management, 36 (3), 79-83.
Hou, J., & Lv, J. (2013). Applicability of MKTOR scale for market orientation
construct in Chinese transition economies. Journal of Applied Sciences, 13 (23), 5625-
5631.
Hult T., & Ketchen D. (2001). Does market orientation matter? A test of the
relationship between positional advantage and performance. Strategic Management
Journal, 22, 899-906.
Jantunen, A., Nummela, N., Puumalainen, K., & Saarenketo, S. (2008).Strategic
orientations of born globals-Do they really matter?. Journal of World Business, 43 (2),
158-170.
Jaworski B.J., & Kohli A.K. (1993). Market orientation: antecedents and
consequences. Journal of marketing, 57, 53-70.
Johansen D., & Knight G. (2010).entrepreneurial and market-oriented sme‘s fit
to international environments, dynamic capabilities and competencies. International
Business: Research, Teaching and Practice, 4 (1), 38-55.
84
Johanson J., & Vahlne J. (1977). The internationalization process of the firm -A
model of knowledge development and increasing foreign market commitments. Journal
of International Business Studies, 8, 23-32.
Johanson, J., & Wiedersheim P. (1975). Internationalization of firm- 4 Swedish
cases. Journal of Management Studies of Management Studies, 12, 305-322.
Jolly V., Alahuhta M., & Jeannet J.P. (1992). Challenging the incumbents: how
high technology start-ups compete globally. Journal of Strategic Change, 1, 71-82.
Jones, M., & Nummela N. (2008). International Entrepreneurship: Expanding
the domain and extending our research questions. European Management Journal, 26
(6), 349-353.
Jones, M.V., & Coviello, N.E. (2005). Internationalisation: Conceptualising an
entrepreneurial process of behaviour in time. Journal of International Business Studies,
36 (3), 284-303.
Kara, A., Spillan, J.,& DeShields, O. (2005). The effect of a market orientation
on business performance: a study of small-sized service retailers using MARKOR scale.
Journal of Small Business Management, 43 (2), 105-118.
Karra, N., Phillips, N., & Tracey, P. (2008).Building the born global firm.
Developing entrepreneurial capabilities for international new venture success. Long
Range Planning, 41 (4), 440-458.
Kaynak E., & Kara, A. (2004). Market orientation and organizational
performance: a comparison of industrial versus consumer companies in mainland China
using market orientation scale (MARKOR). Journal of Small Business Management, 43
(2), 105-118.
Kim, D., Basu C., Naidu, G., & Cavusgil E. (2011).The innovativeness of born-
globals and customer orientation: Learning from Indian born-globals. Journal of
Business Research, 64 (8), 879-886.
Kirca, A., Jayachandran S., & Bearden W. (2005). Market orientation: a meta-
analytic review and assessment of its antecedents and impact on performance. Journal
of Marketing, 69, 24-41.
Kirpalani, V.H. & Gabrielsson, M. (2012). Born globals: research areas that still
need to be covered more fully in Gabrielsson, M., & Kirpalani, V. H. (Eds.). (2012).
Handbook of research on born globals. Edward Elgar Publishing.
Knight, G. A. (2001). Entrepreneurship and Strategy in the International SME.
Journal of International Management, 7, 155-171.
Knight, G. A., & Cavusgil, S. T. (2004). Innovation, organizational capabilities,
and the born global firm. Journal of International Business Studies, 35, 124-141.
Knight, G., & Cavusgil, T. (1996). The born global firm: a challenge to
traditional internationalization theory. Advances in International Marketing, 8,11-26.
Knight, G., Madsen, T.K., & Servais, P. (2004). An inquiry into born-global
firms in Europe and the USA. International Marketing Review, 21 (6), 645-665.
Knight, G.A. (1997). Firm orientation and strategy under regional market
integration. International Executive, 39 (3), 351-374.
Knudsen, T., & Madsen, T. K. (2002).Export strategy: a dynamic capabilities
perspective. Scandinavian Journal of Management, 18, 475-502.
Kocak, A., & Abimbola, T. (2009). The effects of entrepreneurial marketing on
born global performance. International Marketing Review, 26 (4/5), 439-452.
Kocak, A., & Abimbola, T. (2009). The effects of entrepreneurial marketing on
born global performance. International Marketing Review, 26 (4), 439-452.
Kohli A., Jaworski B., & Kumar A. (1993). MARKOR: a measure of market
orientation. Journal of marketing research, 30 (4), 467-477.
85
Kohli, A., & Jaworski B. (1990). Market orientation: the construct, research
propositions and managerial implications. Journal of Marketing, 54,1-18.
Kumar K., Subramanian R., & Yauger C. (1998). Examining the market
orientation-performance relationship: a context-specific study. Journal of Management,
24 (2), 201-233.
Laanti, R., Gabrielsson, M., & Gabrielsson, P. (2007). The globalization
strategies of business-to-business born global firms in the wireless technology industry.
Industrial Marketing Management, 36 (8), 1104-1117.
Lado N., Maydeu-Olivares A., & Rivera J. (1998). Measuring market orientation
in several populations. A structural equations model. European Journal of Marketing,
32 (3/4), 22-39.
Lafferty B., & Hult T.(2001). A synthesis of contemporary market orientation
perspectives. European Journal of Marketing, 35 (1-2), 92-109.
Lee, Y. K., Kim, S. H., Seo, M. K., & Hight, S. K. (2015). Market orientation
and business performance: Evidence from franchising industry. International Journal of
Hospitality Management, 44, 28-37.
Li, T., & Cavusgil, S. T. (1995). A classification and assessment of research
streams in international marketing. International Business Review, 4 (3), 251-277.
Liao, S. H., Chang, W. J., Wu, C. C., & Katrichis, J. M. (2011). A survey of
market orientation research (1995–2008). Industrial Marketing Management, 40 (2),
301-310.
Liesch, P., Weerawardena, J., Sullivan Mort, G., Knight, G., & Kastelle, T.
(2007). Introduction. Journal of World Business, 42 (3), 232-235.
Lings, I., & Greenley, G. (2010). Internal market orientation and market-
oriented behaviours. Journal of Service Management, 21 (3), 321-343.
Liu, B., & Fu Z. (2011). Relationship between strategic orientation and
organizational performance in born global: A critical review. International Journal of
Business and Management, 6 (3), 109-115.
Luostarinen, R., & Gabrielsson, M. (2004). Finnish perspective of international
entrepreneurship. Dana, L.P. (Ed), Handbook of research on international
entrepreneurship, Cheltenham: Edward Elgar, 383-403.
Luostarinen, R., & Gabrielsson, M. (2006).Globalization and marketing
strategies of Born Globals in SMOPECs Thunderbird. International Business Review,
48 (6), 773-801.
Macedo, I., & Pinho, J. (2006). The relationship between resource dependence
and market orientation: The specific case of non-profit organizations. European Journal
of Marketing, 40 (5/6), 533-553.
Madsen, T., & Servais, P. (1997). The internationalization of born globals: an
evolutionary process?. International Business Review, 6 (6), 561-583.
Madsen, T.K., Rasmussen, E., & Servais, P. (2000). Differences and similarities
between born globals and other types of exporters. Advances in International
Marketing, 10, 247-265.
Mathews, J., & Zander I. (2007). The international entrepreneurial dynamics of
accelerated internationalization. Journal of International Business Studies, 38 (3), 387-
403.
Matsuno, K., Mentzer, J., & Ozsomer, A. (2002). The effects of entrepreneurial
proclivity and market orientation on business performance. Journal of Marketing, 66,
18-32.
Matsuno, K., Mentzer, J., & Rentz, O. (2000). A Refinement and Validation of
the Markor Scale. Journal of the Academy of Marketing Science, 28, 527-539.
86
Mavondo F., & Farrell M. (2000). Measuring market orientation: are there
differences between business marketers and consumer marketers? Australian Journal of
management, 25, (2), 223-244.
Mazaira, A., González, E., & Avendaño, R. (2003). The role of market
orientation on company performance through the development of sustainable
competitive advantage: the Inditex-Zara case. Marketing Intelligence & Planning, 21
(4), 220-229.
Mcclure, E. (2010). The influence of organizational culture and conflict on
market orientation. Journal of Business and Industrial Marketing, 25 (7), 514-524.
McDougall P.P., & Oviatt B. M. (1996). New venture internationalization,
strategic change, and performance: A follow-up study. Journal of Business Venture, 11
(1), 23-40.
McDougall, P., Shane S., & Oviatt B. (1994). Explaining the formation of
international new ventures: The limits of theories from international business research.
Journal of Business Venturing, 9 (4), 469-487.
McKinsey & Co. (1993). Emerging exporters. Australiaʼs high value-added
manufacturing exporters. Mel-bourne: McKinsey & Company and the Australian
Manufacturing Council.
Melén, S., & Nordman, E.R. (2009). The internationalisation modes of Born
Globals: A longitudinal study. European Management Journal, 27 (4), 243-254.
Menguc, B., & Auh S. (2006). Creating a Firm-Level dynamic capability
through capitalizing on market orientation and innovativeness. Journal of the Academy
of Marketing Science, 34 (1), 63-73.
Miles, M. B.,& Huberman, A. M. Qualitative Data Analysis: An Expanded
Sourcebook, Thousand Oaks: Sage Publications 1994.
Moen, Ø. (2002). The Born Globals a new generation of small European
exporters. International Marketing Review, 19 (2), 156-175.
Moen, Ø., & Servais P. (2002). Born global or gradual global? Examining the
export behavior of small and medium-sized enterprises. Journal of International
Marketing, 10 (3), 49-72.
Moorman, C.,& Rust R.T. (1999).The Role of Marketing. Journal of Marketing,
63 (Special Issue), 180-197.
Morgan R.E., & Strong C.A. (1998). Market orientation and dimensions of
strategic orientation. European Journal of Marketing, 32 (11/12), 1051-1073.
Mort G.S., & Weerawardena J. (2006).Networking capability and international
entrepreneurship. International Marketing Review, 23 (5), 549-572.
Muhr, T. & Friese, S. (2004). User's manual for Atlas.ti 5.0 (2nd. edition).
Berlin: Scientific Software Development.
Muhr, T. (2004). ATLAS.ti 5.0 [Version 5:]. Berlin, Germany: ATLAS.ti
Scientific Software Development GmbH. Available from http://www.atlasti.com/
Murray, J. Y., Gao, G. Y., & Kotabe, M. (2011). Market orientation and
performance of export ventures: the process through marketing capabilities and
competitive advantages. Journal of the Academy of Marketing Science, 39 (2), 252-269.
Nagy, G., & Berács, J. (2012). Antecedents to the export market orientation of
Hungarian higher education institutions, and their export performance consequences.
Journal of Marketing for Higher Education, 22 (2), 231-256.
Narver J.C., & Slater S.F. (1990). The effect of a market orientation on business
profitability. Journal of Marketing, 54 (4), 20-35.
87
Noble, C., Sinha, R.,& Kumar, A. (2002). Market orientation and alternative
strategic orientations: A longitudinal assessment of performance implications. Journal
of Marketing, 66, 25-39.
Nordman, R. E.,& Melén, S. (2008). The impact of different kinds of knowledge
for the internationalization process of Born Globals in the biotech business. Journal of
World Business, 43 (2), 171-185.
Oczkowski, E., & Farrell M. (1998). Discriminating between measurement
scales using Non-Nested Tests and Two Stage Estimators: the case of market
orientation. International Journal of Research in Marketing, 15, 349-366.
Odorici, V., & Presutti, M. (2013). The entrepreneurial experience and strategic
orientation of high-tech born global start-ups: An analysis of novice and habitual
entrepreneurs. Journal of International Entrepreneurship, 11 (3), 268-291.
O'Sullivan, D., & Butler, P. (2009). Market orientation and enterprise policy.
European Journal of Marketing, 43 (11/12), 1349-1364.
Oviatt B. & McDougall P. (1994).Toward a theory of international new
ventures. Journal of International Business Studies, 38, 45-64.
Oviatt, B., & McDougall P. (1995). Global start-ups: Entrepreneurs on a world-
wide stage. Academic Management Executive, 9 (2), 30-43.
Oviatt, B., & McDougall, P. (1997). Challenges for internationalization process
theory: The case of international new ventures. Management International Review,
Special Issue 2, 85-99.
Oxtorp, L. A. (2014). Dynamic managerial capability of technology-based
international new ventures—a basis for their long-term competitive advantage. Journal
of International Entrepreneurship, 12 (4), 389-420.
Pangarkar, N. (2008). Internationalization and performance of small-and-
medium sized enterprises. Journal of World Business, 43, 475-485.
Pelham A. (2000). Market orientation and other potential influences on
performance in small and medium-sized manufacturing firms. Journal of Small
Business Management, 38 (1), 33-46.
Pla Barber, J.,& Cobos Caballero, Á. La aceleración del proceso de
internacionalización de la empresa: El caso de las International New Ventures
españolas. Publicación del Departamento de Dirección de Empresas ―Juan José Renal
Piqueras‖. Número 802. Páginas 9 a 21. Valencia, España. Octubre 2002.
Racela, O. C, Chaikittisilpa, C.,& Thoumrungroje, A. (2007). Market
orientation, international business relationships and perceived export performance.
International Marketing Review, 24, (2),144-16
Rennie, M. W. (1993). Born Global. McKinsey Quarterly, 4, 45-52.
Reuber, R.,& Fischer, E. (2002). Foreign sales and small firm growth: The
moderating role of the management Team. Entrepreneurship, Theory and Practice, 27
(1), 29-45.
Rialp A., Galvan, I., & Suarez S. (2010). A configuration-holistic approach to
born-global firms´ strategy formation process. European Management Journal, 28, 108-
123.
Rialp, A., & Rialp J. (1996).El papel de los acuerdos de cooperación en los
procesos de internacionalización de la empresa española: un análisis empírico. Papeles
de Economía Española, 66, 248-266.
Rialp, A., & Rialp, J. (2006). Faster and more successful exporters: An
exploratory study of born global firms from the resource-based view. Journal of
Euromarketing, 16 (1-2), 71-86.
88
Rialp, A., Rialp, J., & Knight, G. (2005). The phenomenon of early
internationalizing firms: what do we know after a decade (1993–2003) of scientific
inquiry?. International Business Review, 14 (2), 147-166.
Ripollés, M., Blesa, A., & Monferrer, D. (2012). Factors enhancing the choice of
higher resource commitment entry modes in international new ventures. International
Business review, 21 (4), 648-666.
Roersen, M. J., Kraaijenbrink, J., & Groen, A. J. (2013). Marketing ignorance
and the validity of narver and slater's MKTOR scale in high-tech russian firms. Journal
of Product Innovation Management, 30 (3), 545-559.
Rose G., & Shoham A., (2002). Export performance and market orientation:
establishing an empirical link. Journal of Business Research, 55 (3), 217-222.
Ruekert, R. (1992). Developing a market orientation an organizational strategy
perspective. International Journal of Research in Marketing, 9, 225-245.
Ruokonen, M., & Saarenketo, S. (2009). The strategic orientations of rapidly
internationalizing software companies. European Business Review, 21 (1), 17-41.
Ruokonen, M., Nummela, N., Puumalainen, K., & Saarenketo, S. (2008).
Market orientation and internationalisation in small software firms. European Journal
of Marketing, 42 (11/12), 1294-1315.
Schlosser F.K., & McNaughton R.B. (2009).Using the I-MARKOR scale to
identify market-oriented individuals in the financial services sector. Journal of Services
Marketing, 23 (4), 236-247.
Selnes, F., Jaworski, B.J., & Kohli, A.K. (1996). Market orientation in United
Stared and Scandinavian companies: A cross-cultural study. Scandinavian Journal of
management, 12 (2), 139-157.
Senglen, Per O. (1997). Why the impact factor of journals should not be used for
evaluating research. BMJ. 314, 7079, 497.
Servais, P., & Rasmussen, E.S. (2000). Different types of international new
ventures. Paper presented at the Academy of International Business (AIB) Annual
Meeting (November), Phoenix, AZ., USA, 1-27.
Servais, P., Zucchella, A., & Palamara, G. (2007). International entrepreneurship
and sourcing: international value chain of small firms. Journal of Euromarketing, 16
(1/2), 105-117.
Shapiro, B. (1998). ―What the hell is market-orientated?‖. Harvard Business
Review, 66, 119-125.
Sharma, D., & Blomstermo, A. (2003). The Internationalization process of Born
Global: a network view. International Business Review, 12, 739-753.
Shook, C. L., Priem, R. L., & McGee, J. E. (2003). Venture creation and the
enterprising individual: a review and synthesis. Journal of Management, 29 (3), 379-
399.
Siguaw J., Brown G., & Widing R. (1994). The influences of the market
orientation of the firm on sales force behavior and attitudes. Journal of Marketing
Research, 31, 106-116.
Siguaw, J., & Diamantopoulos, A. (1994). The market orientation measure: a
reexamination of Narver and Slater´s scale. In: Park, C., Smith, D. (Eds.), proceedings
of the American Marketing Association Winter Educator`s, Vol. 5. American Marketing
Association, Chicago, pp. 150-151.
Sin L., Tse A., Yau O., Chow R., & Lee J. (2005). Market orientation,
relationship marketing orientation, and business performance: The moderating effects of
economic ideology and industry type. Journal of International Marketing, 13 (1), 36-57.
89
Sin L., Tse A., Yau O., Chow R., Lee J., & Lau L. (2005).Relationship
marketing orientations: scale development and cross-cultural validation. Journal of
Business Research, 58, 185-194.
Sørensen, H.E. (2009). Why competitors matter for market orientation.
European Journal of Marketing, 43 (5/6), 735 -761.
Strauss, A. L., & Corbin, J. (1990). Basics of qualitative research: Grounded
theory procedures and techniques. Newbury Park, CA: Sage.
Strauss, A. L., & Corbin, J. (1994). Grounded theory methodology: An
overview. In Norman K. Denzin & Yvonna S. Lincoln (Eds.), Handbook of qualitative
research (pp.273-285). London: Sage.
Sullivan Mort, G.M., & Weerawardena, J. (2006). Networking Capability and
International Entrepreneurship: How Networks Function in Australian Born Global
Firms. International Marketing Review, 23 (5), 549-572.
Tomášková, E. (2009). The current methods of measurement of market
orientation. European Research Studies Journal, 12 (3), 135-150.
Trudgen, R., & Freeman, S. (2014). Measuring the performance of born-global
firms throughout their development process: The roles of initial market selection and
internationalisation speed. Management International Review, 54 (4), 551-579.
Valenzuela, A. (2000). Modelos de capacidades para la internacionalización de
la empresa exportadora española. Cuadernos de Economía y Dirección de la Empresa,
5, 91-109.
Verbees, F., & Meulenberg M. (2004). Market orientation, innovativeness,
product innovation, and performance in small firms. Journal of Small Business
Management, 42 (2), 134-154.
Vorhies. D.W., Harker, M., & Rao, C.P., (1999). The capabilities and
performance of market-driven firms. European Journal of Marketing, 33 (11/12), 1171-
1202.
Voss, G.B.,& Voss, Z.G. (2000). Strategic orientation and firm performance in
an artistic environment. Journal of Marketing, 64 (1), 67-83.
Weerawardena J., Sullivan Mort G., Liesch P., & Knight, G. (2007).
Conceptualizing accelerated internationalization in the born global firm: A dynamic
capabilities perspective. Journal of World Business, 42, 294-306.
Woller, G. (2002). From market failure to marketing failure: market orientation
as the key to deep outreach in Microfinance. Journal of International Development, 14,
305-332.
Wong, H. Y., & Merrilees, B. (2012). Born Globals: How are they Different?.
Interdisciplinary Approaches to Product Design, Innovation, and Branding in
International Marketing: Creative Research on Branding, Product Design/Innovation,
and Strategic Thought/Social Entrepreneurship, 23, 305.
Wood, E., Khavul, S., Perez‐Nordtvedt, L., Prakhya, S., Velarde Dabrowski, R.,
& Zheng, C. (2011). Strategic commitment and timing of internationalization from
emerging markets: evidence from China, India, Mexico, and South Africa. Journal of
Small Business Management, 49 (2), 252-282.
Wren, B. (1997). The market orientation construct: Measurement and scaling
issues. Journal of Marketing Theory and Practice, 15 (3), 31-54.
Wren, B. M., Souder, W.E., & Berkowitz D. (2000). Market Orientation and
New Product Development in Global Industrial Firms. Industrial Marketing
Management, 29 (6), 601-611.
Yin, R. K. (2003). Case study research: Design and methods (3rd ed.). Thousand
Oaks, CA: Sage.
90
Zahra, S. A. (2014). Public and corporate governance and young global
entrepreneurial firms. Corporate Governance: An International Review, 22 (2), 77-83.
Zahra, S.A., Ireland, R.D., & Hitt, M.A. (2000). International expansion by new
venture firms: International diversity, mode of market entry, technological learning, and
firm performance. Academy of Management Journal, 43 (5), 925-950.
Zeng, S., Xie, X.M., Tam, C.M., & Wan, T.W.(2009). Relationships between
business factors and performance in internationalization: An empirical study in China.
Management Decision, 47 (2), 308-329.
Zhang, J., Jiang, Y., Shabbir, R., & Duan, Y. (2015). How perceived
institutional pressures impact market orientation: an empirical study of Chinese
manufacturing firms. Asia Pacific Journal of Marketing and Logistics, 27 (2) 1-29.
Zhang, M., & Dodgson, M. (2007). "A Roasted Duck Can Still Fly Away": A
Case Study of Technology, Nationality, Culture and the Rapid and Early
Internationalization of the Firm. Journal of World Business, 42, 336-349.
Zhou, L. (2007). The effects of entrepreneurial proclivity and foreign market
knowledge on early internationalization. Journal of World Business, 42 (3), 281-293.
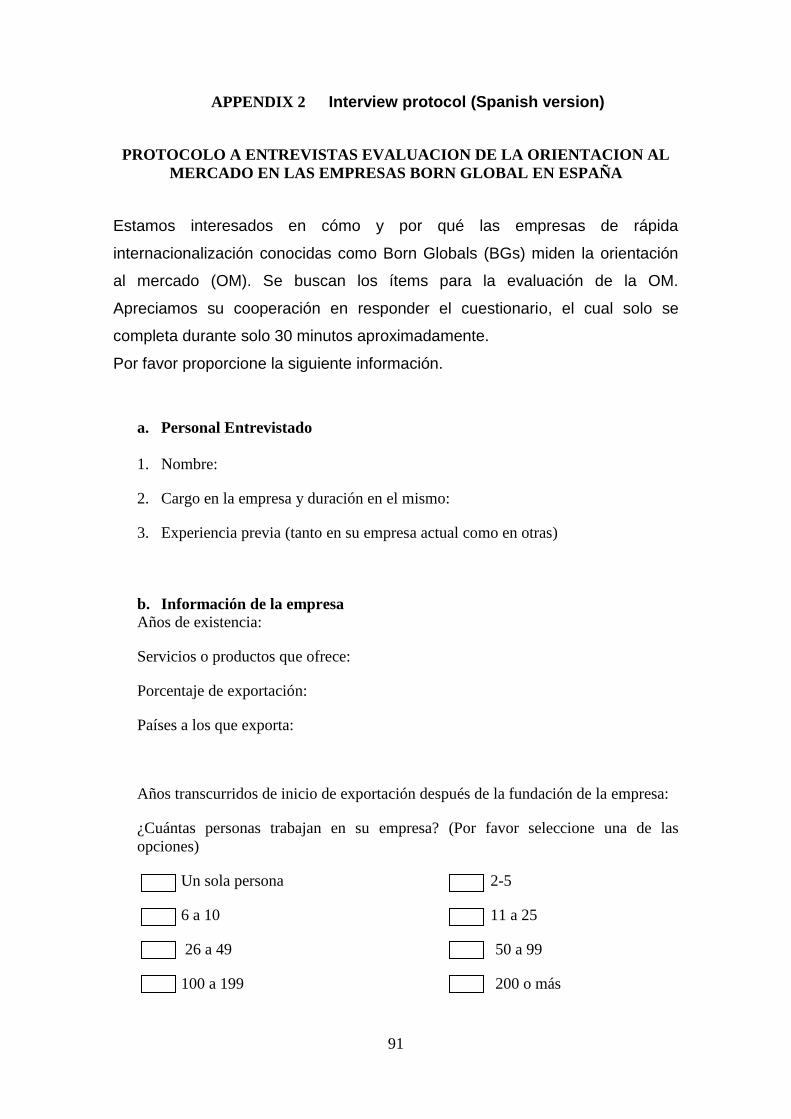
91
APPENDIX 2 Interview protocol (Spanish version)
PROTOCOLO A ENTREVISTAS EVALUACION DE LA ORIENTACION AL
MERCADO EN LAS EMPRESAS BORN GLOBAL EN ESPAÑA
Estamos interesados en cómo y por qué las empresas de rápida
internacionalización conocidas como Born Globals (BGs) miden la orientación
al mercado (OM). Se buscan los ítems para la evaluación de la OM.
Apreciamos su cooperación en responder el cuestionario, el cual solo se
completa durante solo 30 minutos aproximadamente.
Por favor proporcione la siguiente información.
a. Personal Entrevistado
1. Nombre:
2. Cargo en la empresa y duración en el mismo:
3. Experiencia previa (tanto en su empresa actual como en otras)
b. Información de la empresa
Años de existencia:
Servicios o productos que ofrece:
Porcentaje de exportación:
Países a los que exporta:
Años transcurridos de inicio de exportación después de la fundación de la empresa:
¿Cuántas personas trabajan en su empresa? (Por favor seleccione una de las
opciones)
Un sola persona 2-5
6 a 10 11 a 25
26 a 49 50 a 99
100 a 199 200 o más
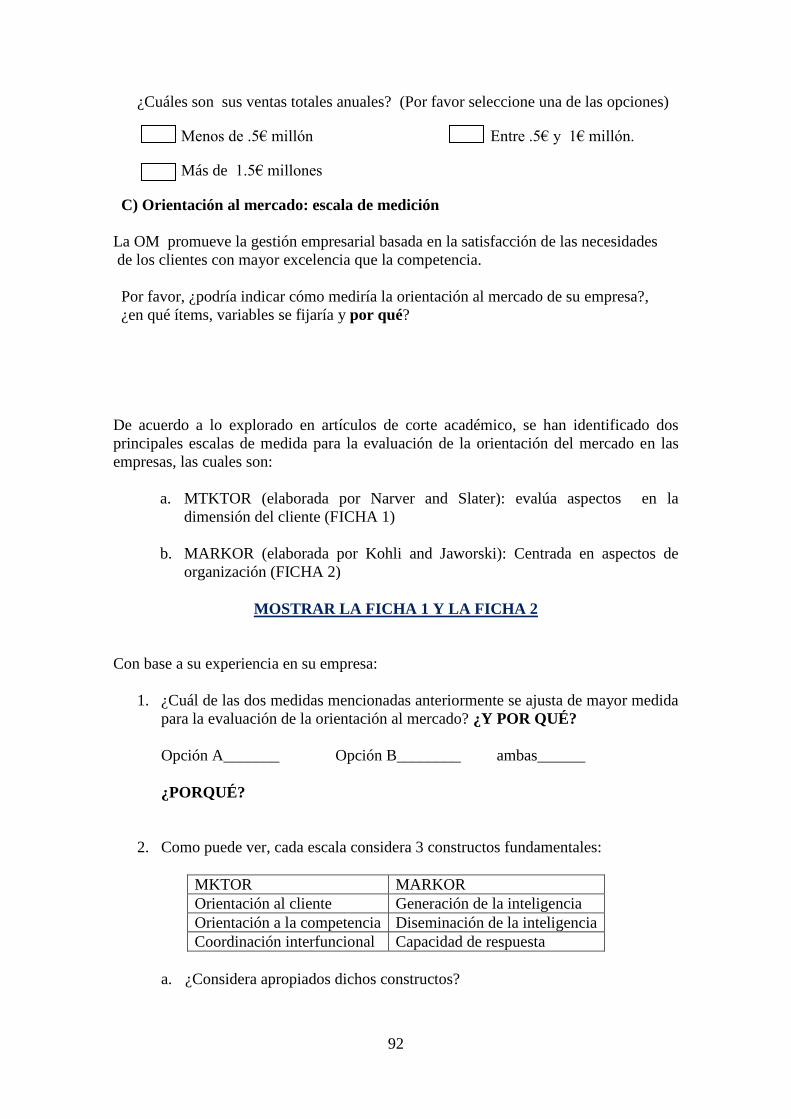
92
¿Cuáles son sus ventas totales anuales? (Por favor seleccione una de las opciones)
Menos de .5€ millón Entre .5€ y 1€ millón.
Más de 1.5€ millones
C) Orientación al mercado: escala de medición
La OM promueve la gestión empresarial basada en la satisfacción de las necesidades
de los clientes con mayor excelencia que la competencia.
Por favor, ¿podría indicar cómo mediría la orientación al mercado de su empresa?,
¿en qué ítems, variables se fijaría y por qué?
De acuerdo a lo explorado en artículos de corte académico, se han identificado dos
principales escalas de medida para la evaluación de la orientación del mercado en las
empresas, las cuales son:
a. MTKTOR (elaborada por Narver and Slater): evalúa aspectos en la
dimensión del cliente (FICHA 1)
b. MARKOR (elaborada por Kohli and Jaworski): Centrada en aspectos de
organización (FICHA 2)
MOSTRAR LA FICHA 1 Y LA FICHA 2
Con base a su experiencia en su empresa:
1. ¿Cuál de las dos medidas mencionadas anteriormente se ajusta de mayor medida
para la evaluación de la orientación al mercado? ¿Y POR QUÉ?
Opción A_______ Opción B________ ambas______
¿PORQUÉ?
2. Como puede ver, cada escala considera 3 constructos fundamentales:
MKTOR MARKOR
Orientación al cliente Generación de la inteligencia
Orientación a la competencia Diseminación de la inteligencia
Coordinación interfuncional Capacidad de respuesta
a. ¿Considera apropiados dichos constructos?
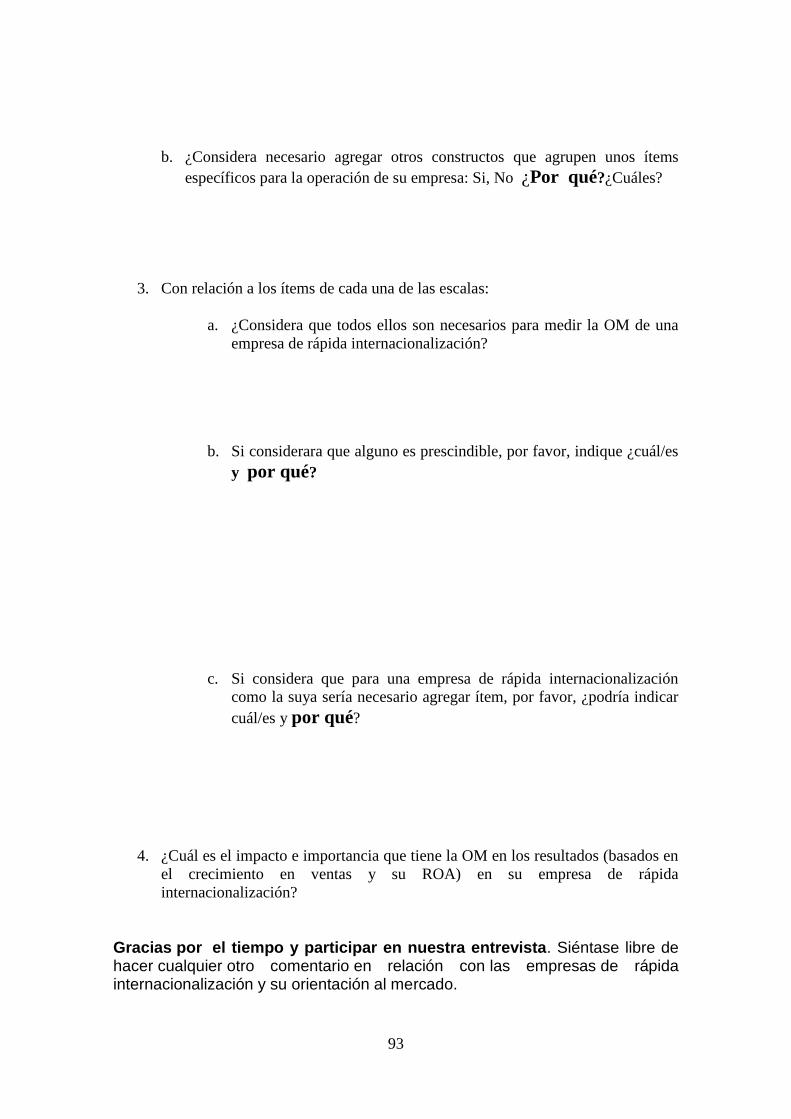
93
b. ¿Considera necesario agregar otros constructos que agrupen unos ítems
específicos para la operación de su empresa: Si, No ¿Por qué?¿Cuáles?
3. Con relación a los ítems de cada una de las escalas:
a. ¿Considera que todos ellos son necesarios para medir la OM de una
empresa de rápida internacionalización?
b. Si considerara que alguno es prescindible, por favor, indique ¿cuál/es
y por qué?
c. Si considera que para una empresa de rápida internacionalización
como la suya sería necesario agregar ítem, por favor, ¿podría indicar
cuál/es y por qué?
4. ¿Cuál es el impacto e importancia que tiene la OM en los resultados (basados en
el crecimiento en ventas y su ROA) en su empresa de rápida
internacionalización?
Gracias por el tiempo y participar en nuestra entrevista. Siéntase libre de hacer cualquier otro comentario en relación con las empresas de rápida internacionalización y su orientación al mercado.
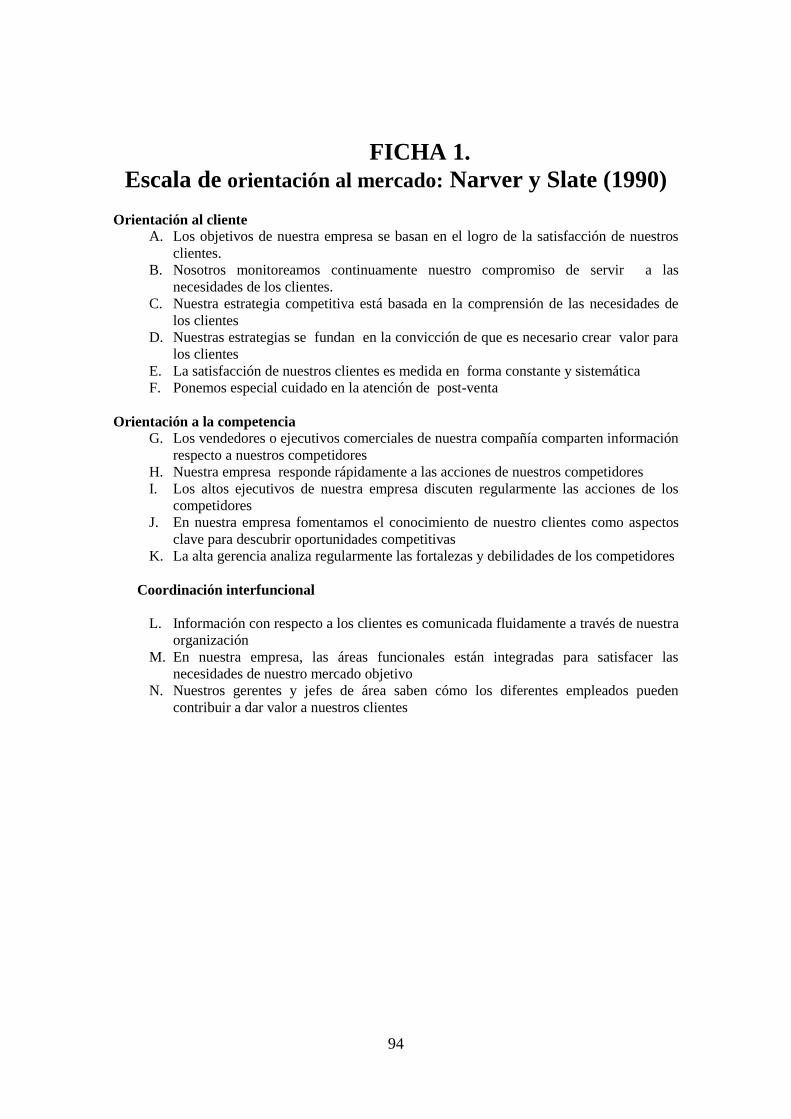
94
FICHA 1.
Escala de orientación al mercado: Narver y Slate (1990) Orientación al cliente
A. Los objetivos de nuestra empresa se basan en el logro de la satisfacción de nuestros
clientes.
B. Nosotros monitoreamos continuamente nuestro compromiso de servir a las
necesidades de los clientes.
C. Nuestra estrategia competitiva está basada en la comprensión de las necesidades de
los clientes
D. Nuestras estrategias se fundan en la convicción de que es necesario crear valor para
los clientes
E. La satisfacción de nuestros clientes es medida en forma constante y sistemática
F. Ponemos especial cuidado en la atención de post-venta
Orientación a la competencia
G. Los vendedores o ejecutivos comerciales de nuestra compañía comparten información
respecto a nuestros competidores
H. Nuestra empresa responde rápidamente a las acciones de nuestros competidores
I. Los altos ejecutivos de nuestra empresa discuten regularmente las acciones de los
competidores
J. En nuestra empresa fomentamos el conocimiento de nuestro clientes como aspectos
clave para descubrir oportunidades competitivas
K. La alta gerencia analiza regularmente las fortalezas y debilidades de los competidores
Coordinación interfuncional
L. Información con respecto a los clientes es comunicada fluidamente a través de nuestra
organización
M. En nuestra empresa, las áreas funcionales están integradas para satisfacer las
necesidades de nuestro mercado objetivo
N. Nuestros gerentes y jefes de área saben cómo los diferentes empleados pueden
contribuir a dar valor a nuestros clientes
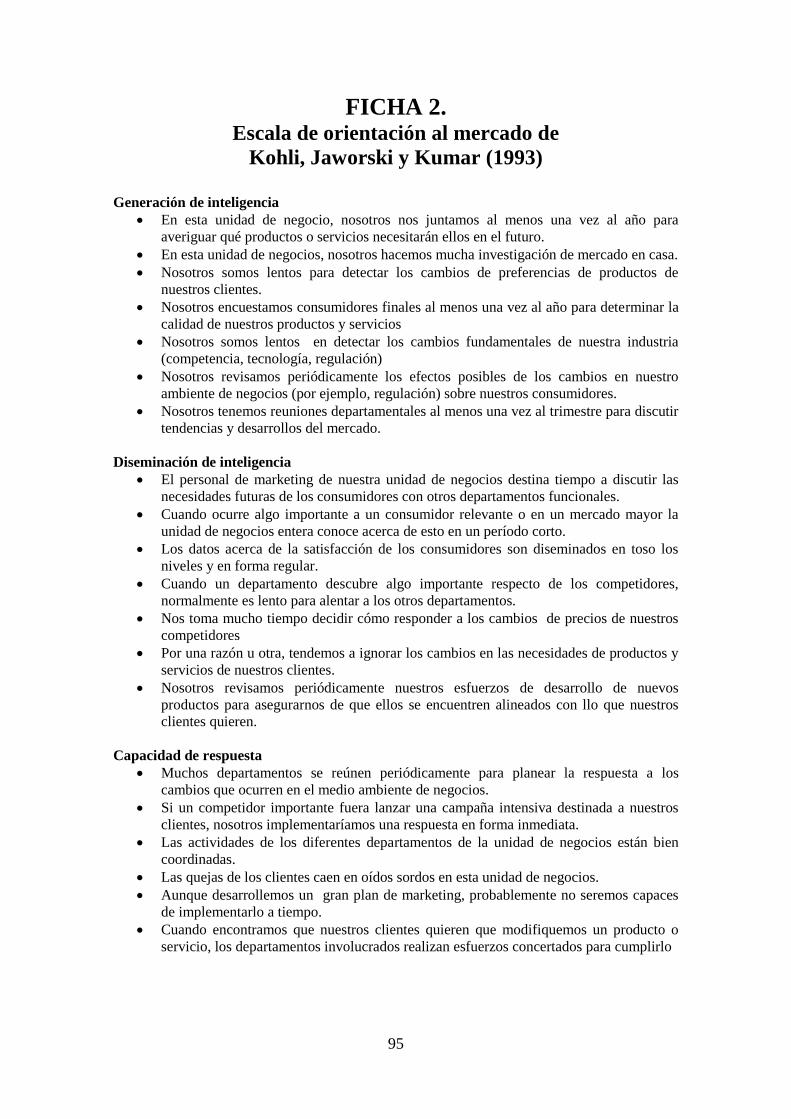
95
FICHA 2. Escala de orientación al mercado de
Kohli, Jaworski y Kumar (1993)
Generación de inteligencia
En esta unidad de negocio, nosotros nos juntamos al menos una vez al año para
averiguar qué productos o servicios necesitarán ellos en el futuro.
En esta unidad de negocios, nosotros hacemos mucha investigación de mercado en casa.
Nosotros somos lentos para detectar los cambios de preferencias de productos de
nuestros clientes.
Nosotros encuestamos consumidores finales al menos una vez al año para determinar la
calidad de nuestros productos y servicios
Nosotros somos lentos en detectar los cambios fundamentales de nuestra industria
(competencia, tecnología, regulación)
Nosotros revisamos periódicamente los efectos posibles de los cambios en nuestro
ambiente de negocios (por ejemplo, regulación) sobre nuestros consumidores.
Nosotros tenemos reuniones departamentales al menos una vez al trimestre para discutir
tendencias y desarrollos del mercado.
Diseminación de inteligencia
El personal de marketing de nuestra unidad de negocios destina tiempo a discutir las
necesidades futuras de los consumidores con otros departamentos funcionales.
Cuando ocurre algo importante a un consumidor relevante o en un mercado mayor la
unidad de negocios entera conoce acerca de esto en un período corto.
Los datos acerca de la satisfacción de los consumidores son diseminados en toso los
niveles y en forma regular.
Cuando un departamento descubre algo importante respecto de los competidores,
normalmente es lento para alentar a los otros departamentos.
Nos toma mucho tiempo decidir cómo responder a los cambios de precios de nuestros
competidores
Por una razón u otra, tendemos a ignorar los cambios en las necesidades de productos y
servicios de nuestros clientes.
Nosotros revisamos periódicamente nuestros esfuerzos de desarrollo de nuevos
productos para asegurarnos de que ellos se encuentren alineados con llo que nuestros
clientes quieren.
Capacidad de respuesta
Muchos departamentos se reúnen periódicamente para planear la respuesta a los
cambios que ocurren en el medio ambiente de negocios.
Si un competidor importante fuera lanzar una campaña intensiva destinada a nuestros
clientes, nosotros implementaríamos una respuesta en forma inmediata.
Las actividades de los diferentes departamentos de la unidad de negocios están bien
coordinadas.
Las quejas de los clientes caen en oídos sordos en esta unidad de negocios.
Aunque desarrollemos un gran plan de marketing, probablemente no seremos capaces
de implementarlo a tiempo.
Cuando encontramos que nuestros clientes quieren que modifiquemos un producto o
servicio, los departamentos involucrados realizan esfuerzos concertados para cumplirlo

96
APPENDIX 3 Interview protocol (English version)
Interview Guide
Interview guide: Evaluation of market orientation of born global firms in Spain
Introduction: We would like you to answer the questions of how and why the born
global firms measure market orientation. We seek for items that allow us to measure the
market orientation, by completing the questions, which should take 30 minutes.
1. Interviewer information
-Name
-Position
- Previous experience.
2. Company information
-Funded year
-What are your products/Service?
- % of Sales in International Markets
-Which are your markets (countries)?
- When did the company first become involved in International Markets?
- No of employees,
1 2-5
6 - 10 11 - 25
26 - 49 50 - 99
100 - 199 200 and more
-Total of sales
Less of .5€ million Between .5€ and 1€ millón.
more of 1.5€ million
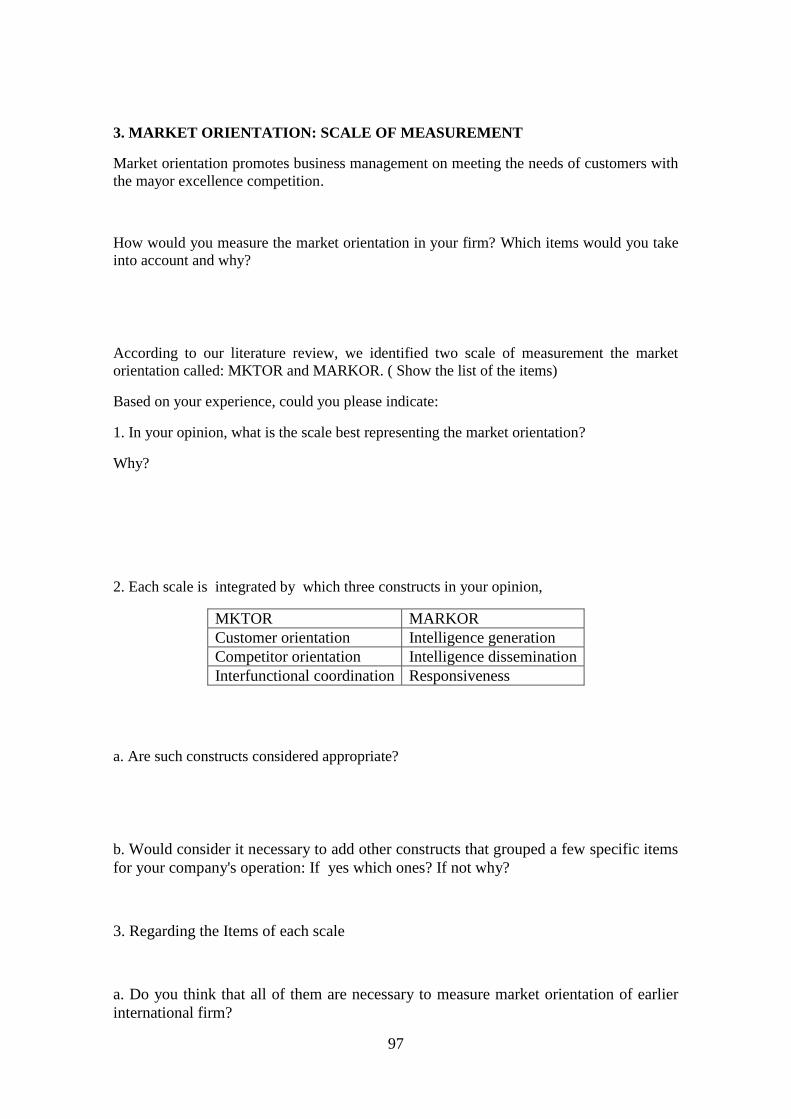
97
3. MARKET ORIENTATION: SCALE OF MEASUREMENT
Market orientation promotes business management on meeting the needs of customers with
the mayor excellence competition.
How would you measure the market orientation in your firm? Which items would you take
into account and why?
According to our literature review, we identified two scale of measurement the market
orientation called: MKTOR and MARKOR. ( Show the list of the items)
Based on your experience, could you please indicate:
1. In your opinion, what is the scale best representing the market orientation?
Why?
2. Each scale is integrated by which three constructs in your opinion,
MKTOR MARKOR
Customer orientation Intelligence generation
Competitor orientation Intelligence dissemination
Interfunctional coordination Responsiveness
a. Are such constructs considered appropriate?
b. Would consider it necessary to add other constructs that grouped a few specific items
for your company's operation: If yes which ones? If not why?
3. Regarding the Items of each scale
a. Do you think that all of them are necessary to measure market orientation of earlier
international firm?

98
b. If you consider that an item is dispensable, please, indicate to us which one and why?
c. If you believe that for a company of rapid internationalization such as yours would
need to add an item, please, could indicate which one and why?
4. What is the importance and the impact that market orientation has on your firmʼs
performance (sales growth and ROA)?
Thanks for the time and participating in our interview. Feel free to make any additional
comments
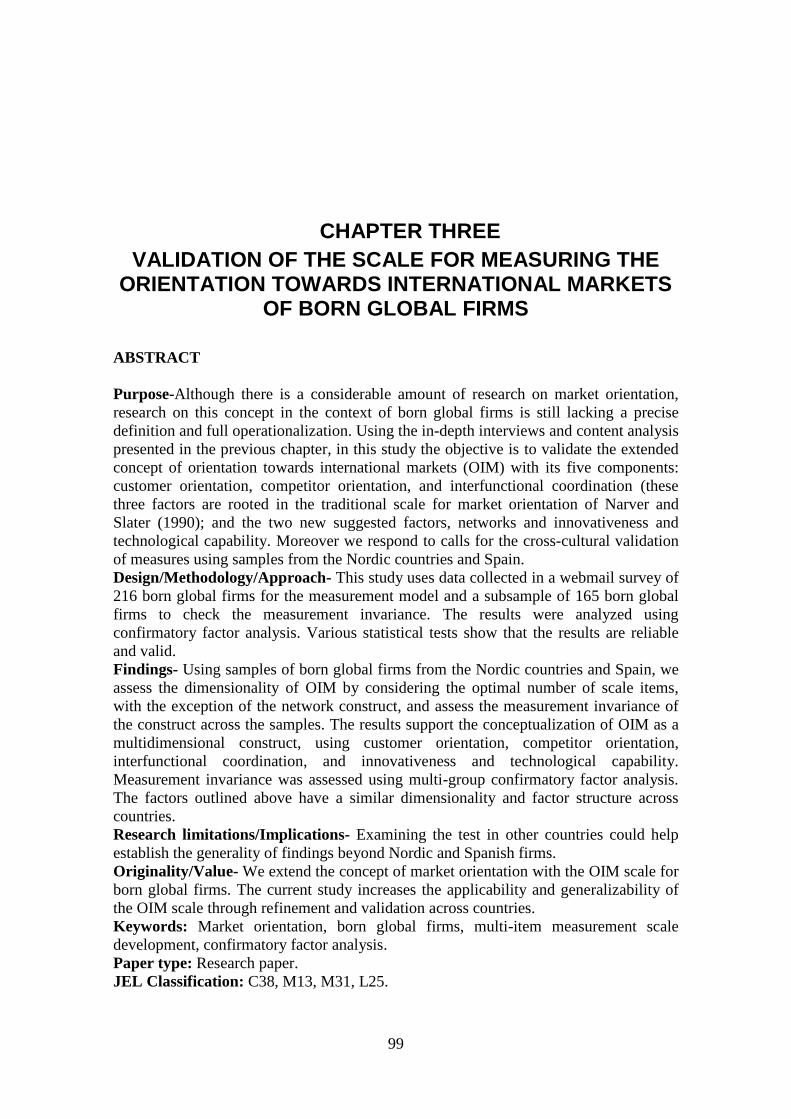
99
3 CHAPTER THREE
VALIDATION OF THE SCALE FOR MEASURING THE ORIENTATION TOWARDS INTERNATIONAL MARKETS
OF BORN GLOBAL FIRMS
ABSTRACT
Purpose-Although there is a considerable amount of research on market orientation,
research on this concept in the context of born global firms is still lacking a precise
definition and full operationalization. Using the in-depth interviews and content analysis
presented in the previous chapter, in this study the objective is to validate the extended
concept of orientation towards international markets (OIM) with its five components:
customer orientation, competitor orientation, and interfunctional coordination (these
three factors are rooted in the traditional scale for market orientation of Narver and
Slater (1990); and the two new suggested factors, networks and innovativeness and
technological capability. Moreover we respond to calls for the cross-cultural validation
of measures using samples from the Nordic countries and Spain.
Design/Methodology/Approach- This study uses data collected in a webmail survey of
216 born global firms for the measurement model and a subsample of 165 born global
firms to check the measurement invariance. The results were analyzed using
confirmatory factor analysis. Various statistical tests show that the results are reliable
and valid.
Findings- Using samples of born global firms from the Nordic countries and Spain, we
assess the dimensionality of OIM by considering the optimal number of scale items,
with the exception of the network construct, and assess the measurement invariance of
the construct across the samples. The results support the conceptualization of OIM as a
multidimensional construct, using customer orientation, competitor orientation,
interfunctional coordination, and innovativeness and technological capability.
Measurement invariance was assessed using multi-group confirmatory factor analysis.
The factors outlined above have a similar dimensionality and factor structure across
countries.
Research limitations/Implications- Examining the test in other countries could help
establish the generality of findings beyond Nordic and Spanish firms.
Originality/Value- We extend the concept of market orientation with the OIM scale for
born global firms. The current study increases the applicability and generalizability of
the OIM scale through refinement and validation across countries.
Keywords: Market orientation, born global firms, multi-item measurement scale
development, confirmatory factor analysis.
Paper type: Research paper.
JEL Classification: C38, M13, M31, L25.
100
3.1 INTRODUCTION
Born global (BG) is a phenomenon that challenged the traditional approach to the
internationalization of firms, because BG firms undertake international business at or
near the time they are founded. BG firms demonstrate a strong customer orientation and
superior marketing capability as key drivers of their accelerated internationalization
(Kim et al., 2011; Sullivan Mort et al., 2012). In spite of its relevance, the effects of
strategic marketing for BG firms have not been widely studied. More specifically,
researchers have suggested that there is a need for further research on market orientation
(MO) in early internationalizing firms (Evers, 2011; Hallbäck & Gabrielsson, 2013). To
fill this gap, this study highlights the concept of orientation towards international
markets, which is an extension of MO, for BG companies.
On the basis of the in-depth interviews and content analysis presented in the previous
chapter, the OIM scale includes the constructs of customer orientation, competitor
orientation, and interfunctional coordination (rooted in the MKTOR scale of Narver and
Slater (1990)), and, specifically, networks, and innovativeness and technological
capability, which are the constructs added by this study. Our purpose in this chapter is
to present a reliable and valid measure of orientation towards international markets for
born global firms. Therefore, we answer the following questions with this
research:―How do born global firms assess the proposed scale for measuring their
orientation towards international markets?‖―Is the proposed scale valid for BG firms
from different countries?‖ As recommended by previous research, testing the proposed
scale in different countries strengthens its validity.
This chapter is organized into four sections: the first section presents the literature
review conducted in the area of scale development. Following this, we explain how the
OIM instrument was developed. Thirdly, a description of the procedures used to assess
the psychometric properties of the proposed scale is presented. Finally, a discussion of
the results and implications of the study follows, and the chapter concludes with the
limitations of the study and future research suggestions.
3.2 LITERATURE REVIEW
3.2.1 Scale development and validation
According to DeVellis (2011), ―we develop scales when we want to measure
phenomena that we believe to exist because of our theoretical understanding but that we
101
cannot assess directly‖ (p. 11). In order to explore the main features of the process of
scale development and validation, we conducted a review of the empirical studies. The
search covered two online journal databases: Scopus and Thomson Reuters Web of
Science (formerly ISI Web of Knowledge), both of which have a comprehensive
coverage of business and management journals. We used the major keyword phrase:
―scale development and validation‖ on March 20, 2014. The searches yielded 761
journal articles altogether, and we filtered these, following Senglen (1997), using the
criterion of relevance (with citation range 100-1100), resulting in 23 articles for our
sample. We reviewed the scale development articles published in the 17 years between
1990 and 2007. An overview of these articles indicates that the development and
assessment of scales falls broadly into two streams: the procedure/stages applied to
develop the scale and the statistical methods used (see Appendix 4).
3.2.2 The procedure/stages
Although there is a little variation in the sequence of the steps for the development of
valid and reliable multi-item instruments by researchers, a number of authors have
recommended the following stages in constructing a scale: item generation, scale
purification based on a reliability assessment, scale validation, and measurement
invariance (Byrne, 2001; Churchill, 1979; DeVellis, 2003; Steenkamp & Baumgartner,
1998).
Studies frequently report item generation as the first stage in scale development
(Bearden et al., 2001; Dabholkar et al., 1996; Flynn & Goldsmith, 1999; Judge et al.,
2003; Liden & Maslyn, 1998). In the process of item generation, as guided by Churchill
(1979), researchers generate a pool of items based on a literature review and qualitative
input from focus groups or interviews. The studies in our review mainly used a
literature review and interviews to generate the items of the scale, with the only
exception being the study of Yang et al. (2005), which used the combination of a
literature review and a focus group.
In parallel with developing a pool of items it is considered necessary at this stage to
have the items reviewed by experts to assess their quality through content validity
(DeVellis, 2003; Netemeyer et al., 2003). Most of the papers included a report on
content validity that refers to item sampling adequacy (DeVellis, 2003, p. 49). Tian, et
al. (2001), for instance, aiming to develop a scale to measure consumers‘ need for
102
uniqueness, conducted a comprehensive review of consumer behavior literature and
analyzed the qualitative data; as result of this process they generated an initial pool of
93 items. The content validity of this pool of items was assessed in two steps: first, there
was an evaluation of the dimensions based on the opinion of five judges, which
suggested the deletion of 19 items; and second, in a similar step, four judges evaluated
the definition of each dimension and eliminated 27 items. As result of this item
generation, three dimensions and 45 items were selected for a questionnaire to perform
the evaluation.
After an initial pool of items has been developed, the second stage in the scale
development and evaluation process is called scale purification (Churchill, 1979). In
order to carry out scale purification, researchers use a reliability assessment. Reliability
refers to ―the degree of dependability and stability of a scale‖ (Ahire et al., 1996, p.36).
The most common methods of estimating reliability are the calculation of Cronbach‘s
alpha (Cronbach, 1951; Cronbach & Shavelson, 2004), and composite reliability (Leo &
Russell-Bennett, 2014).
Although several measures of reliability can be calculated in order to establish the
internal consistency of an instrument, the use of Cronbach‘s alpha is the most common
and accepted form of reliability estimation, and therefore the majority of the empirical
papers reviewed reported that the scales were refined using this method (Cadogan et al.,
1999; Patterson et al., 2005; Richins & Dawson, 1992). According to Nunnally (1978),
an acceptable reliability score for a scale must be greater than .70. A meta-analytic
study of the use of Cronbach‘s alpha by Peterson (1994) supports the predominant use
of Cronbach‘s alpha as a generalized measure of reliability, based on the review of 832
studies, and suggests that overall the median of .77 was sufficient for most research
purposes. Additionally, as part of the purification of the scale, researchers include the
composite reliability test (Netemeyer et al., 2003). According to Anderson and Gerbing
(1988), as a minimum a value of composite reliability .70 is required. Following the
guidelines of Bagozzi (1981) and Werts et al. (1974), some of the papers reviewed
(Judge et al., 2003; Li et al., 2005; Menor & Roth, 2007) used the composite reliability
test in conjunction with Cronbach‘s alpha; for instance, Li et al. (2005) reported that
two tests were undertaken to establish the reliability of the constructs. Initially,
Cronbach‘s alpha was calculated, and the results showed good reliability, with values
103
ranging from .73 to .93. This was followed by the composite reliability test, for which
all coefficients were greater than .70, indicating good reliability of all the constructs.
Followed the check for internal consistency, the next assessment of the scale is for scale
validity. Carmines and Zeller (1979) state that ―validity is evidenced by the degree that
a particular indicator measures what it is supposed to measure rather than reflecting
some other phenomenon‖ (p.16). A review of the literature indicates that in order to test
the validity of a scale, researchers have used various indicators. One of the first
indicators to be used for scale validity is convergent validity. To assess the convergent
validity of constructs, ―we look at each item in the scale as a different approach to
measure the construct and determine if they are convergent‖ (Li et al., 2005, p.629). In
order to strengthen the validity of the scale further, the second test is the discriminant
validity which― is the extent to which latent variable A discriminates from other latent
variables (e.g., B, C, D)‖ (Farrell, 2010, p. 324).
In addition, other evaluations used by researchers to assess scale validity are
nomological validity (Cadogan et al., 1999; Flynn & Goldsmith, 1999; Menor & Roth,
2007), which― is provided by a construct‘s possession of distinct antecedent causes,
consequential effects, or modifying conditions, and quantitative differences in the
degree to which a construct is related to antecedents or consequences or varies across
conditions in exhibiting consequential effects‖ (Tian et al., 2001, p.58), and criterion-
related validity (Liden & Maslyn, 1998; Yang et al., 2005), which― is at issue when the
purpose is to use an instrument to estimate some important form of the behavior that is
external to the measuring instrument itself‖ (p. 87). However, most of the studies
reviewed reported that the researchers evaluated the constructs using the two main types
of test: convergent and discriminant validity.
The last stage in scale development is the assessment of measurement equivalence or
measurement invariance (ME/I). When a researcher is concerned only with the extent to
which an instrument is equivalent across independent samples ME/I needs to be
assessed. ―ME/I generally focuses solely on the invariant operation of the items and, in
particular, on the factor loadings‖ (Byrne, 2008, p. 873). Generally speaking, there are
six levels of ME/I: configural invariance, metric invariance, scalar invariance, factor
covariance invariance, factor variance invariance, and error variance invariance (Hansen
et al., 2006). According to Horn and McArdle (1992) and Schmitt and Kuijanin (2008),
104
it is rare for all of these tests of ME/I to be performed in studies. The selection of the
type of invariance is based on the particular research objectives. The previous literature
supports the importance of, as a minimum, configural and metric invariance. These are
needed to explore the scale in cross-cultural studies (Runyan et al., 2012; Schmitt &
Kuijanin, 2008; Steenkamp & Baumgartner, 1998; Vandenberg, 2002).
The use of ME/I in studies has recently increased (Deshpandé et al., 2013; Sass et al.,
2014; Story et al., 2015). However, despite numerous calls for the use of ME/I for
measures, it is still rarely assessed by researchers (Netemeyer et al., 1991; Hult et al.,
2008; Schreiber et al., 2006; Vandenberg & Lance, 2000; Watkins, 2010; Yu & Shek,
2014). For instance, in the extensive review conducted by Hult et al. (2008) in the five
top journals in international business, fewer than 20% of the studies assessed ME/I. A
similar result was found from our review: only five studies (21%) reported ME/I.
In the literature on the scale development, researchers from several disciplines have
attempted to analyze the use of ME/I in order to identify best practice and prescribe
recommendations to improve its application (Raykov et al., 2012; Schmitt & Kuijanin,
2008; Sharma & Weathers, 2003; Vandenberg & Lance, 2000). However, some of the
studies that offer guidelines to the sequence of steps for scale development, in different
research areas such as entrepreneurship (Slavec & Drnovšek, 2010), marketing
(Terblanche & Boshoff, 2008), organization (Hinkin, 1995), and counseling psychology
(Worthington & Whittaker, 2006), omitted ME/I in their recommendations. In general,
critical reviews of the literature suggest that ―there is a lack of concern with
measurement invariance in cross-cultural research and tests for such are rarely
presented‖ (Watkins, 2010, p. 702).
3.2.3 The statistical methods
In order to obtain a robust evaluation of the quality of the items, in most of the studies
the statistical methods of exploratory factor analysis (EFA), followed by confirmatory
factor analysis (CFA), were used as part of the scale development process. In general,
researchers use these two statistical methods to assess the constructs of a scale
(Watkins, 2010).
105
3.2.3.1 Exploratory factor analysis
Most of the empirical papers reviewed reported that EFA was carried out during the
initial development of the scale. EFA can help refine a scale through defining the
number of dimensions and evaluating the constructs (Gaskin & Happell, 2014).
Worthington and Whittaker (2006), based on an extensive literature review of scale
development research, showed that there are many decisions confronting users of EFA
such as (a) the selection of the extraction method, (b) the choice of the rotation method,
(c) the number of factor retentions, and (d) item deletion.
Regarding extraction methods, there are two main factor extraction methods reported by
the papers reviewed in the scale development research: principal component analysis
(PCA, seven studies, 30%) and common-factors analysis (principal-axis factoring, four
studies, 17%). Each method has a different purpose; according to Worthington and
Whittaker (2006), ―the PCA aims to reduce the number of the items while retaining as
much of the original item variance as possible‖ (p.818), while principal-axis factoring
shows the underlying dimensions within the facets (Tabachnick & Fidell, 2007).
Therefore, as shown by Velicer and Jackson (1990) and Conway and Huffcutt (2003),
PCA and common-factors analysis often produce similar results; however, most
researchers prefer PCA. A survey of scale development in organizational behavior
conducted by Hinkin (1995), which was based on 277 scales from75 studies, found that
PCA was the most frequently reported extraction method in the papers reviewed.
Related to rotation methods, Costello and Osborne (2011) state that there are two
rotation methods performed by researchers: one is called orthogonal, and produces
factors that are uncorrelated (varimax is a frequently-used example of this method), and
the second is oblique rotation, which allows the factors to be correlated. In our review,
most articles used either the orthogonal method (e.g. Ahire et al., 1996; Reidenbach &
Robin, 1990; Yang et al., 2005) or the oblique rotation method (Antoncic & Hisrich,
2001; Carlson et al., 2006; Liden & Maslyn, 1998; Richins & Dawson, 1992).
Regarding factor retention, DeVellis (2003) pointed out that is difficult to determine
how many factors can be extracted from the data. There are a variety of criteria that may
be selected by researchers for the purpose of factor retention, such as parallel analysis
(Horn, 1965), approximating simple structures (McDonald, 1985), the scree test
(Cattell, 1966), the eigenvalue rule (Kaiser, 1960), and whether the variance explains
106
more than 50-60% (Hair et al., 1998). The most widely used method for selecting the
number of factors to retain during scale development is the eigenvalue rule (DeVellis,
2003; Hinkin, 1995). ―An eigenvalue represents the amount of information captured by
a factor‖ (DeVellis, 2003, p.114). The eigenvalue rule is that factors whose eigenvalues
are less than 1.0 should be eliminated because those factors contain less information
than the items on an average scale (DeVellis, 2003).
Some of the studies reviewed reported the use of a combination of methods for deciding
on the number of factors. For instance, the eigenvalue rule and the extraction of
variance were reported by two studies (Carlson et al., 2006; Ferris et al., 2005), and in
another two studies the eigenvalue rule and the scree plot test were chosen (Liden &
Masly, 1998; Yang et al., 2005). Carlson et al. (2006) purified a scale that measured
work–family enrichment through carrying out EFA with the principal component
method, and used multiple criteria for determining the number of the factors to retain:
those with eigenvalues greater than 1.0 and a variance that explained more than 60%.
As a result of this analysis, they found that the work–family scale is composed of three
factors, with 15 items.
Finally, with regard to item deletion/retention, several criteria for determining item
deletion or retention have been presented in the literature on scale development,
including loadings, cross-loadings, communalities and item analysis (Worthington &
Whittaker 2006). Researchers most frequently report loadings and cross-loadings as
criteria for item deletion (Hinkin, 1995). In our literature review, the studies reported
using loadings and cross-loadings (e.g. Ahire et al., 1996; Bearden et al., 2001; Muylle
et al., 2004; Voss et al., 2003). ―With multiple cross-loadings, items with lower
communalities assisted in determining which items to remove‖ (Leo & Russell-Bennett,
2014, p. 3).
3.2.3.2 Confirmatory factor analysis
CFA has become one of the more commonly-implemented techniques reported by
researchers in scale development literature, in place of the multitrait–multimethod
model (Knight, 1997). The purpose of the analysis is to evaluate the dimensionality and
factor structure of the scale (Fornell & Larcker, 1981; Anderson & Gerbing, 1988).
―This method also provides the fit of the individual items within the specified model
using the modification indices‖ (Hinkin, 1998, p. 114).
107
CFA has been used to test the psychometric properties of measurement scales in a
number of studies, through the goodness-of-fit model with a variety of fit indices
(Bentler & Bonett, 1980; Schreiber et al., 2006). Some common fit indices reported by
researchers in scale development literature are the chi-square statistic for testing the
overall model fit, the incremental fit indices detailed in Appendix 5 (the Normed Fit
Index (NFI), the Tucker-Lewis Index (TLI), and the Comparative Fit Index (CFI)), and
the absolute fit indices(the Goodness-of-Fit Index (GFI), the Adjusted Goodness-of-Fit
Index (AGFI), the Root Mean Square Residual (RMR), the Standardized Root Mean
Square Residual (SRMR) and the Root Mean Square Error of Approximation
(RMSEA))(Byrne, 2001; Kline, 2005; Worthington & Whittaker, 2006). In our review,
most of the studies reported using some of these indices (twenty studies, 87%).
In studies of scale development, there are different preferences with regard to which
indices should be reported. For instance, in a review by Schreiber et al. (2006) it was
found that the most commonly reported fit indices are the CFI, the TLI, and the
RMSEA. Boomsma (2000) and Kline (2005) suggested the chi-square test, the RMSEA,
the CFI and the SRMR. The threshold values for acceptable fit are less than .80 for the
RMSEA and the SRMR, and more than .90 for the CFI and the TLI (Bentler & Bonett,
1980).
CFA also offers multi-group analysis (MGCFA) to assess the measurement invariance
of scales for various levels of invariance (Jöreskog & Sörbom, 1999). Byrne (2001)
recommended that ―researchers assess the parameters most commonly of interest in
answering questions related to multi-group equivalence: (a) factor loadings, (b) factor
covariances, and (c) structural regression paths‖ (p. 199). According to Akoto (2014),
certain fit indices that are often recommended for testing the fit of the MGCFA are the
chi-square test, the RMSEA and the CFI. In our review, similar fit statistics were
reported by Carlson et al. (2006) when testing the ME/I in the work–family enriched
scale. However, in addition to the chi-square test, the RMSEA and the CFI, other
studies include other fit indices such the AGFI (Dabholkar et al., 1996), the GFI, the
TLI (Netemeyer et al., 1996), and the NFI (Voss et al., 2003).
In summary, we will adopt the suggested stages and the reviewed research techniques in
the validation of the scale for measuring OIM. Thus, we will perform the statistical
analyses EFA, CFA and MGCFA on the OIM scale.
108
3.3 RESEARCH METHODOLOGY
3.3.1 Research context
A cross-country study was chosen as the research approach of this chapter because it is
the most appropriate for a scale validation process (Horn & McArdle, 1992). As a
consequence, it was necessary to establish the invariance of the proposed scale, so we
had to test whether the measurement instrument was equivalent across different samples
(Byrne, 2008). This approach is one of the ways in which this research gives added
value, because within the literature on BG firms there is a special call for performing
research across countries; in existing studies such research has been limited and scarce
(Jones et al., 2011). As pointed out by Cannone and Ughetto (2014), most of the
research on BG firms has been performed in a single country (e.g. Sepulveda &
Gabrielsson, 2013), and the few attempts to compare several contexts have mainly
followed a qualitative approach (e.g. Moen, 2002).
European countries were selected as the research context because they are the location
for the core of the research into BG firms (Cesinger et al., 2012; Peiris et al., 2012). We
carried out our analysis by studying firms from Denmark, Finland and Spain. This
number of countries is seen as acceptable by Franke and Richey (2010): ―There is no
mandatory number of settings to examine for useful research findings. A study of two or
three countries may provide important insights and stimulate a stream of future
research‖ (p.1289). Following the recommendation of Malhotra et al. (1996), the choice
of Spanish and Nordic small firms as the subject of this chapter was made because these
companies are culturally and economically very different from each other. However,
these European countries are alike in having firms that show rapid internationalization
(Cesinger et al., 2012). Moreover, these countries allowed us to interpret our findings in
a more context-sensitive way.
3.3.2 Data collection and sample
The sample for developing this project, as mentioned earlier, produced information
from three countries: Denmark, Finland and Spain. The web-based survey instrument,
along with the initial covering letter, is presented in Appendix 9 (Spanish version) and
Appendix 10 (English version).
We collected the names and contact information for international firms from different
databases: Danish BG firms (a database developed from previous studies conducted by
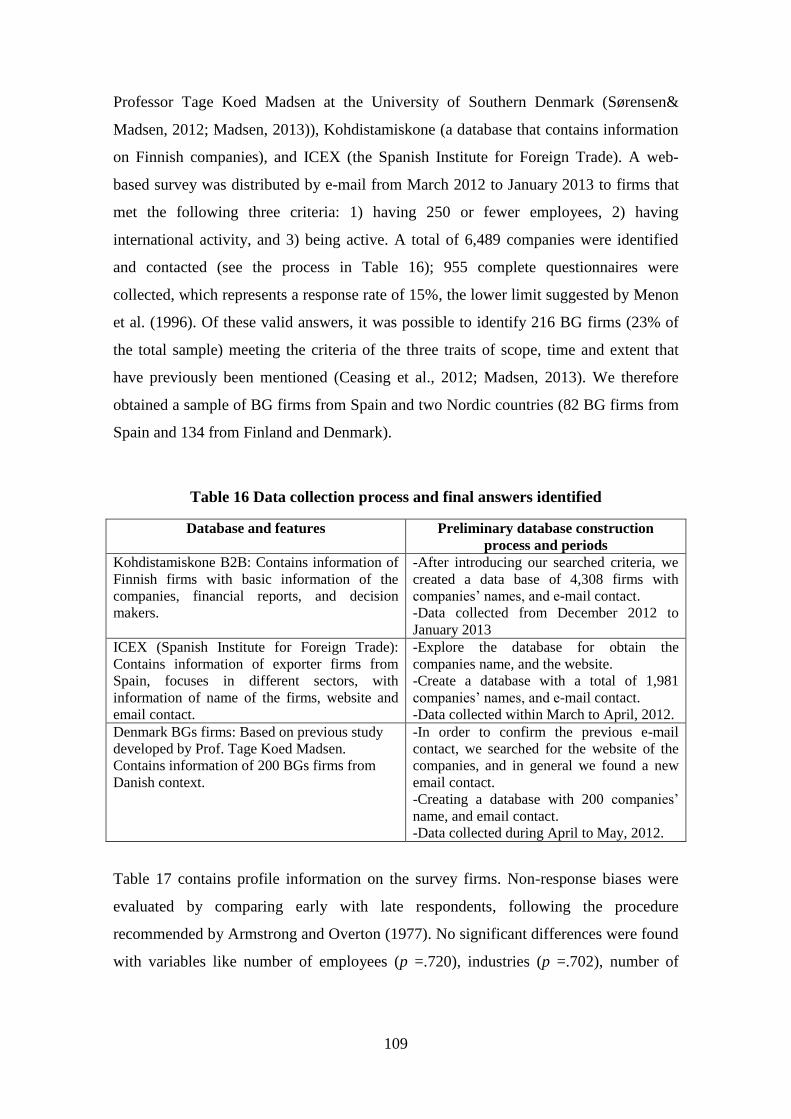
109
Professor Tage Koed Madsen at the University of Southern Denmark (Sørensen&
Madsen, 2012; Madsen, 2013)), Kohdistamiskone (a database that contains information
on Finnish companies), and ICEX (the Spanish Institute for Foreign Trade). A web-
based survey was distributed by e-mail from March 2012 to January 2013 to firms that
met the following three criteria: 1) having 250 or fewer employees, 2) having
international activity, and 3) being active. A total of 6,489 companies were identified
and contacted (see the process in Table 16); 955 complete questionnaires were
collected, which represents a response rate of 15%, the lower limit suggested by Menon
et al. (1996). Of these valid answers, it was possible to identify 216 BG firms (23% of
the total sample) meeting the criteria of the three traits of scope, time and extent that
have previously been mentioned (Ceasing et al., 2012; Madsen, 2013). We therefore
obtained a sample of BG firms from Spain and two Nordic countries (82 BG firms from
Spain and 134 from Finland and Denmark).
Table 16 Data collection process and final answers identified
Database and features Preliminary database construction
process and periods
Kohdistamiskone B2B: Contains information of
Finnish firms with basic information of the
companies, financial reports, and decision
makers.
-After introducing our searched criteria, we
created a data base of 4,308 firms with
companies‘ names, and e-mail contact.
-Data collected from December 2012 to
January 2013
ICEX (Spanish Institute for Foreign Trade):
Contains information of exporter firms from
Spain, focuses in different sectors, with
information of name of the firms, website and
email contact.
-Explore the database for obtain the
companies name, and the website.
-Create a database with a total of 1,981
companies‘ names, and e-mail contact.
-Data collected within March to April, 2012.
Denmark BGs firms: Based on previous study
developed by Prof. Tage Koed Madsen.
Contains information of 200 BGs firms from
Danish context.
-In order to confirm the previous e-mail
contact, we searched for the website of the
companies, and in general we found a new
email contact.
-Creating a database with 200 companies‘
name, and email contact.
-Data collected during April to May, 2012.
Table 17 contains profile information on the survey firms. Non-response biases were
evaluated by comparing early with late respondents, following the procedure
recommended by Armstrong and Overton (1977). No significant differences were found
with variables like number of employees (p =.720), industries (p =.702), number of
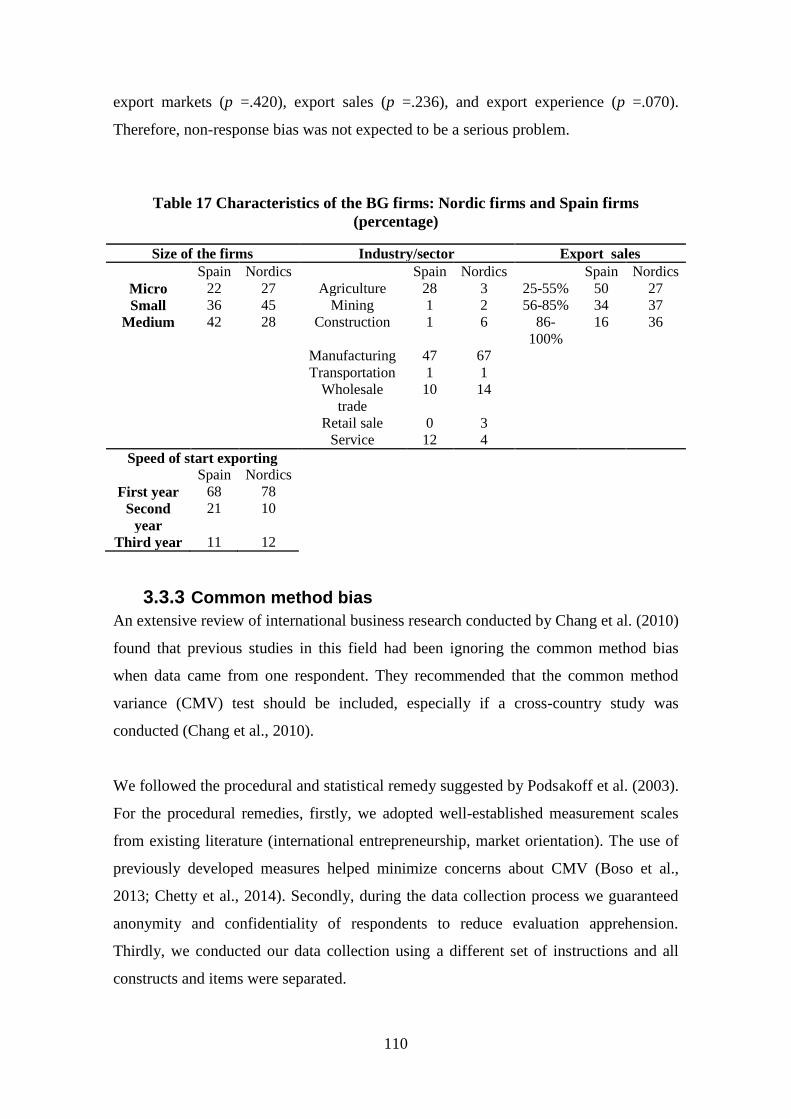
110
export markets (p =.420), export sales (p =.236), and export experience (p =.070).
Therefore, non-response bias was not expected to be a serious problem.
Table 17 Characteristics of the BG firms: Nordic firms and Spain firms
(percentage)
Size of the firms Industry/sector Export sales
Spain Nordics Spain Nordics Spain Nordics
Micro 22 27 Agriculture 28 3 25-55% 50 27
Small 36 45 Mining 1 2 56-85% 34 37
Medium 42 28 Construction 1 6 86-
100%
16 36
Manufacturing 47 67
Transportation 1 1
Wholesale
trade
10 14
Retail sale 0 3
Service 12 4
Speed of start exporting
Spain Nordics
First year 68 78
Second
year
21 10
Third year 11 12
3.3.3 Common method bias
An extensive review of international business research conducted by Chang et al. (2010)
found that previous studies in this field had been ignoring the common method bias
when data came from one respondent. They recommended that the common method
variance (CMV) test should be included, especially if a cross-country study was
conducted (Chang et al., 2010).
We followed the procedural and statistical remedy suggested by Podsakoff et al. (2003).
For the procedural remedies, firstly, we adopted well-established measurement scales
from existing literature (international entrepreneurship, market orientation). The use of
previously developed measures helped minimize concerns about CMV (Boso et al.,
2013; Chetty et al., 2014). Secondly, during the data collection process we guaranteed
anonymity and confidentiality of respondents to reduce evaluation apprehension.
Thirdly, we conducted our data collection using a different set of instructions and all
constructs and items were separated.
111
From a statistical point of view, we examined the possibility of CMV using Harman‘s
single-factor test (Podsakoff et al., 2003). We conducted the factor analysis in both
samples to determine whether the majority of the variance was concentrated in one
factor (Podsakoff & Organ, 1986). The factor analysis for the Spanish BG firms resulted
in 6 factors with eigenvalue greater than 1 (accounting for 68.36% of the total variance),
and the first factor accounted for 36.29% of the variance. The factor analysis for the
Nordic BG firms resulted in 5 factors with eigenvalue greater than 1 (accounting for
62.27% of the total variance), and the first factor accounted for 32.20% of the variance.
Thus, CMV was not a significant concern in this study.
3.3.4 SCALE DEVELOPMENT
The development of an integrated measurement model for OIM is based on a multi-
stage research design that is outlined in figure 8 and follows the psychometric
measurement theory (Churchill, 1979; Gerbing & Andesson, 1998) that includes
qualitative and quantitative research.
Before the quantitative analysis of OIM within the context of BG firms, an initial
qualitative stage was needed to provide an initial list of the scale items related to the
different components and subcomponents of the OIM scale (this is the content of
chapter two).
As noted by Churchill (1979), researchers are strongly recommended to use a multiple
item scale instead of a single item scale, in order to increase reliability and decrease
measurement error. Consistent with the scaling literature, multiple items were
developed for each dimension.
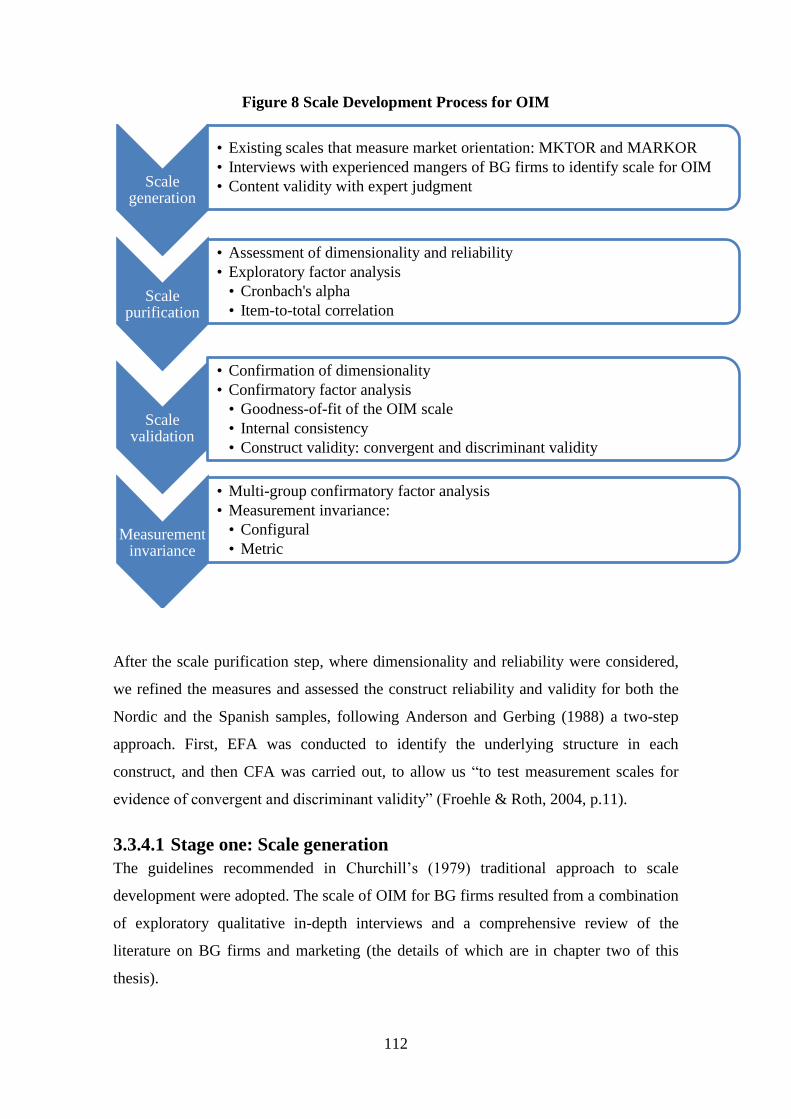
112
Figure 8 Scale Development Process for OIM
After the scale purification step, where dimensionality and reliability were considered,
we refined the measures and assessed the construct reliability and validity for both the
Nordic and the Spanish samples, following Anderson and Gerbing (1988) a two-step
approach. First, EFA was conducted to identify the underlying structure in each
construct, and then CFA was carried out, to allow us ―to test measurement scales for
evidence of convergent and discriminant validity‖ (Froehle & Roth, 2004, p.11).
3.3.4.1 Stage one: Scale generation
The guidelines recommended in Churchill‘s (1979) traditional approach to scale
development were adopted. The scale of OIM for BG firms resulted from a combination
of exploratory qualitative in-depth interviews and a comprehensive review of the
literature on BG firms and marketing (the details of which are in chapter two of this
thesis).
Scale generation
• Existing scales that measure market orientation: MKTOR and MARKOR
• Interviews with experienced mangers of BG firms to identify scale for OIM
• Content validity with expert judgment
Scale purification
• Assessment of dimensionality and reliability
• Exploratory factor analysis
• Cronbach's alpha
• Item-to-total correlation
Scale validation
• Confirmation of dimensionality
• Confirmatory factor analysis
• Goodness-of-fit of the OIM scale
• Internal consistency
• Construct validity: convergent and discriminant validity
Measurement invariance
• Multi-group confirmatory factor analysis
• Measurement invariance:
• Configural
• Metric
113
The five proposed dimensions were based on previously validated scales. This
facilitated the establishment of the content validity of the instrument. Additionally, to
ensure the content validity of the measures, an in-depth analysis of the measures was
performed by ten managers and two academic experts who were familiar with the topic
under investigation, with the aim of refining the instructions, the format, and the
wording of the items (DeVellis, 2003). After feedback from the academics and
practitioners, the final dimensions of the scale for OIM were modeled as a reflective
second-order construct (the selection of a reflective construct is supported in section
3.3.4.3 below) with five reflective first-order dimensions: customer orientation (CuO,
with 7 items), competitor orientation (CO, with 4 items), interfunctional coordination
(IC, with 4 items), innovativeness and technological capability (ITC, with 5 items) and
influence of networks (NW, with 3 items). Appendix 6 presents a final list of the 23
items remaining in the questionnaire, which will be measured using a 7-point Likert
scale ranging from 1 (―strongly disagree‖) to 7 (―strongly agree‖).
3.3.4.2 Stage two: Scale purification
As previously mentioned, following the guidelines on scale validation, we assessed the
unidimensionality of the constructs and the reliability of the scale (Gerbing &
Anderson, 1988). To purify the measurement scale for OIM, the total sample of BG
firms was split into two subsamples: Spanish BG firms and Nordic BG firms (DeVellis,
2003).
As recommended by Pallant (2001), Bartlett‘s Test of Sphericity and KMO were
performed on the data prior to factor extraction, to ensure that the characteristics of the
data set were suitable for the factor analysis to be conducted. Table 18 reports that
Bartlett‘s Test of Sphericity is significant (p<.05) in both samples, and the value of the
KMO index is above .50 (Kaiser, 1960). Our results suggest that the data satisfies the
psychometric criteria for EFA to be performed.
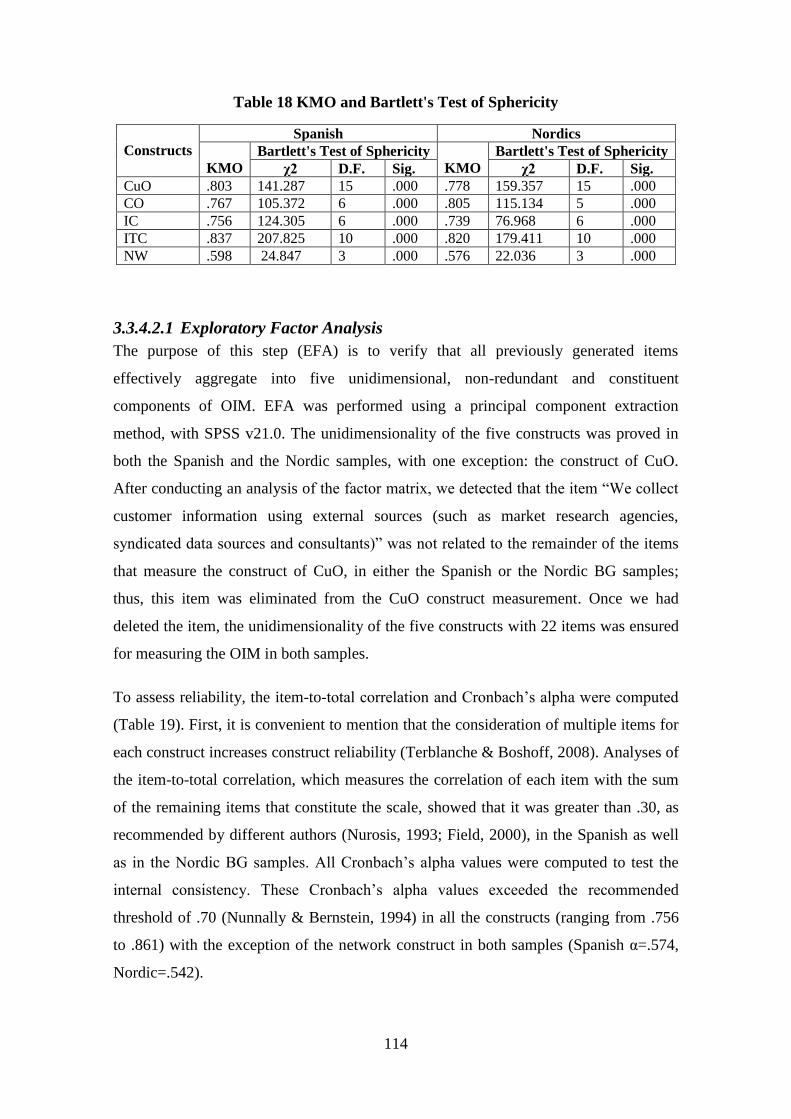
114
Table 18 KMO and Bartlett's Test of Sphericity
Constructs
Spanish Nordics
KMO
Bartlett's Test of Sphericity
KMO
Bartlett's Test of Sphericity
χ2 D.F. Sig. χ2 D.F. Sig.
CuO .803 141.287 15 .000 .778 159.357 15 .000
CO .767 105.372 6 .000 .805 115.134 5 .000
IC .756 124.305 6 .000 .739 76.968 6 .000
ITC .837 207.825 10 .000 .820 179.411 10 .000
NW .598 24.847 3 .000 .576 22.036 3 .000
3.3.4.2.1 Exploratory Factor Analysis
The purpose of this step (EFA) is to verify that all previously generated items
effectively aggregate into five unidimensional, non-redundant and constituent
components of OIM. EFA was performed using a principal component extraction
method, with SPSS v21.0. The unidimensionality of the five constructs was proved in
both the Spanish and the Nordic samples, with one exception: the construct of CuO.
After conducting an analysis of the factor matrix, we detected that the item ―We collect
customer information using external sources (such as market research agencies,
syndicated data sources and consultants)‖ was not related to the remainder of the items
that measure the construct of CuO, in either the Spanish or the Nordic BG samples;
thus, this item was eliminated from the CuO construct measurement. Once we had
deleted the item, the unidimensionality of the five constructs with 22 items was ensured
for measuring the OIM in both samples.
To assess reliability, the item-to-total correlation and Cronbach‘s alpha were computed
(Table 19). First, it is convenient to mention that the consideration of multiple items for
each construct increases construct reliability (Terblanche & Boshoff, 2008). Analyses of
the item-to-total correlation, which measures the correlation of each item with the sum
of the remaining items that constitute the scale, showed that it was greater than .30, as
recommended by different authors (Nurosis, 1993; Field, 2000), in the Spanish as well
as in the Nordic BG samples. All Cronbach‘s alpha values were computed to test the
internal consistency. These Cronbach‘s alpha values exceeded the recommended
threshold of .70 (Nunnally & Bernstein, 1994) in all the constructs (ranging from .756
to .861) with the exception of the network construct in both samples (Spanish α=.574,
Nordic=.542).

115
In assessing the EFA, we ensured that all the items exceeded the required factor loading
of .50 and that the dimensions exceeded 50% of the explained variance with eigenvalues
≥1.0 (Hair et al., 2006).
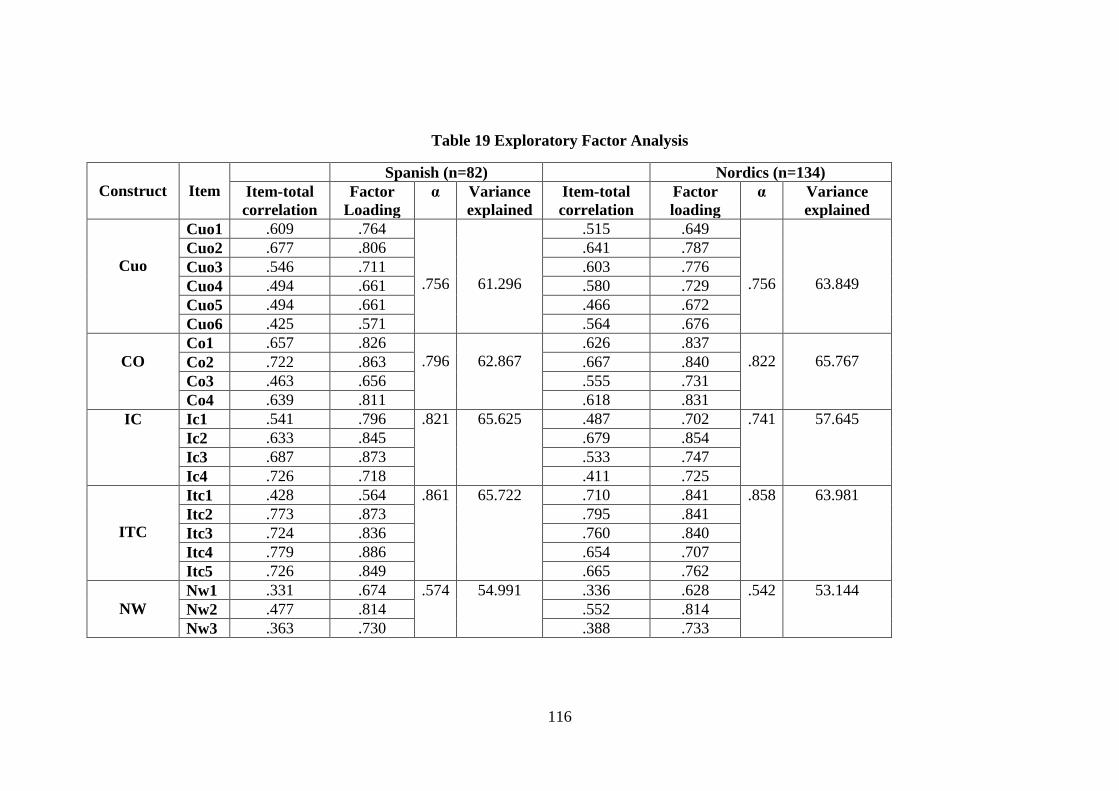
116
Table 19 Exploratory Factor Analysis
Construct
Item
Spanish (n=82) Nordics (n=134)
Item-total
correlation
Factor
Loading
α Variance
explained
Item-total
correlation
Factor
loading
α Variance
explained
Cuo
Cuo1 .609 .764
.756
61.296
.515 .649
.756
63.849
Cuo2 .677 .806 .641 .787
Cuo3 .546 .711 .603 .776
Cuo4 .494 .661 .580 .729
Cuo5 .494 .661 .466 .672
Cuo6 .425 .571 .564 .676
CO
Co1 .657 .826
.796
62.867
.626 .837
.822
65.767 Co2 .722 .863 .667 .840
Co3 .463 .656 .555 .731
Co4 .639 .811 .618 .831
IC Ic1 .541 .796 .821 65.625 .487 .702 .741 57.645
Ic2 .633 .845 .679 .854
Ic3 .687 .873 .533 .747
Ic4 .726 .718 .411 .725
ITC
Itc1 .428 .564 .861 65.722 .710 .841 .858 63.981
Itc2 .773 .873 .795 .841
Itc3 .724 .836 .760 .840
Itc4 .779 .886 .654 .707
Itc5 .726 .849 .665 .762
NW
Nw1 .331 .674 .574 54.991 .336 .628 .542 53.144
Nw2 .477 .814 .552 .814
Nw3 .363 .730 .388 .733
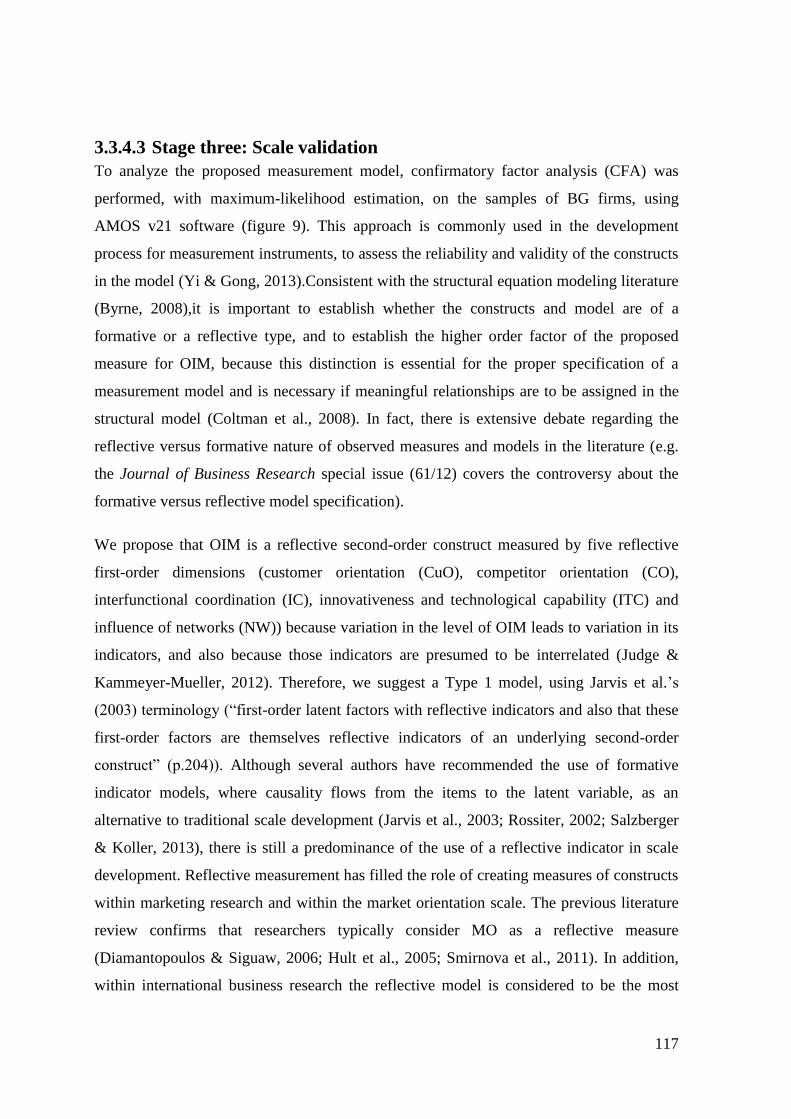
117
3.3.4.3 Stage three: Scale validation
To analyze the proposed measurement model, confirmatory factor analysis (CFA) was
performed, with maximum-likelihood estimation, on the samples of BG firms, using
AMOS v21 software (figure 9). This approach is commonly used in the development
process for measurement instruments, to assess the reliability and validity of the constructs
in the model (Yi & Gong, 2013).Consistent with the structural equation modeling literature
(Byrne, 2008),it is important to establish whether the constructs and model are of a
formative or a reflective type, and to establish the higher order factor of the proposed
measure for OIM, because this distinction is essential for the proper specification of a
measurement model and is necessary if meaningful relationships are to be assigned in the
structural model (Coltman et al., 2008). In fact, there is extensive debate regarding the
reflective versus formative nature of observed measures and models in the literature (e.g.
the Journal of Business Research special issue (61/12) covers the controversy about the
formative versus reflective model specification).
We propose that OIM is a reflective second-order construct measured by five reflective
first-order dimensions (customer orientation (CuO), competitor orientation (CO),
interfunctional coordination (IC), innovativeness and technological capability (ITC) and
influence of networks (NW)) because variation in the level of OIM leads to variation in its
indicators, and also because those indicators are presumed to be interrelated (Judge &
Kammeyer-Mueller, 2012). Therefore, we suggest a Type 1 model, using Jarvis et al.‘s
(2003) terminology (―first-order latent factors with reflective indicators and also that these
first-order factors are themselves reflective indicators of an underlying second-order
construct‖ (p.204)). Although several authors have recommended the use of formative
indicator models, where causality flows from the items to the latent variable, as an
alternative to traditional scale development (Jarvis et al., 2003; Rossiter, 2002; Salzberger
& Koller, 2013), there is still a predominance of the use of a reflective indicator in scale
development. Reflective measurement has filled the role of creating measures of constructs
within marketing research and within the market orientation scale. The previous literature
review confirms that researchers typically consider MO as a reflective measure
(Diamantopoulos & Siguaw, 2006; Hult et al., 2005; Smirnova et al., 2011). In addition,
within international business research the reflective model is considered to be the most
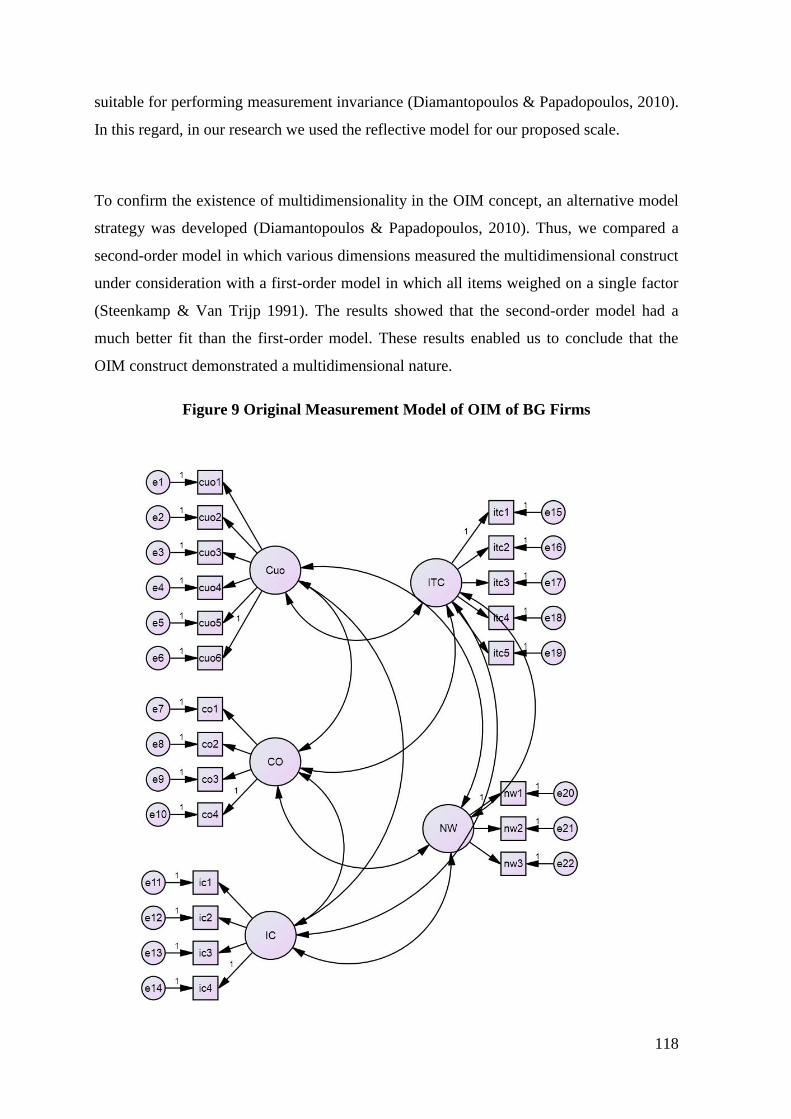
118
suitable for performing measurement invariance (Diamantopoulos & Papadopoulos, 2010).
In this regard, in our research we used the reflective model for our proposed scale.
To confirm the existence of multidimensionality in the OIM concept, an alternative model
strategy was developed (Diamantopoulos & Papadopoulos, 2010). Thus, we compared a
second-order model in which various dimensions measured the multidimensional construct
under consideration with a first-order model in which all items weighed on a single factor
(Steenkamp & Van Trijp 1991). The results showed that the second-order model had a
much better fit than the first-order model. These results enabled us to conclude that the
OIM construct demonstrated a multidimensional nature.
Figure 9 Original Measurement Model of OIM of BG Firms
119
3.3.4.3.1 Measurement model
The normality assumption for the data was assessed prior to conducting the analysis
(Kaplan, 2009). Skewness (<±3) and Kurtosis (<±10) tests were conducted for each item
(Kline, 1986). The results do not support the normality assumption in the two BG firms
samples. Furthermore, for various items, the critical values exceeded +2 or -2, and
therefore the results revealed the non-normal distribution of the data. One method to
correct for non-normality is to use the Bollen-Stine p-value rather than the usual maximum
likelihood-based p-value to assess the overall model fit. Furthermore, the bootstrapping
method (1,000 subsamples) was utilized to produce parameter estimates, standard errors,
and p-values (Efron & Gong, 1983).
The scale refinement process followed the multiple decision rules proposed by Jöreskog
and Sörbom (1993): (a) weak convergence requiring the elimination of indicators that did
not have a significant factorial regression coefficient for Student‘s t distribution of at least
2.58 (p = 0.01); (b) strong convergence forcing the elimination of those indicators that
were not substantial, i.e., those whose standardized coefficient (λ) was less than .50; and
(c) a selective elimination of indicators that least contributed to the explanation of the
model, given the cut-off point of R2
less than .3. Following all these recommendations, we
eliminated three items from the CuO scale (CuO4, CuO5 and CuO6), two items from the
CO scale (CO3 and CO5), one item from ITC (ITC1) and the construct NW. We would
like to point out that the elimination of this construct was unexpected because the
literature, from our perspective, provides arguments that justify its consideration as a
component of the orientation towards international markets (as we have mentioned in the
previous chapter, there is research showing how networks are factors that heavily influence
the internationalization process of BG firms (Sharma & Blomstermo 2003; Gabrielsson et
al., 2004; Kocak & Abimbola 2009)). As we mention in the discussion section, we believe
that more research is needed on this construct, especially regarding the items that could be
used for measuring it. The 13 retained items are a parsimonious way of capturing OIM,
and were used for the final measurement model in all the subsequent analyses.
A series of CFAs were conducted in AMOS v21 to assess the psychometric properties of
the scale and identify the optimal model. First, CFA was performed on the entire sample of
216 firms. Subsequently two additional separate CFAs were performed on the two sub-
samples: the 82 Spanish firms and the 134 Nordic firms. The overall Bollen-Stine
bootstrap results indicate a good fit in all three models (p=0.347 in the entire sample;
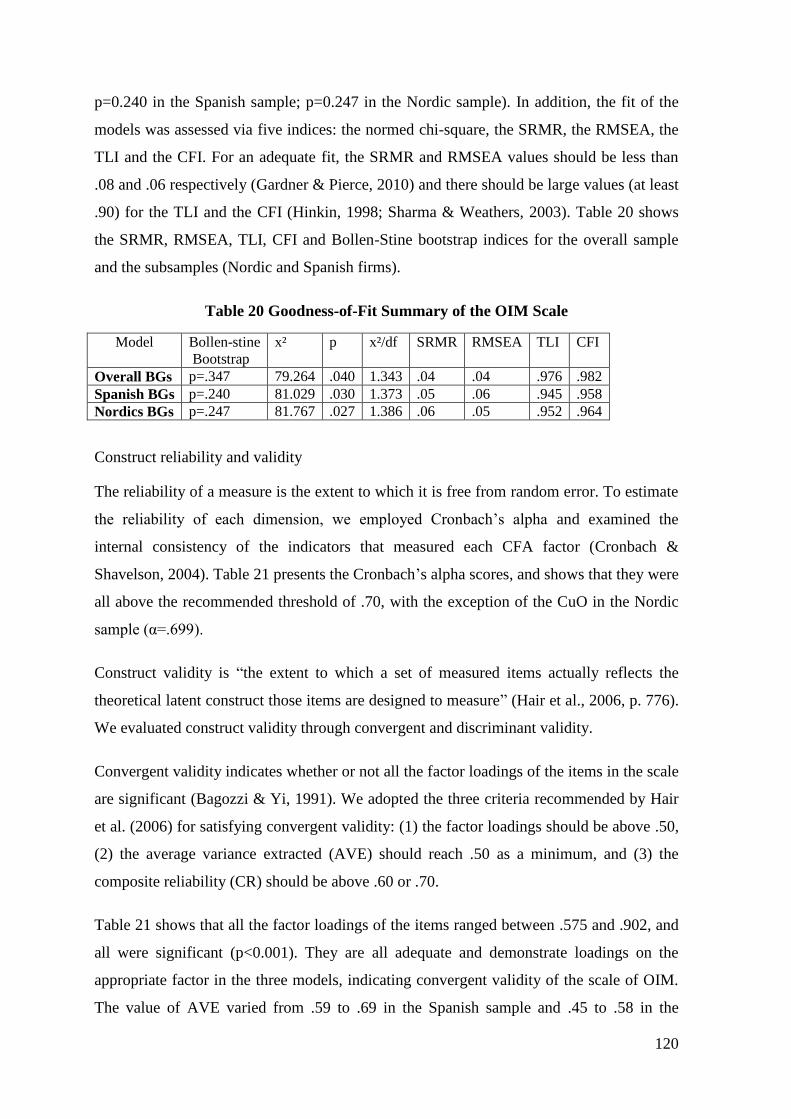
120
p=0.240 in the Spanish sample; p=0.247 in the Nordic sample). In addition, the fit of the
models was assessed via five indices: the normed chi-square, the SRMR, the RMSEA, the
TLI and the CFI. For an adequate fit, the SRMR and RMSEA values should be less than
.08 and .06 respectively (Gardner & Pierce, 2010) and there should be large values (at least
.90) for the TLI and the CFI (Hinkin, 1998; Sharma & Weathers, 2003). Table 20 shows
the SRMR, RMSEA, TLI, CFI and Bollen-Stine bootstrap indices for the overall sample
and the subsamples (Nordic and Spanish firms).
Table 20 Goodness-of-Fit Summary of the OIM Scale
Model Bollen-stine
Bootstrap
x² p x²/df SRMR RMSEA TLI CFI
Overall BGs p=.347 79.264 .040 1.343 .04 .04 .976 .982
Spanish BGs p=.240 81.029 .030 1.373 .05 .06 .945 .958
Nordics BGs p=.247 81.767 .027 1.386 .06 .05 .952 .964
Construct reliability and validity
The reliability of a measure is the extent to which it is free from random error. To estimate
the reliability of each dimension, we employed Cronbach‘s alpha and examined the
internal consistency of the indicators that measured each CFA factor (Cronbach &
Shavelson, 2004). Table 21 presents the Cronbach‘s alpha scores, and shows that they were
all above the recommended threshold of .70, with the exception of the CuO in the Nordic
sample (α=.699).
Construct validity is ―the extent to which a set of measured items actually reflects the
theoretical latent construct those items are designed to measure‖ (Hair et al., 2006, p. 776).
We evaluated construct validity through convergent and discriminant validity.
Convergent validity indicates whether or not all the factor loadings of the items in the scale
are significant (Bagozzi & Yi, 1991). We adopted the three criteria recommended by Hair
et al. (2006) for satisfying convergent validity: (1) the factor loadings should be above .50,
(2) the average variance extracted (AVE) should reach .50 as a minimum, and (3) the
composite reliability (CR) should be above .60 or .70.
Table 21 shows that all the factor loadings of the items ranged between .575 and .902, and
all were significant (p<0.001). They are all adequate and demonstrate loadings on the
appropriate factor in the three models, indicating convergent validity of the scale of OIM.
The value of AVE varied from .59 to .69 in the Spanish sample and .45 to .58 in the
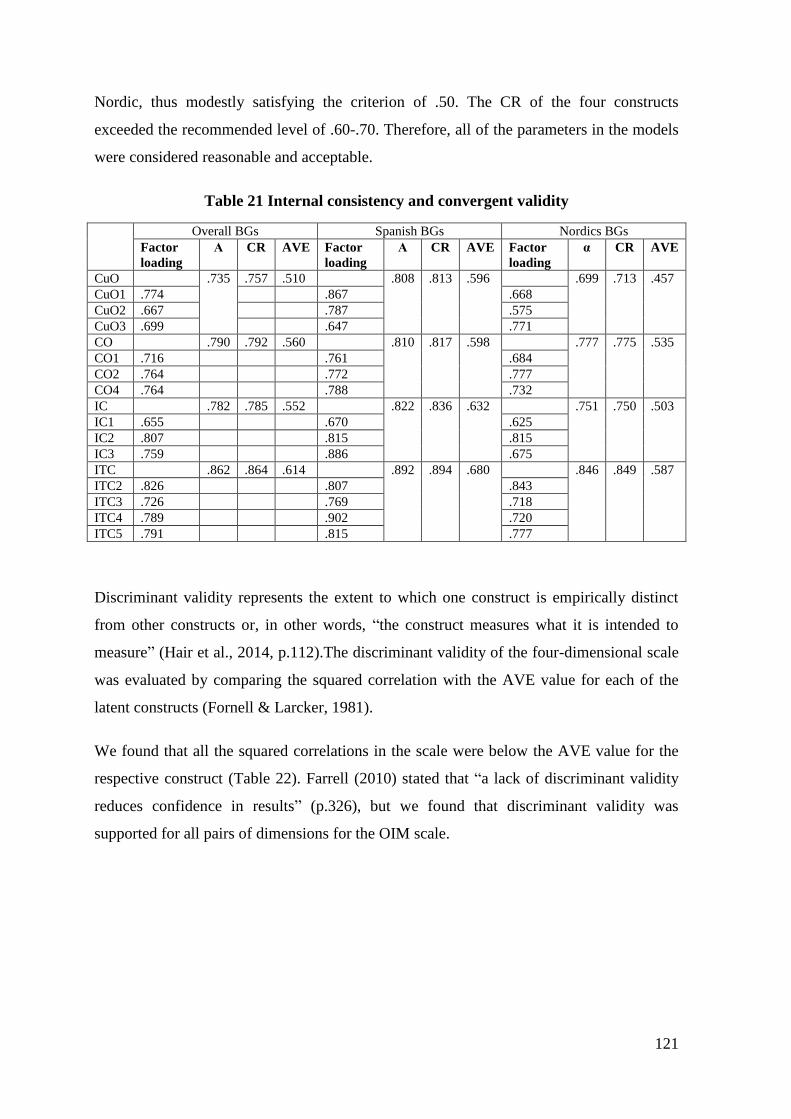
121
Nordic, thus modestly satisfying the criterion of .50. The CR of the four constructs
exceeded the recommended level of .60-.70. Therefore, all of the parameters in the models
were considered reasonable and acceptable.
Table 21 Internal consistency and convergent validity
Overall BGs Spanish BGs Nordics BGs
Factor
loading
Α CR AVE Factor
loading
Α CR AVE Factor
loading
α CR AVE
CuO .735 .757 .510 .808 .813 .596 .699 .713 .457
CuO1 .774 .867 .668
CuO2 .667 .787 .575
CuO3 .699 .647 .771
CO .790 .792 .560 .810 .817 .598 .777 .775 .535
CO1 .716 .761 .684
CO2 .764 .772 .777
CO4 .764 .788 .732
IC .782 .785 .552 .822 .836 .632 .751 .750 .503
IC1 .655 .670 .625
IC2 .807 .815 .815
IC3 .759 .886 .675
ITC .862 .864 .614 .892 .894 .680 .846 .849 .587
ITC2 .826 .807 .843
ITC3 .726 .769 .718
ITC4 .789 .902 .720
ITC5 .791 .815 .777
Discriminant validity represents the extent to which one construct is empirically distinct
from other constructs or, in other words, ―the construct measures what it is intended to
measure‖ (Hair et al., 2014, p.112).The discriminant validity of the four-dimensional scale
was evaluated by comparing the squared correlation with the AVE value for each of the
latent constructs (Fornell & Larcker, 1981).
We found that all the squared correlations in the scale were below the AVE value for the
respective construct (Table 22). Farrell (2010) stated that ―a lack of discriminant validity
reduces confidence in results‖ (p.326), but we found that discriminant validity was
supported for all pairs of dimensions for the OIM scale.
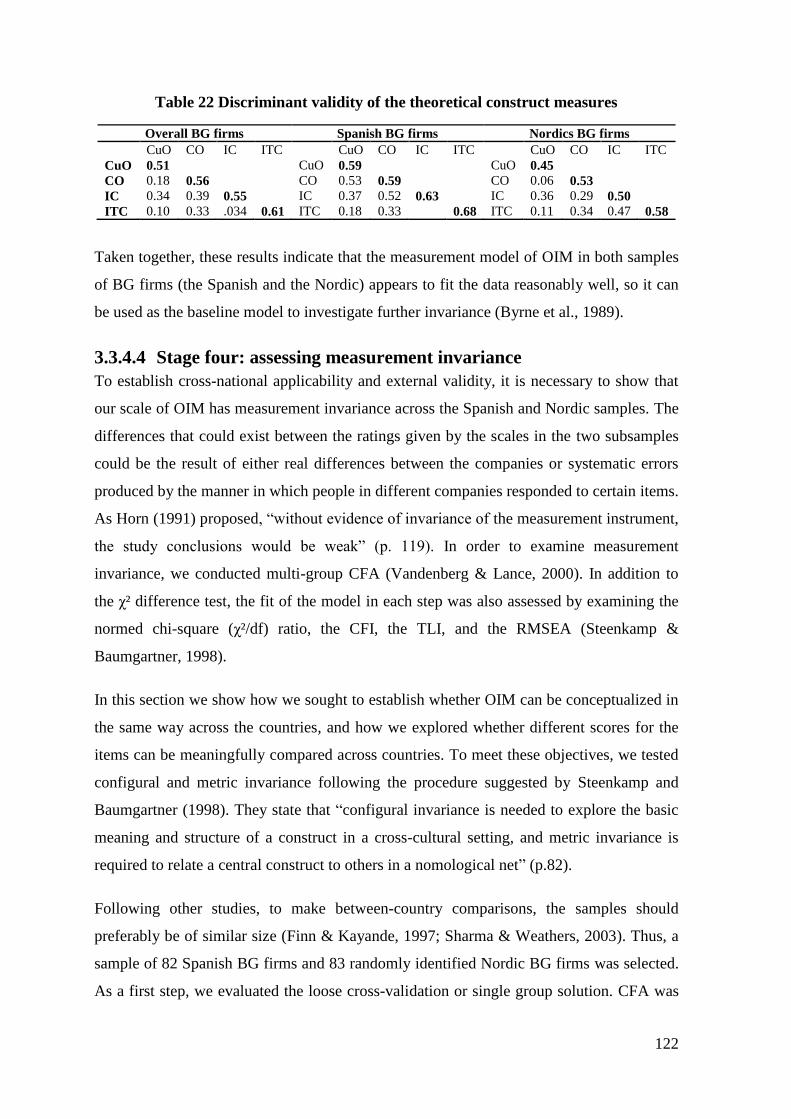
122
Table 22 Discriminant validity of the theoretical construct measures
Overall BG firms Spanish BG firms Nordics BG firms
CuO CO IC ITC CuO CO IC ITC CuO CO IC ITC
CuO 0.51 CuO 0.59 CuO 0.45
CO 0.18 0.56 CO 0.53 0.59 CO 0.06 0.53
IC 0.34 0.39 0.55 IC 0.37 0.52 0.63 IC 0.36 0.29 0.50
ITC 0.10 0.33 .034 0.61 ITC 0.18 0.33 0.68 ITC 0.11 0.34 0.47 0.58
Taken together, these results indicate that the measurement model of OIM in both samples
of BG firms (the Spanish and the Nordic) appears to fit the data reasonably well, so it can
be used as the baseline model to investigate further invariance (Byrne et al., 1989).
3.3.4.4 Stage four: assessing measurement invariance
To establish cross-national applicability and external validity, it is necessary to show that
our scale of OIM has measurement invariance across the Spanish and Nordic samples. The
differences that could exist between the ratings given by the scales in the two subsamples
could be the result of either real differences between the companies or systematic errors
produced by the manner in which people in different companies responded to certain items.
As Horn (1991) proposed, ―without evidence of invariance of the measurement instrument,
the study conclusions would be weak‖ (p. 119). In order to examine measurement
invariance, we conducted multi-group CFA (Vandenberg & Lance, 2000). In addition to
the χ² difference test, the fit of the model in each step was also assessed by examining the
normed chi-square (χ²/df) ratio, the CFI, the TLI, and the RMSEA (Steenkamp &
Baumgartner, 1998).
In this section we show how we sought to establish whether OIM can be conceptualized in
the same way across the countries, and how we explored whether different scores for the
items can be meaningfully compared across countries. To meet these objectives, we tested
configural and metric invariance following the procedure suggested by Steenkamp and
Baumgartner (1998). They state that ―configural invariance is needed to explore the basic
meaning and structure of a construct in a cross-cultural setting, and metric invariance is
required to relate a central construct to others in a nomological net‖ (p.82).
Following other studies, to make between-country comparisons, the samples should
preferably be of similar size (Finn & Kayande, 1997; Sharma & Weathers, 2003). Thus, a
sample of 82 Spanish BG firms and 83 randomly identified Nordic BG firms was selected.
As a first step, we evaluated the loose cross-validation or single group solution. CFA was
123
conducted to assess the fit across each group (a good fit in both samples is required).
Scholars have addressed the importance of conducting single-group analysis prior to multi-
group comparisons (Brown, 2006; Freitag & Bauer, 2013). As Table 23 shows, the results
indicated that the measurement model in both groups appeared to fit the data well, so it
could be used to investigate further invariance (Byrne et al., 1989).
The next step in establishing invariance across Spanish and Nordic firms was to test
configural invariance. Configural invariance examines whether the items comprising the
measurement instrument exhibit the same configuration of factor loadings across the
countries (Steenkamp & Baumgartner, 1998, p.80). The four-factor measurement model
established above was now examined using multi-group analysis to test the validity of the
factor structure across the two group-countries simultaneously. In other words, the model
was estimated simultaneously in the two groups. This model serves as a basis for
determining whether the restrictions that are incorporated affect the adjustment negatively.
The fit of the configural invariance model was satisfactory. As shown in Table 23, all the
fit indices were within acceptable ranges (χ2=176.22,χ
2/df=1.49, p=.01, TLI=.92, CFI=.94,
RMSEA=.05), indicating that the same factor structure was found for the two samples. We
observe how the chi-square value and the degrees of freedom are the sum of the two
previous values (see Table 23), and although they remain significant, the remainder of the
indicators show that it is reasonable to assume the same factorial structure in both samples.
Once configural invariance had been established, metric invariance could be tested. Metric
invariance examines whether the factor loadings are the same for each scale item across
samples. In other words, we ensured that the concepts had been measured in the same way
in both cases. We tested metric invariance by constraining the factor loadings of the
baseline model to be the same across sample splits. As the results show,
χ2=192.32,χ
2/DF=1.51, p=.01, TLI=.91, CFI=.93, and RMSEA=.05. Thus, it is necessary
to compare the chi-square value from the second (equal form) and third (equal factor
loadings) steps to verify that the fit of the new model is not significantly worse. As
recommended by Byrne (2001), based on results of the chi-square test for the difference
between the models of OIM, we found that the measurement model for the Spanish and
Nordic BG firms had no significant differences (∆χ2=16.10, ∆DF=9, p = 0.065). Thus, we
can conclude that imposing restrictions on the equality of factorial loadings does not
significantly and negatively influence the fit. Based on these results, it can be claimed that
this structure fits the data very well across the countries. Metric invariance for this model
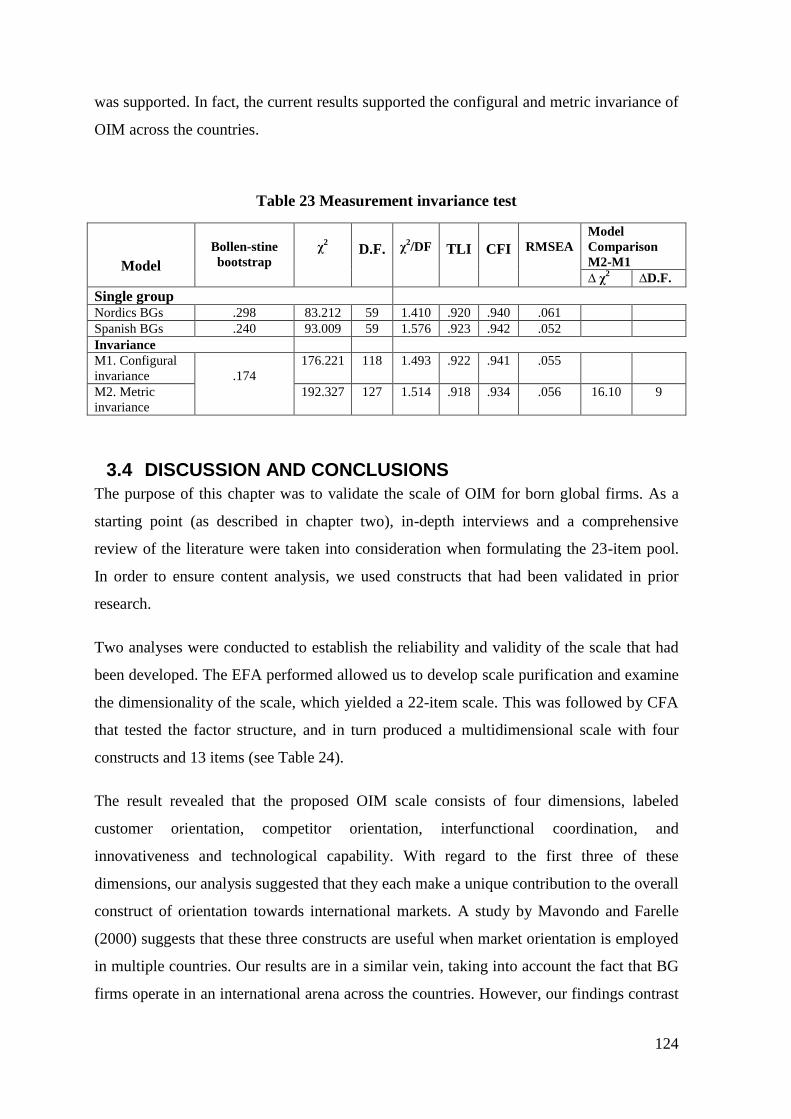
124
was supported. In fact, the current results supported the configural and metric invariance of
OIM across the countries.
Table 23 Measurement invariance test
Model
Bollen-stine
bootstrap
χ2
D.F.
χ2/DF
TLI
CFI
RMSEA
Model
Comparison
M2-M1
∆ χ2 ∆D.F.
Single group Nordics BGs .298 83.212 59 1.410 .920 .940 .061
Spanish BGs .240 93.009 59 1.576 .923 .942 .052
Invariance
M1. Configural
invariance
.174
176.221 118 1.493 .922 .941 .055
M2. Metric
invariance
192.327 127 1.514 .918 .934 .056 16.10 9
3.4 DISCUSSION AND CONCLUSIONS
The purpose of this chapter was to validate the scale of OIM for born global firms. As a
starting point (as described in chapter two), in-depth interviews and a comprehensive
review of the literature were taken into consideration when formulating the 23-item pool.
In order to ensure content analysis, we used constructs that had been validated in prior
research.
Two analyses were conducted to establish the reliability and validity of the scale that had
been developed. The EFA performed allowed us to develop scale purification and examine
the dimensionality of the scale, which yielded a 22-item scale. This was followed by CFA
that tested the factor structure, and in turn produced a multidimensional scale with four
constructs and 13 items (see Table 24).
The result revealed that the proposed OIM scale consists of four dimensions, labeled
customer orientation, competitor orientation, interfunctional coordination, and
innovativeness and technological capability. With regard to the first three of these
dimensions, our analysis suggested that they each make a unique contribution to the overall
construct of orientation towards international markets. A study by Mavondo and Farelle
(2000) suggests that these three constructs are useful when market orientation is employed
in multiple countries. Our results are in a similar vein, taking into account the fact that BG
firms operate in an international arena across the countries. However, our findings contrast
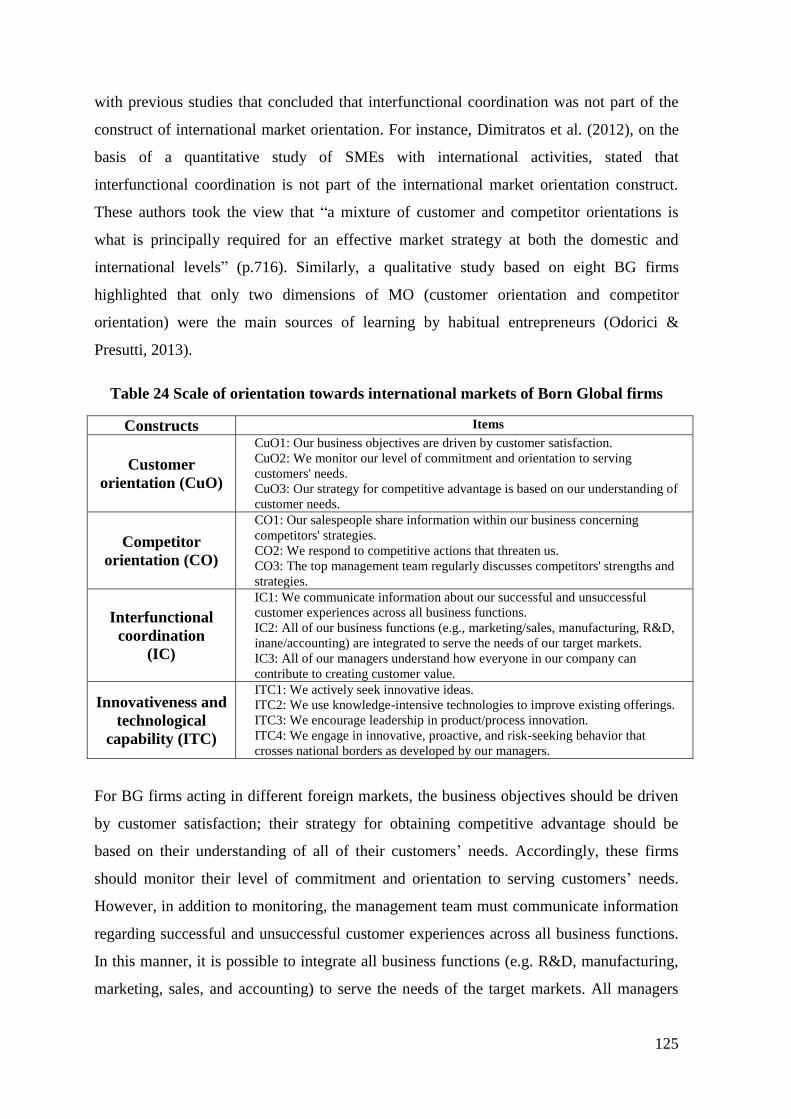
125
with previous studies that concluded that interfunctional coordination was not part of the
construct of international market orientation. For instance, Dimitratos et al. (2012), on the
basis of a quantitative study of SMEs with international activities, stated that
interfunctional coordination is not part of the international market orientation construct.
These authors took the view that ―a mixture of customer and competitor orientations is
what is principally required for an effective market strategy at both the domestic and
international levels‖ (p.716). Similarly, a qualitative study based on eight BG firms
highlighted that only two dimensions of MO (customer orientation and competitor
orientation) were the main sources of learning by habitual entrepreneurs (Odorici &
Presutti, 2013).
Table 24 Scale of orientation towards international markets of Born Global firms
Constructs Items
Customer
orientation (CuO)
CuO1: Our business objectives are driven by customer satisfaction.
CuO2: We monitor our level of commitment and orientation to serving
customers' needs.
CuO3: Our strategy for competitive advantage is based on our understanding of
customer needs.
Competitor
orientation (CO)
CO1: Our salespeople share information within our business concerning
competitors' strategies.
CO2: We respond to competitive actions that threaten us.
CO3: The top management team regularly discusses competitors' strengths and
strategies.
Interfunctional
coordination
(IC)
IC1: We communicate information about our successful and unsuccessful
customer experiences across all business functions.
IC2: All of our business functions (e.g., marketing/sales, manufacturing, R&D,
inane/accounting) are integrated to serve the needs of our target markets.
IC3: All of our managers understand how everyone in our company can
contribute to creating customer value.
Innovativeness and
technological
capability (ITC)
ITC1: We actively seek innovative ideas.
ITC2: We use knowledge-intensive technologies to improve existing offerings.
ITC3: We encourage leadership in product/process innovation.
ITC4: We engage in innovative, proactive, and risk-seeking behavior that
crosses national borders as developed by our managers.
For BG firms acting in different foreign markets, the business objectives should be driven
by customer satisfaction; their strategy for obtaining competitive advantage should be
based on their understanding of all of their customers‘ needs. Accordingly, these firms
should monitor their level of commitment and orientation to serving customers‘ needs.
However, in addition to monitoring, the management team must communicate information
regarding successful and unsuccessful customer experiences across all business functions.
In this manner, it is possible to integrate all business functions (e.g. R&D, manufacturing,
marketing, sales, and accounting) to serve the needs of the target markets. All managers
126
can understand how everyone in the firm can contribute to creating customer value.
Moreover, top management should regularly discuss competitors‘ strengths and strategies
and respond to competitive and threatening actions by competitors. Hence, salespeople,
who are likely to be the first to encounter such strategies, must share information in
relation to competitor strategies with the entire organization .
The findings also show that innovativeness and technological capability is an element of
the scale of OIM. This dimension was previously identified in the BG literature as one of
the factors influencing the BG internationalization process (Zahra et al., 2000; Freeman et
al., 2006; Zhang & Dodgson 2007). Furthermore, previous research suggests that BG firms
seek to develop new products, designs, services, or ideas for international markets though
innovativeness and technological capability (Efrat & Shoham, 2012; Zhang et al., 2009).
Moreover, the integration of this construct for the measurement of the OIM of the BG
firms is in line with the literature on MO that suggests that this construct drives a
continuous and proactive disposition towards meeting customers‘ needs (Han et el., 1998).
The strong customer intimacy of BG firms enhances the successful development of
innovative products (Sullivan et. al., 2012).
Finally, regarding the network constructs, unlike our qualitative study (chapter two) and
previous research (Coviello, 2006) which indicate that networks are relevant for BG firms,
and could be an element of OIM, our empirical findings reveal that the psychometric
proprieties of the networks were not supported by the empirical analysis performed under
the context of both samples. As we mentioned earlier, this result is contrary to our
expectation and the literature that previously linked the networks and the MO constructs.
For instance, Ruokonen et al. (2008), argued that market orientation of international firms
is integrated by the customer orientation and competitor orientation, proposing that the
interfuntional coordination should be replaced by the construct of networks coordination.
In a similar vein, Dimitratos et al. (2012) argued that there is a similar relationship between
international networking and international market orientation in their study of international
firms.
In the context of this study, then, a potential explanation could be that networks for born
global firms are more of an external source that helps to overcome resource scarcity at the
early stage of a firm‘s establishment (such as financial networks that create a relationship
to help with market entry and to reach new space in foreign markets). The proposed scale
127
validated by the BG firms managers reflected the role of the OIM as an internal capability
of the firms that increasingly requires a focus on customers‘ needs and market
opportunities. Further, as pointed out by Park and Rhee (2012) "the number of networks is
a pre-condition that is more influential in building knowledge competencies for
international activities (p. 1375).
Therefore, the quantitative study provides no support for a relationship between networks
and OIM for BG firms, thus our results are more in line with Gerschewski et al. (2015) and
Thai and Chong (2008), than contrary to their expectation, to find limited support of the
relationship between BG firms and their networks. According to Thai and Chong (2008)
"prior international personal and business network is not a ―must-have‖"(p.95).
Furthermore, in order to increase the comprehension between the networks and the
proposed orientation (OIM), future research might try to explore the role of networks as a
mediating factor between OIM and performance (Zhou et al., 2007).
After checking the psychometric properties of the proposed scale, we established the
measurement invariance across firms from different countries. A significant criticism in the
literature is the fact that many studies are based on a single country and have not been
generalized to other contexts. In this research, we tested the cross-country measurement
invariance of the scale. Our results established the measurement invariance of the four
OIM constructs for born global firms from different countries, and this can facilitate
comparison studies using cross-cultural samples.
Our contribution is to offer a significant advance in the current literature on international
entrepreneurship and international marketing by affording an integrative framework to give
a thorough understanding of how the MO concept can be extended into companies with
specific features such as BG firms. We explore MO and provide a conceptualization of the
OIM construct, and then develop a scale of OIM with four components, namely: customer
orientation, competitor orientation, interfunctional coordination, and innovativeness and
technological capability. We provide empirical evidence on the testable constructs that is
both reliable and valid. The scale was tested in order to ensure measurement invariance,
and we give a theoretical insight into how OIM can be generated and applied within
different contexts.
128
3.4.1 LIMITATIONS AND FUTURE RESEARCH
This study assessed the psychometric properties and cross-country equivalence of an OIM
scale for BGs through an examination of 165 of these companies from three countries,
which helped us to deal with external validity aspects. However, the sample sizes were
relatively small, which is one of the limitations of this study. Therefore, future studies are
required, in order to validate the findings of this study with a larger sample and in other
regions such as Central and South America and Africa that are under-researched areas for
early internationalizing firms. Likewise, it could also be relevant to determine the validity
of the proposed OIM scale for firms with different degrees of international involvement.
For example, the assessment of this scale for those companies that followed a gradual
internationalization process would allow us, if the scale is also valid for this type of firm,
to provide a scale for measuring orientation towards international markets regardless of the
internationalization pattern followed by the company. In this sense, the use of our scale
with a comparative study of a large group of firms with different levels of
internationalization could be helpful in providing answers to such questions, and could
extend the validation of the scale to other types of firms.
Another limitation is related to the reliance placed on the perceptions of managers. As
Rong and Wilkinson (2011) argue, studies that rely on perceptual information from
managers may tell us only about sense-making by managers. Likewise, Uncles (2011)
points out that a manager might believe that his organization can sense the market, but that
customers or other stakeholders (suppliers, shareholders, analysts or competitors) might
not think the same. Although we agree with Uncles (2011), we believe that having multiple
respondents from each company to reflect the perspectives of managers with varied roles,
functions, experiences, and life stages, and not simply relying on one senior manager as the
key informant, is one option for overcoming this limitation; for this research this was not a
possible alternative because of the management of the available information.
In conclusion, the 13-item validated OIM scale is a useful instrument to examine this issue,
and can help us to understand further, for example, the relationship between OIM and BG
firms‘ performance. Future research would need to determine the degree to which BG
firms‘ performance is impacted by OIM.
129
3.5 REFERENCES
Ahire, S.L., Golhar, D.Y., & Waller, M.A. (1996). Development and Validation of
TQM Implementation Constructs. Decision Sciences, 27 (1), 23-56.
Akoto, E. O. (2014). Cross-cultural factorial validity of the academic motivation
scale. Cross Cultural Management. An International Journal, 21 (1), 104-125.
Altshuler, L., & Tarnovskaya, V. V. (2010). Branding capability of technology
born globals. Journal of Brand Management, 18 (3), 212-227.
Amabile, T. M., Conti, R., Coon, H., Lazenby, J., & Herron, M. (1996). Assessing
the work environment for creativity. Academy of management journal, 39 (5), 1154-1184.
Anderson, J. C., & Gerbing D. W. (1988). Structural Equation Modeling in
Practice: A Review and Recommended Two-Step Approach, Psychological Bulletin (103)
3, 411-423.
Andersson, S., & Wictor, I. (2003). Innovative internationalisation in new firms-
Born Globals the Swedish case. Journal of International Entrepreneurship, 1 (3), 249-
276.
Antoncic, B., & Hisrich, R. D. (2001). Intrapreneurship: construct refinement and
cross-cultural validation. Journal of business venturing, 16 (5), 495-527.
Armario, J., Ruiz, D., & Armario, E. (2008). Market orientation and
internationalization in small and medium-sized enterprises. Journal of Small Business
Management, 46 (4), 485-511.
Armstrong, J. S., & Overton, T. S. (1977). Estimating nonresponse bias in mail
surveys. Journal of Marketing Research, 16 (August), 396-402.
Bagozzi, R. P., & Yi Y. (1988). On the Evaluation of Structural Equation Models.
Journal of the Academy of Marketing Science, 16, 74-94.
Bagozzi, R. P. (1981). Attitude, intentions and behavior: a test of some key
hypotheses. Journal of Personality and Social Psychology, 41, 607-627.
Bearden, W. O., Hardesty, D. M., & Rose, R. L. (2001). Consumer self‐confidence:
refinements in conceptualization and measurement. Journal of Consumer Research, 28 (1),
121-134.
Bentler, P. M., & Bonett, D. G. (1980). Significance tests and goodness of fit in the
analysis of covariance structures. Psychological bulletin, 88 (3), 588.
Boehe, D. M. (2009). Brazilian software SME's export propensity: Bridging "born
global" and stage approaches. Latin American Business Review, 10 (2-3), 187-216.
Boomsma, A. (2000). Reporting analyses of covariance structures. Structural
equation modeling, 7 (3), 461-483.
Brown, T. A. (2006).Confirmatory factor analysis for applied research. New York:
Guilford Press.
Browne, M. W. , & Cudeck, R. (1993). Alternative ways of assessing model fit. In
K. A. Bollen & J. S. Long (Eds.), Testing structural equation models (pp. 136-162).
Byrne, B. M. (2001). Structural equation modeling with AMOS: Basic concepts,
applications, and programming. Mahwah, NJ: Erlbaum.
Byrne, B. M. (2008). Testing for multigroup equivalence of a measuring
instrument: A walk through the process. Psicothema, 20 (4), 872-88.
Byrne, B. M., Shavelson, R. J., & Muthen, B. (1989). Testing for equivalence of
factor covariance and mean structures: the issue of partial measurement invariance.
Psychological Bulletin, 105, 456-466.
Cadogan, J. W., Diamantopoulos, A., & De Mortanges, C. P. (1999). A measure of
export market orientation: scale development and cross-cultural validation. Journal of
International Business Studies, 689-707.
130
Cadogan, J., Diamantopoulos A., & Pahud de Mortanges C. (1999). A measure of
export market orientation: Scale development and cross-cultural validation. Journal of
International Business Studies, 30, 689-707.
Cannone, G., & Ughetto, E. (2014). Born globals: A cross-country survey on high-
tech start-ups. International Business Review, 23 (1), 272-283.
Carlson, D. S., Kacmar, K. M., Wayne, J. H., & Grzywacz, J. G. (2006). Measuring
the positive side of the work–family interface: Development and validation of a work–
family enrichment scale. Journal of Vocational Behavior, 68 (1), 131-164.
Carmines, E. G., & Zeller, R. A. (Eds.). (1979). Reliability and validity assessment
(Vol. 17). Sage.
Cattell, R. B. (1966). The scree test for the number of factors. Multivariate
behavioral research, 1 (2), 245-276.
Cesinger, B., Fink, M., Madsen, T. K., & Kraus, S. (2012).Rapidly
internationalizing ventures: how definitions can bridge the gap across contexts.
Management Decision, 50 (10),1816-1842.
Chang, S.-J., van Witteloostuijn, A., & Eden, L. (2010). From the Editors:
Common method variance in international business research. Journal of International
Business Studies, 41, 178-184.
Churchill, G.A., Jr. (1979). A paradigm for developing better measures of
marketing constructs. Journal of Marketing Research, 16, 64-73.
Coltman, T., Devinney, T. M., Midgley, D. F., & Venaik, S. (2008). Formative
versus reflective measurement models: Two applications of formative measurement.
Journal of Business Research, 61 (12), 1250-1262.
Conway, J. & Huffcutt, A.(2003). A Review and evaluation of exploratory factor
analysis practices in organizational research. Organizational Research Methods, 6 ( 2),
147-168.
Costello, A. B., & Osborne, J. W. (2011). Best practices in exploratory factor
analysis: four recommendations for getting the most from your analysis. Pract Assess Res
Eval 2005; 10. pareonline. net/getvn. asp, 10, 7.
Coviello N.E. (2006). The network dynamics of international new ventures.
Journal of International Business Studies, 37 (5), 713-731.
Cronbach, L. J. (1951). Coefficient alpha and the internal structure of tests.
psychometrika, 16 (3), 297-334.
Cronbach, L. J., & Shavelson, R. J. (2004). My current thoughts on coefficient
alpha and successor procedures. Educational and psychological measurement, 64 (3), 391-
418.
Dabholkar, D., Thorpe, I. & Rentz, J.O. (1996). A Measure of Service Quality for
Retail Stores. Journal of the Academy of Marketing Science, 24, 3-16.
Deshpandé, R., Grinstein, A., Kim, S. H., & Ofek, E. (2013). Achievement
motivation, strategic orientations and business performance in entrepreneurial firms: How
different are Japanese and American founders?. International Marketing Review, 30 (3),
231-252.
DeVellis RF. (2003).Scale development: theory and applications. Thousand Oaks,
Calif: SAGE Publications.
DeVellis, R. F. (2011). Scale development: Theory and applications (Vol. 26).
Sage Publications.
Diamantopoulos, A., & Papadopoulos, N. (2010). Assessing the cross-national
invariance of formative measures: Guidelines for international business researchers.
Journal of International Business Studies, 41 (2), 360-370.
131
Diamantopoulos, A., & Siguaw, J. A. (2006). Formative versus reflective indicators
in organizational measure development: a comparison and empirical illustration. British
Journal of Management, 17 (4), 263-282.
Diamantopoulos, A., & Winklhofer, H. M. (2001). Index construction with
formative indicators: An alternative to scale development. Journal of marketing research,
38 (2), 269-277.
Dimitratos, P., Voudouris, I., Plakoyiannaki E.& Nakos G. (2012). International
Entrepreneurial Culture - Toward A Comprehensive Opportunity-Based Operationalization
of International Entrepreneurship. International Business Review, 21 (4), 708-721.
Efrat, K., & Shoham, A.(2012). Born global firms: The differences between their
short- and long-term performance drivers. Journal of World Business, 47, 647-685.
Efron, B., & Gong, G. (1983). A leisurely look at the bootstrap, the jackknife, and
cross-validation. The American Statistician, 37 (1), 36-48.
Evers N. (2011). Exploring market orientation in new export ventures.
International Journal of Entrepreneurship and Innovation Management, 13 (3/4), 357-376.
Farrell, A. M. (2010). Insufficient discriminant validity: A comment on Bove,
Pervan, Beatty, and Shiu (2009). Journal of Business Research, 63 (3), 324-327.
Ferris, G. R., Treadway, D. C., Kolodinsky, R. W., Hochwarter, W. A., Kacmar, C.
J., Douglas, C., & Frink, D. D. (2005). Development and validation of the political skill
inventory. Journal of Management, 31 (1), 126-152.
Field, A. (2000). Discover statistics, using SPSS for windows. Thousand Oaks, CA:
Sage.
Finn, A., & Kayande´, U. (1997). Reliability assessment and optimization of
marketing measurement. Journal of Marketing Research, 34, 262-275.
Flynn, L. R., Goldsmith, R. E., & Eastman, J. K. (1996). Opinion leaders and
opinion seekers: Two new measurement scales. Journal of the Academy of Marketing
Science, 24(2), 137-147.
Flynn, L.R. & Goldsmith, R.E. (1999). A short, reliable measure of subjective
knowledge. Journal of Business Research, 46 (1), 57–66.
Fornell, C. & Larcker, D.F. (1981). Evaluating structural equations models with
unobservable variables and measurement error. Journal of Marketing Research, 18, 39-50.
Franke, G. R., & Richey, R. G. (2010). Improving generalizations from multi-
country comparisons in international business research. Journal of International Business
Studies, 41 (8), 1275-1293.
Freeman, S., Edwards, R., & Schroder, B. (2006). How smaller born-global firms
use networks and alliances to overcome constraints to rapid internationalization. Journal of
International Marketing, 14 (3), 33-63.
Freitag, M., & Bauer, P. C. (2013). Testing for Measurement Equivalence in
Surveys: Dimensions of Social Trust across Cultural Contexts. Public Opinion Quarterly,
77 (S1), 24-44.
Froehle, C. M., & Roth, A. V. (2004). New measurement scales for evaluating
perceptions of the technology-mediated customer service experience. Journal of
Operations Management, 22 (1), 1-22.
Gabrielsson, M., & Gabrielsson, P. (2011). Internet-based sales channel strategies
of born global firms. International Business Review, 20 (1), 88-99.
Gabrielsson, M., Sasi, V., & Darling, J. (2004). Finance strategies of rapidly-
growing Finnish SMEs: Born Internationals and Born Globals. European Business Review,
16 (6), 590-604.
132
Gardner, D.G. & Pierce, J.L. (2010). The Core Self-Evaluation Scale: Further
Construct Validation Evidence. Educational and Psychological Measurement, 70 (2) 291-
304.
Gaskin, C. J., & Happell, B. (2014). On exploratory factor analysis: A review of
recent evidence, an assessment of current practice, and recommendations for future use.
International journal of nursing studies, 51 (3), 511-521.
Gauzente, C. (1999). Comparing market orientation scales: a content analysis.
Marketing Bulletin, 10, 76-83.
Gerbing, D. W., & Anderson J. C. (1988). An updated paradigm for scale
development incorporating unidimensionality and its assessment. Journal of Marketing
Research (25), 186-192.
Gerschewski, S., Rose, E. L., & Lindsay, V. J. (2015). Understanding the drivers of
international performance for born global firms: An integrated perspective. Journal of
World Business, 50 (3), 558–575.
Hair Jr, J. F., Sarstedt, M., Hopkins, L., & Kuppelwieser, V. G. (2014). Partial least
squares structural equation modeling (PLS-SEM): An emerging tool in business research.
European Business Review, 26 (2), 106-121.
Hair, J. F., Tatham, R. L., Anderson, R. E., & Black, W. (2006). Multivariate data
analysis (Vol. 6). Upper Saddle River, NJ: Pearson Prentice Hall.
Hallbäck, J., & Gabrielsson, P. (2013). Entrepreneurial marketing strategies during
the growth of international new ventures originating in small and open economies.
International Business Review, 22 (6), 1008-1020.
Han K.J., Kim N., & Srivastava R.K. (1998). Market Orientation and
Organizational Performance: Is Innovation a Missing Link? Journal of Marketing, 62 (4),
30- 45.
Hansen, J. D., Deitz, G. D., Tokman, M., Marino, L. D., & Weaver, K. M. (2011).
Cross-national invariance of the entrepreneurial orientation scale. Journal of Business
Venturing, 26 (1), 61-78.
Hayduk, L. A. (1987). Structural equation modeling with L1SREL: Essentials and
advances. Baltimore, MD: Johns Hopkins Press.
Hinkin, T. (1998). A brief tutorial on the development of measure for use in survey
questionnaires. Organization Research Method, 1 (1), 104-121.
Hinkin, T. R. (1998). A brief tutorial on the development of measures for use in
survey questionnaires. Organizational research methods, 1 (1), 104-121.
Hohenthal, J., Johanson, J., & Johanson, M. (2014). Network knowledge and
business-relationship value in the foreign market. International Business Review, 23 (1), 4-
19.
Hooper, D., Coughlan, J., and Mullen, M.(2008) Structural Equation Modelling:
Guidelines for Determining Model Fit. Electronic Journal of Business Research Methods,
6 (1), 53-60.
Horn, J. L. (1965). A rationale and test for the number of factors in factor analysis.
Psychometrika, 30 (2), 179-185.
Horn, J.L. & McArdle, J.J. (1992). A practical and theoretical guide to
measurement invariance in aging research. Experimental Aging Research, 18, 117-144.
Horn, J.L. (1991). Comments on issues in factorial invariance, in Best methods for
the analysis of change, L.M. Collins and J.L. Horn, eds. Washington, DC: American
Psychological Association, 114-125.
Hu, L. T., & Bentler, P. M. (1999). Cutoff criteria for fit indexes in covariance
structure analysis: Conventional criteria versus new alternatives. Structural equation
modeling: a multidisciplinary journal, 6 (1), 1-55.
133
Hult, G. T. M., Ketchen, D. J., & Slater, S. F. (2005). Market orientation and
performance: an integration of disparate approaches. Strategic Management Journal, 26
(12), 1173-1181.
Hult, G. T. M., Ketchen, D. J., Griffith, D. A., Finnegan, C. A., Gonzalez-Padron,
T., Harmancioglu, N., ... & Cavusgil, S. T. (2008). Data equivalence in cross-cultural
international business research: assessment and guidelines. Journal of International
Business Studies, 39 (6), 1027-1044.
Jarvis, C. B., MacKenzie, S. B., & Podsakoff, P. M. (2003). A critical review of
construct indicators and measurement model misspecification in marketing and consumer
research. Journal of consumer research, 30 (2), 199-218.
Jones, M. V., Coviello, N., & Tang, Y. K. (2011). International entrepreneurship
research (1989–2009): a domain ontology and thematic analysis. Journal of Business
Venturing, 26 (6), 632-659.
Jöreskog, K. G., & Sörbom, D. (1993). LISREL 8: Structural equation modeling
with the SIMPLIS command language. Scientific Software International.
Jöreskog, K. G., & Sörbom, D. (1999). LISREL 8 user‘s reference guide. Chicago:
Scientific Software International.
Judge, T. A., Erez, A., Bono, J. E. & Thoresen, C. J. (2003), The core self-
evaluations scale: development of a measure. Personnel Psychology, 56, 303-331.
Kaiser, H. F. (1960). The application of electronic computers to factor analysis.
Educational and psychological measurement.
Kaplan, D. (2009). Structural equation modeling: Foundations and extensions
(Vol. 10). Sage.
Kim, D., Basu C., Naidu, G., & Cavusgil E. (2011).The innovativeness of born-
globals and customer orientation: Learning from Indian born-globals. Journal of Business
Research, 64 (8), 879-886.
Kline, P. (1986). A handbook of test construction. Introduction to psychometric
design. London: Methuen.
Kline, R.B. (2005), Principles and Practice of Structural Equation Modeling (2nd
Edition ed.). New York: The Guilford Press.
Kocak, A., & Abimbola, T. (2009). The effects of entrepreneurial marketing on
born global performance. International Marketing Review, 26 (4), 439 - 452.
Leo, C. & Russell-Bennett, R. (2014). Developing a multidimensional scale of
customer-oriented deviance (COD). Journal of Business Research, 67 (6), 1218-1225.
Li, L. Qian, G., & Qian, Z. (2012). Early internationalization and performance of
small high-tech ―born-globals‖. International Marketing Review, 29 (5), 536-561.
Li, L., Rao, S.S., Ragu-Nathan, T.S. & Ragu-Nathan, B. (2005). Development and
validation of a measurement instrument for studying supply chain management practices.
Journal of Operations Management, 23 (6), 618-641.
Liao, S.-H., Chang, W.-J., Wu, C.-C., & Katrichis, J. M (2011). A survey of market
orientation research (1995–2008). Industrial Marketing Management, 40 (2), 301-310.
Liden, R. C., & Maslyn, J. M. (1998). Multidimensionafity of leader-member
exchange: an empirical assessment through scale development. Journal of management, 24
(1), 43-72.
Luostarinen, R., & Gabrielsson, M. (2006). Globalization and marketing strategies
of born globals in SMOPECs. Thunderbird International Business Review, 48 (6), 773-
801.
Madsen, T. K. (2013). Early and rapidly internationalizing ventures: Similarities
and differences between classifications based on the original international new venture and
born global literatures. Journal of International Entrepreneurship, 11 (1), 65-79.
134
Malhotra, N. K., Agarwal, J., & Peterson, M. (1996). Methodological issues in
cross-cultural marketing research: A state-of-the-art review. International Marketing
Review, 13 (5), 7-43.
Mavondo, F.T and Farrell, M. (2000). Measuring Market Orientation: Are there
Differences between Business Marketers and Consumer Marketers?. Australian Journal of
Management 25, 2 (September), 223-244.
McDonald, R. P. (1985). Factor analysis and related methods. Hillsdale, NJ:
Lawrence Earibaum.
Menguc, B., & Auh S. (2006). Creating a Firm-Level dynamic capability through
capitalizing on market orientation and innovativeness. Journal of the Academy of
Marketing Science, 34 (1), 63-73.
Menon, A., Bharadwaj, S. G., & Howell, R. (1996). The quality and effectiveness
of marketing strategy: Effects of functional and dysfunctional conflict in
intraorganizational relationships. Journal of the Academy of Marketing Science, 24 (4),
299-313.
Menor, L.J. & Roth, A.V. (2007). New service development competence in retail
banking: Construct development and measurement validation. Journal of Operations
Management, 25 (4), 825-846.
Moen, O. (2002). The Born Globals: A new generation of small European
exporters. International Marketing Review, 19 (2), 156-175.
Mort, G. S., Weerawardena, J., & Liesch, P. (2012). Advancing entrepreneurial
marketing: Evidence from born global firms. European Journal of Marketing, 46 (3-4),
542-561.
Muylle, S., Moenaert, R., & Despontin, M. (2004). The conceptualization and
empirical validation of web site user satisfaction. Information & Management, 41 (5), 543-
560.
Narver J.C. & Slater S.F. (1990). The effect of a market orientation on business
profitability. Journal of Marketing, 54 (4), 20-35.
Netemeyer, R. G., Boles, J. S., & McMurrian, R. (1996). Development and
validation of work–family conflict and family–work conflict scales. Journal of applied
psychology, 81 (4), 400.
Netemeyer, R., Bearden, W., & Sharma, S. (2003). Scaling procedures: Issues and
applications. Thousand Oaks, CA: Sage.
Nunnally, J. (1978). C.(1978). Psychometric theory.
Nunnally, J. C. & Bernstein, I. H. (1994). Psychometric theory (3rd ed.). New
York: McGraw-Hill.
Nurosis, M. J. (1993). SPSS. Statistical data analysis. Spss Inc.
Odorici, V. & Presutti, M. (2013). The entrepreneurial experience and strategic
orientation of high-tech born global start-ups: An analysis of novice and habitual
entrepreneurs. Journal of International Entrepreneurship, 11, 268-291.
Pallant, J. (2001). SPSS Survival Manual: A Step by Step Guide to Data Analysis
Using SPSS for Windows (Versions 10 and 11): SPSS Student Version 11.0 for Windows.
Milton Keynes, UK, USA: Open University Press.
Park, T., & Rhee, J. (2012). Antecedents of knowledge competency and
performance in born globals: the moderating effects of absorptive capacity. Management
Decision, 50 (8), 1361-1381.
Patterson, M. G., West, M. A., Shackleton, V. J., Dawson, J. F., Lawthom, R.,
Maitlis,S., Robinson, D. L., & Wallace, A. M. (2005). Validating the organizational
climate measure: links to managerial practices, productivity and innovation. Journal of
Organizational Behaviour, 26, 379-408.
135
Peiris, I. K., Akoorie, M. E., & Sinha, P. (2012). International entrepreneurship: A
critical analysis of studies in the past two decades and future directions for research.
Journal of International Entrepreneurship, 10 (4), 279-324.
Peterson, R. A. (1994). A meta-analysis of Cronbach's coefficient alpha. Journal of
consumer research, 381-391.
Podsakoff, P. M., & Organ, D. W. (1986). Self-reports in organizational research:
Problems and prospects. Journal of Management, 12, 69-82.
Podsakoff, P. M., MacKenzie, S. B., Lee, J. Y., & Podsakoff, N. P. (2003).
Common method biases in behavioral research: A critical review of the literature and
recommended remedies. Journal of Applied Psychology, 88, 879-903.
Raykov, T., Marcoulides, G. A., & Li, C. H. (2012). Measurement Invariance for
Latent Constructs in Multiple Populations A Critical View and Refocus. Educational and
Psychological Measurement, 72 (6), 954-974.
Reidenbach, R. E., & Robin, D. P. (1990). Toward the development of a
multidimensional scale for improving evaluations of business ethics. Journal of Business
Ethics, 9 (8), 639-653.
Richins, M.L. & Dawson, S. (1992). A consumer values orientation for materialism
and its measurement: Scale development and validation. Journal of consumer research, 19
(3), 303-316.
Rong, B., & Wilkinson, I. F. (2011). What do managers‘ survey responses mean
and what affects them? The case of market orientation and firm performance. Australasian
Marketing Journal (AMJ), 19 (3), 137-147.
Rossiter, J. R. (2002). The C-OAR-SE procedure for scale development in
marketing. International journal of research in marketing, 19 (4), 305-335.
Runyan, R. C., Ge, B., Dong, B., & Swinney, J. L. (2012). Entrepreneurial
Orientation in Cross‐Cultural Research: Assessing Measurement Invariance in the
Construct. Entrepreneurship Theory and Practice, 36 (4), 819-836.
Ruokonen, M., Nummela, N., Puumalainen, K., & Saarenketo, S. (2008). Market
orientation and internationalisation in small software firms. European Journal of
Marketing, 42 (11/12), 1294-1315.
Salzberger, T., & Koller, M. (2013). Towards a new paradigm of measurement in
marketing. Journal of Business Research, 66 (9), 1307-1317.
Sass, D. A., Schmitt, T. A., & Marsh, H. W. (2014). Evaluating model fit with
ordered categorical data within a measurement invariance framework: A comparison of
estimators. Structural Equation Modeling: A Multidisciplinary Journal, 21 (2), 167-180.
Schmitt, N. & Kuljanin, G. (2008). Measurement invariance: Review of practice
and implications. Human Resource Management Review 18, 210-222.
Schreiber, J. B., Nora, A., Stage, F. K., Barlow, E. A., & King, J. (2006). Reporting
structural equation modeling and confirmatory factor analysis results: A review. The
Journal of Educational Research, 99 (6), 323-338.
Scott, J.E. 1994, The measurement of information systems effectiveness: Evaluating
a measuring Instrument, Proceedings of the fifteenth international conference on
information systems, Vancouver, British Columbia, pp. 111-128.
Sepulveda, S. & Gabrielsson, M. (2013). Network development and firm growth: A
resource-based of B2B Born Globals. Industrial Marketing Management, 42, 792-804.
Sharma, D., & Blomstermo, A. (2003). The Internationalization process of Born
Global: a network view. International Business Review, 12, 739-753.
Sharma, S. & Weathers, D. (2003). Assessing generalizability of scales used in
cross-national research. International Journal of Research in Marketing, 20, 287-295.
136
Slavec, A., & Drnovšek, M. (2012). A perspective on scale development in
entrepreneurship research. Economic and Business Review, 14 (1), 39-62.
Smirnova, M., Naudé, P., Henneberg, S.C., Mouzas, S., & Kouchtch, S.P. (2011),
"The Impact of Market Orientation on the Development of Relational Capabilities and
Performance Outcomes: The case of Russian Industrial Firms. Industrial Marketing
Management, 40 (1), 44-53.
Sørensen, H. E., & Madsen, T. K. (2012). Strategic orientations and export market
success of manufacturing firms: The role of market portfolio diversity. International
Marketing Review, 29 (4), 424-441.
Steenkamp J-B. E. M. & Baumgartner H. (1998). Assessing measurement
invariance in cross-national consumer research. Journal of Consumer Research, 25, 78-90.
Steenkamp, J. B. E., & Van Trijp, H. (1991). The use of LISREL in validating
marketing constructs. International Journal of Research in marketing, 8 (4), 283-299.
Story, V. M., Boso, N., & Cadogan, J. W. (2015). The Form of Relationship
between Firm‐Level Product Innovativeness and New Product Performance in Developed
and Emerging Markets. Journal of Product Innovation Management, 32 (1), 45-64.
Sullivan Mort, G., Weerawardena, J. & Liesh, P. (2012). Advancing entrepreneurial
marketing. Evidence from born global firms. European Journal of Marketing, 46 (3/4),
542-561.
Svensson, G. (2006). A quest for a common terminology: the concept of born
glocals. Management Decision, 44 (9), 1311-1317.
Tabachnick, G. G., and Fidell, L. S. (2007). Experimental Designs Using ANOVA.
Belmont, CA: Duxbury.
Terblanche, N. S., & Boshoff, C. (2008). Improved scale development in
marketing-An empirical illustration. International Journal of Market Research, 50 (1),
105-119.
Thai, M. T. T., & Chong, L. C. (2008). Born-global: The case of four Vietnamese
SMEs. Journal of International Entrepreneurship, 6 (2), 72-100.
Tian, K. T., Bearden, W. O., & Hunter, G. L. (2001). Consumers‘ need for
uniqueness: Scale development and validation. Journal of Consumer Research, 28, 50-66.
Tiu Wright, L. (2001). Intercontinental comparisons in marketing strategy.
International Marketing Review, 18 (3), 344-354.
Ullman, J. B. (2001). Structural Equation Modeling. In B. G
Uncles, M.D. (2011). Researching market orientation and business performance.
Australasian Marketing Journal, 19, 161-164
Vandenberg, R. J. (2002). Toward a further understanding of and improvement in
measurement invariance methods and procedures. Organizational Research Methods, 5
(2), 139-158.
Vandenberg, R. J., & Lance, C. E. (2000). A review and synthesis of the
measurement invariance literature: suggestions, practices, and recommendations for
organizational research. Organizational Research Methods, 3, 4-70.
Velicer, W. F., & Jackson, D. N. (1990). Component analysis versus common
factor analysis: Some issues in selecting an appropriate procedure. Multivariate behavioral
research, 25 (1), 1-28.
Voss, K. E., Spangenberg, E. R., Grohmann, B.(2003). Measuring the hedonic and
utilitarian dimensions of consumer attitude. Journal of Marketing Research, 40, 310-320.
Watkins, L. (2010). The cross-cultural appropriateness of survey-based value (s)
research: A review of methodological issues and suggestion of alternative methodology.
International Marketing Review, 27 (6), 694-716.
137
Werts, C .E., Linn, R. L., & Jöreskog, K.G.(1974). Intra class reliability estimates:
Testing structural assumptions. Educational and Psychological Measurement, 34, 25-33.
Worthington, R. L., & Whittaker, T. A. (2006). Scale development research a
content analysis and recommendations for best practices. The Counseling Psychologist, 34
(6), 806-838.
Yang, Z., Cai, S., Zhou, Z. & Zhou, N. (2005). Development and validation of an
instrument to measure user perceived service quality of information presenting Web
portals. Information and Management, 42 (4), 575-589.
Yi Y. & Gong T. (2013). Customer value co-creation behavior: scale development
and validation Journal of Business Research, 66, (9), 1279-1284.
Yin, R. K. (2003). Case study research: Design and methods (3rd ed.). Thousand
Oaks, CA: Sage.
Yu, L., & Shek, D. T. (2014). Testing factorial invariance across groups: an
illustration using AMOS. International Journal on Disability and Human Development, 13
(2), 205-216.
Zahra, S., Duane, R. & Hitt, M. (2000). International Expansion by New Venture
Firms: International Diversity, Model of Market Entry, Technological Learning, and
Performance. Academy of Management Journal, 43 (5), 925-950.
Zhang, M., & Dodgson, M. (2007). A Roasted Duck Can Still Fly Away: A Case
Study of Technology, Nationality, Culture and the Rapid and Early Internationalization of
the Firm. Journal of World Business, 42, 336-349.
Zhang, M., Tansuhaj, p., & McCullought, J. (2009). International entrepreneurial
capability: The measurement and a comparison between born global firms and traditional
exporters in China. Journal of International Entrepreneurship, 7, 292-322.
Zhou, L., Wu, W. P., & Luo, X. (2007). Internationalization and the performance of
born-global SMEs: the mediating role of social networks. Journal of International
Business Studies, 38 (4), 673-690.

138
APPENDIX 4 Scale development and validation
Authors Procedure/Stages Statistical methods
Ahire, Golhar &
Waller (1996)
Scale refinement and validation, content validity analysis, unidimensionality, reliability,
convergent, and discriminant validity analysis, criterion-related validity analysis. Exploratory and confirmatory factor analysis
Amabile et al. (1996) Scale structure, internal consistency, test-retest reliability, convergent and discriminant
validity.
Confirmatory Factor
Analysis.
Antoncic & Hisrich
(2001)
Measurement instrument, convergent
and discriminant validity and for cross-cultural comparability Exploratory and confirmatory factor analysis
Bearden et al.,(2001) Item generation and content validity, item purification. Confirmatory Factor
Analysis(scale, discriminant validity). Test-retest reliability, convergent validity, and
relative predictive validity. Convergent validity.
Exploratory and confirmatory factor analysis.
Cadogan, et al.,
(1999)
Item generation, validation items. Scale purification, stability and dimensionality: item
analysis, reliability and unidimensionality assessment. Validity: content, convergent and
discriminant validity. Cross-country stability
multitrait-multimethod
analysis and confirmatory factor analysis
Carlson et al.,(2006) Content adequacy, item validation, dimensionality, internal consistency, discriminant
validity, measurement invariance and convergent validity. Exploratory and confirmatory factor analysis
Dabholkar, et al.,
(1996)
Item generation and scale development, test of the proposed factor structure, cross
validation and construct reliability and validity.
Confirmatory Factor
Analysis.
Diamontopolous &
Winklhofer (2001)
Content specification, indicator
specification, indicator collinearity, and external validity.
Multiple indicators and
multiple causes (MIMIC)
model.
Ferris et al. (2005) Development and initial validation (measures, dimensionality, reliability, fit statistics and
alternative models and convergent, discriminant validity, measurement and predictive
properties), factor structure confirmation and construct validity (convergent and
discriminant validity) and criterion-related validity.
Exploratory and confirmatory factor analysis
Flynn & Goldsmith
(1999)
Scale development: item generation, internal consistency, test–retest reliability of the scale,
construct validity, dimensionality and reliability validity and convergent and nomological Exploratory and confirmatory factor
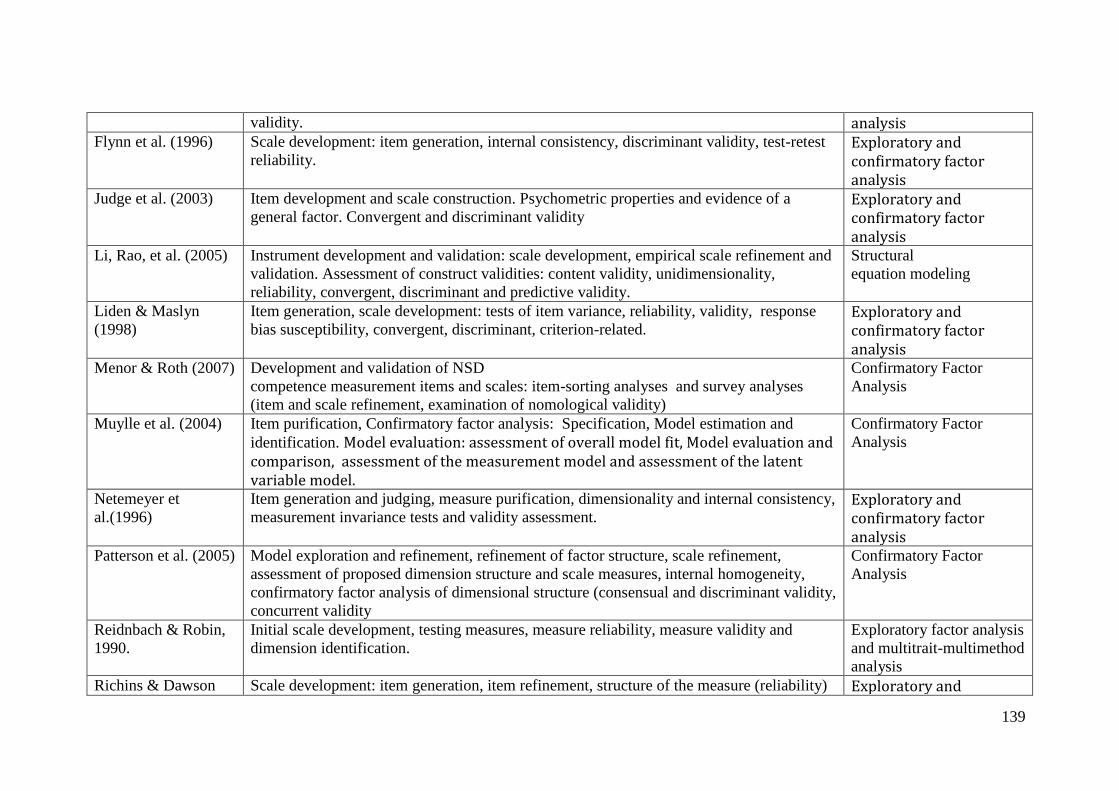
139
validity. analysis Flynn et al. (1996) Scale development: item generation, internal consistency, discriminant validity, test-retest
reliability. Exploratory and confirmatory factor analysis
Judge et al. (2003) Item development and scale construction. Psychometric properties and evidence of a
general factor. Convergent and discriminant validity Exploratory and confirmatory factor analysis
Li, Rao, et al. (2005) Instrument development and validation: scale development, empirical scale refinement and
validation. Assessment of construct validities: content validity, unidimensionality,
reliability, convergent, discriminant and predictive validity.
Structural
equation modeling
Liden & Maslyn
(1998)
Item generation, scale development: tests of item variance, reliability, validity, response
bias susceptibility, convergent, discriminant, criterion-related. Exploratory and confirmatory factor analysis
Menor & Roth (2007) Development and validation of NSD
competence measurement items and scales: item-sorting analyses and survey analyses
(item and scale refinement, examination of nomological validity)
Confirmatory Factor
Analysis
Muylle et al. (2004) Item purification, Confirmatory factor analysis: Specification, Model estimation and
identification. Model evaluation: assessment of overall model fit, Model evaluation and comparison, assessment of the measurement model and assessment of the latent variable model.
Confirmatory Factor
Analysis
Netemeyer et
al.(1996)
Item generation and judging, measure purification, dimensionality and internal consistency,
measurement invariance tests and validity assessment. Exploratory and confirmatory factor analysis
Patterson et al. (2005) Model exploration and refinement, refinement of factor structure, scale refinement,
assessment of proposed dimension structure and scale measures, internal homogeneity,
confirmatory factor analysis of dimensional structure (consensual and discriminant validity,
concurrent validity
Confirmatory Factor
Analysis
Reidnbach & Robin,
1990.
Initial scale development, testing measures, measure reliability, measure validity and
dimension identification.
Exploratory factor analysis
and multitrait-multimethod
analysis
Richins & Dawson Scale development: item generation, item refinement, structure of the measure (reliability) Exploratory and
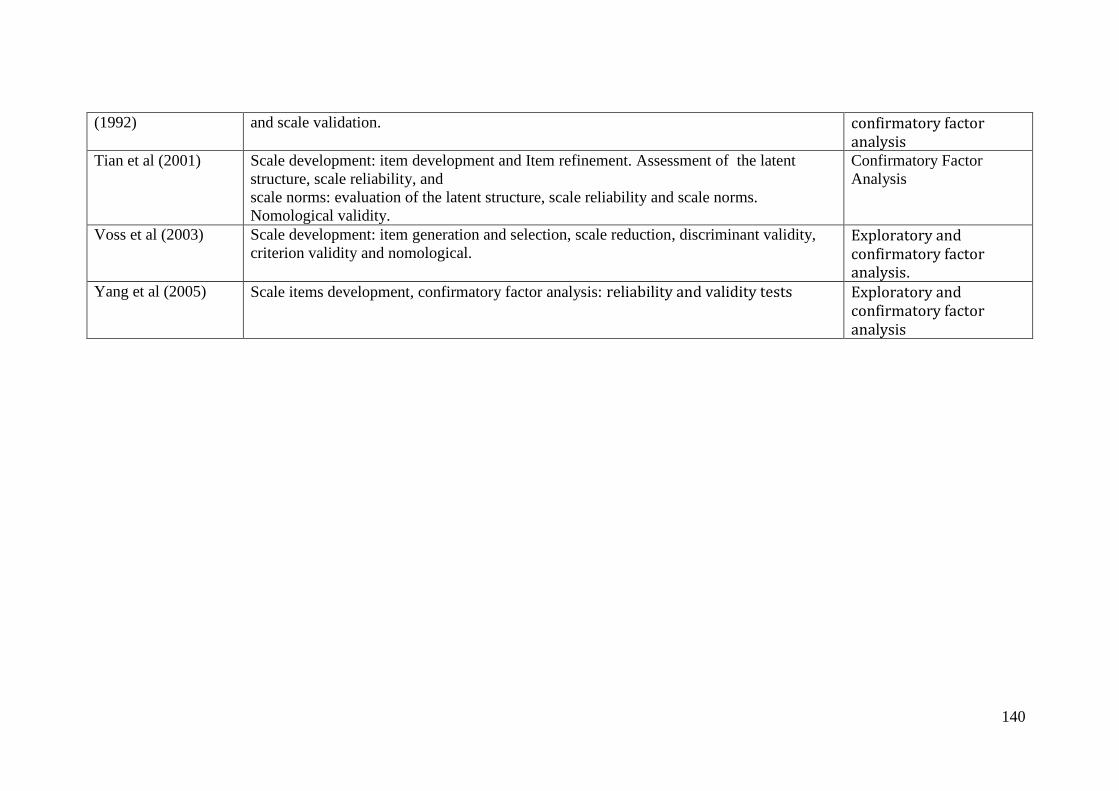
140
(1992) and scale validation. confirmatory factor analysis
Tian et al (2001) Scale development: item development and Item refinement. Assessment of the latent
structure, scale reliability, and
scale norms: evaluation of the latent structure, scale reliability and scale norms.
Nomological validity.
Confirmatory Factor
Analysis
Voss et al (2003) Scale development: item generation and selection, scale reduction, discriminant validity,
criterion validity and nomological. Exploratory and confirmatory factor analysis.
Yang et al (2005) Scale items development, confirmatory factor analysis: reliability and validity tests Exploratory and confirmatory factor analysis
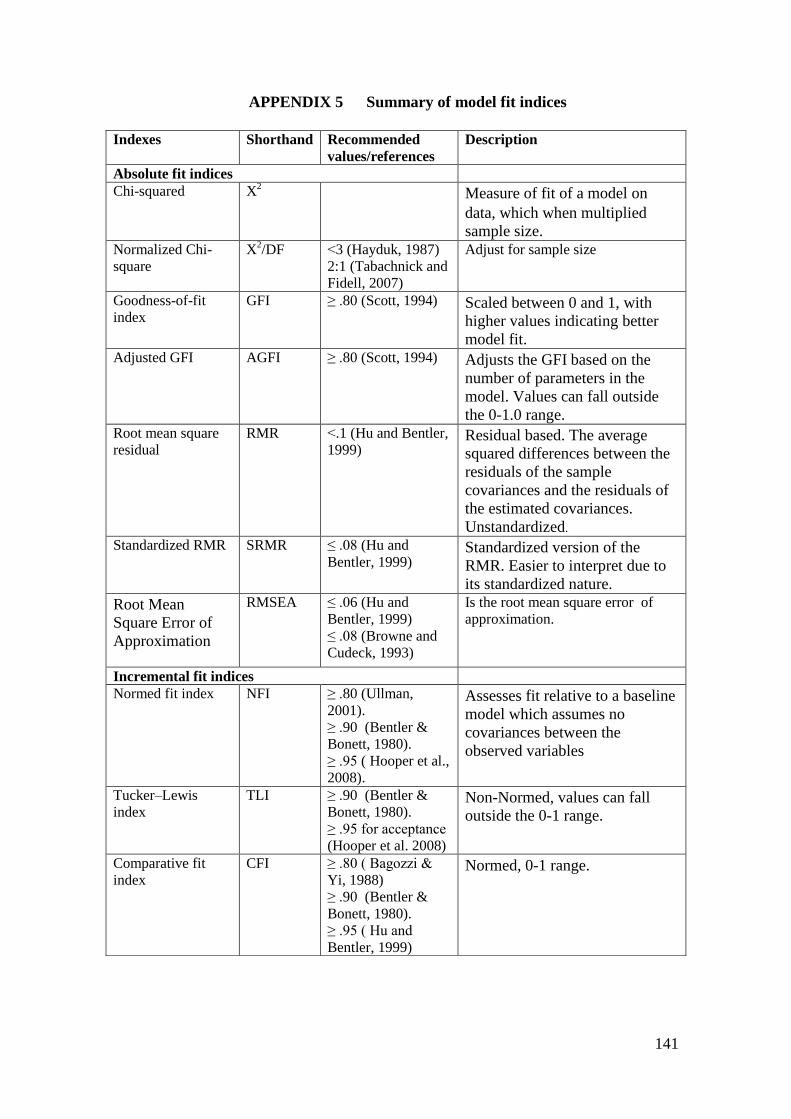
141
APPENDIX 5 Summary of model fit indices
Indexes Shorthand Recommended
values/references
Description
Absolute fit indices
Chi-squared X2
Measure of fit of a model on
data, which when multiplied
sample size. Normalized Chi-
square
X2/DF ˂3 (Hayduk, 1987)
2:1 (Tabachnick and
Fidell, 2007)
Adjust for sample size
Goodness-of-fit
index
GFI ≥ .80 (Scott, 1994) Scaled between 0 and 1, with
higher values indicating better
model fit. Adjusted GFI AGFI ≥ .80 (Scott, 1994) Adjusts the GFI based on the
number of parameters in the
model. Values can fall outside
the 0-1.0 range. Root mean square
residual
RMR ˂.1 (Hu and Bentler,
1999) Residual based. The average
squared differences between the
residuals of the sample
covariances and the residuals of
the estimated covariances.
Unstandardized.
Standardized RMR SRMR ≤ .08 (Hu and
Bentler, 1999) Standardized version of the
RMR. Easier to interpret due to
its standardized nature.
Root Mean
Square Error of
Approximation
RMSEA ≤ .06 (Hu and
Bentler, 1999)
≤ .08 (Browne and
Cudeck, 1993)
Is the root mean square error of
approximation.
Incremental fit indices
Normed fit index NFI ≥ .80 (Ullman,
2001).
≥ .90 (Bentler &
Bonett, 1980).
≥ .95 ( Hooper et al.,
2008).
Assesses fit relative to a baseline
model which assumes no
covariances between the
observed variables
Tucker–Lewis
index
TLI ≥ .90 (Bentler &
Bonett, 1980).
≥ .95 for acceptance
(Hooper et al. 2008)
Non-Normed, values can fall
outside the 0-1 range.
Comparative fit
index
CFI ≥ .80 ( Bagozzi &
Yi, 1988)
≥ .90 (Bentler &
Bonett, 1980).
≥ .95 ( Hu and
Bentler, 1999)
Normed, 0-1 range.
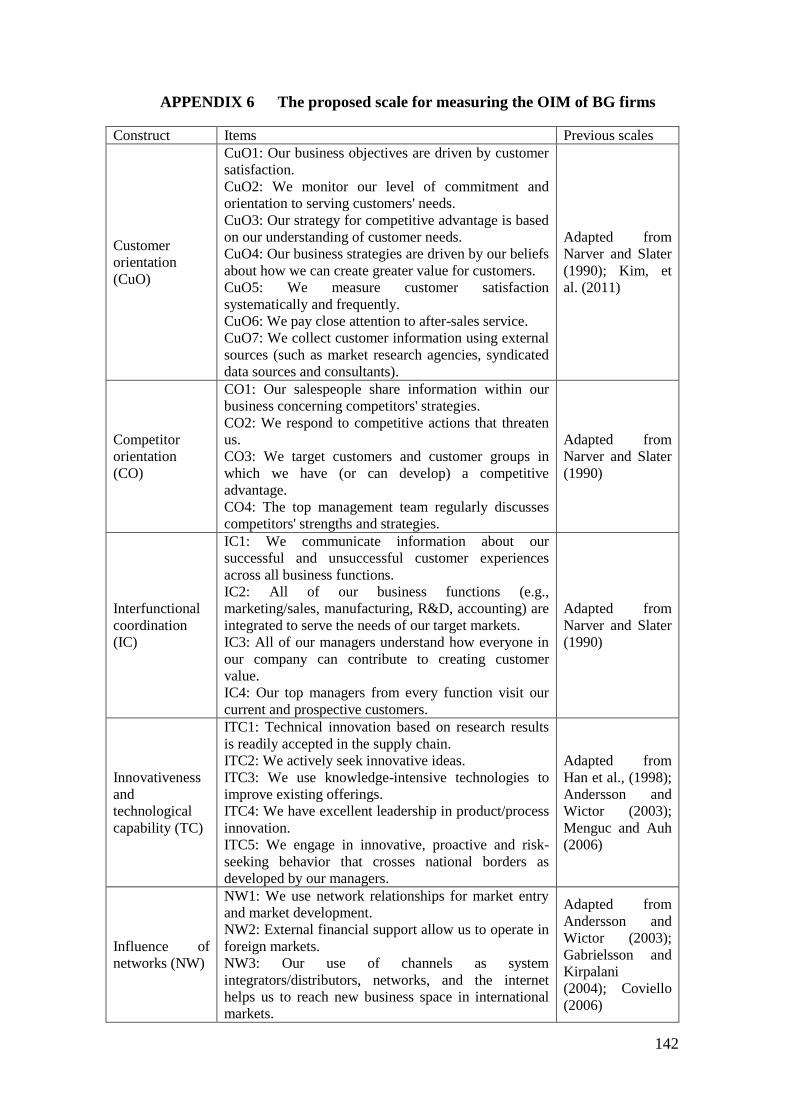
142
APPENDIX 6 The proposed scale for measuring the OIM of BG firms
Construct Items Previous scales
Customer
orientation (CuO)
CuO1: Our business objectives are driven by customer
satisfaction. CuO2: We monitor our level of commitment and
orientation to serving customers' needs. CuO3: Our strategy for competitive advantage is based
on our understanding of customer needs. CuO4: Our business strategies are driven by our beliefs
about how we can create greater value for customers. CuO5: We measure customer satisfaction
systematically and frequently. CuO6: We pay close attention to after-sales service. CuO7: We collect customer information using external
sources (such as market research agencies, syndicated
data sources and consultants).
Adapted from
Narver and Slater
(1990); Kim, et
al. (2011)
Competitor
orientation
(CO)
CO1: Our salespeople share information within our
business concerning competitors' strategies. CO2: We respond to competitive actions that threaten
us. CO3: We target customers and customer groups in
which we have (or can develop) a competitive
advantage. CO4: The top management team regularly discusses
competitors' strengths and strategies.
Adapted from
Narver and Slater
(1990)
Interfunctional
coordination
(IC)
IC1: We communicate information about our
successful and unsuccessful customer experiences
across all business functions. IC2: All of our business functions (e.g.,
marketing/sales, manufacturing, R&D, accounting) are
integrated to serve the needs of our target markets. IC3: All of our managers understand how everyone in
our company can contribute to creating customer
value. IC4: Our top managers from every function visit our
current and prospective customers.
Adapted from
Narver and Slater
(1990)
Innovativeness
and
technological
capability (TC)
ITC1: Technical innovation based on research results
is readily accepted in the supply chain. ITC2: We actively seek innovative ideas. ITC3: We use knowledge-intensive technologies to
improve existing offerings. ITC4: We have excellent leadership in product/process
innovation. ITC5: We engage in innovative, proactive and risk-
seeking behavior that crosses national borders as
developed by our managers.
Adapted from
Han et al., (1998);
Andersson and
Wictor (2003);
Menguc and Auh
(2006)
Influence of
networks (NW)
NW1: We use network relationships for market entry
and market development. NW2: External financial support allow us to operate in
foreign markets. NW3: Our use of channels as system
integrators/distributors, networks, and the internet
helps us to reach new business space in international
markets.
Adapted from
Andersson and
Wictor (2003);
Gabrielsson and
Kirpalani (2004); Coviello
(2006)
143
4 CHAPTER FOUR
THE EFFECT OF ORIENTATION TOWARDS INTERNATIONAL MARKETS ON THE BUSINESS
PERFORMANCE OF BORN GLOBAL FIRMS
ABSTRACT
Purpose- This chapter examines how the extended concept of market orientation for
born global firms that we have called orientation towards international markets (OIM,
which has four components: customer orientation, competitor orientation,
interfunctional coordination and innovativeness and technological capability) affects
business performance, as measured by customer performance and financial
performance, in the context of born global firms, and whether this effect varies between
countries.
Design/Methodology/Approach- The chapter uses data collected by web survey in a
sample survey of a data set of 165 born global firms. The technique of confirmatory
factor analysis is used to test the measurement properties of the study constructs, and
multi-group confirmatory factor analysis is used in testing the measurement invariance.
Subsequently, a structural equation modeling procedure is used to test the research
hypothesis developed on the basis of the literature review.
Findings- The results show that the OIM components have a positive and significant
effect on business performance in born global firms in both contexts (Nordic and
Spanish companies) through customer and financial performance.
Originality/Value- This chapter advances the domain of international entrepreneurship
into a new concept, OIM, which contributes to the achievement of superior performance
in BG firms.
Keywords: Born global firms, orientation towards international market, performance,
structural equation model.
Paper type: Research paper.
JEL Classification: C12, M13, M31, L25.
144
4.1 INTRODUCTION
The exploration of the relationship between MO and performance in the context of BG
firms has been limited, with a few exceptions (Arpa et al., 2012; Gabrielsson et al.,
2014). The lack of consistency in the findings about the importance of the MO construct
for firm performance in BG firms might be partly attributable to the fact that the
literature provides varying perspectives about the role of the different components of
market orientation. In particular, Lengler et al. (2013) argued that, in the international
context, the effect of firms‘ market orientation is still at an early stage of development.
The purpose of this chapter is to examine how the extended concept of market
orientation, in other words, orientation towards international markets, affects business
performance in the context of BG firms, and whether this effect varies between
countries. Therefore we address the following question: ―To what extent are born global
firms‘ performances impacted by their orientation towards international markets?‖ To
answer this question, we use structural equation modeling (SEM), and consider BG
firms from three different countries (Denmark, Finland and Spain).
This chapter is organized as follows. In the next section we review some of the relevant
literature that provides the foundation for this study. The focus is on the discussion in
the literature of the performance of BG firms, and we derive a hypothesis for empirical
examination. The next section introduces the methodological design for the assessment,
and the SEM. The fourth section presents the findings of the data analysis and the
results of the hypothesis. The final section discusses the findings and their implications
for academics, and further research.
4.2 LITERATURE REVIEW
In line with the study‘s objective of examining the impact of OIM on BG firms‘
performance, first, we present a brief review of the link between strategic orientation
and performance. Second, we review which type of performance measure is most
relevant to BGs. Third, we briefly present the two most prominent theoretical
frameworks that are associated with the sustainable business performance of OIM for
BG firms: the resource based view (RBV) and dynamic capability(DC).
145
4.2.1 Born global firms and strategic orientation
Recent studies have revealed the business strategies employed by BG firms influenced
them to succeed in the international markets and improved their performance (Hagen &
Zucchella; 2014; Su, 2013; Sui & Baum, 2015; Weerawardena et al., 2015). As pointed
out by Hagen et al. (2012) "strategic orientations influence organizational behaviour
which in turn might become manifest in strategies leading to competitive advantage that
ultimately influences performance" (p. 371). Studies exploring different types of
strategic orientations include international entrepreneurial orientation, learning
orientation and international-growth orientation (Gerschewski et al., 2015; Jantunen et
al., 2008); customer orientation and technological orientation (Jeong et al., 2006);
market orientation (Arpa et al., 2012; Laforet, 2008; Zhou et al., 2005). The strategic
orientations are defined as ―the guiding principles that influence a firm‘ marketing and
strategy-making activities‖ (Noble et al., 2002, p.25).
According to Cadogan (2012) "Strategic orientations do not exist in isolation: firms can
and do have multiple strategic orientations" (p. 346). In this sense, scholars have
highlighted the incorporation of various strategies within their studies, thus they have
adopted the multiple orientations and explored how strategic orientations are related
amongst themselves and their relationship with performance (Aziz & Omar, 2013;
Etemad, 2015; Hult et al., 2001; Kropp et al., 2006; Laukkanen et al., 2013; Sürer &
Mutlu, 2015). In relation to the question of if strategic orientation influences
performance, Hagen et al. (2012) described that market orientation, entrepreneurial
orientation and innovation orientation show a generally positive relationship with
performance in the international scope. Thus, several studies highlight the importance of
strategic orientation to the performance of BG firms. Kocak and Ambibola (2009) for
example, based on five BG firms, analyzed the effect of learning orientation,
entrepreneurial orientation and market orientation. The results show a positive effect on
firms‘ performance. Likewise, in their study of 299 Finnish companies, Jantunen et al.
(2008) explored the relevance of strategic orientation such as: entrepreneurial
orientation, learning orientation and International-growth orientation on performance.
They found that strategic orientation is related to the performance of the BG firms.
146
Although the evidence points to a general support for strategic orientations-performance
relationship (e.g. learning orientation, entrepreneurial orientation, brand orientation;
market orientation), MO is recognized as the key strategic orientation of the firms to
gain improved performance (Chad, 2014; Grinstein, 2006, 2008). Grinstein (2008),
aimed to understand the relationship of the MO with alternative strategies that have
been relevant for the business performance of the companies by conducting a meta-
analysis. The results of the relationship between MO and other strategies orientations
(innovation, learning, entrepreneurial, employee) was positive, thus MO can be viewed
as a core strategy of the firms.
Based on an extensive review of the literature that investigated multiple orientation and
the performance within the period of 1987 to 2010, Hakala (2011) covered a total of 67
articles. The findings show that the most relevant strategy was MO in comparison to
other orientations, like entrepreneurial orientation, learning orientation and technology
orientation. In a similar vein, Chad (2014) suggested that for non-profit companies, the
MO provides the most positive effect in enhancing performance "over and above all
other strategic orientations" (Chad, 2014 p. 92). Moreover, according to Odorici and
Presutti (2013) "market orientation have emerged relatively recently as potentially
important dimensions of strategic orientation that might explain the phenomenon of
BG" (p. 270).
In summary, strategic orientations are considered as an important source to the
international performance of the firms. Earlier works (Jantunen et al. 2008; Luostarinen
& Gabrielsson, 2006; Kirpalani & Gabrielsson, 2012; Knight, 2015) have shown the
importance of increasing research of MO as a key strategy of the BG firms. In response
to this call, in this study, we aim to explore OIM and its implication on business
performance of BG firms.
4.2.2 Measurement of performance in the context of born global firms
A close examination of the existing literature reveals a general consensus that an
increase in a firm‘s international operations will contribute positively to the
performance of the firm (Hult et al., 2008). However, as Zhou and Wu (2014)
147
recognize, there is still room for more research in the field of international
entrepreneurship (IE) linking early internationalization and performance: ―theoretical
development and empirical examination in the performance implications of early
internationalization has become a central topic in International Entrepreneurship (IE)
research‖ (p. 133). We have to recognize that performance has been used in the
literature on BG firms from different perspectives and with multidimensional measures
(Jones et al., 2011). The following discussion is organized according to the frame of
reference, the operationalization of performance, the data collection method, and the
measures themselves that are set out by Gerschewski and Xiao (2015) in their
classification of performance in BG research.
4.2.2.1 Frame of reference
Matthyssens and Pauwels, 1996, in their extensive review of how performance can be
measured, highlight two main frames of reference: the objective frame and the
subjective one. In a similar manner, according to Jones et al. (2011) and Aspelund et al.
(2007), most of the studies in the BG literature have adopted objective and/or subjective
measures of performance.
According to González-Benito and González-Benito (2005): ―The measurement of
performance can focus on objectively quantifiable accounting or operative indicators, or
on the subjective assessment of performance in comparison to objectives and
competitors‖ (p.798). For instance, Jantunen et al. (2008) aimed to evaluate the impact
of strategic orientation (entrepreneurial, learning, and international growth orientation)
on the international performance of Finnish BG firms. They used six items to evaluate
performance, and based their evaluation on subjective measures: sales volume, market
share, profitability, market entry, image development, and knowledge development.
Their results indicated that strategic orientation had a positive impact on international
performance. On the other hand, Park and Rhee (2012) linked knowledge competency
with an objective performance measurement that included six indicators (export sales,
resale of imported products, domestic sales of products manufactured, domestic sales
connected to licensing and royalties, foreign sales connected to licensing and royalties
and other sources). Their results, based on 271 South Korean BG firms, reveal that the
international business experience of managers and the use of networks are important
preconditions for building a knowledge base, and that this leads to superior international
performance.
148
Although seminal reviews of the literature (Aspelund et al., 2007; Hult et al., 2008)
have emphasized the value of using a combination of objective and subjective indicators
to measure performance, a preference for subjective indicators of performance was
recommended by some authors (Bener & Glaister, 2010). These authors detected that
subjective measures offer a better reflection of performance and are more direct
measures than objective measures. Thus, as is recommended in many BG studies
(Jantunen et al., 2008), in this research subjective measures will be considered.
4.2.2.2 Operationalization of performance
According to Hult et al. (2008) and Venkatraman and Ramanujam (1986), a broader
conceptualization of performance includes financial and operational dimensions,
including non-financial measures. Most of the studies of BG firms have adopted
financial measures, although there are a few exceptions that measure non-financial
performance (e.g. Mort & Weerawardena, 2006; Venkatraman & Ramanujan, 1986). In
one of the studies that measures non-financial performance, Mort and Weerawardena
(2006) measure performance using two non-financial items: entry into multiple markets
and rapid market expansion. They argue that ―it would be inappropriate to use profit and
ROI as indicators as these firms have not reached the stage of sustained growth‖
(p.565).
Financial performance has been measured using a variety of different indicators on
different dimensions (Venkatraman & Ramanujan, 1986). Appendix 7 presents the
items employed in empirical studies that measure performance in terms of accounting
performance (Gleason et al., 2006), business performance (Zhou et al., 2007), export
performance (Kuivalainen, et al., 2007), financial performance (Zhang et al., 2013),
growth performance (Han & Celly, 2008), international performance (Park & Rhee,
2012), sales performance (Kuivalainen et al., 2007), and strategic performance (Efrat, &
Shoham, 2012; Zhang et al., 2013).
After analyzing 96 studies in the field of international business, Hult et al. (2008) found
that the largest body of studies focus on financial performance (sales, ROA, ROI, and
profitability) and operational performance (market share and productivity).In a similar
way, the empirical work reviewed suggested that the dominant way of measuring
financial performance at the firm level was to consider sales growth, sales volume,
149
ROE, ROI, and profitability. The measure most often used for operational performance
was market share.
4.2.2.3 Data collection methods for measuring the performance of BG
firms
In the research on BG firms, a variety of data collection methods has been applied for
measuring performance. As shown in Appendix 6, primary data collection was mainly
used by the scholars. The majority of the studies reviewed here used surveys for data
collection, and employed quantitative methods (e.g. Kundu & Katz, 2003; Park & Rhee,
2012; Zhou & Wu, 2014). This position is the same as in SME internationalization
research, where the quantitative approach still dominates (Fillis 2007, p.123).
The studies on BG firms tend to use just one method, relying on the quantitative
approach. Only three studies integrated qualitative and quantitative approaches (Crick,
2009; Efrat & Shoham, 2012; Zhou et al., 2007). Even those studies applied a simple
two-step approach, such as interviews followed by a survey. Furthermore, Efrat and
Shoham (2012) and Zhou et al. (2007) reported only their survey results, again
highlighting the quantitative emphasis. Only Crick (2009) reported findings of both
interviews and surveys.
In general, when primary sources were used, performance was assessed in the studies as
a multidimensional/multilevel construct (see Appendix 7, with an exception being the
paper of Zhou et al. (2010)). The link between internationalization and performance has
received scholarly attention from several authors, and a positive connection between
these two aspects is generally assumed.
4.2.2.4 Extant measures of born global performance
The performance of BG firms has been conceptualized as ―the extent to which financial
and other goals are achieved as a function of business strategies‖ (Knight & Cavusgil
2004, p. 129). Scholars have measured performance in BG firms in a variety of ways,
measuring such things as marketing performance (Clark, 2000), brand performance
(O‘Cass & Ngo, 2007), employment performance (Sadikoglu & Zehir, 2010),
innovation performance (Rosenbusch et al., 2011), and new product performance
(Gatignon & Xuereb, 1997), among others. In our literature review of research on BG
firms, we detected that the majority of the studies included export performance,
150
international performance, and firm performance (Crick, 2009; Jones et al., 2011; Zhou
et al., 2010).
Export performance has attracted a great deal of attention among researchers during the
last couple of decades (Cavusgil & Zou, 1994; Katsikeas et al., 2000). In a
comprehensive meta-analysis, Gemünden (1991) found that there are many explanatory
variables for measuring export performance at the export venture level. This multiplicity
in the number of variables arises from the multi-disciplinary scope of the possible
assessment of export performance , which includes international business, international
entrepreneurship, and international marketing (Kahiya & Dean, 2014). However, as
pointed out by Katsikeas et al. (2000),―export performance is one of the most widely
researched but least understood and most contentious areas of international marketing‖
(p. 333). As result, there are difficulties in conceptualizing, operationalizing, and
measuring export performance (Leonidou & Katsikeas, 2010; Kahiya & Dean, 2014). In
BG research several studies have evaluated the impact on export performance of
strategic orientation (Kuivalainen et al., 2007), resources and intentions (Kundu & Katz,
2003), social networks (Zhou et al., 2007), information technology capability (Zhang et
al., 2013) and the role of the Internet (Sinkovics et al., 2013).
International performance has been theoretically and empirically linked to BG firms
research. There are a variety of determinants and measures employed in international
performance studies: for instance, according to Cicic et al. (2002), in order to measure a
firm‘s international performance four indicators could be used – sales, profits, change in
sales and change in profits. In the study conducted by Zhou et al. (2010), a one-
dimensional construct of international performance (international sales growth) was
employed to evaluate its relationship with the learning advantages of newness in 436
Chinese firms. Madsen (1987), taking into account the strategic view, identified two
strategies that impact positively on international performance: (1) communications with
customers/local representatives; and (2) the level of marketing/financial support for
local intermediaries. Along the same lines, Knight and Cavusgil (2004) found a positive
relationship between international performance and business strategies and
organizational culture. Their findings supported the proposition that strategies and
organizational culture maximize the international performance of BG firms.
151
The measurement of firm performance involves several alternatives in many of the
studies of BG firms. In an extensive overview of the IE field that highlighted
opportunities for marketing researchers, Styles and Seymour (2006) recommended
understanding performance in terms of survival, growth and profit. Many of the BG
firms studies included these measurements of firm performance (Gerschewski et al.,
2015; Johanson & Martin, 2015). Efrat and Shoham (2012) ―assessed the survival of the
BGs firms that refers to firms‘ ability to maintain independent operations‖ (p. 677).
They classified the survival of the firm as a long-term factor, and strategic performance
as having a short-term impact on the firm. Their findings reveal that management,
marketing, and technological capabilities affect the survival rates of firms.
Most of the studies reviewed suggested that there is a positive relationship between
being a BG and performance, in terms of growth and profit (Aspelund et al., 2007). In a
similar vein, Zhou and Wu (2014) examined the impact of early foreign market entry on
growth and profitability. The results indicated that early international entry had a
positive impact on sales growth, but unfortunately they did not find a positive
relationship with profitability.
4.2.3 Orientation towards international markets and performance: Using the approaches of the resource based view and dynamic capability
As we mentioned in the previous chapters of this thesis, the components of OIM are
rooted in the MO concept. The literature extensively documents the positive
relationship between market orientation and firm performance (Chang et al., 2014;
Kirca et al., 2005; Martin & Grbac, 2003;Tsai et al., 2008; Wang et al., 2012; Voss &
Voss, 2000). The conceptual frameworks that have supported the relationship between
the components of MO and performance in the academic literature are most often the
resource based view and dynamic capability (Armario et al., 2008; Hunt & Lambe,
2000; Martelo et al., 2011). These approaches have received growing attention in
strategic management, marketing and international business as sources of competitive
advantage for firms(Covin & Miller, 2014; Peng, 2001; Zahra et al., 2006). Liao et al.
(2011) stated that ―according to RBV, MO might increase an organization‘s ability to
understand and satisfy customers, thereby increasing its organizational capabilities‖ (p.
305). Because in this study OIM is rooted in the components of MO, we draw on the
152
RBV and DC as frameworks that support its relationship with performance. Thus, in the
next subsection we briefly explore these two approaches (RBV and DC).
4.2.3.1 The resource based view
The RBV of the firm has emerged from the strategic management field (Barney, 1991;
Peteraf, 1993;Wernerfelt, 1984) and is now also known as resource based theory (RBT)
(Barney et al., 2011; Peiris et al., 2012). It asserts that a firm‘s valuable, rare, inimitable
and non-substitutable resources allow it to develop long-term competitive advantages
that translate into superior performance (Barney, 1991). According to Nath et al. (2010),
RBT is built from the perspective that firms will have different resources and
capabilities that produce different performance results.
The rapid expansion of the RBT within the field of international business (IB) and
marketing has been analyzed in different pieces of research. Regarding the link between
the RBT and IB research, Peng (2001), on the basis of 66 articles, found that the RBT
played a part in different areas of IB such as the management of multinational firms,
strategic alliances, market entries, emerging markets, and IE. According to Peng
(2001)―the RBV has made IB research more theoretically rigorous‖ (p.819). An
extensive review of 291 articles on IE conducted by Peiris et al. (2012) found that the
RBT is one of the dominant frameworks used in the understanding of IE.
On the other hand, growing evidence in practice and academic research supports the
link between the RBT and marketing (Barney et al., 2011; Bharadwaj et al., 1993;
Capron & Hulland, 1999;Wernerfelt, 2014). An extensive literature review conducted
by Kozlenkova et al. (2014) showed that the use of the RBT within the field of
marketing had increased by more than 500% over a decade. Regarding the contribution
of the RBT within marketing, Kozlenkova et al. (2014) stated that RBT ―offers a
compelling framework for integrating multiple, dissimilar resources to explain their
synergistic, differential effects on performance and their associated contingencies‖
(p.18).
In the marketing literature, there has been extensive use of the RBT as a key theoretical
framework for analyzing the components of MO (Evanschitzky, 2007; He et al., 2013;
Hult & Ketchen 2001; Lonial & Carter, 2013; Tokarczyk et al., 2007). For instance,
drawing on the RBT, Menguc and Auh (2006) argued that MO, when linked with a high
153
level of innovativeness, has a stronger impact on firm performance. In a similar vein,
Hult and Ketchen (2001) found that innovation capability, entrepreneurship,
organizational learning, and MO enhance a firm‘s positional advantage. The authors
highlighted the fact that MO generates the strongest positional advantage. Lonial and
Carter (2013) connected MO, learning orientation, and entrepreneurial orientation as
sources of sustainable advantage that tend to lead to superior company performance.
Based on MO as a resource of the firm, Armario et al. (2008) found that this orientation
is viewed as an antecedent of the internationalization process for those SMEs that adopt
the sequential approach for operating in foreign markets.
Jaakkola et al. (2010), Merrilees et al. (2011), and Morgan et al. (2009), found that MO,
coupled with other marketing capabilities, enables the firm to gain competitive
advantage, which consequently leads to superior performance. In addition to the MO
components, the RBT also supports the components of OIM that are known as
innovativeness and technological capability (Kocak & Ambibola, 2009; Shou et al.,
2014). Thus, the RBT is particularly suitable for explaining OIM, because this
orientation can be understood as a company capability with a positive impact on firm
performance (Armario, et al., 2008; Hult et al., 2005).
4.2.3.2 Dynamic Capability
The dynamic capability (DC) framework is an extension of the RBV (Eisenhardt &
Martin, 2000). Teece et al. (1997) argued that DC enables firms to create a competitive
advantage. Additionally, researchers have demonstrated a positive relationship between
DC and performance (Eisenhardt & Martin, 2000; Hung et al., 2010; Lin & Wu, 2014;
Slater et al., 2006; Zott, 2003). For example, Eriksson (2014) conducted a survey of 142
studies using DC and found that the outcomes of DC have been analyzed mainly in
terms of performance. Zahra et al. (2006) explored the role of DC within the
entrepreneurship literature, and, for them, ―the effect of dynamic capabilities on
performance will depend on the quality of the organization‘s knowledge base‖ (p. 943).
The quantity of research conducted on the topic of DC has grown significantly, and
scholars have adopted the use of DC in the fields of IB and marketing (Cavusgil et al.,
2007; Peiris et al., 2012). Regarding IB and the DC approach, the existing literature has
focused on the influence of DC on international expansion (Luo, 2000) and the
internationalization process and performance (Prange & Verdier, 2011), and the
154
relationship of DC with the accelerated internationalization of BG firms/INVs (Evers,
2011;Weerawardena et al., 2007). Furthermore, according to Evers (2011) and
Schweizer et al. (2010), the capabilities of networking and learning have a positive
effect on the internationalization process. On the other hand, the use of DC in the
marketing research shows the emergence of a diversity of approaches such as marketing
capability (Vorhies et al., 2011), marketing dynamic capability (Fang & Zou, 2009), and
dynamic marketing capabilities (Wang et al., 2013). According to Morgan (2012),
dynamic marketing capability has emerged from DC theory and the strategic marketing
literature, and is composed of market learning, resource reconfiguration, and capability
enhancement. Blesa and Ripollés (2008) explored the impact of marketing capability on
performance. Their results indicated that marketing capability has a positive effect on
firms‘ performance. According to Barrales-Molina et al. (2013), marketing capability
incorporates the role of MO. Some studies (e.g. Barreto, 2010; Foley & Fahy, 2009;
Van Raaij & Stoelhorst, 2008) found a clear relationship between DC and the MO
components. The definition offered by Kyriakopoulos and Moorman (2004)describes
MO as ―a firm's capability to anticipate market requirements ahead of competitors and
to create durable relationships with customers, channel members, and suppliers‖
(p.220).
The components of MO have a positive relationship with a number of capabilities, such
as market-sensing capability (Day, 1994), knowledge management (Martelo et al.,
2011), and customer relationship management (Hooley et al., 2005). Likewise, the
integration of DC into the MO field has been addressed as a determinant of
performance; for instance, Menguc and Auh (2006), using a survey of 242 Australian
firms, argued that MO as a DC, in combination with innovativeness, has a positive
effect on firm performance. Olavarrieta and Friedmann (2008) linked the MO
components and DC and identified the components as factors that determine firms‘
performance. Moreover, the components of OIM (innovativeness and technological
capability) have previously been referred to as the DC of firms (McAdam et al., 2014;
Weerawardena et al., 2015).
Therefore, studies have indeed concluded that MO provides firms with market-sensing
and customer-linking capabilities that enhance organizational performance (Hult &
Ketchen, 2001). In terms of customer-related benefits, MO has been found to enhance
customer satisfaction and loyalty, because market-oriented firms are well positioned to
155
anticipate customer needs and to offer goods and services to satisfy those needs (Slater
& Narver, 1994). In relation to this, it has been asserted by BG scholars that the
components of OIM are critical determinants for performance (Gerschewski et al.,
2015; Knight & Cavusgil, 2004). Consequently, much of the empirical research on MO
(including in the context of domestic firms and exporters) has tested the relationship
between MO and performance, and the mainstream theory seems to suggest a positive
impact of the extended construct of MO, OIM, on performance; therefore, this study
presents the following hypothesis:
The higher the orientation towards international markets of a born global firm, the
higher the performance of this company.
4.3 METHODOLOGY
4.3.1 Sample
In this study, as detailed in chapter three, the data collected in the multi-country context
were evaluated through the recommended test of non-response bias. In order to test the
hypothesis, and assess the performance construct, we used the total of 165 BG firms.
In addition, as in the previous chapter, this study also examined the common method
bias by running Harman‘s one- factor tests. Based in Nordics sample (n=83), the factor
analytic results indicated the existence of three factors with eigenvalue greater than 1.0.
The three factors explained the 63.48% variance. With regards to the Spanish firms
(n=82), the results show that three factor were extracted with eigenvalues greater than 1,
accounting for 69.12%. There was no single factor that emerged that could account for
the majority of the covariance in the measures, suggesting that no common method
variance occurred.
4.3.2 Data analysis technique
Structural Equation Modeling (SEM) is an important tool that has been applied in the
field of marketing and IE (Iacobucci, 2009; Park & Rhee, 2012). This analytical
technique is appropriate for specifying, estimating, and evaluating models of linear
relationship among a set of observable variables with respect to what is usually a
smaller number of unobserved variables (Bentler, 1995; Bollen, 1989). SEM ―also helps
to avoid bias that may be cause by running individual regressions, by incorporating
measurement errors into the model‖ (Park & Rhee, 2012, p.1373). In general, SEM is
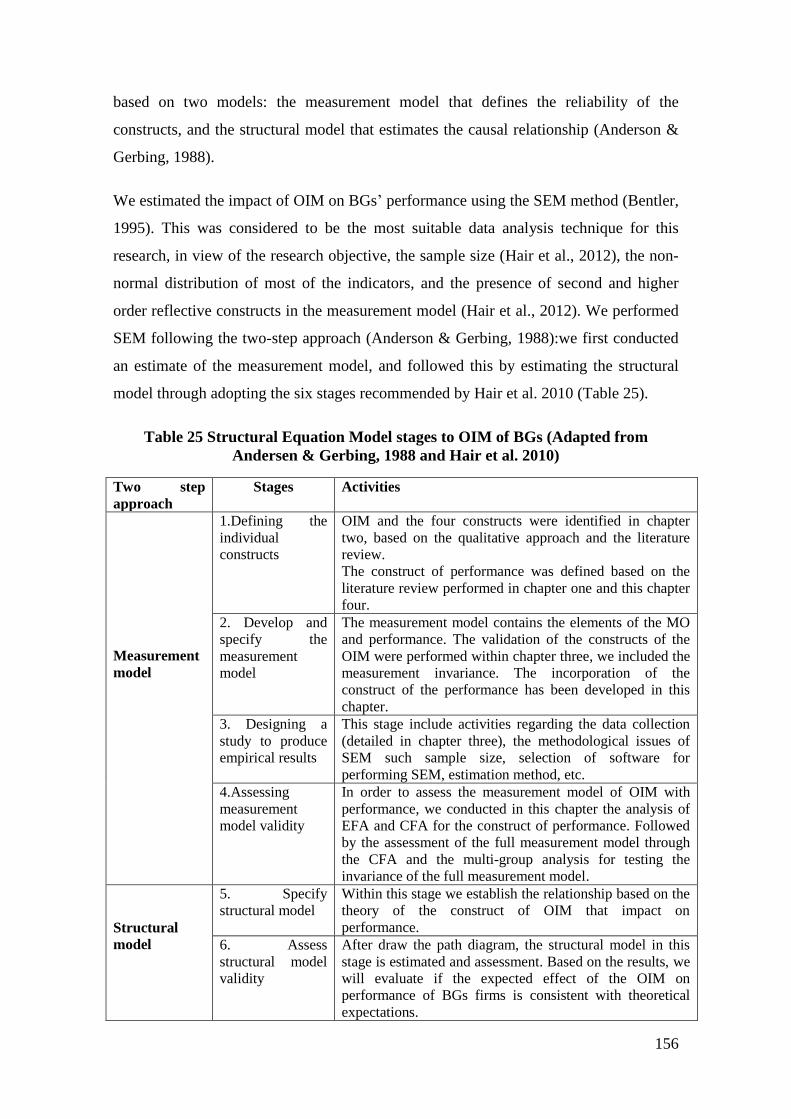
156
based on two models: the measurement model that defines the reliability of the
constructs, and the structural model that estimates the causal relationship (Anderson &
Gerbing, 1988).
We estimated the impact of OIM on BGs‘ performance using the SEM method (Bentler,
1995). This was considered to be the most suitable data analysis technique for this
research, in view of the research objective, the sample size (Hair et al., 2012), the non-
normal distribution of most of the indicators, and the presence of second and higher
order reflective constructs in the measurement model (Hair et al., 2012). We performed
SEM following the two-step approach (Anderson & Gerbing, 1988):we first conducted
an estimate of the measurement model, and followed this by estimating the structural
model through adopting the six stages recommended by Hair et al. 2010 (Table 25).
Table 25 Structural Equation Model stages to OIM of BGs (Adapted from
Andersen & Gerbing, 1988 and Hair et al. 2010)
Two step
approach
Stages Activities
Measurement
model
1.Defining the
individual
constructs
OIM and the four constructs were identified in chapter
two, based on the qualitative approach and the literature
review.
The construct of performance was defined based on the
literature review performed in chapter one and this chapter
four.
2. Develop and
specify the
measurement
model
The measurement model contains the elements of the MO
and performance. The validation of the constructs of the
OIM were performed within chapter three, we included the
measurement invariance. The incorporation of the
construct of the performance has been developed in this
chapter.
3. Designing a
study to produce
empirical results
This stage include activities regarding the data collection
(detailed in chapter three), the methodological issues of
SEM such sample size, selection of software for
performing SEM, estimation method, etc.
4.Assessing
measurement
model validity
In order to assess the measurement model of OIM with
performance, we conducted in this chapter the analysis of
EFA and CFA for the construct of performance. Followed
by the assessment of the full measurement model through
the CFA and the multi-group analysis for testing the
invariance of the full measurement model.
Structural
model
5. Specify
structural model
Within this stage we establish the relationship based on the
theory of the construct of OIM that impact on
performance.
6. Assess
structural model
validity
After draw the path diagram, the structural model in this
stage is estimated and assessment. Based on the results, we
will evaluate if the expected effect of the OIM on
performance of BGs firms is consistent with theoretical
expectations.
157
4.3.3 Data analysis tools/issues with SEM
There are several features that need to be taken into account in order to perform SEM,
as recommended by Hair et al. (1988) and Shah and Goldstein (2006): the sample size,
whether the data follow a normal distribution, the estimation method, and the fit indices.
4.3.3.1 Sample size
Sample size is an important aspect to consider when SEM becomes the technique to be
implemented in research. There are some guidelines about the appropriate sample size
when using SEM. According to Hair et al. (2010) the sample size depends on the model
characteristics – the model size and the score characteristics of the measured variables.
For instance, the recommended sample size for a model with five or fewer constructs
that each contains around three items is 100 observations. If the model has a large
number of constructs (each one with fewer than three items) then the minimum sample
size is 500 observations (Hair et al., 2010).
Nevertheless, there is an ongoing debate about appropriate sample size. According to
Ding et al. (1995), the smallest sample size that should be used in studies when
conducting SEM is between 100 and 150 observations. In a similar vein, Anderson and
Gerbing (1988) suggested that a sample size of between 100 and 150 will be sufficient
for performing SEM. In an extensive review of studies that use SEM, conducted by
Schumacker and Lomax (2010), it was found that the sample sizes were between 250
and 500 subjects. Regarding the discussion on sample size for performing SEM,
Iacobucci (2010) stated that ―the vague, folklore rule of thumb considering requisite
sample size, e.g., ‗n>200‘ can be conservative, and is surely simplistic‖ (p. 92). She
found that even with smaller samples, within the range of 50 to 100, SEM can perform
well.
In order to determine the suitability of the sample size of this study, we used the
estimator developed by Westland (2010) for computing the minimum sample size
needed to detect a minimum effect at given power and significance levels in the SEM.
This estimator takes into account the ratio of indicators (measures) to latent variables,
and statistical power. Following the recommendation of Westland (2010), we used the
power calculator (Soper, 2014) for our model that has six latent variables and 18
observed variables. The results indicated a minimum sample size of 128 observations.
Our sample size exceeded this recommendation, because we used a total sample of 165
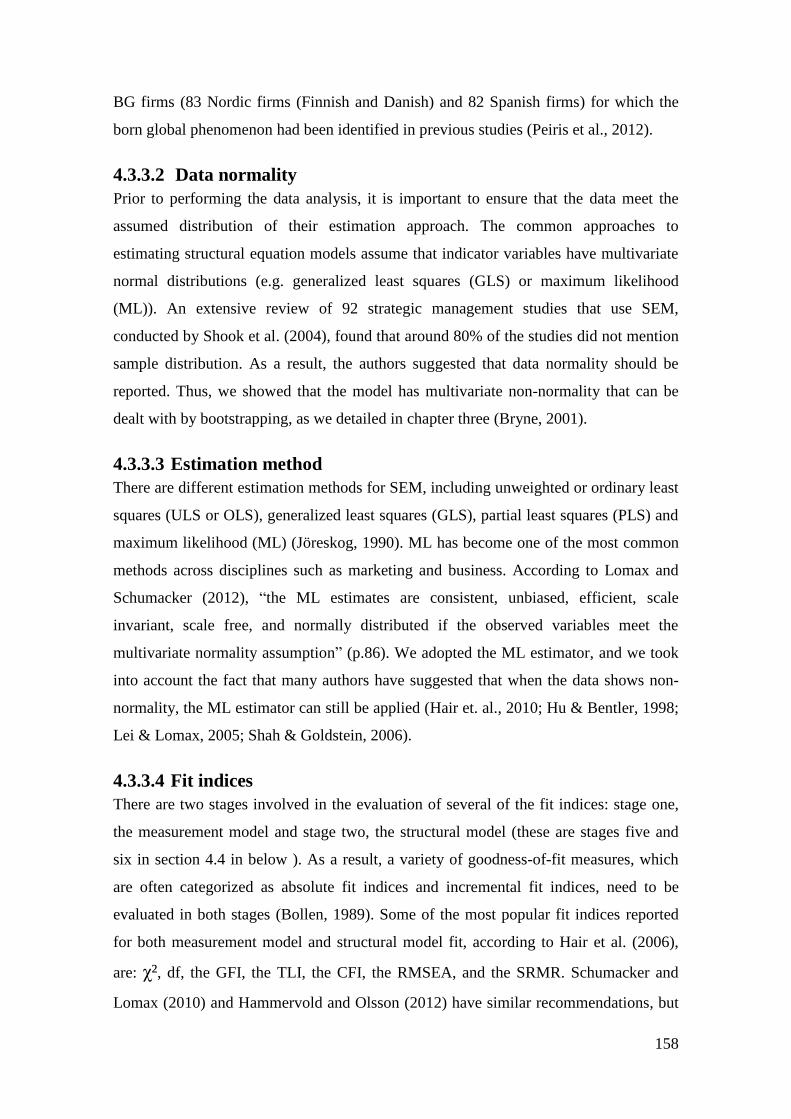
158
BG firms (83 Nordic firms (Finnish and Danish) and 82 Spanish firms) for which the
born global phenomenon had been identified in previous studies (Peiris et al., 2012).
4.3.3.2 Data normality
Prior to performing the data analysis, it is important to ensure that the data meet the
assumed distribution of their estimation approach. The common approaches to
estimating structural equation models assume that indicator variables have multivariate
normal distributions (e.g. generalized least squares (GLS) or maximum likelihood
(ML)). An extensive review of 92 strategic management studies that use SEM,
conducted by Shook et al. (2004), found that around 80% of the studies did not mention
sample distribution. As a result, the authors suggested that data normality should be
reported. Thus, we showed that the model has multivariate non-normality that can be
dealt with by bootstrapping, as we detailed in chapter three (Bryne, 2001).
4.3.3.3 Estimation method
There are different estimation methods for SEM, including unweighted or ordinary least
squares (ULS or OLS), generalized least squares (GLS), partial least squares (PLS) and
maximum likelihood (ML) (Jöreskog, 1990). ML has become one of the most common
methods across disciplines such as marketing and business. According to Lomax and
Schumacker (2012), ―the ML estimates are consistent, unbiased, efficient, scale
invariant, scale free, and normally distributed if the observed variables meet the
multivariate normality assumption‖ (p.86). We adopted the ML estimator, and we took
into account the fact that many authors have suggested that when the data shows non-
normality, the ML estimator can still be applied (Hair et. al., 2010; Hu & Bentler, 1998;
Lei & Lomax, 2005; Shah & Goldstein, 2006).
4.3.3.4 Fit indices
There are two stages involved in the evaluation of several of the fit indices: stage one,
the measurement model and stage two, the structural model (these are stages five and
six in section 4.4 in below ). As a result, a variety of goodness-of-fit measures, which
are often categorized as absolute fit indices and incremental fit indices, need to be
evaluated in both stages (Bollen, 1989). Some of the most popular fit indices reported
for both measurement model and structural model fit, according to Hair et al. (2006),
are: χ², df, the GFI, the TLI, the CFI, the RMSEA, and the SRMR. Schumacker and
Lomax (2010) and Hammervold and Olsson (2012) have similar recommendations, but
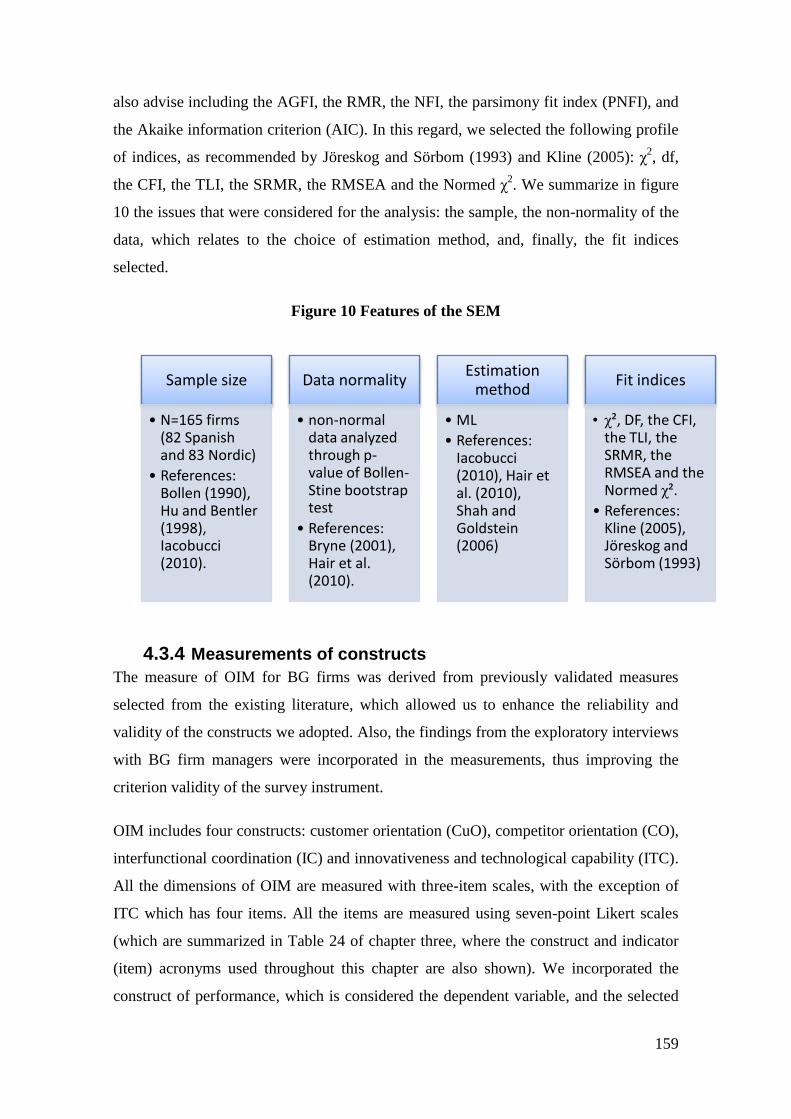
159
Sample size
• N=165 firms (82 Spanish and 83 Nordic)
• References: Bollen (1990), Hu and Bentler (1998), Iacobucci (2010).
Data normality
• non-normal data analyzed through p-value of Bollen-Stine bootstrap test
• References: Bryne (2001), Hair et al. (2010).
Estimation method
• ML
• References: Iacobucci (2010), Hair et al. (2010), Shah and Goldstein (2006)
Fit indices
• χ², DF, the CFI, the TLI, the SRMR, the RMSEA and the Normed χ².
• References: Kline (2005), Jöreskog and Sörbom (1993)
also advise including the AGFI, the RMR, the NFI, the parsimony fit index (PNFI), and
the Akaike information criterion (AIC). In this regard, we selected the following profile
of indices, as recommended by Jöreskog and Sörbom (1993) and Kline (2005): χ2, df,
the CFI, the TLI, the SRMR, the RMSEA and the Normed χ2. We summarize in figure
10 the issues that were considered for the analysis: the sample, the non-normality of the
data, which relates to the choice of estimation method, and, finally, the fit indices
selected.
Figure 10 Features of the SEM
4.3.4 Measurements of constructs
The measure of OIM for BG firms was derived from previously validated measures
selected from the existing literature, which allowed us to enhance the reliability and
validity of the constructs we adopted. Also, the findings from the exploratory interviews
with BG firm managers were incorporated in the measurements, thus improving the
criterion validity of the survey instrument.
OIM includes four constructs: customer orientation (CuO), competitor orientation (CO),
interfunctional coordination (IC) and innovativeness and technological capability (ITC).
All the dimensions of OIM are measured with three-item scales, with the exception of
ITC which has four items. All the items are measured using seven-point Likert scales
(which are summarized in Table 24 of chapter three, where the construct and indicator
(item) acronyms used throughout this chapter are also shown). We incorporated the
construct of performance, which is considered the dependent variable, and the selected
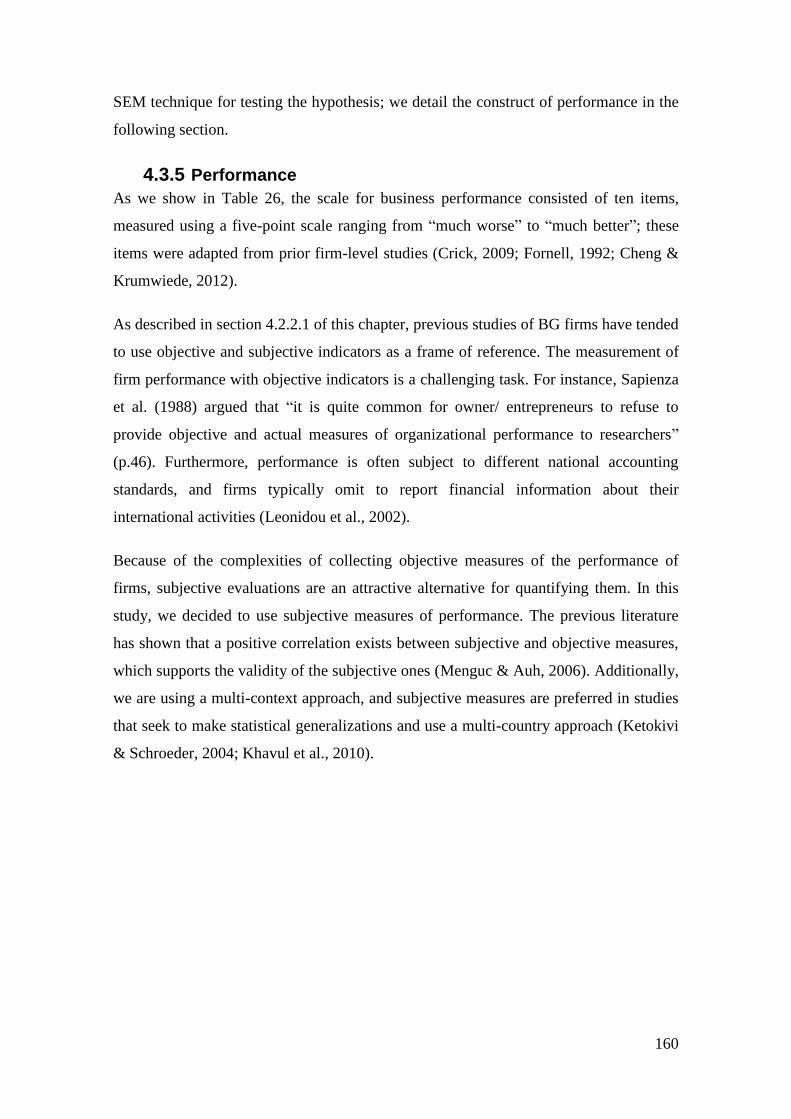
160
SEM technique for testing the hypothesis; we detail the construct of performance in the
following section.
4.3.5 Performance
As we show in Table 26, the scale for business performance consisted of ten items,
measured using a five-point scale ranging from ―much worse‖ to ―much better‖; these
items were adapted from prior firm-level studies (Crick, 2009; Fornell, 1992; Cheng &
Krumwiede, 2012).
As described in section 4.2.2.1 of this chapter, previous studies of BG firms have tended
to use objective and subjective indicators as a frame of reference. The measurement of
firm performance with objective indicators is a challenging task. For instance, Sapienza
et al. (1988) argued that ―it is quite common for owner/ entrepreneurs to refuse to
provide objective and actual measures of organizational performance to researchers‖
(p.46). Furthermore, performance is often subject to different national accounting
standards, and firms typically omit to report financial information about their
international activities (Leonidou et al., 2002).
Because of the complexities of collecting objective measures of the performance of
firms, subjective evaluations are an attractive alternative for quantifying them. In this
study, we decided to use subjective measures of performance. The previous literature
has shown that a positive correlation exists between subjective and objective measures,
which supports the validity of the subjective ones (Menguc & Auh, 2006). Additionally,
we are using a multi-context approach, and subjective measures are preferred in studies
that seek to make statistical generalizations and use a multi-country approach (Ketokivi
& Schroeder, 2004; Khavul et al., 2010).
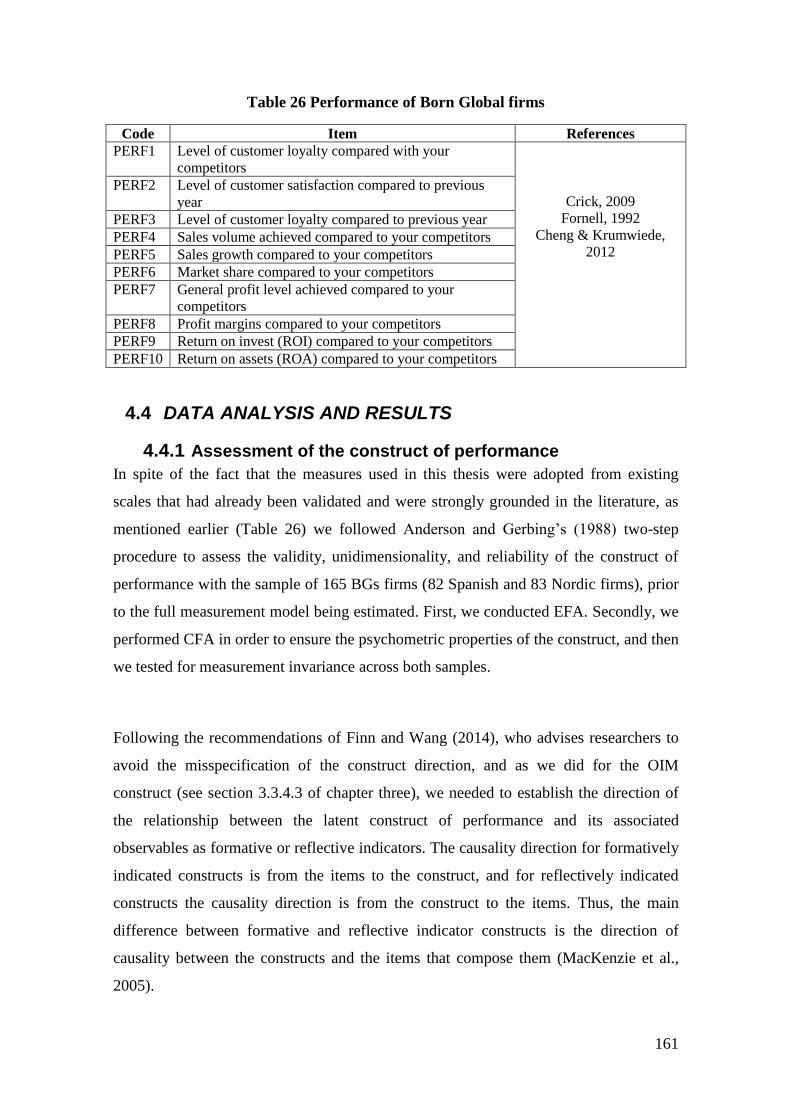
161
Table 26 Performance of Born Global firms
Code Item References
PERF1 Level of customer loyalty compared with your
competitors
Crick, 2009
Fornell, 1992
Cheng & Krumwiede,
2012
PERF2 Level of customer satisfaction compared to previous
year
PERF3 Level of customer loyalty compared to previous year
PERF4 Sales volume achieved compared to your competitors
PERF5 Sales growth compared to your competitors
PERF6 Market share compared to your competitors
PERF7 General profit level achieved compared to your
competitors
PERF8 Profit margins compared to your competitors
PERF9 Return on invest (ROI) compared to your competitors
PERF10 Return on assets (ROA) compared to your competitors
4.4 DATA ANALYSIS AND RESULTS
4.4.1 Assessment of the construct of performance
In spite of the fact that the measures used in this thesis were adopted from existing
scales that had already been validated and were strongly grounded in the literature, as
mentioned earlier (Table 26) we followed Anderson and Gerbing‘s (1988) two-step
procedure to assess the validity, unidimensionality, and reliability of the construct of
performance with the sample of 165 BGs firms (82 Spanish and 83 Nordic firms), prior
to the full measurement model being estimated. First, we conducted EFA. Secondly, we
performed CFA in order to ensure the psychometric properties of the construct, and then
we tested for measurement invariance across both samples.
Following the recommendations of Finn and Wang (2014), who advises researchers to
avoid the misspecification of the construct direction, and as we did for the OIM
construct (see section 3.3.4.3 of chapter three), we needed to establish the direction of
the relationship between the latent construct of performance and its associated
observables as formative or reflective indicators. The causality direction for formatively
indicated constructs is from the items to the construct, and for reflectively indicated
constructs the causality direction is from the construct to the items. Thus, the main
difference between formative and reflective indicator constructs is the direction of
causality between the constructs and the items that compose them (MacKenzie et al.,
2005).
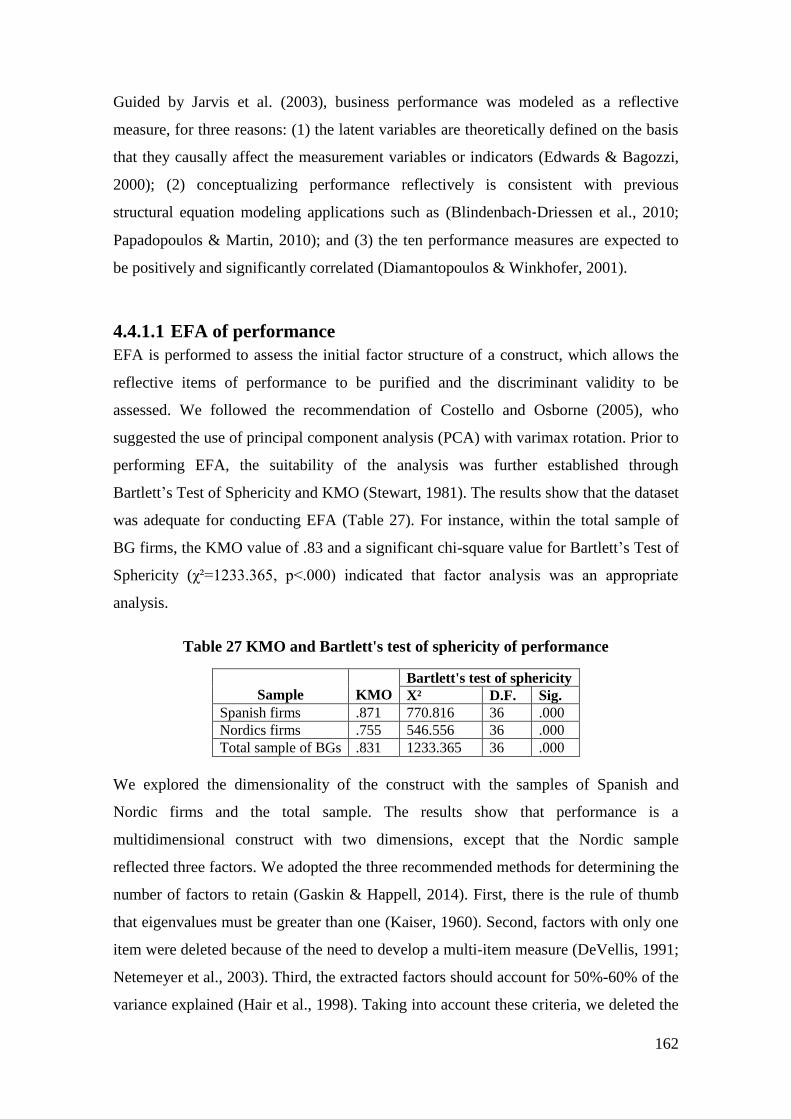
162
Guided by Jarvis et al. (2003), business performance was modeled as a reflective
measure, for three reasons: (1) the latent variables are theoretically defined on the basis
that they causally affect the measurement variables or indicators (Edwards & Bagozzi,
2000); (2) conceptualizing performance reflectively is consistent with previous
structural equation modeling applications such as (Blindenbach‐Driessen et al., 2010;
Papadopoulos & Martin, 2010); and (3) the ten performance measures are expected to
be positively and significantly correlated (Diamantopoulos & Winkhofer, 2001).
4.4.1.1 EFA of performance
EFA is performed to assess the initial factor structure of a construct, which allows the
reflective items of performance to be purified and the discriminant validity to be
assessed. We followed the recommendation of Costello and Osborne (2005), who
suggested the use of principal component analysis (PCA) with varimax rotation. Prior to
performing EFA, the suitability of the analysis was further established through
Bartlett‘s Test of Sphericity and KMO (Stewart, 1981). The results show that the dataset
was adequate for conducting EFA (Table 27). For instance, within the total sample of
BG firms, the KMO value of .83 and a significant chi-square value for Bartlett‘s Test of
Sphericity (χ²=1233.365, p˂.000) indicated that factor analysis was an appropriate
analysis.
Table 27 KMO and Bartlett's test of sphericity of performance
Sample
KMO
Bartlett's test of sphericity
X² D.F. Sig.
Spanish firms .871 770.816 36 .000
Nordics firms .755 546.556 36 .000
Total sample of BGs .831 1233.365 36 .000
We explored the dimensionality of the construct with the samples of Spanish and
Nordic firms and the total sample. The results show that performance is a
multidimensional construct with two dimensions, except that the Nordic sample
reflected three factors. We adopted the three recommended methods for determining the
number of factors to retain (Gaskin & Happell, 2014). First, there is the rule of thumb
that eigenvalues must be greater than one (Kaiser, 1960). Second, factors with only one
item were deleted because of the need to develop a multi-item measure (DeVellis, 1991;
Netemeyer et al., 2003). Third, the extracted factors should account for 50%-60% of the
variance explained (Hair et al., 1998). Taking into account these criteria, we deleted the
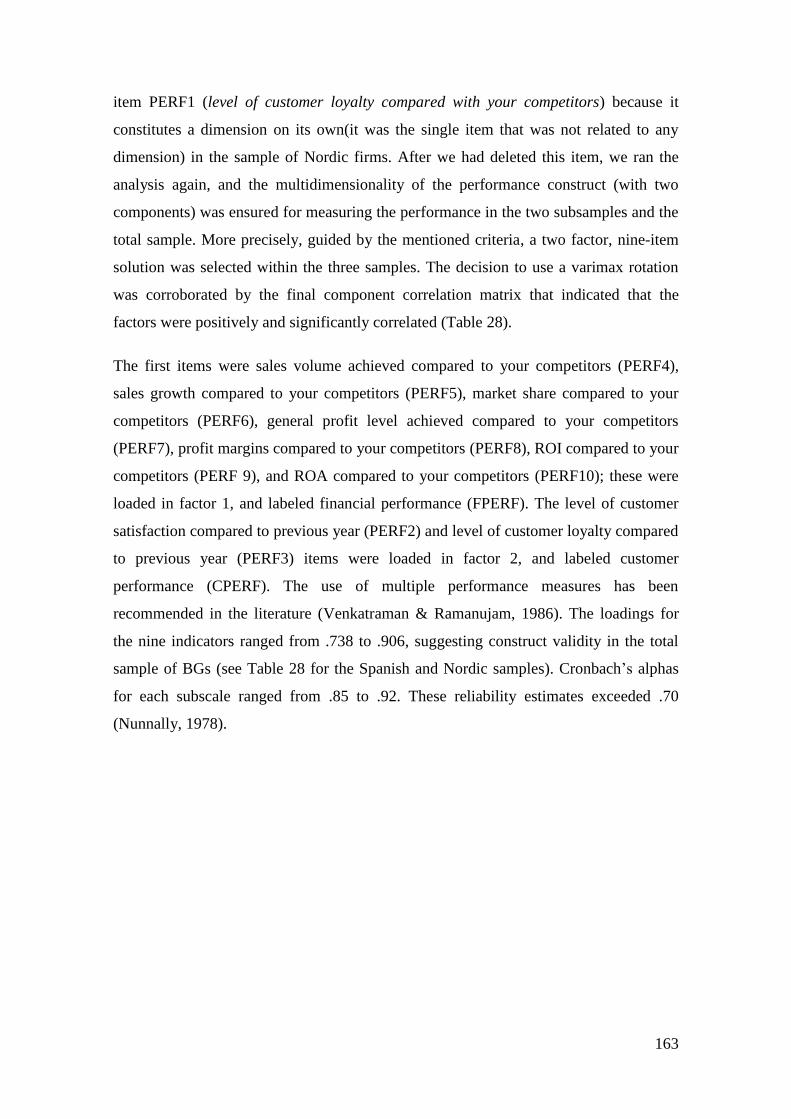
163
item PERF1 (level of customer loyalty compared with your competitors) because it
constitutes a dimension on its own(it was the single item that was not related to any
dimension) in the sample of Nordic firms. After we had deleted this item, we ran the
analysis again, and the multidimensionality of the performance construct (with two
components) was ensured for measuring the performance in the two subsamples and the
total sample. More precisely, guided by the mentioned criteria, a two factor, nine-item
solution was selected within the three samples. The decision to use a varimax rotation
was corroborated by the final component correlation matrix that indicated that the
factors were positively and significantly correlated (Table 28).
The first items were sales volume achieved compared to your competitors (PERF4),
sales growth compared to your competitors (PERF5), market share compared to your
competitors (PERF6), general profit level achieved compared to your competitors
(PERF7), profit margins compared to your competitors (PERF8), ROI compared to your
competitors (PERF 9), and ROA compared to your competitors (PERF10); these were
loaded in factor 1, and labeled financial performance (FPERF). The level of customer
satisfaction compared to previous year (PERF2) and level of customer loyalty compared
to previous year (PERF3) items were loaded in factor 2, and labeled customer
performance (CPERF). The use of multiple performance measures has been
recommended in the literature (Venkatraman & Ramanujam, 1986). The loadings for
the nine indicators ranged from .738 to .906, suggesting construct validity in the total
sample of BGs (see Table 28 for the Spanish and Nordic samples). Cronbach‘s alphas
for each subscale ranged from .85 to .92. These reliability estimates exceeded .70
(Nunnally, 1978).
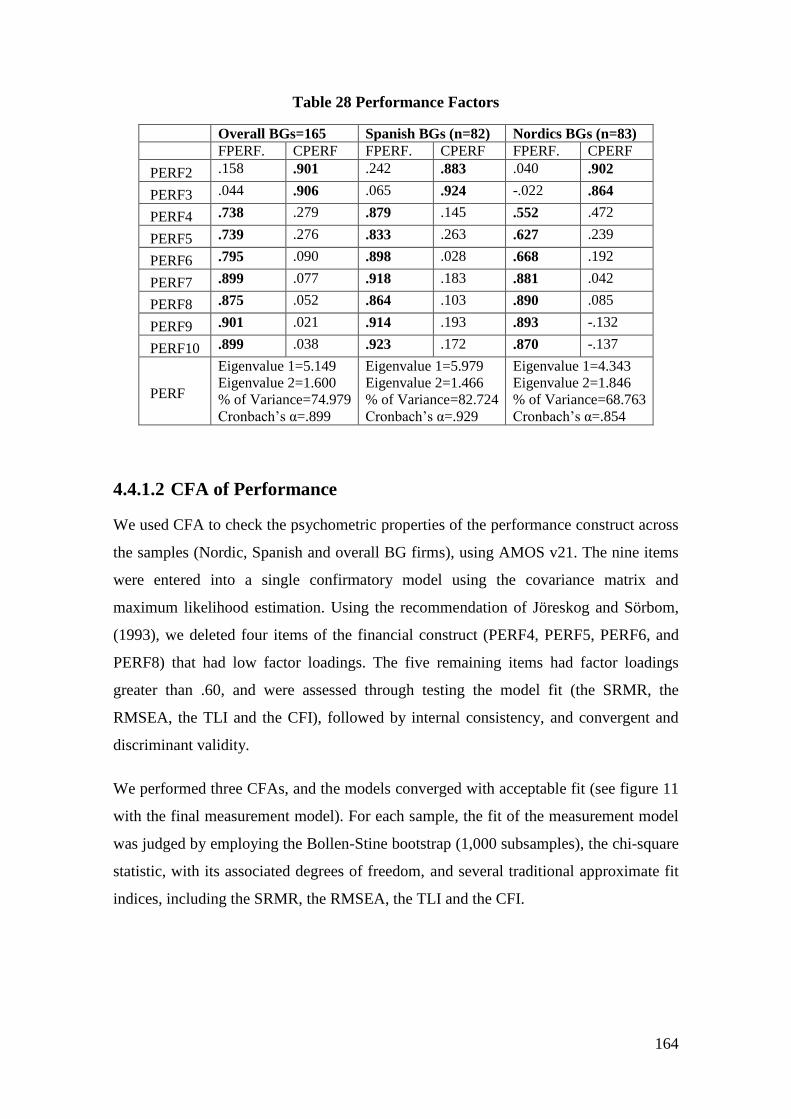
164
Table 28 Performance Factors
Overall BGs=165 Spanish BGs (n=82) Nordics BGs (n=83)
FPERF. CPERF FPERF. CPERF FPERF. CPERF
PERF2 .158 .901 .242 .883 .040 .902
PERF3 .044 .906 .065 .924 -.022 .864
PERF4 .738 .279 .879 .145 .552 .472
PERF5 .739 .276 .833 .263 .627 .239
PERF6 .795 .090 .898 .028 .668 .192
PERF7 .899 .077 .918 .183 .881 .042
PERF8 .875 .052 .864 .103 .890 .085
PERF9 .901 .021 .914 .193 .893 -.132
PERF10 .899 .038 .923 .172 .870 -.137
PERF
Eigenvalue 1=5.149
Eigenvalue 2=1.600
% of Variance=74.979
Cronbach‘s α=.899
Eigenvalue 1=5.979
Eigenvalue 2=1.466
% of Variance=82.724
Cronbach‘s α=.929
Eigenvalue 1=4.343
Eigenvalue 2=1.846
% of Variance=68.763
Cronbach‘s α=.854
4.4.1.2 CFA of Performance
We used CFA to check the psychometric properties of the performance construct across
the samples (Nordic, Spanish and overall BG firms), using AMOS v21. The nine items
were entered into a single confirmatory model using the covariance matrix and
maximum likelihood estimation. Using the recommendation of Jöreskog and Sörbom,
(1993), we deleted four items of the financial construct (PERF4, PERF5, PERF6, and
PERF8) that had low factor loadings. The five remaining items had factor loadings
greater than .60, and were assessed through testing the model fit (the SRMR, the
RMSEA, the TLI and the CFI), followed by internal consistency, and convergent and
discriminant validity.
We performed three CFAs, and the models converged with acceptable fit (see figure 11
with the final measurement model). For each sample, the fit of the measurement model
was judged by employing the Bollen-Stine bootstrap (1,000 subsamples), the chi-square
statistic, with its associated degrees of freedom, and several traditional approximate fit
indices, including the SRMR, the RMSEA, the TLI and the CFI.
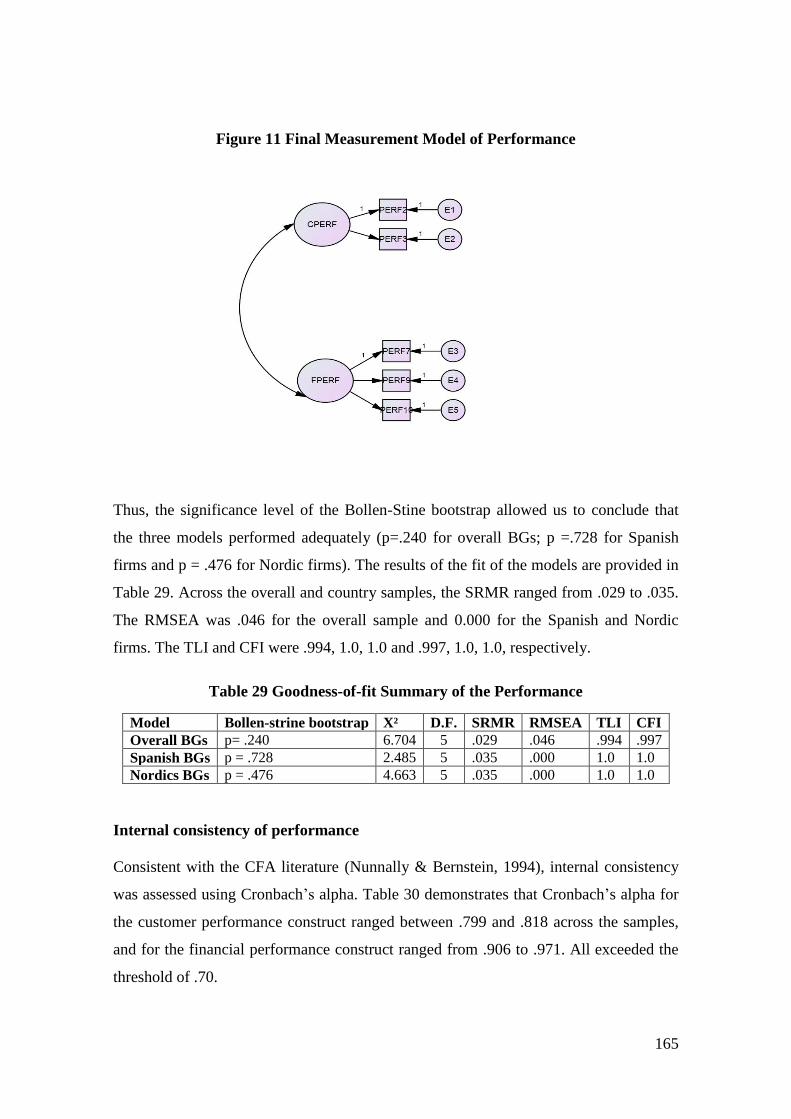
165
Figure 11 Final Measurement Model of Performance
Thus, the significance level of the Bollen-Stine bootstrap allowed us to conclude that
the three models performed adequately (p=.240 for overall BGs; p =.728 for Spanish
firms and p = .476 for Nordic firms). The results of the fit of the models are provided in
Table 29. Across the overall and country samples, the SRMR ranged from .029 to .035.
The RMSEA was .046 for the overall sample and 0.000 for the Spanish and Nordic
firms. The TLI and CFI were .994, 1.0, 1.0 and .997, 1.0, 1.0, respectively.
Table 29 Goodness-of-fit Summary of the Performance
Model Bollen-strine bootstrap X² D.F. SRMR RMSEA TLI CFI
Overall BGs p= .240 6.704 5 .029 .046 .994 .997
Spanish BGs p = .728 2.485 5 .035 .000 1.0 1.0
Nordics BGs p = .476 4.663 5 .035 .000 1.0 1.0
Internal consistency of performance
Consistent with the CFA literature (Nunnally & Bernstein, 1994), internal consistency
was assessed using Cronbach‘s alpha. Table 30 demonstrates that Cronbach‘s alpha for
the customer performance construct ranged between .799 and .818 across the samples,
and for the financial performance construct ranged from .906 to .971. All exceeded the
threshold of .70.
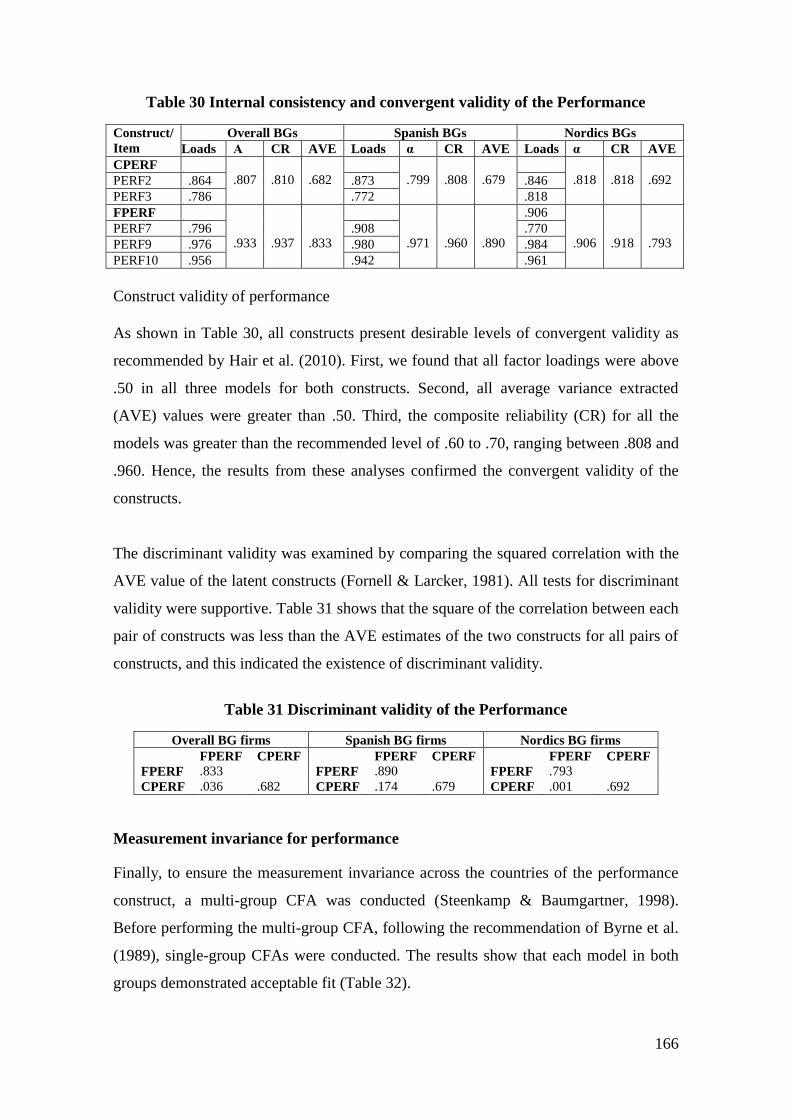
166
Table 30 Internal consistency and convergent validity of the Performance
Construct/
Item
Overall BGs Spanish BGs Nordics BGs
Loads Α CR AVE Loads α CR AVE Loads α CR AVE
CPERF
.807
.810
.682
.799
.808
.679
.818
.818
.692 PERF2 .864 .873 .846
PERF3 .786 .772 .818
FPERF
.933
.937
.833
.971
.960
.890
.906
.906
.918
.793 PERF7 .796 .908 .770
PERF9 .976 .980 .984
PERF10 .956 .942 .961
Construct validity of performance
As shown in Table 30, all constructs present desirable levels of convergent validity as
recommended by Hair et al. (2010). First, we found that all factor loadings were above
.50 in all three models for both constructs. Second, all average variance extracted
(AVE) values were greater than .50. Third, the composite reliability (CR) for all the
models was greater than the recommended level of .60 to .70, ranging between .808 and
.960. Hence, the results from these analyses confirmed the convergent validity of the
constructs.
The discriminant validity was examined by comparing the squared correlation with the
AVE value of the latent constructs (Fornell & Larcker, 1981). All tests for discriminant
validity were supportive. Table 31 shows that the square of the correlation between each
pair of constructs was less than the AVE estimates of the two constructs for all pairs of
constructs, and this indicated the existence of discriminant validity.
Table 31 Discriminant validity of the Performance
Overall BG firms Spanish BG firms Nordics BG firms
FPERF CPERF FPERF CPERF FPERF CPERF
FPERF .833 FPERF .890 FPERF .793
CPERF .036 .682 CPERF .174 .679 CPERF .001 .692
Measurement invariance for performance
Finally, to ensure the measurement invariance across the countries of the performance
construct, a multi-group CFA was conducted (Steenkamp & Baumgartner, 1998).
Before performing the multi-group CFA, following the recommendation of Byrne et al.
(1989), single-group CFAs were conducted. The results show that each model in both
groups demonstrated acceptable fit (Table 32).
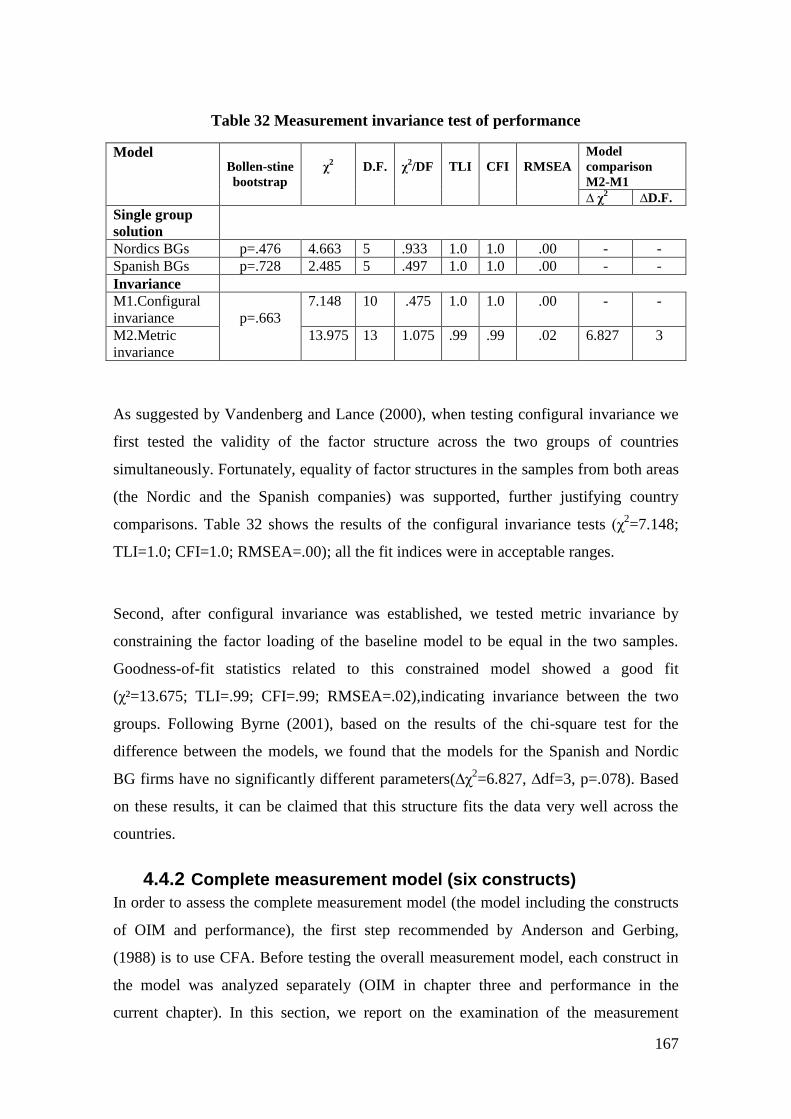
167
Table 32 Measurement invariance test of performance
Model
Bollen-stine
bootstrap
χ2
D.F.
χ2/DF
TLI
CFI
RMSEA
Model
comparison
M2-M1
∆ χ2 ∆D.F.
Single group
solution
Nordics BGs p=.476 4.663 5 .933 1.0 1.0 .00 - -
Spanish BGs p=.728 2.485 5 .497 1.0 1.0 .00 - -
Invariance
M1.Configural
invariance
p=.663
7.148 10 .475 1.0 1.0 .00 - -
M2.Metric
invariance
13.975 13 1.075 .99 .99 .02 6.827 3
As suggested by Vandenberg and Lance (2000), when testing configural invariance we
first tested the validity of the factor structure across the two groups of countries
simultaneously. Fortunately, equality of factor structures in the samples from both areas
(the Nordic and the Spanish companies) was supported, further justifying country
comparisons. Table 32 shows the results of the configural invariance tests (χ2=7.148;
TLI=1.0; CFI=1.0; RMSEA=.00); all the fit indices were in acceptable ranges.
Second, after configural invariance was established, we tested metric invariance by
constraining the factor loading of the baseline model to be equal in the two samples.
Goodness-of-fit statistics related to this constrained model showed a good fit
(χ²=13.675; TLI=.99; CFI=.99; RMSEA=.02),indicating invariance between the two
groups. Following Byrne (2001), based on the results of the chi-square test for the
difference between the models, we found that the models for the Spanish and Nordic
BG firms have no significantly different parameters(∆χ2=6.827, ∆df=3, p=.078). Based
on these results, it can be claimed that this structure fits the data very well across the
countries.
4.4.2 Complete measurement model (six constructs)
In order to assess the complete measurement model (the model including the constructs
of OIM and performance), the first step recommended by Anderson and Gerbing,
(1988) is to use CFA. Before testing the overall measurement model, each construct in
the model was analyzed separately (OIM in chapter three and performance in the
current chapter). In this section, we report on the examination of the measurement
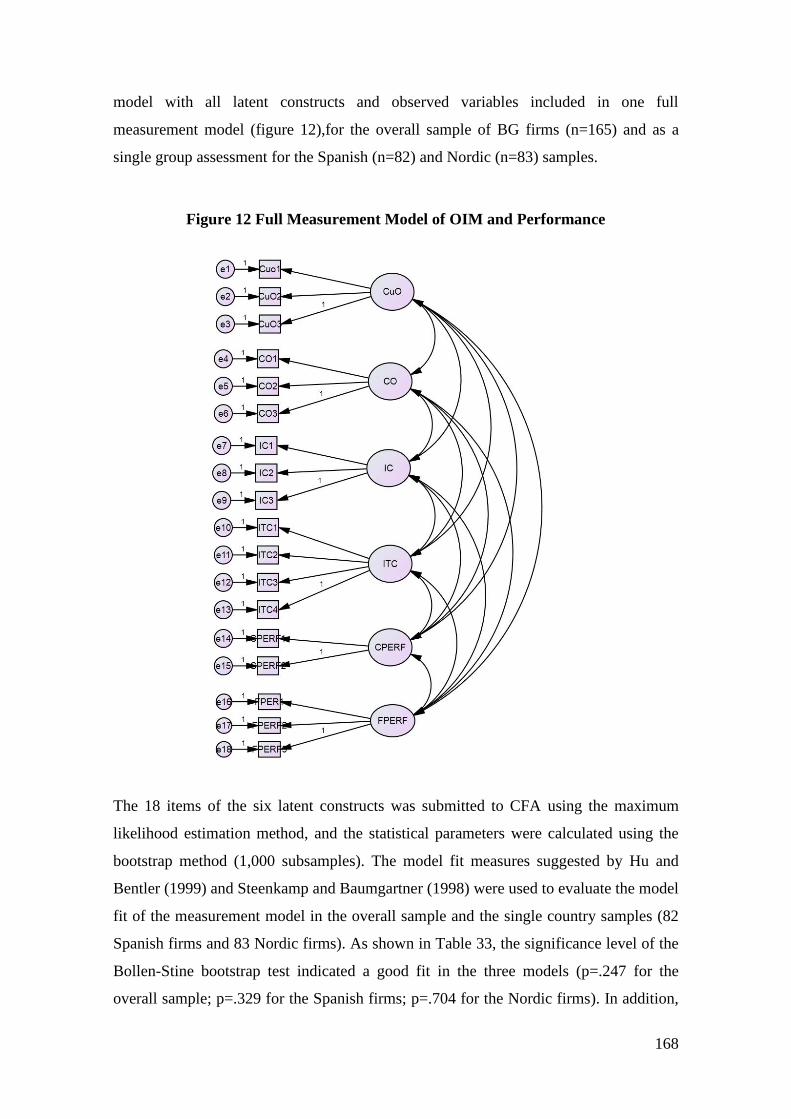
168
model with all latent constructs and observed variables included in one full
measurement model (figure 12),for the overall sample of BG firms (n=165) and as a
single group assessment for the Spanish (n=82) and Nordic (n=83) samples.
Figure 12 Full Measurement Model of OIM and Performance
The 18 items of the six latent constructs was submitted to CFA using the maximum
likelihood estimation method, and the statistical parameters were calculated using the
bootstrap method (1,000 subsamples). The model fit measures suggested by Hu and
Bentler (1999) and Steenkamp and Baumgartner (1998) were used to evaluate the model
fit of the measurement model in the overall sample and the single country samples (82
Spanish firms and 83 Nordic firms). As shown in Table 33, the significance level of the
Bollen-Stine bootstrap test indicated a good fit in the three models (p=.247 for the
overall sample; p=.329 for the Spanish firms; p=.704 for the Nordic firms). In addition,
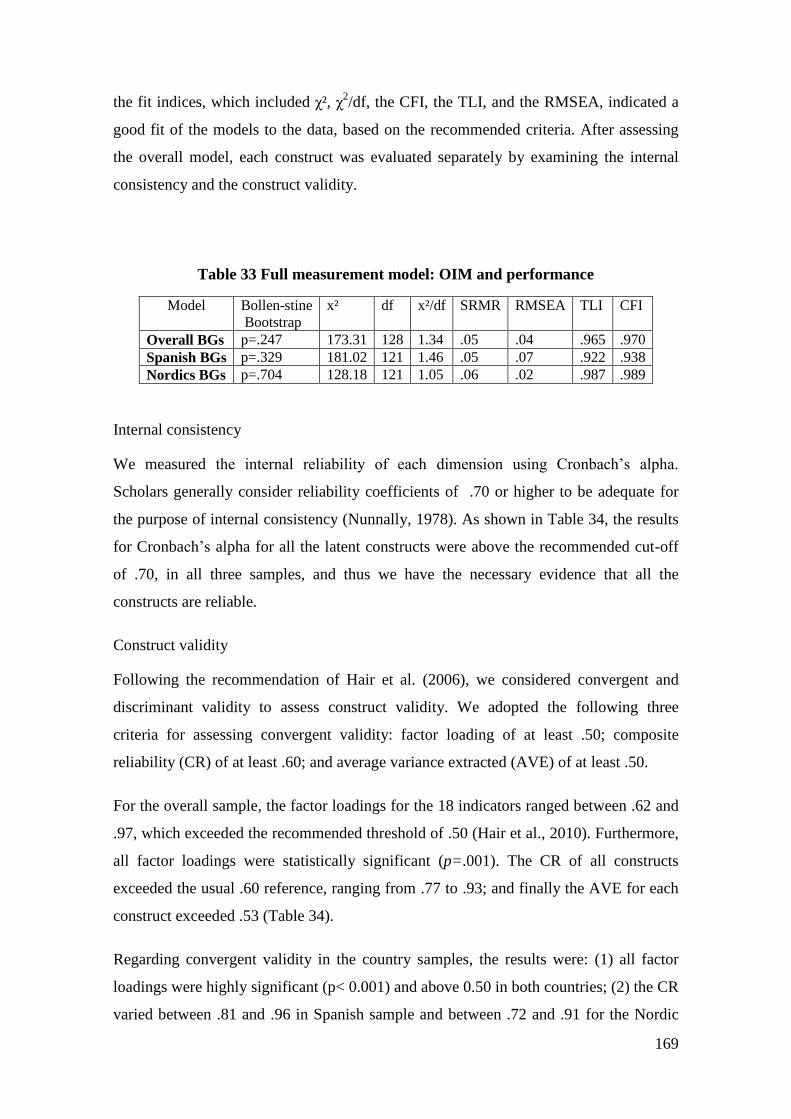
169
the fit indices, which included χ², χ2/df, the CFI, the TLI, and the RMSEA, indicated a
good fit of the models to the data, based on the recommended criteria. After assessing
the overall model, each construct was evaluated separately by examining the internal
consistency and the construct validity.
Table 33 Full measurement model: OIM and performance
Model Bollen-stine
Bootstrap
x² df x²/df SRMR RMSEA TLI CFI
Overall BGs p=.247 173.31 128 1.34 .05 .04 .965 .970
Spanish BGs p=.329 181.02 121 1.46 .05 .07 .922 .938
Nordics BGs p=.704 128.18 121 1.05 .06 .02 .987 .989
Internal consistency
We measured the internal reliability of each dimension using Cronbach‘s alpha.
Scholars generally consider reliability coefficients of .70 or higher to be adequate for
the purpose of internal consistency (Nunnally, 1978). As shown in Table 34, the results
for Cronbach‘s alpha for all the latent constructs were above the recommended cut-off
of .70, in all three samples, and thus we have the necessary evidence that all the
constructs are reliable.
Construct validity
Following the recommendation of Hair et al. (2006), we considered convergent and
discriminant validity to assess construct validity. We adopted the following three
criteria for assessing convergent validity: factor loading of at least .50; composite
reliability (CR) of at least .60; and average variance extracted (AVE) of at least .50.
For the overall sample, the factor loadings for the 18 indicators ranged between .62 and
.97, which exceeded the recommended threshold of .50 (Hair et al., 2010). Furthermore,
all factor loadings were statistically significant (p=.001). The CR of all constructs
exceeded the usual .60 reference, ranging from .77 to .93; and finally the AVE for each
construct exceeded .53 (Table 34).
Regarding convergent validity in the country samples, the results were: (1) all factor
loadings were highly significant (p< 0.001) and above 0.50 in both countries; (2) the CR
varied between .81 and .96 in Spanish sample and between .72 and .91 for the Nordic

170
firms; and (3) the AVE varied between .59 and .89 in the Spanish sample and between
.46 and .79 in the Nordic sample (Table 34), thus modestly satisfying the criterion of .50
(Bagozzi & Yi, 1988; Bhuian et al., 2005).
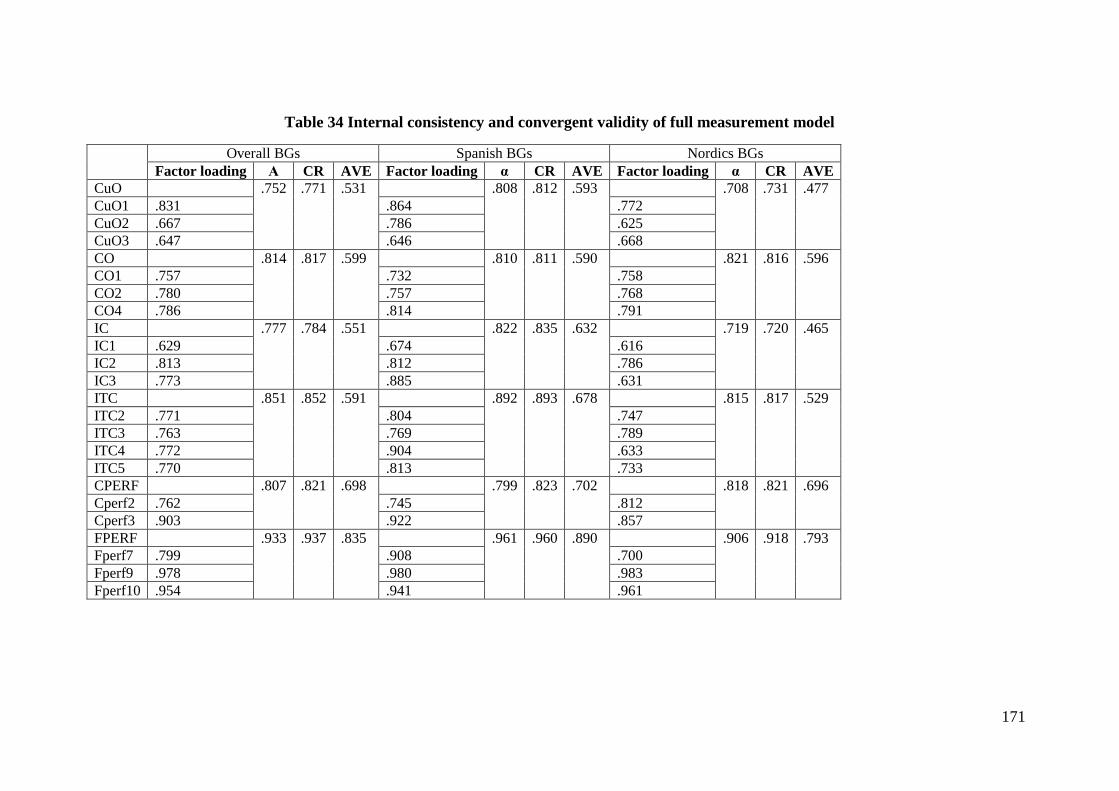
171
Table 34 Internal consistency and convergent validity of full measurement model
Overall BGs Spanish BGs Nordics BGs
Factor loading Α CR AVE Factor loading α CR AVE Factor loading α CR AVE
CuO .752 .771 .531 .808 .812 .593 .708 .731 .477
CuO1 .831 .864 .772
CuO2 .667 .786 .625
CuO3 .647 .646 .668
CO .814 .817 .599 .810 .811 .590 .821 .816 .596
CO1 .757 .732 .758
CO2 .780 .757 .768
CO4 .786 .814 .791
IC .777 .784 .551 .822 .835 .632 .719 .720 .465
IC1 .629 .674 .616
IC2 .813 .812 .786
IC3 .773 .885 .631
ITC .851 .852 .591 .892 .893 .678 .815 .817 .529
ITC2 .771 .804 .747
ITC3 .763 .769 .789
ITC4 .772 .904 .633
ITC5 .770 .813 .733
CPERF .807 .821 .698 .799 .823 .702 .818 .821 .696
Cperf2 .762 .745 .812
Cperf3 .903 .922 .857
FPERF .933 .937 .835 .961 .960 .890 .906 .918 .793
Fperf7 .799 .908 .700
Fperf9 .978 .980 .983
Fperf10 .954 .941 .961
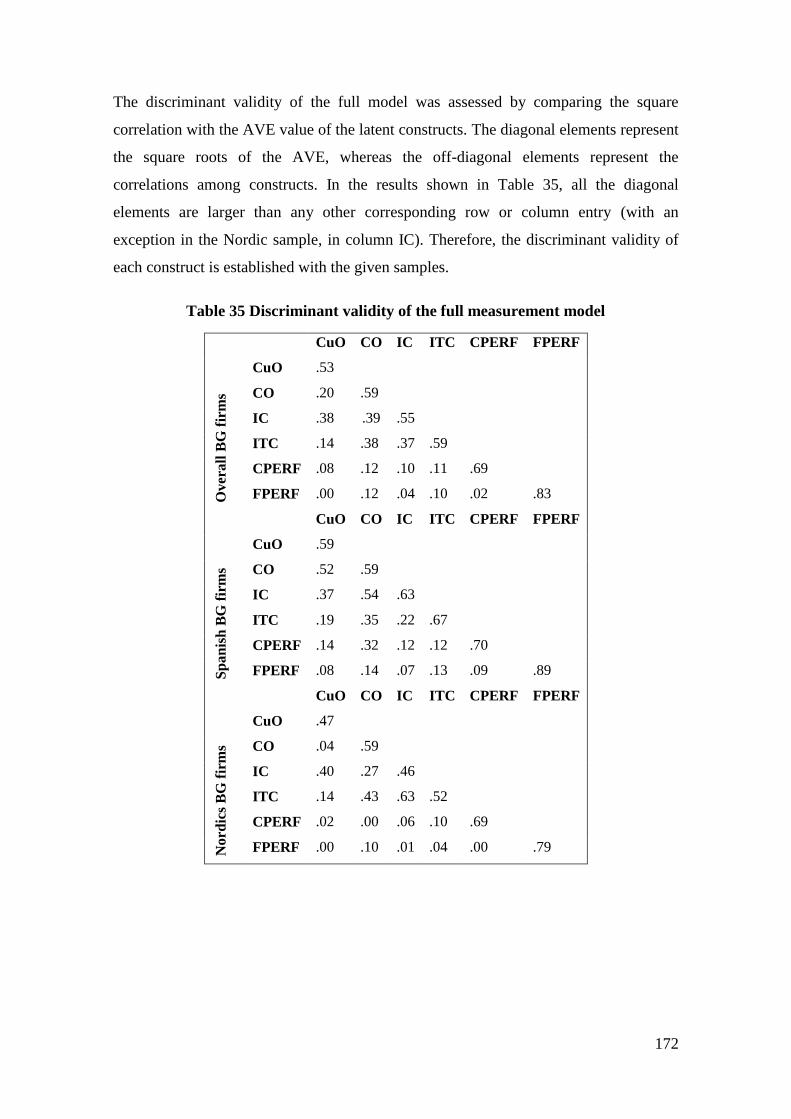
172
The discriminant validity of the full model was assessed by comparing the square
correlation with the AVE value of the latent constructs. The diagonal elements represent
the square roots of the AVE, whereas the off-diagonal elements represent the
correlations among constructs. In the results shown in Table 35, all the diagonal
elements are larger than any other corresponding row or column entry (with an
exception in the Nordic sample, in column IC). Therefore, the discriminant validity of
each construct is established with the given samples.
Table 35 Discriminant validity of the full measurement model
Over
all
BG
fir
ms
CuO CO IC ITC CPERF FPERF
CuO .53
CO .20 .59
IC .38 .39 .55
ITC .14 .38 .37 .59
CPERF .08 .12 .10 .11 .69
FPERF .00 .12 .04 .10 .02 .83
CuO CO IC ITC CPERF FPERF
Sp
an
ish
BG
fir
ms
CuO .59
CO .52 .59
IC .37 .54 .63
ITC .19 .35 .22 .67
CPERF .14 .32 .12 .12 .70
FPERF .08 .14 .07 .13 .09 .89
CuO CO IC ITC CPERF FPERF
No
rdic
s B
G f
irm
s
CuO .47
CO .04 .59
IC .40 .27 .46
ITC .14 .43 .63 .52
CPERF .02 .00 .06 .10 .69
FPERF .00 .10 .01 .04 .00 .79
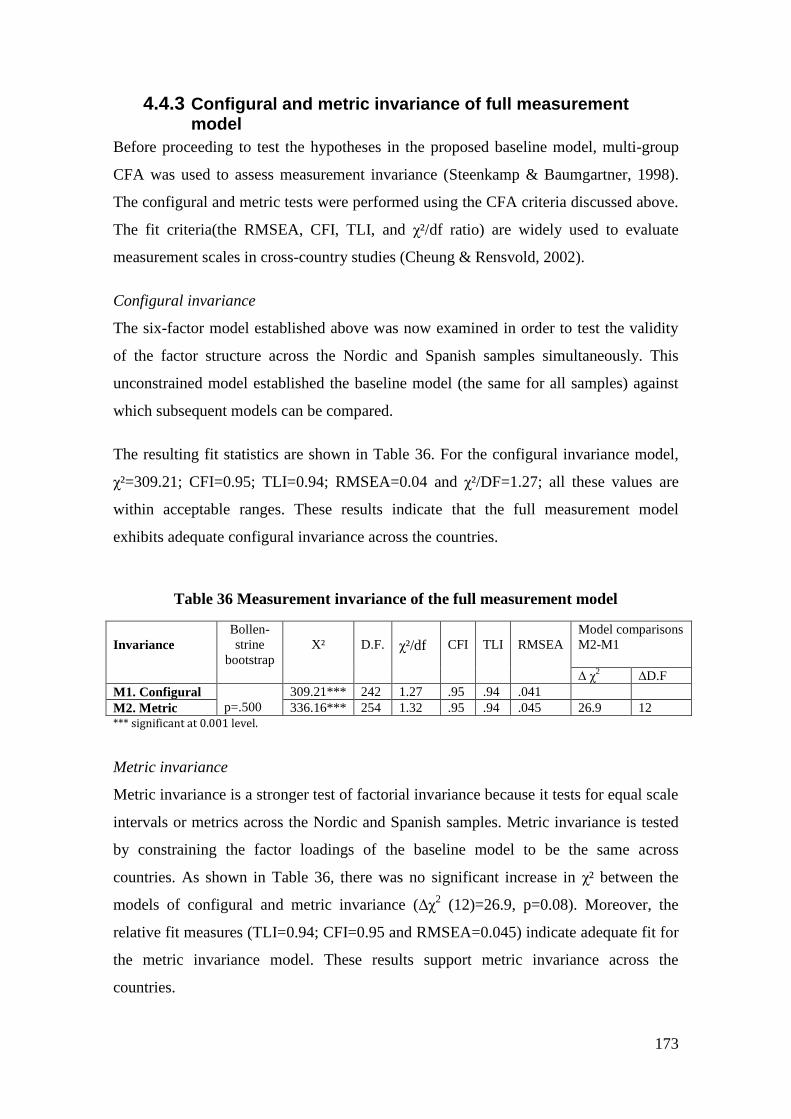
173
4.4.3 Configural and metric invariance of full measurement model
Before proceeding to test the hypotheses in the proposed baseline model, multi-group
CFA was used to assess measurement invariance (Steenkamp & Baumgartner, 1998).
The configural and metric tests were performed using the CFA criteria discussed above.
The fit criteria(the RMSEA, CFI, TLI, and χ²/df ratio) are widely used to evaluate
measurement scales in cross-country studies (Cheung & Rensvold, 2002).
Configural invariance
The six-factor model established above was now examined in order to test the validity
of the factor structure across the Nordic and Spanish samples simultaneously. This
unconstrained model established the baseline model (the same for all samples) against
which subsequent models can be compared.
The resulting fit statistics are shown in Table 36. For the configural invariance model,
χ²=309.21; CFI=0.95; TLI=0.94; RMSEA=0.04 and χ²/DF=1.27; all these values are
within acceptable ranges. These results indicate that the full measurement model
exhibits adequate configural invariance across the countries.
Table 36 Measurement invariance of the full measurement model
Invariance
Bollen-
strine
bootstrap
X²
D.F.
χ²/df
CFI
TLI
RMSEA
Model comparisons
M2-M1
∆ χ2 ∆D.F
M1. Configural
p=.500
309.21*** 242 1.27 .95 .94 .041
M2. Metric 336.16*** 254 1.32 .95 .94 .045 26.9 12
*** significant at 0.001 level.
Metric invariance
Metric invariance is a stronger test of factorial invariance because it tests for equal scale
intervals or metrics across the Nordic and Spanish samples. Metric invariance is tested
by constraining the factor loadings of the baseline model to be the same across
countries. As shown in Table 36, there was no significant increase in χ² between the
models of configural and metric invariance (∆χ2 (12)=26.9, p=0.08). Moreover, the
relative fit measures (TLI=0.94; CFI=0.95 and RMSEA=0.045) indicate adequate fit for
the metric invariance model. These results support metric invariance across the
countries.
174
Based on these results, there is adequate support for measurement invariance (configural
and metric) of the constructs across the two samples of BG firms. It is therefore suitable
to pool the two data sets to test the hypothesis proposed in the structural model.
4.4.4 Structural Model
After having validated the full measurement model, we describe the evaluation of the
structural model in this section. Figure 13 sets out the proposed structural model,
showing the association between the four dimensions of OIM and performance. To
estimate the model, as mentioned earlier, conventional maximum likelihood estimation
was used.
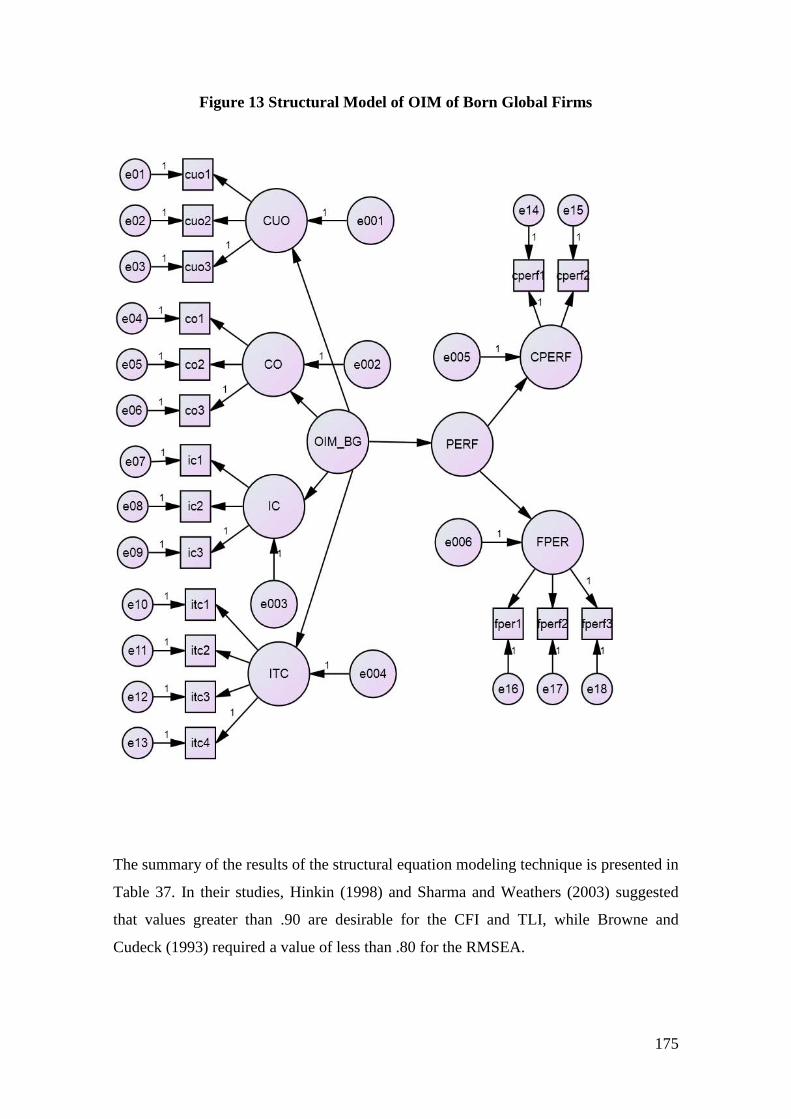
175
Figure 13 Structural Model of OIM of Born Global Firms
The summary of the results of the structural equation modeling technique is presented in
Table 37. In their studies, Hinkin (1998) and Sharma and Weathers (2003) suggested
that values greater than .90 are desirable for the CFI and TLI, while Browne and
Cudeck (1993) required a value of less than .80 for the RMSEA.
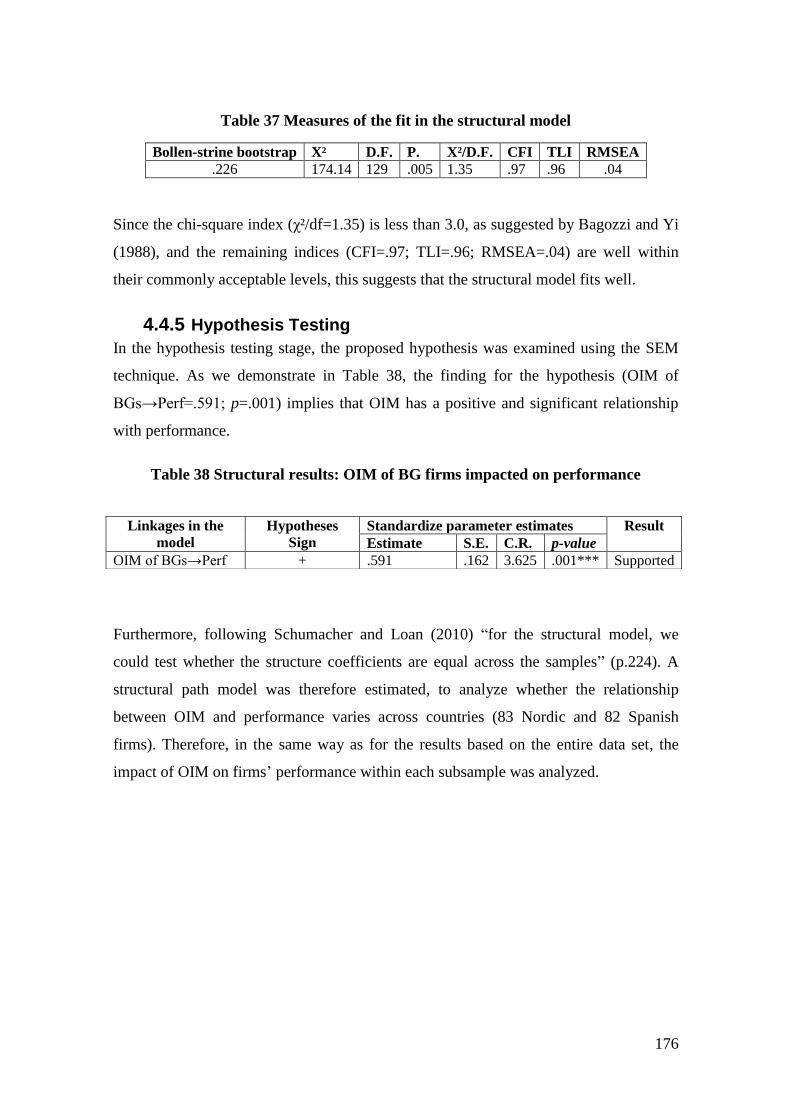
176
Table 37 Measures of the fit in the structural model
Bollen-strine bootstrap X² D.F. P. X²/D.F. CFI TLI RMSEA
.226 174.14 129 .005 1.35 .97 .96 .04
Since the chi-square index (χ²/df=1.35) is less than 3.0, as suggested by Bagozzi and Yi
(1988), and the remaining indices (CFI=.97; TLI=.96; RMSEA=.04) are well within
their commonly acceptable levels, this suggests that the structural model fits well.
4.4.5 Hypothesis Testing
In the hypothesis testing stage, the proposed hypothesis was examined using the SEM
technique. As we demonstrate in Table 38, the finding for the hypothesis (OIM of
BGs→Perf=.591; p=.001) implies that OIM has a positive and significant relationship
with performance.
Table 38 Structural results: OIM of BG firms impacted on performance
Furthermore, following Schumacher and Loan (2010) ―for the structural model, we
could test whether the structure coefficients are equal across the samples‖ (p.224). A
structural path model was therefore estimated, to analyze whether the relationship
between OIM and performance varies across countries (83 Nordic and 82 Spanish
firms). Therefore, in the same way as for the results based on the entire data set, the
impact of OIM on firms‘ performance within each subsample was analyzed.
Linkages in the
model
Hypotheses
Sign
Standardize parameter estimates Result
Estimate S.E. C.R. p-value
OIM of BGs→Perf + .591 .162 3.625 .001*** Supported
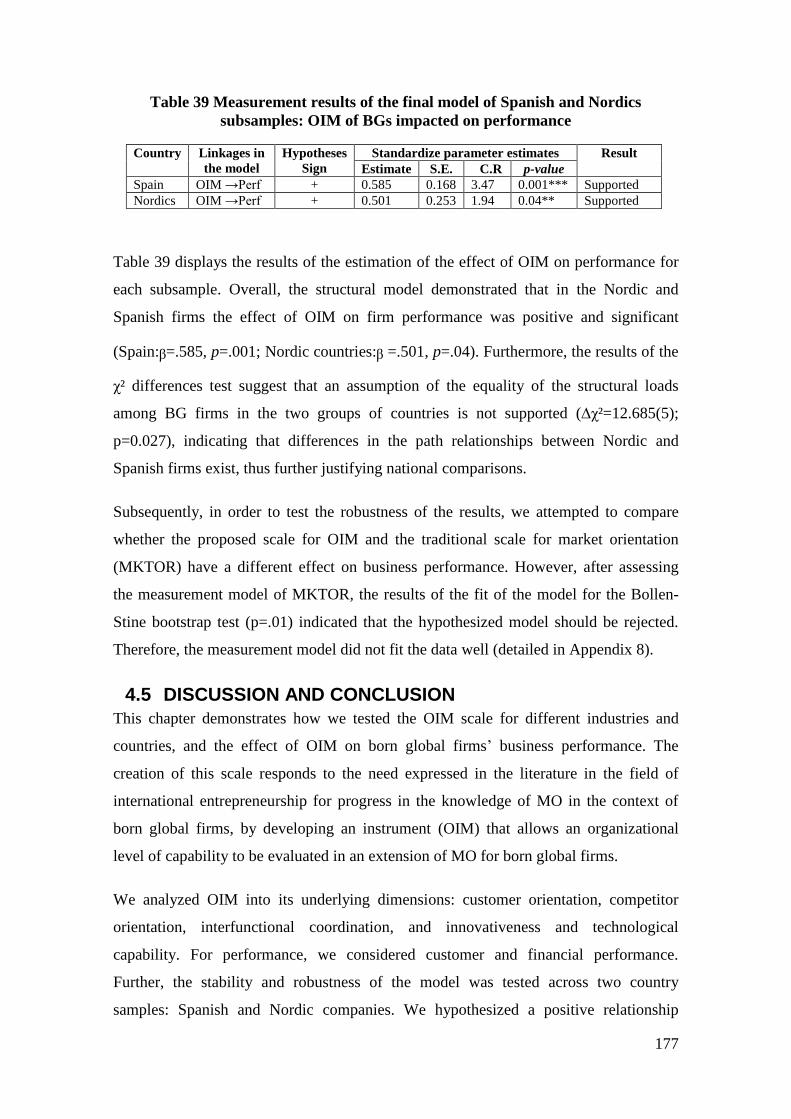
177
Table 39 Measurement results of the final model of Spanish and Nordics
subsamples: OIM of BGs impacted on performance
Table 39 displays the results of the estimation of the effect of OIM on performance for
each subsample. Overall, the structural model demonstrated that in the Nordic and
Spanish firms the effect of OIM on firm performance was positive and significant
(Spain:ᵦ=.585, p=.001; Nordic countries:ᵦ =.501, p=.04). Furthermore, the results of the
χ² differences test suggest that an assumption of the equality of the structural loads
among BG firms in the two groups of countries is not supported (∆χ²=12.685(5);
p=0.027), indicating that differences in the path relationships between Nordic and
Spanish firms exist, thus further justifying national comparisons.
Subsequently, in order to test the robustness of the results, we attempted to compare
whether the proposed scale for OIM and the traditional scale for market orientation
(MKTOR) have a different effect on business performance. However, after assessing
the measurement model of MKTOR, the results of the fit of the model for the Bollen-
Stine bootstrap test (p=.01) indicated that the hypothesized model should be rejected.
Therefore, the measurement model did not fit the data well (detailed in Appendix 8).
4.5 DISCUSSION AND CONCLUSION
This chapter demonstrates how we tested the OIM scale for different industries and
countries, and the effect of OIM on born global firms‘ business performance. The
creation of this scale responds to the need expressed in the literature in the field of
international entrepreneurship for progress in the knowledge of MO in the context of
born global firms, by developing an instrument (OIM) that allows an organizational
level of capability to be evaluated in an extension of MO for born global firms.
We analyzed OIM into its underlying dimensions: customer orientation, competitor
orientation, interfunctional coordination, and innovativeness and technological
capability. For performance, we considered customer and financial performance.
Further, the stability and robustness of the model was tested across two country
samples: Spanish and Nordic companies. We hypothesized a positive relationship
Country Linkages in
the model
Hypotheses
Sign
Standardize parameter estimates Result
Estimate S.E. C.R p-value
Spain OIM →Perf + 0.585 0.168 3.47 0.001*** Supported
Nordics OIM →Perf + 0.501 0.253 1.94 0.04** Supported
178
between OIM and performance for BG firms, and, for our data, the results show that
this relationship is significant. This finding is consistent with previous studies that were
focused on a similar relationship in the context of BG firms (Hallbäck & Gabrielsson,
2013; Kocak & Ambibola, 2009), although from a qualitative approach. In combination
with other marketing strategies such as international entrepreneurship, learning
orientation, and entrepreneurial capital, the results of these studies showed that MO
enables the internationalization process and has a positive effect on performance in the
context of BG firms.
Most papers automatically assume that MO has a positive influence on performance.
This chapter empirically demonstrates that, for BG firms, OIM, the concept that extends
MO for firms that internationalize from inception by adding the construct of
innovativeness and technological capability, also impacts positively on performance.
Earlier literature on the relationship between BG firms and MO has tended to emphasize
the positive effect of innovativeness and technological capability on performance
(Frishammar & Andersson, 2009; Zhang et al., 2013). Indeed, Hallbäck and Gabrielsson
(2013) argues that ―It has been previously suggested that market orientation relates to
the innovativeness‖(p. 1018).
Another interesting result is that, looking at the direct effects of OIM on performance
for Nordic and Spanish firms, there are differences between these countries. Even
though the effects are statistically significant in both groups of countries, it seems that
OIM makes a greater contribution to business performance in Spanish BG firms than in
Nordic BG firms. In the context of this study, a possible explanation is that institutional
environment or environmental conditions (Nummela et al., 2014) may have had an
impact on the relationship between OIM and performance. Despite the fact that previous
studies argue that there is no difference across countries in the relationship between MO
and business performance (Liao et al., 2011; Cano et al., 2004), it seems clear that
different characteristics of country-specific business environments influence the
effectiveness of OIM, thus one cannot say for certain whether successes in these
countries are caused predominantly by superior OIM practices or by favorable business
environments. This is consistent with prior empirical research (e.g. Day & Wensley,
1988; Ellis, 2006; Murray et al., 2011; Raju et al., 2011) which suggests that the desired
level of MO for a business depends on its environment.
179
Foley and Fahy (2009), for example found that the institutional environment influences
the relationship between MO and performance. According to North (1990), each
country creates its own unique institutional environment consisting of both formal and
informal institutional structures (Veciana & Urbano, 2008). Formal institutions consist
of statute law, common law, and regulations. Informal institutions refer to ―conventions,
norms of behavior, and self imposed rules of behavior‖ (North, 1992, p.4). Within the
context of Spanish firms the institutional environment relies more on informal
institutions than formal structures (Alvarez et al., 2011). On the other hand regarding
Nordic firms, Chatzopoulou (2015), suggested that the firms use both structures: formal
and informal.
Thus, despite differences in institutional environment across the Nordics and Spain, it
can be said that the structure of institutions will influence and may help explain
differences in OIM activity between countries which is consistent with Renko et al.
(2009) and Gaur et al. (2011) who pointed out that "depending on the level of
development of the institutional environment in a particular country, the need for being
market oriented may vary" (p.1188).
Moreover, following Matsuno et al. (2005) in this study we attempted to compare the
empirical results obtained in relation to the OIM scale with those obtained in relation to
the original MKTOR scale for our samples of BG firms. However, the model fit for
MKTOR indicated that was not possible to estimate the model, and as a consequence no
comparative approach between OIM and MKTOR can be adopted.
4.5.1 Limitations and future research
This study offers important and novel contributions to the literature on international
marketing and international entrepreneurship, but has a number of limitations that could
serve as starting point for future lines of research. First, our research did not take into
consideration the specific impact that each construct of OIM has on performance for BG
firms. A promising direction of research may be a further examination of each
construct, in order to highlight whether one of them has a stronger effect on
performance. Second, although evidence from different countries helped to establish the
cross-country validity of the measure and findings, future studies would benefit greatly
180
from including other contexts such as Africa or Latin America, where BG research has
been limited.
The final limitation has to do with the sample size; although in this study we utilized
several techniques to boost our response rate, including follow-up communications and
the offer of an incentive to respondents (in the form of a research summary), our sample
employed within this chapter was 165 firms. A larger sample size might help to improve
the validity of the results established (Hair et al., 2010).
Our existing study focused on OIM and its relationship with performance for BG firms.
There may be other strategies that influence the success of this type of firms (Etemad,
2015). Prior researches have acknowledged the positive effect of entrepreneurship
orientation (EO) and MO on firm's performance (Frishammar & Andersson, 2009;
Hakala, 2011; Monferrer et al., 2012). Both Chandra Badoli (2014) and Hong et al.
(2013) argue that MO and EO are complementary strategies to achieve competitive
advantage. Therefore, we suggest future research to analyze the effect of international
entrepreneurship orientation (IEO) and OIM on business performance of BG firms.
IE scholars modify the EO into IEO concept (Boehe, 2009; Covin & Miller, 2014;
Dimitratos et al., 2012; Freeman & Cavusgil, 2007; Gerschewski et al., 2015; Glavas &
Mathews, 2014; Jones & Coviello, 2005; Knight, 2001; Knight & Cavusgil, 2004), in
same the vein that our study does (that adapted the concept of MO for BG firms by
suggesting the OIM). According to Slevin and Terjesen (2011), a minority of scholars
of IE studies utilize the classic "EO" concept. Likewise, as pointed out by Covin and
Millers (2014), the IEO concept shares the core elements of EO that can be viewed as a
combination of proactiveness, innovativeness, and risk-taking (Covin and Slevin 1989).
Moreover, Born global scholars, found a positive impact of IEO on performance (e.g.
Gerschewski et al., 2015), thus this analysis must be extended to study the relationship
between these orientations (OIM and IEO) and the performance implication for BG
firms.
181
4.6 REFERENCES
Alvarez, C., Urbano, D., Coduras, A., & Ruiz-Navarro, J. (2011). Environmental
conditions and entrepreneurial activity: a regional comparison in Spain. Journal of
Small Business and Enterprise Development, 18 (1), 120-140.
Anderson, J. C. & Gerbing D. W. (1988).Structural Equation Modeling in
Practice: A Review and Recommended Two-Step Approach. Psychological Bulletin,
103 (May), 411-423.
Armario, J., Ruiz ,D. & Armario, E.(2008). market orientation and
internationalization in small and medium sized enterprises. Journal of Small Business
Management, 46 (4), 485-511.
Arpa, C., Tiernan, S., & O'Dwyer, M. (2012). Entrepreneurial orientation,
market orientation and internationalisation in born global small and micro–businesses.
International Journal of Entrepreneurship and Small Business, 16 (4), 455-470.
Aspelund, A., Madsen, T. K. & Moen, Ø. (2007). A review of the foundation,
international marketing strategies, and performance of international new ventures.
European Journal of Marketing, 41 (11/12), 1423-1448.
Aziz, N. A., & Omar, N. A. (2013). Exploring the effect of Internet marketing
orientation, Learning Orientation and Market Orientation on innovativeness and
performance: SME (exporters) perspectives. Journal of Business Economics and
Management, 14 (sup1), S257-S278.
Bagozzi, R. P., & Yi, Y. (1988). On the evaluation of structural equation
models. Journal of the academy of marketing science, 16 (1), 74-94.
Barney, J. B. (1991). Firm resources and sustained competitive advantage.
Journal of Management, 17, 99-120.
Barney, J., Ketchen, D., & Wright, M. (2011). The future of resource based
theory: Revitalization or decline? Journal of Management, 37 (5), 1299-1315.
Barrales‐Molina, V., Martínez‐López, F. J., & Gázquez‐Abad, J. C. (2014).
Dynamic marketing capabilities: Toward an integrative framework. International
Journal of Management Reviews, 16 (4), 397-416.
Barreto, I. (2010). Dynamic capabilities: A review of past research and an
agenda for the future. Journal of Management, 36 (1), 256-280.
Bener, M. & Glaister, K. W. (2010). Determinants of performance in
international joint ventures. Journal of Strategy and Management, 3 (3), 188-214.
Bentler, P. M. (1995). EQS structural equations program manual. Encino, CA:
Multivariate Software.
Bhardwaj, V., Eijkman, M. & Runyan, R. C. (2011). Internationalization of a
‗Born-Global‘ Fashion Retailer through dynamic strategic planning process.
International Review of Retail, Distribution and Consumer Research, 21 (3), 267-281.
Bharadwaj, S. G., Varadarajan, P. R., & Fahy, J. (1993). Sustainable competitive
advantage in service industries: A conceptual model and research propositions. Journal
of Marketing, 57, 83-99.
Bhuian, S. N., Menguc, B., & Bell, S. J. (2005). Just entrepreneurial enough: the
moderating effect of entrepreneurship on the relationship between market orientation
and performance. Journal of business research, 58 (1), 9-17.
Blesa A. & Ripollés M. (2008). The influence of marketing capabilities on
economic international performance. International Marketing Review, 6 (25), 651-673.
Blindenbach‐Driessen, F., Van Dalen, J., & Van Den Ende, J. (2010). Subjective
Performance Assessment of Innovation Projects. Journal of Product Innovation
Management, 27 (4), 572-592.
182
Bollen, K. A. (1989).Structural equations with latent variables. New York:
Wiley.
Browne, M. W., & Cudeck, R. (1993). Alternative ways of assessing model fit.
Sage Focus Editions, 154, 136-136.
Byrne, B. M., Shavelson, R. J., & Muthén, B. (1989). Testing for the
equivalence of factor covariance and mean structures: The issue of partial measurement
invariance. Psychological bulletin, 105 (3), 456.
Byrne, B.M. (2001). Structural equation modeling with AMOS: Basic concepts,
applications and programming. Mahwah, N.J.: Lawrence Erlbaum Associates.
Cadogan, J. W. (2012). International marketing, strategic orientations and
business success: reflections on the path ahead. International Marketing Review, 29 (4),
340-348.
Cano, C. R., Carrillat, F. A., & Jaramillo, F. (2004). A meta-analysis of the
relationship between market orientation and business performance: evidence from five
continents. International Journal of research in Marketing, 21 (2), 179-200.
Capron, L., & Hulland, J. (1999). Redeployment of brands, sales forces, and
general marketing management expertise following horizontal acquisitions: A resource-
based view. Journal of Marketing, 63, (2), 41-54.
Cavusgil, E., Seggie, S. H&. Talay, M.B. (2007). Dynamic capabilities view:
foundations and research agenda. Journal of Marketing Theory and Practice, 15 (2),
159-166.
Cavusgil, S.T. & Zou, S. (1994). Marketing strategic-performance relationship:
an investigation of the empirical link in export market ventures. Journal of marketing,
58, 1-21.
Chad, P. (2014). Organizational change within charities: improved performance
via introduction of market orientation and other strategic orientations. International
Review on Public and Nonprofit Marketing, 11 (1), 89-113.
Chandra Balodi, K. (2014). Strategic orientation and organizational forms: an
integrative framework. European Business Review, 26 (2), 188-203.
Chang, W. Franke, G.R., Butler, T.D. Musgrove, C.F. & Ellinger A.E. (2014).
Differential Mediating Effects of Radical and Incremental Innovation on Market
Orientation-Performance Relationship: A Meta-Analysis. The Journal of Marketing
Theory and Practice, 22 (3), 235-250.
Chatzopoulou, S. (2015). When Do National Administrations Adapt to EU
Policies? Variation in Denmark and Greece. International Journal of Public
Administration, 38 (2), 104-115.
Cheng, C. & Krumwiede, D. (2012). The role of service innovation in the
market orientation-new service performance linkage. Technovation, 32, 487-497.
Cheung, G. W., & Rensvold, R. B. (2002). Evaluating goodness-of-fit indexes
for testing measurement invariance. Structural equation modeling, 9 (2), 233-255.
Cicic, M., Patterson, P.G., Shoham, A. (2002). Antecedents of international
performance: A service firms‘ perspective. European Journal of Marketing, 36 (9/10),
1103-1118.
Clark, B. H.. (2000). Managerial perceptions of marketing performance:
efficiency, adaptability, effectiveness and satisfaction. Journal of Strategic Marketing, 8
(1), 3-25.
Costello, A. B. & Osborne J. (2005). Best practices in exploratory factor
analysis: four recommendations for getting the most from your analysis. Practical
Assessment Research and Evaluation, 10 (7), 1-9.
183
Covin, J. G. & Miller, D. (2014). International entrepreneurial orientation:
conceptual considerations, research themes, measurement issues, and future research
directions. Entrepreneurship Theory and Practice, 38, 11-44.
Covin, J. G., & Slevin, D. P. (1989). Strategic management of small firms in
hostile and benign environments. Strategic management journal, 10 (1), 75-87.
Crick, D. (2009). The internationalisation of born global and international new
venture SMEs. International Marketing Review, 26 (4/5), 453-476.
Day, G.S. (1994).The capabilities of market-driven organisations. Journal of
Marketing, 58 (4), 37-61.
DeVellis, R. F. (1991). Scale Development; Theory and Applications,
California, Sage.
Diamantopoulos, A., & Winklhofer, H. M. (2001). Index construction with
formative indicators: An alternative to scale development. Journal of marketing
research, 38 (2), 269-277.
Dimitratos, P., Voudouris, I., Plakoyiannaki, E., & Nakos, G. (2012).
International entrepreneurial culture—Toward a comprehensive opportunity-based
operationalization of international entrepreneurship. International Business Review, 21
(4), 708-721.
Ding, L., Velicer, W. F., & Harlow, L. L. (1995). Effects of estimation methods,
number of indicators per factor and improper solutions on structural equation modeling
fit indices. Structural Equation Modeling, 2, 119-143.
Efrat, K. & A. Shoham (2012). Born Global Firms: The Differences between
their Short- and Long-Term Performance Drivers. Journal of World Business, 47 (4),
675-685.
Ellis, P. D. (2006). Market Orientation and Performance: A Meta‐Analysis and
Cross‐National Comparisons. Journal of Management Studies, 43 (5), 1089-1107.
Eisenhardt, K. M. & Martin J. A.(2000). Dynamic Capabilities: What Are
They?. Strategic Management Journal, 21 (10/11),1105-1121.
Eriksson, T. (2014). Processes, antecedents and outcomes of dynamic
capabilities. Scandinavian Journal of Management, 30, 65-82.
Etemad, H. (2015). The promise of a potential theoretical framework in
international entrepreneurship: An entrepreneurial orientation-performance relation in
internationalized context. Journal of International Entrepreneurship, 13 (2), 89-95.
Evanschitzky, H. (2007). Market orientation of service networks: Direct and
indirect effects on sustained competitive advantage. Journal of Strategic Marketing, 15
(4), 349-368.
Evers, N. (2011). International new ventures in ―low tech‖ sectors: a dynamic
capabilities perspective. Journal of Small Business and Enterprise Development, 18 (3),
502-528.
Fang, E. & Zou, S.M.(2009). Antecedents and consequences of marketing
dynamic capabilities in international joint ventures. Journal of international business
studies, 40 (5), 742-761.
Fillis, I. (2007). A methodology for researching international entrepreneurship in
SMEs: a challenge to the status quo. Journal of Small Business and Enterprise
Development, 14 (1), 118-135.
Finn, A., & Wang, L. (2014). Formative vs. reflective measures: Facets of
variation. Journal of Business Research, 67 (1), 2821-2826.
Foley, A. & Fahy, J. (2009). Seeing market orientation through a capabilities
lens. European Journal of Marketing, 43 (1/2), 13-20.
184
Fornell, C. (1992). A national customer satisfaction barometer: the Swedish
experience. Journal of Marketing, 56 (1), 6-21.
Fornell, C., & Larcker, D.F., (1981). Evaluating structural equation models with
unobservable variables and measurement error. Journal of Marketing Research, 18 (1),
39-50.
Freeman, S., & Cavusgil, S. T. (2007). Toward a typology of commitment states
among managers of born-global firms: a study of accelerated internationalization.
Journal of International Marketing, 15 (4), 1-40.
Frishammar, J., & Andersson, S. (2009). The overestimated role of strategic
orientations for international performance in smaller firms. Journal of International
Entrepreneurship, 7 (1), 57-77.
Gabrielsson, M., Gabrielsson, P., & Dimitratos, P. (2014). International
entrepreneurial culture and growth of international new ventures. Management
International Review, 54 (4), 445-471.
Gaskin, C.J. & Happell, B. (2014). On exploratory factor analysis: a review of
recent evidence, an assessment of current practice, and recommendations for future use.
International Journal of Nursing Studies, 51 (3), 511-521.
Gatignon, H. & Xuereb, J.M. (1997). Strategic orientation of the firm and new
product performance. Journal of Marketing Research, 34, 77-90.
Gaur, S. S., Vasudevan, H., & Gaur, A. S. (2011). Market orientation and
manufacturing performance of Indian SMEs: Moderating role of firm resources and
environmental factors. European Journal of Marketing, 45(7/8), 1172-1193.
Gemunden, H. (1991).Success factors of export marketing: a meta-analytic
technique of empirical studies, in Paliwoda, S.J. (Ed.), New Perspectives on
International Marketing, Routledge, London, pp. 22-62.
Gerschewski, S., & Xiao, S. S. (2015). Beyond financial indicators: An
assessment of the measurement of performance for international new ventures.
International Business Review, 24 (4), 615-629.
Gerschewski, S., Rose, E. L., & Lindsay, V. J. (2015). Understanding the drivers
of international performance for born global firms: An integrated perspective. Journal
of World Business, 50 (3), 558-575.
Glavas, C., & Mathews, S. (2014). How international entrepreneurship
characteristics influence Internet capabilities for the international business processes of
the firm. International Business Review, 23 (1), 228-245.
Gleason, K. C., Madura, J.& Wiggenhorn, J. (2006).Operating characteristics,
risk, and performance of born‐global firms. International Journal of Managerial
Finance, 2 (2), 96-120.
Gonzalez-Benito O. & Gonzalez-Benito, J. (2005). Cultural vs. operational
market orientation and objective vs. subjective performance: Perspective of production
and operations. Industrial Marketing Management, 34 (8) 797-829.
Grinstein, A. (2008). The relationships between market orientation and
alternative strategic orientations: A meta-analysis. European Journal of Marketing, 42
(1/2), 115-134.
Hagen, B., & Zucchella, A. (2014). Born global or born to run? The long-term
growth of born global firms. Management International Review, 54 (4), 497-525.
Hagen, B., Zucchella, A., Cerchiello, P., & De Giovanni, N. (2012).
International strategy and performance—Clustering strategic types of SMEs.
International Business Review, 21 (3), 369-382.
Hair, J. F. J., Anderson, R. E., Tatham, R. L. & Black, W. C. (1998).
Multivariate Data Analysis. Upper Saddle River, NJ, Prentice Hall.
185
Hair, J. F., Sarstedt, M., Pieper, T. M., & Ringle, C. M. (2012). The Use of
Partial Least Squares Structural Equation Modeling in Strategic Management Research:
A Review of Past Practices and Recommendations for Future Applications. Long Range
Planning, 45, 320-340.
Hair, J. F., Tatham, R. L., Anderson, R. E., & Black, W. (2006). Multivariate
data analysis (Vol. 6). Upper Saddle River, NJ: Pearson Prentice Hall.
Hair, J.F., Black, W.C., Babin, B.J. and Anderson, R.E. (2010), Multivariate
Data Analysis, 7th ed., Pearson Education International, Upper Saddle River, NJ.
Hakala, H. (2011). Strategic orientations in management literature: three
approaches to understanding the interaction between market, technology,
entrepreneurial and learning orientations. International Journal of Management
Reviews, 13 (2), 199-217.
Hallbäck, J., & Gabrielsson, P. (2013). Entrepreneurial marketing strategies
during the growth of international new ventures originating in small and open
economies. International Business Review, 22 (6), 1008-1020.
Han, M. & Celly, N. (2008). Strategic ambidexterity and performance in
international new ventures. Canadian Journal of Administrative Sciences, 25, 335-349.
He, X., Brouthers K. D. & Filatotchev I. (2013). Resource-Based and
institutional perspectives on export channel selection and export performance. Journal
of Management, 39 (27), 27-47.
Hinkin, T. R. (1998). A brief tutorial on the development of measures for use in
survey questionnaires. Organizational research methods, 1 (1), 104-121.
Hong, J., Song, T. H., & Yoo, S. (2013). Paths to success: how do market
orientation and entrepreneurship orientation produce new product success?. Journal of
Product Innovation Management, 30 (1), 44-55.
Hooley, G.J., Greenly, G.E., Cadogan, J.W. & Fahy, J. (2005). The performance
impact of marketing resources. Journal of Business Research, 58 (1), 18-27.
Hu, L. T., & Bentler, P. M. (1999). Cutoff criteria for fit indexes in covariance
structure analysis: Conventional criteria versus new alternatives. Structural Equation
Modeling: A Multidisciplinary Journal, 6 (1), 1-55.
Hu, L., & Bentler, P. M. (1998). Fit indices in covariance structure modeling:
Sensitivity to under-parameterized model misspecification. Psychological Methods,
3,424-453.
Hult, G T., Ketchen, D. J., Griffith, D. A., Chabowski, B. R., Hamman, M. K.,
Dykes, B. J., Pollitte W. A. & S Cavusgil T.(2008). An assessment of the measurement
of performance in international business research. Journal of International Business
Studies, 39, 1064-1080.
Hult, G. T. M., & Ketchen, D. J. (2001). Does market orientation matter?: A test
of the relationship between positional advantage and performance. Strategic
Management Journal, 22 (9), 899-906.
Hult, G.T., Ketchen, D.J. & Slater, S. (2005). Market orientation and
performance: an integration of disparate approaches. Strategic Management Journal,
26, 1174-1181.
Hult, T. M., Ketchen D. J., Griffith, D. A., Chabowski, B. R., Hamman, M.K.,
Dykes, B.J., Pollitte, W. A & Cavusgil, T. An assessment of the measurement of
performance in international business research. Journal of International Business
Studies, 39, 1064-1080.
Hung, R.Y., Yang, B., Lien, B.Y., McLean, G.N. & Kuo, Y. (2010). Dynamic
capability: Impact of process alignment and organizational learning culture on
performance. Journal of World Business, 45, 285-294.
186
Hunt, S., &Lambe J. (2000). Marketing‘s contribution to business strategy:
market orientation, relationship marketing and resourced-advantage theory.
International Journal of Management Review, 2 (1), 17-43.
Iacobucci D.(2009). Everything you always wanted to know about SEM
(structural equations modeling) but were afraid to ask. Journal of Consumer
Psychology, 19, 673-680.
Iacobucci, D. (2010). Structural Equations Modeling: Fit Indices, Sample Size,
and Advanced Issues. Journal of Consumer Psychology, 20 (1), 90-98.
Jaakkola, M., Möller, K., Parvinen, P., Evanschitzky, H. & Mühlbacher H.
(2010). Strategic marketing and business performance: A study in three European
‗engineering countries‘. Industrial Marketing Management, 39, 1300-1310.
Jantunen, A., Nummela, N., Puumalainen, K., & Saarenketo, S. (2008). Strategic
orientations of born globals-Do they really matter?. Journal of World Business, 43 (2),
158-170.
Jarvis, C. B., MacKenzie, S. B., & Podsakoff, P. M. (2003). A critical review of
construct indicators and measurement model misspecification in marketing and
consumer research. Journal of consumer research, 30 (2), 199-218.
Jeong, I., Pae, J. H., & Zhou, D. (2006). Antecedents and consequences of the
strategic orientations in new product development: The case of Chinese manufacturers.
Industrial Marketing Management, 35 (3), 348-358.
Johanson, M., & Martín, O. M. (2015). The incremental expansion of Born
Internationals: A comparison of new and old Born Internationals. International Business
Review, 24 (3), 476-496.
Jones, M. V., & Coviello, N. E. (2005). Internationalisation: conceptualising an
entrepreneurial process of behaviour in time. Journal of International Business Studies,
36 (3), 284-303.
Jones, M. V., Coviello, N., & Tang, Y. K. (2011). International entrepreneurship
research (1989–2009): a domain ontology and thematic analysis. Journal of Business
Venturing, 26 (6), 632-659.
Jöreskog, K. G. & Söborn, D. (1993). New features in LISRELE 8. Chicago:
Scientific Software.
Jöreskog, K. G. (1990). New developments in LISREL: Analysis of ordinal
variables using polychoric correlations and weighted least squares. Quality and
Quantity, 24, 387-404.
Kahiya, E. T. & Dean, D. L. (2014). Export performance: multiple predictors
and multiple measures approach, Asia Pacific Journal of Marketing and Logistics, 26
(3), 378-407.
Kaiser, H. F. (1960). The Application of Electronic Computers to Factor
Analysis. Educational and Psychological Management, 41, 141-151.
Katsikeas, C. S., Leonidou, L. C., & Morgan, N. A. (2000). Firm-level export
performance assessment: Review, evaluation, and development. Journal of the Academy
of Marketing Sciences, 28 (4), 493-511.
Ketokivi, M.& Schroeder, R. (2004).Manufacturing practices, strategic fit and
performance: A routine‐based view. International Journal of Operations & Production
Management, 24 (2), 171-191.
Ketokivi, M.A. & Schroeder, R.G. (2004). Perceptual measures of performance:
fact or fiction?. Journal of Operations Management, 22, 247-264.
Khavul, S. Pérez-Nordtvedt, L. & Wood, E. (2010). Organizational entrainment
and international new ventures from emerging markets. Journal of Business Venturing,
25, 104-119.
187
Kirpalani, V. M., & Gabrielsson, M. (2012). Born Globals: Research Areas that
Still Need to be Covered More Fully. Handbook Of Research On Born Globals, Edward
Elgar Publishing, 99-127.
Kirca, A. H., Jayachandran, S. & Bearden W. O. (2005). market orientation: a
meta-analytic review and assessment of its antecedents and impact on performance.
Journal of Marketing, 69, 24-41.
Knight, G. A. (2001). Entrepreneurship and strategy in the international SME.
Journal of international management, 7 (3), 155-171.
Knight, G. (2015). Born Global Firms: Evolution of a Contemporary
Phenomenon, in Shaoming Zou , Hui Xu , Linda Hui Shi (ed.) Entrepreneurship in
International Marketing (Advances in International Marketing, Volume 25) Emerald
Group Publishing Limited, pp.3 - 19.
Knight, G. A., & Cavusgil, S. T. (2004). Innovation, organization capabilities,
and the born-global firm. Journal of International Business Studies, 35, 124-141.
Kocak, A., & Abimbola, T. (2009). The effects of entrepreneurial marketing on
born global performance. International Marketing Review, 26 (4/5), 439-452.
Kozlenkova, I.V., Samaha,S.A. & Palmatier, R.W. (2014). Resource-Based
Theory in marketing. Journal of the Academy of Marketing Science, 42 (1), 1-21.
Kropp, F., Lindsay, N. J., & Shoham, A. (2006). Entrepreneurial, market, and
learning orientations and international entrepreneurial business venture performance in
South African firms. International Marketing Review, 23 (5), 504-523.
Kuivalainen, O., Sundqvist, S. & Servais P.(2007). Firms‗ degree of born-
globalness, international entrepreneurial orientation and export performance. Journal of
World Business, 42, 253-67.
Kundu, S.K., & Katz. J.H. (2003).Born international SMEs: bi-level impacts of
resources and intentions. Small Business Economics, 20, 25-49.
Kyriakopoulos K. & Moorman C. (2004).Tradeoffs in Marketing Exploitation
and Exploration Strategies: The Overlooked Role of Market Orientation. International
Journal of Research in Marketing, 21, 219-240.
Laforet, S. (2008). Size, strategic, and market orientation affects on innovation.
Journal of Business Research, 61 (7), 753-764.
Laukkanen, T., Nagy, G., Hirvonen, S., Reijonen, H., & Pasanen, M. (2013).
The effect of strategic orientations on business performance in SMEs: A multigroup
analysis comparing Hungary and Finland. International Marketing Review, 30 (6), 510-
535.
Lei, M. & Lomax, R.G., 2005. The effect of varying degrees of nonnormality in
structural equation modeling. Structural Equation Modeling, 12 (1), 1-27.
Lengler, J. F., Sousa, C. M., & Marques, C. (2013). Exploring the linear and
quadratic effects of customer and competitor orientation on export performance.
International Marketing Review, 30 (5), 440-468.
Leonidou L.C, Katsikeas C.S, & Samiee S (2002). Marketing strategy
determinants of export performance: a meta-analysis. Journal of Business Research, 55
(1),51-67.
Leonidou, L. C., & Katsikeas, C. S. (2010). An integrative assessment of
exporting research published in business journals during the period 1960-2007. Journal
of Business Research, 63 (8), 879-887.
Liao, S.H., Chang, W.J., Wu C.C. & Katrichis, J.M. (2011). A survey of market
orientation research (1995–2008). Industrial Marketing Management, 40 (2), 301-310.
188
Lin, Y. & Wu, L. (2014). Exploring the role of dynamic capabilities in firm
performance under the resource-based view framework. Journal of Business Research,
67, 407-413.
Lomax, R. G., & Schumacker, R. E. (2012). A beginner's guide to structural
equation modeling. Routledge Academic.
Lonial, S. C., & Carter, R. E. (2015). The Impact of Organizational Orientations
on Medium and Small Firm Performance: A Resource‐Based Perspective. Journal of
Small Business Management, 53 (1), 94-113.
Luo, Y. (2000). Dynamic capabilities in international expansion. Journal of
World Business, 35 (4), 355-378.
Luostarinen, R., & Gabrielsson, M. (2006). Globalization and marketing
strategies of born globals in SMOPECs. Thunderbird International Business Review, 48
(6), 773-801.
MacKenzie, S. B., Podsakoff, P. M., & Jarvis, C. B. (2005). The problem of
measurement model misspecification in behavioral and organizational research and
some recommended solutions. Journal of Applied Psychology, 90 (4), 710-730.
Madsen, T.K. (1987). Empirical export performance studies: a review of
conceptualizations and findings. Advances in international marketing, 2, 177-198.
Martelo, S., Barroso, C. & Cepeda-Carrión, G. (2011). Creating dynamic
capabilities to increase customer value. Management Decision, 49 (7), 1141-1159.
Martin, J. H., & Grbac, B. (2003). Using supply chain management to leverage a
firm‘s market orientation. Industrial Marketing Management, 32, 25-38.
Matsuno, K., Mentzer, J. T., & Rentz, J. O. (2005). A conceptual and empirical
comparison of three market orientation scales. Journal of business research, 58 (1), 1-8.
Matthyssens, P., & Pauwels, P. (1996). Assessing export performance
measurement. In S. T. Cavusgil & C. Axinn (Eds.). Advances in international marketing
(Vol. 8, 85-114). Greenwich, CT: JAI Press Inc.
McAdam, M, McAdam, R, Dunn, A, McCall, C (2014). Development of small
and medium-sized enterprise horizontal innovation networks: UK agri-food sector
study. International Small Business Journal, 32 (7), 830-853.
Menguc, B., & Auh, S. (2006). Creating a firm-level dynamic capability through
capitalizing on market orientation and innovativeness. Journal of the Academy of
Marketing Science, 34 (1), 63-73.
Merrilees, B., Rundle-Thiele, S. & Lye A. (2011). Marketing capabilities:
antecedents and implications for B2B SME performance. Industrial Marketing
Management, 40, 368-375.
Monferrer, D., Ripollés, M., & Blesa, A. (2012). Competitiveness through
strategic orientation. Tržište, (Vol. 24/2), 163-185.
Morgan, M., Vorhies, D.W. & Mason, C.H. (2009). Market orientation,
marketing capabilities, and firm performance. Strategic Management Journal, 30, 909-
920.
Morgan, N. A. (2012). Marketing and business performance. Journal of the
Academy of Marketing Science, 40 (1), 102-119.
Mort, G.S. & Weerawardena, J. (2006). Networking capability and international
entrepreneurship: How networks function in Australian born global firms. International
Marketing Review, 23 (5), 549-572.
Murray, J. Y., Gao, G. Y., & Kotabe, M. (2011). Market orientation and
performance of export ventures: the process through marketing capabilities and
competitive advantages. Journal of the Academy of Marketing Science, 39 (2), 252-269.
189
Narver, J. C., & Slater, S. F. (1990). The effect of a market orientation on
business profitability. The Journal of Marketing, 20-35.
Nath, P., Nachiappan, S. & Ramanathan, R. (2010). The impact of marketing
capability, operations capability and diversification strategy on performance: A
resource-based view. Industrial Marketing Management, 39, 317-329.
Netemeyer, R. G., Bearden, W. O. & Sharma, S. (2003). Scaling Procedures:
Issues and Applications. Thousand Oaks, Sage Publications.
Noble, C. H., Sinha, R. K., & Kumar, A. (2002). Market orientation and
alternative strategic orientations: a longitudinal assessment of performance implications.
Journal of marketing, 66 (4), 25-39.
North D.C. (1990) Institutions, institutional change and economic performance.
Cambridge University Press, New York
North, D. C. (1992). Institutions and economic theory. The American Economist,
36 (1), 3-6.
Nummela, N., Saarenketo, S., Jokela, P., & Loane, S. (2014). Strategic
Decision-Making of a Born Global: A Comparative Study From Three Small Open
Economies. Management International Review, 54 (4), 527-550.
Nunnally, J. & Bernstein I.H. (1994). Psychometric Theory (3ed ed.), New
York, McGraw Hill.
Nunnally, J. (1978). Psychometric Theory, New York, McGraw Hill.
O'Cass, AG & Ngo, L,(2007). Market orientation versus innovative culture: Two
routes to superior brand performance. European Journal of Marketing, 41, (7/8) 868-
887.
Odorici, V., & Presutti, M. (2013). The entrepreneurial experience and strategic
orientation of high-tech born global start-ups: An analysis of novice and habitual
entrepreneurs. Journal of International Entrepreneurship, 11 (3), 268-291.
Olavarrieta, S. & Friedmann R. (2008). Market orientation, knowledge-related
resources and firm performance. Journal of Business Research, 61, 623-630.
Papadopoulos, N., & Martín, O. M. (2010). Toward a model of the relationship
between internationalization and export performance. International Business Review, 19
(4), 388-406.
Park, T. & Rhee, J. (2012). Antecedents of knowledge competency and
performance in born globals: The moderating effects of absorptive capacity.
Management Decision, 50 (8), 1361- 1381.
Peiris I. K., Akoorie, M. E. & Sinha, P. (2012). International entrepreneurship:
A critical analysis of studies in the past two decades and future directions for research.
Journal of International Entrepreneurship, 10, 279-324.
Peng, M. (2001). The resource-based view and international business. Journal of
Management, 27, 803-829.
Peteraf, M.A. (1993). The Cornerstones of Competitive Advantage: A Resource-
Based View. Strategic Management Journal, 14 (3), 179-191.
Prange, C. & Verdier, S. (2011). Dynamic capabilities, internationalization
processes and performance. Journal of World Business, 46, 126-133.
Renko, M., Carsrud, A., & Brännback, M. (2009). The effect of a market
orientation, entrepreneurial orientation, and technological capability on innovativeness:
A study of young biotechnology ventures in the United States and in Scandinavia.
Journal of Small Business Management, 47 (3), 331-369.
Rosenbusch, N., Brinckmann, J., Bausch, A. (2011). Is innovation always
beneficial? A meta-analysis of the relationship between innovation and performance in
SMEs. Journal of Business Venturing, 26 (4), 441-457.
190
Sadikoglu, E. & Zehir, C. (2010). Investigating the effects of innovation and
employee performance on the relationship between total quality management practices
and firm performance: An empirical study of Turkish firms. International Journal of
Production Economics, 127 (1), 13-26.
Sapienza, H. J., Smith, K. G., & Gannon, M. J. (1988). Using subjective
evaluations of organizational performance in small business research. American Journal
of Small Business, 12 (3), 45-53.
Schumacker, R. E. & Lomax, R. G. (2010). A beginner‘s guide to structural
equation modeling (3rd ed.) New York: Routledge.
Schweizer, R., Vahlne, J.E, & Johanson, J.(2010). Internationalization as an
entrepreneurial process. Journal of International Entrepreneurship, 8 (4),343-370.
Shah, R. & Goldstein, S.M. (2006). Use of structural equation modeling in
operations management research: Looking back and forward. Journal of Operations
Management, 24, 148-169.
Sharma, S., & Weathers, D. (2003). Assessing generalizability of scales used in
cross-national research. International Journal of Research in Marketing, 20 (3), 287-
295.
Shook, C. L., Ketchen, D. J., Hult, G. T. M., & Kacmar, K. M. (2004). An
assessment of the use of structural equation modeling in strategic management research.
Strategic Management Journal, 25 (4), 397-404.
Sinkovics, N., Sinkovics, R. R. & Jean, .R.‐J. (2013). The internet as an
alternative path to internationalization?. International Marketing Review, 30 (2), 130-
155.
Slater, S. F., & Narver, J. C. (1994). Market orientation, customer value, and
superior performance. Business horizons, 37 (2), 22-28.
Slater, S. F., Olson, E. M., & Hult, G. T. M. (2006). The moderating influence
of strategic orientation on the strategy formation capability—performance relationship.
Strategic Management Journal, 27 (12), 1221-1231.
Slevin, D. P., & Terjesen, S. A. (2011). Entrepreneurial orientation: Reviewing
three papers and implications for further theoretical and methodological development.
Entrepreneurship Theory and Practice, 35 (5), 973-987.
Soper, D. S. (2014). Post-hoc statistical power calculator for multiple regression
[software].
Srivastava, R. K., Fahey L.& H. Christensen K.(2001). The resource-based
view and marketing: The role of market-based assets in gaining competitive advantage.
Journal of Management, 27, 777-802.
Steenkamp, J. B. E., & Baumgartner, H. (1998). Assessing measurement
invariance in cross-national consumer research. Journal of consumer research, 25 (1),
78-107.
Steward, D.W. (1981). The application and misapplication of factor analysis in
marketing research. Journal of Marketing Research, 18, 51-62.
Styles, C. & Seymour, R. G. (2006). Opportunities for marketing researchers in
international entrepreneurship. International Marketing Review, 23 (2), 126-145.
Su, N. (2013). Internationalization strategies of Chinese it service suppliers. MIS
Quarterly: Management Information Systems, 37 (1), 175-200.
Sürer, A., & Mutlu, H. M. (2015). The Effects of an E-marketing Orientation on
Performance in Turkish Exporter Firms. Journal of Internet Commerce, 14(1), 123-138.
Teece, D., Pisano, G., & Shuen, A. (1997). Dynamic capabilities and strategic
management. Strategic Management Journal, 18(7), 509-533.
191
Tokarczyk, J., Hansen, E., Green, M. & Down, J. (2007). A resource-based
view and market orientation theory examination of the role of ―familiness‖ in family
business success. Family Business Review,20 (1), 17-31.
Tsai, K.H. Chou, C. & Kuo, J.H. (2008). The curvilinear relationships between
responsive and proactive market orientations and new product performance: A
contingent link. Industrial Marketing Management, 37,884-894.
Van Raaij, E.M., & Stoelhorst, J.W. (2008).The implementation of a market
orientation: A review and integration of the contributions to date. European Journal of
Marketing, 42 (11/12), 1265-129.
Vandenberg, R. J., & Lance, C. E. (2000). A review and synthesis of the
measurement invariance literature: Suggestions, practices, and recommendations for
organizational research. Organizational research methods, 3 (1), 4-70.
Veciana, J. M., & Urbano, D. (2008). The institutional approach to
entrepreneurship research. Introduction. International Entrepreneurship and
Management Journal, 4 (4), 365-379.
Venkatraman, N., & Ramanujam, V. (1986). Measurement of business
performance in strategy research: A comparison of approaches. Academy of
Management Review, 11, 801-814.
Vorhies, D. W., Orr, L. M., & Bush, V. D. (2011). Improving customer-focused
marketing capabilities and firm financial performance via marketing exploration and
exploitation. Journal of the Academy of Marketing Science, 39 (5), 735-756.
Voss, Z. G. & Voss G. B. (2000).Exploring the Impact of Organizational Values
and Strategic Orientation on Performance in the Nonprofit Professional Theatre
Industry. International Journal of Arts Management, 3 (1), 62-76.
Wang, C. Chen K. & Chen, S. (2012). Total quality management, market
orientation and hotel performance: The moderating effects of external environmental
factors. International Journal of Hospitality Management, 31 (1), 119-129.
Wang, E.T.G., Hu, H.F. & Hu, P.J.H. (2013). Examining the role of information
technology in cultivating firms' dynamic marketing capabilities. Information &
Management, 50 (6), 336-343.
Weerawardena, J., Gillian Sullivan, M., Sandeep, S., Knight, G. & Liesch, P. W.
(2015). The role of the market sub-system and the socio-technical sub-system in
innovation and firm performance: a dynamic capabilities approach. Journal of the
Academy of Marketing Science, 43, 221-239.
Weerawardena, J., Mort, G., Liesch, P.& Knight, G.A. (2007).Conceptualizing
accelerated internationalization in the born global firm: a dynamic capabilities
perspective. Journal of World Business, 42 (3), 294-306.
Wernerfelt, B. (1984). A resource based view of the firm. Strategic Management
Journal, 5, 171-180.
Wernerfelt, B. (2014). On the role of the RBV in marketing. Journal of the
Academy of Marketing Science,42, 22-23.
Westland, J. C. (2010). Lower bounds on sample size in structural equation
modeling. Electronic Commerce Research and Applications, 9 (6), 476-487.
Zahra, S. A., Sapienza H. J. & Davidsson, P. (2006).Entrepreneurship and
dynamic capabilities: a review, model and research agenda. Journal of Management
Studies, 43(4), 917-955.
Zhang, M. J. (2007). Is support for top managers‘ dynamic capabilities,
environmental dynamism, and firm performance: an empirical investigation. Journal of
Business & Management, 13 (1), 57-77.
192
Zhang, M., Sarker, S. & Sarker, S. (2013). Drivers and export performance
impacts of IT capability in ‗born-global‘ firms: a cross-national study. Information
Systems Journal, 23, 419-443.
Zhou, L. & Wu, A. (2014). Earliness of internationalization and performance
outcomes: Exploring the moderating effects of venture age and international
commitment. Journal of World Business, 49 (1), 132-142.
Zhou, L., Barnes, B.R. & Lu, Y. (2010). Entrepreneurial proclivity, capability
upgrading and performance advantage of newness among international new ventures.
Journal of International Business Studies, 41 (5) 882-905.
Zhou, K. Z., Yim, C. K., & Tse, D. K. (2005). The effects of strategic
orientations on technology-and market-based breakthrough innovations. Journal of
marketing, 69 (2), 42-60.
Zhou, L., Wu, W., & Luo, X. (2007). Internationalization and the performance
of born-global SMEs: The mediating role of social networks. Journal of International
Business Studies, 38, 673-690.
Zott, C. (2003). Dynamic capabilities and the emergence of intra-industry
differential firm performance: Insights from a simulation study. Strategic Management
Journal, 24, 97-12.
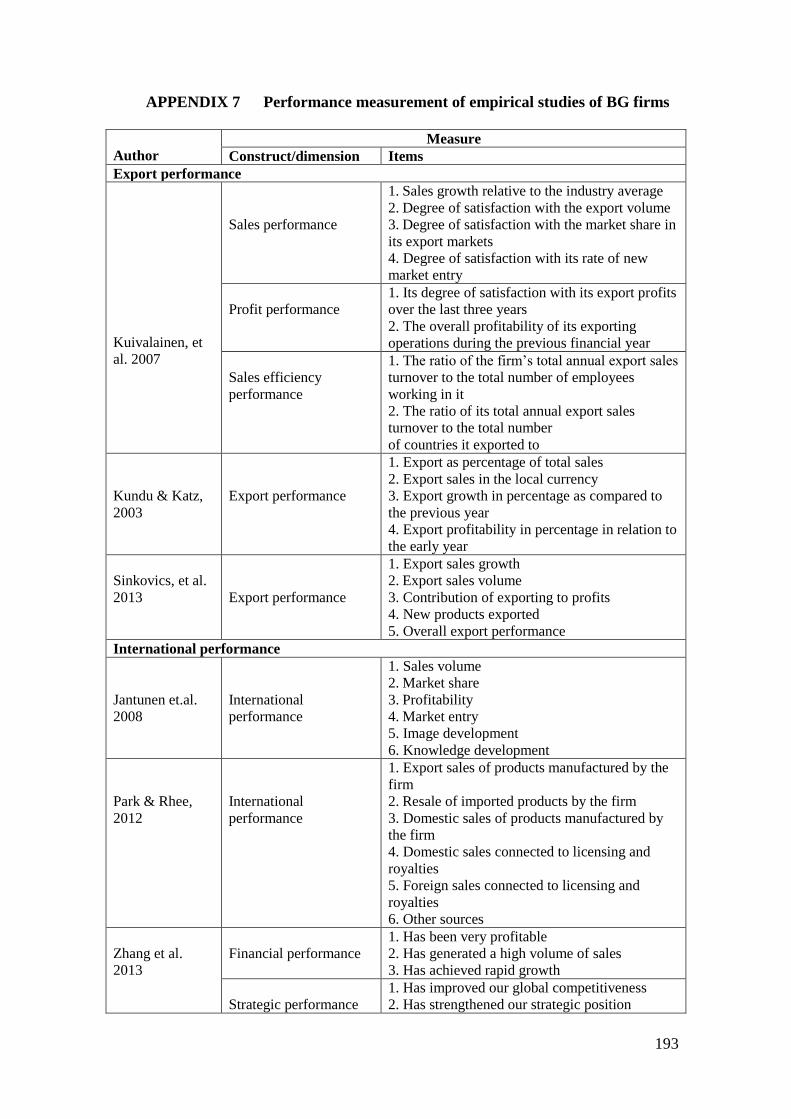
193
APPENDIX 7 Performance measurement of empirical studies of BG firms
Author
Measure
Construct/dimension Items
Export performance
Kuivalainen, et
al. 2007
Sales performance
1. Sales growth relative to the industry average
2. Degree of satisfaction with the export volume
3. Degree of satisfaction with the market share in
its export markets
4. Degree of satisfaction with its rate of new
market entry
Profit performance
1. Its degree of satisfaction with its export profits
over the last three years
2. The overall profitability of its exporting
operations during the previous financial year
Sales efficiency
performance
1. The ratio of the firm‘s total annual export sales
turnover to the total number of employees
working in it
2. The ratio of its total annual export sales
turnover to the total number
of countries it exported to
Kundu & Katz,
2003
Export performance
1. Export as percentage of total sales
2. Export sales in the local currency
3. Export growth in percentage as compared to
the previous year
4. Export profitability in percentage in relation to
the early year
Sinkovics, et al.
2013
Export performance
1. Export sales growth
2. Export sales volume
3. Contribution of exporting to profits
4. New products exported
5. Overall export performance
International performance
Jantunen et.al.
2008
International
performance
1. Sales volume
2. Market share
3. Profitability
4. Market entry
5. Image development
6. Knowledge development
Park & Rhee,
2012
International
performance
1. Export sales of products manufactured by the
firm
2. Resale of imported products by the firm
3. Domestic sales of products manufactured by
the firm
4. Domestic sales connected to licensing and
royalties
5. Foreign sales connected to licensing and
royalties
6. Other sources
Zhang et al.
2013
Financial performance
1. Has been very profitable
2. Has generated a high volume of sales
3. Has achieved rapid growth
Strategic performance
1. Has improved our global competitiveness
2. Has strengthened our strategic position
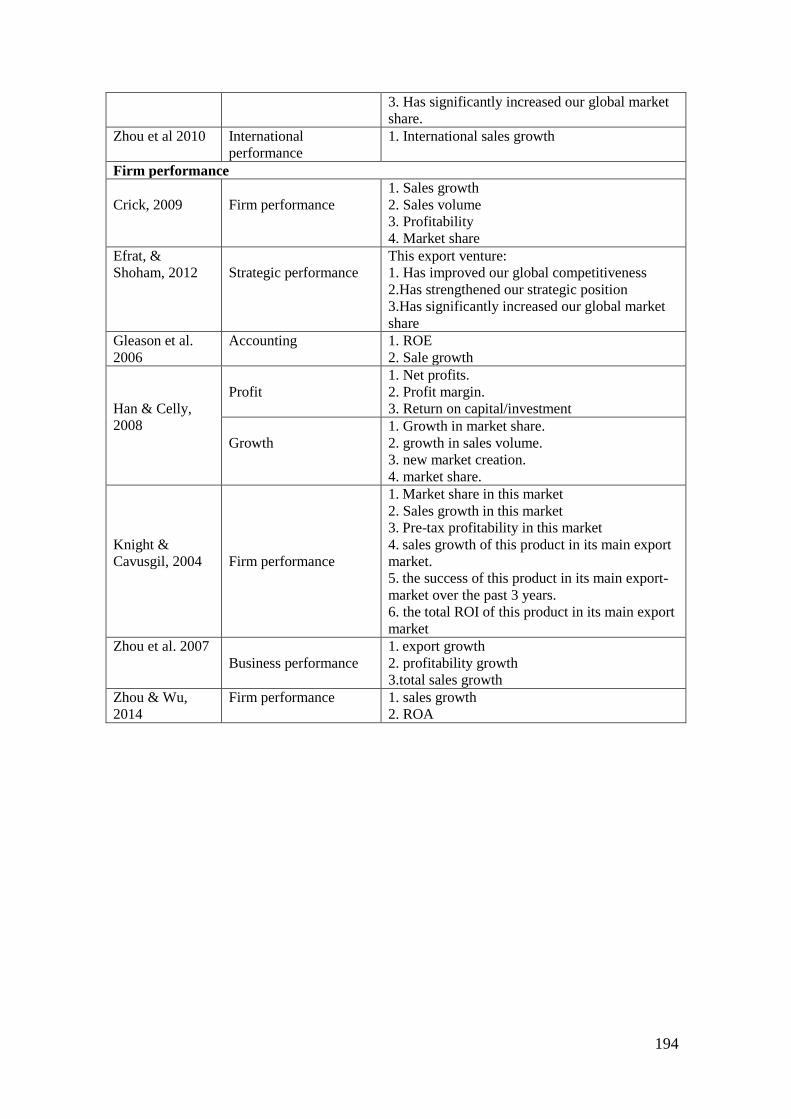
194
3. Has significantly increased our global market
share.
Zhou et al 2010 International
performance
1. International sales growth
Firm performance
Crick, 2009
Firm performance
1. Sales growth
2. Sales volume
3. Profitability
4. Market share
Efrat, &
Shoham, 2012
Strategic performance
This export venture:
1. Has improved our global competitiveness
2.Has strengthened our strategic position
3.Has significantly increased our global market
share
Gleason et al.
2006
Accounting 1. ROE
2. Sale growth
Han & Celly,
2008
Profit
1. Net profits.
2. Profit margin.
3. Return on capital/investment
Growth
1. Growth in market share.
2. growth in sales volume.
3. new market creation.
4. market share.
Knight &
Cavusgil, 2004
Firm performance
1. Market share in this market
2. Sales growth in this market
3. Pre-tax profitability in this market
4. sales growth of this product in its main export
market.
5. the success of this product in its main export-
market over the past 3 years.
6. the total ROI of this product in its main export
market
Zhou et al. 2007
Business performance
1. export growth
2. profitability growth
3.total sales growth
Zhou & Wu,
2014
Firm performance 1. sales growth
2. ROA
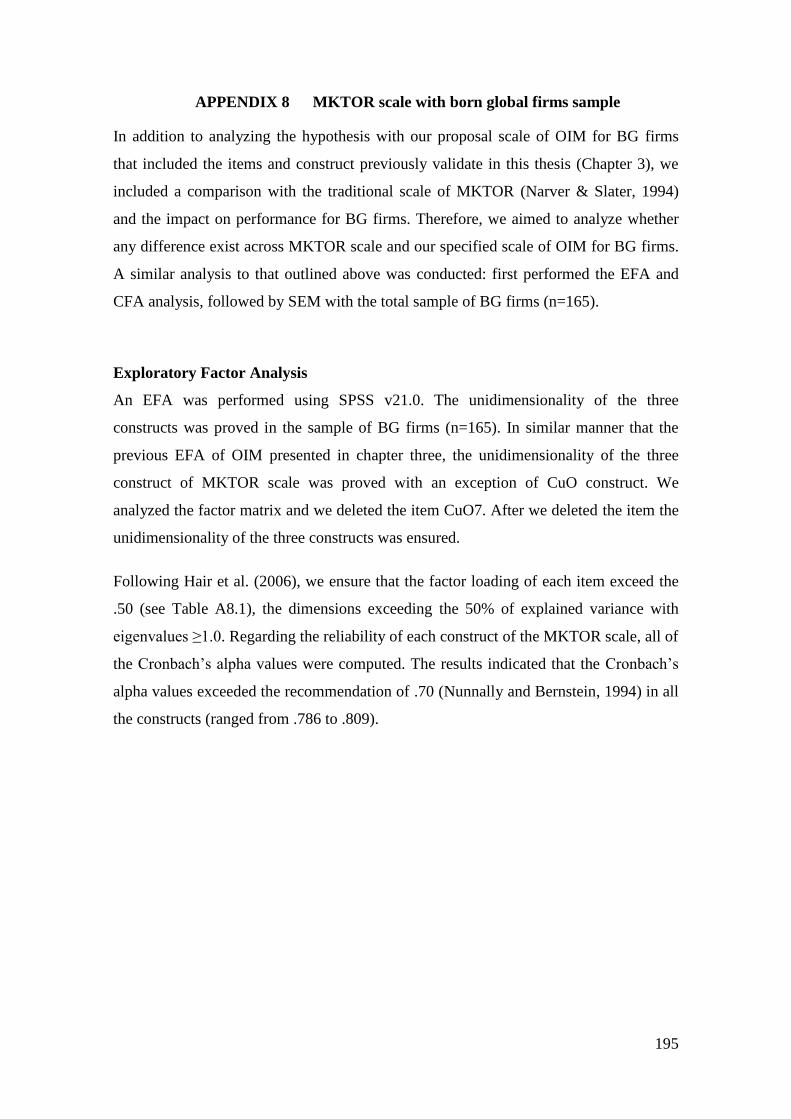
195
APPENDIX 8 MKTOR scale with born global firms sample
In addition to analyzing the hypothesis with our proposal scale of OIM for BG firms
that included the items and construct previously validate in this thesis (Chapter 3), we
included a comparison with the traditional scale of MKTOR (Narver & Slater, 1994)
and the impact on performance for BG firms. Therefore, we aimed to analyze whether
any difference exist across MKTOR scale and our specified scale of OIM for BG firms.
A similar analysis to that outlined above was conducted: first performed the EFA and
CFA analysis, followed by SEM with the total sample of BG firms (n=165).
Exploratory Factor Analysis
An EFA was performed using SPSS v21.0. The unidimensionality of the three
constructs was proved in the sample of BG firms (n=165). In similar manner that the
previous EFA of OIM presented in chapter three, the unidimensionality of the three
construct of MKTOR scale was proved with an exception of CuO construct. We
analyzed the factor matrix and we deleted the item CuO7. After we deleted the item the
unidimensionality of the three constructs was ensured.
Following Hair et al. (2006), we ensure that the factor loading of each item exceed the
.50 (see Table A8.1), the dimensions exceeding the 50% of explained variance with
eigenvalues ≥1.0. Regarding the reliability of each construct of the MKTOR scale, all of
the Cronbach‘s alpha values were computed. The results indicated that the Cronbach‘s
alpha values exceeded the recommendation of .70 (Nunnally and Bernstein, 1994) in all
the constructs (ranged from .786 to .809).
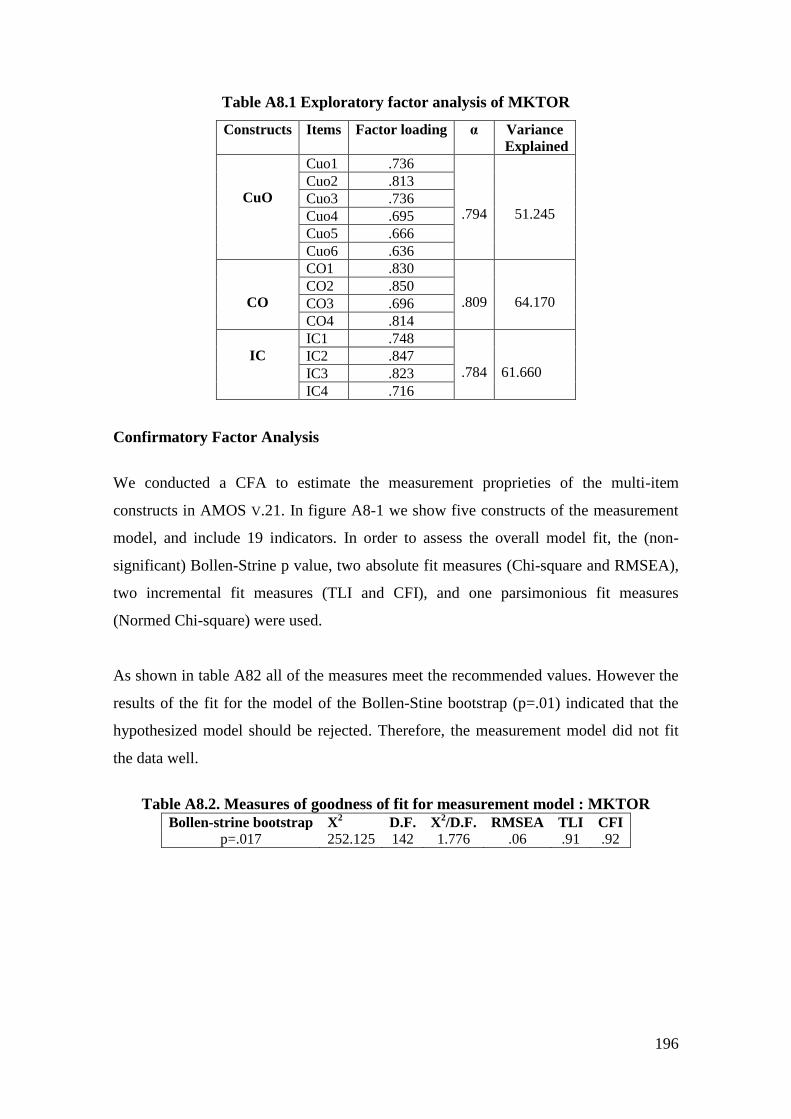
196
Table A8.1 Exploratory factor analysis of MKTOR
Constructs Items Factor loading α Variance
Explained
CuO
Cuo1 .736
.794
51.245
Cuo2 .813
Cuo3 .736
Cuo4 .695
Cuo5 .666
Cuo6 .636
CO
CO1 .830
.809
64.170 CO2 .850
CO3 .696
CO4 .814
IC
IC1 .748
.784
61.660 IC2 .847
IC3 .823
IC4 .716
Confirmatory Factor Analysis
We conducted a CFA to estimate the measurement proprieties of the multi-item
constructs in AMOS V.21. In figure A8-1 we show five constructs of the measurement
model, and include 19 indicators. In order to assess the overall model fit, the (non-
significant) Bollen-Strine p value, two absolute fit measures (Chi-square and RMSEA),
two incremental fit measures (TLI and CFI), and one parsimonious fit measures
(Normed Chi-square) were used.
As shown in table A82 all of the measures meet the recommended values. However the
results of the fit for the model of the Bollen-Stine bootstrap (p=.01) indicated that the
hypothesized model should be rejected. Therefore, the measurement model did not fit
the data well.
Table A8.2. Measures of goodness of fit for measurement model : MKTOR
Bollen-strine bootstrap X2
D.F. X2/D.F. RMSEA TLI CFI
p=.017 252.125 142 1.776 .06 .91 .92
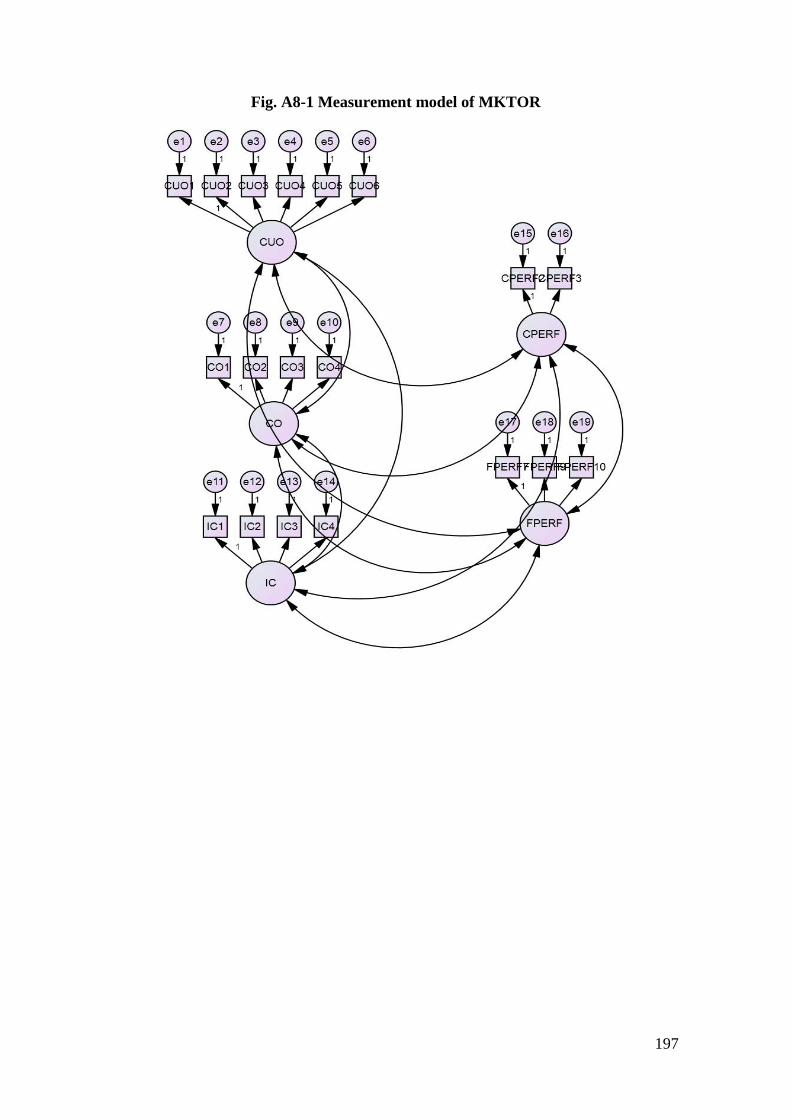
197
Fig. A8-1 Measurement model of MKTOR
198
5 CHAPTER FIVE: CONCLUSIONS
6 5.1 INTRODUCTION This thesis has enhanced the understanding of born global (BG) firms and of how
orientation towards international markets (OIM) relates to performance. As outlined in
chapter one, we aimed to contribute to the IE field by extending the knowledge of
market orientation (MO) in the context of BG firms. On the basis of an extensive
literature review and interviews with BG managers, we conceptualized the notion of
OIM for such firms. While there is a flourishing area of studies that in recent years have
investigated MO in the context of BG firms, there is a need for deeper studies that
investigate in more detail how MO influences the performance of BG firms. The
objective of this thesis was to fill the research gap suggested by Frishammar and
Andersson (2009): ―the problems associated with using ‗traditional‘ MO (...) constructs
in an SME setting and point to the need of developing more appropriate constructs
tailored to this context‖ (p.57). The thesis also addressed a research gap in terms of the
impact of MO on performance for BG firms (Knight, 2015).
In order to enrich the results of this thesis, the research design we adopted used a mixed
method approach, with a sample from different industries and more than one country.
We comment first on the choice of a mixed method design to develop and validate the
OIM concept. As pointed out by Jick (1979), the mixed methods approach is based on
the assumption that a weakness in any single method will be compensated by strengths
in another.
The advantage of the application of mixed methods in this study over the selection of a
single methodology is that it increased the robustness and the rigor, thus enhancing the
validity of the proposed OIM construct. The use of the qualitative study made it
possible to develop and propose the OIM scale. In addition to the interviews conducted
with the five managers of BG firms, the adoption of operational measures from the
existing literature increased the reliability. In order to test the applicability of the
proposed scale in the context of BG firms, the quantitative approach served as a
reliability and validity check on the OIM construct and then on the effect on
performance.
199
The majority of the previous studies of MO components in the field of marketing and
BG firms have adopted either a purely qualitative (Gabrielsson et al., 2014; Kocak &
Ambibola, 2009) or a quantitative (Wong & Merrilees, 2012) approach. Liao et al.
(2011) reviewed over 500 empirical studies on MO in order to gain a good
understanding of this research stream. The authors carried out a systematic analysis of
articles, focusing on the relationships between MO and performance, MO and
marketing, and MO and innovation, among others. They called for the integration of
methodologies to avoid incomplete conclusions and to allow a complete picture of MO
to be obtained. Hohenthal (2006) also highlighted the need for a mixed methods
research design in the field of IE. The author pointed out that ―using mixed methods is
an often proposed but rarely used research design‖ (p. 175). By following a path of
research that embraces a mixture of methods from both the IE and the marketing fields,
this thesis explores the benefits of embracing statistical techniques, methods, and
analytical tools from different research areas such case studies, scale development
literature, and SEM, in order to gain a better understanding of OIM for born global
firms.
Regarding our sample, this study incorporates a heterogeneous industry approach that
allows us to generalize the results. In the field of IE, studies tend to focus on sector-
specific data (Coviello & Jones, 2004). It is common for research on the BG
phenomenon to be carried out mainly in high-tech industries (Jones et al., 2011; Crick
& Crick, 2014; Mainela et al., 2011) or in sector-specific areas such as manufacturing
firms (e.g. McDougall & Oviatt, 1996; Knight & Cavusgil, 2004). As illustrated in
Table 17 of chapter three, the firms in our sample represent a variety of industries, and
thus in this thesis the conceptualization and application of OIM as an antecedent of
performance is not focused on any specific industry.
Moreover we adopted the multi-country approach. In general the analysis in BG studies
has been conducted for a single country (Pettersen & Tobiassen, 2012; Uner et al.,
2013) or within a country or cultural unit (Coelho et al., 2014; Efrat & Shoham, 2012),
and therefore multi-country research is somewhat limited (Zahra & George, 2002). In
addition, ―in spite of the importance of ensuring instrument equivalence in cross-
national investigations, IE research is weak in this area‖ (Coviello & Jones 2004, p.
496).
200
Our study adopted the multi-country approach at the stage of validating the OIM scale,
and, as a consequence, considered the influence on performance for samples made up of
Spanish and Nordic BG firms. With the aim of ensuring the instrument equivalence of
OIM, in line with Vandenberg and Lance (2000), the measurement equivalence was
checked. Thus, first of all for the OIM measurement, we tested the psychometric
proprieties of the scale with the full sample of the BG firms, and then, following
Vandenberg and Lance (2000), we checked the invariance of the OIM measurement
with a single-group analysis of the country, and then tested the invariability (chapter
three). A similar process was adopted for the performance construct (chapter four). The
empirical results indicated that our proposed tools of OIM and performance
measurement had metric and configural invariance in the context of Nordic and Spanish
firms.
The objective in this chapter is to present an overview and the main conclusions of the
three empirical studies, which were aimed at understanding the concept of OIM for BG
firms and its role in explaining the performance of this type of firm. The specific
contributions of this dissertation are shown first in the section on theoretical
contributions. After this, we present the managerial implications. This dissertation
concludes with a discussion of the limitations of the research and the suggestion of
avenues for future research.
5.2 THEORETICAL CONTRIBUTIONS
The main purpose of this study was to conceptualize MO in the context of BG firms, to
identify whether any adaptation was necessary, and to determine whether the suggested
OIM has an impact on performance.
Taking into account the fact that BG firms do not only act in the domestic market,
because they operate in very different markets in their early stages, and that the
traditional concept of MO does not recognize the international emphasis of BG firms,
we proposed the concept of OIM, which is related to the concept of MO but has a
broader content due to the international dimension of the concept. This orientation is
rooted in the components of the MKTOR scale and also incorporates other components
that allow firms to extend market orientation to international markets. Next, the main
theoretical contributions of the three original studies, as shown in Table 40, are
discussed in further detail.
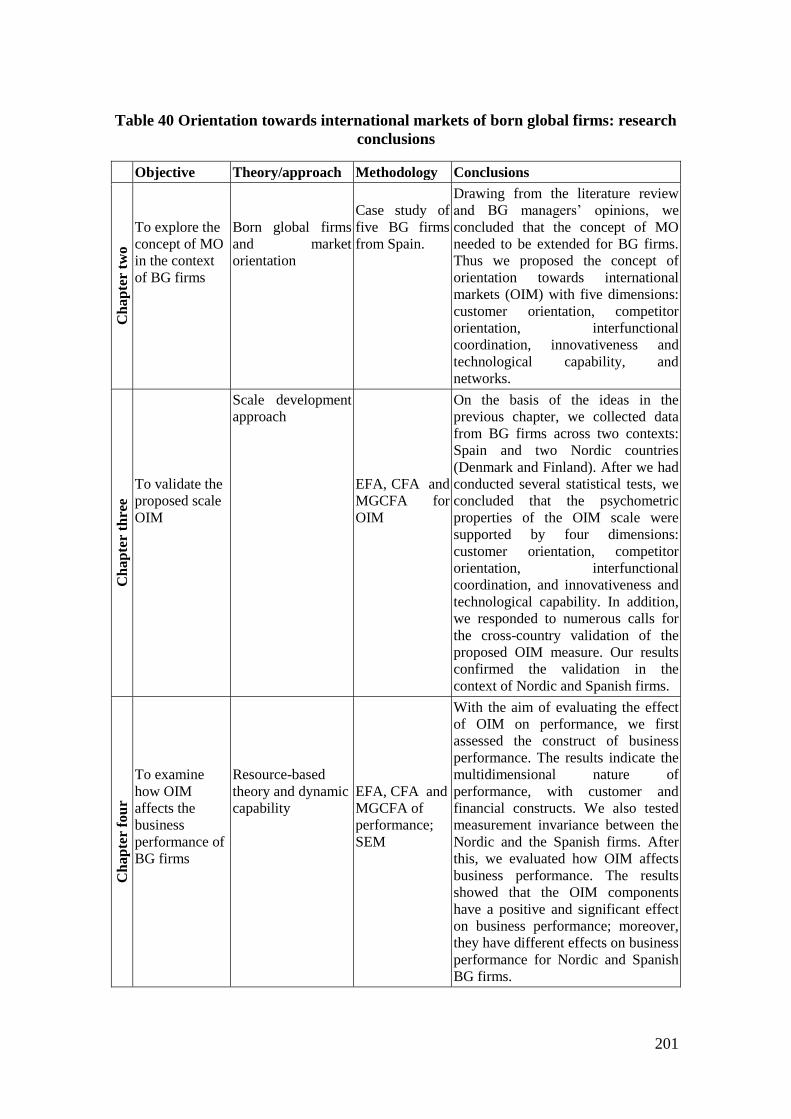
201
Table 40 Orientation towards international markets of born global firms: research
conclusions
Objective Theory/approach Methodology Conclusions
Ch
ap
ter
two
To explore the
concept of MO
in the context
of BG firms
Born global firms
and market
orientation
Case study of
five BG firms
from Spain.
Drawing from the literature review
and BG managers‘ opinions, we
concluded that the concept of MO
needed to be extended for BG firms.
Thus we proposed the concept of
orientation towards international
markets (OIM) with five dimensions:
customer orientation, competitor
orientation, interfunctional
coordination, innovativeness and
technological capability, and
networks.
Ch
ap
ter
thre
e
To validate the
proposed scale
OIM
Scale development
approach
EFA, CFA and
MGCFA for
OIM
On the basis of the ideas in the
previous chapter, we collected data
from BG firms across two contexts:
Spain and two Nordic countries
(Denmark and Finland). After we had
conducted several statistical tests, we
concluded that the psychometric
properties of the OIM scale were
supported by four dimensions:
customer orientation, competitor
orientation, interfunctional
coordination, and innovativeness and
technological capability. In addition,
we responded to numerous calls for
the cross-country validation of the
proposed OIM measure. Our results
confirmed the validation in the
context of Nordic and Spanish firms.
Ch
ap
ter
fou
r
To examine
how OIM
affects the
business
performance of
BG firms
Resource-based
theory and dynamic
capability
EFA, CFA and
MGCFA of
performance;
SEM
With the aim of evaluating the effect
of OIM on performance, we first
assessed the construct of business
performance. The results indicate the
multidimensional nature of
performance, with customer and
financial constructs. We also tested
measurement invariance between the
Nordic and the Spanish firms. After
this, we evaluated how OIM affects
business performance. The results
showed that the OIM components
have a positive and significant effect
on business performance; moreover,
they have different effects on business
performance for Nordic and Spanish
BG firms.
202
First, drawing on born global firms literature and the market orientation literature, this
study makes a key theoretical contribution by suggesting how MO should be
reconceptualized for BG firms. Our findings provide evidence that it is necessary to
incorporate components that relate to the international scope of this type of firm, with
the concept of ―orientation towards international markets (OIM)‖. The OIM scale
proposed provides a more comprehensive means of operationalizing the MO of BG
firms than is currently found in the literature. A significant criticism in the literature of
research into international firms is that many studies lack justification for adopting the
original scales for MO (MKTOR and/or MARKOR), and/or do not use the items fully
to capture the nature of BG firms, which operate mainly in the international
environment (Frishammar & Andersson, 2009). As pointed out by Knight and Kim
(2009), ―smaller international firms may manifest specific resources comprising
orientations and competences that are instrumental to the conception and
implementation of activities in international markets‖ (p. 257).
Moreover, our results support the view that both innovativeness and technological
capability and networks should be taken into account for a full understanding of OIM. A
central tenet of the RBV is that firm capabilities interact with each other, thus these
combinations create capabilities for firms that will produce a superior competitive
advantage (Menguc, 2006). An important theoretical contribution to the resource based
theory and the dynamic capabilities of our study is the finding that the BG firms require
additional capabilities (innovativeness and technological capability) in comparison to
the firms that have just developed domestic operations. Thus these capabilities will be
able to leverage this to their advantage to improve firm performance. The RBV suggests
that firms should create and develop their valuable, rare, imperfectly imitable resources
and utilize them to succeed in the domestic market and/ or abroad.
Based on the five components proposed for OIM, the second study analyzed the
psychometric properties of the OIM scale by adopting insights from the extent scale
development literature. Although the components of the OIM scale have previously
been used in research on an individual basis, no prior study has used all of these
constructs simultaneously. This answers Knight (2015) call for the BG literature to
explore the relevance of MO, and also answers Ruokonen et al. (2008) who pointed out
"that traditional measures do not cover all aspects of the phenomenon, and that a more
comprehensive approach is needed" (p. 1311).
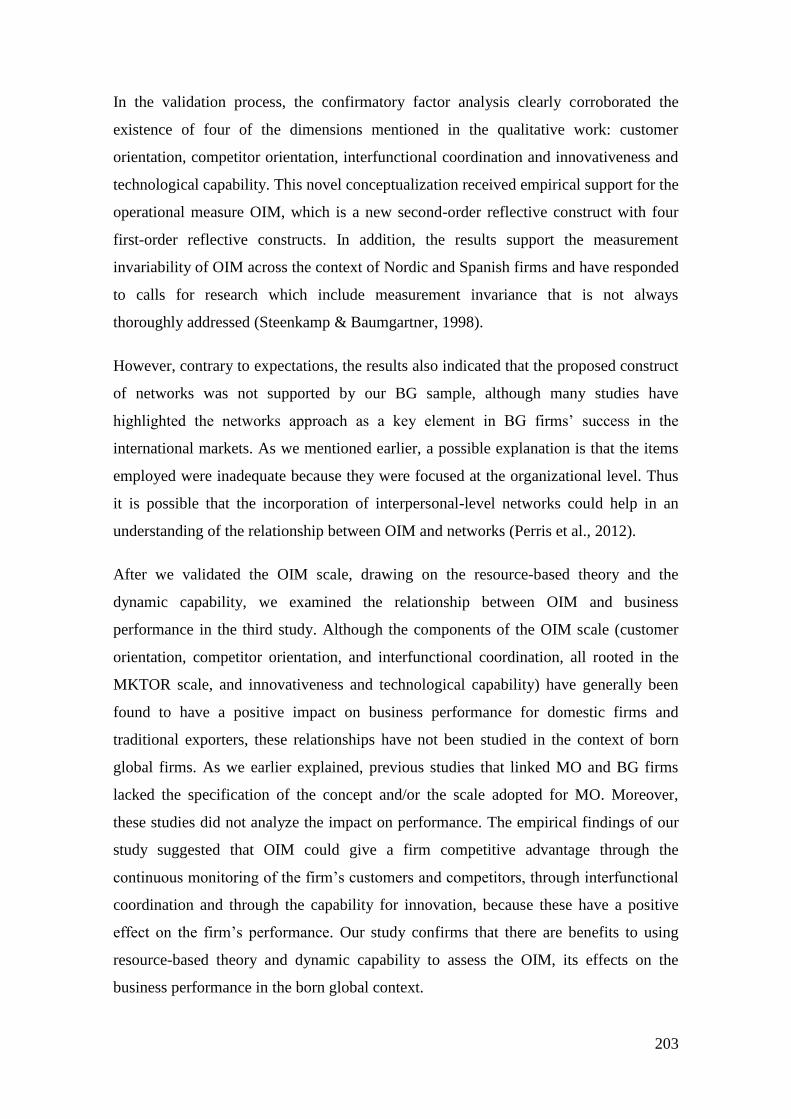
203
In the validation process, the confirmatory factor analysis clearly corroborated the
existence of four of the dimensions mentioned in the qualitative work: customer
orientation, competitor orientation, interfunctional coordination and innovativeness and
technological capability. This novel conceptualization received empirical support for the
operational measure OIM, which is a new second-order reflective construct with four
first-order reflective constructs. In addition, the results support the measurement
invariability of OIM across the context of Nordic and Spanish firms and have responded
to calls for research which include measurement invariance that is not always
thoroughly addressed (Steenkamp & Baumgartner, 1998).
However, contrary to expectations, the results also indicated that the proposed construct
of networks was not supported by our BG sample, although many studies have
highlighted the networks approach as a key element in BG firms‘ success in the
international markets. As we mentioned earlier, a possible explanation is that the items
employed were inadequate because they were focused at the organizational level. Thus
it is possible that the incorporation of interpersonal-level networks could help in an
understanding of the relationship between OIM and networks (Perris et al., 2012).
After we validated the OIM scale, drawing on the resource-based theory and the
dynamic capability, we examined the relationship between OIM and business
performance in the third study. Although the components of the OIM scale (customer
orientation, competitor orientation, and interfunctional coordination, all rooted in the
MKTOR scale, and innovativeness and technological capability) have generally been
found to have a positive impact on business performance for domestic firms and
traditional exporters, these relationships have not been studied in the context of born
global firms. As we earlier explained, previous studies that linked MO and BG firms
lacked the specification of the concept and/or the scale adopted for MO. Moreover,
these studies did not analyze the impact on performance. The empirical findings of our
study suggested that OIM could give a firm competitive advantage through the
continuous monitoring of the firm‘s customers and competitors, through interfunctional
coordination and through the capability for innovation, because these have a positive
effect on the firm‘s performance. Our study confirms that there are benefits to using
resource-based theory and dynamic capability to assess the OIM, its effects on the
business performance in the born global context.
204
EMO (rooted in
MARKOR)
In addition, whilst we attempted to compare the results of OIM with the original
MKTOR scale using the BG sample, the model fit for MKTOR showed it that was not
possible to estimate the model, and as a consequence no comparative approach between
OIM and MKTOR can be adopted.
To summarize, as we illustrate in figure 14, this dissertation contributes to born global
research by providing a scale of orientation towards international markets and
demonstrating the effect of this orientation on the performance of born global firms.
Figure 14 Traditional Market Orientation, and Orientation towards International
Markets of Born Global Firms
5.3 MANAGERIAL IMPLICATIONS
The findings of this study have important implications for born global business
managers. With a stronger focus on return on investment and restricted budgets, an
effective OIM for a company is more important than ever. However, to date the
managers of BG firms have lacked the tool that is necessary to allow them to measure
this relevant yet intangible asset in their firms. The scale we have developed can
provide a reliable and valid analytical tool for assessing the orientation towards
international markets of these firms. Thus born global managers may adopt the scale for
a better understanding of the reality of foreign markets and to develop effective
strategies to attract and retain customers in different markets overseas. Furthermore, this
measurement scale allows for an item-based prioritization. For marketing managers in
particular, an application of the items of the scale can provide detailed information on
Traditional
view
Born
global
firms
MARKOR
Orientation towards international markets Customer orientation, competitor orientation, interfunctional coordination and innovativeness
and technological capability.
MKTOR
Market orientation
205
marketing activities that meet the needs and expectations of customers in foreign
markets. As a consequence, the OIM scale provides managers of BG firms with
important means for taking action, not only to increase their firms‘ OIM but also to
manage the consequences of OIM, such as the satisfaction of customers‘ expectations,
effectively.
5.4 STUDY LIMITATIONS
This thesis has outlined the research undertaken, which involved different approaches
and stages, and a mixed methodology. As a result, there are several limitations of this
study that should be taken into account.
The sample for the first study was drawn from five BG firms based in Spain. In spite of
the fact that the sample size is small if we are generalizing the results, the five
companies studied were from different sectors (e.g. design, telecommunications
systems, and advertising services), which allowed us to test samples from different
sectors in the further analyses. However, regarding the quantitative studies, the sample
size of BG firms (n=165) is considered small in the SEM literature.
An additional limitation is that our empirical study relied on the key informant
approach. However, the use of a single informant was found to be necessary and
appropriate for this thesis. The informants were not chosen on a random basis: their
participation was requested because they had special knowledge of the international and
marketing activities of their companies. Adopting this strategy offers an advantage over
the use of several informants (Phillips, 1981). For instance, Narver and Slater (1990)
acknowledge, as one limitation of their study, that all the measures used the average of
the responses from all the responders in each SBU. In spite of the fact that a multi-
informant approach increases the reliability of a study, marketing research still tends to
rely on a single informant (Kumar et al., 1993; Lukas & Ferrell, 2000).
5.5 SUGGESTIONS FOR FUTURE RESEARCH
This study has identified that there is room for further research on the application of
OIM adopted by BG firms. Some of the possibilities for further investigation are
described below.
Our analysis was based on BG firms in Nordic countries and Spain, with the objective
being to validate and measure OIM and performance. Future research can also attempt
206
to examine the relationship between OIM and performance for traditional firms that
operate in international markets. As we mentioned in chapter three, we collected a total
of 955 valid observations, but because of our focus on BG firms, we used only 25% of
the total sample collected. Thus with the rest of our dataset it would be possible to carry
out further exploration with the 739 firms that followed a different speed in the
internationalization process. Zhang et al. (2009) say: ―We believe a comparison of born
global firms and traditional exporters might be of interest to IE researchers‖ (p.293).
Therefore, it will be interesting to see the link between OIM and performance and
identify whether the OIM scale follows the same operationalization and has the same
effects on performance for firms that are not ―born global‖.
The relationship between OIM and business performance was examined with cross-
sectional data, instead of longitudinal data. BG firms are similar to other international
firms in that their global business environment is very competitive and dynamic, so
some of the variables measured will change over time, and this may modify the results.
Further study using a longitudinal approach would provide a richer and clearer
understanding of the dynamics and complexity of the proposed relationship between
OIM and performance in a BG context (Fillis, 2007; Hagen & Zucchella, 2014; Noble,
Sinha & Kumar, 2002).
Another promising avenue for future research would be to study the effect of OIM
under multi-group analysis with manufacturing firms and service firms. The role of
service firms has hardly been studied in the literature, because most previous studies
have been focused on manufacturing firms (Perris et al.,2012). In a similar way to the
way in which we performed the comparison across countries, future studies could
examine whether the impact of OIM across services and manufacturing varies, and
increase the generality of our findings.
Likewise, another area that deserves future attention is related to the role of the network
construct. Initially, and based on the literature review and the managers of the BG firms,
we included the role of networks as part of OIM. However the statistical results of the
CFA performed in chapter three showed that the role of networks was not part of the
OIM scale. As we mentioned, future research should explore the relationship between
OIM and networks to determine whether new items of the construct should be taken
into account and included in the OIM scale.

207
Finally, this study explores OIM and its effect on performance. Previous studies in the
field of MO investigate how each component of MO influences performance (e.g. Gaur
et al., 2011; Sørense, 2009). For future research, an effort should be made to assess,
using disaggregation, the construct of OIM. It will be interesting to identify the
construct that has the strongest effect on business performance.
208
5.6 REFERENCES
Coelho, B. V., de Mello, R. C., & da Rocha, A. (2014). Leblon Cachaça: A born
global in a traditional industry. Journal of Business Research, 67 (4), 567-575.
Coviello, N. E., & Jones, M. V. (2004). Methodological issues in international
entrepreneurship research. Journal of Business Venturing, 19 (4), 485-508.
Crick, D. & J. Crick (2014). The Internationalization Strategies of Rapidly
Internationalizing High-Tech SMES: Planned and Unplanned Activities, European
Business Review, 26 (5), 421-448.
Efrat, K., & Shoham, A. (2012). Born global firms: the differences between their
short-and long-term performance drivers. Journal of World Business, 47 (4), 675-685.
Fillis, I. (2007). A methodology for researching international entrepreneurship in
SMEs: a challenge to the status quo. Journal of Small Business and Enterprise
Development, 14 (1), 118-135.
Frishammar, J., & Andersson, S. (2009). The overestimated role of strategic
orientations for international performance in smaller firms. Journal of International
Entrepreneurship, 7 (1), 57-77.
Gabrielsson, M., Gabrielsson, P., & Dimitratos, P. (2014). International
Entrepreneurial Culture and Growth of International New Ventures. Management
International Review, 54 (4), 445-471.
Knight G. (2015). Born Global Firms: Evolution of a Contemporary
Phenomenon, in Shaoming Zou , Hui Xu , Linda Hui Shi (ed.) Entrepreneurship in
International Marketing (Advances in International Marketing, Volume 25) Emerald
Group Publishing Limited, pp. 3 - 19.
Gaur, S. S., Vasudevan, H., & Gaur, A. S. (2011). Market orientation and
manufacturing performance of Indian SMEs: Moderating role of firm resources and
environmental factors. European Journal of Marketing, 45 (7/8), 1172-1193.
Hagen, B., & Zucchella, A. (2014). Born global or born to run? The long-term
growth of born global firms. Management International Review, 54 (4), 497-525.
Hohenthal, J. (2006). Integrating qualitative and quantitative methods in
research on international entrepreneurship. Journal of International Entrepreneurship, 4
(4), 175-190.
Jick, T. D. (1979). Mixing qualitative and quantitative methods: Triangulation in
action. Administrative science quarterly, 602-611.
Jones, M. V., Coviello, N., & Tang, Y. K. (2011). International entrepreneurship
research (1989–2009): a domain ontology and thematic analysis. Journal of Business
Venturing, 26 (6), 632-659.
Knight, G. A., & Cavusgil, S. T. (2004). Innovation, organizational capabilities,
and the born-global firm. Journal of International Business Studies, 35 (2), 124-141.
Kocak, A., & Abimbola, T. (2009). The effects of entrepreneurial marketing on
born global performance. International Marketing Review, 26 (4/5), 439-452.
Kumar, N., Stern, L. W., & Anderson, J. C. (1993). Conducting
interorganizational research using key informants. Academy of management journal, 36
(6), 1633-1651.
Liao, S. H., Chang, W. J., Wu, C. C., & Katrichis, J. M. (2011). A survey of
market orientation research (1995–2008). Industrial Marketing Management, 40 (2),
301-310.
209
Lukas, B. A., & Ferrell, O. C. (2000). The effect of market orientation on
product innovation. Journal of the academy of marketing science, 28 (2), 239-247.
Mainela, T., Pernu, E., & Puhakka, V. (2011). The development of a high-tech
international new venture as a process of acting: A study of the lifespan of a venture in
software business. Journal of Small Business and Enterprise Development, 18 (3), 430-
456.
McDougall, P. P., & Oviatt, B. M. (1996). New venture internationalization,
strategic change, and performance: A follow-up study. Journal of Business Venturing,
11 (1), 23-40.
Narver, J. C., & Slater, S. F. (1990). The effect of a market orientation on
business profitability. The Journal of Marketing, 20-35.
Noble, C. H., Sinha, R. K., & Kumar, A. (2002). Market orientation and
alternative strategic orientations: a longitudinal assessment of performance implications.
Journal of marketing, 66 (4), 25-39.
Peiris, I. K., Akoorie, M. E., & Sinha, P. (2012). International entrepreneurship:
A critical analysis of studies in the past two decades and future directions for research.
Journal of International Entrepreneurship, 10 (4), 279-324.
Pettersen, I. B., & Tobiassen, A. E. (2012). Are born globals really born globals?
The case of academic spin-offs with long development periods. Journal of International
Entrepreneurship, 10 (2), 117-141.
Phillips, L. W. (1981). Assessing measurement error in key informant reports: A
methodological note on organizational analysis in marketing. Journal of Marketing
Research, 395-415.
Sørensen, H. E. (2009). Why competitors matter for market orientation.
European Journal of Marketing, 43 (5/6), 735-761.
Uner, M. M., Kocak, A., Cavusgil, E., & Cavusgil, S. T. (2013). Do barriers to
export vary for born globals and across stages of internationalization? An empirical
inquiry in the emerging market of Turkey. International Business Review, 22 (5), 800-
813.
Vandenberg, R. J., & Lance, C. E. (2000). A review and synthesis of the
measurement invariance literature: Suggestions, practices, and recommendations for
organizational research. Organizational research methods, 3 (1), 4-70.
Wong, J.H., & Merrilees B. (2012).Born Globals: How are they Different?, in
K. Scott Swan, Shaoming Zou (ed.) Interdisciplinary Approaches to Product Design,
Innovation, & Branding in International Marketing (Advances in International
Marketing, Volume 23), 305 - 329.
Zahra, S. A., & George, G. (2002). The net-enabled business innovation cycle
and the evolution of dynamic capabilities. Information Systems Research, 13 (2), 147-
150.
Zhang, M., Tansuhaj, p., & McCullought, J. (2009). International
entrepreneurial capability: The measurement and a comparison between born global
firms and traditional exporters in China. Journal of International Entrepreneurship, 7,
292-322.

210
APPENDIX 9 Survey Spanish version
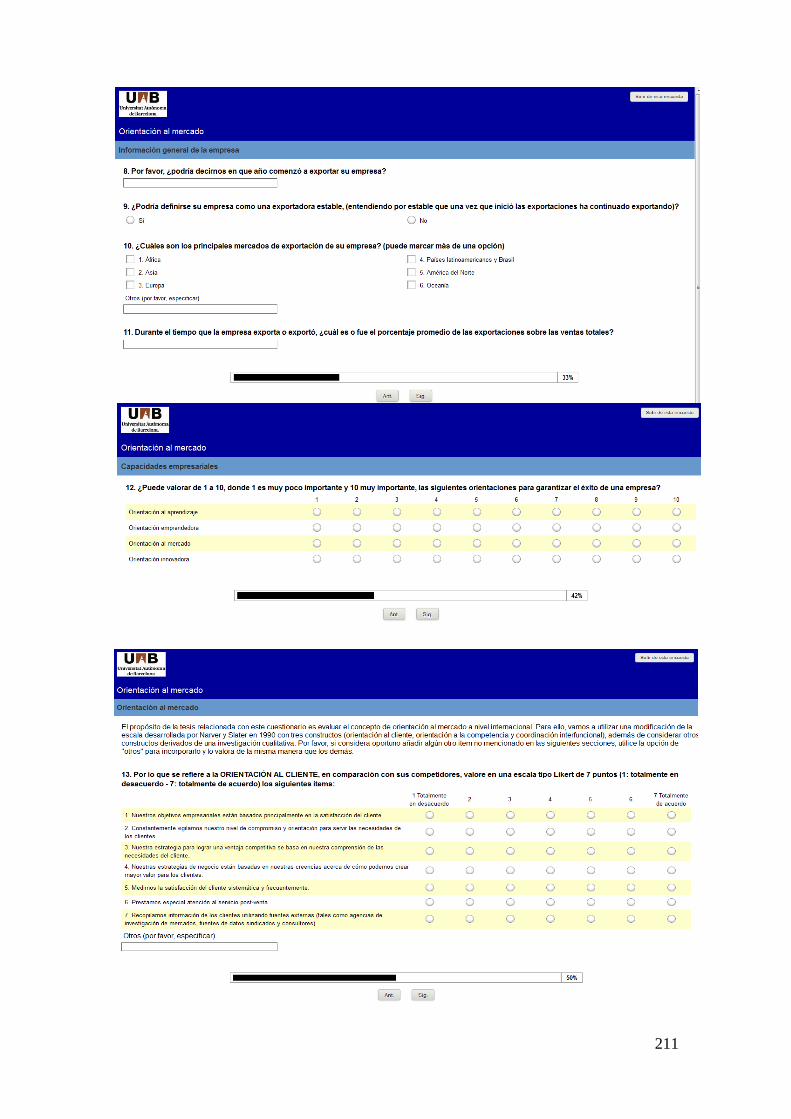
211

212

213

214
APPENDIX 10 Survey English version
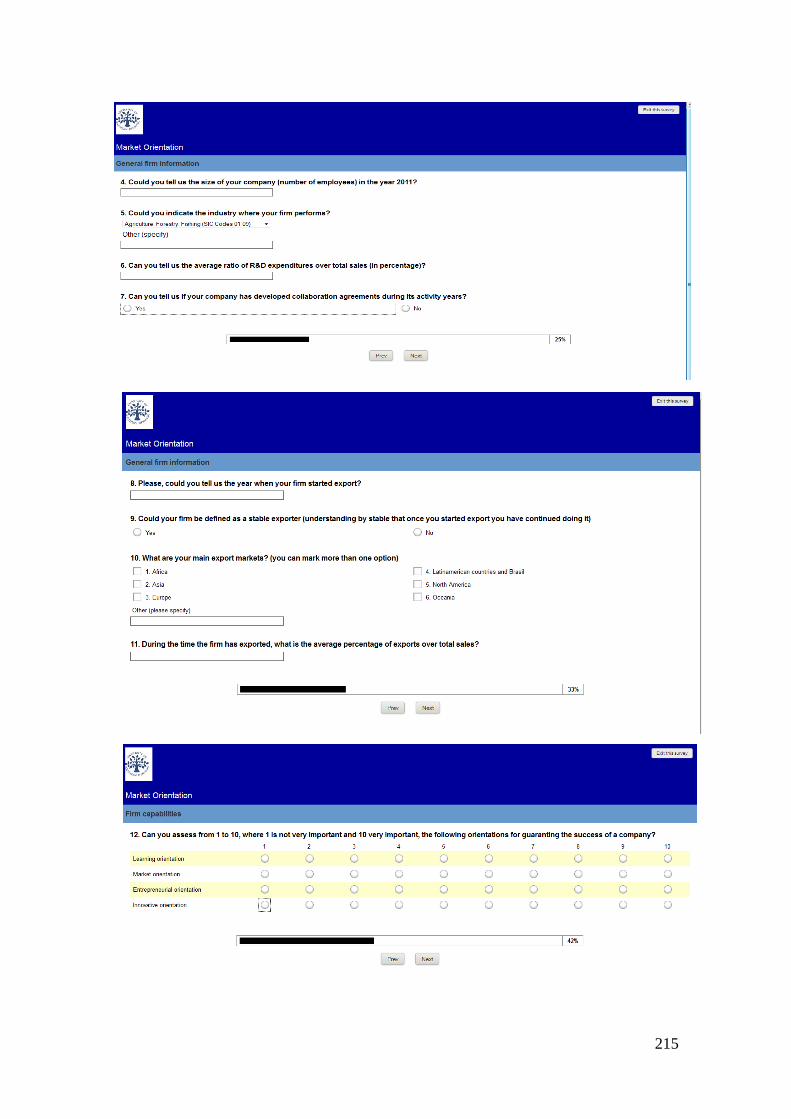
215
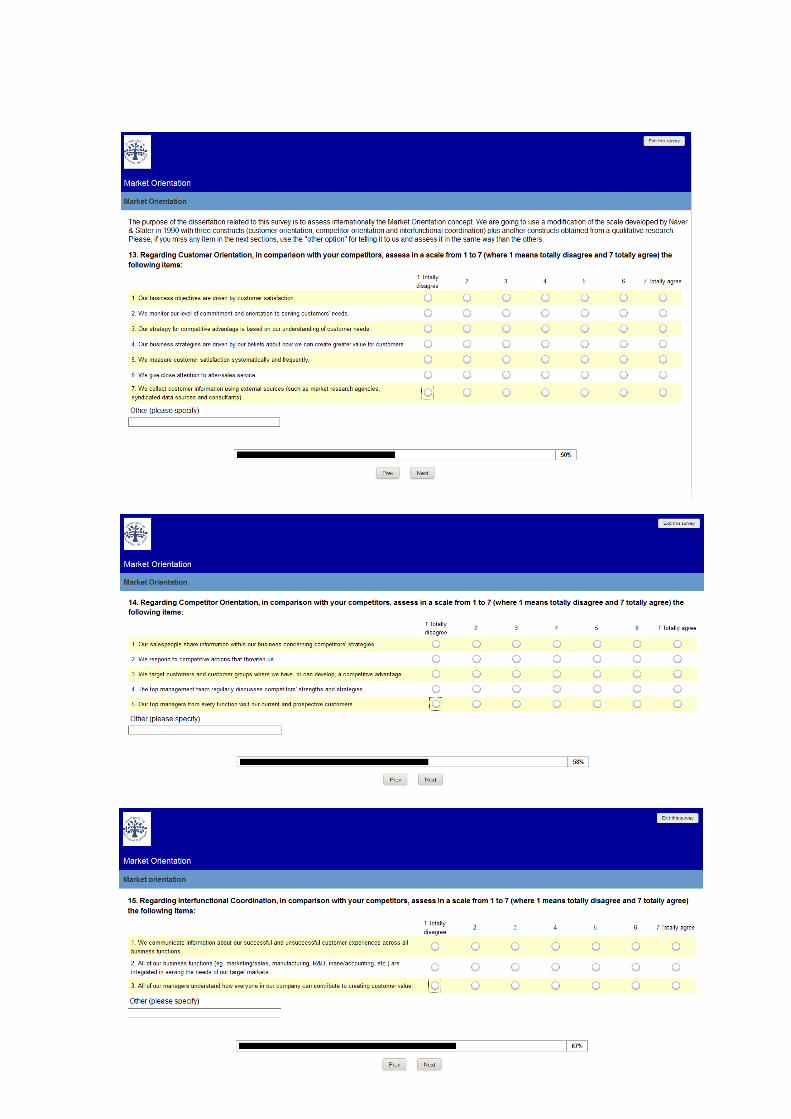
216
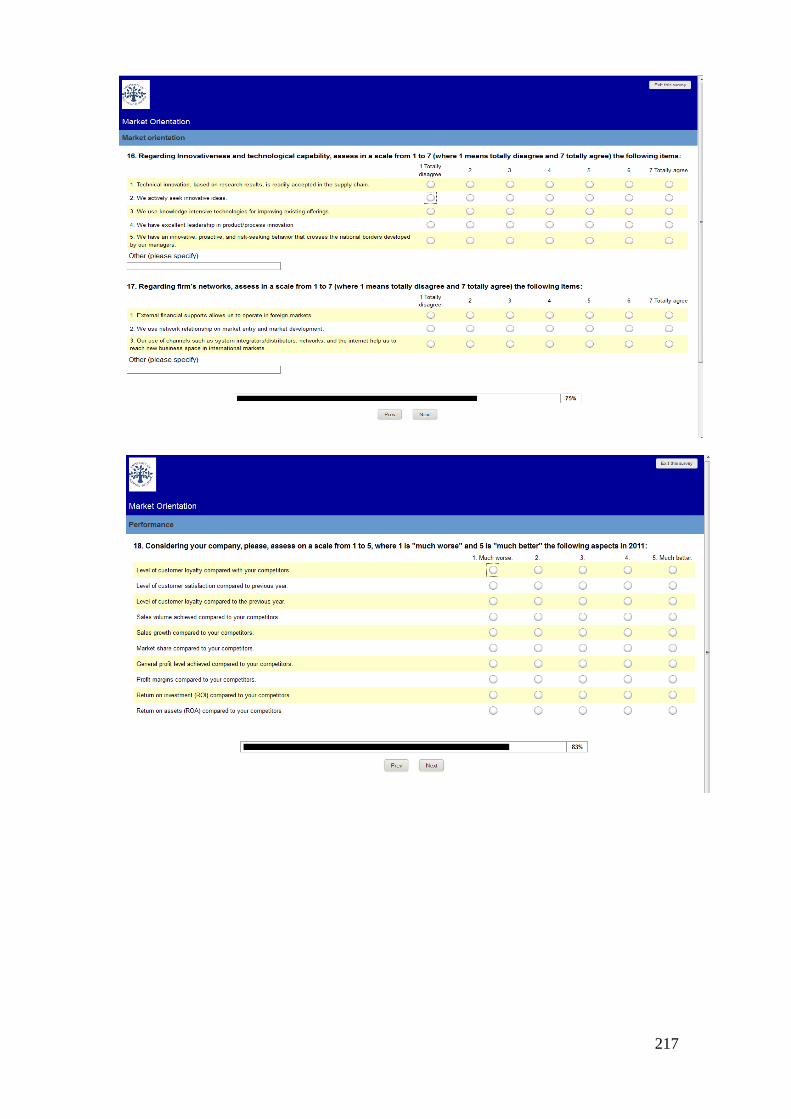
217

218


