1 Fidelity Factor Index Methodologies
Fidelity High Dividend Index
Fidelity Dividend Index for Rising Rates
Fidelity International High Dividend Index
Fidelity U.S. Low Volatility Factor Index
Fidelity U.S. Momentum Factor Index
Fidelity U.S. Quality Factor Index
Fidelity U.S. Value Factor Index
Fidelity International Value Factor Index
Index Methodology Document
January 2018
2 Fidelity Factor Index Methodologies
Table of Contents
SECTION 1: INTRODUCTION .................................................................................................................................... 3
Index Definitions and Rationale .............................................................................................................................. 3
Index Methodology Summary ................................................................................................................................. 4
SECTION 2: INVESTMENT UNIVERSE ..................................................................................................................... 5
U.S. Investment Universes ..................................................................................................................................... 5
Developed International Investment Universe ........................................................................................................ 6
SECTION 3: INDEX CONSTRUCTION ....................................................................................................................... 7
Fidelity High Dividend Index ................................................................................................................................... 7
Fidelity Dividend Index for Rising Rates ................................................................................................................. 9
Fidelity International High Dividend Index ............................................................................................................ 11
Fidelity U.S. Low Volatility Factor Index ............................................................................................................... 13
Fidelity U.S. Momentum Factor Index .................................................................................................................. 14
Fidelity U.S. Quality Factor Index ......................................................................................................................... 15
Fidelity U.S. Value Factor Index ........................................................................................................................... 16
Fidelity International Value Factor Index .............................................................................................................. 17
SECTION 4: INDEX MAINTENANCE ....................................................................................................................... 19
Frequency of Rebalance ....................................................................................................................................... 19
Ongoing Maintenance ........................................................................................................................................... 19
SECTION 5: INDEX CALCULATIONS ..................................................................................................................... 20
Index History ......................................................................................................................................................... 20
Data Distribution ................................................................................................................................................... 20
SECTION 6: INDEX GOVERNANCE ........................................................................................................................ 22
Index Sponsor and Index Calculation Agent......................................................................................................... 22
Index Committee ................................................................................................................................................... 22
Index Policy ........................................................................................................................................................... 22
DISCLAIMERS .......................................................................................................................................................... 23
3 Fidelity Factor Index Methodologies
Section 1: Introduction
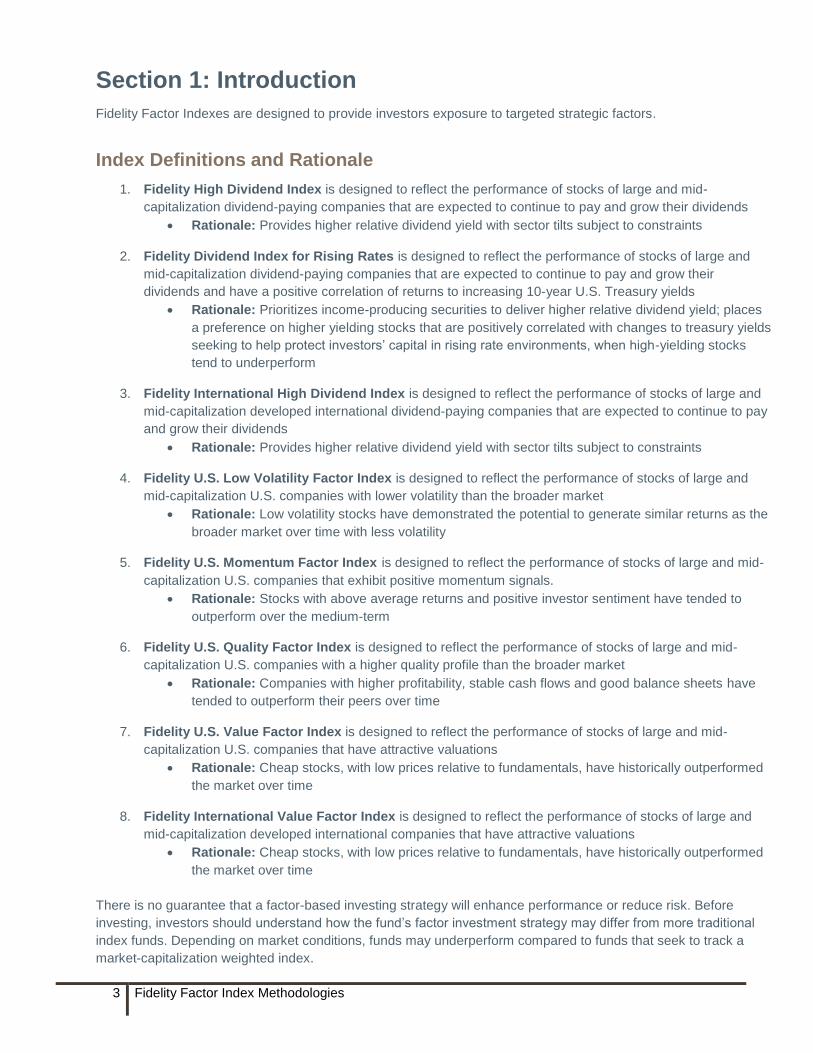
Fidelity Factor Indexes are designed to provide investors exposure to targeted strategic factors.
Index Definitions and Rationale
1. Fidelity High Dividend Index is designed to reflect the performance of stocks of large and mid-
capitalization dividend-paying companies that are expected to continue to pay and grow their dividends
Rationale: Provides higher relative dividend yield with sector tilts subject to constraints
2. Fidelity Dividend Index for Rising Rates is designed to reflect the performance of stocks of large and
mid-capitalization dividend-paying companies that are expected to continue to pay and grow their
dividends and have a positive correlation of returns to increasing 10-year U.S. Treasury yields
Rationale: Prioritizes income-producing securities to deliver higher relative dividend yield; places
a preference on higher yielding stocks that are positively correlated with changes to treasury yields
seeking to help protect investors’ capital in rising rate environments, when high-yielding stocks
tend to underperform
3. Fidelity International High Dividend Index is designed to reflect the performance of stocks of large and
mid-capitalization developed international dividend-paying companies that are expected to continue to pay
and grow their dividends
Rationale: Provides higher relative dividend yield with sector tilts subject to constraints
4. Fidelity U.S. Low Volatility Factor Index is designed to reflect the performance of stocks of large and
mid-capitalization U.S. companies with lower volatility than the broader market
Rationale: Low volatility stocks have demonstrated the potential to generate similar returns as the
broader market over time with less volatility
5. Fidelity U.S. Momentum Factor Index is designed to reflect the performance of stocks of large and mid-
capitalization U.S. companies that exhibit positive momentum signals.
Rationale: Stocks with above average returns and positive investor sentiment have tended to
outperform over the medium-term
6. Fidelity U.S. Quality Factor Index is designed to reflect the performance of stocks of large and mid-
capitalization U.S. companies with a higher quality profile than the broader market
Rationale: Companies with higher profitability, stable cash flows and good balance sheets have
tended to outperform their peers over time
7. Fidelity U.S. Value Factor Index is designed to reflect the performance of stocks of large and mid-
capitalization U.S. companies that have attractive valuations
Rationale: Cheap stocks, with low prices relative to fundamentals, have historically outperformed
the market over time
8. Fidelity International Value Factor Index is designed to reflect the performance of stocks of large and
mid-capitalization developed international companies that have attractive valuations
Rationale: Cheap stocks, with low prices relative to fundamentals, have historically outperformed
the market over time
There is no guarantee that a factor-based investing strategy will enhance performance or reduce risk. Before
investing, investors should understand how the fund’s factor investment strategy may differ from more traditional
index funds. Depending on market conditions, funds may underperform compared to funds that seek to track a
market-capitalization weighted index.
4 Fidelity Factor Index Methodologies
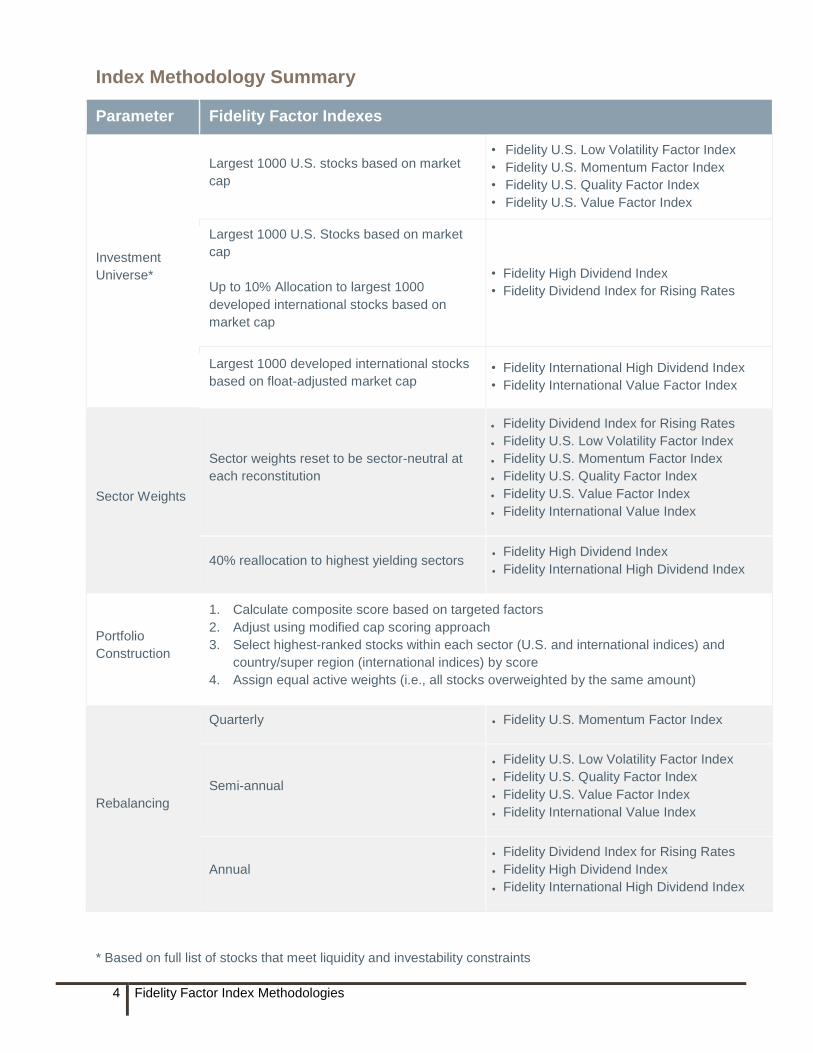
Index Methodology Summary
Parameter Fidelity Factor Indexes
Investment
Universe*
Largest 1000 U.S. stocks based on market
cap
• Fidelity U.S. Low Volatility Factor Index
• Fidelity U.S. Momentum Factor Index
• Fidelity U.S. Quality Factor Index
• Fidelity U.S. Value Factor Index
Largest 1000 U.S. Stocks based on market
cap
Up to 10% Allocation to largest 1000
developed international stocks based on
market cap
• Fidelity High Dividend Index
• Fidelity Dividend Index for Rising Rates
Largest 1000 developed international stocks
based on float-adjusted market cap • Fidelity International High Dividend Index
• Fidelity International Value Factor Index
Sector Weights
Sector weights reset to be sector-neutral at
each reconstitution
Fidelity Dividend Index for Rising Rates
Fidelity U.S. Low Volatility Factor Index
Fidelity U.S. Momentum Factor Index
Fidelity U.S. Quality Factor Index
Fidelity U.S. Value Factor Index
Fidelity International Value Index
40% reallocation to highest yielding sectors Fidelity High Dividend Index
Fidelity International High Dividend Index
Portfolio
Construction
1. Calculate composite score based on targeted factors
2. Adjust using modified cap scoring approach
3. Select highest-ranked stocks within each sector (U.S. and international indices) and
country/super region (international indices) by score
4. Assign equal active weights (i.e., all stocks overweighted by the same amount)
Rebalancing
Quarterly Fidelity U.S. Momentum Factor Index
Semi-annual
Fidelity U.S. Low Volatility Factor Index
Fidelity U.S. Quality Factor Index
Fidelity U.S. Value Factor Index
Fidelity International Value Index
Annual
Fidelity Dividend Index for Rising Rates
Fidelity High Dividend Index
Fidelity International High Dividend Index
* Based on full list of stocks that meet liquidity and investability constraints

5 Fidelity Factor Index Methodologies
Section 2: Investment Universe
U.S. Investment Universes
Constructing the domestic indexes begins with selecting the largest 1,000 U.S. stocks based on market cap and
certain liquidity and investability requirements. These largest 1,000 securities are the eligible investment universe
for Fidelity U.S. Low Volatility Factor Index, Fidelity U.S. Momentum Factor Index, Fidelity U.S. Quality Factor
Index, and Fidelity U.S. Value Factor Index. These largest 1,000 securities are 90% or more of the eligible
investment universe for Fidelity High Dividend Index and Fidelity Dividend Index for Rising Rates. These securities
are utilized to determine the weights of the broader U.S. equity market (U.S. Equity market).
Securities Excluded:
1. Remove any stocks whose country is not classified as United States
2. Remove any stocks whose security type is not set to common stock, or that are not the parent entity
3. Remove any remaining securities that are:
a. Limited Partnerships
b. BDCs
c. ADRs
d. Closed End Funds
e. UITs
f. Mutual Funds
Data Availability Screens:
1. Include only stocks with prices, market caps, and trading volumes greater than zero
Liquidity / Investability Screens:
1. Exclude all stocks in the bottom quintile of securities based on days to trade $10 million
2. Exclude all stocks with less than 15% free float market cap
Largest 1000 Selection: Sort the remaining stocks by free-float market cap. The market cap of all share classes is
combined into a single value for the stock. The top 1000 stocks comprise the eligible starting universe. Weights for
constituents and sectors in the U.S. Equity market are also determined using combined free-float market cap.
6 Fidelity Factor Index Methodologies
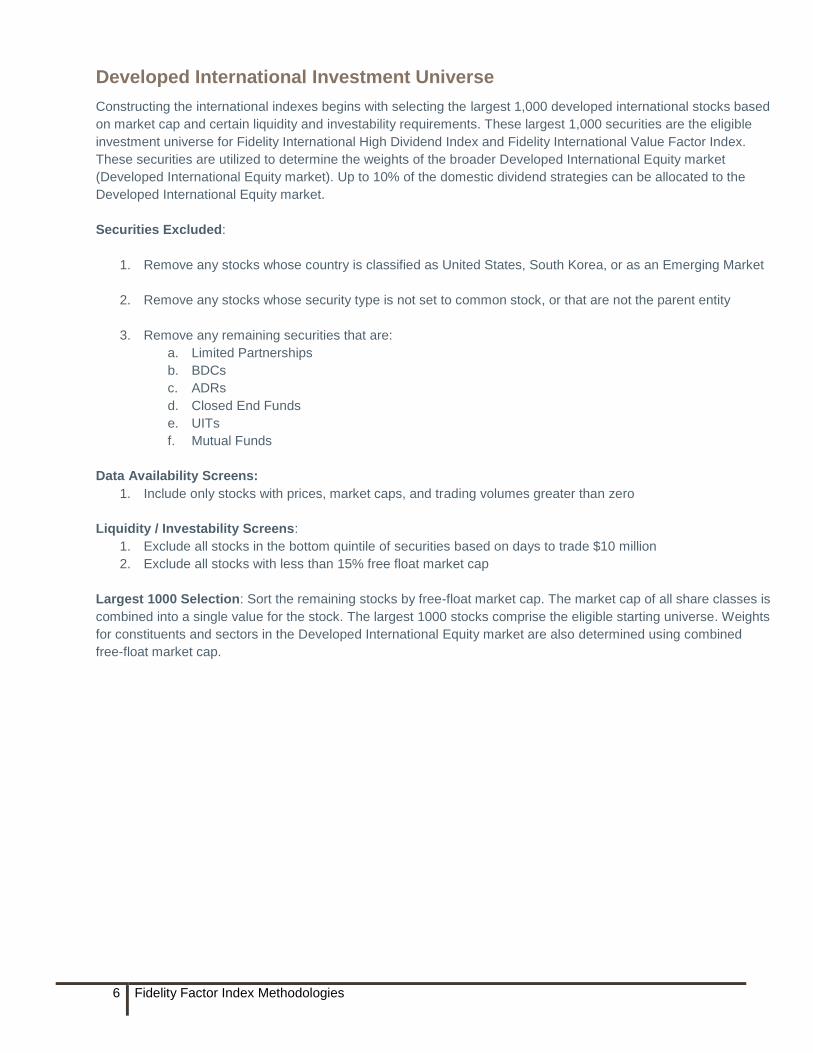
Developed International Investment Universe
Constructing the international indexes begins with selecting the largest 1,000 developed international stocks based
on market cap and certain liquidity and investability requirements. These largest 1,000 securities are the eligible
investment universe for Fidelity International High Dividend Index and Fidelity International Value Factor Index.
These securities are utilized to determine the weights of the broader Developed International Equity market
(Developed International Equity market). Up to 10% of the domestic dividend strategies can be allocated to the
Developed International Equity market.
Securities Excluded:
1. Remove any stocks whose country is classified as United States, South Korea, or as an Emerging Market
2. Remove any stocks whose security type is not set to common stock, or that are not the parent entity
3. Remove any remaining securities that are:
a. Limited Partnerships
b. BDCs
c. ADRs
d. Closed End Funds
e. UITs
f. Mutual Funds
Data Availability Screens:
1. Include only stocks with prices, market caps, and trading volumes greater than zero
Liquidity / Investability Screens:
1. Exclude all stocks in the bottom quintile of securities based on days to trade $10 million
2. Exclude all stocks with less than 15% free float market cap
Largest 1000 Selection: Sort the remaining stocks by free-float market cap. The market cap of all share classes is
combined into a single value for the stock. The largest 1000 stocks comprise the eligible starting universe. Weights
for constituents and sectors in the Developed International Equity market are also determined using combined
free-float market cap.
7 Fidelity Factor Index Methodologies
Section 3: Index Construction
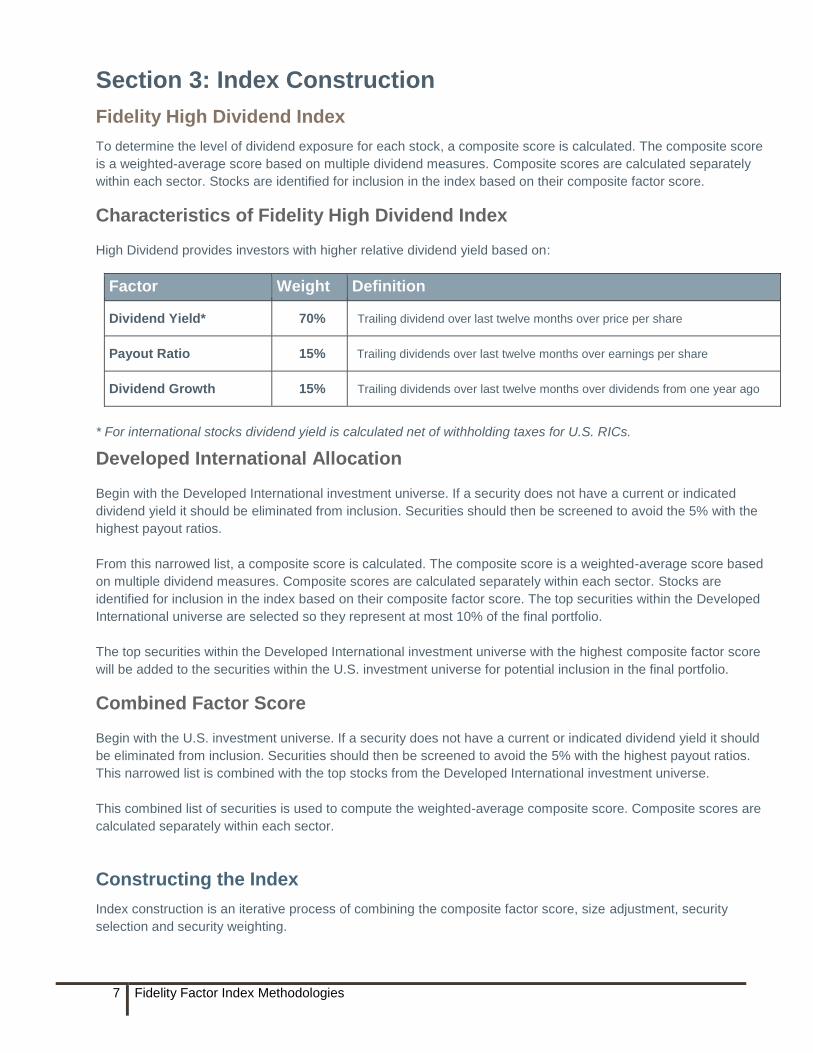
Fidelity High Dividend Index
To determine the level of dividend exposure for each stock, a composite score is calculated. The composite score
is a weighted-average score based on multiple dividend measures. Composite scores are calculated separately
within each sector. Stocks are identified for inclusion in the index based on their composite factor score.
Characteristics of Fidelity High Dividend Index
High Dividend provides investors with higher relative dividend yield based on:
Factor Weight Definition
Dividend Yield* 70% Trailing dividend over last twelve months over price per share
Payout Ratio 15% Trailing dividends over last twelve months over earnings per share
Dividend Growth 15% Trailing dividends over last twelve months over dividends from one year ago
* For international stocks dividend yield is calculated net of withholding taxes for U.S. RICs.
Developed International Allocation
Begin with the Developed International investment universe. If a security does not have a current or indicated
dividend yield it should be eliminated from inclusion. Securities should then be screened to avoid the 5% with the
highest payout ratios.
From this narrowed list, a composite score is calculated. The composite score is a weighted-average score based
on multiple dividend measures. Composite scores are calculated separately within each sector. Stocks are
identified for inclusion in the index based on their composite factor score. The top securities within the Developed
International universe are selected so they represent at most 10% of the final portfolio.
The top securities within the Developed International investment universe with the highest composite factor score
will be added to the securities within the U.S. investment universe for potential inclusion in the final portfolio.
Combined Factor Score
Begin with the U.S. investment universe. If a security does not have a current or indicated dividend yield it should
be eliminated from inclusion. Securities should then be screened to avoid the 5% with the highest payout ratios.
This narrowed list is combined with the top stocks from the Developed International investment universe.
This combined list of securities is used to compute the weighted-average composite score. Composite scores are
calculated separately within each sector.
Constructing the Index
Index construction is an iterative process of combining the composite factor score, size adjustment, security
selection and security weighting.

8 Fidelity Factor Index Methodologies
Composite scores are size-adjusted so as to remove size bias in the index by blending the composite score with a
size factor until no size bias remains. This iterative process begins with 100% weight allocated to the composite
score and entails moving incremental weight to the size factor until the portfolio’s overall exposure to size is at a
minimum. Within each sector, securities are then selected based on the attractiveness of their size-adjusted
composite score as follows:
Sectors with >100 securities Select top decile
Sectors with 25-100 securities Select top quintile
Sectors with <25 securities Select all stocks
Within each sector, each stock is weighted based on its market cap weight in the broader equity market plus an
overweight adjustment. The overweight adjustment applied is equal for all constituents within that sector. The
purpose of this “equal active” weighting approach is to reduce the potential for concentration in certain stocks
based solely on market cap.
In order to emphasize dividend-paying stocks, the sectors are weighted relative to the broader U.S. equity market
depending on the yield characteristics of the sector. Sectors with higher dividend yields are overweighted, while
those with lower dividend yields are underweighted. Up to 40% weight is reallocated from the bottom half of
sectors to the top half in terms of dividend yields (if there is an uneven number of sectors, the extra one is included
in the bottom half).
Analyze total weight allocated to securities from the Developed International universe to ensure weight does not
exceed 10%. If total allocation is above 10%, scale down weight proportionately from all Developed International
stocks to ensure combined allocation is below that threshold.

9 Fidelity Factor Index Methodologies
Fidelity Dividend Index for Rising Rates
To determine the level of dividend yield exposure for each stock, a composite score is calculated. The composite
score is a weighted-average score based on multiple dividend measures. Composite scores are calculated
separately within each sector. Stocks are identified for inclusion in the index based on their composite factor score.
Characteristics of Fidelity Dividend Index for Rising Rates
Dividend for Rising Rates targets higher yielding companies with positive correlation to changes in treasury yields
that can provide protection in a rising rate environment based on:
Factor Weight Definition
Dividend Yield* 63% Trailing dividend over last twelve months over price per share
Payout Ratio 13.5% Trailing dividends over last twelve months over earnings per share
Dividend Growth 13.5% Trailing dividends over last twelve months over trailing dividends from one year ago
Correlation to 10-year Treasury Yields
10% Correlation of weekly changes in the 10-year treasury yield with weekly stock return
* For International stocks dividend yield is calculated net of withholding taxes for U.S. RICs.
Developed International Allocation
Begin with the Developed International investment universe. If a security does not have a current or indicated
dividend yield it should be eliminated from inclusion. Securities should then be screened to avoid the 5% with the
highest payout ratios.
From this narrowed list, a composite score is calculated. The composite score is a weighted-average score based
on multiple dividend measures. Composite scores are calculated separately within each sector. Stocks are
identified for inclusion in the index based on their composite factor score. The top securities within the Developed
International universe are selected so they represent at most 10% of the final portfolio.
The top securities within the Developed International investment universe with the highest composite factor score
will be added to the securities within the U.S. investment universe for potential inclusion in the final portfolio.
Combined Factor Score
Begin with the U.S. investment universe. If a security does not have a current or indicated dividend yield it should
be eliminated from inclusion. Securities should then be screened to avoid the 5% with the highest payout ratios.
This narrowed list is combined with the top stocks from the Developed International investment universe.
This combined list of securities is used to compute the weighted-average composite score. Composite scores are
calculated separately within each sector.
Constructing the Index
Index construction is an iterative process of combining the composite factor score, size adjustment, security
selection and security weighting.
Composite scores are size-adjusted so as to remove size bias in the index by blending the composite score with a
size factor until no size bias remains. This iterative process begins with 100% weight allocated to the composite

10 Fidelity Factor Index Methodologies
score and entails moving incremental weight to the size factor until the portfolio’s overall exposure to size is at a
minimum. Within each sector, securities are then selected based on the attractiveness of their size-adjusted
composite score as follows:
Sectors with >100 securities Select top decile
Sectors with 25-100 securities Select top quintile
Sectors with <25 securities Select all stocks
Within each sector, each stock is weighted based on its market cap weight in the broader equity market plus an
overweight adjustment. The overweight adjustment applied is equal for all constituents within that sector. The
purpose of this “equal active” weighting approach is to reduce the potential for concentration in certain stocks
based solely on market cap.
Analyze total weight allocated to securities from Developed International universe to ensure weight does not
exceed 10%. If total allocation is above 10%, scale down weight proportionately from all Developed International
stocks to ensure combined allocation is below that threshold.

11 Fidelity Factor Index Methodologies
Fidelity International High Dividend Index
To determine the level of dividend exposure for each stock, a composite score is calculated. The composite score
is a weighted-average z-score based on three dividend measures. Composite scores are calculated separately
within each sector and country intersection group. Stocks are identified for inclusion in the index based on their
composite factor score.
Characteristics of Fidelity International High Dividend Index
International High Dividend provides investors with higher relative dividend yield based on:
Factor Weight Definition
Dividend Yield* 70% Trailing dividend over last twelve months over price per share
Payout Ratio 15% Trailing dividends over last twelve months over earnings per share
Dividend Growth 15% Trailing dividends over last twelve months over dividends from one year ago
* For international stocks, dividend yield is calculated net of withholding taxes for U.S. RICs.
Narrowing International Investment Universe
1. If a security does not have a dividend yield, it will not be eligible
2. All securities without an indicated dividend yield should also be excluded
3. Securities are screened to remove the 5% with the highest payout ratios
Calculating Composite Factor Score
From this narrowed list, a composite score is calculated. The composite score is a weighted-average score based
on multiple dividend measures. Composite scores are calculated separately within each sector. Stocks are
identified for inclusion in the index based on their composite factor score.
Constructing the Index
Index construction is an iterative process of combining the composite factor score, size adjustment, security
selection and security weighting.
The process targets the selection of 100 stocks, but the final constituent count of the index may be more or less
than 100, due to numerical rounding, the reallocation of weight from lower-yielding sectors to higher-yielding
sectors, and the removal of companies that cease paying dividends on a quarterly basis.
Composite scores are size-adjusted so as to remove size bias in the index by blending the composite score with a
size factor until no size bias remains. This iterative process begins with 100% weight allocated to the composite
score and entails moving incremental weight to the size factor until the portfolio’s overall exposure to size is at a
minimum.
Within each sector and country intersection group, securities are then selected based on the attractiveness of their
size-adjusted composite score. The number of stocks selected is determined by the aggregate weight of each
sector and country intersection group in the Developed International Equity investment universe as follows:
Create groups by intersecting country and sector.
12 Fidelity Factor Index Methodologies
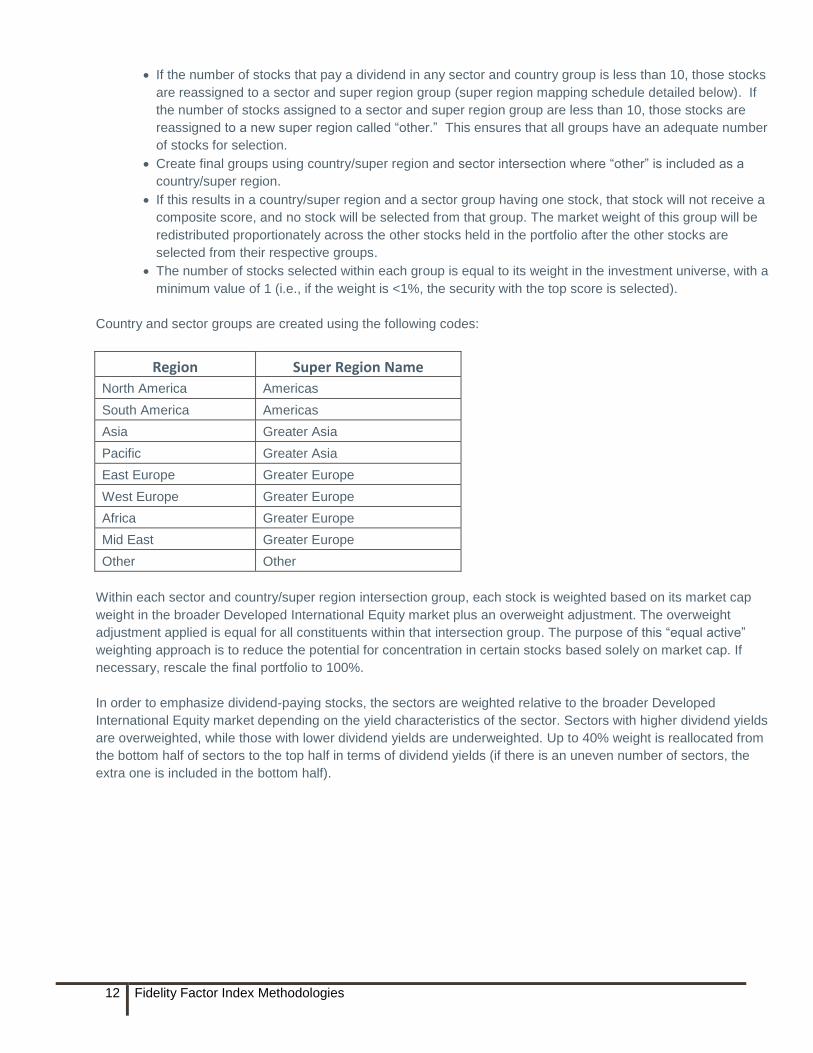
If the number of stocks that pay a dividend in any sector and country group is less than 10, those stocks
are reassigned to a sector and super region group (super region mapping schedule detailed below). If
the number of stocks assigned to a sector and super region group are less than 10, those stocks are
reassigned to a new super region called “other.” This ensures that all groups have an adequate number
of stocks for selection.
Create final groups using country/super region and sector intersection where “other” is included as a
country/super region.
If this results in a country/super region and a sector group having one stock, that stock will not receive a
composite score, and no stock will be selected from that group. The market weight of this group will be
redistributed proportionately across the other stocks held in the portfolio after the other stocks are
selected from their respective groups.
The number of stocks selected within each group is equal to its weight in the investment universe, with a
minimum value of 1 (i.e., if the weight is <1%, the security with the top score is selected).
Country and sector groups are created using the following codes:
Region Super Region Name
North America Americas
South America Americas
Asia Greater Asia
Pacific Greater Asia
East Europe Greater Europe
West Europe Greater Europe
Africa Greater Europe
Mid East Greater Europe
Other Other
Within each sector and country/super region intersection group, each stock is weighted based on its market cap
weight in the broader Developed International Equity market plus an overweight adjustment. The overweight
adjustment applied is equal for all constituents within that intersection group. The purpose of this “equal active”
weighting approach is to reduce the potential for concentration in certain stocks based solely on market cap. If
necessary, rescale the final portfolio to 100%.
In order to emphasize dividend-paying stocks, the sectors are weighted relative to the broader Developed
International Equity market depending on the yield characteristics of the sector. Sectors with higher dividend yields
are overweighted, while those with lower dividend yields are underweighted. Up to 40% weight is reallocated from
the bottom half of sectors to the top half in terms of dividend yields (if there is an uneven number of sectors, the
extra one is included in the bottom half).
13 Fidelity Factor Index Methodologies
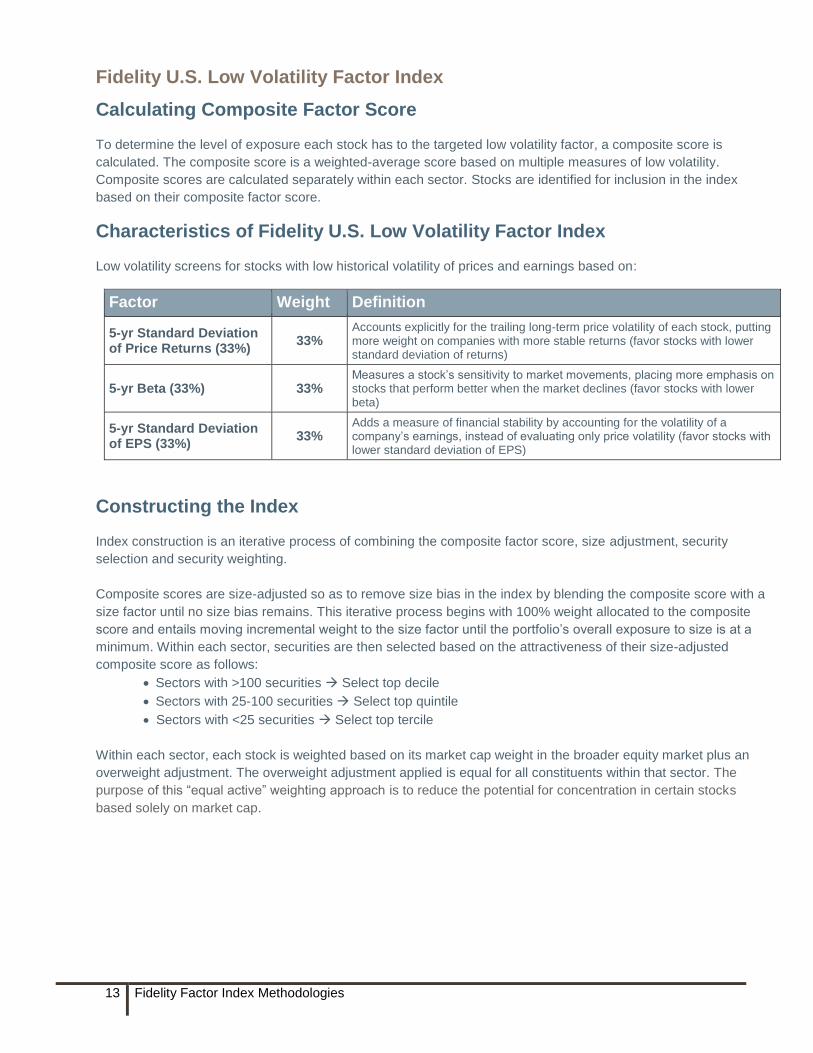
Fidelity U.S. Low Volatility Factor Index
Calculating Composite Factor Score
To determine the level of exposure each stock has to the targeted low volatility factor, a composite score is
calculated. The composite score is a weighted-average score based on multiple measures of low volatility.
Composite scores are calculated separately within each sector. Stocks are identified for inclusion in the index
based on their composite factor score.
Characteristics of Fidelity U.S. Low Volatility Factor Index
Low volatility screens for stocks with low historical volatility of prices and earnings based on:
Factor Weight Definition
5-yr Standard Deviation of Price Returns (33%)
33% Accounts explicitly for the trailing long-term price volatility of each stock, putting more weight on companies with more stable returns (favor stocks with lower standard deviation of returns)
5-yr Beta (33%) 33% Measures a stock’s sensitivity to market movements, placing more emphasis on stocks that perform better when the market declines (favor stocks with lower beta)
5-yr Standard Deviation of EPS (33%)
33% Adds a measure of financial stability by accounting for the volatility of a company’s earnings, instead of evaluating only price volatility (favor stocks with lower standard deviation of EPS)
Constructing the Index
Index construction is an iterative process of combining the composite factor score, size adjustment, security
selection and security weighting.
Composite scores are size-adjusted so as to remove size bias in the index by blending the composite score with a
size factor until no size bias remains. This iterative process begins with 100% weight allocated to the composite
score and entails moving incremental weight to the size factor until the portfolio’s overall exposure to size is at a
minimum. Within each sector, securities are then selected based on the attractiveness of their size-adjusted
composite score as follows:
Sectors with >100 securities Select top decile
Sectors with 25-100 securities Select top quintile
Sectors with <25 securities Select top tercile
Within each sector, each stock is weighted based on its market cap weight in the broader equity market plus an
overweight adjustment. The overweight adjustment applied is equal for all constituents within that sector. The
purpose of this “equal active” weighting approach is to reduce the potential for concentration in certain stocks
based solely on market cap.
14 Fidelity Factor Index Methodologies
Fidelity U.S. Momentum Factor Index
Calculating Composite Factor Score
To determine the level of exposure each stock has to the targeted momentum factor, a composite score is
calculated. The composite score is a weighted-average score based on multiple measures of momentum.
Composite scores are calculated separately within each sector. Stocks are identified for inclusion in the index
based on their composite factor score.
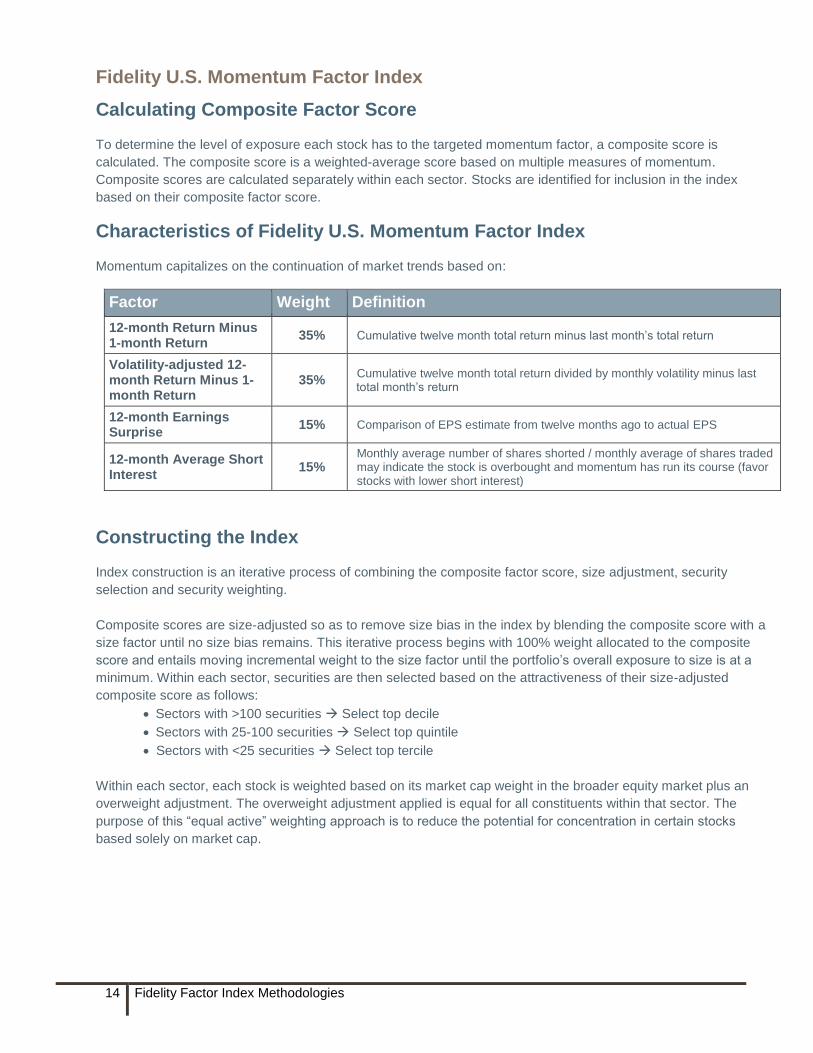
Characteristics of Fidelity U.S. Momentum Factor Index
Momentum capitalizes on the continuation of market trends based on:
Factor Weight Definition
12-month Return Minus 1-month Return
35% Cumulative twelve month total return minus last month’s total return
Volatility-adjusted 12-month Return Minus 1-month Return
35% Cumulative twelve month total return divided by monthly volatility minus last total month’s return
12-month Earnings Surprise
15% Comparison of EPS estimate from twelve months ago to actual EPS
12-month Average Short Interest
15%
Monthly average number of shares shorted / monthly average of shares traded may indicate the stock is overbought and momentum has run its course (favor stocks with lower short interest)
Constructing the Index
Index construction is an iterative process of combining the composite factor score, size adjustment, security
selection and security weighting.
Composite scores are size-adjusted so as to remove size bias in the index by blending the composite score with a
size factor until no size bias remains. This iterative process begins with 100% weight allocated to the composite
score and entails moving incremental weight to the size factor until the portfolio’s overall exposure to size is at a
minimum. Within each sector, securities are then selected based on the attractiveness of their size-adjusted
composite score as follows:
Sectors with >100 securities Select top decile
Sectors with 25-100 securities Select top quintile
Sectors with <25 securities Select top tercile
Within each sector, each stock is weighted based on its market cap weight in the broader equity market plus an
overweight adjustment. The overweight adjustment applied is equal for all constituents within that sector. The
purpose of this “equal active” weighting approach is to reduce the potential for concentration in certain stocks
based solely on market cap.
15 Fidelity Factor Index Methodologies
Fidelity U.S. Quality Factor Index
Calculating Composite Factor Score
To determine the level of exposure each stock has to the targeted quality factor, a composite score is calculated.
The composite score is a weighted-average score based on multiple measures of quality. Composite scores are
calculated separately within each sector, except for the Financials sector. Within Financials, the Banks industry
group is calculated separately and then combined with the rest of the sector. Stocks are identified for inclusion in
the index based on their composite factor score.
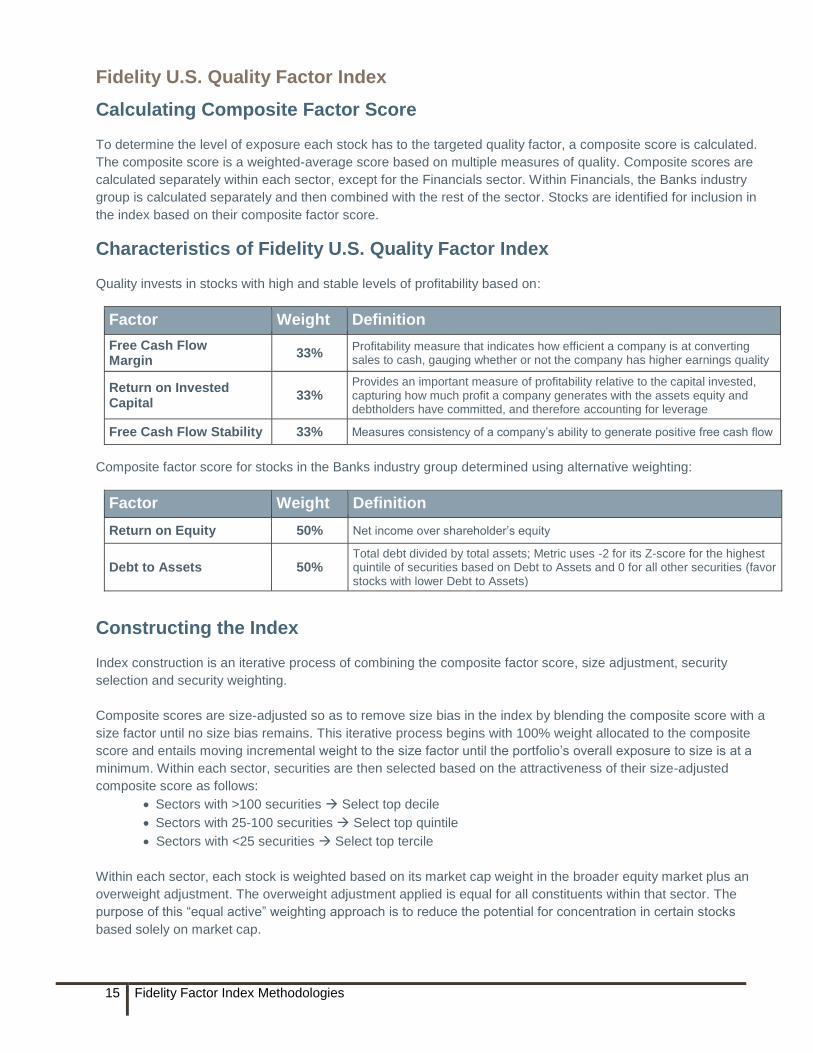
Characteristics of Fidelity U.S. Quality Factor Index
Quality invests in stocks with high and stable levels of profitability based on:
Factor Weight Definition
Free Cash Flow Margin
33% Profitability measure that indicates how efficient a company is at converting sales to cash, gauging whether or not the company has higher earnings quality
Return on Invested Capital
33% Provides an important measure of profitability relative to the capital invested, capturing how much profit a company generates with the assets equity and debtholders have committed, and therefore accounting for leverage
Free Cash Flow Stability 33% Measures consistency of a company’s ability to generate positive free cash flow
Composite factor score for stocks in the Banks industry group determined using alternative weighting:
Factor Weight Definition
Return on Equity 50% Net income over shareholder’s equity
Debt to Assets 50% Total debt divided by total assets; Metric uses -2 for its Z-score for the highest quintile of securities based on Debt to Assets and 0 for all other securities (favor stocks with lower Debt to Assets)
Constructing the Index
Index construction is an iterative process of combining the composite factor score, size adjustment, security
selection and security weighting.
Composite scores are size-adjusted so as to remove size bias in the index by blending the composite score with a
size factor until no size bias remains. This iterative process begins with 100% weight allocated to the composite
score and entails moving incremental weight to the size factor until the portfolio’s overall exposure to size is at a
minimum. Within each sector, securities are then selected based on the attractiveness of their size-adjusted
composite score as follows:
Sectors with >100 securities Select top decile
Sectors with 25-100 securities Select top quintile
Sectors with <25 securities Select top tercile
Within each sector, each stock is weighted based on its market cap weight in the broader equity market plus an
overweight adjustment. The overweight adjustment applied is equal for all constituents within that sector. The
purpose of this “equal active” weighting approach is to reduce the potential for concentration in certain stocks
based solely on market cap.
16 Fidelity Factor Index Methodologies
Fidelity U.S. Value Factor Index
Calculating Composite Factor Score
To determine the level of exposure each stock has to the targeted value factor, a composite score is calculated.
The composite score is a weighted-average score based on multiple measures of value. Composite scores are
calculated separately within each industry group and then combined for each sector. Stocks are identified for
inclusion in the index based on their composite factor score.
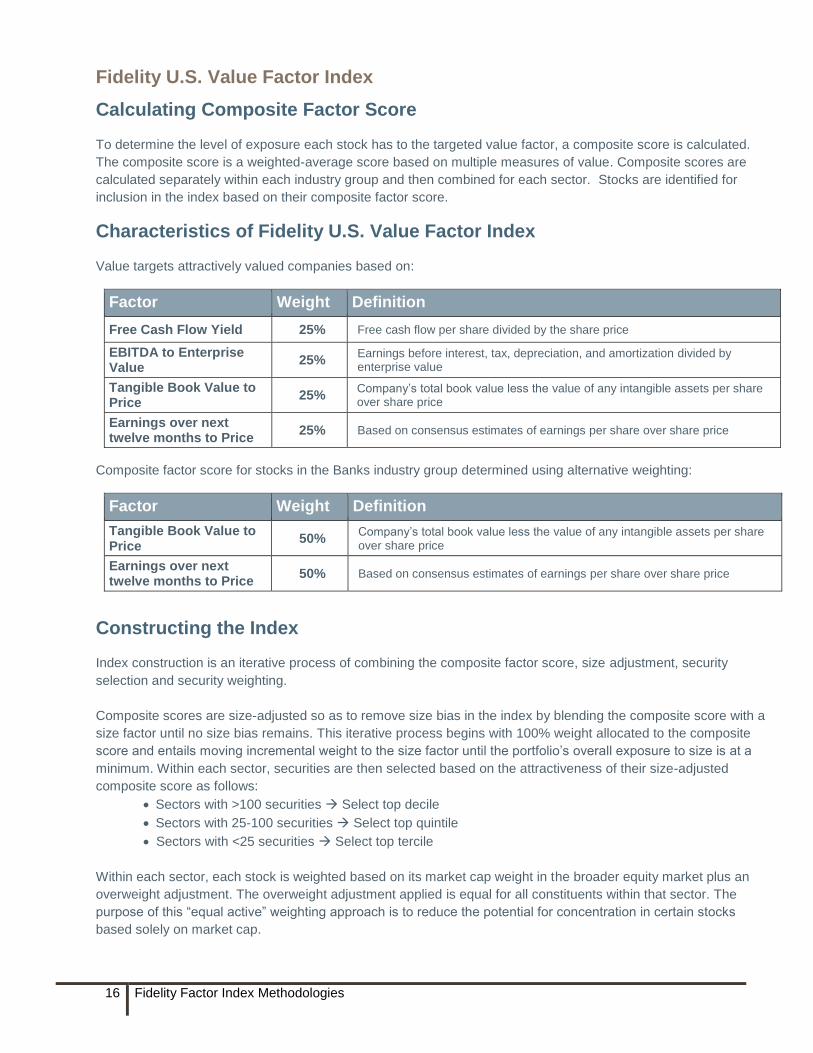
Characteristics of Fidelity U.S. Value Factor Index
Value targets attractively valued companies based on:
Factor Weight Definition
Free Cash Flow Yield 25% Free cash flow per share divided by the share price
EBITDA to Enterprise Value
25% Earnings before interest, tax, depreciation, and amortization divided by enterprise value
Tangible Book Value to Price
25% Company’s total book value less the value of any intangible assets per share over share price
Earnings over next twelve months to Price
25% Based on consensus estimates of earnings per share over share price
Composite factor score for stocks in the Banks industry group determined using alternative weighting:
Factor Weight Definition
Tangible Book Value to Price
50% Company’s total book value less the value of any intangible assets per share over share price
Earnings over next twelve months to Price
50% Based on consensus estimates of earnings per share over share price
Constructing the Index
Index construction is an iterative process of combining the composite factor score, size adjustment, security
selection and security weighting.
Composite scores are size-adjusted so as to remove size bias in the index by blending the composite score with a
size factor until no size bias remains. This iterative process begins with 100% weight allocated to the composite
score and entails moving incremental weight to the size factor until the portfolio’s overall exposure to size is at a
minimum. Within each sector, securities are then selected based on the attractiveness of their size-adjusted
composite score as follows:
Sectors with >100 securities Select top decile
Sectors with 25-100 securities Select top quintile
Sectors with <25 securities Select top tercile
Within each sector, each stock is weighted based on its market cap weight in the broader equity market plus an
overweight adjustment. The overweight adjustment applied is equal for all constituents within that sector. The
purpose of this “equal active” weighting approach is to reduce the potential for concentration in certain stocks
based solely on market cap.
17 Fidelity Factor Index Methodologies
Fidelity International Value Factor Index
Calculating Composite Factor Score
To determine the level of exposure each stock has to the targeted value factor, a composite score is calculated.
The composite score is a weighted-average score based on multiple measures of value. Composite scores are
calculated separately within each industry group and then combined for each sector and country intersection
group. Stocks are identified for inclusion in the index based on their composite factor score.
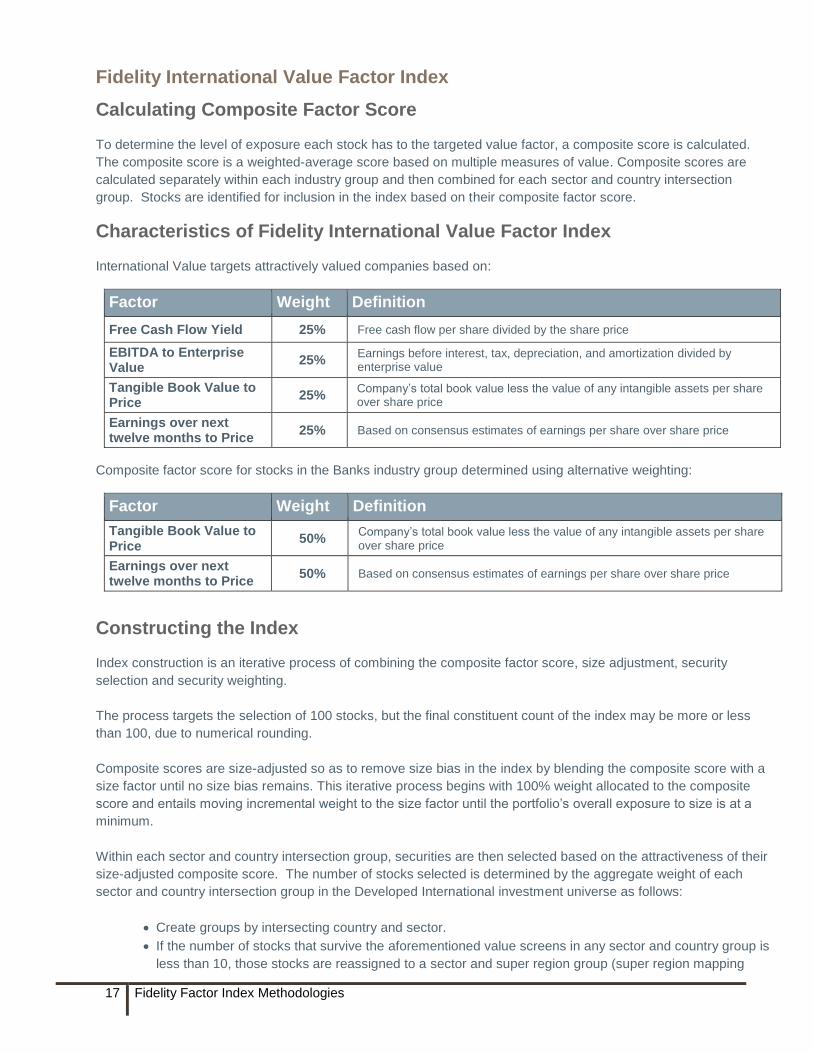
Characteristics of Fidelity International Value Factor Index
International Value targets attractively valued companies based on:
Factor Weight Definition
Free Cash Flow Yield 25% Free cash flow per share divided by the share price
EBITDA to Enterprise Value
25% Earnings before interest, tax, depreciation, and amortization divided by enterprise value
Tangible Book Value to Price
25% Company’s total book value less the value of any intangible assets per share over share price
Earnings over next twelve months to Price
25% Based on consensus estimates of earnings per share over share price
Composite factor score for stocks in the Banks industry group determined using alternative weighting:
Factor Weight Definition
Tangible Book Value to Price
50% Company’s total book value less the value of any intangible assets per share over share price
Earnings over next twelve months to Price
50% Based on consensus estimates of earnings per share over share price
Constructing the Index
Index construction is an iterative process of combining the composite factor score, size adjustment, security
selection and security weighting.
The process targets the selection of 100 stocks, but the final constituent count of the index may be more or less
than 100, due to numerical rounding.
Composite scores are size-adjusted so as to remove size bias in the index by blending the composite score with a
size factor until no size bias remains. This iterative process begins with 100% weight allocated to the composite
score and entails moving incremental weight to the size factor until the portfolio’s overall exposure to size is at a
minimum.
Within each sector and country intersection group, securities are then selected based on the attractiveness of their
size-adjusted composite score. The number of stocks selected is determined by the aggregate weight of each
sector and country intersection group in the Developed International investment universe as follows:
Create groups by intersecting country and sector.
If the number of stocks that survive the aforementioned value screens in any sector and country group is
less than 10, those stocks are reassigned to a sector and super region group (super region mapping

18 Fidelity Factor Index Methodologies
schedule detailed below). If the number of stocks assigned to a sector and super region group are less
than 10, those stocks are reassigned to a new super region called “other.” This ensures that all groups
have an adequate number of stocks for selection.
Create final groups using country/super region and sector intersection where “other” is included as a
country.
If this results in a country/super region and a sector group having one stock, that stock will not receive a
composite score, and no stock will be selected from that group. The market weight of this group will be
redistributed proportionately across the other stocks held in the portfolio after the other stocks are
selected from their respective groups.
The number of stocks selected within each group is equal to its weight in the investment universe, with a
minimum value of 1 (i.e., if the weight is <1%, the security with the top score is selected).
Country and sector groups are created using the following codes:
Region Super Region Name
North America Americas
South America Americas
Asia Greater Asia
Pacific Greater Asia
East Europe Greater Europe
West Europe Greater Europe
Africa Greater Europe
Mid East Greater Europe
Other Other
Within each sector and country intersection group, each stock is weighted based on its market cap weight in the
broader Developed International Equity market plus an overweight adjustment. The overweight adjustment applied
is equal for all constituents within that intersection group. The purpose of this “equal active” weighting approach is
to reduce the potential for concentration in certain stocks based solely on market cap. If necessary, rescale the
final portfolio to 100%.

19 Fidelity Factor Index Methodologies
Section 4: Index Maintenance
Frequency of Rebalance
Fidelity U.S. Momentum Factor Index is rebalanced quarterly on the 3rd Friday of February, May, August and
November. Fidelity U.S. Low Volatility Factor Index, Fidelity U.S. Quality Factor Index, Fidelity U.S. Value Factor
Index and Fidelity International Value Factor Index are rebalanced semi- annually on the 3rd Friday of February
and August. Fidelity High Dividend Index, Fidelity Dividend Index for Rising Rates, and Fidelity International High
Dividend Index are rebalanced annually on the 3rd Friday of February.
Proformas will be generated starting 8 days prior to the rebalance date, based on data from 10 business days prior
to the scheduled rebalance.
Rebalance Schedule Details
Fundamental Data Captured 10 days prior to the rebalance date
Pro Forma Begins 8 days prior to the rebalance date
Rebalance Effective Date Third Friday of the rebalance month effective at next day market open
Ongoing Maintenance
The index is also reviewed on an ongoing basis to account for corporate events such as mergers, takeovers,
delistings, group changes, suspensions, spin-offs/demergers or bankruptcies. Changes to index composition and
related weight adjustments are made as soon as they are effective. Corporate actions will be treated as follows:
Stock Event Type SPDJI Corporate Action Treatment Divisor Change
Stock Forward/Reverse Split Market cap neutral event. Shares change offset by price adjustment in
the morning.
No
Investible Weight Factor
(IWF) Change
IWF increase/decrease has no impact on index shares as the
Additional Weight Factor (AWF) will adjust to offset the IWF change.
No
Share Issuance Shares outstanding increase/decrease has no impact on index shares
as the AWF will adjust to offset the shares outstanding change.
No
Standard rights treatment
(market cap neutral) - default
If the rights are in the money, the spot price of the underlying security
will be adjusted after market close of the day prior to the exDate and
the index shares of the underlying security will adjust to offset the price
adjustment thus making the event a market cap neutral event.
No
Special cash dividend
(standard treatment)
The spot price of the underlying security will be adjusted after market
close of the day prior to the exDate.
Yes
Delisting (due to bankruptcy
or cancellation of listing)
The delisted security will be deleted from the index (at either the last
traded price or a zero price).
Yes
Spin-off (Price Adjustment) In the event that SPDJI applies the event as a non-ZPSO event, the
spun-off company is added to the index with respect to spinoff ratio.
The spot price of the underlying security is adjusted after market close
of the day prior to the exDate by the closing spot price of the spun off
company multiplied by the spinoff ratio, thus making it a market cap
neutral event. The divisor will not be adjusted.
No
M&A (Cash acquisition) The acquired company is deleted from the index. Yes
M&A (Stock acquisition, cash
and/or stock acquisition)
The acquired company is deleted from the index. The index shares of
the acquirer will not be adjusted.
Yes
Cessation of dividend For the dividend indices: In the event a company ceases paying
dividends, it will be removed from the index at the next available of the
following dates: third Friday in February, April, August and November.
Yes

20 Fidelity Factor Index Methodologies
Section 5: Index Calculations
The index is calculated by means of the divisor methodology. The index value is simply the index market value
divided by the index divisor:
𝐼𝑛𝑑𝑒𝑥 𝑉𝑎𝑙𝑢𝑒 = 𝐼𝑛𝑑𝑒𝑥 𝑀𝑎𝑟𝑘𝑒𝑡 𝑉𝑎𝑙𝑢𝑒
𝐼𝑛𝑑𝑒𝑥 𝐷𝑖𝑣𝑖𝑠𝑜𝑟
𝐼𝑛𝑑𝑒𝑥 𝑀𝑎𝑟𝑘𝑒𝑡 𝑉𝑎𝑙𝑢𝑒 = ∑(𝐼𝑛𝑑𝑒𝑥 𝑆ℎ𝑎𝑟𝑒𝑠)𝑖
𝑁
𝑖=1
∗ (𝑃𝑟𝑖𝑐𝑒)𝑖
In order to maintain basket series continuity, it is also necessary to adjust the divisor at the rebalancing.
(𝐼𝑛𝑑𝑒𝑥 𝑉𝑎𝑙𝑢𝑒)𝑏𝑒𝑓𝑜𝑟𝑒 𝑟𝑒𝑏𝑎𝑙𝑎𝑛𝑐𝑖𝑛𝑔 = (𝐼𝑛𝑑𝑒𝑥 𝑉𝑎𝑙𝑢𝑒)𝑎𝑓𝑡𝑒𝑟 𝑟𝑒𝑏𝑎𝑙𝑎𝑛𝑐𝑖𝑛𝑔
Therefore,
(𝐷𝑖𝑣𝑖𝑠𝑜𝑟)𝑎𝑓𝑡𝑒𝑟 𝑟𝑒𝑏𝑎𝑙𝑎𝑛𝑐𝑖𝑛𝑔 = (𝐼𝑛𝑑𝑒𝑥 𝑀𝑎𝑟𝑘𝑒𝑡 𝑉𝑎𝑙𝑢𝑒)𝑎𝑓𝑡𝑒𝑟 𝑟𝑒𝑏𝑎𝑙𝑎𝑛𝑐𝑖𝑛𝑔
(𝐼𝑛𝑑𝑒𝑥 𝑉𝑎𝑙𝑢𝑒)𝑏𝑒𝑓𝑜𝑟𝑒 𝑟𝑒𝑏𝑎𝑙𝑎𝑛𝑐𝑖𝑛𝑔
Index History
Index history will be calculated for daily values and month end holdings going back to 12/31/1995. Base value will
be 100.00 starting as of 12/31/1995.
Data Distribution
Index data is supplied by S&P Dow Jones Custom Indices and index levels are made available through custom
hosted websites.
http://www.customindices.spindices.com/custom-index-calculations/fidelity/all
On behalf of Fidelity, S&P Dow Jones Indices disseminates the indices real-time via the Chicago Mercantile
Exchange’s (CME) Market Data Platform (MDP).
Index levels and holdings are also being made available to the following investment data providers:
Bloomberg
Fidelity U.S. Low Volatility Factor Index PR (FIDUSLVP)
Fidelity U.S. Low Volatility Factor Index TR (FIDUSLVT)
Fidelity U.S. Momentum Factor Index PR (FIDUSMOP)
Fidelity U.S. Momentum Factor Index TR (FIDUSMOT)
Fidelity U.S. Quality Factor Index PR (FIDUSQLP)
Fidelity U.S. Quality Factor Index TR (FIDUSQLT)
Fidelity U.S. Value Factor Index PR (FIDUSVLP)
Fidelity U.S. Value Factor Index TR (FIDUSVLT)
Fidelity High Dividend Index PR (FIDUSCDP)
Fidelity High Dividend Index TR (FIDUSCDT)
Fidelity High Dividend Index NR (FIDUSCDN)
Fidelity Dividend Index for Rising Rates PR (FIDUSDRP)
21 Fidelity Factor Index Methodologies
Fidelity Dividend Index for Rising Rates TR (FIDUSDRT)
Fidelity Dividend Index for Rising Rates NR (FIDUSDRN)
Fidelity International High Dividend Index PR (FIDINDVP)
Fidelity International High Dividend Index TR (FIDINDVT)
Fidelity International High Dividend Index NR (FIDINDVN)
Fidelity International Value Factor Index PR (FIDINVLP)
Fidelity International Value Factor Index TR (FIDINVLT)
Fidelity International Value Factor Index NR (FIDINVLN)
Morningstar

22 Fidelity Factor Index Methodologies
Section 6: Index Governance
Index Sponsor and Index Calculation Agent
The index sponsor is Fidelity Investments. Fidelity Investments has appointed S&P Dow Jones as Index Calculation Agent to calculate and publish the indexes in accordance with this methodology document. The index sponsor may appoint an alternative Index Calculation Agent at any time.
Index Committee
The index is maintained by Fidelity Investments Index Committee. The Index Committee is responsible for reviewing the design and composition of the indexes. The Committee meets periodically to review market conditions and index performance, or on an as-needed basis to address major market developments. In addition, the Committee reserves the right to exercise its discretion in making decisions with respect to Index Policies or actions. Fidelity Investments considers information about changes to its indexes and related matters to be potentially market moving and material. Therefore, all Index Committee discussions are confidential.
Index Policy
Announcements: Announcements regarding changes to any of the indexes will be made publicly available prior to the effective date of the change. All announcements will be published on www.fidelity.com Index Holiday Schedule: Index schedule will follow the NYSE holiday schedule Market Disruption: In situations where calculation of an index may not be possible under certain circumstances, including market disruptions, systems failures, weather conditions, acts of terrorism or any other event that is beyond the reasonable control of the Index Sponsor and/or Index Calculation Agent, the Index Calculation Agent will calculate the closing price of the indexes based on:
(1) The closing prices published by the exchange, or (2) If no closing price is available, the last regular trade reported for each security before the exchange
closed If an exchange fails to open due to unforeseen circumstances, the Index Calculation Agent will treat the closures as a standard market holiday. The index will use the prior day’s closing prices and shift any corporate actions to the following business day. If all exchanges fail to open or in other extreme circumstances, the Index Calculation Agent may determine not to publish the indexes for that day.
23 Fidelity Factor Index Methodologies
Disclaimers
FMR CO., INC. makes no representation or warranty, express or implied, to any member of the public regarding the advisability of investing in securities generally or the ability of the Indexes to track general stock market performance. FMR CO., INC. does not guarantee the accuracy, completeness, or performance of any Index or the data included therein and shall have no liability in connection with any Index or Index calculation, errors, omissions or interruptions of any Fidelity Index or any data included therein. The indexes are unmanaged and are not available for direct investment. FMR CO. INC. has contracted with an independent calculation agent to calculate each Index. Fidelity Brokerage Services LLC ("FBS"), Member NYSE, SIPC, 900 Salem Street, Smithfield, RI 02917 Fidelity Investments Institutional Services Company, Inc. ("FIISC"), 500 Salem Street, Smithfield, RI 02917 © 2018 FMR LLC. All rights reserved. The third-party trademarks and service marks are the property of their respective owners. All other trademarks and service marks are the property of FMR LLC or an affiliated company.
772280.3.0


