
Page | i
Matt Rule BSc(EnvMgt), PGDipEnSt & MRenEn
June 2016
MASTER OF RENEWABLE ENERGY
Feasibility of a Grid Connected Solar Power
Tower with Molten Salt Storage Plant for
Kalgoorlie-Boulder, Western Australia

Page | ii
Declaration
I declare that this dissertation contains literature research on the feasibility of grid
connected solar power tower with molten salt technology by the author. Where other
sources have been used, they are appropriately referenced and documented. Outcomes of
System Advisor Model have been used in the research and analysing. The content has not
been previously submitted for a degree at any tertiary education institution.
Matt Haydn Rule
Page | iii
ABSTRACT
Solar power tower (SPT) plants with thermal energy storage (TES) provide great
opportunities on the utility-scale; becoming a viable option for areas with moderate to high
direct solar availability. The absence of commercial SPTs in Australia, together with the need
to increase renewable energy capacity, raises the importance of proving it viable and
beneficial. There is an apparent research gap, specifically, into the feasibility of a grid
connected SPT with molten salt storage system for the Goldfields city, which this research
explores. In this dissertation, solar power tower with storage systems are reviewed to
facilitate the research. The System Advisor Model (SAM) base case 104 MW SPT, with the
performance advancement that (14 hours) molten salt storage adds, introduces the
capability of replacing conventional power plants, generate reliable base load or demand
following electricity into the SWIS power grid and create jobs. Kalgoorlie-Boulder, with its
excellent solar resource, infrastructure, local economy and SWIS grid connection enables
this solar thermal power system to be considered appropriate. The research methodology
presents the procedure and limitations in the modeling of the system, and the sensitivity
analysis. The estimated performance of certain SPT with molten salt TES designs (similar to
Crescent Dunes SPT plant) show that it could generate all of the city’s electricity demand
(excluding the mine sites), and still feed in electricity to the grid. The benefits from grid
connection come in the form of capacity credits and renewable energy certificates. These
are required to form a PPA, as the estimated LCOE is above the fossil fuel range (although in
line with current SPTs with storage). Taking advantage of Government policies and
incentives from the gird, together with the system costs (explicitly, heliostat field) predicted
reduction, the gap will close, improving economic viability and enhancing its feasibility.
Page | iv
Table of Contents
Declaration .......................................................................................................................................... ii Abstract ............................................................................................................................................... iii Table of Contents................................................................................................................................. iv List of Figures ....................................................................................................................................... v List of Tables ........................................................................................................................................ vi Acknowledgements ............................................................................................................................. vii
1 Introduction .................................................................................................................................. 1 1.1 Background.............................................................................................................................. 1 1.2 Research Aim and Objectives ................................................................................................... 5 1.3 Dissertation Structure .............................................................................................................. 6 1.4 Dissertation Scope and Limitations .......................................................................................... 6
2 Review: Solar Power Tower System .............................................................................................. 8 2.1 Introduction............................................................................................................................. 8 2.2 Concentrated Solar Power Progress and Solar Power Tower Projects ....................................... 8 2.3 Solar Power Tower Technology and Developments .................................................................. 12 2.3.1 The System ........................................................................................................................ 12 2.3.2 Heliostat Field.................................................................................................................... 14 2.3.3 Receiver............................................................................................................................. 17 2.3.4 Heat Transfer Fluids ........................................................................................................... 19 2.3.5 Thermal Energy Storage .................................................................................................... 20 2.3.6 Power Cycle ....................................................................................................................... 22 2.4 Sustainability ........................................................................................................................... 23 2.5 Economics ............................................................................................................................... 24 2.6 Policies, Incentives and the Utilities ......................................................................................... 29
3 Methodology .................................................................................................................................. 33 3.1 Site Resources ......................................................................................................................... 33 3.2 Utilising SAM for Modelling and Sensitivity Analysis ................................................................. 34
4 Results and Discussion................................................................................................................... 38 4.1 Site Characteristics: Kalgoorlie-Boulder, Western Australia ...................................................... 38 4.2 Modelled Utility-Scale Solar Power Tower with Molten Salt Storage ........................................ 45 4.2.1 Technical Output ............................................................................................................... 45 4.2.2 Financial Aspects ............................................................................................................... 49 4.2.3 Sensitivity Analysis............................................................................................................. 52 4.3 Enhancing Feasibility through the Utility .................................................................................. 57
5 Conclusion and Recommendations................................................................................................ 58
6 References ..................................................................................................................................... 61
Appendix A
Page | v
List of Figures
Figure 1: CSP global capacity, by country or region, 2004 to 2014.
Figure 2: Basic subsystems of a molten salt power tower configuration
Figure 3: Schematics of tubular external (left) and cavity (right) receivers
Figure 4: Levelised cost of energy/electricity generation calculation
Figure 5: 2010 and 2014 LCOE from utility-scale renewable technologies
Figure 6: SunShot Initiative 2020 goal for concentrating solar power and the cost reductions
achieved from 2010–2013
Figure 7: 1983-2015 USA cumulative total solar thermal electricity generating capacity
Figure 8: The rise of LGCs
Figure 9: Hypothetical daily load profile with solar radiation and CSP plant generation
Figure 10: Australia’s DNI
Figure 11: Kalgoorlie-Boulder annual average DNI modelled AUSTELA (2007) compared with
the NASA (22-year average)
Figure 12: Kalgoorlie 22-year Averaged Normalised Clearness Index
Figure 13: Kalgoorlie-Boulder location in Western Australia
Figure 14: Kalgoorlie-Boulder solar resource (DNI) and the 104 MW solar power tower (14
Hours TES) energy output annual trend
Figure 15: Solar power tower (modelled) direct capital costs broken down into percentage
Figure 16: Modelled solar power tower solar multiple and storage influence on the LCOE
Page | vi
List of Tables
Table 1: CSP projects in Australia
Table 2: Global Operational Commercial Solar Power Tower Plants
Table 3: Global Under Construction Commercial Solar Power Tower Plants
Table 4: Modelled base case SPT (with TES) technical summary
Table 5: Modelled 104 MW SPT with 14 hours TES financial* summary
Table 6: SPT capacity factor sensitivity to TES and turbine capacity (gross) at modelled site
Table 7: SPT (14 hours TES) total installed costs, LCOE and annual electricity to the grid
sensitivity to turbine capacity (gross) at modelled site (SAM)
Table 8: SPT total installed costs, LCOE (nominal), annual generation and water usage
sensitivity to mirror (heliostat) reflectance and soiling efficiency, at modelled site
Table 9: Effect of Condenser type on the base case SPT’s LCOE, annual generation and water
usage
Table 10: Influence of an Investment Tax Credit (ITC), halved heliostat cost and DOE SunShot
system cost goals on the total installed cost and LCOE of the SPT base case

Page | vii
Abbreviations and Acronyms
AUSTELA Australian Solar Thermal Energy Association
BOM Bureau of Meteorology
CKB City of Kalgoorlie-Boulder
CSP concentrating solar power
DNI direct normal irradiance
FiT Feed-in Tariff
HTF heat transfer fluid
ITC Investment Tax Credit (USA)
LGS Large-scale generation certificates
LCOE levelised cost of energy (or electricity)
LGA local government area
NREL National Renewable Energy Laboratory
O&M operations and maintenance
PPA Power Purchase Agreement
RET Renewable Energy Target
RPS Renewable portfolio standards
SAM System Advisor Model, produced by NREL, Sandia National Labs, and DOE
SPT solar power tower; also known as central receiver
TES thermal energy storage
WA Western Australia

Page | viii
ACKNOWLEDGEMENTS
I would like to thank my loving fiancé and family for their support through this journey.
I would especially like dedicate this to my Dad, and thank him for always believing in me.
Page | 1
Introduction
1.1 Background
Reducing dependence on fossil fuels and increasing energy security is the underlying current
driving the research. It is scientifically accepted that anthropogenic climate change has the
potential to cause widespread, irreversible and detrimental change to Earth. It threatens
ecosystems and human societies, thus requiring a globally agreeable direction on mitigating
the root cause; greenhouse gas (GHG) emissions. The UNFCCC 2015 Paris Climate
Conference is the latest global agreement for combating climate change by aiming to
keeping global warming below 2°C (above pre-industrial levels) and stabilising atmospheric
concentrations of GHGs (Climate Action, 2015). Australia, one of the large numbers of
countries to sign the Paris agreement is now expected to deliver on its commitment and
accelerate the reduction of GHG emissions. The Australian Federal Government already has
the Renewable Energy Target (RET) policy, that ensures at least 33,000 GWh (recently
downgraded from 41,000 GWh) of the country’s electricity is generated from renewable
energy sources by 2020 (Clean Energy Council, 2014). Therefore, the deployment of
renewable energy power systems increasingly needs to be achieved.
There is an abundance of options when it comes to renewable energy technologies:
hydropower, solar PV, concentrated solar power, wind, tidal, wave, geothermal, bio energy
and hydrogen fuel. However, the choice of energy system is primarily dependent on
resource availability and suitability at the desired location. Concentrated solar power (CSP),
or solar thermal power, is a renewable power generation technology that requires high
solar irradiation, in terms of direct nominal irradiance (DNI), to perform effectively; suiting
areas in the Sun Belt region, between 40 degrees north and south of the equator (IEA-ETSAP
Page | 2
& IRENA, 2013). Large parts of Australia fit this particular solar resource requirement more
than adequately.
CSP technology for large electricity projects has been on the rise over the last decade. Yet
the market remains under-developed when compared to the majority of other renewable
energy markets, as of the REN21 ‘Renewable 2015 Global Status Report’ (2015). The recent
release of the ‘Solar Thermal Electricity Global Outlook 2016’ (SolarPACES, et al, 2016) had
the installed capacity up to almost 5 GW at the end 2015. Surprisingly, there is currently
only one commercially operational CSP plant in Australia, the 6 MW linear Fresnel Liddell
Solar Thermal Station. Which is used as a solar steam boost for the Liddell coal-fired station
in the Hunter Valley, NSW. The other operational plants are demonstrational: Lake
Cargelligo power tower (3.5 MW) and Cooma power tower; both in NSW (CSP World, 2015).
Western Australia (WA), however, has no CSP plants installed. Known for its sunny days, this
is a great opportunity for WA to explore and develop this technology. The only planned CSP
plant in WA is the North Midlands Solar Thermal Power Project, a 3 MW hybrid solar power
tower-waste heat system in Morawa (Carbon Reduction Ventures, 2015).
According to the 2014 Clean Energy Australia Report, 13% (or 4817 GWh) of electricity
generated in WA was from renewable energy (Clean Energy Council, 2014). The current
situation in WA of having no state RET could be a factor in the low penetration of renewable
energy projects (Climate Council of Australia, 2014). However, if CSP systems can produce
similar amounts of electricity (into the grid) as one or more of the conventional polluting
power plants, whilst having a competitive levelised cost of energy (LCOE), then it will put
pressure on the future validity of these conventional plants and increase the renewable
energy penetration of the state.
Page | 3
Solar power tower (SPT, also known as central receiver) systems are an exciting type of CSP
technology. The system uses thousands of computer controlled two axis mirrors (heliostats)
to focus concentrated solar radiation onto a central receiver (tower). Heat transfer fluid
(HTF) transports the absorbed thermal energy from the receiver to generate steam, which
drives a turbine, and produces electricity. These power systems, depending on the type of
central receiver and HTF, can achieve operating temperatures from 250°C to 1000°C)
(Behar, et al, 2013). This high temperature allows for greater efficiency than the parabolic
trough and linear Fresnel collector CSP technologies, and potentially reduces energy costs
(IRENA, 2012).
Adding thermal energy storage (TES) to a solar power tower system is advantageous,
creating the ability to operate longer (when solar resources are not available) and at utility-
scale, with configurations allowing it to operate as a base-load plant (Kearney, 2013).
Integrating TES to the SPT plant will create dispatchable power (to meet peak demands of
the electricity grid) and raise capacity factors (IRENA, 2012). Evening Peak demand and
intermediate loads can (economically) be met, while the sun is not shining; unlike solar PV
without battery backup (IRENA, 2012). Molten salt can be used as a storage fluid to
complement the molten salt HTF. Crescent Dunes (Nevada, USA) is the first operating utility-
scale power tower facility in the world; the power tower facility uses molten salt for HTF and
storage, achieving 10hrs of full load storage (Solar Reserve, 2016).
There is limited research on the feasibility of CSP technology with TES on a utility-scale in
WA. There has been a recent study by Meybodi & Beath (2016) that presents research on
SPT with TES for three Australian towns (comparing Kalgoorlie, Mildura and Alice Springs),
focusing on the cost uncertainties and solar resource variations in data. It concluded that
Page | 4
there was limited influence of storage capacity on the LCOE (Meybodi & Beath, 2016).
However there has not been research (specifically) on the feasibility of utility-scale SPT with
molten salt TES technology in WA, (or Kalgoorlie-Boulder specifically) which looks at
economic and technical parameters (including policies) that influence its viability; and also
investigating its grid connected benefits. This gap (or limitation) in research, in this specific
area, warrants this study.
This Dissertation researches the feasibility of a power tower CSP system with integrated
(molten salt) TES, connected to the SWIS grid in Kalgoorlie-Boulder, Western Australia (WA).
The site chosen, Kalgoorlie-Boulder, is in the Goldfields-Esperance region of WA, about 550
kilometres east of Perth. The large gold mining based town receives an annual average DNI
of over 2000kWh/m2 (2016, NASA), has availability to water, and importantly, is connected
to the (SWIS) electricity grid.
Government policy mechanisms, financial incentives, technical improvements and
performance parameters will be reviewed in relevant literature, and investigated using
simulations to determine their sensitivity on the viability of the power tower system. If a
utility-scale SPT (with TES) plant is economically and technically feasible at the selected site,
without detrimental environmental or social affects, then it will attract financial interest into
developing this power system. The end results would be to increase the State’s renewable
energy generation; feed in reliable energy to the SWIS; replace current conventional fossil
fuel power systems; and showcase these renewable energy systems to the world as proven
technology.
Renewable energy projects, notably a utility-scale SPT facility, can create socio-economic
opportunities by creating jobs, developing knowledge, and exporting the gained essential
Page | 5
skills. Initially though, in order to encourage investment allure, it is essential to demonstrate
the viability of the desired CSP technology, at the given site, for it to be bankable.
1.2 Research Aim and Objectives
Aim:
To investigate and attain the feasibility of a SPT with (molten salt) TES connected to the
SWIS in Kalgoorlie-Boulder. The research aims to produce an argument for whether this SPT
system (at this site) is bankable (or viable for investors to support), and show its potential of
replacing polluting conventional plants and increasing the renewable energy penetration of
the State.
Objectives to meet the aim:
Investigate the site’s solar resource, relevant infrastructure, and electricity demand
and generation.
To research the relevant Australian government policies and regulations that are
supporting large-scale renewable energy projects (namely CSP).
Review literature and publications on SPT systems (including TES) to understand and
present the background and situate the research within the context of current
ongoing developments (globally).
Utilise System Advisor Model (SAM) simulations to produce and review the
economic and technical parameters and performances.
Produce sensitivity analyses from project simulations to examine optimal financial,
technical and performance enhancing inputs.
Page | 6
Calculate the LCOE of the studied CSP plant and compare against the current global
averages.
To estimate yearly power output of the simulated CSP system, and compare against
the Kalgoorlie-Boulder power plant(s) and the current power demands. Additionally
compare the simulated energy output to WA’s power plants in the SWIS, and SPT
plants throughout the world.
1.3 Dissertation Structure
Chapter 1 provides a background into the state of CSP and introduces the research topic and
question, aim, objectives and research gap. Chapter 2 reviews the solar power tower
system, including technical status, economics, sustainability, policies and incentives, and
potential utility benefits. Chapter 3 describes the methods used in the research. Chapter 4
produces the results of the modelled SPT system and discusses the findings. Chapter 5
provides the conclusion to the research. Chapter 6 lists the references used.
1.4 Dissertation Scope and Limitations
The focus of this dissertation is on researching and reviewing the feasibility of a SPT with
TES system in Kalgoorlie-Boulder, connected to the SWIS. This is not a feasibility study per
se, but rather research of SPT developments and performances, and assessment of the
technical and economic viability (and associated environmental effects) of the simulated
utility-scale CSP system. In addition, a sensitivity analysis of the technical and financial
parameters that influence the overall feasibility of the power tower system is undertaken.

Page | 7
The scope is on the viability of the SPT technology, not comparing CSP types. However,
some findings will come from other types of CSP technologies with crossover components or
financing schemes. Case studies and reviews on projects are limited due to the relatively
small number of STP plants around the world, especially operational utility-scale units. The
literature review is used to understand the background and situate the research within the
context of current ongoing developments (globally), generally focusing on technological
advancements, system design, storage, efficiency improvements, and supporting policies
and agreements that will ensure feasibility of the SPT system; making it ultimately bankable.
Kalgoorlie-Boulder was chosen based on its solar resource, grid connection, and available
infrastructure (including water availability). Other sites are not investigated or presented in
this research. The study starts from after a site has been chosen in order to focus on the
feasibility of the (simulated) SPT system and analyse how particular design parameters can
influence it. The research did not identify a specific area of land in the City of Kalgoorlie-
Boulder, as this will require investigation into land cost and availability, which is beyond the
scope of this project.
National Renewable Energy Laboratory’s (NREL’s) SAM calculations and simulations of a
utility-scale SPT with molten salt TES were limited in terms of certain component and
material options. Additionally, the size of study, and time allocated, did not warrant the
investigation and data gathering of all possible (site-specific) financial inputs. NREL SAM
guidelines for simulating utility-scale SPT with molten salt storage, and the AUSTELA
Australian guide to SAM for CSP, aided the research methodology objectives. The research
simulation only looked at the system with molten salt HTF and TES, as was intended. In
addition, financial unknowns’ specific to WA limited the sensitivity analysis to performance
Page | 8
modeling of the power tower system (at the stated site). The modeling assumptions and
recommendations from the guidelines were accepted based on the system technology being
the first of its kind for Australia, and having limited projects worldwide.
2 Review: Solar Power Tower Systems
2.1 Introduction
This chapter reviews the literature on SPT system technology. The focus is on utility-scale
SPT systems with storage (molten salt), presenting the developments, attractiveness, drivers
and limitations of the technology. The SPT system, economics, sustainability, and policies
and incentives are reviewed. The relevant literature reviewed and presented will give
context and background to the research and findings, while aiding in answering the
questions posed. Government papers, journals and publications are some of the material
used in this review; only English literature is considered, and the review is limited to mostly
recent material.
2.2 Concentrated Solar Thermal Progress and Solar Power Tower Projects
Concentrated Solar Power (CSP) has been progressing relatively exponentially, from an
installed capacity of just 0.4 GW in 2004, to 4.4 GW in 2014 (REN21, 2015). As of the end of
2014, total capacity was clearly dominated by Spain and the USA (Figure 1). The recent
release of the ‘Solar Thermal Electricity Global Outlook 2016’ (SolarPACES et al, 2016) had
the installed capacity up to almost 5 GW at the end 2015, continuing the strong growth over
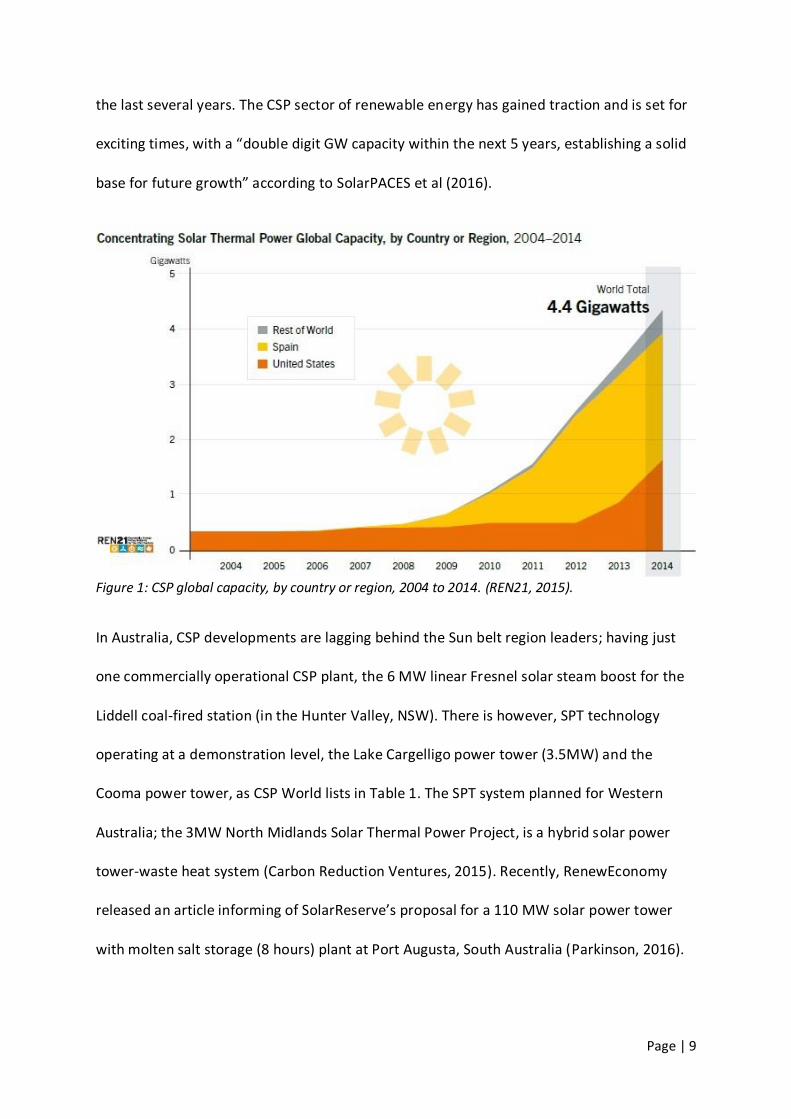
Page | 9
the last several years. The CSP sector of renewable energy has gained traction and is set for
exciting times, with a “double digit GW capacity within the next 5 years, establishing a solid
base for future growth” according to SolarPACES et al (2016).
Figure 1: CSP global capacity, by country or region, 2004 to 2014. (REN21, 2015).
In Australia, CSP developments are lagging behind the Sun belt region leaders; having just
one commercially operational CSP plant, the 6 MW linear Fresnel solar steam boost for the
Liddell coal-fired station (in the Hunter Valley, NSW). There is however, SPT technology
operating at a demonstration level, the Lake Cargelligo power tower (3.5MW) and the
Cooma power tower, as CSP World lists in Table 1. The SPT system planned for Western
Australia; the 3MW North Midlands Solar Thermal Power Project, is a hybrid solar power
tower-waste heat system (Carbon Reduction Ventures, 2015). Recently, RenewEconomy
released an article informing of SolarReserve’s proposal for a 110 MW solar power tower
with molten salt storage (8 hours) plant at Port Augusta, South Australia (Parkinson, 2016).
Page | 10
This proposed utility-scale SPT system aims to provide reliable electricity day and night to
the town and nearby areas. It would increase Australia’s CSP capacity substantially.
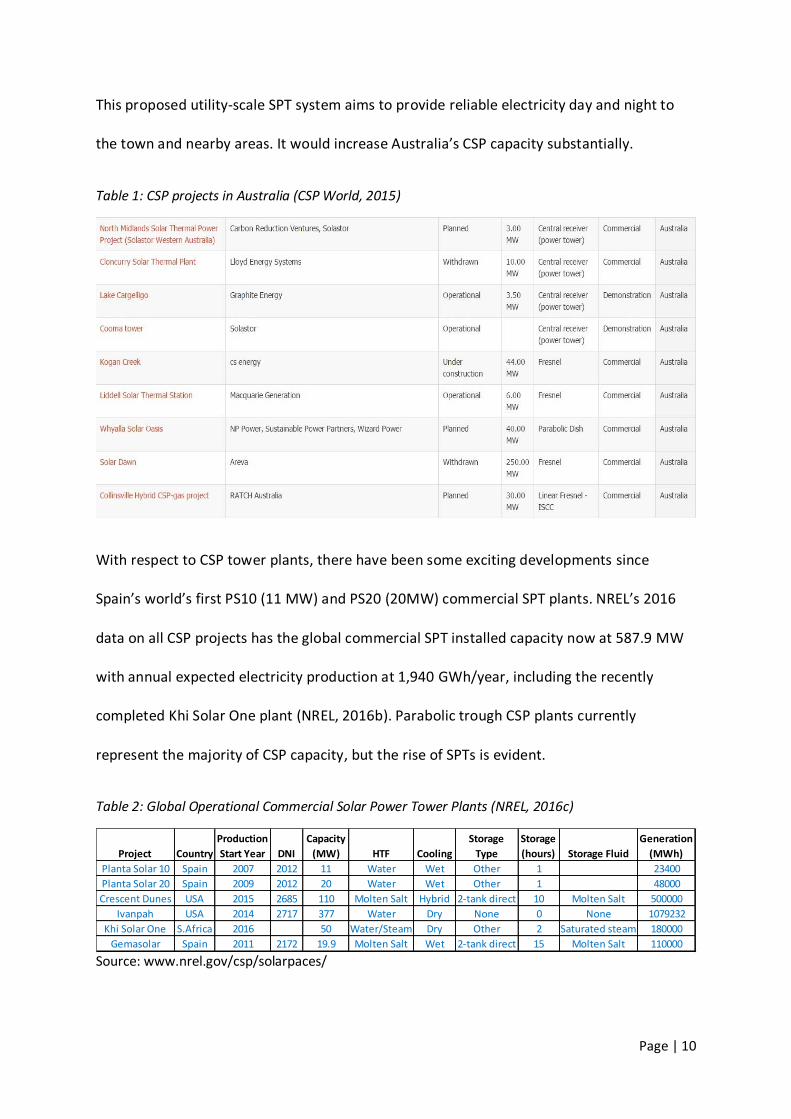
Table 1: CSP projects in Australia (CSP World, 2015)
With respect to CSP tower plants, there have been some exciting developments since
Spain’s world’s first PS10 (11 MW) and PS20 (20MW) commercial SPT plants. NREL’s 2016
data on all CSP projects has the global commercial SPT installed capacity now at 587.9 MW
with annual expected electricity production at 1,940 GWh/year, including the recently
completed Khi Solar One plant (NREL, 2016b). Parabolic trough CSP plants currently
represent the majority of CSP capacity, but the rise of SPTs is evident.
Table 2: Global Operational Commercial Solar Power Tower Plants (NREL, 2016c)
Source: www.nrel.gov/csp/solarpaces/
Project Country
Production
Start Year DNI
Capacity
(MW) HTF Cooling
Storage
Type
Storage
(hours) Storage Fluid
Generation
(MWh)
Planta Solar 10 Spain 2007 2012 11 Water Wet Other 1 23400
Planta Solar 20 Spain 2009 2012 20 Water Wet Other 1 48000
Crescent Dunes USA 2015 2685 110 Molten Salt Hybrid 2-tank direct 10 Molten Salt 500000
Ivanpah USA 2014 2717 377 Water Dry None 0 None 1079232
Khi Solar One S.Africa 2016 50 Water/Steam Dry Other 2 Saturated steam 180000
Gemasolar Spain 2011 2172 19.9 Molten Salt Wet 2-tank direct 15 Molten Salt 110000
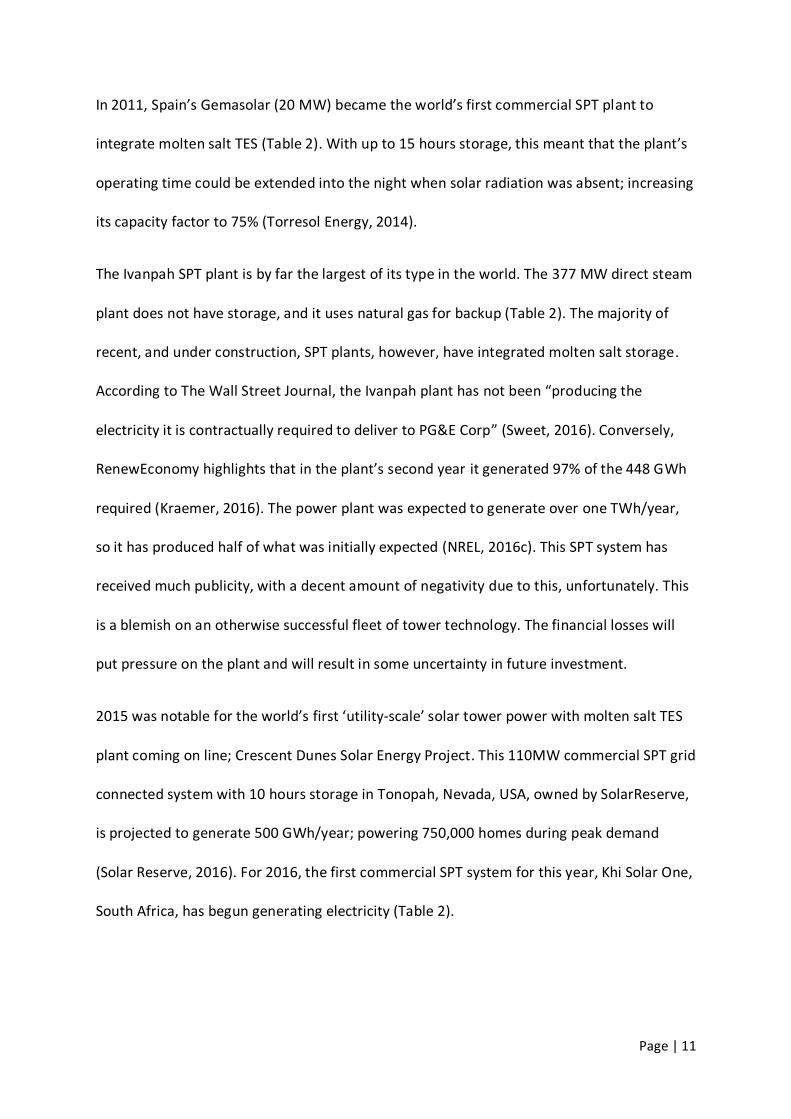
Page | 11
In 2011, Spain’s Gemasolar (20 MW) became the world’s first commercial SPT plant to
integrate molten salt TES (Table 2). With up to 15 hours storage, this meant that the plant’s
operating time could be extended into the night when solar radiation was absent; increasing
its capacity factor to 75% (Torresol Energy, 2014).
The Ivanpah SPT plant is by far the largest of its type in the world. The 377 MW direct steam
plant does not have storage, and it uses natural gas for backup (Table 2). The majority of
recent, and under construction, SPT plants, however, have integrated molten salt storage.
According to The Wall Street Journal, the Ivanpah plant has not been “producing the
electricity it is contractually required to deliver to PG&E Corp” (Sweet, 2016). Conversely,
RenewEconomy highlights that in the plant’s second year it generated 97% of the 448 GWh
required (Kraemer, 2016). The power plant was expected to generate over one TWh/year,
so it has produced half of what was initially expected (NREL, 2016c). This SPT system has
received much publicity, with a decent amount of negativity due to this, unfortunately. This
is a blemish on an otherwise successful fleet of tower technology. The financial losses will
put pressure on the plant and will result in some uncertainty in future investment.
2015 was notable for the world’s first ‘utility-scale’ solar tower power with molten salt TES
plant coming on line; Crescent Dunes Solar Energy Project. This 110MW commercial SPT grid
connected system with 10 hours storage in Tonopah, Nevada, USA, owned by SolarReserve,
is projected to generate 500 GWh/year; powering 750,000 homes during peak demand
(Solar Reserve, 2016). For 2016, the first commercial SPT system for this year, Khi Solar One,
South Africa, has begun generating electricity (Table 2).
Page | 12
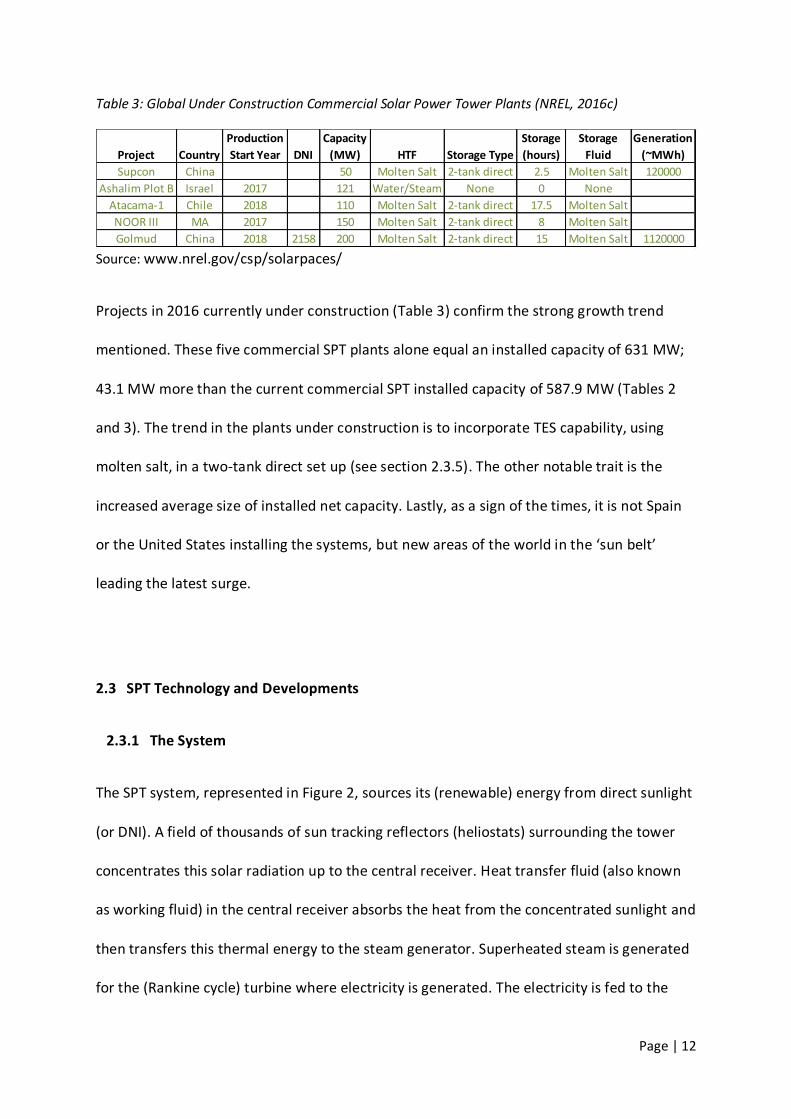
Table 3: Global Under Construction Commercial Solar Power Tower Plants (NREL, 2016c)
Source: www.nrel.gov/csp/solarpaces/
Projects in 2016 currently under construction (Table 3) confirm the strong growth trend
mentioned. These five commercial SPT plants alone equal an installed capacity of 631 MW;
43.1 MW more than the current commercial SPT installed capacity of 587.9 MW (Tables 2
and 3). The trend in the plants under construction is to incorporate TES capability, using
molten salt, in a two-tank direct set up (see section 2.3.5). The other notable trait is the
increased average size of installed net capacity. Lastly, as a sign of the times, it is not Spain
or the United States installing the systems, but new areas of the world in the ‘sun belt’
leading the latest surge.
2.3 SPT Technology and Developments
2.3.1 The System
The SPT system, represented in Figure 2, sources its (renewable) energy from direct sunlight
(or DNI). A field of thousands of sun tracking reflectors (heliostats) surrounding the tower
concentrates this solar radiation up to the central receiver. Heat transfer fluid (also known
as working fluid) in the central receiver absorbs the heat from the concentrated sunlight and
then transfers this thermal energy to the steam generator. Superheated steam is generated
for the (Rankine cycle) turbine where electricity is generated. The electricity is fed to the
Project Country
Production
Start Year DNI
Capacity
(MW) HTF Storage Type
Storage
(hours)
Storage
Fluid
Generation
(~MWh)
Supcon China 50 Molten Salt 2-tank direct 2.5 Molten Salt 120000
Ashalim Plot B Israel 2017 121 Water/Steam None 0 None
Atacama-1 Chile 2018 110 Molten Salt 2-tank direct 17.5 Molten Salt
NOOR III MA 2017 150 Molten Salt 2-tank direct 8 Molten Salt
Golmud China 2018 2158 200 Molten Salt 2-tank direct 15 Molten Salt 1120000
Page | 13
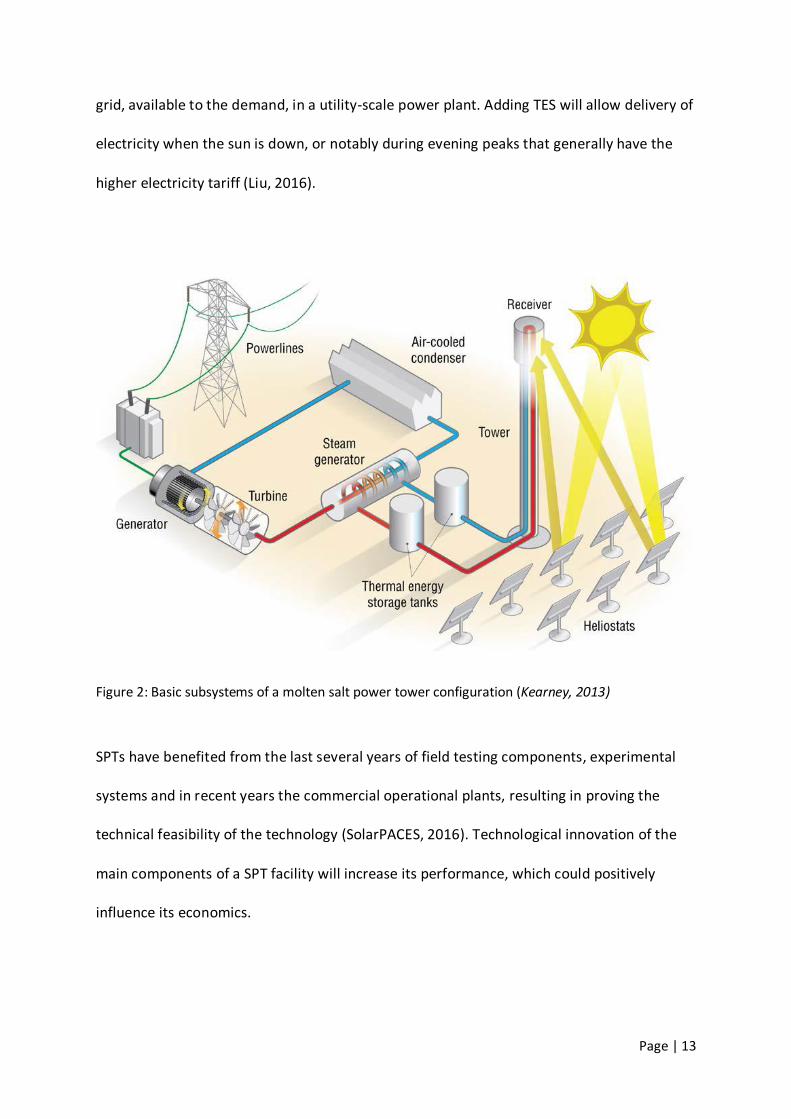
grid, available to the demand, in a utility-scale power plant. Adding TES will allow delivery of
electricity when the sun is down, or notably during evening peaks that generally have the
higher electricity tariff (Liu, 2016).
Figure 2: Basic subsystems of a molten salt power tower configuration (Kearney, 2013)
SPTs have benefited from the last several years of field testing components, experimental
systems and in recent years the commercial operational plants, resulting in proving the
technical feasibility of the technology (SolarPACES, 2016). Technological innovation of the
main components of a SPT facility will increase its performance, which could positively
influence its economics.

Page | 14
2.3.2 Heliostat Field
The solar collector (heliostat) field, with its two-axis sun tracking heliostats (mirrors) and
control system is required to focus direct solar radiation onto the tower-mounted receiver
throughout daylight hours. Each individual heliostat will follow the sun, changing its angle to
optimize the amount of available solar radiation reflected to the solar tower receiver
aperture.
A single modern (low-cost) heliostat includes a reflecting surface, a support structure with
foundation, a pedestal, a two-axis tracking mechanism and a control system (Behar et al,
2016). Early prototype heliostat reflective surfaces were around 40m2 in area. This has
developed to lower cost and larger designs of 120m2 for the first commercial SPTs, such as
Spain’s PS10 and PS20 power plants (Romero et al, 2014).
Heliostat field performance is a function of the field’s optical efficiency. A number of factors
contribute to the overall optical efficiency of the field. Wei et al (2010) state that the cosine
effect contributes the greatest energy loss of the heliostat field, with approximate annual
cosine losses of 23.4%. Other losses taken into account when optimizing the field’s optical
efficiency are the atmospheric attenuation (6%), blocking and shadowing (5.6%), receiver
spillage (2%), and mirror reflectance (10%) (Wei et al, 2010).
Cosine effect (ηcos) is due to the angle between the incident solar beam radiation
and a vector normal to the surface of the heliostat (Besarati, 2014). It is dependent
on latitude, requiring (for example) heliostat fields to be in the south in the Southern
hemisphere (Romero, 2014).

Page | 15
Atmospheric attenuation (ηatm) is influenced by the weather, and the distance
between heliostat and receiver (Wei et al, 2010).
Blocking and shadowing (ηbs) effects are determined by the relative location of
neighbouring heliostats. The losses depend on the distance between heliostats and
their arrangement (Wei et al, 2010).
Receiver spillage factor (ηspillage), or interception efficiency, is dependent on the off-
axis aberration (astigmatic effect), mirror slope and surface, tracking precision, and
sun shape factors (Noone et al, 2012). To avoid excess receiver spillage loss the solar
field boundary is constrained by the tower height, plus the receiver tilt angle and size
(Wei, et al, 2010).
Mirror reflectance loss (ηref) depends on its surface quality, in terms of degradation
and soiling (or cleanliness).
Efficiency, η = ηcos × ηatm × ηref × ηsb × ηspillage
These losses can total up to 47% of the DNI falling on the heliostats, according to Behar et al
(2016). However, in terms of the heliostat field layout, which excludes the mirror reflectivity
losses, there can be up to 40% of total energy losses (Behar et al, 2016). Field layout losses
can decrease by fine-tuning the optimal heliostat layout configuration (Noone et al, 2012).
An increase in efficiency could result in a field of fewer mirrors for similar radiation received
by the tower, reducing capital cost, or alternatively, the same number of mirrors providing
more power. The tradeoff is between the field area and field efficiency. As the size of the
heliostat field increases, the optical efficiency generally declines (Collado et al, 2013).
Additionally there is the shadowing and blocking-heliostat density trade-off, where a denser
Page | 16
field of heliostats increases the shadowing and blocking losses, yet decreases the other
optical losses (Collado et al, 2013).
Given the complexity of designing efficient solar field layouts, several different codes,
algorithms and methodologies have been developed (Mutuberria et al, 2016). They assist by
reducing the number of parameters to consider and simplifying the process. The DELSOL3 is
a code, popular since the 1980s, that optimizes the SPT field (Romero et al, 2014) and is the
approach used in NREL’s System Advisor Model (SAM). The code’s algorithm distributes the
heliostat field into zones of radial direction and azimuth direction (Kistler, 1986).
Areas with high solar radiation can coincide with deserts or regions prone to airborne dust.
Dust, dirt and other particulates can accumulate on the field mirrors, which will present
operational and maintenance issues, and additional costs to consider. Mirror reflectivity
losses need mitigating, because a 1% reflectance loss can directly lead to a 1% increase in
the LCOE (Hunter et al, 2014). The heliostats optical performance is clearly influential on the
power system’s electricity costs. Attention to the design of heliostat field layout, material
and its maintenance will play a large role in ensuring the feasibility of the whole SPT system.
When introducing thermal energy storage (TES), the (solar) field’s solar multiple will require
increasing from that of a non-storage plant. IEA-ETSAP & IRENA (2013) describe the solar
multiple as the “ratio of the actual size of the solar field to the solar field size needed to
feed the turbine at nominal design capacity with maximum solar irradiance (about 1
kW/m2).” CSP plants with no storage have a solar multiple between 1.1 and 1.5 in order to
allow for thermal losses; while plants with TES can have solar multiples of 3 to 5 to allow for
the extra thermal energy required for storage (IEA-ETSAP and IRENA, 2013).

Page | 17
2.3.3 Receiver
The tower-mounted (central) receiver (the heat exchanger) absorbs the heliostat reflected
solar radiation and converts it into thermal energy. Its purpose is to efficiently convert
sunlight to heat, and it should mimic a black body cavity by minimizing radiation losses. In
solar receivers, efficiency and durability are the priorities; however, the efficiency will
decrease with the desired high absorber temperature (increase) because the higher HTF
temperatures result in increased heat to electricity conversion efficiency (Weinstein et al,
2015). High-performance materials are required for SPT receivers due to the high levels of
radiant flux and resulting temperatures experienced (Romero et al, 2014). Metal alloys or
ceramic materials that tolerate, not only the temperature changes, but also high energy
density, are essential (Behar, 2016).
Central receiver towers can be around a height of 195 meters, depending on the heliostat
field (Solar Reserve, 2016). The two main designs are external and cavity receivers, both
shown in Figure 3.
Figure 3: Schematics of tubular external (left) and cavity (right) receivers (Ho et al, 2014, p839)

Page | 18
External receiver: consists of panels of small vertical tubes joined next to each other
creating a cylinder shape. The tubes connect to headers that supply HTF to the bottom and
collect the heated fluid from the top (Power from the Sun, 2016). The receiver can absorb
solar radiation from all directions due to its cylindrical geometry; therefore suiting a
heliostat field layout that surrounds the tower, with the receiver centered in the field. It can
achieve efficiencies of 80 to 90%, given an appropriate HTF (Ho et al, 2014).
External cylindrical (tube) receiver designs have demonstrated performance in the
Gemasolar 20MW, Ivanpah 377MW and the Crescent Dunes 110MW SPT (with storage)
plants (Table 2). SolarReserve’s Crescent Dunes SPT receiver consists of 14 panels, each
made up of 66 thin-wall straight tubes (of nickel based alloy steel with high absorptivity
black coating) (Solar Reserve, 2016).
Cavity receiver: the heliostats reflect solar radiation through an aperture into an insulated
enclosure and onto the heat transfer surface (Behar, 2016). Due to the cavity geometry,
convective heat losses from the absorber are reduced (Weinstein et al, 2015). The limiting
design factor is its acceptance angle and contained (non-external) absorbing surface. The
heliostat field is dependent on its view of the cavity aperture. Therefore, heliostats are
positioned mainly on one side of the receiver. PS10 and PS20 SPTs are examples where the
cavity receiver is used (Table 2).
Alternative receiver types, such as particle receivers, have been researched and modelled.
Particle receivers are planned to achieve receiver outlet temperatures of over 1000°C (Ho et
al, 2014). The receiver uses solid particles (as HTF and TES medium) to absorb concentrated
DNI. High temperatures are achieved due to the directly absorbed solar flux from the HTF
(Behar, 2016). For this type to be viable for advanced SPT systems, then greater solar
Page | 19
absorptance, larger concentration ratios and an effective particle heat exchanger is
necessary (Ho et al, 2014).
2.3.4 Heat Transfer Fluid
The heat transfer fluid (HTF) is an essential part of the SPT system, as it collects heat from
the solar radiation reflected to the receiver, transports the thermal energy to where it is
required, and then exchanges the thermal energy to produce steam in the power cycle
process. The change in enthalpy in the HTF is the thermal power output of the solar power
system (Kearney, 2013). Molten salt and steam (and water mix) have been the HTFs of
choice for commercial SPT plants (Table 2). The HTF medium also ultimately determines the
storage system used.
In direct steam generation (DSG) superheated steam from the water feeds directly into the
power cycle, rather than requiring a heat exchanger to convert water into superheated
steam to drive the turbine (Weinstein et al, 2015). Without the need for a separate HTF and
heat exchanger, the energy costs will be reduced. The water-steam mixture of over 400°C
has a high heat capacity, creating good power cycle efficiencies (Weinstein et al, 2015).
Spain’s 11 MW PS10 and 20 MW PS20 SPT plants are examples of the commercial use of
DSG (Weinstein et al, 2015). Saturated steam as HTF does have its drawbacks, notably its
limited TES capacity. It creates challenges for use as a (base load) utility-scale plant; given
the lack of storage.
Molten salt HTF has been the ‘trend’ in recent SPT designs (Table 3). The type of salt used
has been a 60% sodium nitrate (NaNO3) and 40% potassium nitrate (KNO3) mix, also known
Page | 20
as “Solar Salt” (Pfleger et al, 2015). The use of molten salt as the HTF (and storage medium)
has been a defining factor in Nevada’s Crescent Dunes SPT. The plant stores more energy in
less salt when compared with other technologies due to the high temperature differential
(288°C to 566°C) (Solar Reserve, 2016). Managing the HTF stability and not allowing freezing
will prevent damage to piping, and avoid unwanted maintenance costs. The molten Solar
Salt has an upper stability limit of 600°C, allowing for use of (high efficiency) Rankine cycle
turbines, and a (manageable) high freezing point of 200°C (Dun et al, 2012). The salt remains
in a liquid state in the SPT system for the operating life of the plant; eliminating the (costly)
need to replace the HTF (Dun et al, 2012).
Fluoride and chloride (molten) salts as HTF could be used in future higher temperature SPTs,
creating potentially higher efficiencies (Pfleger et al, 2015). However, the higher operating
temperatures are currently not achievable due to receiver material limitations (Weinstein et
al, 2015). The cost and availability of the type of salt and mixture come into the equation
when exploring these HTF options, along with any known toxicity and impurity properties.
Other options for HTF that, once matured and suitable, will advance SPTs thermal
performance are pressurised gases. Gases, such as CO2 and air, can reduce chemical
stability and material compatibility issues, while achieving greater temperatures, hence
greater power conversion efficiencies (Weinstein et al, 2015).
2.3.5 Thermal Energy Storage
CSP plants have an advantage over most other renewable technologies, namely the ability
to provide low cost thermal energy storage (TES). For sensible heat storage in current SPT
Page | 21
plants, the HTF, a molten salt mixture consisting of 60% NaNO3 and 40% KNO3 (Solar Salt),
is used commercially (Pfleger, et al, 2015). By having more NaNO3 than eutectic mixture,
the material costs can be reduced (Pfleger et al, 2015). The salt type is worth researching for
availability and performance in future SPTs.
SPTs with adequate TES systems have the desired ability to alleviate short load fluctuations
and to shift the time when the energy is supplied, in order to dispatch power to the grid at a
time to satisfy demand (generally the highest electricity tariff) (Liu et al, 2016). Even during
cloudy periods, the available stored heat can continue the plant’s electricity output (Beyond
Zero Emissions, 2012). ‘Dispatchability’ is one of the key features that make the SPT with
TES attractive as a utility-scale power plant. The ability to supply power at peak periods puts
it in the same category with a gas open cycle plant, as a ‘peaking’ plant (Beyond Zero
Emissions, 2012). TES will also allow for extension of power production to beyond sunset
and, depending on the storage capacity, could offer base load power. The Gemasolar SPT
plant, in 2013, achieved constant power production (24 hours per day) for 36 consecutive
days (SolarPACES et al, 2016). Importantly, a plant’s capacity factor significantly increases
due to adding TES, reaching as high as 75% for Gemasolar SPT plant (15 hours TES) (NREL,
2016).
Two-tank molten salt TES systems are the current trend for SPTs (Table 3). The two-tank
system (Figure 2) pumps molten salt (565°C) from a hot tank to a steam generator to
produce steam for the (Rankine cycle) turbine, then to a cold tank (290°C) ready to be
reheated from the receiver (SolarPACES, 2016). However, proposed single-tank thermocline
TES systems, according to DOE (2016), have the potential to displace 75% of the salt, by
replacing it with cheaper rocks or pebbles. This would mean less salt to transport and
Page | 22
condition because solid storage materials have not been demonstrated commercially in
SPTs (Table 3), their impact on performance and costs is questionable. Another storage
medium explored is phase change materials (PCM); this latent heat storage would benefit
systems that have large fractions of latent heat, like DSG systems (Wyld Group, 2008).
2.3.5 Power Cycle
Commercial SPT plants typically used Rankine cycle steam turbines for their power
conversion. This conversion system is the same as in conventional fossil fuel power plants,
where it converts thermal energy into electricity (Behar, 2016). The Rankine cycle operates
at a range of inlet temperatures from 350°C to 600°C, with efficiency of around 40%
(Weinstein et al, 2015); suiting the molten salt HTF temperature ranges, as mentioned in the
previous sub-section. However, supercritical steam Rankine cycle systems can reach 760°C,
with 45% efficiency (Weinstein et al, 2015). The Rankine cycle, like all heat engines,
increases conversion efficiency the higher the temperature and pressure of the steam
entering the turbine (ITP, 2012).
Alternatively, a Brayton cycle conversion system could be used in future SPT plants. It
requires a volumetric air receiver and an adapted gas turbine (Behar, 2016). A Brayton cycle
has an operating temperature range of 500°C to 800°C, suiting supercritical CO2 as the HTF
(Weinstein et al, 2015). An advantage of this technology is the greater efficiency of 50% (Ho
et al, 2014).
Page | 23
2.4 Sustainability
CSP plants, when operating, do not rely on finite fossil fuel to generate electricity. They are
sustainable, in that they require fuel from the sun, and as such do not emit greenhouse
emissions. To put it into context, the planned 2440 new coal plants worldwide (totalling
1428 GW) could emit around 6.5 GtCO2 per annum, that is around 18% of the total allowed
emissions in 2030 ‘under a 2˚C-compatible scenario’ (Climate Tracker, 2015). This highlights
the significant action required to offset the effect of these planned plants, by rapidly
increasing the renewable energy capacity.
A CSP plant, in general, takes around five months to payback the energy used for
manufacturing and installing the equipment (REN21, 2015). This is an excellent ratio when
taking into account a plant’s lifetime of 30 years (REN21, 2015). With increases in SPT plant
capacity factor from incorporating TES, and given revenue increases, the life-cycle payback
period should drop further.
Power conversion systems require cooling. Technology that reduces water use in SPTs will
go a long way to increase its sustainability and reduce costs. Given most SPT plants are likely
to be in semi-arid to arid regions, lessening the consumption of local water sources is
essential. Air-cooled condensers can reduce water use by 95% (compared to water-cooled
condenses), although, with some decrease in electricity output (ITP, 2012). Air-cooling does
require 5%-10% more in investment cost than wet-cooling (SolarPACES et al, 2016).
Cleaning each heliostat is a necessary task for all SPT plants, and thus (traditionally) requires
water, which adds up over a year. There has been research by Boston University into self-
cleaning CSP collectors, that reduce water usage (DOE, 2014). The technology could (ideally)
Page | 24
transfer to heliostats. It uses a small electric charge to remove (90%) of dust particles from
the panel surfaces (Whitlock, 2016). Another exciting innovation is at the Ketura Sun solar
plant, Israel, where frame-mounted robots with tiny brushes clean the heliostat panels,
using mini-solar panels (Whitlock, 2016).
The SPT operational impact on birds has been an issue raised for some plants, yet literature
on this aspect is scarce. CleanTechnica reports the lesson learnt from one day of numerous
bird fatalities, was to “focus no more than 4 mirrors on any one place in the air during
standby”, resulting in no fatalities in the 3 months following (Kraemer, 2015). Importantly to
note, in comparison to fossil-fired plants, CSP plants are far less harmful to the
environment.
2.5 Economics
SPT technology can potentially be economically viable in high DNI regions, due to substantial
declines in cost curves (SolarPACES et al, 2016). Technological innovation, increased and
improved production, and economies of scale are the factors driving costs down; becoming
competitive with fossil-fuelled power (SolarPACES et al, 2016). The volatility and increase of
fuel prices for conventional plants will aid CSP’s progress, whilst benefiting the environment.
The IRENA 2014 report has installed costs for SPT with 4 to 8 hours storage at between
(USD) $6800 and $12,800kW (IRENA, 2015). Interestingly, the heliostat field contributes up
to 50% of the total installed costs (Collado et al, 2013). The low end (of the costs) are
comparable to a biomass combustion combined heat and power plant of (USD) $5792/kW,

Page | 25
and a Wind turbine (10 – 100kW) of (USD) $6,118 (NREL, 2016d). Important to note, the
value IRENA gave was prior to the Crescent Dunes utility SPT.
An important measurement of a project’s viability is its Net Present Value (NPV). NPV is
calculated by subtracting the present value of cash outflows from inflows, over a period
(Investopedia, 2016). A positive NPV indicates a project that will make a profit. The Internal
rate of return (IRR) is the discount rate required to produce a NPV of zero. Both are useful
for measuring a project’s profitability. Those two measurements, together with the payback
period (length of time to recover the project’s cost), are what investors (could) use to
determine if the project is ‘bankable’.
A common metric to measure an energy technology’s competitiveness and economic
performance, is the levelised cost of energy (or electricity) (LCOE). It is defined as the
constant cost of energy ($/unit of energy output) over the lifetime of a power plant,
resulting in a total net present value (NPV) of zero (Lovegrove et al, 2014). A relatively
simple version of LCOE is presented in Figure 4.

Page | 26
Figure 4: Levelised cost of energy/electricity generation calculation (IRENA, 2012)
The methods behind LCOE calculation can vary from one study to another. Taxes and
inflation may be included. Therefore, comparing LCOEs with potentially different (or
unknown) methods for one energy type to another could result in false comparisons. So too,
does comparing fossil fuels with renewable energy, as hidden costs (or negative
externalities) to social and environmental health from pollution are typically ignored in LCOE
values.
Page | 27
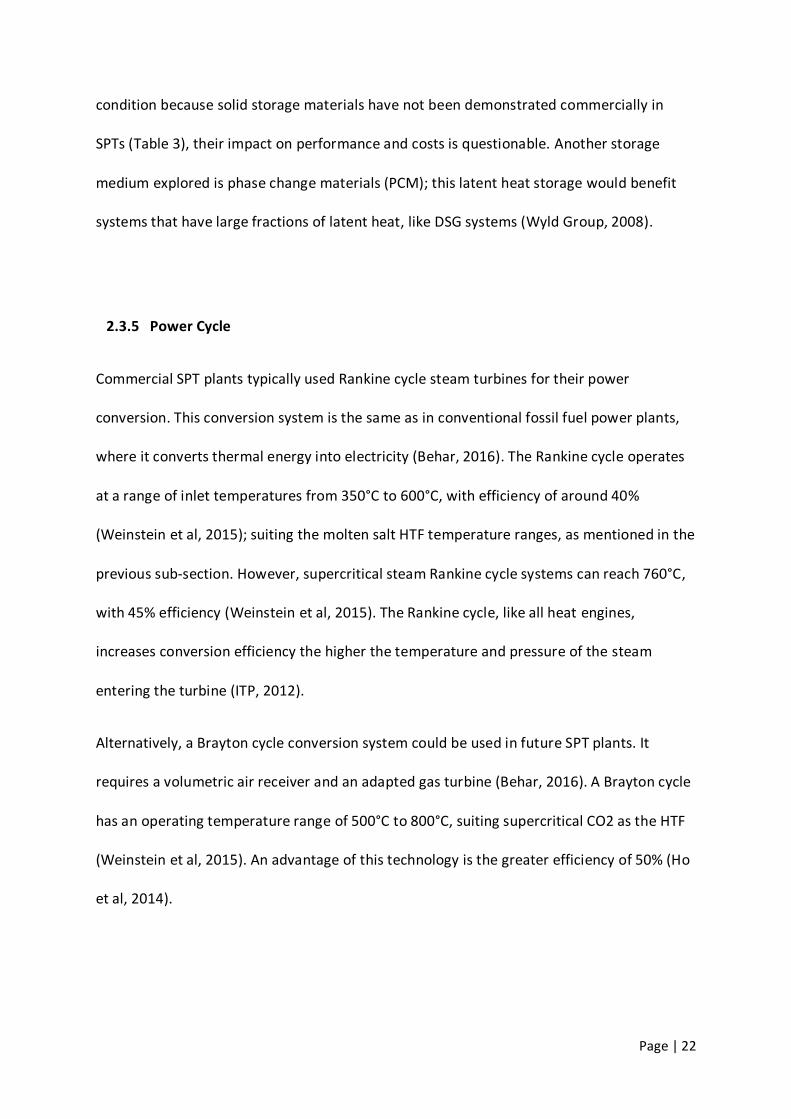
The levelised cost of electricity from utility-scale renewable technologies, 2010 and 2014
Figure 5: 2010 and 2014 LCOE from utility-scale renewable technologies (IRENA, 2015)
The LCOE for CSP in 2014 (Figure 5) has significantly fallen since 2010, and its capacity
grown. In 2014, the LCOE range falls below (USD) 20c/kWh. The tan band in Figure 5,
representing the fossil fuel power cost curve, indicates that CSP is steadily making positive
inroads. Investigating other past and predicted values found a general trend of falling costs
of energy, albeit with a range of (mostly unknown) LCOE methods.
SPTs at (USD) 17c to 29c/kWh, assuming a 10% cost of capital (IRENA, 2012)
Utility-scale CSP plants in Australia: broadly accepted value of (AUD) 25c/kWh
(Webby, 2013).
100 MW (14 hours TES) Kalgoorlie modelled plant, with 7% discount rate: (AUD)
16.4c/kWh (Meybodi et al, 2016).
Page | 28
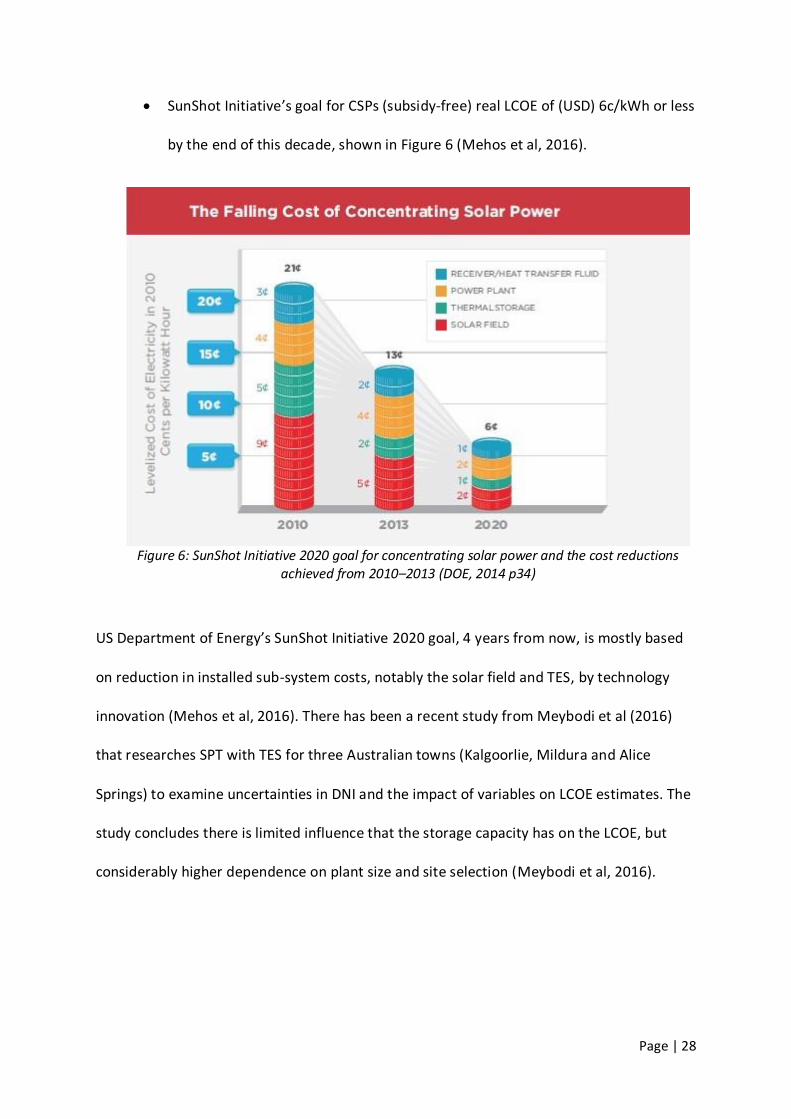
SunShot Initiative’s goal for CSPs (subsidy-free) real LCOE of (USD) 6c/kWh or less
by the end of this decade, shown in Figure 6 (Mehos et al, 2016).
Figure 6: SunShot Initiative 2020 goal for concentrating solar power and the cost reductions achieved from 2010–2013 (DOE, 2014 p34)
US Department of Energy’s SunShot Initiative 2020 goal, 4 years from now, is mostly based
on reduction in installed sub-system costs, notably the solar field and TES, by technology
innovation (Mehos et al, 2016). There has been a recent study from Meybodi et al (2016)
that researches SPT with TES for three Australian towns (Kalgoorlie, Mildura and Alice
Springs) to examine uncertainties in DNI and the impact of variables on LCOE estimates. The
study concludes there is limited influence that the storage capacity has on the LCOE, but
considerably higher dependence on plant size and site selection (Meybodi et al, 2016).
Page | 29
2.6 Policies, Incentives and the Utilities
Spain and the US have seen the largest growth in CSP capacity over the last decade, and
certain drivers in place have had an important role in this. Renewable Portfolio Standards
(RPS) policies, feed-in tariff (FiT), capital grants and tax relief are support mechanisms
proving essential for driving the commercial progress of CSP.
A FiT ensures that power plants receive a guaranteed price for their electricity over a certain
length of time, so to entice investment for the project (Beyond Zero Emissions, 2012). Spain,
in 2007, enhanced its feed-in tariff (FiT) regulations (with the Royal Decree 661). The CSP
electricity generators received a fixed tariff of 27 € cents/kWh for the first 25 years and then
21.5 € cents/kWh after (SolarPACES, Spain, 2016). This provides a stable assurance of
revenue from energy production. Abengoa Solar’s PS10, the first commercial SPT plant in
the world, was born out of/into this FiT, in 2007. By the end of 2009, 8 CSP plants had been
commissioned (SolarPACES, Spain, 2016). Unfortunately, to the detriment of Spain’s CSP
industry, the Government in 2009, canceled the FiT for new plants. As was seen in Table 4,
Spain has no new or planned CSP plants.
The United States has the longest history of solar thermal generated electricity. The spike in
CSP electricity production from 2013, seen in Figure 7, was influenced by federal incentives.

Page | 30
Figure 7: 1983-2015 USA cumulative total solar thermal electricity generating capacity (U.S. EIA, 2016)
A requirement for the increase in electricity generation from renewable energy technologies
is legislated by the RPS, in most US states (SolarPACES et al, 2016). Additionally, in 2005, the
US Federal Investment Tax Credit (ITC) of 30% was introduced (SolarPACES et al, 2016). The
ITC of 30% of the cost of development has brought great growth to the solar thermal energy
industry. It was set to decline after 2016, although fortunately it will remain for five more
years from project’s prior expiry dates (Mai et al, 2016). The other successful incentive, for
certain clean energy projects, has been the US Department of Energy (DOE) Loan
Guarantees (SolarPACES et al, 2016). Nevada’s Crescent Dunes SPT (Tonopah) project
received a $737 million DOE loan guarantee, allowing it to become a reality, producing
energy from late 2015 (NREL, Crescent Dunes, 2016).
For Australia, the Renewable Energy Target (RET) is a policy designed to drive the growth of
renewable energy generation. Unfortunately, the reduction of the RET from 41,000 GWh to
33,000 GWh/year of ‘new renewable generation’ by 2020 is a dampener, but still means
that power plants like SPTs need to be considered. (Clean Energy Council, 2014). Policy
Page | 31
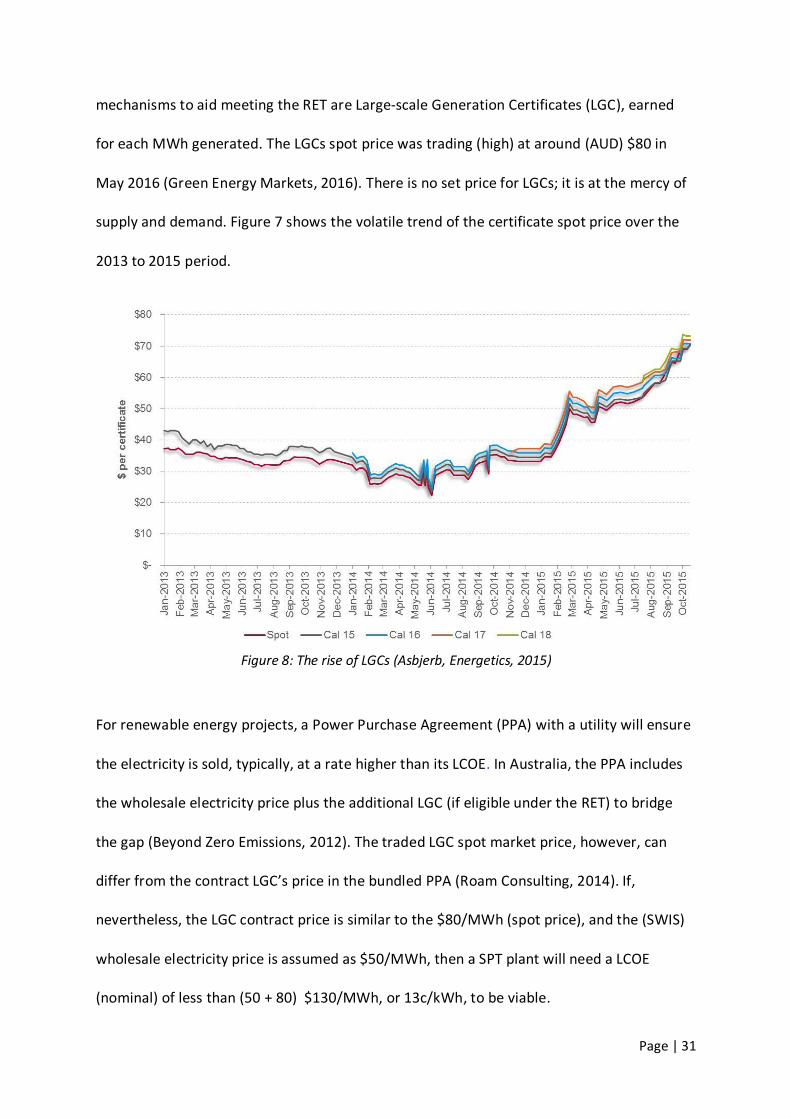
mechanisms to aid meeting the RET are Large-scale Generation Certificates (LGC), earned
for each MWh generated. The LGCs spot price was trading (high) at around (AUD) $80 in
May 2016 (Green Energy Markets, 2016). There is no set price for LGCs; it is at the mercy of
supply and demand. Figure 7 shows the volatile trend of the certificate spot price over the
2013 to 2015 period.
Figure 8: The rise of LGCs (Asbjerb, Energetics, 2015)
For renewable energy projects, a Power Purchase Agreement (PPA) with a utility will ensure
the electricity is sold, typically, at a rate higher than its LCOE. In Australia, the PPA includes
the wholesale electricity price plus the additional LGC (if eligible under the RET) to bridge
the gap (Beyond Zero Emissions, 2012). The traded LGC spot market price, however, can
differ from the contract LGC’s price in the bundled PPA (Roam Consulting, 2014). If,
nevertheless, the LGC contract price is similar to the $80/MWh (spot price), and the (SWIS)
wholesale electricity price is assumed as $50/MWh, then a SPT plant will need a LCOE
(nominal) of less than (50 + 80) $130/MWh, or 13c/kWh, to be viable.

Page | 32
The added advantage of a SPT is its ability to offset the need for conventional dispatchable
systems on the grid (capacity value); notably open cycle gas plants. The capacity value gives
it potential (eligibility) for capacity credits. Under the SWIS Reserve Capacity Requirement
(RCR), power plants will dispatch a certain amount of capacity when required, earning
Reserve Capacity Credits (RCCs) (ITP, 2012). In the WA SWIS, for 2013-14, the reserve
capacity price was $178,477/MW/year (AEMO, 2015). ITP (2012) determined that (given a
capacity price similar to above), if “a high-capacity CSP system could earn 90% of that rate it
would equate to an extra $20 per MWh income.” Including this value on top of the
wholesale electricity price and LGCs would mean a significant increment (ITP, 2012).
Figure 9: Hypothetical daily load profile with solar radiation and CSP plant generation (SolarPACES et al, 2016, p22)
For a SPT plant with adequate TES, there is potential for it to operate, following the demand
curve, while retaining enough dispatchability to qualify for RCC payments. Figure 8 displays
a hypothetical daily load profile, showing how a solar thermal electricity plant can operate
as a peaking power plant. The utility-scale suitability from having large capacity value TES is
a bankable feature over intermittent power plants without storage.
Page | 33
3 Methods
3.1 Site Resources
Solar values were obtained from NASA (2016), to compare with AUSTELA’s solar files for
Kalgoorlie. The Solar values from AUSTELA (2014 files) were used for NREL’s System Advisor
Model (SAM), as they were in the (hourly) form required by the simulation program. In
order to choose from the three years provided (1998, 2007 and 2011) in the AUSTELA file,
the direct normal irradiance (DNI) values were compared to NASA’s DNI, using the same
coordinates. The DNI annual value from 2007 was closest to the NASA value, and therefore
chosen for the SAM simulations.
Coordinates obtained from the AUSTELA solar files and used for NASA data: latitude
30.785 °S, longitude 121.453 °E.
Kalgoorlie-Boulder DNI from NASA: 6.83 kWh/m^2/day = 2493 kWh/m^2/year. 22-
year average (NASA, 2016).
Kalgoorlie-Boulder DNI from AUSTELA (2014) SAM files: 6.66 kWh/m^2/day = 2430
kWh/m^2/year (2007)
2493 – 2430 = 63, or 97.5% similarity.
Clearness index obtained from NASA used the latitude and longitude as above.
The City of Kalgoorlie-Boulder (CBK, 2016) provided most of the city characteristics, in terms
of population, industries, land size, and electricity consumption. An assumption was made,
that the total consumption for Kalgoorlie-Boulder does not take into account any mine sites
with their own generators. It is purely electricity sourced from the (SWIS) power grid. The
Page | 34
Local power plant information was obtained from the (Clean Energy Regulator, 2015).
Regarding the Parkeston Power Station in CBK, there were differing values for the annual
generation. One value from the (part owner) TransAlta website (TransAlta, 2016), and
another from the Clean Energy Regulator (2015). Both differing values are presented in
section 4.2.1.
3.2 Modeling and Analysing SPT System
SAM was used as a tool to simulate and analyse technical and financial performance of a
utility-scale (104 MW net) SPT with (14 hours) TES base case at Kalgoorlie-Boulder. The
turbine size was chosen of similar size to the Crescent Dunes plant (110MW) and in line with
other planned SPT plants (Table 3). Storage capacity was chosen to be 14 hours to
complement to turbine size and offer sufficient dispatchability to receive benefits from the
utility. Many input options were left as default values (purposely), in version ‘2016.3.14’ of
SAM. The modelled inputs and variables are provided in Appendix A as screen shots. The
notable inputs and some explanations are detailed below.
System design:
Design turbine gross output, 115 MWe
Solar multiple of 3.1, to suit the storage capacity
TES, 14 hours
HTF cold 290°C and hot 574°C (default)
Page | 35
Heliostat field:
The ‘always optimise’ option was used, to prioritise the heliostat layout over other
components
On-axis canting method
Ideal focusing method
Tower and receiver:
Receiver parameters are for an external receiver
Salt (60% NaNO3 40% KNO3) HTF
Power cycle:
Rankine cycle
Boiler operating pressure, 100 bar
Air-cooled condenser type chosen to avoid excess water usage (on top of mirror
cleaning)
Thermal storage: the two-tank system was kept default (storage hours determined in
system design).
Keeping the technical values default was a safe option. The scope of the dissertation did not
extend to researching each possible technical value. SAM (version 2016.3.14) is assumed to
give ‘realistic’ technical values.
The system technology is not operating commercially in Australia and has limited projects
worldwide. Financial unknowns (specific to WA) limited how realistic the costs of the system
would be at site. System costs were chosen to remain default (Appendix). The ‘Australian

Page | 36
Companion Guide to SAM for Concentrating Solar Power’ and AUSTELA’s
‘SAM_Project_Files_For_Aus-March2014’ were examined. However, the developments in
SPT technology over the last 2 to 3 years, namely Crescent Dunes plant, has meant those
values from AUSTELA are not as relevant. Additionally the conversion to Australian currency
in 2012, does not match today’s (2016) exchange rate (USD to AUD). By keeping the costs
default, it maintains transparency and aids comparisons with other (recent) SPT modellings.
Even taking into account the exchange rate, the system costs in Australia, by the time a SPT
plant is commissioned, are likely to have fallen from current values. The costs used are
reasonable estimates for the purpose of the study.
For the purpose of this research SAM monetary values are in AUD. The initial SAM values
used were US based (in USD), however, with a lack of SPT plants in Australia, it was decided
to assume these values for this study site as being in AUD. Currency will be noted for each
value, outside of SAM.
Financial parameters:
Specified IRR target, 9.68% (Nominal discount rate, 9.68%). The target IRR effectively
takes the place of the discount rate, recommended Lovegrove (2014)
IRR target year, 20
PPA price escalation, 1%/year
25 years analysis period
Inflation rate, 2.5%
Real discount rate, 7%
30% Federal income tax (no State income tax)
60% debt of total capital cost

Page | 37
Construction loan, 4% interest rate, 24 months prior to operation
Uniform dispatch, with PPA price multiplier if 1
No incentives for the SPT base case
3% Federal for 20 year Straight Line for depreciation
From these parameters entered, data outputs include:
Annual Electrical Production
Capacity factor
LCOE over entire system life
Total direct and indirect costs
PPA
NPV
Using a LCOE model that is simple and transparent has the benefit of being replicated
easier. The research uses SAM to calculate the LCOE. The Internal Rate of Return (IRR),
incentives and taxes are included within the LCOE calculation.
The sensitivity of the modelled base case to changes in input parameters was investigated
to determine were the potential is to improve the plant’s feasibility. Applying 30% ITC
incentive and SunShot sub-system cost goals were simulated to determine improvements,
economically. Additionally, the SWIS utility’s incentives, and National and State policies
were evaluated to determine how it can enhance feasibility. Influences on LCOE, installed
costs, water use, capacity factor and annual electricity generation were priorities in the
sensitivity analysis.

Page | 38
4 Results and Discussion
4.1 Site Characteristics: Kalgoorlie-Boulder, Western Australia
Direct normal irradiation (DNI) is the global radiation minus the diffuse radiation; in a direct
line from the sun. DNI of over 2000 kWh/m2/year is the preferred minimum that
SolarPACES et al (2016) state for CSP sites. High direct beam levels are throughout the
Australian continent, with very high levels in the West, as seen in Figure 10.
Figure 10: Australia’s DNI (SolarGIS, 2016)
Page | 39
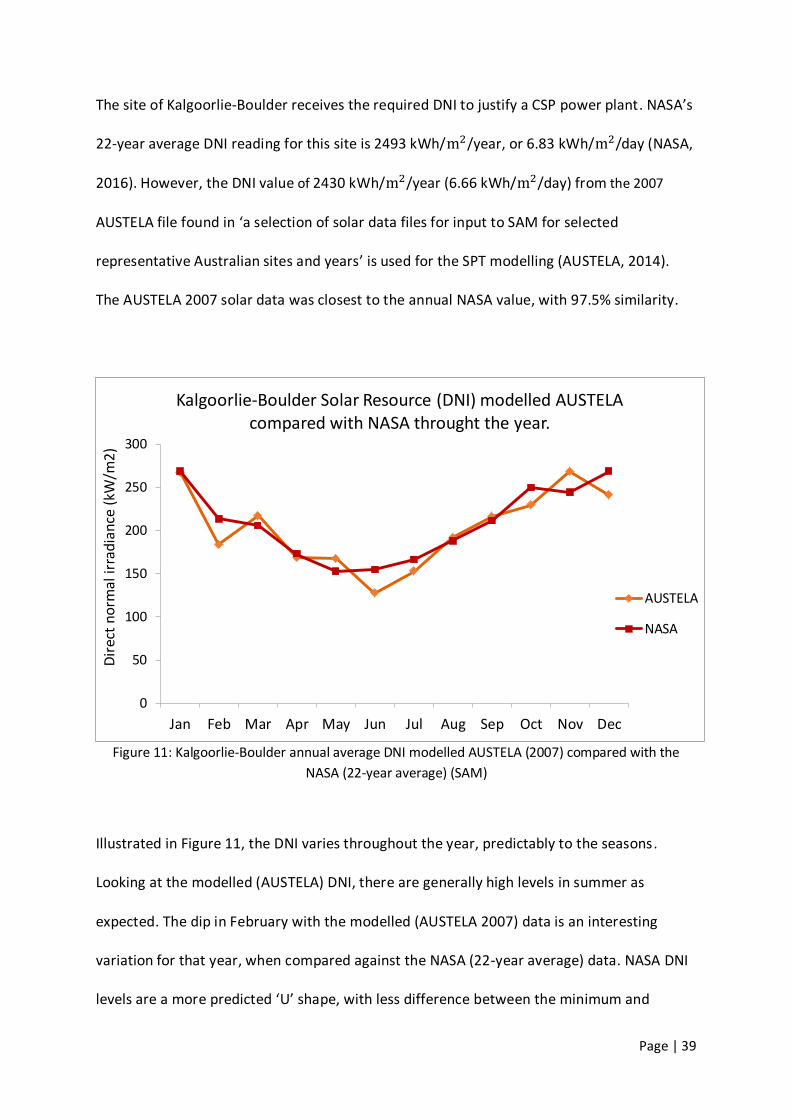
The site of Kalgoorlie-Boulder receives the required DNI to justify a CSP power plant. NASA’s
22-year average DNI reading for this site is 2493 kWh/m2/year, or 6.83 kWh/m2/day (NASA,
2016). However, the DNI value of 2430 kWh/m2/year (6.66 kWh/m2/day) from the 2007
AUSTELA file found in ‘a selection of solar data files for input to SAM for selected
representative Australian sites and years’ is used for the SPT modelling (AUSTELA, 2014).
The AUSTELA 2007 solar data was closest to the annual NASA value, with 97.5% similarity.
Figure 11: Kalgoorlie-Boulder annual average DNI modelled AUSTELA (2007) compared with the
NASA (22-year average) (SAM)
Illustrated in Figure 11, the DNI varies throughout the year, predictably to the seasons.
Looking at the modelled (AUSTELA) DNI, there are generally high levels in summer as
expected. The dip in February with the modelled (AUSTELA 2007) data is an interesting
variation for that year, when compared against the NASA (22-year average) data. NASA DNI
levels are a more predicted ‘U’ shape, with less difference between the minimum and
0
50
100
150
200
250
300
Jan Feb Mar Apr May Jun Jul Aug Sep Oct Nov Dec
Dir
ect
no
rmal
irra
dia
nce
(kW
/m2
)
Kalgoorlie-Boulder Solar Resource (DNI) modelled AUSTELA compared with NASA throught the year.
AUSTELA
NASA
Page | 40
maximum months than the modelled, due to the smoothing out of long-term averages.
Furthermore, the modelled DNI data has a noticeable lower June level and higher November
level than the NASA data. Nonetheless, the DNI levels indicate suitable solar availability.
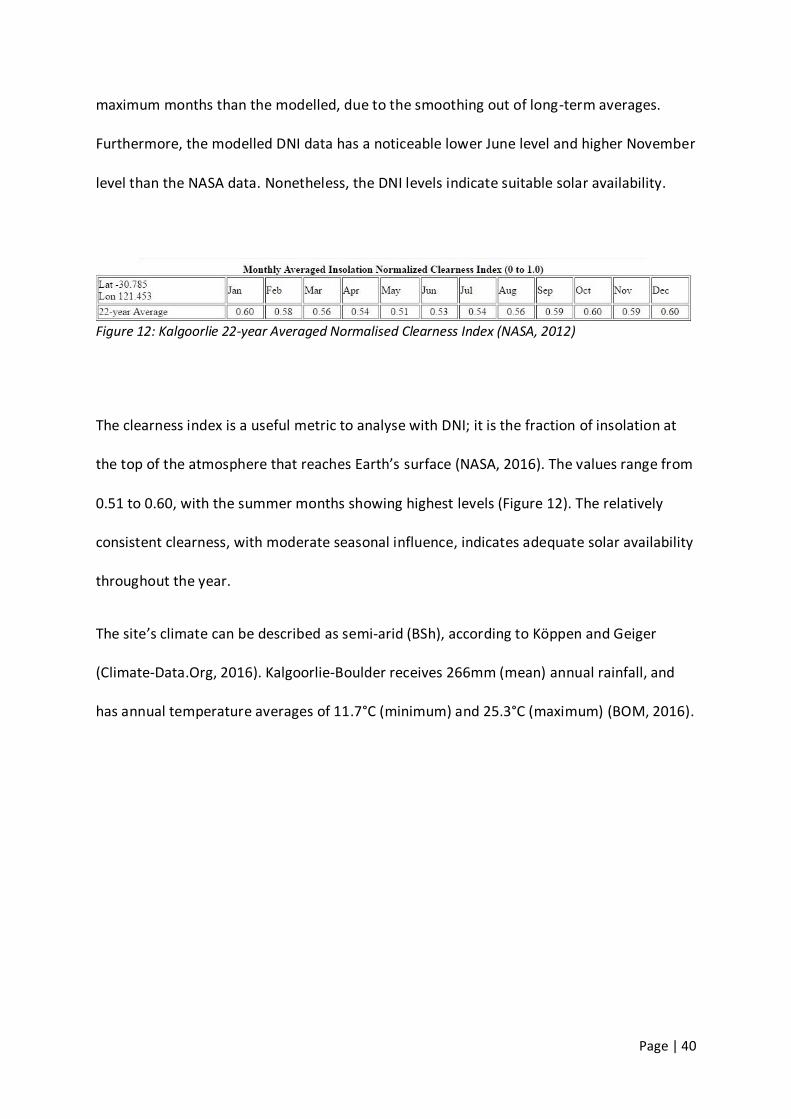
Figure 12: Kalgoorlie 22-year Averaged Normalised Clearness Index (NASA, 2012)
The clearness index is a useful metric to analyse with DNI; it is the fraction of insolation at
the top of the atmosphere that reaches Earth’s surface (NASA, 2016). The values range from
0.51 to 0.60, with the summer months showing highest levels (Figure 12). The relatively
consistent clearness, with moderate seasonal influence, indicates adequate solar availability
throughout the year.
The site’s climate can be described as semi-arid (BSh), according to Köppen and Geiger
(Climate-Data.Org, 2016). Kalgoorlie-Boulder receives 266mm (mean) annual rainfall, and
has annual temperature averages of 11.7°C (minimum) and 25.3°C (maximum) (BOM, 2016).

Page | 41
Figure 13: Kalgoorlie-Boulder location in Western Australia (2016, Google Maps)
The general location of Kalgoorlie-Boulder is presented above (Figure 12). The site is 593
kilometres by road, east of Perth, in the Goldfields of WA. The total land area of the local
government area (LGA) is 9,515,150 Ha, with 3.7% of that protected (Australian Bureau of
Statistics, 2015). This large area of land allows great potential for an approved (specific) site
location for a SPT plant, which has reasonably large land area requirements. However, the
town itself is close to the western border of the LGA, ideally, where the solar thermal plant
would be; in close proximity to the South West Interconnected System (SWIS), to avoid line
upgrade costs.
Page | 42
Kalgoorlie-Boulder, with its population of 33,763 (2013) (Australian Bureau of Statistics,
2015), is known for its rich gold mining history (which continues today), notably the ‘Super
Pit’ making its mark on the map. The super pit is the largest open-cut gold mine in Australia
(KCGM, 2016). The large gold mine and other numerous mines throughout the surrounding
area attract workers from all over the country. The mining industry (21% of employment) is
the backbone of this city (Australian Bureau of Statistics, 2015). Other notable industries, in
terms of employment percentages, are manufacturing (7.4%), construction (8.3%) and retail
trade (8.9%) (Australian Bureau of Statistics, 2015). A healthy local economy and available
workforce with accompanying infrastructure is important when considering how suitable a
CSP project is for the area.
The level of accessibility can limit many areas with good DNI if not logistically and
economically viable. The major highway (Great Eastern Hwy), along with rail, connects Perth
to the Goldfield’s city; allowing equipment transportation to site, and access for
maintenance and work force. Additionally, the city has an airport with direct flights to Perth,
Adelaide and Melbourne, as well as regional WA towns (Kalgoorlie Tourism, 2016).
The city is supplied water from the Goldfields Pipeline, which runs for 560km, from the
Mundaring Weir, in the Perth hills, east to Mount Charlotte Reservoir at Kalgoorlie (DoE,
Australia, 2016). Considering the requirement for water when regarding the power system’s
cooling and heliostat washing, this is an essential resource to have available.
Natural gas is supplied via the Goldfields gas pipeline from the Canarvan Basin in North
West WA, with an installed capacity of 130 TJ/day (Office of Energy, 2010). The long journey
the gas takes is to provide fuel for heating and electricity for the Goldfields region.

Page | 43
Interestingly, the main power plants that generate electricity for Kalgoorlie-Boulder and its
mines are fuelled by gas from this pipeline.
Importantly, the city is connected to the SWIS grid. The grid has 5134 MW of installed
generation capacity, supplying the south west, including Perth Metropolitan, with electricity
(AER, 2009). Western Power is the regional distributor providing electricity, while the mine
sites, mostly, generate their own power (CBK, 2013). The accessibility to the power grid is
what gives the SPT the ability of utility penetration, and the accompanying benefits.
Electricity consumption for Kalgoorlie-Boulder was 7,723,681 kWh (7.7 GWh) in the
2013/2014 financial year (7,740,806 kWh in 2012/13) (Wilson, 2014). This does not include
the operating mines, and is likely not the whole picture, as the GWh figure appears to be
low. The CBK 2013/14 report states that 65% of the consumption was from the Wastewater
Treatment Plant, Oasis Recreation Centre, Airport and Administration Building (Wilson,
2014). The city does not (necessarily) only receive electricity via the SWIS, it also feeds
electricity back into the SWIS at times. This is an important aspect of the SWIS Goldfields
city connection. The plant is not sized to merely supply Kalgoorlie-Boulder, but also the
surrounding mines and to feed into the connected south-west grid.
Kalgoorlie-Boulder Power Plants:
Synergy’s West Kalgoorlie Power Plant, gas/diesel, 62.8 MW rated capacity
(Department of Finance, 2016).
TransAlta Kalgoorlie Power Plant, gas/diesel, 68MW rated capacity (Department of
Finance, 2016).

Page | 44
Parkeston power plant, gas, 110 MW rated capacity (TransAlta, 2016). Fuelled by the
natural gas from North West WA via the Goldfields Gas Pipeline, the (TransAlta co-
owned) power plant provides mines sites in the area with electricity, and has
additional capacity for peak periods or base load back-up power (Seeley, 2015). It
also reinforces the Kalgoorlie-Boulder electricity supply through its SWIS grid
(TransAlta, 2016).
Renewable energy (electricity) facilities:
South Boulder Wastewater Treatment Plant’s 150 kW (ground mounted) Solar PV
system, completed in 2014, will offset approximately 584 MWh (of non-renewable
electricity consumption) and 440 tonnes of CO2 a year (CKB, 2016).
Oasis Recreation Centre 135kW Solar PV system will offset approximately 246 MWh
(of non-renewable electricity consumption) and 192 tonnes of CO2 each year (CKB,
2016). Funding received through the Low Energy Emissions Development (LEED)
Fund (CKB, 2016).
Proposed renewable energy (electricity) facilities:
Solar PV System for Kalgoorlie-Boulder Airport; potential 100 kW, currently being
investigated by the CKB, due to the airport having the third largest electricity
consumption in the city (Wilson, 2014).
Potential CSP plant of 115MW capacity, covering 700ha at the Mungari Industrial
Estate, 23km west of Kalgoorlie-Boulder, costing $600m, and employing 1500 people
during a three-year construction has been proposed by Exergy Power (Ely & Dulaney,
2015). According to the Kalgoorlie Miner, there is support from the Goldfields

Page | 45
Esperance Development Commission, Regional Development Australia Goldfields
Esperance, the WA Government’s Department of Finance and the Kalgoorlie-Boulder
Chamber of Commerce and Industry (Ely & Dulaney, 2015). Currently there is no
planned solar power tower or any other CSP project in the Goldfields, WA.
The favourable characteristics of Kalgoorlie-Boulder culminate in a site that is suited for a
utility-scale SPT with TES facility. The accessibility of services and infrastructure, the more
than adequate solar resources, together with a progressive local government, introducing
and proposing renewable energy technology, is a positive sign. Environmental measures
would need to ensure that the impact will be minimised and offsets explored. An increase to
the protected relatively minuscule protected land percentage to a considerable larger
amount could be a proposed option. The next question is to see how a modelled SPT system
performs at this site, under federal and state policies and incentives.
4.2 Modelled Utility-Scale Solar Power Tower with Storage System
4.2.1 Technical Output
The (SAM) modelled solar power tower with molten salt storage system’s technical
performance and characteristics (at Kalgoorlie-Boulder) is summarised in Table 4 below.
Table 4: Modelled base case SPT (with TES) technical summary (SAM)
Turbine net output 104 MW
Thermal energy storage (TES) 14 hours
Capacity factor 71.3%
Annual energy from the system (net) 646.6 GWh/year
Power cycle thermal efficiency 41.2%
Number of heliostats 11659
Annual water usage: cycle + mirror washing 120761 m3

Page | 46
Total land area 10.03 km2
Single heliostat area 144.38 m2
Total heliostat reflective area 1.70 km2
Tower height 223.22 m
Receiver height 24.61 m
HTF hot temperature 574 °C
HTF cold temperature 290 °C
HTF density 1808.48 kg/m3
Storage tank volume x 2 19137 m3
The amount of (estimated) energy from the system (per year) is one of the first results
looked at when determining the potential performance of the desired power plant. The
base case SPT generation of 646.6 GWh/year, is more than the city’s combined power
plants:
1.9 GWh/year, Synergy’s Kalgoorlie Gas Turbine peaking plant (Clean Energy
Regulator, 2015)
162 GWh/year, TransAlta’s Kalgoorlie Power Station (Clean Energy Regulator, 2015)
226 GWh/year, Goldfields Power/TransAlta’s Parkeston Power Plant (Clean Energy
Regulator, 2015). TransAlta states it as 433 GWh/year (TransAlta, 2016)
The estimated 646.6 GWh/year, from the modelled SPT, is similarly comparable to (SWIS
connected) Synergy’s Cockburn combined-cycle gas power plant of 658.2 GWh/year (Clean
Energy Regulator, 2015). Importantly, the SPT plant is without the 260,404 tonnes CO2-e
annually that the gas plant emits (Clean Energy Regulator, 2015).
The modelled SPT system would (also) achieve more output annually than the 110 MW
Crescent Dunes SPT facility, of predicted 500 GWh/year, when it fully ramps up. At 500
GWh, the Crescent Dunes (with 10 hours TES) plant is estimated to provide 75,000 homes
with power during peak times (Solar Reserve, Crescent Dunes, 2016). A SPT plant of that

Page | 47
capacity, can bring benefits to society, like the approximately 4,300 direct and indirect jobs
from Crescent Dunes (Solar Reserve, Crescent Dunes, 2016).
Installed capacity can be misleading metric, because power plants with storage and a high
capacity factor can also produce significant amounts of energy per year. Capacity Factor =
Net Annual Energy (kWh/year) / System Capacity (kW) / 8760 (hours/year). The base case
SPT’s high capacity factor (71.3%) is influenced by its 14 hours of TES, which raises it up into
a different category of power plant. According to the US EIA (2014), a capacity factor of
71.3% would be second only to nuclear, and similar to geothermal.
The results from the base case (Table 4) suggest the SPT system (at the site selected)
requires a large number of heliostats (11659, each 144.38 m2), covering a vast area, to
optimise output, including storage. The land area requirements (10.03 km2 ) are a challenge,
that other technologies do not have, yet, the vast governing area of the CBK (site) could
allow for the sizeable SPT facility. Solar field design codes and priorities will influence the
land area required for the facility. Tower height is (also) influenced by solar field design and
system size. The tower receiver height (223.22 m) will not be a subtle mark on the horizon.
The system requires water for cooling and mirror washing. The base case design uses an air-
cooled condenser that significantly reduces water demand. The relationship the plant has
with water use is explored in the sensitivity analyses (Table 8 and 9).
The HTF cold and hot temperature values (Table 4) are typical for (nitrite) molten salt
medium, importantly it is kept within a range that does not freeze the fluid or cause
instability. The large tank volume of the modelled SPT plant (for each of the two storage
tanks), is to allow enough molten salt TES for 14 hours. These tanks are a vital component of

Page | 48
the system, which enables it to provide smooth output, dispatchability, and capacity value
on the network.
Figure 14: Kalgoorlie-Boulder solar resource (DNI) and the 104 MW solar power tower (14 Hours TEM) energy output annual trend (SAM)
A SPT system in Kalgoorlie-Boulder, using the 104 MW (net) with 14 hours TES design, will
ultimately fluctuate throughout the year, as the DNI levels do. Figure 14 displays the
seasonal trend of DNI and the SPT output that is dependent on it. Therefore, the reduction
of DNI in winter (notably June) results in the SPT system output following suit, and
generating less energy than the summer months. This could be seen as a negative, when
compared to the steady fuel feed gas turbine plants. The reality is that the electricity
demands are not constant throughout the seasons. The summer months have higher
average DNI readings (and hence output), which complement summer peak air-conditioning
use.
0
10
20
30
40
50
60
70
80
0
50
100
150
200
250
300
Jan Feb Mar Apr May Jun Jul Aug Sep Oct Nov Dec
Ener
gy o
utp
ut
(GW
h)
Dir
ect
no
rmal
irra
dia
nce
(kW
/m2
)
Kalgoorlie-Boulder Solar Resource and the 104 MW SPT (14 hours TES) Energy Output Annual Trend
DNI
GWh
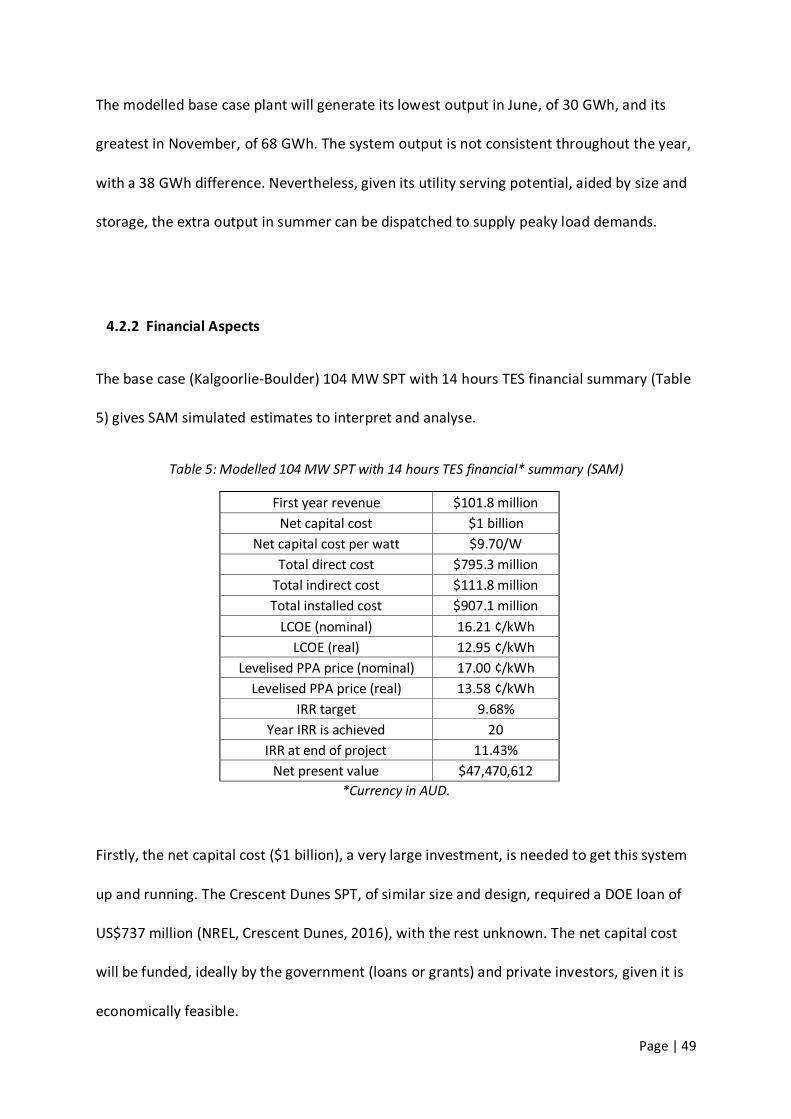
Page | 49
The modelled base case plant will generate its lowest output in June, of 30 GWh, and its
greatest in November, of 68 GWh. The system output is not consistent throughout the year,
with a 38 GWh difference. Nevertheless, given its utility serving potential, aided by size and
storage, the extra output in summer can be dispatched to supply peaky load demands.
4.2.2 Financial Aspects
The base case (Kalgoorlie-Boulder) 104 MW SPT with 14 hours TES financial summary (Table
5) gives SAM simulated estimates to interpret and analyse.
Table 5: Modelled 104 MW SPT with 14 hours TES financial* summary (SAM)
First year revenue $101.8 million
Net capital cost $1 billion
Net capital cost per watt $9.70/W
Total direct cost $795.3 million
Total indirect cost $111.8 million
Total installed cost $907.1 million
LCOE (nominal) 16.21 ¢/kWh
LCOE (real) 12.95 ¢/kWh
Levelised PPA price (nominal) 17.00 ¢/kWh
Levelised PPA price (real) 13.58 ¢/kWh
IRR target 9.68%
Year IRR is achieved 20
IRR at end of project 11.43%
Net present value $47,470,612
*Currency in AUD.
Firstly, the net capital cost ($1 billion), a very large investment, is needed to get this system
up and running. The Crescent Dunes SPT, of similar size and design, required a DOE loan of
US$737 million (NREL, Crescent Dunes, 2016), with the rest unknown. The net capital cost
will be funded, ideally by the government (loans or grants) and private investors, given it is
economically feasible.
Page | 50
Assuming that the modelled power plant’s (AUD) LCOE (nominal) of 16.21c/kWh, and real
LCOE of 12.95c/kWh (depending on if it’s policy or project driven) is the same in USD, then it
is at the lower end of range in Figure 5, section 2.5. When comparing the real LCOE, it
matches the 2013 SunShot (USD) LCOE of 13c/kWh (Figure 6); otherwise, it is only 3.21c off
nominal (also assuming the modelled plant’s AUD values are the same in the US, as
mentioned in the methods section). Comparing LCOEs creates assumptions, and in the case
of this research it is better used to look at its sensitivity to other variables (in the next sub-
section). Even so, if this LCOE value is to be taken as plausible, then it still requires further
downward pressure in order to achieve a value in the fossil fuel range, and the availability of
LGCs and other policy mechanisms to readily achieve a viable PPA. What this actually may
mean in terms of its economic feasibility potential is discussed later.
The PPA, which is what will be required for a project of this type and cost, needs to be
greater than the LCOE value. The levelised PPA outcome from the modelling is set according
the IRR (which is set at the nominal discount rate). If a PPA of this price were achievable for
the Kalgoorlie-Boulder SPT then it would reach its internal rate of return IRR target of 9.8%
in year 20, and be 11.42% at the end of analysis period (year 25). The SPT IRR indicates a
potentially worthy investment, given a PPA is signed and capital investment secured.

Page | 51
Figure 15: Solar power tower (modelled) direct capital costs broken down into percentage (SAM)
Total direct costs take up most of the required funds compared to the indirect costs (of
engineering, procurement and land costs). The direct capital cost of the modelled SPT
power plant (Figure 15) will dictate overall financing, as it plays a major role in the overall
lifetime costs for renewable energy projects, since fuel costs are zero. Illustrated by Figure
15, the SPT’s sub-systems of heliostats, storage, receiver, tower and power cycle, contribute
75% of the direct capital. Heliostats cost, contributing 36% of the direct capital cost is the
largest fraction, and in line with expectations noted in section 2.5. The 15% of costs
attributed to balance of plant (BOP), site improvement (preparation) and contingency have
less influential weight.
Reducing direct costs is an obvious way to affect the overall cost of the system, therefore
increasing financial attractiveness and decreasing LCOE. The (U.S.) SunShot Initiative aims to
reduce the main sub-system costs significantly, whilst in parallel, increase their performance
and efficiencies through innovations; in turn further driving the cost of energy for the
Tower 4%
Heliostats 36%
Storage 13%
Receiver 15% Power cycle
17%
Site improvement
3%
BOP 5%
Contingency 7%
Other 15%
Solar Power Tower Direct Capital Cost Breakdown
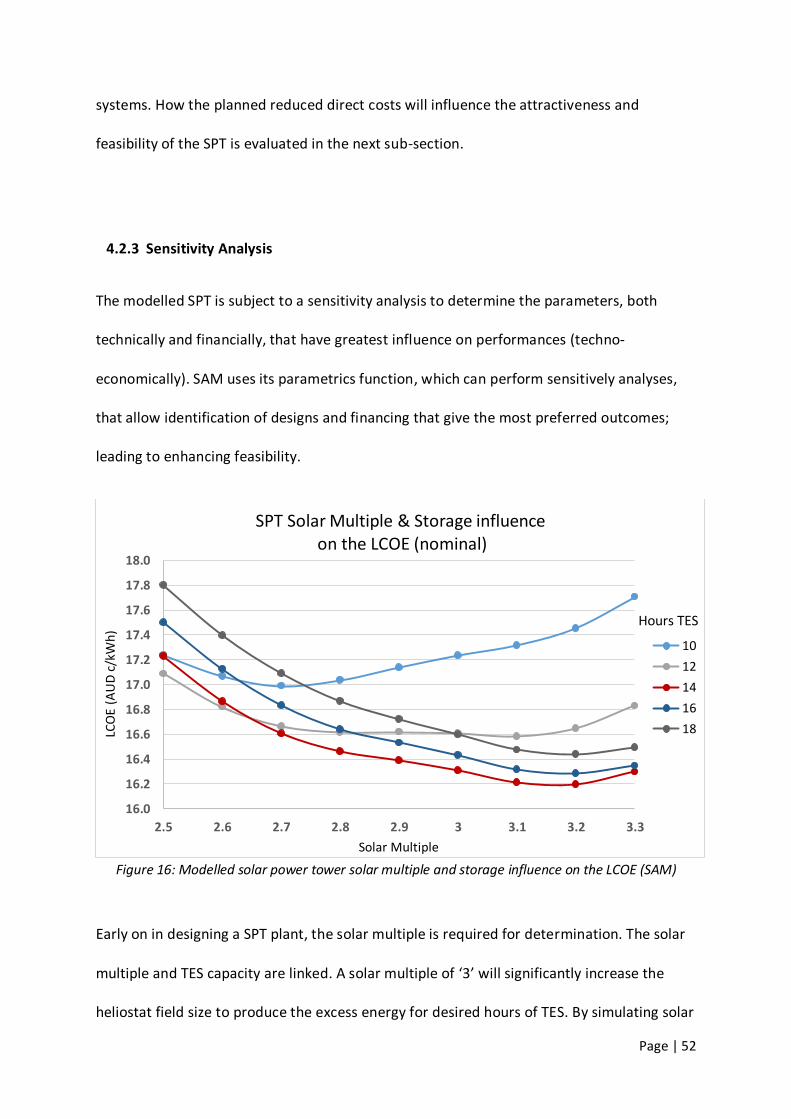
Page | 52
systems. How the planned reduced direct costs will influence the attractiveness and
feasibility of the SPT is evaluated in the next sub-section.
4.2.3 Sensitivity Analysis
The modelled SPT is subject to a sensitivity analysis to determine the parameters, both
technically and financially, that have greatest influence on performances (techno-
economically). SAM uses its parametrics function, which can perform sensitively analyses,
that allow identification of designs and financing that give the most preferred outcomes;
leading to enhancing feasibility.
Figure 16: Modelled solar power tower solar multiple and storage influence on the LCOE (SAM)
Early on in designing a SPT plant, the solar multiple is required for determination. The solar
multiple and TES capacity are linked. A solar multiple of ‘3’ will significantly increase the
heliostat field size to produce the excess energy for desired hours of TES. By simulating solar
16.0
16.2
16.4
16.6
16.8
17.0
17.2
17.4
17.6
17.8
18.0
2.5 2.6 2.7 2.8 2.9 3 3.1 3.2 3.3
LCO
E (A
UD
c/k
Wh
)
Solar Multiple
SPT Solar Multiple & Storage influence on the LCOE (nominal)
10
12
14
16
18
Hours TES
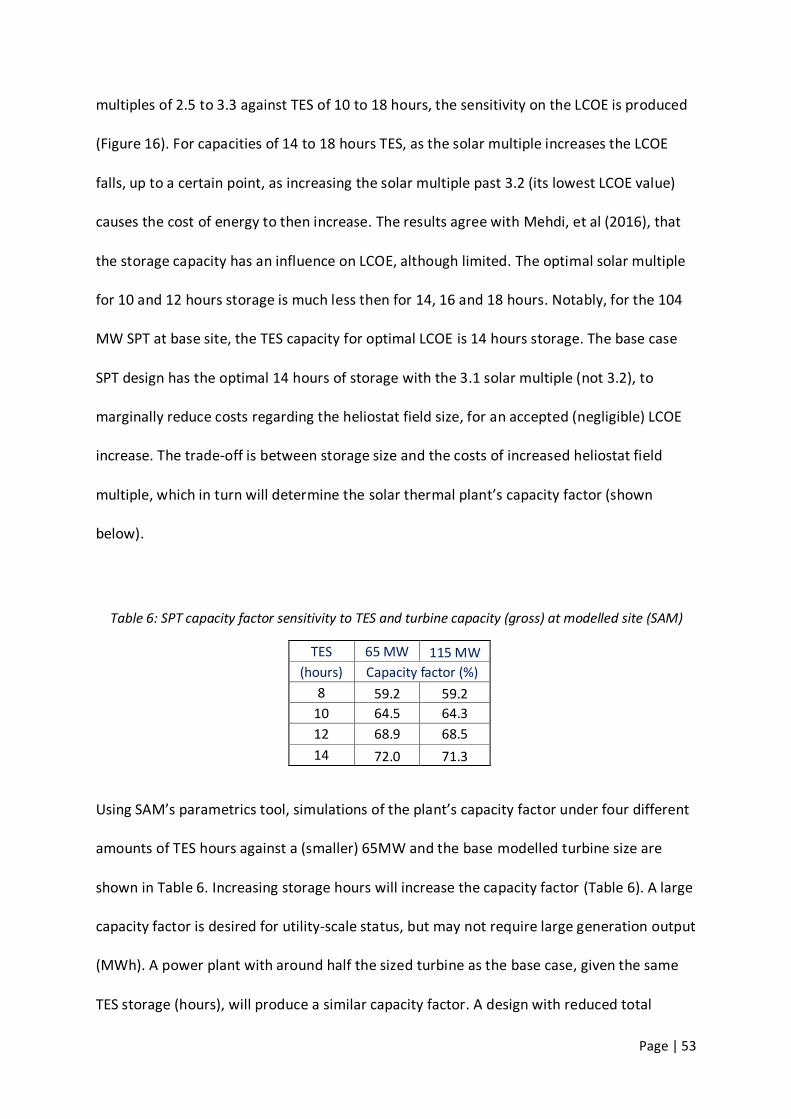
Page | 53
multiples of 2.5 to 3.3 against TES of 10 to 18 hours, the sensitivity on the LCOE is produced
(Figure 16). For capacities of 14 to 18 hours TES, as the solar multiple increases the LCOE
falls, up to a certain point, as increasing the solar multiple past 3.2 (its lowest LCOE value)
causes the cost of energy to then increase. The results agree with Mehdi, et al (2016), that
the storage capacity has an influence on LCOE, although limited. The optimal solar multiple
for 10 and 12 hours storage is much less then for 14, 16 and 18 hours. Notably, for the 104
MW SPT at base site, the TES capacity for optimal LCOE is 14 hours storage. The base case
SPT design has the optimal 14 hours of storage with the 3.1 solar multiple (not 3.2), to
marginally reduce costs regarding the heliostat field size, for an accepted (negligible) LCOE
increase. The trade-off is between storage size and the costs of increased heliostat field
multiple, which in turn will determine the solar thermal plant’s capacity factor (shown
below).
Table 6: SPT capacity factor sensitivity to TES and turbine capacity (gross) at modelled site (SAM)
TES 65 MW 115 MW
(hours) Capacity factor (%)
8 59.2 59.2
10 64.5 64.3
12 68.9 68.5
14 72.0 71.3
Using SAM’s parametrics tool, simulations of the plant’s capacity factor under four different
amounts of TES hours against a (smaller) 65MW and the base modelled turbine size are
shown in Table 6. Increasing storage hours will increase the capacity factor (Table 6). A large
capacity factor is desired for utility-scale status, but may not require large generation output
(MWh). A power plant with around half the sized turbine as the base case, given the same
TES storage (hours), will produce a similar capacity factor. A design with reduced total
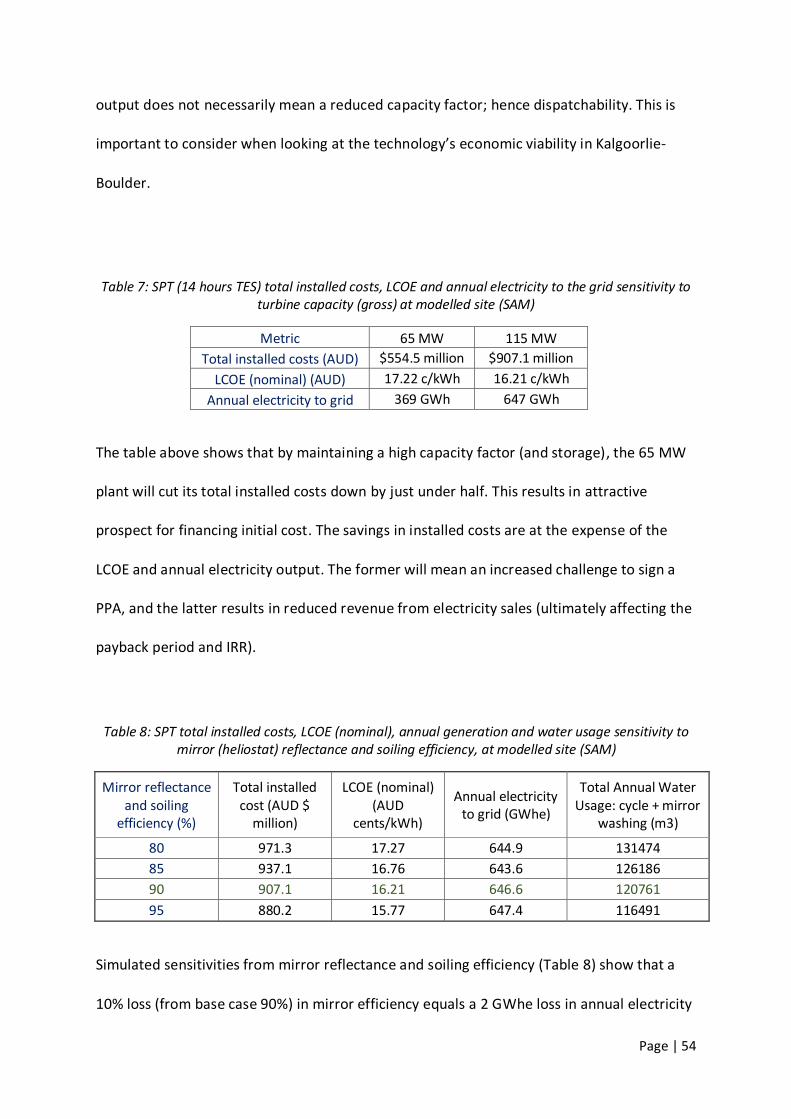
Page | 54
output does not necessarily mean a reduced capacity factor; hence dispatchability. This is
important to consider when looking at the technology’s economic viability in Kalgoorlie-
Boulder.
Table 7: SPT (14 hours TES) total installed costs, LCOE and annual electricity to the grid sensitivity to turbine capacity (gross) at modelled site (SAM)
Metric 65 MW 115 MW
Total installed costs (AUD) $554.5 million $907.1 million
LCOE (nominal) (AUD) 17.22 c/kWh 16.21 c/kWh
Annual electricity to grid 369 GWh 647 GWh
The table above shows that by maintaining a high capacity factor (and storage), the 65 MW
plant will cut its total installed costs down by just under half. This results in attractive
prospect for financing initial cost. The savings in installed costs are at the expense of the
LCOE and annual electricity output. The former will mean an increased challenge to sign a
PPA, and the latter results in reduced revenue from electricity sales (ultimately affecting the
payback period and IRR).
Table 8: SPT total installed costs, LCOE (nominal), annual generation and water usage sensitivity to mirror (heliostat) reflectance and soiling efficiency, at modelled site (SAM)
Mirror reflectance and soiling
efficiency (%)
Total installed cost (AUD $
million)
LCOE (nominal) (AUD
cents/kWh)
Annual electricity to grid (GWhe)
Total Annual Water Usage: cycle + mirror
washing (m3)
80 971.3 17.27 644.9 131474
85 937.1 16.76 643.6 126186
90 907.1 16.21 646.6 120761
95 880.2 15.77 647.4 116491
Simulated sensitivities from mirror reflectance and soiling efficiency (Table 8) show that a
10% loss (from base case 90%) in mirror efficiency equals a 2 GWhe loss in annual electricity
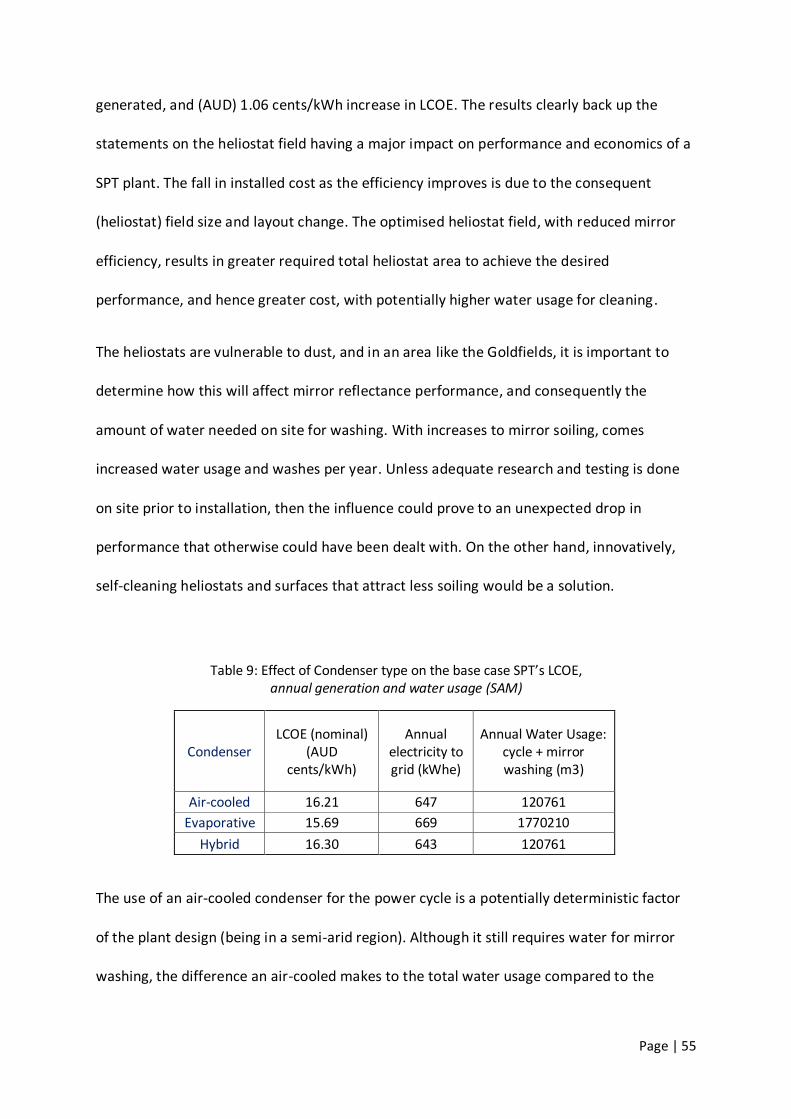
Page | 55
generated, and (AUD) 1.06 cents/kWh increase in LCOE. The results clearly back up the
statements on the heliostat field having a major impact on performance and economics of a
SPT plant. The fall in installed cost as the efficiency improves is due to the consequent
(heliostat) field size and layout change. The optimised heliostat field, with reduced mirror
efficiency, results in greater required total heliostat area to achieve the desired
performance, and hence greater cost, with potentially higher water usage for cleaning.
The heliostats are vulnerable to dust, and in an area like the Goldfields, it is important to
determine how this will affect mirror reflectance performance, and consequently the
amount of water needed on site for washing. With increases to mirror soiling, comes
increased water usage and washes per year. Unless adequate research and testing is done
on site prior to installation, then the influence could prove to an unexpected drop in
performance that otherwise could have been dealt with. On the other hand, innovatively,
self-cleaning heliostats and surfaces that attract less soiling would be a solution.
Table 9: Effect of Condenser type on the base case SPT’s LCOE, annual generation and water usage (SAM)
Condenser LCOE (nominal)
(AUD cents/kWh)
Annual electricity to grid (kWhe)
Annual Water Usage: cycle + mirror washing (m3)
Air-cooled 16.21 647 120761
Evaporative 15.69 669 1770210
Hybrid 16.30 643 120761
The use of an air-cooled condenser for the power cycle is a potentially deterministic factor
of the plant design (being in a semi-arid region). Although it still requires water for mirror
washing, the difference an air-cooled makes to the total water usage compared to the
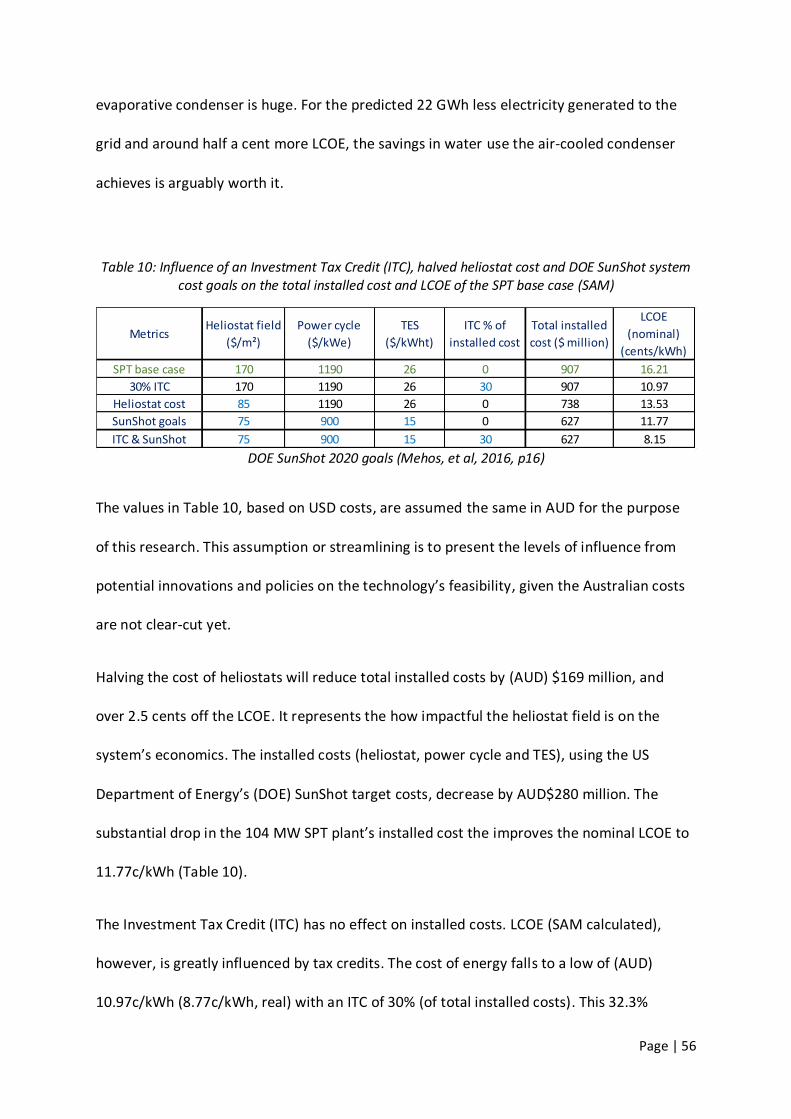
Page | 56
evaporative condenser is huge. For the predicted 22 GWh less electricity generated to the
grid and around half a cent more LCOE, the savings in water use the air-cooled condenser
achieves is arguably worth it.
Table 10: Influence of an Investment Tax Credit (ITC), halved heliostat cost and DOE SunShot system cost goals on the total installed cost and LCOE of the SPT base case (SAM)
DOE SunShot 2020 goals (Mehos, et al, 2016, p16)
The values in Table 10, based on USD costs, are assumed the same in AUD for the purpose
of this research. This assumption or streamlining is to present the levels of influence from
potential innovations and policies on the technology’s feasibility, given the Australian costs
are not clear-cut yet.
Halving the cost of heliostats will reduce total installed costs by (AUD) $169 million, and
over 2.5 cents off the LCOE. It represents the how impactful the heliostat field is on the
system’s economics. The installed costs (heliostat, power cycle and TES), using the US
Department of Energy’s (DOE) SunShot target costs, decrease by AUD$280 million. The
substantial drop in the 104 MW SPT plant’s installed cost the improves the nominal LCOE to
11.77c/kWh (Table 10).
The Investment Tax Credit (ITC) has no effect on installed costs. LCOE (SAM calculated),
however, is greatly influenced by tax credits. The cost of energy falls to a low of (AUD)
10.97c/kWh (8.77c/kWh, real) with an ITC of 30% (of total installed costs). This 32.3%
MetricsHeliostat field
($/m²)
Power cycle
($/kWe)
TES
($/kWht)
ITC % of
installed cost
Total installed
cost ($ million)
LCOE
(nominal)
(cents/kWh)
SPT base case 170 1190 26 0 907 16.21
30% ITC 170 1190 26 30 907 10.97
Heliostat cost 85 1190 26 0 738 13.53
SunShot goals 75 900 15 0 627 11.77
ITC & SunShot 75 900 15 30 627 8.15

Page | 57
reduction in LCOE by a tax credit is the type of incentive required in WA for CSP projects to
become competitive.
Assuming the Australian Government (post 2016 election) implements a similar tax credit
deal, to the US, and the DOE SunShot targeted costs are (similarly) replicated in Australia,
then the cost of energy for a SPT system of this modelled design at Kalgoorlie-Boulder will
‘close the gap’. A LCOE of (AUD) 8.15c/kWh was simulated for that scenario. It would place
it in the broad range of the competition-fossil fuels.
4.2.4 Enhancing Feasibility through the Utility
A large capacity factor means a large number of hours (per year) that the plant can produce
electricity, whereas dispatchability is the ability to provide electricity on the operator’s
demand (IEA-ETSAP and IRENA, 2013). Those traits, along with scale, means a SPT plant can
operate as a base-load plant, like Gemasolar, the world’s first (SolarPACES et al, 2016). This
is important when evaluating the potential for a SPT plant as a grid-connected commercial
plant. If the modelled (molten salt) SPT plant for Kalgoorlie-Boulder is considered feasible,
then it is worth exploring the benefits from the (SWIS) utility.
For the power plant to receive revenue and ultimately be viable, a Power Purchase
Agreement (PPA) is the likely avenue to be had, given there is no feed-in tariff (FiT) for large
power generation in WA. The LCOE should not be greater than the PPA. The PPA bundle
needs to be considered from the utility (off-taker); given the plant is SWIS grid connected.
The SWIS market average (electricity) price is approximately (AUD) $50/Mwah, or 5
cents/kWh (ITP, 2012). The gap needs to close, as the modelled SPT LCOE (nominal) of
Page | 58
(AUD) 16.21c/kWh is too high. The LRCs and capacity credits then come into play. The price
of capacity credits are evaluated to be $178,477/MW/year (AMEO, 2015) from WA’s
Wholesale Energy Market (WEM). With a similar price, ITP (2012) determined by earning
90% of that rate it would equate to (AUD) $20/MWh.
Adding together the capacity credit and the market electricity price will equate to (AUD)
$70/MWh. The PPA can then determine the amount ($/MWh) needed to close the gap.
Comparing with the base case SPT LCOE (AUD 16.21c/kWh), it would fall 9.21c short. The
PPA would close this by using the LGCs. If, we assume, the LGC contract price is similar to
the $80/MWh spot price (as mentioned in section 2.6), then the PPA would come to
$15/MWh (15c/kWh). The (AUD) 1.21c short is much more manageable, and indicates how
close the gap could be (albeit using assumptions).
Interestingly, if the modelled analyses in Table 10 are to be considered possible outcomes in
the (near) future, then the viability changes positively. The PPA go close to (AUD) 11c/kWh if
the SPT was subject to a 30% ITC incentive; 4c clear of the mark. This falls even further if
using SunShot (certain) cost targets and the ITC. The system would only need to acquire a
PPA of over (AUD) 8.15c/kWh; the same as the spot price for LGCs currently. It is worth
noting that the externalities the fossil fuel plants are avoiding is keeping their LCOE low.
5 Conclusion and Recommendations
In summary, the technical feasibility of a utility-scale SPT (with molten salt), has been
proven by the recent likes of the Crescent Dunes plant. Utilising SAM to simulate a SPT plant
in Kalgoorlie-Boulder resulted in clear outcomes suggesting it will be feasible. The financial

Page | 59
aspects of the modelled SPT system relied on many variables and assumptions, given there
is no plant operating in the region to compare with, the economic performance was not far
‘off the mark’ for what could be considered viable. The purpose was not the produce
financial values to be critiqued, rather, developing ways to analyse the sensitivity of the SPT
system, in order to learn its strengths and weaknesses. From this, the economic feasibility
can be evaluated.
Putting attention into the heliostat field for positive returns has been well documented, and
the results confirmed this. The heliostat field is the most sensitive component of the system.
Great care is required in the design and importantly the ongoing operational maintenance
for it to work at its optimal. As seen by the results, a small decrease in heliostat efficiency
has a relatively large affect.
If by the end of this decade the SunShot goals are achieved, and they are transferred and
replicated in Australia, then it is likely a utility-scale SPT will attract investors. Currently, with
limited policy mechanisms to drive the industry, there is no capacity to locally ‘mature’ the
technology. For CSP to thrive in Australia, it is not the solar resource alone that will carry it.
It is recommended that a government ITC incentive be proposed. This may (currently)
appear less likely to be introduced than other mechanisms (such as FiTs) in Australia,
however the influence it has on LCOE is significant enough to ‘close the gap’. With an
election looming, there is potential for new policies to be passed, if given the chance. A
federal FiT system for large renewable energy projects should be considered. Enhancing the
economic feasibility of a SPT plant in Kalgoorlie-Boulder requires strong Government
support, along with significant private investment, to aid development and showcase its
potential.

Page | 60
Future research is required, notably in the transmission capabilities of the SWIS from
Kalgoorlie-Boulder. This research did not include study of the grid capacity limits, nor costs
involved if upgrades are needed. Further research is required in the latest designs and
innovations. Alternative HTF and high temperature cycle systems will offer more diversity in
the industry, with possibilities of much larger systems with greater performances. The
future is bright for this technology, and the sooner Government and the private sector get
on board the better it will be for further innovations. Driving the CSP market and setting up
an industry in Australia will benefit society, environment and the economy locally and
abroad.
Page | 61
6 References
AER (Australian Energy Regulator). (2009). Chapter 4: Beyond the National Electricity
Market. State of the Energy Market 2009 https://www.aer.gov.au/.
Australian Bureau of Statistics. (2015). Kalgoorlie/Boulder (C) (LGA). Retrieved in march
2016 from http://stat.abs.gov.au/
Australian Solar Thermal Energy Association (AUSTELA). (2014). “A selection of solar data
files for input to SAM for selected representative Australian sites and years”. Retrieved from
http://austela.org.au/projects
Australian Energy Market Operator (AEMO). (2015). Final Report: 2016 Maximum Reserve
Capacity Price for the 2018-19 Capacity Year for the Wholesale Electricity Market. Retrieved
from http://wa.aemo.com.au/docs/default-source/default-document-library/final-report-
maximum-reserve-capacity-price-for-the-2018-19-capacity-year.pdf?sfvrsn=0
Behar, O., Khellaf, A., & Mohammedia, K. (2013). A review of studies on central receiver
solar thermal power plants. Renewable and Sustainable Energy Reviews, 23, 12-39.
Besarati, S. M. & Goswami, D. Y. (2014). A computationally efficient method for the design
of the heliostat field for solar power tower plant. Renewable Energy, 69, 226-232.
Beyond Zero Emissions. (2012). Repowering Port Augusta. A blueprint to replace Northern
and Playford B coal power stations with renewable energy. Retrieved from
http://media.bze.org.au/Repowering_PortAugusta.pdf

Page | 62
Bureau of Meteorology (BOM). (2016). Climate statistics for Australian locations. Kalgoorlie-
Boulder Airport. Australian Government. Retrieved in June 2016 from
http://www.bom.gov.au/climate/averages/tables/cw_012038.shtml
Carbon Reduction Ventures. (2015). Update: Hybrid Concentrated Solar Thermal Power
Project. Retrieved from http://www.carbonreduction.com.au/category/information/
City of Kalgoorlie-Boulder (CBK). (2016). Energy. Your Council, Your City – City and
community – Sustainability. Retrieved from http://www.ckb.wa.gov.au/.
City of Kalgoorlie-Boulder (CBK). (2013). Local Planning Strategy shaping our future 2013 –
2033. Retrieved from http://www.planning.wa.gov.au/
Clean Energy Council. (2014). Clean Energy Australia Report 2014. Retrieved from
cleanenergycouncil.org.au
Clean Energy Council. (2014). Renewable Energy Target. Retrieved from
https://www.cleanenergycouncil.org.au/policy-advocacy/renewable-energy-target.html
Clean Energy Regulator. (2015). Australian Government. “Designated generation facilities
report 2014-15”. Retrieved from
www.cleanenergyregulator.gov.au/DocumentAssets/Pages/Designated-generation-
facilities-report-2014-15.aspx.
Climate Action. (2015). COP21. Sustainable Innovation Forum 2015. Retrieved from
http://www.cop21paris.org/about/cop21

Page | 63
Climate Action Tracker. (2015). The Coal Gap: planned coal-fired power plants inconsistent
with 2˚C and threaten achievement of INDCs. Retrieved from
climateactiontracker.org/assets/.../CAT_Coal_Gap_Briefing_COP21.pdf
Climate Council of Australia. (2014). The Australian Renewable Energy Race: Which States
Are Winning Or Losing? Retrieved from
http://www.climatecouncil.org.au/uploads/ee2523dc632c9b01df11ecc6e3dd2184.pdf
Climate-Data.Org. (2016). Climate: Kalgoorlie. Accessed June 2016. Retrieved from
http://en.climate-data.org/location/656/
CSP World. (2015). CSP World Map. Retrieved from http://www.cspworld.org/cspworldmap
Collado, F. J. & Guallar, J. 2013. A review of optimized design layouts for solar power tower
plants with campo code. Renewable and Sustainable Energy Reviews, 20, 142-154.
Asbjerb, M. (2015). Price volatility in Large-scale Generation Certificates over 2015 - what is
the outlook for 2016? Energetics. Retrieved from
http://www.energetics.com.au/resources/latest-news/climate-change-matters/price-
volatility-in-large-scale-generation-certifi
Department of the Environment (DoE). (2016). National Heritage Places – The Goldfields
Water Supply Scheme. Australian Government. Retrieved from
https://www.environment.gov.au/heritage/places/national/goldfields
Department of Finance. (2016). Generation. Public Utilities Office – Energy in WA –
Electricity. Government of Western Australia Retrieved from
http://www.finance.wa.gov.au/.
Page | 64
DOE. (U.S. Department of Energy). (2014). Tackling challenges in solar: 2014 portfolio.
SunShot Initiative. Retrieved from
http://energy.gov/sites/prod/files/2014/08/f18/2014_SunShot_Initiative_Portfolio8.13.14.p
df
DOE (U.S. Department of Energy). (2016). Improved Concentrating Solar Power Systems.
Energy Innovation Portal. Retrieved from
http://techportal.eere.energy.gov/technology.do/techID=1316
Dun, R. I., Hearps, P. J. & Wright, M. H. (2012). Molten-Salt Power Towers- Newly
Commercial Concentrating Solar Storage. Proceedings of the IEEE, 100(2).
Ely, J. & Dulaney M. (2015). Goldfields solar power hub plan revived. Kalgoorlie Miner.
Retrieved from
https://au.news.yahoo.com/thewest/regional/goldfields/a/26240324/goldfields-solar-
power-hub-plan-revived/
Google Maps. (2016). Kalgoorlie. Retrieved from
https://www.google.com.au/maps/place/Kalgoorlie+WA+6430/@-
30.7517896,121.4512242,14z/data=!3m1!4b1!4m5!3m4!1s0x2a4d67b7d4d4e4e1:0x500f63
8247a1600!8m2!3d-30.749!4d121.466
Green Energy Markets. (2016). Market prices (spot). Retrieved from
http://greenmarkets.com.au/
Hunter, S. R., Smith, B. D., Polizos, G., Schaeffer, D. A., Lee, D. F. & Datskos, P. G. (2014).
Low cost anti-soiling coatings for CSP collector mirrors and heliostats. Proc. SPIE 9175, High
Page | 65
and Low Concentrator Systems for Solar Energy Applications IX, 91750J.
doi:10.1117/12.2061845.
Ho, C. K. & Iverson. (2014). Review of high-temperature central receiver designs for
concentrating solar power. Renewable and Sustainable Energy Reviews, 29, 835-846.
IEA-ETSAP and IRENA. (2013). Concentrating Solar Power. Technology Brief E10.
www.irena.org/Publications
Investopedia. (2016). Net Present Value – NPV. Retrieved from
http://www.investopedia.com/terms/n/npv.asp
International Renewable Energy Agency (IRENA). (2012). Concentrating Solar Power.
Renewable Energy Technologies: Cost Analysis Series. Retrieved from
http://www.irena.org/documentdownloads/publications/re_technologies_cost_analysis-
csp.pdf
International Renewable Energy Agency (IRENA). (2015). Renewable Power Generation
Costs in 2014. Retrieved from
http://www.irena.org/menu/index.aspx?mnu=Subcat&PriMenuID=36&CatID=141&SubcatID
=494
ITP (IT Power). (2012). Realising the Potential of Concentrating Solar Power in Australia.
Prepared for Australian Solar Institute. Retrieved from http://www.itpower.co.uk/our-
sectors/solar-energy/concentrated-solar-power-csp/
Kalgoorlie Tourism. (2016). Airport. Retrieved from
http://www.kalgoorlietourism.com/kalgoorlie-airport

Page | 66
Kearney, D. (2013). Utility-Scale Power Tower Solar: Performance Acceptance Test
Guidelines. NREL (National Renewable Energy Laboratory). www.nrel.gov
KCGM. (2016). The Super Pit. Retrieved from http://superpit.com.au/
Kistler, B. L. (1986). A User's Manual for DELSOL3: A Computer Code for Calculating the
Optical Performance and Optimal System Design for Solar Thermal Central Receiver Plants.
Sandia Report. Sandia National Laboratories.
Kraemer, S. (2016). How Ivanpah solar tower plant raised its performance in second year.
Reneweconomy. Retrieved from http://reneweconomy.com.au/2016/how-ivanpah-solar-
tower-plant-raised-its-performance-in-second-year-74219
Kraemer, S. (2015). One Weird Trick Prevents Bird Deaths At Solar Towers. CleanTechica.
Retrieved from http://cleantechnica.com/2015/04/16/one-weird-trick-prevents-bird-
deaths-solar-towers/
Liu, M., Tay, N. H. S., Bell, S., Belusko, M., Jacob, R., Will G., Saman, W. & Bruno, F. (2016).
Review on concentrating solar power plants and new developments in high temperature
thermal energy storage technologies. Renewable and Sustainable Energy Reviews, 53, 1411-
1432.
Lovegrove, K., Franklin, S. & Elliston, B. (2014). Australian Companion Guide to SAM for
Concentrating Solar Power. Australian Solar Thermal Energy Association (AUSTELA) & IT
Power (ITP). Retrieved from
http://www.austela.com.au/docs/projects/sam/SAM_for_Aus_Companion_Guide_2014030
6.pdf
Page | 67
Mai, T., Cole, W., Lantz, E., Marcy, C. & Sigrin, B. (2016). Impacts of Federal Tax Credit
Extensions on Renewable Deployment and Power Sector Emissions. NREL (National
Renewable Energy Laboratory). Retrieved from
http://www.nrel.gov/docs/fy16osti/65571.pdf
Mehos, M., Turchi, C., Jorgenson, J., Denholm, P., Ho, C. & Armijo. (2016). Advancing
Concentrating Solar Power Technology, Performance, and Dispatchability. On the Path the
SunShot. DOE (U.S. Department of Energy) Powered by SunShot, Sandia National
Laboratories & NREL (National Renewable Energy Laboratory. Retrieved from
http://energy.gov/eere/sunshot/downloads/advancing-concentrating-solar-power-
technology-performance-and
Meybodi, M. A. & Beath, A. C. (2016). Impact of cost uncertainties and solar data variations
on the economics of central receiver solar power plants: An Australian case study.
Renewable Energy, 93, 510-524.
Mutuberria, A., Pascual, J., Guisado, M. V. & F. Mallor, F. (2015). Comparison of Heliostat
Field Layout Design Methodologies and Impact on Power Plant Efficiency. ScienceDirect, 69,
1360-1370.
NASA. (2016). NASA Surface meteorology and Solar Energy - Available Tables. Geometery
Information. Atmospheric Science Data Center. Retrieved form
https://eosweb.larc.nasa.gov.
National Renewable Energy Laboratory (NREL). (2014). System Advisor Model (SAM).
Retrieved from https://sam.nrel.gov/
Page | 68
Noone, C. J., Torrilhon, M. & Mitsos, A. (2012). Heliostat field optimization- A new
computationally efficient model & biomimetic layout. SciVerse ScienceDirect, 86, 792-803.
NREL (National Renewable Energy Laboratory). (2016a). Concentrating Solar Power Projects.
Crescent Dunes Solar Energy Project. Retrieved from
http://www.nrel.gov/csp/solarpaces/project_detail.cfm/projectID=60
NREL (National Renewable Energy Laboratory). (2016b). Concentrating Solar Power Projects.
Gemasolar Thermosolar Plant. Retrieved from
http://www.nrel.gov/csp/solarpaces/project_detail.cfm/projectID=40
NREL (National Renewable Energy Laboratory). (2016c). Concentrating Solar Power Projects
by Technology. Power Tower Systems. Retrieved on April 2016, from
http://www.nrel.gov/csp/solarpaces/by_technology.cfm
NREL (National Renewable Energy Laboratory). (2016d). Distributed Generation Renewable
Energy Estimate of Costs (updated February 2016). Energy Analysis. Retrieved from
http://www.nrel.gov/analysis/tech_lcoe_re_cost_est.html
Office of Energy. (2010). Energy Resources and Infrastructure. Government of Western
Australia. Retrieved from https://www.finance.wa.gov.au/
Parkinson, G. (2016). SolarReserve proposes 110MW solar tower and storage plant for
Australia. REneweconomy. http://reneweconomy.com.au/2016/solarreserve-proposes-
110mw-solar-tower-and-storage-plant-for-australia-16693
Page | 69
Pfleger, N., Bauer, T., Martin, C., Eck, M. & Worner, A. (2015). Thermal energy storage -
overview and specific insight into nitrate salts for sensible and latent heat storage. Beilstein
Journal of Nanotechnology, 6, 1437-1497.
Power from the Sun. (2016 accessed). Central Receiver Systems. Chapter 10. Retrieved on
March 2016 from
http://www.powerfromthesun.net/Book/chapter10/chapter10.html#10.2%20%20%20Syste
m%20Thermal%20Performance
REN21. (2015). Renewable 2015 Global Status Report. Retrieved from
http://www.ren21.net/status-of-renewables/global-status-report/
Roam Consulting. (2014). RET policy analysis. Reported to Clean Energy Council. Retrieved
from https://www.cleanenergycouncil.org.au/policy-advocacy/renewable-energy-
target/ret-policy-analysis.html
Romero, M. & Gonzalez-Aguilar, J. (2014). Solar thermal CSP technology. Wiley
Interdisciplinary Reviews. Energy & Environment, 3, 42-59.
Seeley, R. (2015). The Australian Energy Review. Powering WA Industry. Retrieved from
http://australianenergyreview.com.au/.
Solargis. (2016). Solar resource maps for Australia. Retrieved from
http://solargis.com/products/maps-and-gis-data/free/download/australia
SolarPACES. (2016). Solar Power Tower. CSP – How it Works. Retrieved on April 2016 from
http://www.solarpaces.org/csp-technology
SolarPACES. (2016). Spain. Retrieved from www.solarpaces.org/country-information/spain
Page | 70
SolarPACES, Greenpeace & ESTELA. (2016). Solar Thermal Electricity Global Outlook 2016.
Retrieved from http://www.solarpaces.org/press-room/news/item/98-new-solar-thermal-
electricity-report
Solar Reserve. (2016). Crescent Dunes. Retrieved from
http://www.solarreserve.com/en/global-projects/csp/crescent-dunes
Solar Reserve. (2016). Molten Salt Tower Receiver. Retrieved from
http://www.solarreserve.com/en/technology/molten-salt-tower-receiver
Sweet, C. (2016). Ivanpah Solar Plant May Be Forced to Shut Down. The Wall Street Journal.
Retrieved from http://www.wsj.com/articles/ivanpah-solar-plant-may-be-forced-to-shut-
down-1458170858
Torresol Energy. (2014). Project: Gemasolar. Case Study. Retrieved on April 2016 from
www.torresolenergy.com/EPORTAL.../torresol-energy-press-dossier.pdf
TransAlta. (2016). Parkeston. Plants in Operation. Retrieved from
http://www.transalta.com/facilities/plants-operation/parkeston.
U.S. Energy Information Administration (EIA). (2016). Crescent Dunes concentrating solar
plant begins producing electricity. Retrieved from
http://www.eia.gov/todayinenergy/detail.cfm?id=25212
Whitlock, R. (2016). Keeping desert solar power arrays free of dust. Interesting Engineering.
Retrieved from http://interestingengineering.com/keeping-desert-solar-power-arrays-free-
dust/

Page | 71
Webby, B. (2013). Sensitivity analysis for concentrating solar power technologies. 20th
International Congress on Modelling and Simulation, Adelaide, Australia. Retrieved from
http://www.mssanz.org.au/modsim2013/G1/webby.pdf
Wei, Z., Lu, Z., Yu, W. & Wang, Z. (2010). A new code for the design and analysis of the
heliostat field layout for power tower system. ScienceDirect, 84, 685-690.
Weinstein, L. A., Loomis, J., Bhatia, B., Bierman, D. M., Wang, E. N. & Chen, G. (2015).
Concentrating Solar Power. Chemical Reviews, 115, 12797-12838.
Wilson, R. (2014). City of Kalgoorlie-Boulder Energy Snapshot 2014/15: What We’ve
Achieved and Where We’re Going. Council Attachment: 7 CKB Energy Snapshot 2014 2015
Report. Retrieved from http://www.ckb.wa.gov.au/
Wyld Group. (2008). High Temperature Solar Thermal Technology Roadmap. Prepared for
the New South Wales and Victorian Governments. COAG.gov.au. Retrieved from
www.coag.gov.au/sites/default/files/htsolar_thermal_roadmap.pdf
Page | 72
Appendix A
System Adviser Model (SAM) inputs and variables

Page | 73

Page | 74

Page | 75

Page | 76
Page | 77

Page | 78

Page | 79

Page | 80


