
EXECUTIVE SUMMARYThe North Carolina State Ports Authority (the Authority) owns and operates two ocean ports on the eastern
seaboard: the Port of Wilmington and the Port of Morehead City. This study focused on identifying the current
economic contribution of port services for these two publicly-owned ocean ports in North Carolina, both on a
statewide and regional level.
North Carolina ports contribute approximately $15.4 billion annually to the state’s economy. This contribution is
constituted by goods moving through the ports, with $12.9 billion attributed to the Port of Wilmington and $2.5 billion
attributed to the Port of Morehead City. The ports directly and indirectly support more than 87,700 jobs across
North Carolina, which makes up a substantial portion of the state’s economy. The availability of the Port of
Wilmington and the Port of Morehead City plays an important role in the supply chain decisions of companies which
currently have operations in North Carolina and those considering locating manufacturing and distribution
operations in North Carolina. The economic contribution of the existing deepwater ports in North Carolina foster
economic development across the state.
Key components of economic contribution, including direct, indirect, and induced contributions to gross revenue
(business output), employee compensation, jobs, and tax collections were analyzed. The direct contributions
featured in this report were derived from commodity data, and Impact Analysis for Planning (IMPLAN®) multipliers
were used to generate estimates of the indirect and induced contributions of activity at the ports, as well as the
analysis of tax contributions. IMPLAN® is a widely used software model for economic contribution studies of ports
and other transportation assets.
In the study period, July 1, 2017 to June 31, 2018, the North Carolina Ports supported $4.3 billion in employee
compensation for North Carolina workers. Taxes generated by economic activity through the ports provide additional
contributions to local communities and the state of North Carolina. Approximately $687 million in sales, property,
corporate, and personal taxes were received by state and local governments due to activity supported by the ports.
The Port of Wilmington supported the collection of $193 million in county property taxes, and the Port of
Morehead City supported $21 million. Together, the activities at the ports supported $343 million in sales tax
collections across the state. Additionally, state corporate and personal taxes of more than $119 million were
collected due to activity supported by the Port of Wilmington and the Port of Morehead City.
North Carolina Ports Contribution:
$15.4 B Economic Output to
NC
87,700 Jobs Supported in
North Carolina
$4.3 B Employee
Compensation
$687 M Local and State tax
Revenue

:
p. 01 | EXECUTIVE SUMMARY
p. 02 | CONTENTS
p. 03 | INTRODUCTION: BACKGROUND
p. 04 | INTRODUCTION: NC PORTS OVERVIEW
p. 05 | INTRODUCTION: NC PORTS CARGO MOVEMENT
p. 06 | ECONOMICS OF THE ROLE OF PORTS IN THE SUPPLY CHAIN
p. 08 | METHODOLOGY
p. 09 | ECONOMIC CONTRIBUTION RESULTS
p. 10 | ECONOMIC CONTRIBUTION RESULTS: OUTPUT
p. 11 | ECONOMIC CONTRIBUTION RESULTS: EMPLOYMENT
p. 12 | ECONOMIC CONTRIBUTION RESULTS: EMPLOYMEE COMPENSATION
p. 13 | ECONOMIC CONTRIBUTION RESULTS: STATE AND LOCAL TAXES
p. 14 | COMPARISON TO NEIGHBORING STATES’ PORTS
p. 17 | REFERENCES

INTRODUCTION
The North Carolina State Ports Authority (the “Authority”) owns and operates two ocean ports on the eastern seaboard, the
Port of Wilmington and the Port of Morehead City. These two ports are used to move approximately 6.7 million of tons of
commodities into and out of North Carolina annually. The objective of this study was to conduct an economic assessment of
the two ports and estimate their contribution to North Carolina’s economy.
This study builds on two previous studies which analyzed the economic contributions of the North Carolina Ports in 2014
and 2009 (Findley et al 2014, Findley et al 2010). The economic contribution of the ports changes over time, just as the
tonnage shipped through the ports shifts. The changes in overall tonnage moving through the ports can be affected by
numerous factors such as fluctuations in the economy and local demand for imports, the foreign demand for local exports,
local wealth, and other factors which are correlated with microeconomic and macroeconomic trends.
03 |

The study examined the current economic contribution of port services for the two publicly-owned and operated deepwater
ports in North Carolina, both statewide and for the state’s seven economic development regions.
NC Ports Overview
Created in 1945, the Authority is charged with operating and promoting North Carolina’s deepwater ports and associated
facilities. The Authority owns and maintains the Port of Wilmington, the Port of Morehead City, as well as two inland
facilities, the Charlotte Inland Terminal and the Piedmont Triad Inland Terminal.
The Port of Wilmington is North Carolina’s largest port with an operating terminal of 284 acres, handling containers
and a variety of bulk and breakbulk cargo. The port is equipped to handle refrigerated containers and recently
constructed a 101,000-square-foot cold storage facility to further support the state's agricultural and food industries. The
Port of Morehead City is slightly smaller than the Port of Wilmington in terms of size and volume, and does not handle any
container cargo. It serves breakbulk and bulk customers, including a tenant-operated liquid bulk facility on the Radio Island
terminal and supports a thriving barge industry.
Each facility is served by a single Class 1 railroad (CSX for the Port of Wilmington and Norfolk Southern for the Port of
Morehead City) and is well connected to the U.S. Interstate System (I-40 and I-95). Both ports offer cargo handling and
storage facilities.
Jobs at the Authority’s facilities include administration, security, longshoremen, river pilots, stevedores and others.
Businesses that facilitate trade through the ports include third party logistics (3PLs) providers, customs house brokers,
freight forwarders, rail lines, truck lines, steamship lines and tugboat operators. In addition, companies across the state
and beyond its borders ship their cargo and products through North Carolina.
Over 5,000 container
gate moves per week
6.7 million tons of goods
transported annually 101,000-square-foot
Storage Facility
North Carolina Ports Fast Facts
Over 950 ship calls a
year
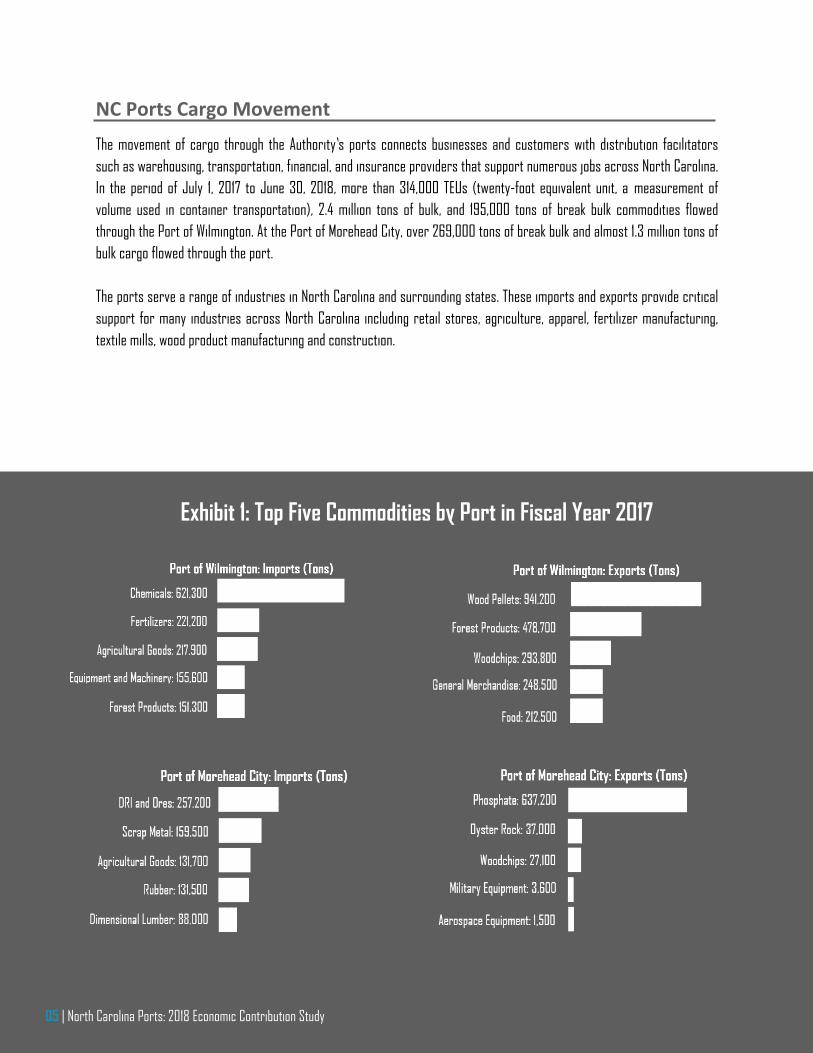
The movement of cargo through the Authority’s ports connects businesses and customers with distribution facilitators
such as warehousing, transportation, financial, and insurance providers that support numerous jobs across North Carolina. In the period of July 1, 2017 to June 30, 2018, more than 314,000 TEUs (twenty-foot equivalent unit, a measurement of
volume used in container transportation), 2.4 million tons of bulk, and 195,000 tons of break bulk commodities flowed
through the Port of Wilmington. At the Port of Morehead City, over 269,000 tons of break bulk and almost 1.3 million tons of
bulk cargo flowed through the port.
The ports serve a range of industries in North Carolina and surrounding states. These imports and exports provide critical
support for many industries across North Carolina including retail stores, agriculture, apparel, fertilizer manufacturing,
textile mills, wood product manufacturing and construction.
Exhibit 1: Top Five Commodities by Port in Fiscal Year 2017
| North Carolina Ports: 2018 Economic Contribution Study

Economics of the Role of Ports in the Supply Chain
Each year, hundreds of billions of transactions occur worldwide. In today’s global economy it’s possible to purchase a good
originating halfway around the world and receive it in a span of a few days or weeks. This high frequency movement of goods
requires quick and efficient coordination to handle the load of goods and inputs being shipped each day. One of the most vital links of
the supply chain network in today’s global economy is ports. They provide access to foreign markets for both sellers and buyers,
connecting each individual and business to the best products and production inputs from around the globe. Ports also provide a fast,
large capacity option for companies to move products both internationally and domestically, helping firms to provide goods and
services at the lowest possible price while also maintaining the flexibility to meet demand fluctuations. The magnitude of supply chain
risk exposure is substantially affected by the efficiency and consistency of port operations. Predictable movement of goods through
ports and productive connections with allied transportation networks can reduce business costs, increase competitiveness, and
improve profitability. Responding to these needs has a noticeable economic effect on the businesses utilizing the ports.
Ports connect buyers and sellers helping provide efficient and reliable supply chain solutions. Through the movement of imports,
exports, and domestic flows, ports have an impact on the economic output, employment, employee compensation, as well as taxes
within the state. Imports arriving at North Carolina's ports generate jobs and income through the transportation of goods from the
ports to their next destination, further assembly or manufacturing of raw or partially processed materials, and/or wholesale and
retail selling of finished products in-state. Exports leaving the United States from North Carolina through these ports similarly
generate jobs and income for the state from the growth, harvesting, processing/packaging of in-state agricultural products,
extraction of minerals and materials, assembly and manufacturing of products and transportation of goods to the ports. Domestic
flows include cargo being moved from one part of the United States to another region which have similar impacts.

METHODOLOGY
IMPLAN ©
To model the economic contribution that the Ports of Wilmington and Morehead City have on North Carolina, an Input-Output
model was created. It is based on the idea that an output of one sector can be the input for another sector, creating an
indirect impact, and that money flows between sectors, creating an induced impact. This flow continues to run throughout
the local economy until the stream of money passes out of an area of activity through imports, non-local spending or other
means. Throughout the years, the Input-Output model has been established as the primary tool used to estimate economic
contribution.
The models developed in this study were used to project how the Ports of Wilmington and Morehead City affect other
industries and local economies within North Carolina. The findings of this effort should be interpreted as the number of
jobs, the level of output, employee compensation, and state and local tax revenue supported by the operations of the ports,
plus the value added to North Carolina generated from the movement of imports, exports, and domestic flows through the
ports.
The Input-Output Model

To estimate the total economic contribution of the Ports of Wilmington and Morehead City, it was necessary to estimate the
total direct output generated by the operations of the ports and the movement of imports, exports and domestic flows.
These numbers were then entered into a statewide Impact Analysis for Planning (IMPLAN) model, part of the modeling
software used to estimate Input-Output relationships for the local economies, to estimate the indirect and induced effects
of the ports.
To calculate the total direct output generated by the movement of imports, exports, and domestic flows, the goods being
shipped through the ports needed to be classified into commodity types and valued per ton. The quantity of commodities used
for the direct contributions was gathered using vessel manifest data supplied by the Authority. The values of and value-added
to the commodities were estimated using data from the Commodity Flow Survey provided by the Bureau of Transportation
Statistics with a conversion to 2018 dollars using the implicit gross domestic product deflator index (BTS 2018, BEA 2018).
Using origin and destination pairs provided by the Authority for each shipment, it was possible to determine the percentage
of each commodity type that was either originating or destined within North Carolina. This prevented the study from over-
estimating the ports’ impact on the State of North Carolina by including shipments being made to, or coming from, other
states. At the end of the data processing, the research team estimated the total value added to North Carolina deriving from
all of the imports, exports, and domestic flows moving through the Ports of Wilmington and Morehead City. This value was
entered into IMPLAN as the direct output of the ports and was used to generate indirect and induced impacts within the state.
The contributions were categorized by port and by the type of goods (container and bulk/break bulk) to gain a detailed view
of the roles of the ports in the state.
In addition to the economic contribution generated from the movement of goods through North Carolina, operations at the
ports represent a portion of the ports’ economic contribution for North Carolina. Jobs at the Authority’s facilities include
administration, security, longshoremen, river pilots, stevedores, and many others. Businesses that facilitate trade through
the ports include third party logistics (3PLs) providers, customs house brokers, freight forwarders, rail lines, truck lines,
steamship lines, and tugboat operators. These jobs are associated with the operation of the ports and generate economic
output, employee compensation, and state and local taxes for North Carolina. North Carolina port jobs data was provided by
the Authority and were classified and entered into IMPLAN as direct jobs. IMPLAN calculated the indirect, induced, and total
output, jobs, employee compensation and taxes generated from these jobs.
The methodology for the study is documented in this report and is a replication of the methodology applied to the North
Carolina Ports using 2014 and 2009 data (Findley et al 2014, Findley et al 2011). The economic impact and contribution
assessment techniques used in this study were consistent with methodologies applied in other states (Humphreys, J.M.2012,
Humphreys, J.M.2017, Nessen 2015).

ECONOMIC CONTRIBUTION RESULTSThe final results of the study include values for output, employment, employee compensation, and taxes.
Exhibit 2 – Value of Goods Moving Through NC Ports by Total, NC Component, and
Value Added
Type of Goods Port
Total Value of
Goods moving
through NC Ports
($)
Value of Goods
Remaining or
Originating in NC
($)
Value Added to NC
Commodities ($) Total Tons
Container Wilmington $ 11,510,856,000 $ 10,515,568,000 $5,193,824,000 2,486,000
Bulk/Breakbulk Morehead City $ 3,821,250,000 $ 1,916,829,000 $ 1,541,517,000 1,652,000
Wilmington $ 6,147,790,000 $ 2,987,011,000 $ 2,043,407,000 2,604,000
Port of Wilmington Subtotal $ 17,658,646,000 $ 13,502,579,000 $ 7,237,231,000 5,090,000
Port of Morehead City Subtotal $ 3,821,250,000 $ 1,916,829,000 $ 1,541,517,000 1,652,000
North Carolina State Ports Total $ 21,479,896,000 $ 15,419,408,000 $ 8,778,748,000 6,742,000
Over 6.7 million tons of goods worth $21.5 billion were transported through North Carolina ports (Exhibit 2). The direct
economic impact of transported goods was derived from the value added to imported goods which originate from or
remain in the state, which totaled over $8.7 billion. This value is the total value of goods moving through North Carolina multiplied by the percentage of imports destined for the state and the percentage of exports originating from North Carolina. This limits the scope of the economic impact of the ports to just the impact it has on the state of North Carolina.

Through the provision of goods’ movement services at the deepwater ports, the ports supported over $15.4 billion in
gross revenues for North Carolina businesses during the study period (Exhibit 3). The Authority’s contribution to the gross
revenues of North Carolina businesses results from the trade facilitated by the availability of transporting goods through
the ports in Wilmington and Morehead City. These goods support a diverse set of industries across the state. The majority
of the output contribution is derived from the container activity at the Port of Wilmington, with a contribution of $9.15
billion. Exhibit 4 shows the distribution of output contribution across the state’s seven economic development regions.
Output (2018 Dollars)
Type of Goods Port Direct Indirect Induced Total
Container Wilmington 5,193,930,000 2,048,520,000 1,915,020,000 9,157,480,000
Bulk/
Breakbulk
Morehead City 1,545,540,000 566,870,000 372,420,000 2,484,830,000
Wilmington 2,100,610,000 857,600,000 803,800,000 3,762,010,000
Port of Wilmington Subtotal 7,294,540,000 2,906,120,000 2,718,820,000 12,919,490,000
Port of Morehead City Subtotal 1,545,540,000 566,870,000 372,420,000 2,484,830,000
North Carolina State Ports Total 8,840,080,000 3,472,990,000 3,091,240,000 15,404,320,000
Source: NCSPA 2018, IMPLAN 2018
Exhibit 4 – Output Contribution of NC Ports Across North Carolina Economic Development Regions
Exhibit 3 – Output Contribution
North Carolina Ports: 2018 Economic Contribution Study |

As a frame of reference for the magnitude of the Authority’s impact on the state’s economy, the contribution was compared
to the North Carolina gross domestic product (GDP). North Carolina’s GDP in 2017 was $538.3 billion (BEA 2017). Therefore,
the Authority’s contribution of $15.4 billion to the state’s GDP was approximately 3% of the total GDP. This is an approximation
as the contribution is based on 2018 dollars.
Another useful comparison can be made to the impact of another important component of the state’s economy: the
construction industry. The 2017 economic impact of construction in North Carolina was $16.4 billion (Statista 2017).
Therefore, the contribution to North Carolina’s economy supported by activity at the Authority’s ports is approximately
equivalent to the statewide impact of construction.
The North Carolina Ports supported, through the provision of goods’ movement services at the two deepwater ports,
87,700 full-time jobs at North Carolina businesses (Exhibit 5). The majority of the employment contribution comes from
the activity related to the movement of container shipments at the Port of Wilmington, with a contribution of over 59,200
jobs. The majority of jobs (44,600) were directly related to activity supported by the ports, while an additional 42,900 jobs
were supported through indirect and induced activities. Exhibit 6 on page 12 shows the distribution of employment
contribution across the state’s seven economic development regions.
Employment (Full-time Jobs)
Type of Goods Port Direct Indirect Induced Total
Container Wilmington 33,200 12,100 13,900 59,200
Bulk/Break-bulk Morehead City 3,400 3,000 2,700 9,100
Wilmington 8,000 5,600 5,800 19,400
Port of Wilmington Subtotal 41,200 17,700 19,700 78,600
Port of Morehead City Subtotal 3,400 3,000 2,700 9,100
North Carolina State Ports Total 44,600 20,700 22,400 87,700
Source: NCSPA 2018, IMPLAN 2018
Exhibit 5 – Employment Contribution
11

The North Carolina Ports supported, through the provision of goods’ movement services at the two deepwater ports, over
$4.37 billion in employee compensation for North Carolina workers (Exhibit 7). Employee compensation is the total payroll
cost including salary, benefits and payroll taxes. More than half of the employee compensation generated from the two
deepwater ports is from employment directly supported by activity related to the North Carolina ports.
Employee Compensation (2018 dollars)
Type of Goods Port Direct Indirect Induced Total
Container Wilmington 1,451,300,000 670,360,000 587,180,000 2,708,840,000
Bulk/ Break-bulk Morehead City 242,470,000 170,210,000 114,190,000 526,880,000
Wilmington 597,150,000 293,860,000 247,010,000 1,139,630,000
Port of Wilmington Subtotal 2,048,450,000 964,220,000 834,190,000 3,848,470,000
Port of Morehead City Subtotal 242,470,000 170,210,000 114,190,000 526,880,000
North Carolina State Ports Total 2,290,920,000 1,134,430,000 948,380,000 4,375,350,000
Source: NCSPA 2018, IMPLAN 2018
Exhibit 6 –Employment Contribution of NC Ports Across North Carolina Economic Development Regions
Exhibit 7 – Employee Compensation

State and local governments in North Carolina received $687 million in annual sales, county property, corporate and
personal tax collections due to activity supported by the two deepwater ports (Exhibit 8). The county property tax related
to activity at the Port of Wilmington is over $192 million, and the activity at the Port of Morehead City generates $32
million. The activity supported by the two deepwater ports resulted in over $343 million in business sales tax collections
across the state (Exhibit 9).
Exhibit 8 – NC Ports State and Local Tax Contributions
Tax Description Port of Wilmington
(2018 dollars)
Port of Morehead City
(2018 dollars)
Total
(2018 dollars)
Business Sales Tax 294,150,000 49,450,000 343,600,000
Property Tax 192,540,000 32,370,000 224,910,000
State Corporate and Personal
Tax
102,810,000 15,910,000 118,720,000
Total 589,500,000 97,720,000 687,220,000
Source: NCSPA 2018, IMPLAN 2018
The estimated property tax collections supported by the Authority can be used to determine the equivalent tax base. The
weighted average county property tax rate, based on total taxable real estate, in the state was $0.661 per $100 valuation
(NCDOR 2017). The total property tax collections of $224.9 million would equate to a tax base of $34.04 billion, which is
approximately 4% of the value of total taxable real estate statewide.
13
Exhibit 9 –Tax Contribution from Goods Moving Through NC Ports Across North Carolina Economic
Development Regions

COMPARISON TO NEIGHBORING STATES’ PORTS
To gain a sense of perspective of NC Ports' contribution, the following discussion includes an assessment of ports in
Georgia and South Carolina. The comparisons evaluated several characteristics of the ports, including static measures
such as port access, and dynamic measures such as port operations and economic contribution which change from year to
year.
By total trade, the Georgia Port moves the most cargo among North Carolina’s neighboring ports (Exhibit 10). The ports of
North Carolina move approximately one-sixth of the tonnage at the Georgia ports, and about one-fourth of the tonnage at the
South Carolina ports. The port operations comparison can provide valuable insight into the economic contribution values
presented in Exhibit 11 and Exhibit 12. Although economic contribution levels are strongly related to the quantity of goods
shipped through a port, other factors play an important role such as the value of the goods, import and export balance,
quality of available landside transportation access, nearby consumer markets and many other dynamics.

Exhibit 10 – Neighboring Ports Operations Comparison
Port 2018 Total Trade
(metric tons)
2018 Container Traffic
(TEUs)
North Carolina (Port of Wilmington
and Port of Morehead City)
6,600,000 322,391
Georgia 36,430,000 4,770,000
South Carolina 22,718,000 2,140,000
Source: Census 2018a, Census 2018b & Respective State’s Port Authority’s Websites
Comparing the volume of goods moving through North Carolina Ports with the ports of Georgia and South Carolina, North
Carolina moves roughly 6% of the Twenty-foot Equivalent units (TEU) and 30% of the metric tons that South Carolina moves
in a year and roughly 4% of the TEUs and 18% of the metric tons that Georgia moves in a year through their ports. The
differences in volumes should be taken into consideration when reviewing the following comparison of jobs and economic
contributions associated with the three ports.
The neighboring ports in Georgia (Humphreys 2017, Humphreys 2012) and South Carolina (Joseph Nessen, 2015) have each
conducted economic contribution studies in recent years to document the role of their state’s ports in the statewide
economy. Those two port studies also utilized IMPLAN® for the development of indirect and inducted impacts. A
comparison of the economic contribution of neighboring ports on their respective states is shown in Exhibit 11. One caveat
to note is that the studies were conducted in different years and comparisons are approximate.
Exhibit 11 – Neighboring Ports Output Contribution Comparison
Study
Base Year
Economic Output (Millions of Dollars)
Port Direct Indirect Induced Total
North Carolina (Port of Wilmington and
Port of Morehead City) 2017
$ 8,800 $ 3,500 $ 3,100 $ 15,400
Georgia 2017 $ 63,400 $ 43,000* $ 106,400
South Carolina 2015 $ 36,000 $ 11,000 6,000 $ 53,000
Source: NCSPA 2014, IMPLAN 2014, Humphreys, J.M. 2012, Wilbur Smith Associates 2008
*Indirect and Induced output. Georgia study combined both.
15

A comparison of the economic contribution in terms of jobs at neighboring ports is shown in Exhibit 12. As study dates are
different, the comparisons are approximate. In relation to the neighboring ports, the Authority’s total employment
contribution is approximately one-fifth to one-half of that of neighboring ports. The relative contribution of North
Carolina ports to the state economy and neighboring ports to their respective economies varies in terms of output and employment contributions because of the types of goods, value of goods, availability of in-state producers and consumers of goods, and other economic factors.
The large difference in the Authority facilities’ output and employment contribution compared to that of other South Atlantic
ports mainly reflects differences in existing transportation infrastructure. Neighboring ports benefit from better rail and
highway connections than Wilmington and Morehead City. Inadequate hinterland connectivity is a major factor limiting the
geographical area that a port can serve. Given the inland connectivity, it is no surprise that Wilmington and Morehead City
have a noticeably smaller economic impact than competing ports that are better supported. It is highly likely that if North
Carolina were to improve the infrastructure that impacts Authority’s ability to attract cargo, there would be an increase in
employment, output, income and tax collections that would exceed the cost of the investment.
Exhibit 12 – Neighboring Ports Employment Contribution Comparison
Study
Base Year
Employment (Jobs)
Port Direct Indirect Induced Total
North Carolina (Port of Wilmington and
Port of Morehead City) 2017
44,600 20,700 22,400 87,700
Georgia 2017 180,189 259,031* 439,220
South Carolina 2015 77,335 61,881 47,990 187,206
Source: NCSPA 2014, IMPLAN 2014, Humphreys, J.M. 2017, Nessen 2015
*Indirect and Induced employment. Georgia study combined into one general secondary effects category.

REFERENCES NCSPA 2018
Respective State’s Port Authority’s Website
BEA (2013). Gross Domestic Product by State. Survey of Current Business. United States Bureau of Economic Analysis. United
States Department of Commerce. Washington, DC. URL: http://www.bea.gov/regional/gsp/
BEA (2018). Gross Domestic Product. Bureau of Economic Analysis. United States Department of Commerce. Washington, DC.
BTS (2012). 2012 Commodity Flow Survey. Table 6. Bureau of Transportation Statistics. Research and Innovative Technology
Administration. United States Department of Transportation. Washington, DC.
Census (2018a). FT920 – US Merchandise Trade: Selected Highlights December 2017. Exhibit 1a: US Port of Export and Method
of Transportation. United States Department of Commerce. Bureau of the Census. Washington, D.C.
Census (2018b). FT920 – US Merchandise Trade: Selected Highlights December 2017. Exhibit 4a: US General Imports – US Port
of Unlading and Method of Transportation. United States Department of Commerce. Bureau of the Census. Washington,
D.C.
Findley, D.J., Cunningham, C.M., Foyle, R.S., Demers, A., List, G.F., Stone, J.R., Dobie, K.E., Hall, W.W., Hauser, E.W., Kemmsies,
and W., Smith, M. Institute for Transportation Research and Education. (2011). Economic Contribution of the North Carolina
Ports. North Carolina State Ports Authority. Wilmington, NC.
Findley, D.J., Small, J.D., Tran, W., Heller, A., Bert, S.A., Searcy, S.E., Institute for Transportation Research and Education.
(2014). Economic Contribution of The North Carolina Ports. North Carolina Ports Authority. Wilmington, N.C.
Humphreys, J.M. (2012). The Economic Impact of Georgia’s Deepwater Ports on Georgia’s Economy in FY 2011. Georgia Ports
Authority. Prepared by University of Georgia. Athens, Georgia.
Humphreys, J.M. (2017). The Economic Impact of Georgia’s Deepwater Ports on Georgia’s Economy in FY 2017. Georgia Ports
Authority. Prepared by University of Georgia. Athens, Georgia.
IMPLAN (2018). IMPLAN Version 3.0. IMPLAN Group LLC. Huntersville, NC.
NBER (2018). US Business Cycle Expansions and Contractions. National Bureau of Economic Research. Cambridge, MA. URL:
http://www.nber.org/cycles/cyclesmain.html
NCDOR (2018). FY 2017-2018 Property Tax Rates. North Carolina Department of Revenue. Raleigh, NC.
Nessen, J. V. (2015). The Economic Impact of the South Carolina Ports Authority: A Statewide and Regional Analysis. South
Carolina Applied Research Center for Supply Chain and Logistics. Prepared by University of South Carolina. Columbia,
South Carolina.
Statista (2017). Real value added to the Gross Domestic Product (GDP) of North Carolina in 2017, by industry (in billion chained
2009 U.S. dollars)
17 | North Carolina Ports: 2018 Economic Contribution Study