
EPC Advanced Infrastructure Implementation Training

Chapter 1Introduction

3
Introduction
Welcome to this EPC course.
We are happy to present you with the EPC Advanced Infrastructure Implementation course where you will learn more about implementing the infrastructure required for an EPC / RFID system
Enjoy the course!

4
Preface
Implementing RFID is similar to implementing a new IT system or a new business process.
To do so efficiently, you will need to follow good project management methodology and define your implementation road map
This implementation roadmap can vary from one company or one industry sector to another.

5
Scope
This course focuses on the implementation aspects that are particular to EPC/RFID infrastructure.
Those aspects are:• The selection of EPC/RFID system design• The site analysis• The installation of the system • The security of the system• The monitoring & troubleshooting of the system
and therefore does not cover the others steps of the implementation roadmap such as the cost-benefits analysis, the project management or the communication
This course also does not cover extensively the implementation of EPCIS as this will be covered in a separate course.

6
Pre-requisites
This course builds on the knowledge that you have acquired in the “Basics of EPC” and in the “EPC / RFID – Advanced technical aspects” courses.
It is strongly advised that if you’re not familiar with EPC and/or RFID, that you first take the “Basics of EPC” course.
It is also strongly advised that you first take the “EPC / RFID – Advanced technical aspects” if you are not familiar with the technicalities of tags, antennas or radiofrequency waves.

Chapter 2 –
Selection of the EPC/RFID system design
8
What is in this chapter?
Selecting the Vendor(s)/Solution Providers
Selecting the Operating Frequency
Selecting the Tags
Selecting the Readers
Selecting the Antennas
Selecting the Transmission Lines
Selecting the Portals
Selecting the RFID Peripherals

2.1 Selecting the vendor(s)/solution provider(s)

10
Why is it important?
Vendors play a major role in helping you design, implement, and manage your solutions and therefore finding the right vendors who can help you address your business issues is critical.
This means that proper vendor selection often makes the difference between a successful project and a failed one.
For an RFID project, this is especially true because its usage is relatively new in areas such as supply chain where only a small set of industry-wide references, best practices, and case studies are available.

11
The Best-of-Breed approach
• Selection of the best vendor for each specific portion of an RFID project.
• The choice often depends on the specific application and industry.
IMPLICATION:
You are in control and manage all aspects of the project in-house.

12
The One-Stop-Shop approach
• Involves selecting one single vendor to act as the primary contractor vendor for the RFID project.
• Primary contractor often manages the entire lifecycle of the project and is responsible for all phases of the project including the selection of additional vendors/sub-contractors
IMPLICATION:
one vendor is primarily in control, manages all aspects of the
project, and takes responsibility for the overall outcome of the
project.
13
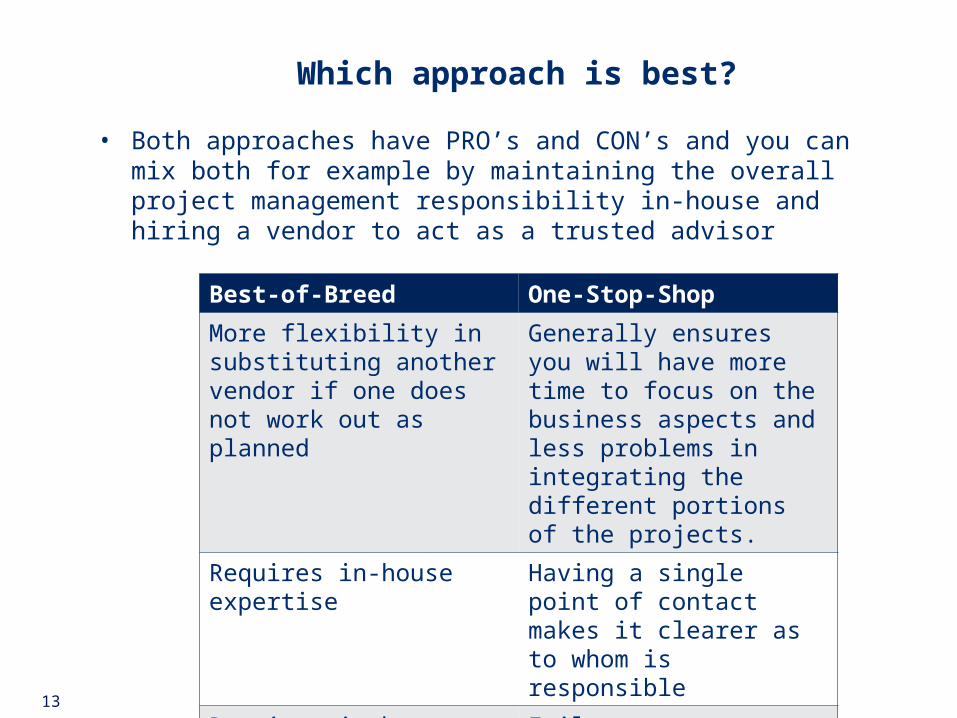
Which approach is best?
• Both approaches have PRO’s and CON’s and you can mix both for example by maintaining the overall project management responsibility in-house and hiring a vendor to act as a trusted advisor
Best-of-Breed One-Stop-Shop
More flexibility in substituting another vendor if one does not work out as planned
Generally ensures you will have more time to focus on the business aspects and less problems in integrating the different portions of the projects.
Requires in-house expertise Having a single point of contact makes it clearer as to whom is responsible
Requires in-house resources for the project management
Failures are expensive in this configuration.

14
How do I compare vendors?
Customerreferences
RFIDTechnologyExperience
IndustryExperience
InvolvementWith
EPCglobal
Generic Criteria +

2.2 Selecting the operating frequency

16
Why is it important?
Tag and reader use radio waves of a certain frequency (operating frequency), to communicate with each other.
The choice of frequency does affect the system’s performance in areas such as speed, range, and accuracy that are critical to your application.
In addition, considering other radio services such as radio, television or mobile phones have operated before the arrival of RFID systems, it is also important to ensure that the selected operating frequency does not disturb these services.

17
What are the frequency ranges?
An RFID systems operates in one of the four main ranges of the radio frequency
We will look at the PROs and CONs of each range and which bands are available for EPC / RFID systems within these ranges.

18
The Low Frequency (LF) range
LF range: 30 KHz - 300 KHz,
RFID systems: 125 KHz &134 KHz.
Characteristics of RFID systems at LF:• Short read range (<0.5m)• Low reading speed • Very few interferences with the
surrounding and absorption or
reflection problems due to water or metal.
Applications:• access control • animal and personnel tracking

19
The High Frequency (HF) range
HF range: 3 MHz - 30 MHz
RFID systems: 13.56 MHz
(only globally accepted radio frequency for RFID systems)
Characteristics• Read range: +/- 3 m.• More problems to penetrate through
materials (vs LF)• Better data transfer speed (vs LF)

20
Applications:
Building access control
Item-level tracking, including baggage handling
Libraries
The High Frequency (HF) range

21
The Ultra High Frequency (UHF) range
UHF range: 300 MHz - 3 GHz.
RFID systems: 344 MHz & 860 - 960 MHz
(Depending on country/region regulations)
List of UHF bands available for RFID
systems -> EPCglobal website.
Characteristics:
•Read Range <= 10 m.•Higher probability for interferences (consumer devices)•Higher probability for problems due to absorption by metals or matter. •High data transfer•Limited portability
22
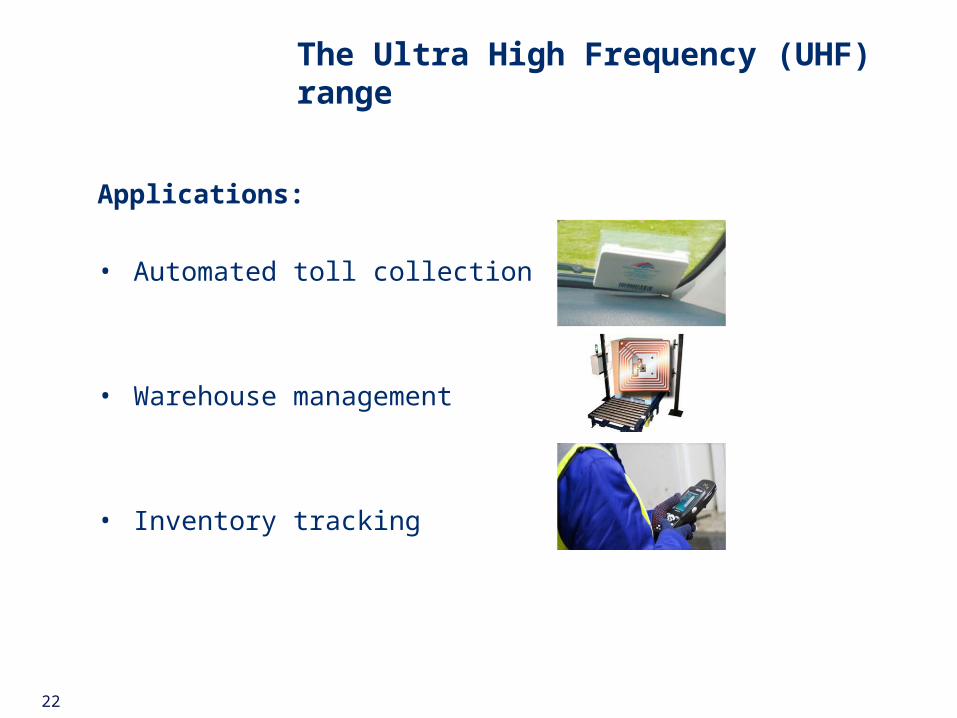
The Ultra High Frequency (UHF) range
Applications:
• Automated toll collection
• Warehouse management
• Inventory tracking

23
The Microwave range
Microwave Range: 1 GHz - 300 GHz
RFID systems: 2.44 GHz and 5.80 GHz
Characteristics:• A long read distance
• A high reading speed and
data transfer rate
• Poor performance around
water and metal
24
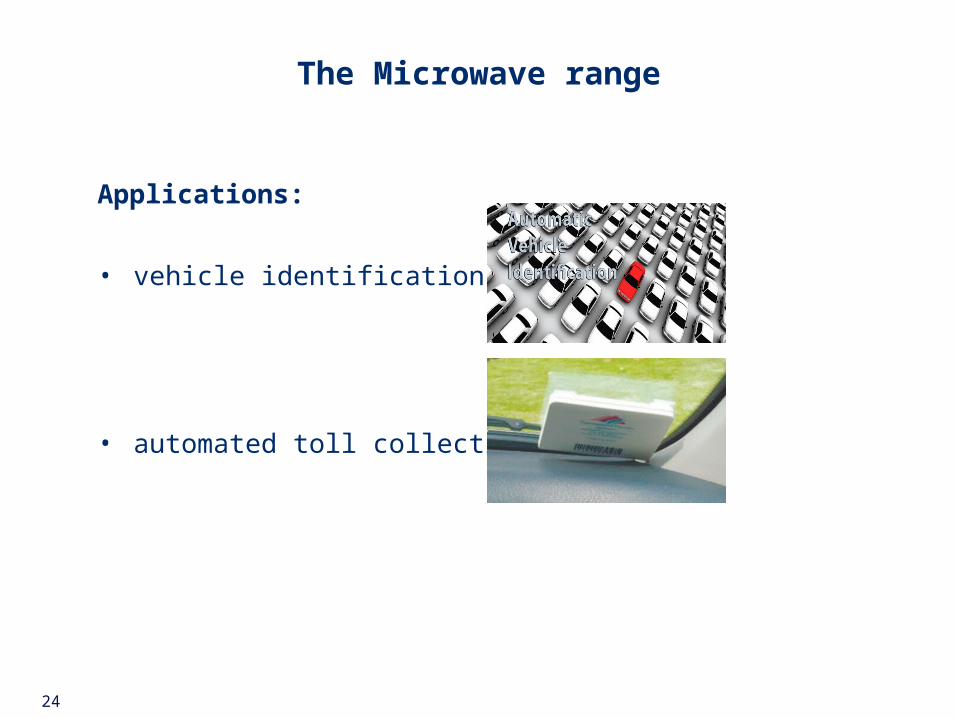
Applications:
• vehicle identification
• automated toll collection
The Microwave range

25
How do I select the operating frequency?

2.3 Selecting the tags

27
How do I select the tags?
Consider various factors:
• tag types and classes, • operating frequency, • read range, • data capacity, • tag form and size, • environmental conditions, • standards and regulations

28
The kinds of tags
Type of tag depends on your application:
Requires tag to store some data (e.g. ID)
& provide it on request
Requires a very long read range or real-time features such as sensing the temperature or the humidity.
Read Only (RO), Write Once Read Many (WORM) or Read and Write (RW) tags depending on the data you wish to store on the tag and whether this data is subject to change.
Passive
Active
Memory

29
The read performance of the tags
Read Performance
Read Range
Reading Efficiency
Antenna Polarization
Antenna orientation
Reading Robustness:# of Successful Reads
Total # of Reads
=

30
Other consideration for the tags
Data Capacity
Security
Compatibility
More data capacity = more useful = more cost
Data locking prevents tampering with the tag data.
With item to be tagged and environment. Appropriate size Enough ruggedness if in contact with harsh environment humidity or corrosive material.
Tag compliance with EPCglobal standards ensures compatibility and interoperability with other systems meeting those standards

2.4 Selecting the readers

32
How do I select the readers?
• Ensure reader operates at your chosen frequency • Ensure reader complies with legal requirements
(e.g.maximum power).• Ensure reader should has correct interface for your
application.

33
Other considerations for the readers
Readers usually have 2-4 antenna ports.
Some readers have up to 8 antenna ports.
Offer a better flexibility in covering a wide area zone.
Readers that can be easily upgraded save
costs.
Application might require readers to be
managed remotely for diagnosis and fixing
without visiting the site.

2.5 Selecting the antennas

35
What are the types of antennas?
Both tags and readers have their antennas and these come in various types.
The main antenna types are:

36
How do I select the antennas?
• Ground area over which the antenna delivers the signal. • All tags placed within the footprint of a reader’s antenna
can be read by the antenna. • Footprints can be mapped using a spectrum analyzer.
• Depends on the tag orientation with respect to the antennas:
Two key factors: the footprint and the polarization
UNKNOWN KNOWN
Use circularly polarized antennas.This ensures some amount of power will be transferred between the reader and the tag antennas, regardless of the tag orientation
Use a linear antenna to receive the maximum power and thereby increase the read range.

2.6 Selecting the transmission lines

38
How do I select transmission lines?
Transmission line:
physical medium (e.g. cable),connects signal source of reader to antenna.
Optimal transmission line:
transfer energy from source to antenna with minimum power loss.
RFID systems generally use 50 ohms coaxial cables as transmission lines as these have low cable loss. Shielded pair cables are also used frequently.The longer the cable, the greater the loss of power.Impedance of transmission line should match input impedance of antenna.

2.7 Selecting the portals.
40
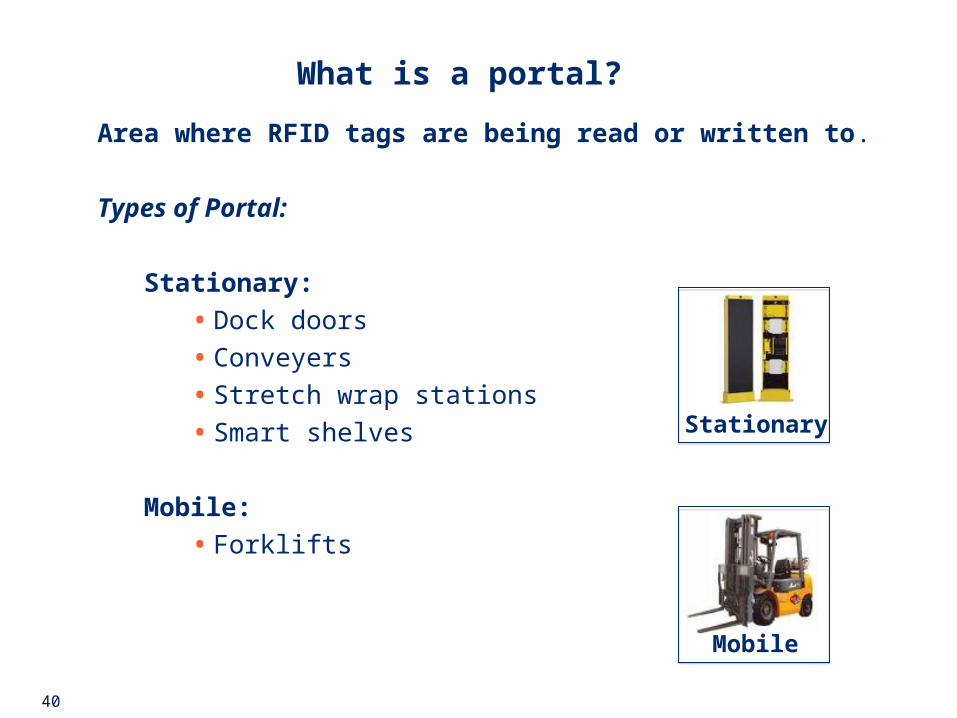
What is a portal?
Area where RFID tags are being read or written to.
Types of Portal:
Stationary:
• Dock doors
• Conveyers
• Stretch wrap stations
• Smart shelves
Mobile:
• Forklifts
Stationary
Mobile

41
The dock doors
Read at pallet level all tags attached to items on vehicles passing through its interrogation zone
Multiple antennas mounted in array on both sides of door
(covers interrogation zone of +/-3 m x 3m HxW)
Position antennas to form an efficient interrogation zone.
Readers activated by motion of vehicle: should be turned on rapidly so vehicle doesn’t have to slow down for all tags to be read.

42
The conveyers
• Generally used for case-level tracking
(e.g. luggage in airport or boxes in distribution center.)• Multiple antennas mounted on gantries around conveyer to
cover the 4 faces as item to be read passes.• Optimal reading: belt and roller for conveyer to be made of
Radiofrequency friendly material at read point (not of metal). • Speed of conveyer to be adjusted for optimal reading

43
The forklifts
Especially well suited for reading tags from items on pallets
Can be connected to data collecting computers
(e.g. for improving inventory management).
Disadvantages of mounting antennas on forklifts:
• Forklift based systems require manual intervention from operators
• Tag readability can be affected by various factors:
• metal of the forks,
• communication devices of the forklift operator
• speed of the forklift

44
The stretch wrap stations
Usually final step before shipping, so, RFID system at this place guarantees integrity of the containers.
Extremely attractive for a portal because orientation of tags continuously changes while the pallet spins (making their reading very efficient).

45
The smart shelves
Significant advantage: helping reduce out-of-stocks.
Disadvantage: • Require multiple readers and antennas • Potential overlapping of interrogation zones and signal interferences.• Densely packed items on the shelves could result in stationary
readers missing some items resulting in inventory issues.

2.8 Selecting the RFID peripherals

47
The RFID printers
Devices printing smart labels (labels combining barcode with RFID tag.
Able to print barcodes on label and read &write tag inside label.
Can be connected to PC via parallel, serial or USB port
Can be connected to network using Ethernet connection.

48
How do I select the RFID printers?
Factors to consider when selecting RFID printers:• Automatically void faulty labels?
• EPC compliant?
• Support for harsh conditions?
• Support for various label sizes
and multiple tag protocols?
• Printing speed sufficient for application
now and in the future?

49
The label applicators
Machines applying the labels on the products in an automated way.
Pneumatic piston label:Detect product and have piston to stop it for labelling.
Advantage: product doesn’t have to be moving at a constant speed.
Wipe-on label applicators: Detect product and perform labelling using roller or brush to wipe down label on package. Require the product to be reliably moving at constant speed
Pneumatic Piston
Wipe-on

50
The feed back systems
Feedback systems include:
• Photo eyes: detect presence of something coming or verify if labels are correctly placed
• Light trees: indicate with green light that package has been read successfully, and with red light that something is missing or incorrect
• Motion sensors: indicate arrival of tagged items at dock door
• Real time location systems: track &report in real time location of assets tagged to be tracked
Generally used to report problems with system or to perform action when event encountered: (e.g. activating readers when tagged items are detected).

2.9 Summary

52
Summary
In this chapter, you have learned that you want to design your RFID system to meet your application’s performance requirements and that vendors play a major role in helping you do so.
The type of your application, the required read range and the operating conditions will be the key factors for selecting your operating frequency.
From there, you will select your tags and readers based on read performance operating conditions and compliance to standards.
Choosing the right portals will depend upon your application and whether you want to track at the item, case or pallet level.
Finally, you have discovered that RFID peripherals will enhance your system and enable it work in a more automated way
Chapter 3 –
The site analysis

54
What is in this chapter?
Design of EPC / RFID system not final until site survey performed.
Understand what information is in blueprint to start site analysis and what information to be entered into blueprint after finish of site analysis.
How to analyze environmental conditions to identify potential sources of interference and how to define where to place interrogation zones

3.1 What is a site analysis?
56
Why is it important?
• Need to determine how RFID system will fit into existing site infrastructure
• Site analysis required before finalizing RFID system design • Site analysis required before you install the RFID system
Main goal of site analysis:
To ensure that interrogation zones will function properly, with maximum performance and without interrupting existing services.
• Site analysis also facilitates smooth integration with existing IT systems
(e.g. by identifying need to upgrade network infrastructure)

57
What are the steps of a site analysis?
You site analysis = project and should be planned accordingly!
Perform your site analysis in 3 steps:
• Prepare your site visit• Visit the site and perform a physical and an radiofrequency
environmental analysis• Document your results in reports and include findings in blueprints.

3.2 Preparing the site analysis

59
What is a blueprint?
Plan or facility diagram that helps visualizing big picture of site infrastructure.
• Preliminary determination of where you can possibly set up interrogation zones by showing for example which are the places you need to avoid such as metalic material or motors that can cause interferences.
• Look on blueprint where to get power sources for RFID system.
• Generally uses standardised symbols to represent electrical and telecom devices.

60
Which equipment do I need?
Main part of site analysis is to perform physical and electrical environment analysis.
The equipment that you need consists of:
Blueprint Laptop AntennaSpectrumAnalyzer Tripod

3.3 Performing a physical and an electrical environment analysis

62
How should I perform a physical environment analysis?
Look for physical conditions or objects that might affect RFID system:
Harsh environmental conditions E.g. corrosive material, extreme temperature or humidity which can damage tags moisture and water contents which can absorb the Radio Frequency signals.
Electrical devices (e.g. motors & cabling) that could create interferences and noise.
Metallic objects that would reflect the Radio Frequency signals.
Any other physical sources that may have adverse effects on the radiofrequency signal propagation.

63
Why should I perform a radiofrequency environment analysis?
Since you have performed the physical environment analysis, you have identified some of the potential sources of electromagnetic noise and interferences.
Now you need to perform a radiofrequency environmental analysis for further identifying the sources of interference and noise and measuring them.
This analysis will help you decide where to place your interrogation zones and also help you fine-tuning and configuring these zones for optimal performance
The analysis will also ensure that your RFID system will not interfere with the existing radiofrequency systems on the site.

64
The radiofrequency environment analysis – step 1
Measure ambient electromagnetic noise (AEN) generated by electrical devices existing at site.
AEN = measured in decibel by spectrum analyzer.
Measures spectrum of electromagnetic wave, helps:
• To identify sources of radiofrequency interferences• To measure RF output from these interfering sources in terms
of distortion, harmonic, modulation, quality and noise• To display signal interference if it overlaps intended signal
65
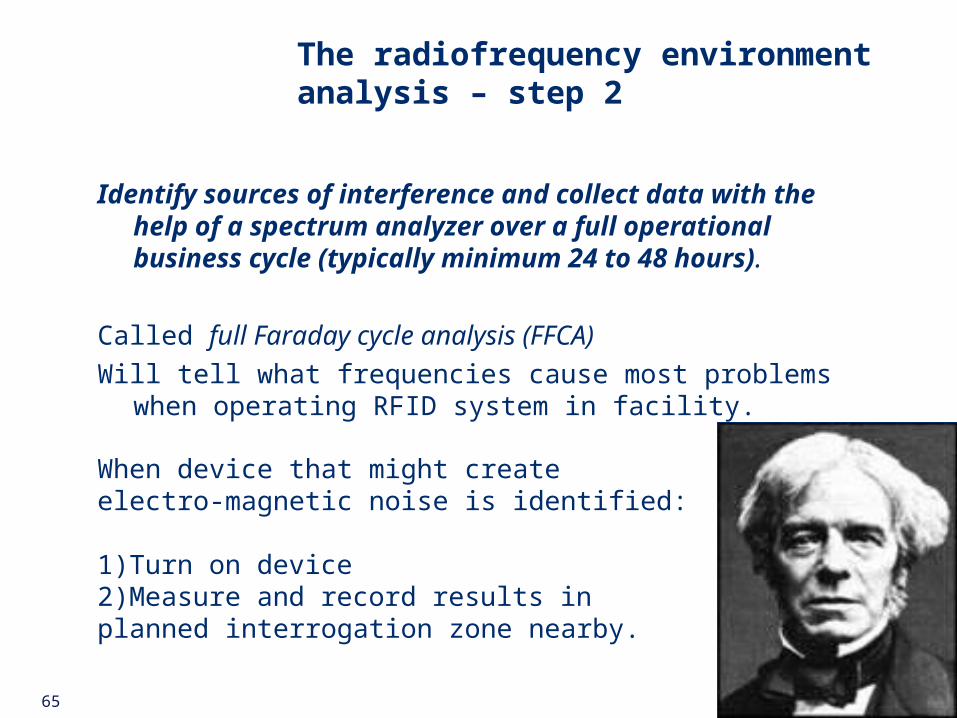
The radiofrequency environment analysis – step 2
Identify sources of interference and collect data with the help of a spectrum analyzer over a full operational business cycle (typically minimum 24 to 48 hours).
Called full Faraday cycle analysis (FFCA)
Will tell what frequencies cause most problems when operating RFID system in facility.
When device that might create electro-magnetic noise is identified:
1)Turn on device 2)Measure and record results in planned interrogation zone nearby.

66
The radiofrequency environment analysis – step 3
Protect your EPC / RFID System from the interferences and noise.
To eliminate or minimize the effects of interference, you can consider implementing the following solutions:
Remove source of interference, if possible. E.g. may be possible to ensure forklift causing interference does not operate in interrogation zone.
Shield source of interference or your RFID system next to this source
Use filters, which permit only selected frequencies to pass through a connected device by rejecting all other frequencies.

67
The radiofrequency environment analysis – step 4
Metals, liquids and obstacles affect radiofrequency signal: measure radio-frequency coverage area for reader antenna at different spots of planned interrogation zones.
For each spot:
• Set up antenna •Use spectrum analyzer for measuring strength of signal emitted by antenna• Measure in different directions• Mark down for each direction at which distance from antenna signal becomes too weak to be useful.
Signal coverage area decreases around spotsnear obstructions, (e.g.) metallic equipment!

68
The radiofrequency environment analysis – step 5
Perform a path loss contour analysis (PLCA) to map how field strength and shape of radio-frequency coverage in interrogation zone varies in zone.
•Shows how radio-frequency signals are degraded and distorted and how shape of coverage changes throughout interrogation zone.
•Helps determining location of antenna in interrogation zone, alignment of antenna and optimal emitted power.

3.4 Documenting your results
70
What should I document?
Report findings on blueprints or some other documents:
Very useful during installation and deployment of EPC / RFID system
-Sources of interferences-Coverage Areas-Potential Barriers

3.5 Summary

72
Summary
In this chapter, you have learned that the purpose of site analysis is to determine how the proposed RFID system will fit into the existing site infrastructure.
You understood that a site analysis has 3 phases that are:• Preparing the equipment and the blueprints• Performing a physical and a radiofrequency environmental
analysis.• Document your results
Finally, you have also learned in more details how to perform the radiofrequency environmental analysis using a spectrum analyzer

Chapter 4 –
Installation of the EPC/RFID system

74
What is in this chapter?
In this chapter, you will understand how you can successfully install your EPC / RFID system.
You will discover the 3 steps of the installation process that are:• Preparing the installation• Installing and configuring the hardware• Setting up the portals• Integrating the infrastructure with the application
Finally, you will learn how to ensure safety for your EPC / RFID system and for the personnel in the area

4.1 Preparing the installation

76
Which documentation is needed?
During the selection of the EPC/RFID system design, you have understood the various RFID solutions available in the context of your application requirements.
Equipped with that understanding, you have performed the site analysis and determined how the RFID system will fit into the existing site infrastructure.
You will now use the information collected and documented during the system design and the site analysis to get your RFID components from your vendors and install the system.
But first you need power for your system, don’t you?

77
Where can I find power?
Readers and tags need power for their operation:
Get needed power sources and cabling from your vendors
Passive tags get power from RF signal emitted by reader
Active tags have own power source (typically battery)
Lifetime or operating temperature defined by application.

78
Where can I find power?
Readers can use various power sources, including:
Power Supply Units(PSUs)
UninterruptedPower Supply
(UPS)
Power over Ethernet(POE)

79
Getting a solution from the vendors
We have seen in chapter 2 the main criteria for selecting your components and your vendors.
Based on your system design and site analysis documentation, you will now ask your vendors for a solution that would meet your application requirements.
The vendor’s solution generally combine the components of your EPC / RFID system and support from the vendor for installing these components.

80
Which solution should I choose?
First ensure:
Components
Proposed solution can be easily integrated with existing network and application and can be easily maintained
•Compatibility, •Consistency with operating frequency •Withstanding operating conditions
Antennas
•Correct type•Appropriate maximum power radiated and coverage area
Readers
•Read tags efficiently for all different products to be tagged

4.2 Installing the hardware

82
How should I install the hardware?
Typical process for installing core hardware for
EPC / RFID system:
TestComponents
MountAntenna
MountReader
InstallCables
Turn on Reader
Test the interrogation zone.
1 2 3 4 5
6
83
Testing the components
You need to validate that a particular component of a system (software, hardware, or both) is functioning properly with the promised performance before installing it.
For example, you should test that a reader meets the performance specifications, such as read range and multiple tag read rate, as specified by the vendor.
TestComponents1

84
Mounting the antenna
Somewhere in or near interrogation zone
maximizing propagation pattern.MountAntenna
2
Map from path loss contour analysis (PLCA) helps:• Determining exact location of antenna in given interrogation zone• Configuring and fine-tuning the antenna.
Consider protection from damage:•Attach using drills and screws, •Use a rack holding antenna, reader, power supply (UPS), and cables. •Racks are good to protect your system from harsh environmental conditions such as dust, humidity, and moisture.

85
Mounting the reader
Mount reader in rack or some surface or edge
(e.g. wall or gantry placed around conveyor).
Consider the following factors when mounting the reader:
Leave space around reader:• for cables • to keep air flowing (reader stays cool)
Avoid:• placing readers close to each other (minimize reader collisions) • placing readers close to sources of interferences• spots of harsh environmental conditions
Choose spot in which reader is safe from accidental physical damage

86
Installing the cables
You will need cables for various purposes such as:• Connecting the antenna to the reader port • Powering your components• Enabling your data transfer, for example from the reader to the
host computer
When installing cables you should:• Use the correct standard cable for a given connection • Keep the cables away from sources of electromagnetic waves
such as motors and electronic• Use labels to identify the cables and keep a cable layout to
avoid confusion and to have easy access for maintenance.• Use protective caps to cover the exposed parts of the cables,
such as cuts.

87
Turning the Reader on
Turn the reader on:
This defines interrogation zone
(area around the reader within which the reader can successfully communicate with a tag).

88
Testing the interrogation zone
To test the interrogation zone, you will:
• Determine the boundaries of the coverage area (interrogation zone) by measuring signal strength at various points around antenna
• Use spectrum analyzer to verify map of the path loss contour analysis (PLCA) determined during the site analysis
• Use the map of the PLCA to fine-tune and configure the RFID system.
Signalstrength
SpectrumAnalyzer
PLCA
89
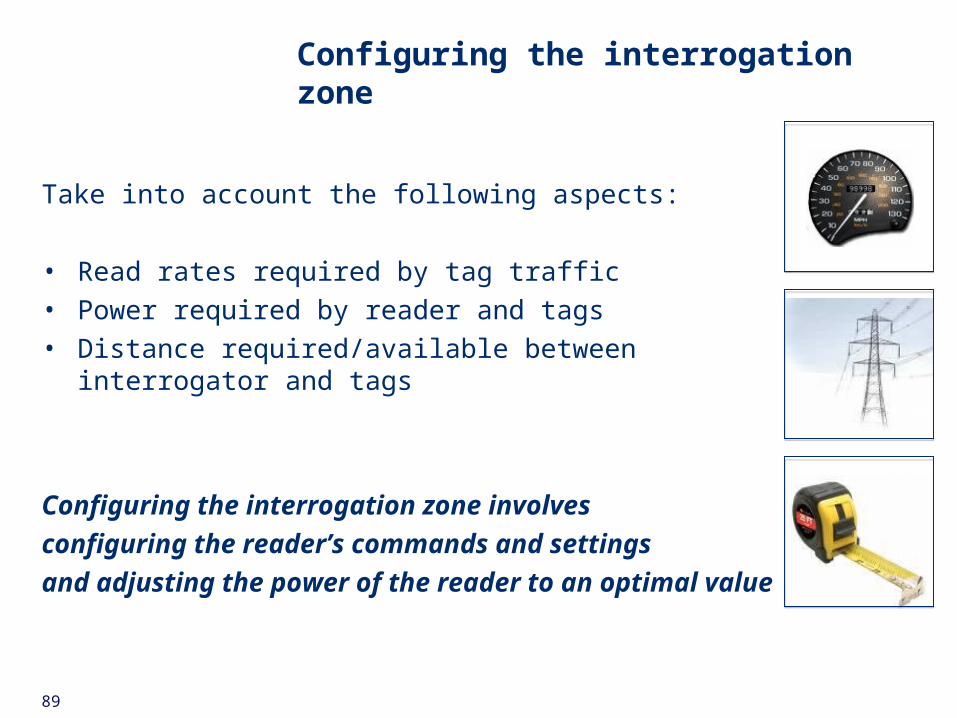
Configuring the interrogation zone
Take into account the following aspects:
• Read rates required by tag traffic• Power required by reader and tags• Distance required/available between interrogator and tags
Configuring the interrogation zone involves
configuring the reader’s commands and settings
and adjusting the power of the reader to an optimal value
90
Configuring the reader’s commands
Commands usually issued on host computer
(Either by application or using Graphical User Interface/GUI).
Common reader’s commands are:
• QUERY initiate the communication with tag
• READ get the data on tag
• WRITE write data on tag
• LOCK/UNLOCK prevent or allow writing data on tag
• KILL disable tag permanently
Additional commands such as
SELECT, INVENTORY or ACCESS
can also be available to help you
isolate group of tags or
isolate tags from a group.

91
Configuring the reader’s settings
Settings and features allow to:
• Adjust power output of reader.• Set operating frequency for reader• Select RFID protocol used by reader (e.g. anti- collision protocol • Set if reader will communicate in duplex or half duplex mode• Be notified when certain events occur.
E.g. if number of tags in interrogation zone exceeds a threshold• Filter which kind of tags to read and which to ignore• Define computers allowed to communicate with reader and users
allowed to use it.

92
Optimising the interrogation zone
Consider the following:
• Network has limited bandwidth and reader’s read cycles consume this bandwidth:
monitor your network traffic
• Adjust the power output for reader: attain required read range while avoiding zone overlaps and staying in limits set by safety regulations.
• If tags are in motion:
balance tag speed with reader’s read speed
Monitor Traffic
Adjust PowerOutput
=
Match Speed

4.3 Setting up the portals

94
Setting up a conveyer portal
Keep in mind:
• Keep antennas +/- 45 cm (1.5 ft) away from conveyor edges.
This avoids signal reflection by metal and other adverse effects
• One of the 4 antennas to be designed for optimal operations under conveyor.
• Reader must be able to make multiple attempts to read tag: mind speed of conveyor while configuring reader
• Polarization & alignment of reader antennas to be compatible with random orientation of tags.

95
Setting up a dock door portal
When setting up a dock door portal, make sure:
• To keep the cables out of harm’s way.
• Antennas are protected against accidental damage.
• # of antennas is large enough to cover width and expected height at which tagged items will be passing
• Not to have too many antennas: creates dense interrogator environment problem
• Most dock doors have 2 or 4 antennas on each side of door• Antennas from the 2 sides of door are not directly pointing
at each other: could cause interferences.
UHF systems provide required read range for dock door portals.

96
Setting up shelf portal
HF systems are generally used for shelf portals:
• sufficient read range
• relatively less affected by metals and liquid content
When setting up a shelf portal:
• Reader antennas to be properly placed, configured & oriented to avoid interference between neighboring antennas.
• You can create multi-shelved portal with 1 antenna per shelf using a multi-antenna reader. Configure reader to use antennas for reads in some sequential order.
• If change in # of items on shelf needs to be detected: readers to be configured to either continuously keep reading tags or have read cycles at preset intervals.

97
Setting up a stretch wrap station portal
Stretch wrap station portals have generally 2 antennas, one on the arm that moves with the roll of stretch wrap and the other one just next to the stretch wrap machine.
When setting up a stretch wrap station portal:• Protect the cabling of the first antenna taking into account the
arm movement that is give extra length to the cable so that it can follow the arm up and down
• Make sure the second antenna is not in the way of the forklift that will drop and pick up the pallet
98
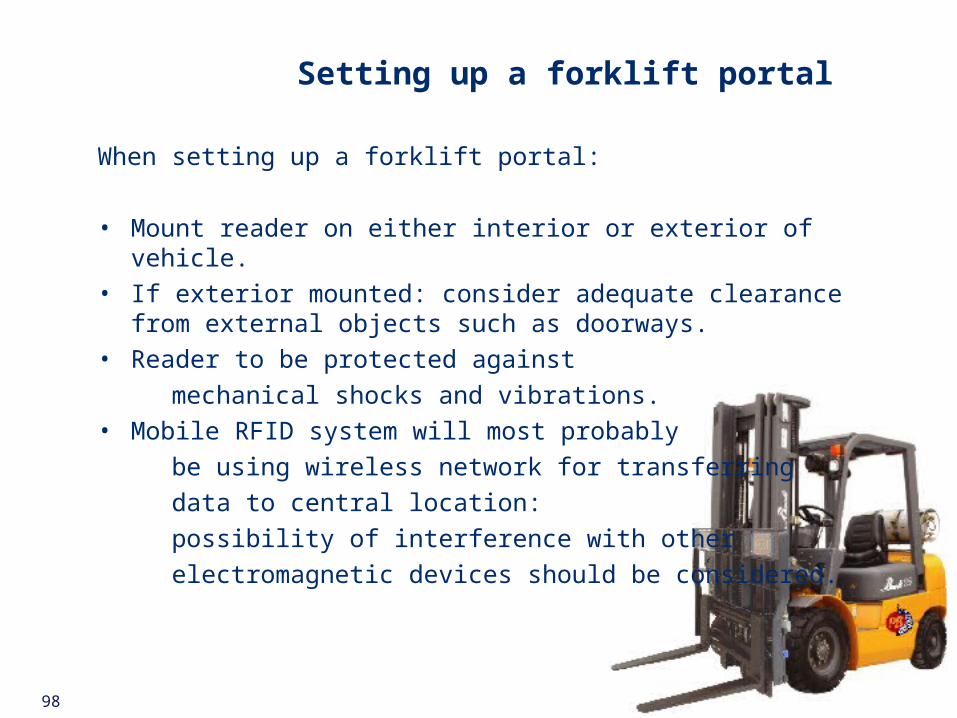
Setting up a forklift portal
When setting up a forklift portal:
• Mount reader on either interior or exterior of vehicle.• If exterior mounted: consider adequate clearance from external
objects such as doorways.• Reader to be protected against
mechanical shocks and vibrations.• Mobile RFID system will most probably
be using wireless network for transferring
data to central location:
possibility of interference with other
electromagnetic devices should be considered.

4.4 Integrating the infrastructure with the application
100
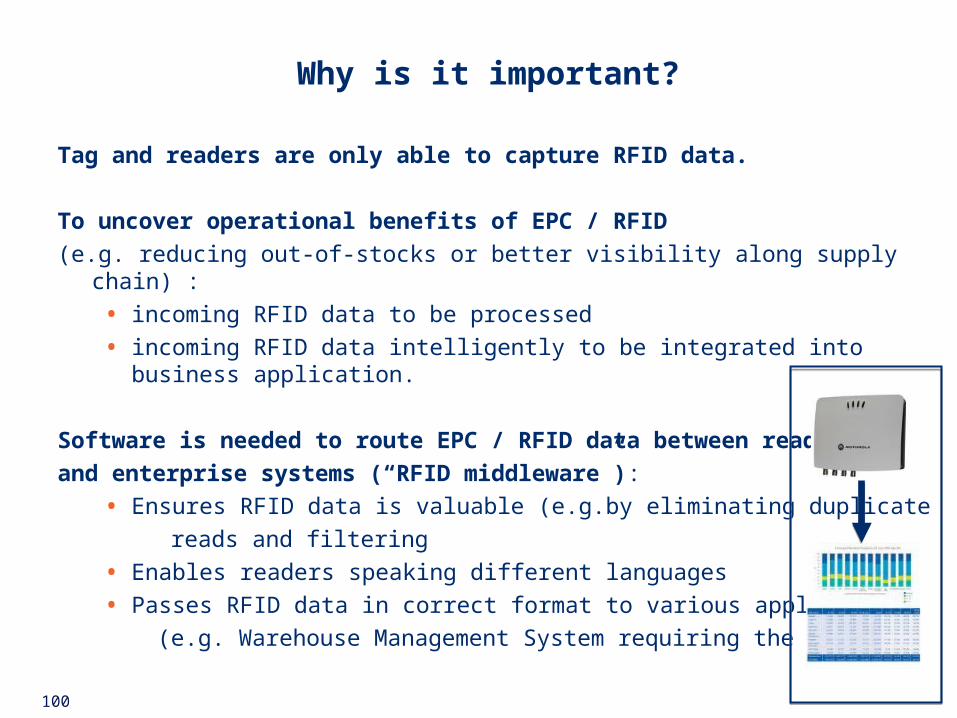
Why is it important?
Tag and readers are only able to capture RFID data.
To uncover operational benefits of EPC / RFID
(e.g. reducing out-of-stocks or better visibility along supply chain) :
• incoming RFID data to be processed
• incoming RFID data intelligently to be integrated into business application.
Software is needed to route EPC / RFID data between readers
and enterprise systems (“RFID middleware”):
• Ensures RFID data is valuable (e.g.by eliminating duplicate
reads and filtering
• Enables readers speaking different languages
• Passes RFID data in correct format to various applications
(e.g. Warehouse Management System requiring the data)

101
What should the middleware do?
Middleware should include 7 core capabilities:
1) Reader and device management
Allows users to configure, deploy & issue commands to readers through common interface.
• Data management
Ensures captured data is intelligently filtered & routed to
appropriate destinations
• Application integration
You need messaging, routing & connectivity features to reliably integrate RFID data into existing systems (e.g. ERP, WMS or CRM)
1) Partner integration
You need B2B integration features (e.g. partner profile management & communication protocols) to efficiently integrate with partner’s data over EDI or web-based systems

102
What should the middleware do?
5) Process management
Allows orchestrating RFID related end-to-end processes.
E.g. link receiving process to inventory & POS process
so system automatically reorders more products without human intervention when inventory is too low
6) Packaged RFID content
You don’t have to start developing RFID applications
(e.g. shipping or asset tracking) from scratch .
• Architecture scalability
Allows system to balance processing load across multiple servers
& reroute data automatically if a server fails.

103
Where should the middleware go?

4.5 Ensuring safety

105
Ensuring safety is a requirement
Ensuring safety for EPC / RFID system & personnel working in zones where system is installed is mandatory step of the installation process
We have already learned that racks or similar protections can be used for protecting components of your system from shocks or harsh conditions.
You also have to protect your system and the personnel operating it from electrostatic discharges by installing for example wrist straps or floor mats

106
Grounding and ground loops
System Components must be grounded:
• To prevent electric shock or fires caused by voltage difference between earth and conducting metal.
• To protect personnel & equipment from lightning strikes.
• To reduce noise & interference coming from computers & readers ensuring system has minimal impact on already existing radiofrequency systems.
Protect your system and personnel from ground loops
by ensuring that the conductor used for grounding
is short enough and that all the readers are connected
to the same grounding system.

4.6 Summary

108
Summary
In this chapter, you have leaned that the implementation of an EPC / RFID system is a process that starts with the documentation collected during the system design and the site analysis.
You have learned how to install your hardware components such as antennas, readers and portals and how to integrate this infrastructure with your application by using the middleware.
Finally, you have been reminded that you must safely protect your system’s components as well as the personnel operating close to your system

Chapter 5 –
The monitoring & troubleshooting of the system

110
What is in this chapter?
Now that you have designed and installed your RFID system, you have to expect to encounter problems such as reader failure, tag failure or network connectivity problems.
Therefore you need to monitor and troubleshoot your system and this chapter will explain you how to do it successfully.
You will learn that monitoring your RFID system involves status monitoring and performance monitoring
You will also learn that you will need to troubleshoot the system for finding the causes for the problems identified during the monitoring and fix these problems.

5.1 What is monitoring?

112
Status monitoring
Monitoring of basic status of system and devices within it, e.g.:
• Is the device connected to the network?• Are the devices powered?• Are the antennas operating?• Is a reader reading the tags successfully?
Please note
Some solutions include status indicator panel
on your desktop allowing to monitor status
of all readers from one location.
Feedback systems (e.g. light tree and horns)
discussed in Chapter 2, can also play an
important role in status monitoring.

113
Performance monitoring
Monitoring performance of a system and the devices within it, e.g.:
• Read rates of readers
• Reading accuracy
• Error frequency
Performance data on predetermined metrics (e.g. read rates) helps determine normal behavior of the system & identify the variance in normal behavior and hence a problem.
6 σ
96%
99%

5.2 Monitoring the interrogation zones

115
What should I look for?
The Interrogation Zone has several parameters characterizing it:
• Number of tags passing through the zone
• Number of tags being successfully read
• Number of tag that can’t be read or read errors
• Reader failure

116
Mean Time Between Failure
MTBF:
Average time between two consecutive failures of a device or
a system. • Indicates robustness of system measured in the past & predicts rate of
failure in near future.
total lifetime of the device
total number of failures recorded
Example:• 20 readers on system• In 10 day period: 6 readers fail once
1 reader fails twice• 20 readers x 10 days = 200 reader days of operation
200 days
6+2 failures
• Calculated as:
• MBTF: = 25 days/failure

117
Average tag traffic volume (ATTV)
Average number of tags passing through an interrogation
zone during an interval of time (e.g. minute or hour).
• Monitoring system collects tag counts and time at which tag was counted from readers.
• Example:
Time interval = 1hour
During the last 4 hours, 10, 20, 30 and 40 tags respectively were detected.
ATTV is :
From the ATTV measurements,
you can predict how much traffic
is expected to pass through an
interrogation zone during a certain period.
10+20+30+40 tags 4 hours
= 100 tags 4 hours
= 25 tags/hour

118
Actual Versus Predicted Traffic Rate (APTR)
Variance of actual tag traffic from predicted tag traffic
through interrogation zone over a time period.
A significant variance could indicate a problem with the system.
APTR = Current Average Tag Traffic Volume (ATTV) - predicted ATTV
Example:
Current ATTV: 25 tags/hour for the past 4 hours.
Predicted ATTV: 15 tags/hour
Variance : 10 tags/hour more than predicted
25
15APTR: = 166 %
Compare actual value to predicted value for thesame time interval & period of day(e.g. from 2.00 to 6.00 pm) as tag traffic can bedifferent at different hours of the day. vs

119
Read Error to Total Read Rates (RETR)
Read errors to total reads rate (RETR) is the total number of read errors divided by the total number of read attempts.
Example:
450 tags read successfully
50 tags couldn’t be read
I.e. You have a problem with 1 tag every 10 tags.
= 5050+450RETR: = 10 % 50
500
30%!
High RETR value is alarm for problem with RFID system:
•internal problem: faulty antenna or low signal strength
•adverse environmental effects: absorption and/or interference.
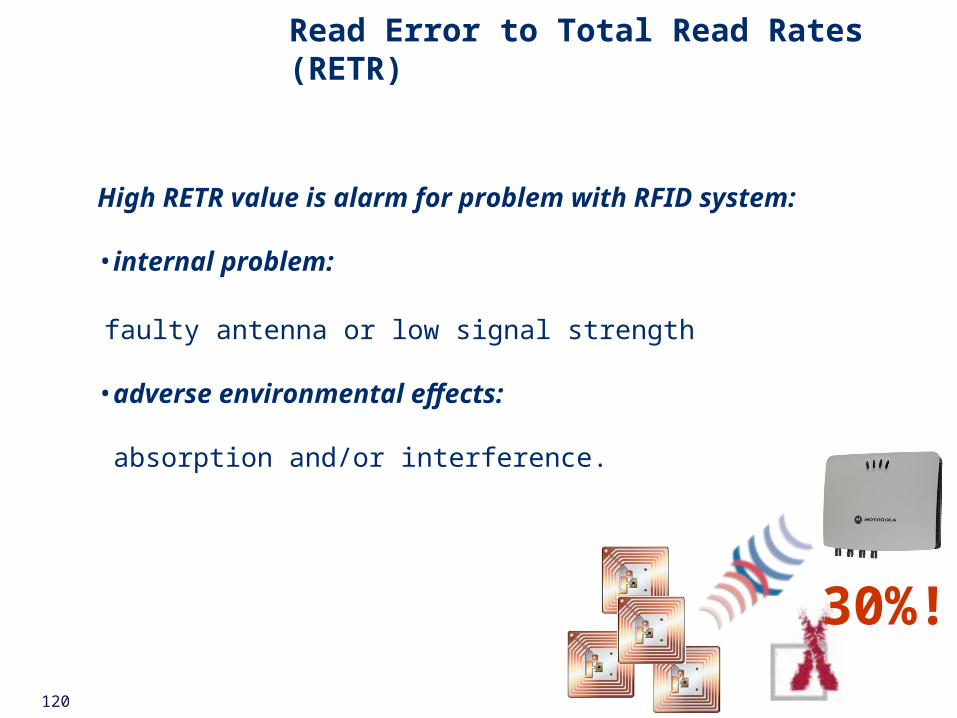
120
30%!
High RETR value is alarm for problem with RFID system:
•internal problem:
faulty antenna or low signal strength
•adverse environmental effects: absorption and/or interference.
Read Error to Total Read Rates (RETR)

5.3 Monitoring the tags

122
Why is it important?
Process of manufacturing tags & application to items has significantly matured, still tag failures do occur.
• Monitoring tags is important task for RFID professional. • Ensure tags are properly placed on items. • Know the reasons why tags can fail and how to manage these failures. • Tags are placed on items to be tracked before the items get out into the
world.
The first step in monitoring tags is to identify improperly tagged items.

123
Identifying improperly tagged items
There are four kinds of improperly tagged items:
• Items tagged with faulty tags.• Items on which tags are placed incorrectly
(where they cannot be read properly by the reader).• Items on which tags are placed at correct spot but they are
applied incorrectly, (e.g. bent or folded).• Items on which tags are not properly oriented when correct
orientation is required for efficient reading.

124
Identifying improperly tagged items
Methods for identifying improperly tagged items:
• Inventory discrepancies
Tags on the items were not properly read; hence the items were not counted.
• Feedback devices, (photo eyes, motion sensors, …)
Provide presence information of item + instruct reader to read it.
If reader cannot see it, it could be an improperly tagged item.• Placing interrogation portal right after application point
If the tag cannot be read, it might be defective or improperly placed.• Manual inspection,
Perhaps before shipping.
125
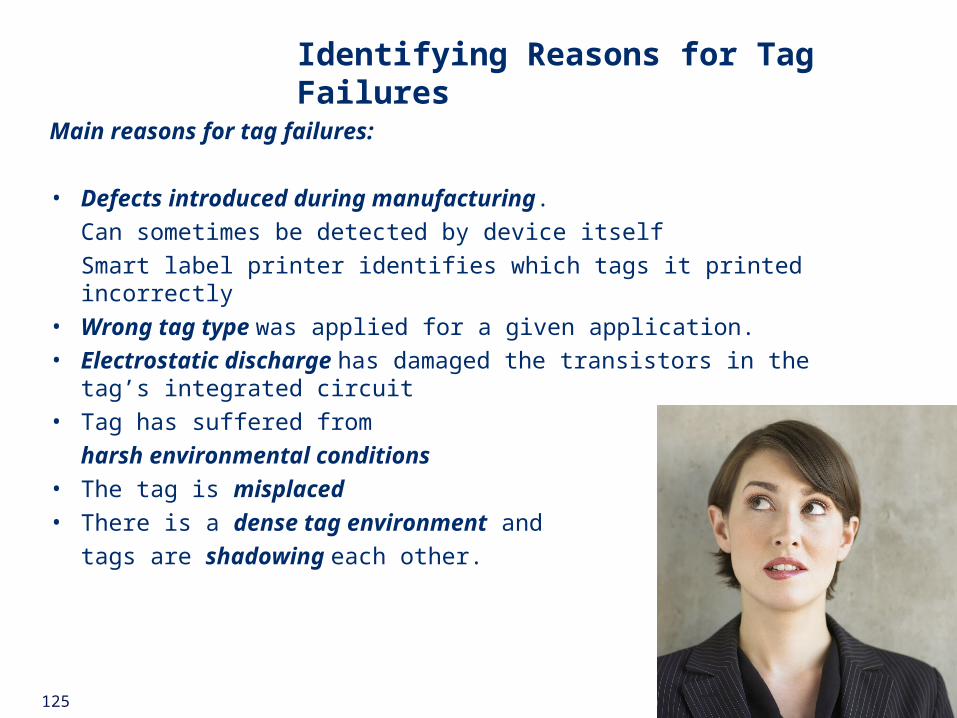
Identifying Reasons for Tag Failures
Main reasons for tag failures:
• Defects introduced during manufacturing.
Can sometimes be detected by device itself
Smart label printer identifies which tags it printed incorrectly • Wrong tag type was applied for a given application.• Electrostatic discharge has damaged the transistors in the
tag’s integrated circuit• Tag has suffered from
harsh environmental conditions• The tag is misplaced• There is a dense tag environment and
tags are shadowing each other.

5.4 Troubleshooting

127
Identifying the problem
Now that you have identified the problem, it is time to solve it by using standard troubleshooting procedure.
The first step is to clearly identify and define the problem.
You should do so by documenting the symptoms and by identifying the affected area
If you have identified and defined the problem, in most cases you should be able to reproduce it.

128
Identifying the causes of the problem
Once problem has been identified and defined, find what is causing the problem.
Root Cause Analysis method
Problems are best solved by attempting to correct or eliminate root causes, (vs addressing immediately obvious symptoms)
Ask what has changed since last time system was working fine.
Use method of elimination to narrow down and isolate the real cause. • Eliminate relatively obvious causes/problems
• Make your way to more complex causes or problems.

129
Solving the problem
Good Understanding of Problem
Possible CausesIdentified
Work on Causes
+Change
Plan & ImplementSolution
Test solution
Document Solution

5.5 Summary

131
Summary
In this chapter, you have learned that the monitoring and troubleshooting are essential parts of running an effective RFID system.
You understood that status monitoring consists of monitoring the status of a system and its devices while performance monitoring consists of measuring the performance metrics of the system or device.
Significant variation in the values of some of these performance metrics can indicate instability of or problems with the system that you will need to troubleshoot.
The standard troubleshooting procedure is identify the problem, identify the cause, implement the solution, test the solution, and document the solution.


