Download - Ecosystem Response to Climate Change
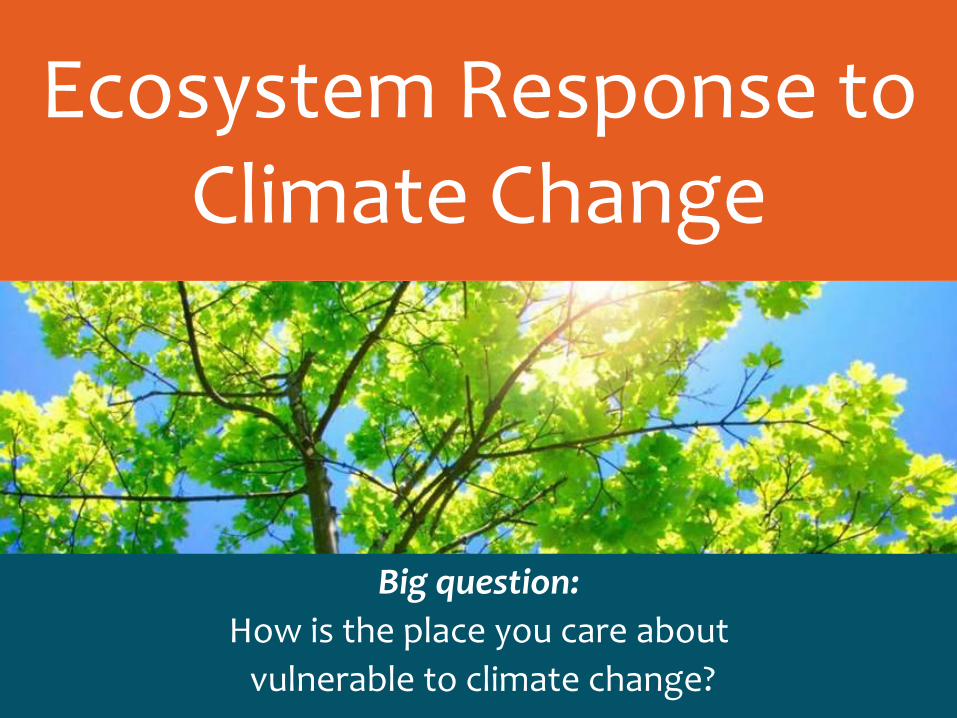
Ecosystem Response to Climate Change
Big question:
How is the place you care about
vulnerable to climate change?
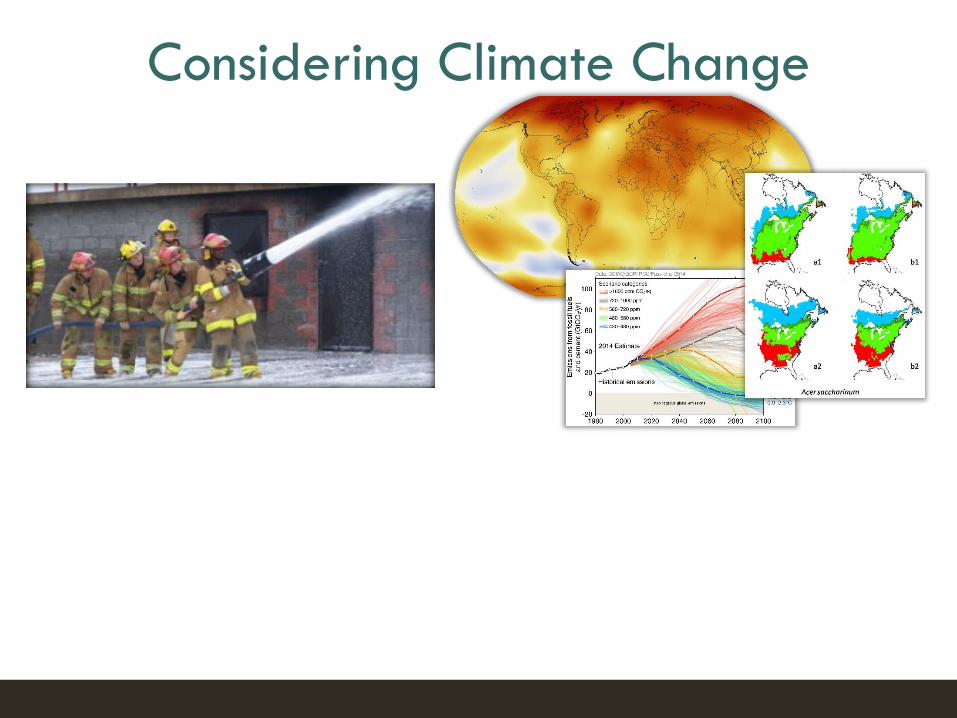
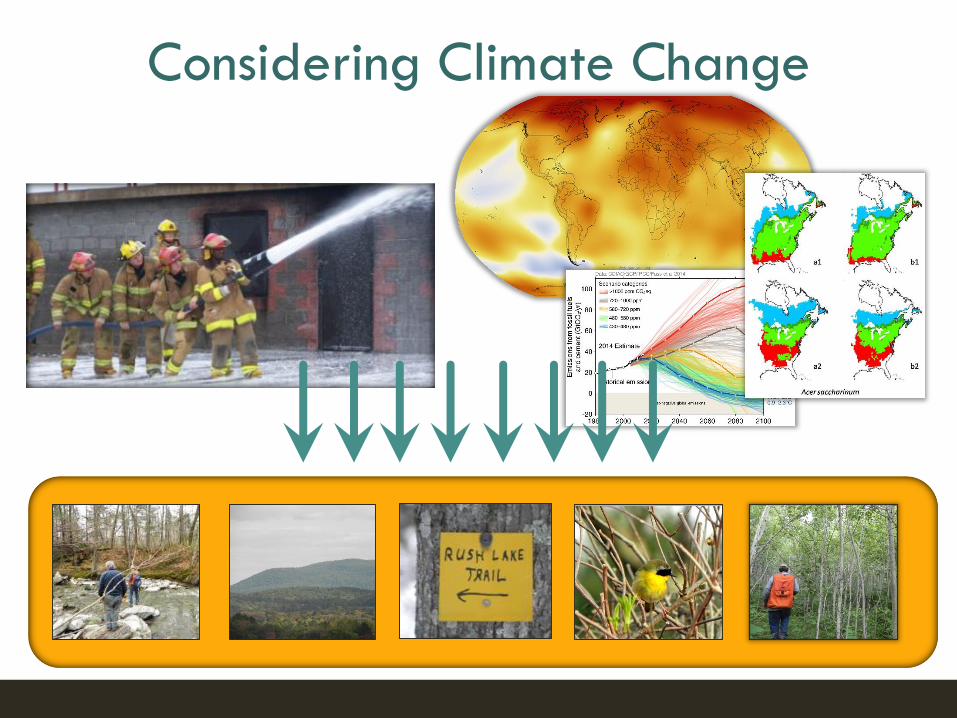
Considering Climate Change
Considering Climate Change

What’s actually changed?
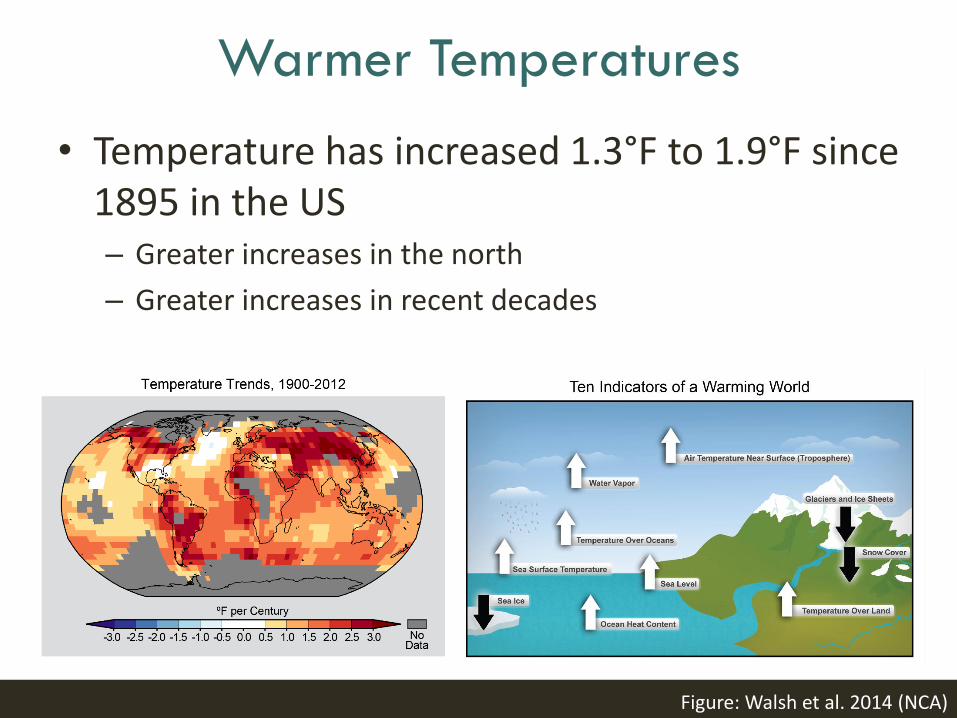
Warmer Temperatures
Figure: Walsh et al. 2014 (NCA)
• Temperature has increased 1.3°F to 1.9°F since 1895 in the US– Greater increases in the north
– Greater increases in recent decades
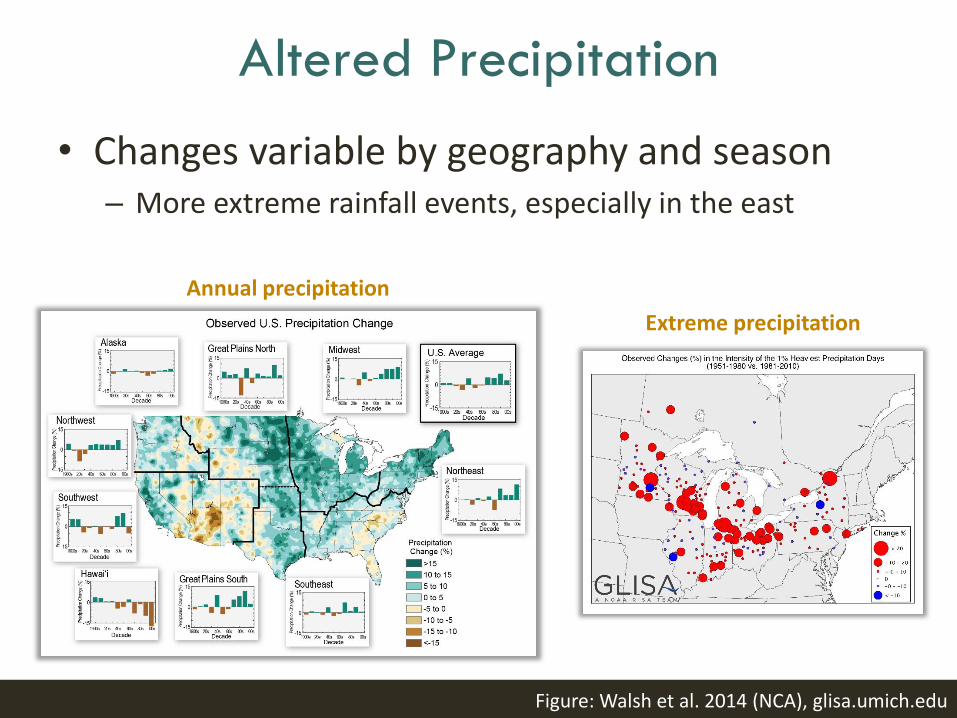
Altered Precipitation
Figure: Walsh et al. 2014 (NCA), glisa.umich.edu
• Changes variable by geography and season– More extreme rainfall events, especially in the east
Annual precipitation
Extreme precipitation
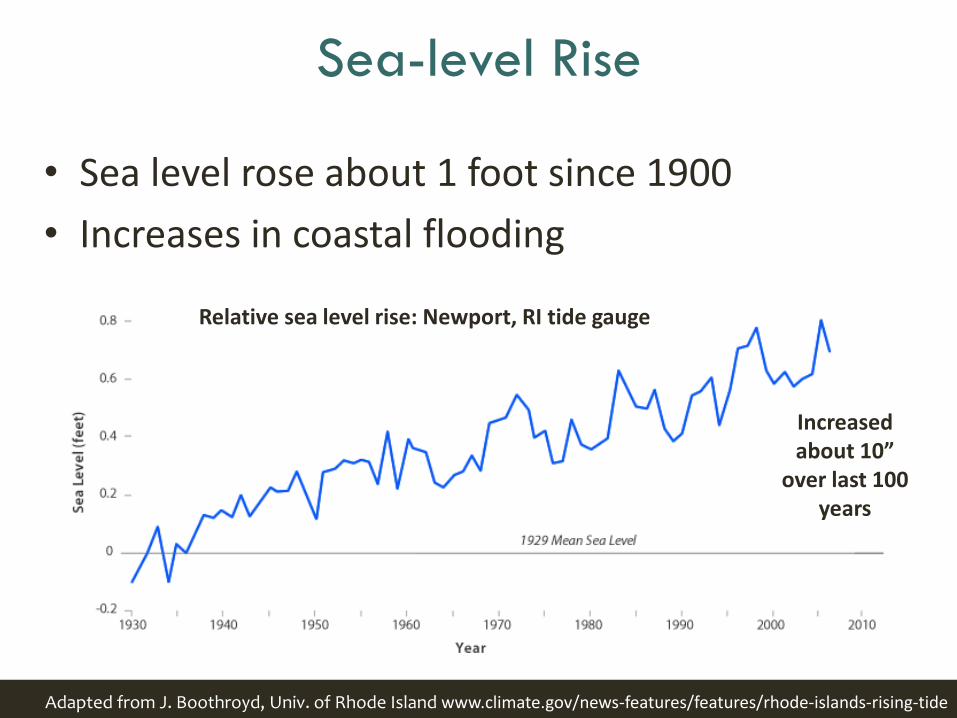
Sea-level Rise
• Sea level rose about 1 foot since 1900
• Increases in coastal flooding
Adapted from J. Boothroyd, Univ. of Rhode Island www.climate.gov/news-features/features/rhode-islands-rising-tide
Relative sea level rise: Newport, RI tide gauge
Increased about 10”
over last 100 years
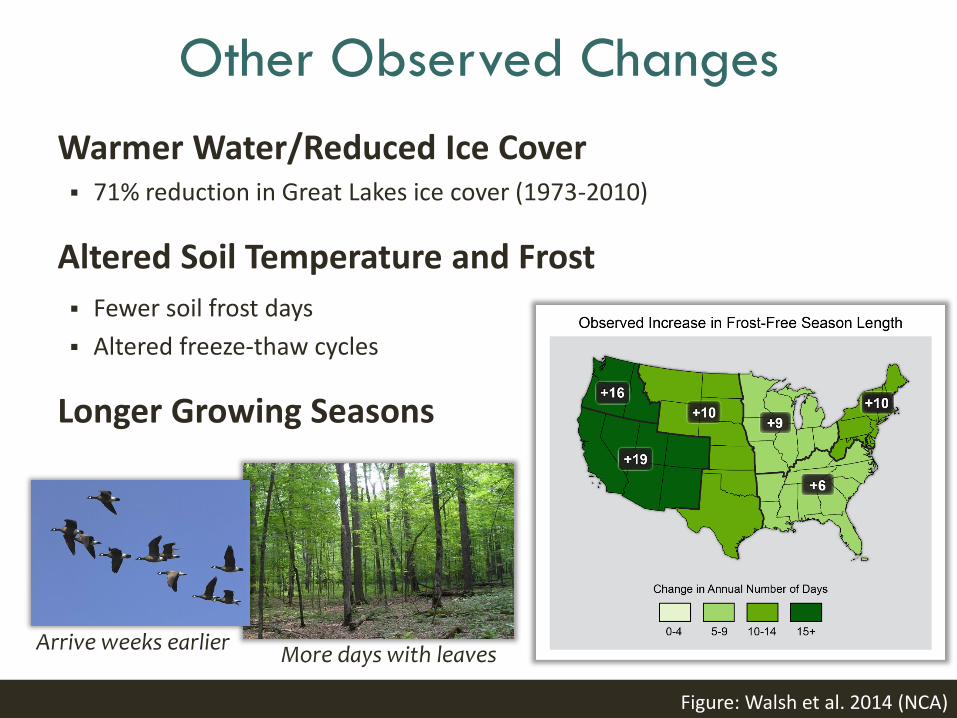
Other Observed Changes
Warmer Water/Reduced Ice Cover 71% reduction in Great Lakes ice cover (1973-2010)
Altered Soil Temperature and Frost
Fewer soil frost days
Altered freeze-thaw cycles
Longer Growing Seasons
Arrive weeks earlierMore days with leaves
Figure: Walsh et al. 2014 (NCA)
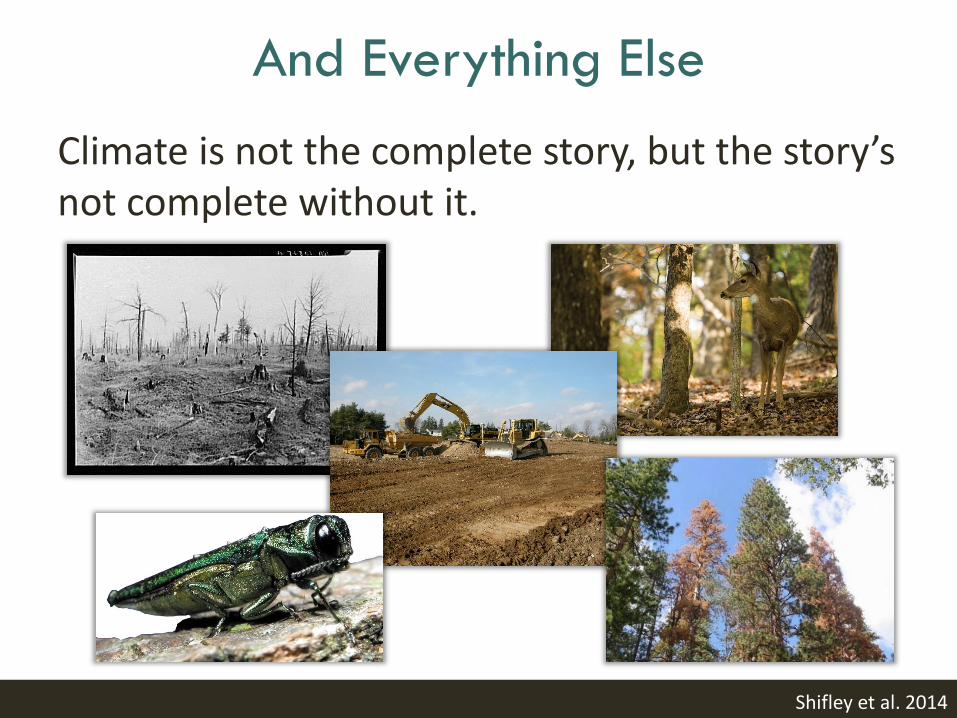
And Everything Else
Climate is not the complete story, but the story’s not complete without it.
Shifley et al. 2014
How is the climate expected to change over the next century?
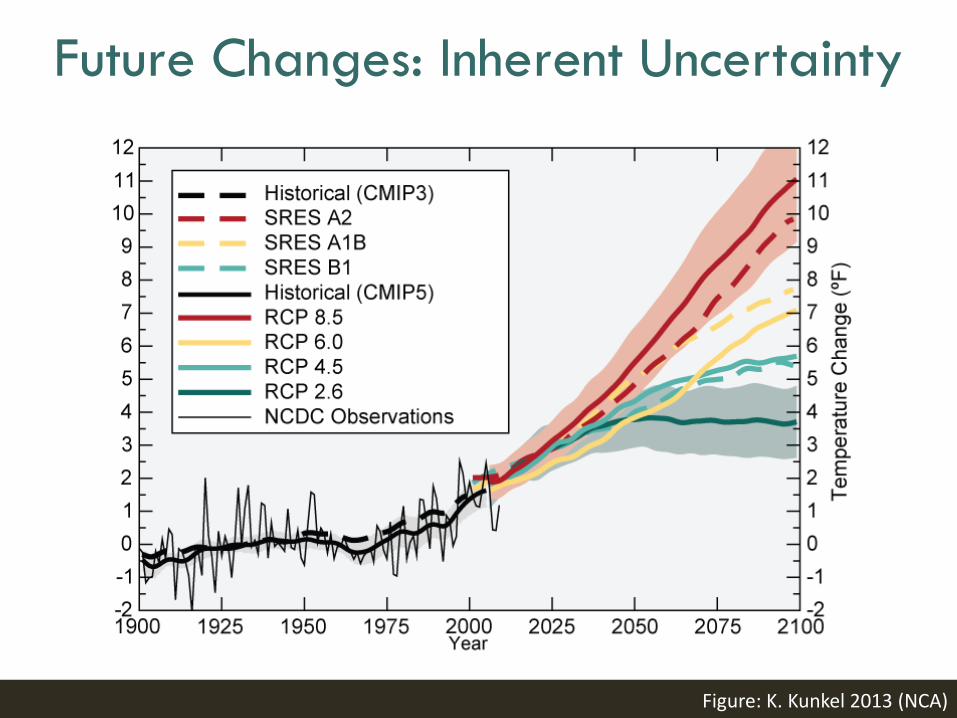
Future Changes: Inherent Uncertainty
IPCC 2007, Graphic: C. Wake, Univ. New HampshireFigure: K. Kunkel 2013 (NCA)
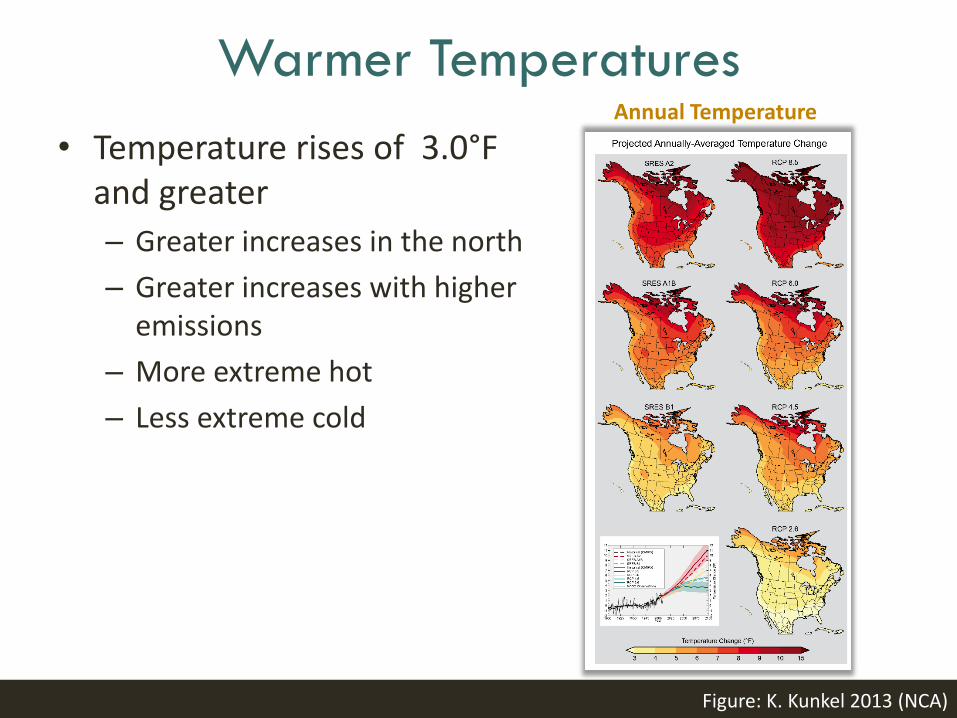
Warmer Temperatures
• Temperature rises of 3.0°F and greater
– Greater increases in the north
– Greater increases with higher emissions
– More extreme hot
– Less extreme cold
Figure: K. Kunkel 2013 (NCA)
Annual Temperature
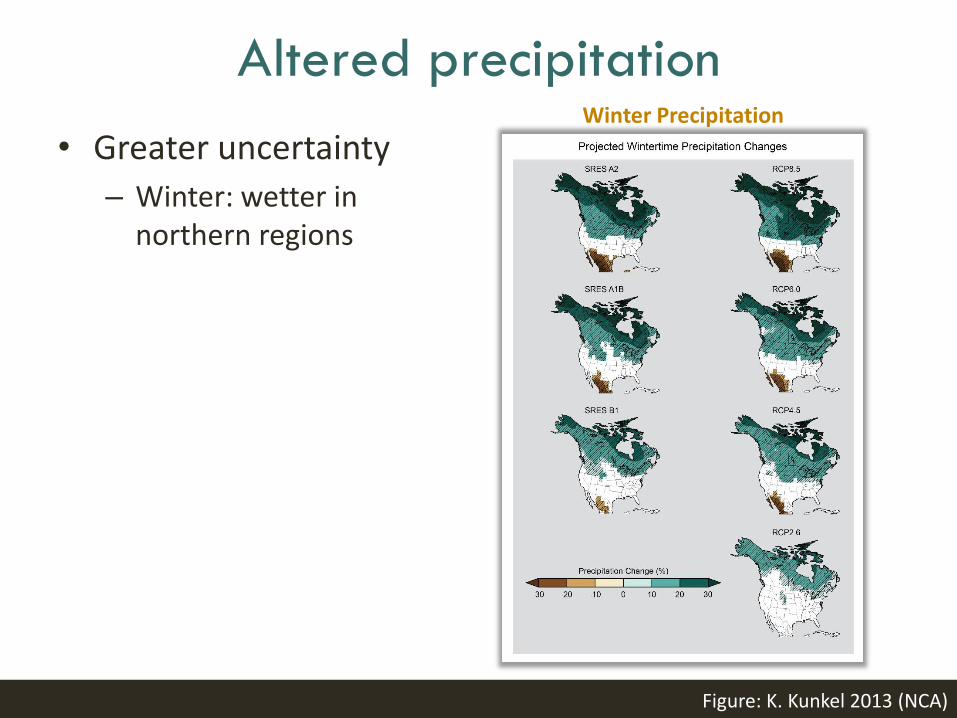
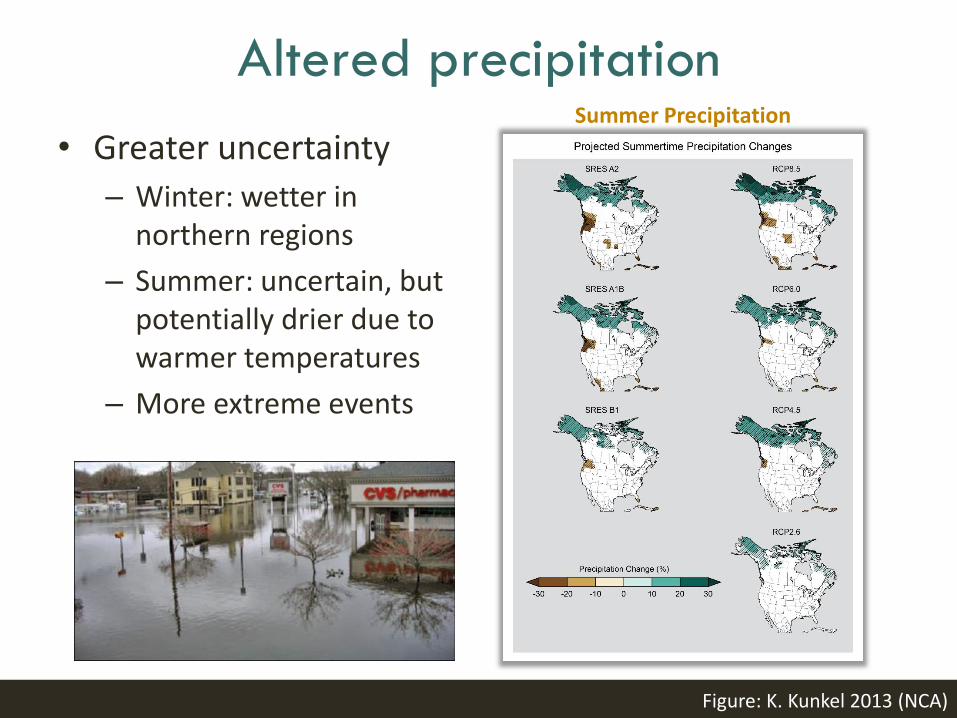
Altered precipitation
• Greater uncertainty
– Winter: wetter in northern regions
Figure: K. Kunkel 2013 (NCA)
Winter Precipitation
Altered precipitation
• Greater uncertainty
– Winter: wetter in northern regions
– Summer: uncertain, but potentially drier due to warmer temperatures
– More extreme events
Figure: K. Kunkel 2013 (NCA)
Summer Precipitation
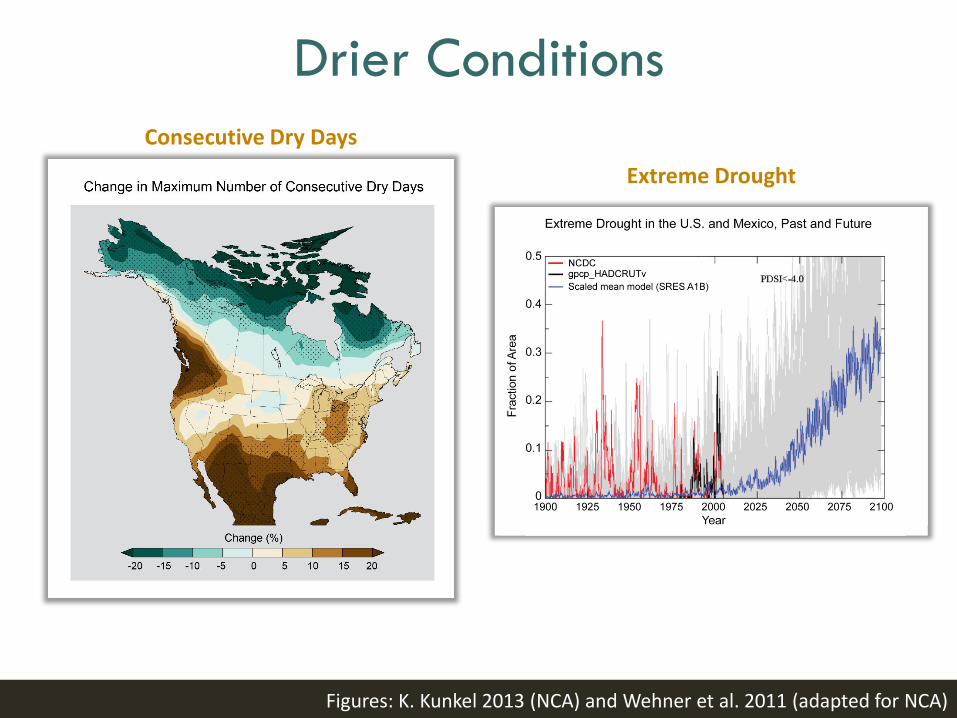
Drier Conditions
Figures: K. Kunkel 2013 (NCA) and Wehner et al. 2011 (adapted for NCA)
Consecutive Dry Days
Extreme Drought
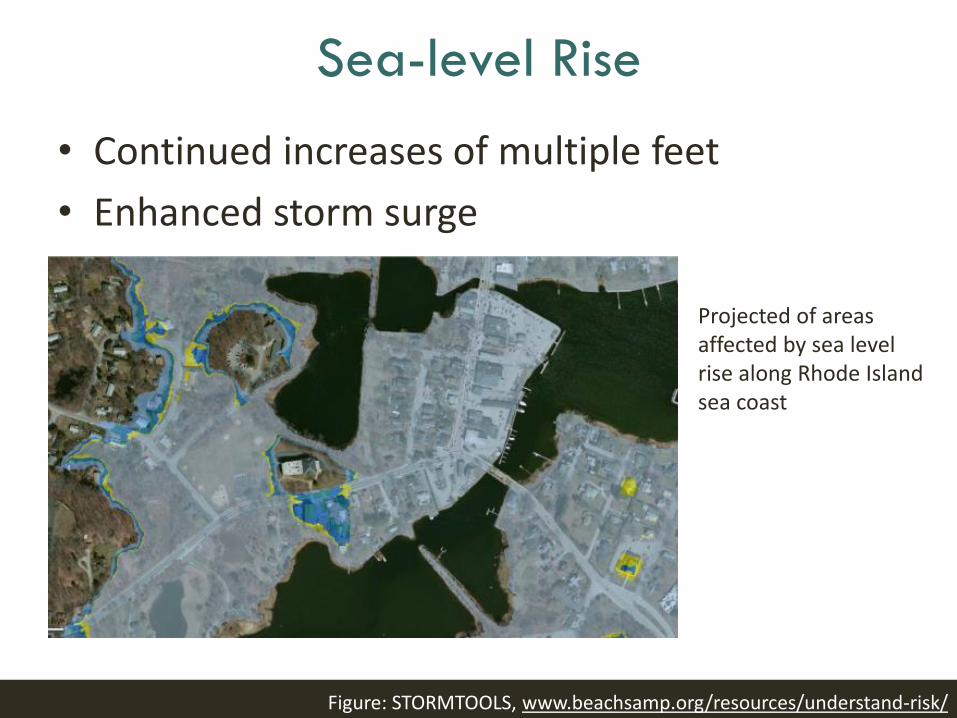
Sea-level Rise
• Continued increases of multiple feet
• Enhanced storm surge
Projected of areas affected by sea level rise along Rhode Island sea coast
Figure: STORMTOOLS, www.beachsamp.org/resources/understand-risk/
How could ecosystems be affected?
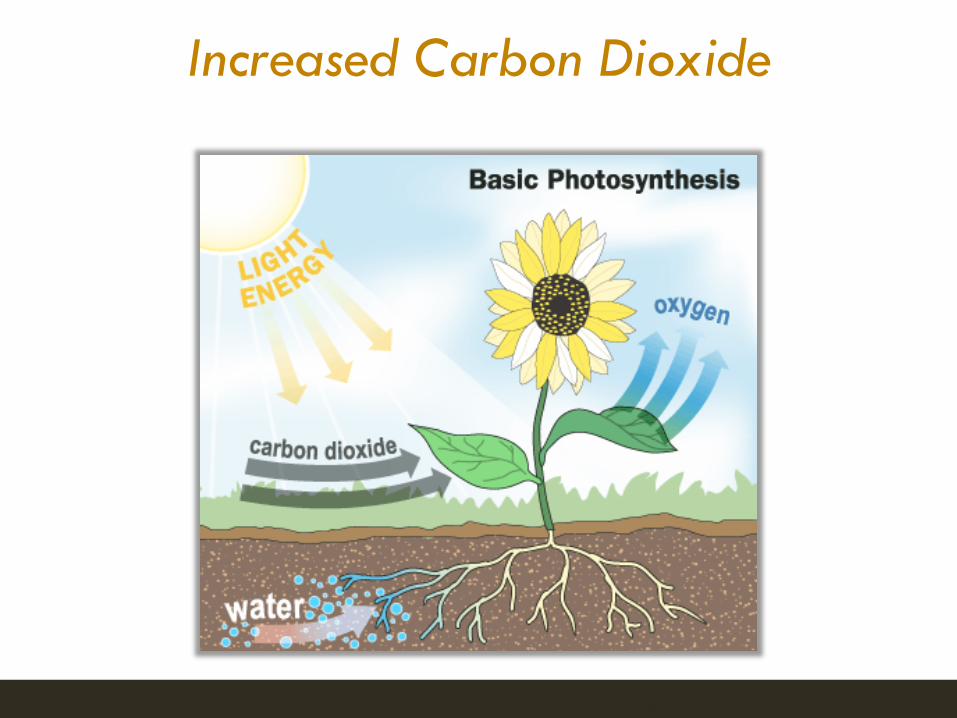
Increased Carbon Dioxide
Image: www.science.howstuffworks.com
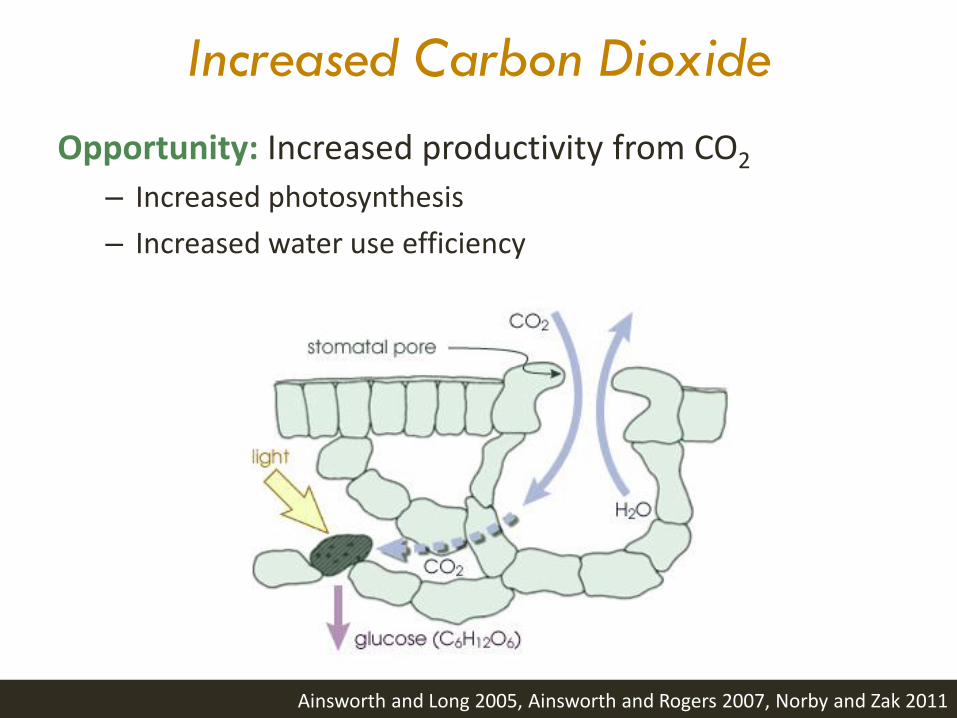
Increased Carbon Dioxide
Opportunity: Increased productivity from CO2
– Increased photosynthesis
– Increased water use efficiency
Ainsworth and Long 2005, Ainsworth and Rogers 2007, Norby and Zak 2011
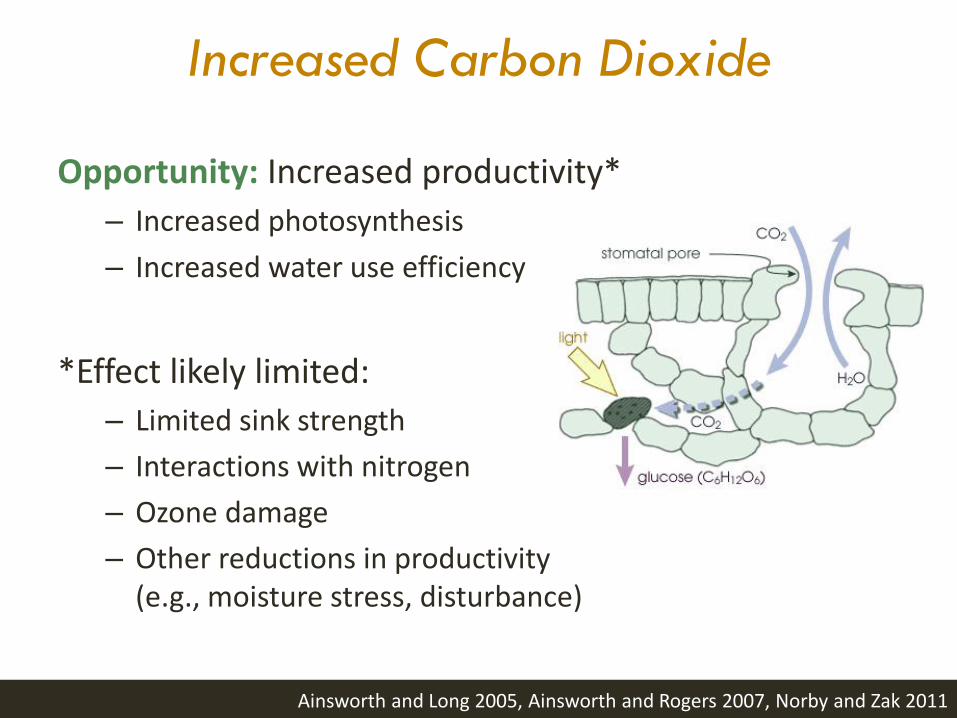
Increased Carbon Dioxide
Opportunity: Increased productivity*
– Increased photosynthesis
– Increased water use efficiency
*Effect likely limited:
– Limited sink strength
– Interactions with nitrogen
– Ozone damage
– Other reductions in productivity (e.g., moisture stress, disturbance)
Ainsworth and Long 2005, Ainsworth and Rogers 2007, Norby and Zak 2011
Longer Growing Seasons
Warmer temps result in longer growing seasons
• Evidence of phenological shifts
• Projected to increase 3-7+ weeks
Opportunity: Longer period for plant growth
Melillo et al. 2014 (NCA), Nelson Center 2014
Longer Growing Seasons
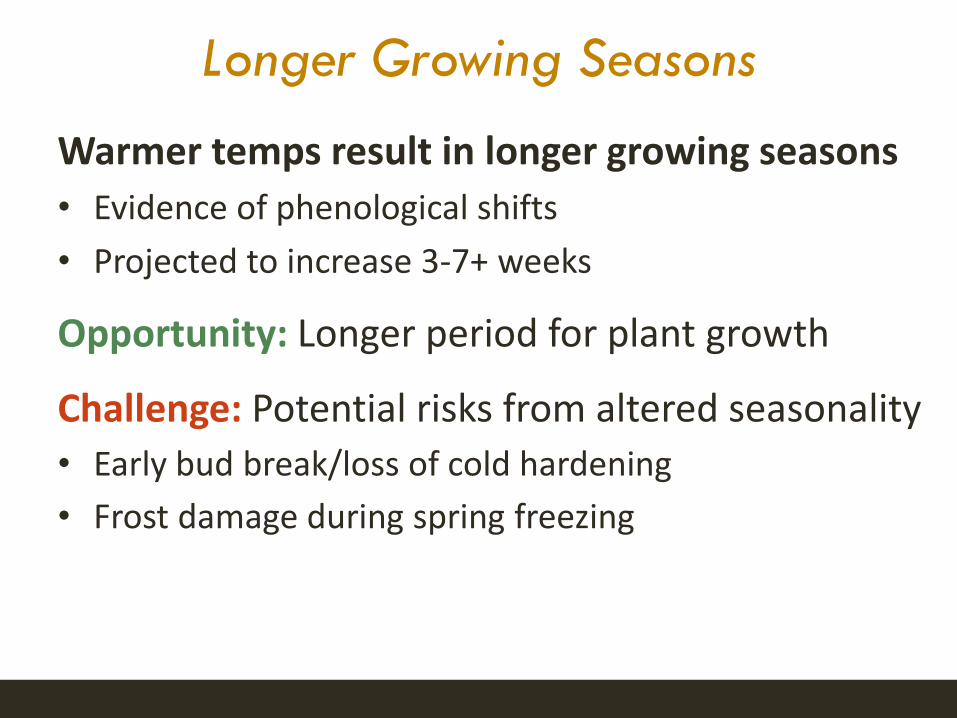
Warmer temps result in longer growing seasons
• Evidence of phenological shifts
• Projected to increase 3-7+ weeks
Opportunity: Longer period for plant growth
Challenge: Potential risks from altered seasonality
• Early bud break/loss of cold hardening
• Frost damage during spring freezing
Shorter Winter = Less Snow
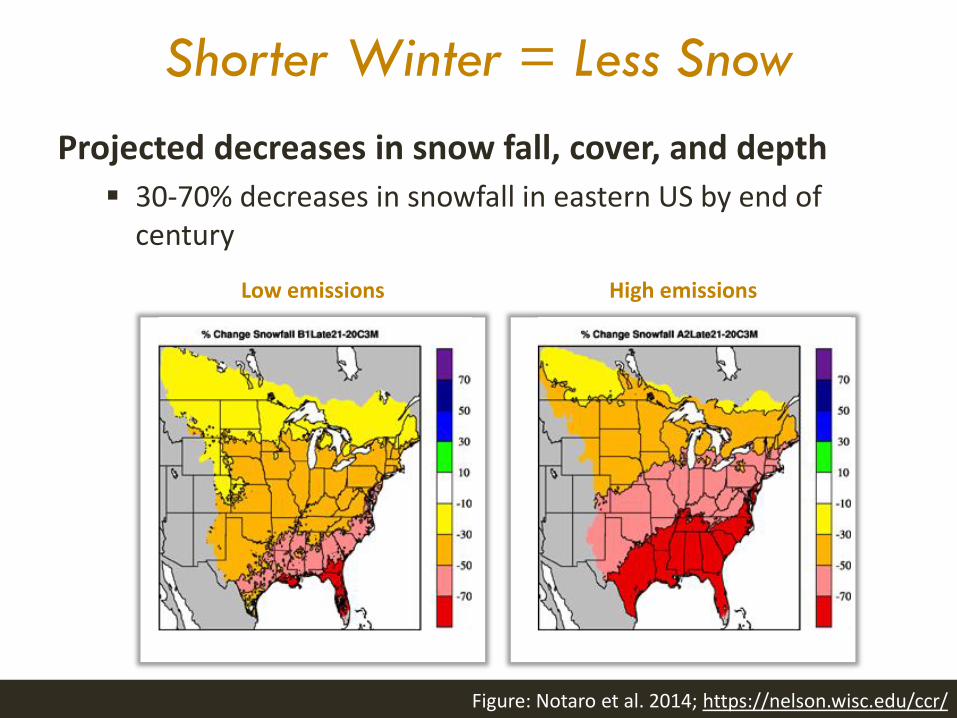
Projected decreases in snow fall, cover, and depth
30-70% decreases in snowfall in eastern US by end of century
Figure: Notaro et al. 2014; https://nelson.wisc.edu/ccr/
Low emissions High emissions
Shorter Winter = Less Snow
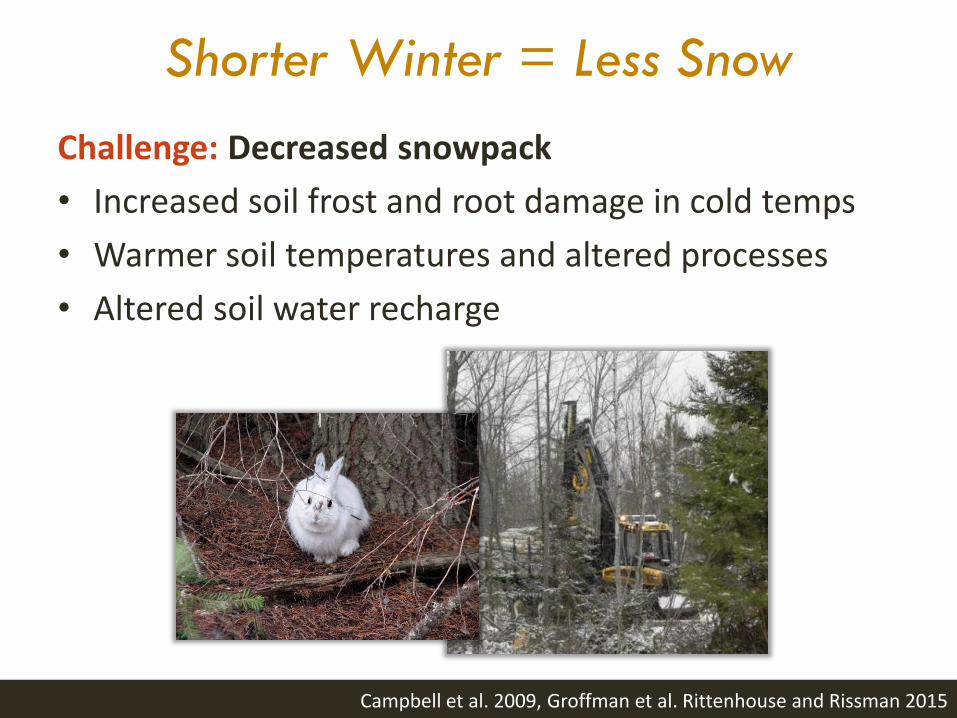
Challenge: Decreased snowpack
• Increased soil frost and root damage in cold temps
• Warmer soil temperatures and altered processes
• Altered soil water recharge
Campbell et al. 2009, Groffman et al. Rittenhouse and Rissman 2015
Shorter Winter = Less Snow, More Rain
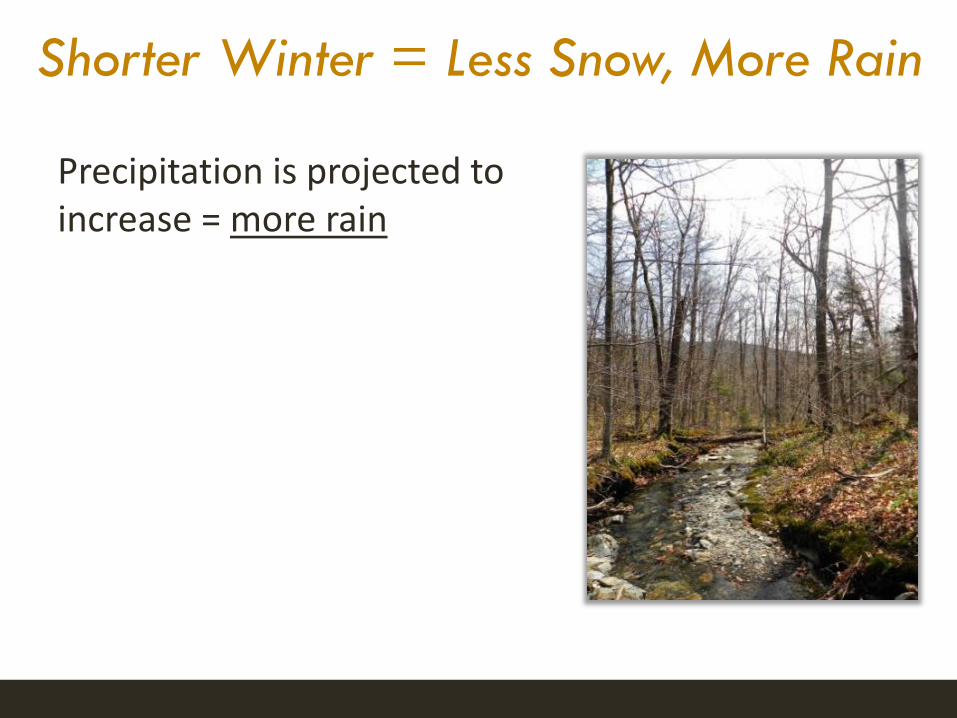
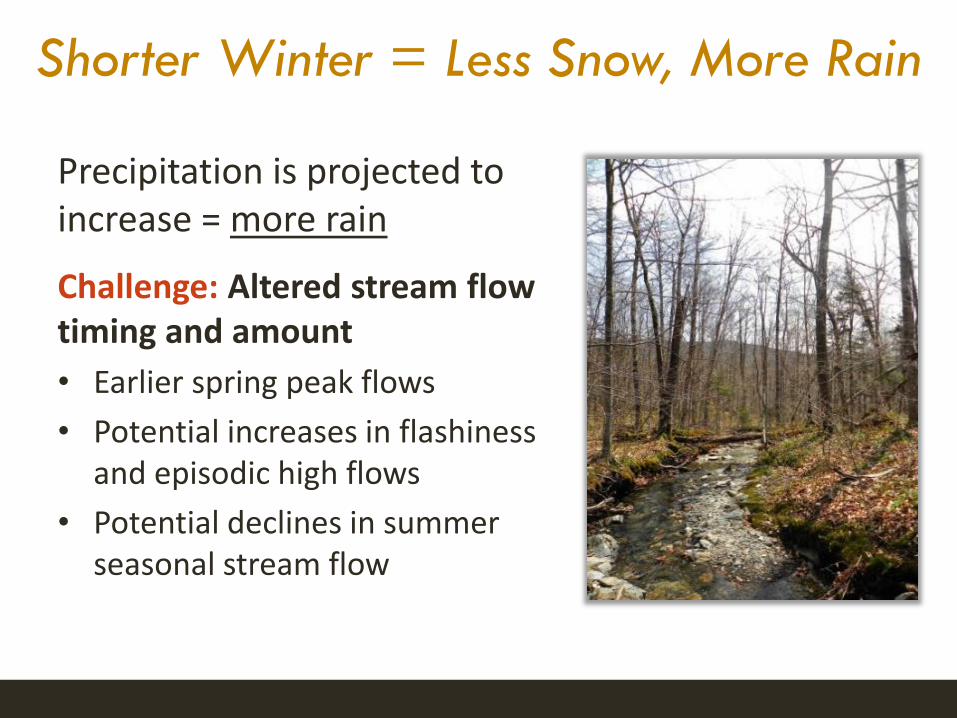
Precipitation is projected to increase = more rain
Shorter Winter = Less Snow, More Rain
Precipitation is projected to increase = more rain
Challenge: Altered stream flow timing and amount
• Earlier spring peak flows
• Potential increases in flashiness and episodic high flows
• Potential declines in summer seasonal stream flow
Longer Growing Season + Altered Precip
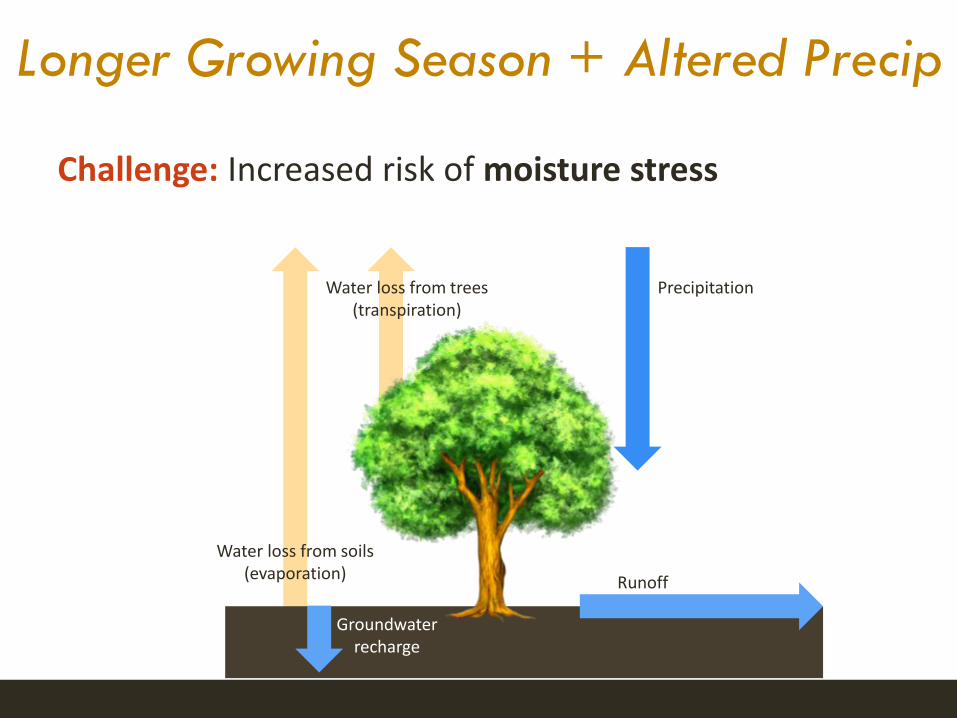
Challenge: Increased risk of moisture stress
Water loss from soils (evaporation)
Water loss from trees (transpiration)
Groundwater recharge
Runoff
Precipitation

Longer Growing Season + Altered Precip
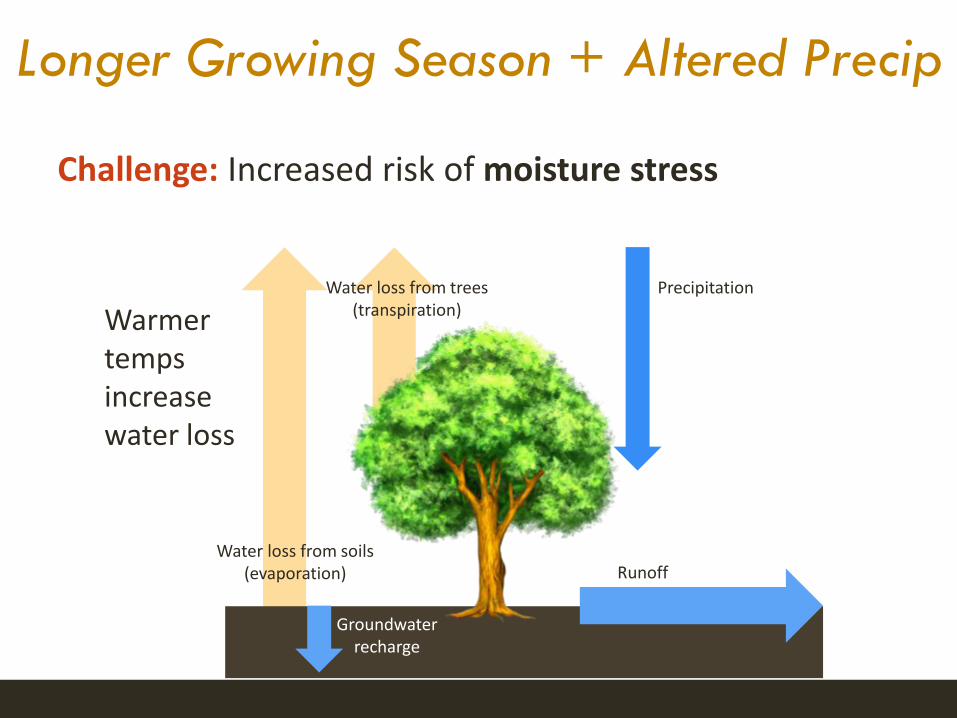
Challenge: Increased risk of moisture stress
Water loss from soils (evaporation)
Water loss from trees (transpiration)
Groundwater recharge
Runoff
Precipitation
Warmer temps increase water loss
Longer Growing Season + Altered Precip
Challenge: Increased risk of moisture stress
Water loss from soils (evaporation)
Water loss from trees (transpiration)
Groundwater recharge
Runoff
Precipitation
Warmer temps increase water loss
Changes in Habitat Suitability
Challenge: Decline of northern/boreal species
Opportunity: Increased habitat for some species
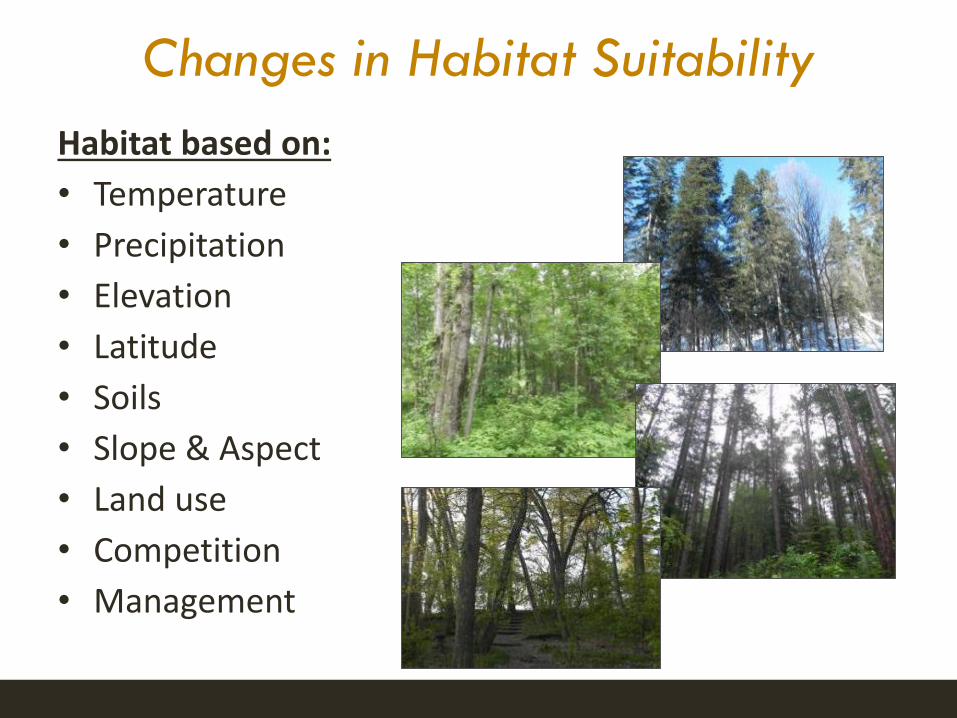
Changes in Habitat Suitability
Habitat based on:
• Temperature
• Precipitation
• Elevation
• Latitude
• Soils
• Slope & Aspect
• Land use
• Competition
• Management
Changes in Habitat Suitability
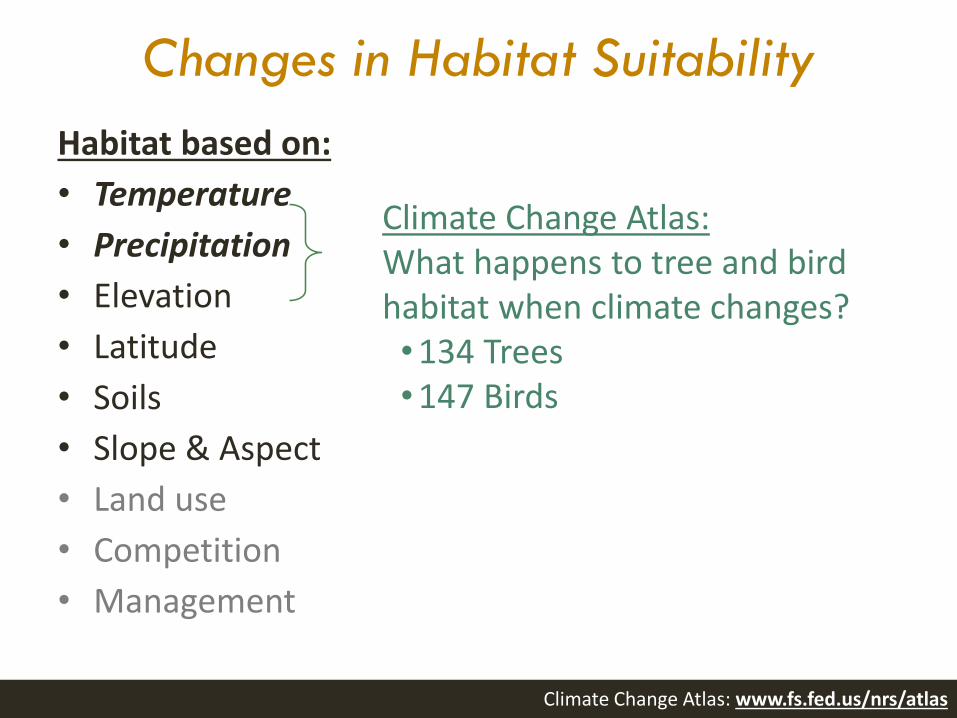
Habitat based on:
• Temperature
• Precipitation
• Elevation
• Latitude
• Soils
• Slope & Aspect
• Land use
• Competition
• Management
Climate Change Atlas:What happens to tree and bird habitat when climate changes?•134 Trees•147 Birds
Climate Change Atlas: www.fs.fed.us/nrs/atlas
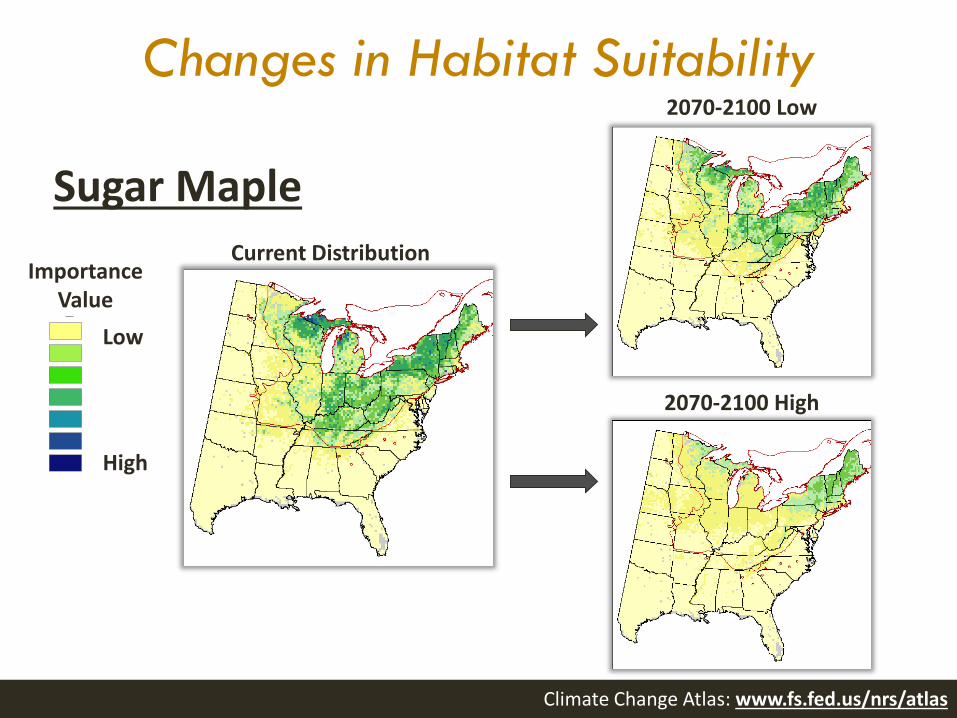
Changes in Habitat Suitability2070-2100 Low
2070-2100 High
Current DistributionImportance
Value
Low
High
Legend
all_spp_current
fia_802
1.000000
1.000001 - 4.000000
4.000001 - 6.000000
6.000001 - 9.000000
9.000001 - 11.000000
11.000001 - 14.000000
14.000001 - 23.000000
Sugar Maple
Climate Change Atlas: www.fs.fed.us/nrs/atlas
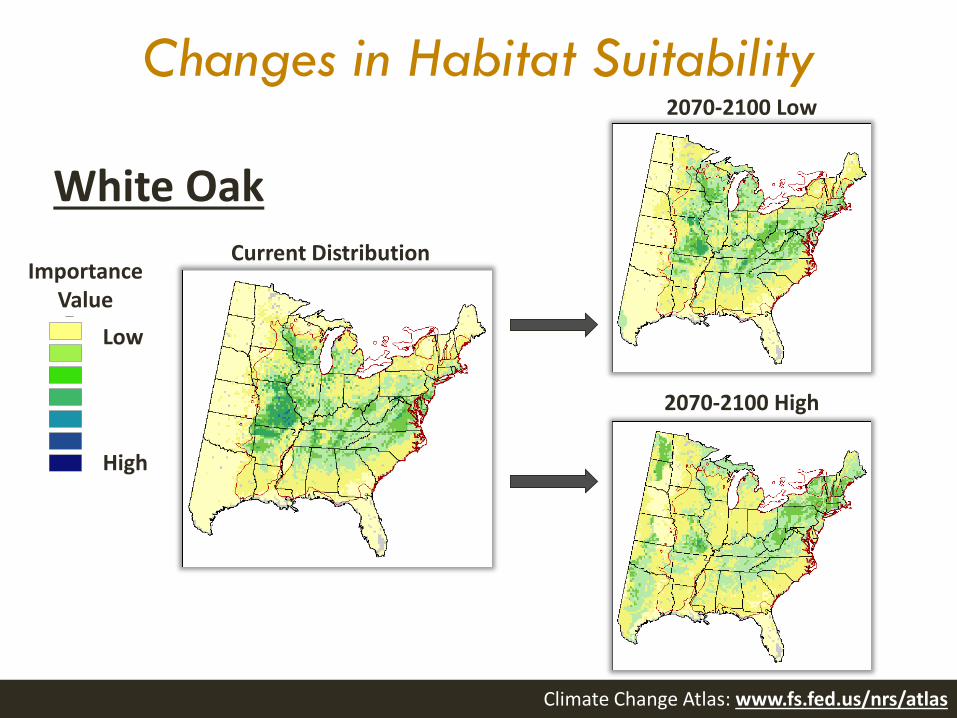
Changes in Habitat Suitability2070-2100 Low
2070-2100 High
Current DistributionImportance
Value
Low
High
Legend
all_spp_current
fia_802
1.000000
1.000001 - 4.000000
4.000001 - 6.000000
6.000001 - 9.000000
9.000001 - 11.000000
11.000001 - 14.000000
14.000001 - 23.000000
White Oak
Climate Change Atlas: www.fs.fed.us/nrs/atlas
Changes in Habitat Suitability
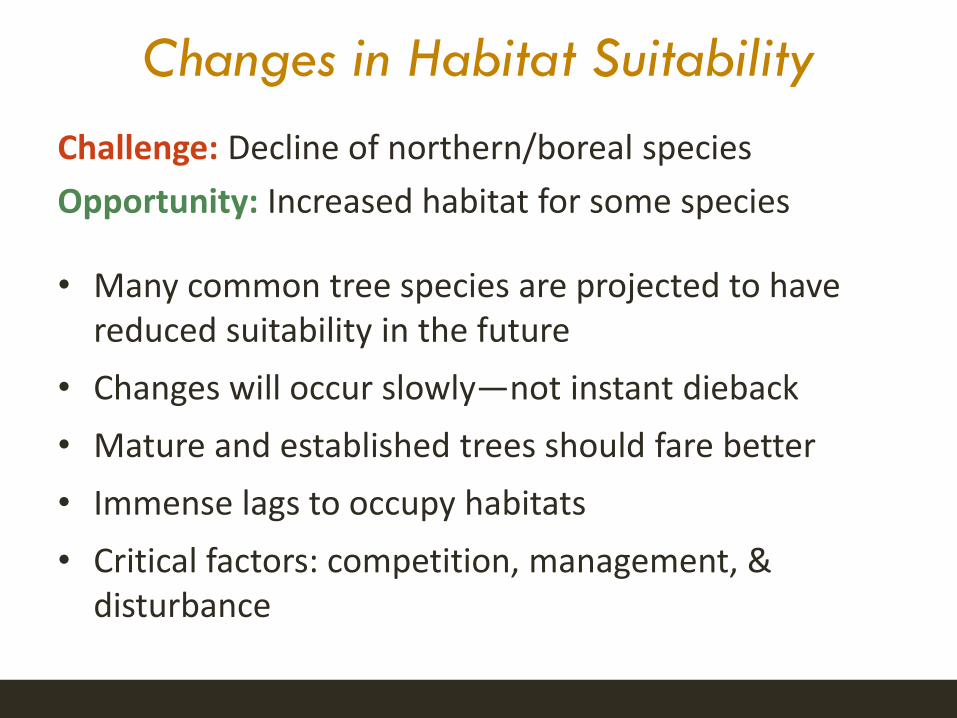
Challenge: Decline of northern/boreal species
Opportunity: Increased habitat for some species
• Many common tree species are projected to have reduced suitability in the future
• Changes will occur slowly—not instant dieback
• Mature and established trees should fare better
• Immense lags to occupy habitats
• Critical factors: competition, management, & disturbance
Extreme Events
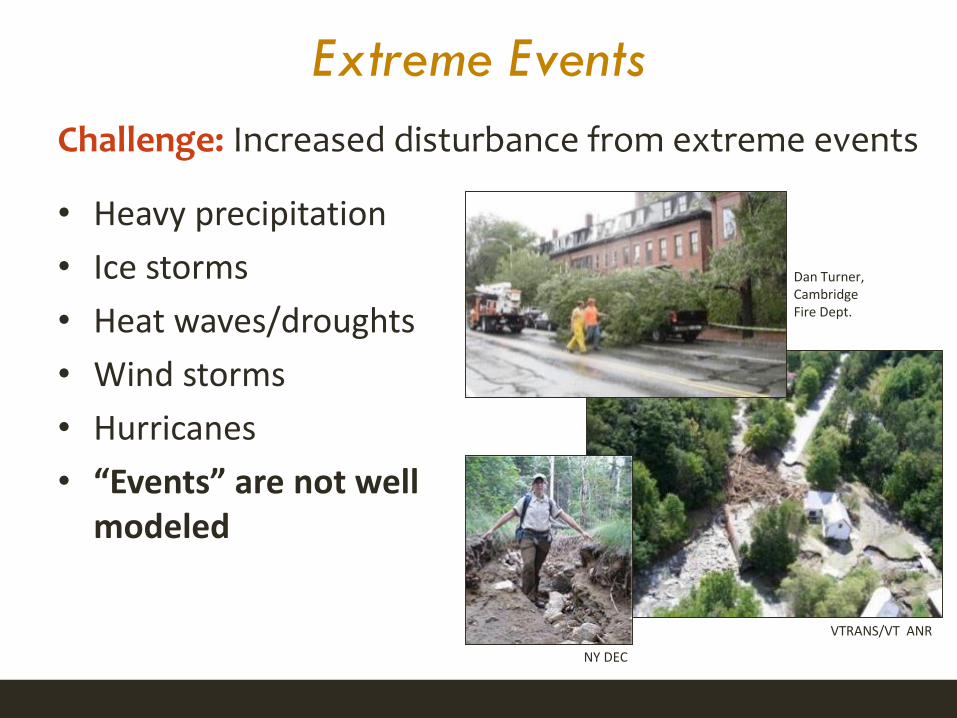
Challenge: Increased disturbance from extreme events
• Heavy precipitation
• Ice storms
• Heat waves/droughts
• Wind storms
• Hurricanes
• “Events” are not well modeled
VTRANS/VT ANR
NY DEC
Dan Turner,Cambridge Fire Dept.
Interactions: Wildfire
Clark et al. 2014
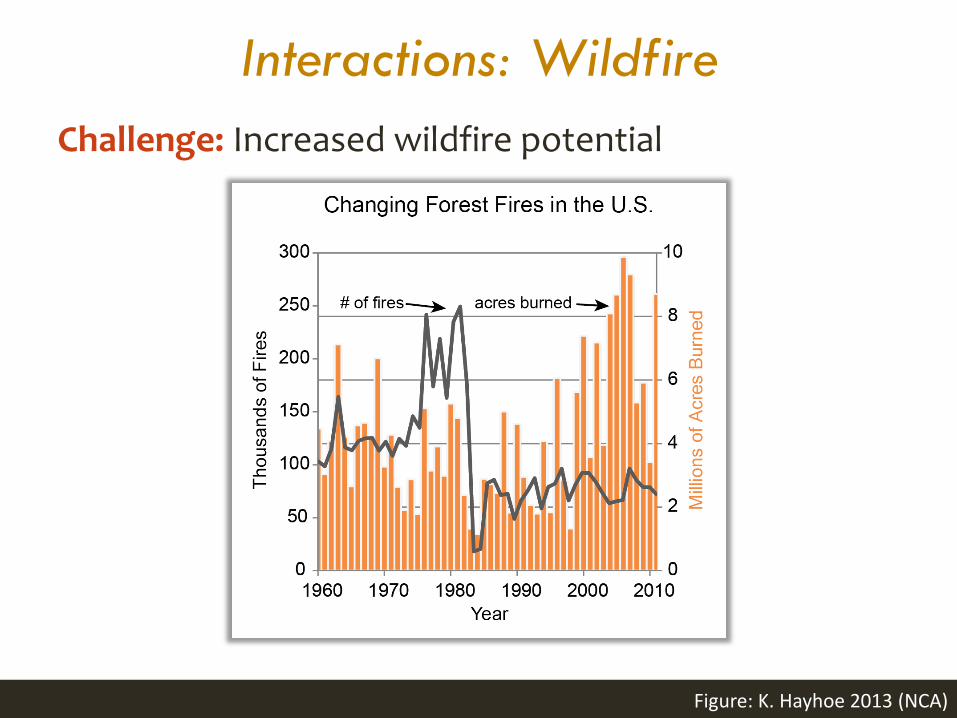
Challenge: Increased wildfire potential
Figure: K. Hayhoe 2013 (NCA)
Interactions: Wildfire
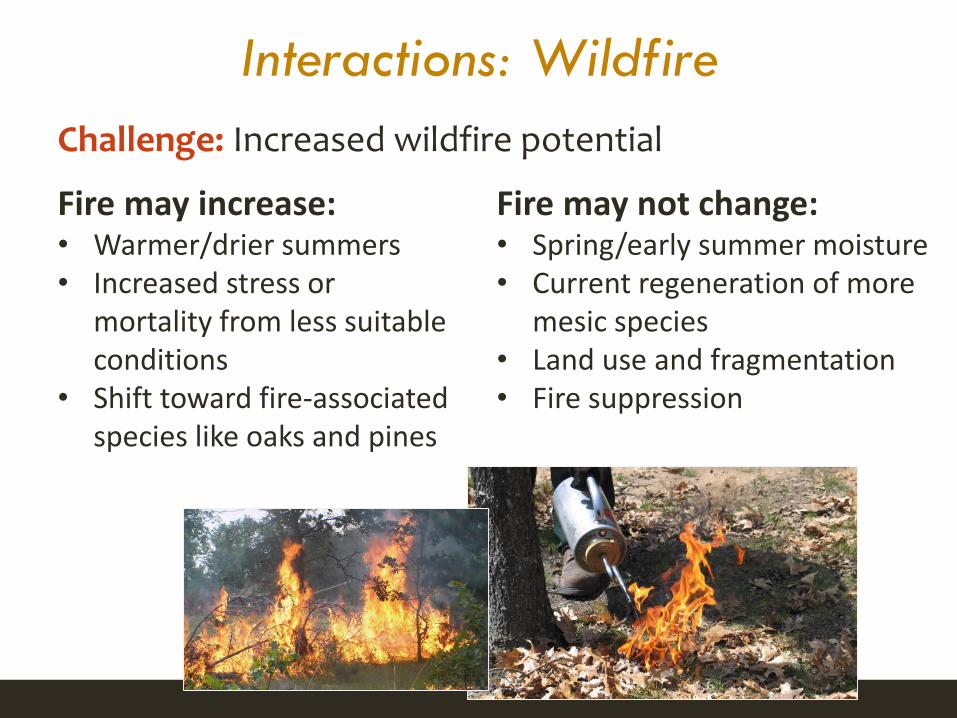
Fire may increase:• Warmer/drier summers• Increased stress or
mortality from less suitable conditions
• Shift toward fire-associated species like oaks and pines
Fire may not change:• Spring/early summer moisture• Current regeneration of more
mesic species• Land use and fragmentation• Fire suppression
Clark et al. 2014
Challenge: Increased wildfire potential
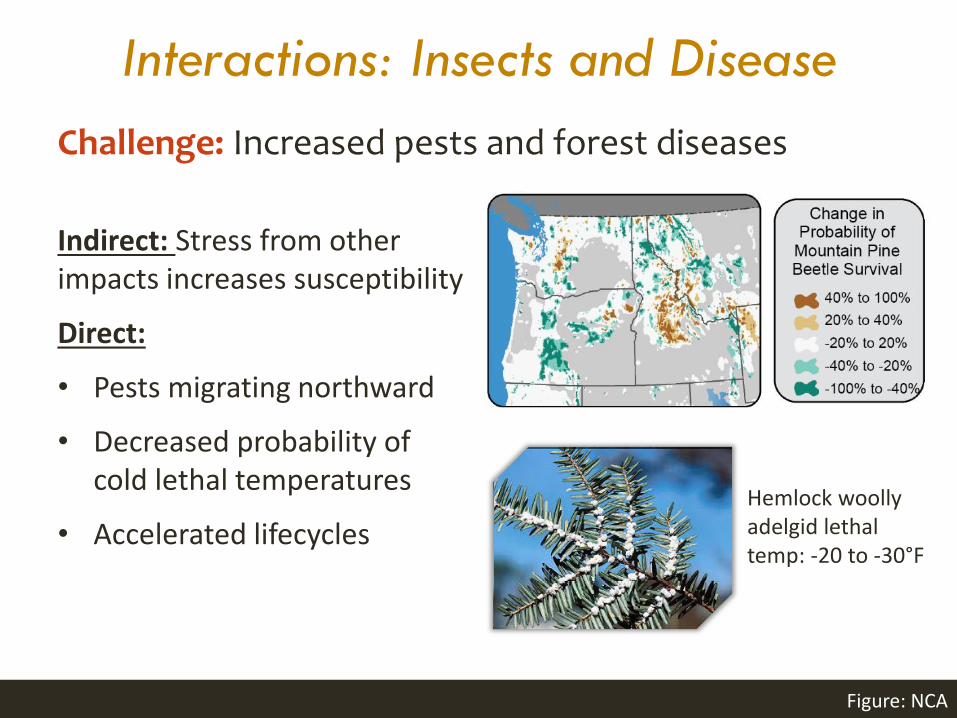
Interactions: Insects and Disease
Indirect: Stress from other impacts increases susceptibility
Direct:
• Pests migrating northward
• Decreased probability of cold lethal temperatures
• Accelerated lifecycles
Ayres and Lombardero 2000, Woods et al. 2005, Parmesan 2006, Dukes et al. 2009 Image: Frumhoff et al. 2007
Hemlock woolly adelgid lethal temp: -20 to -30°F
Challenge: Increased pests and forest diseases
Figure: NCA
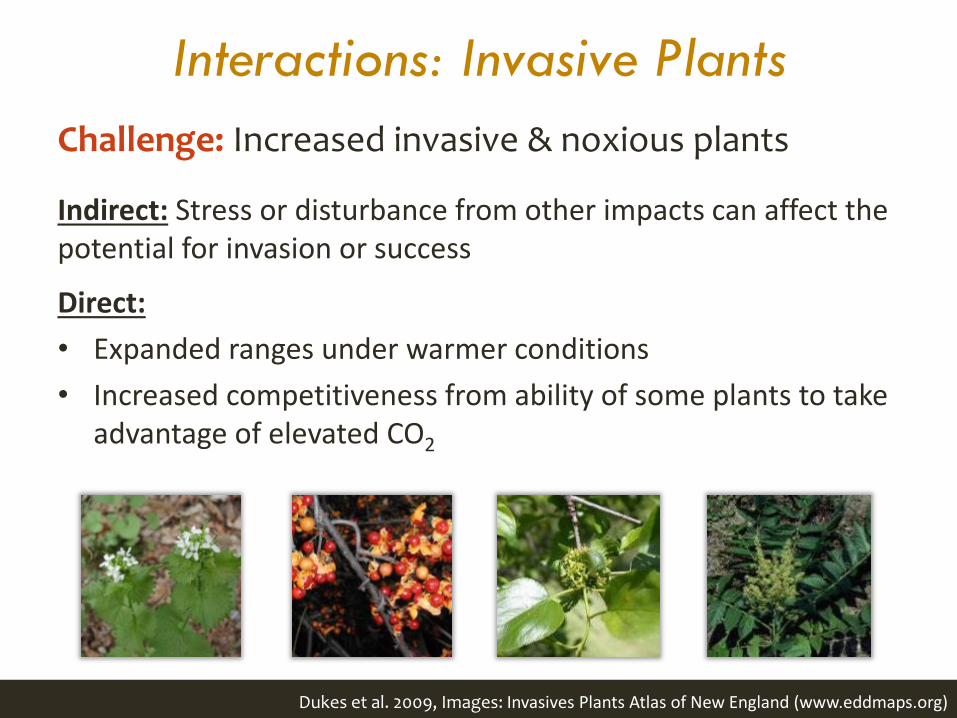
Interactions: Invasive Plants
Indirect: Stress or disturbance from other impacts can affect the potential for invasion or success
Direct:
• Expanded ranges under warmer conditions
• Increased competitiveness from ability of some plants to take advantage of elevated CO2
Dukes et al. 2009, Images: Invasives Plants Atlas of New England (www.eddmaps.org)
Challenge: Increased invasive & noxious plants
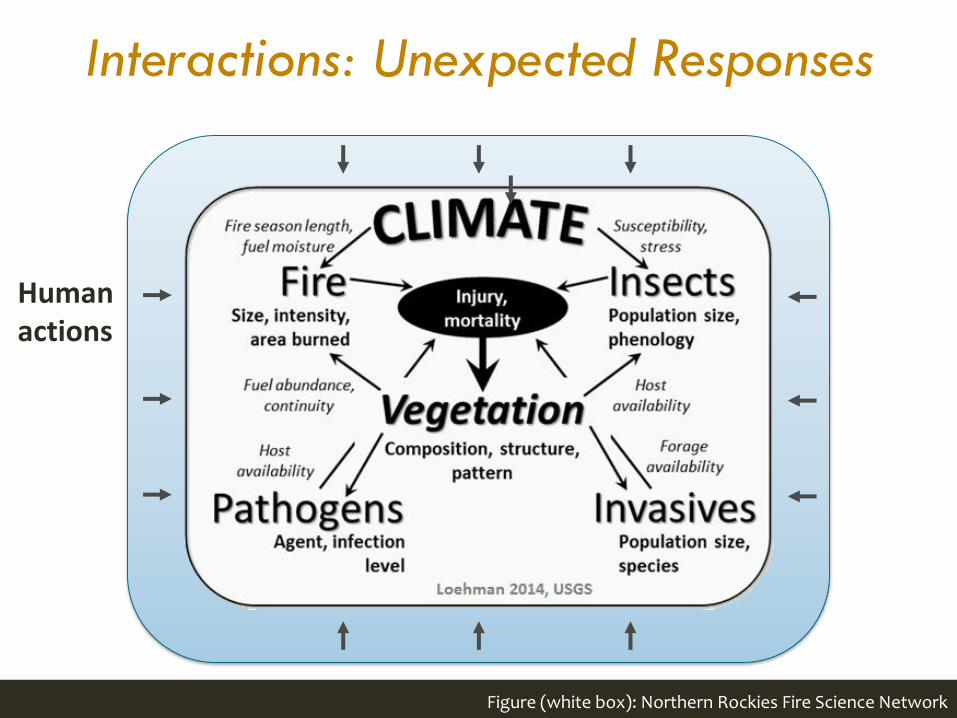
Interactions: Unexpected Responses
Figure (white box): Northern Rockies Fire Science Network
Human actions
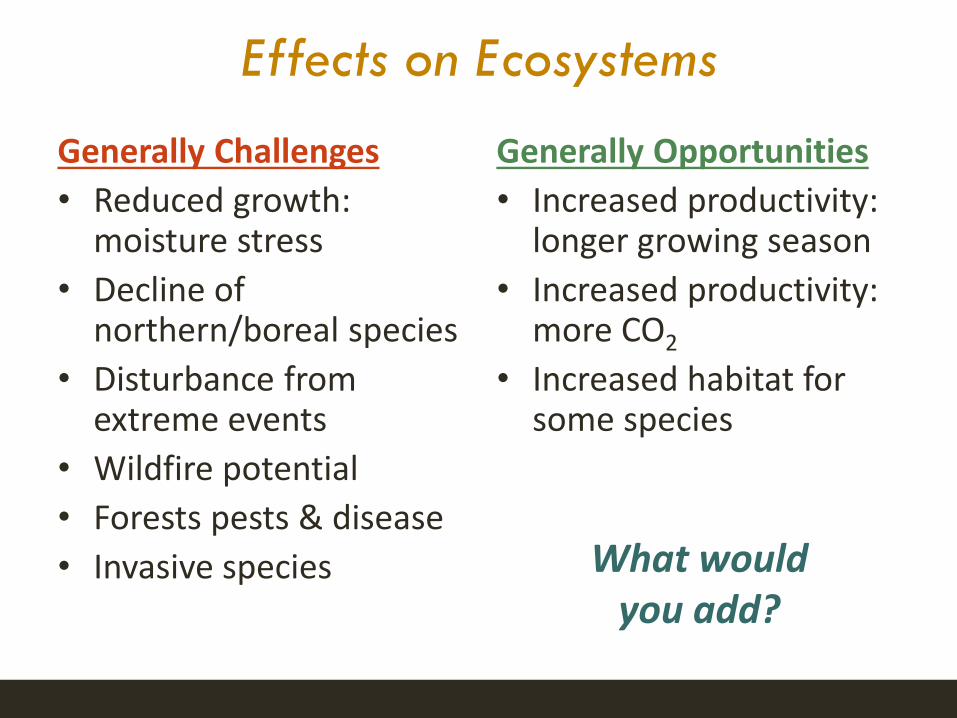
Effects on Ecosystems
Generally Challenges
• Reduced growth: moisture stress
• Decline of northern/boreal species
• Disturbance from extreme events
• Wildfire potential
• Forests pests & disease
• Invasive species
Generally Opportunities
• Increased productivity: longer growing season
• Increased productivity: more CO2
• Increased habitat for some species
What would you add?
Local Considerations
Research and assessments describe broad trends but local conditions make the difference.


