climate change and ecosystem assessment
DESCRIPTION
CKNP Climate Change and Ecosystem AssessmentTRANSCRIPT
CKNP Climate Change and Ecosystem Assessment
Report
Dr. Vaqar Ahmed
Sustainable Development Policy Institute1
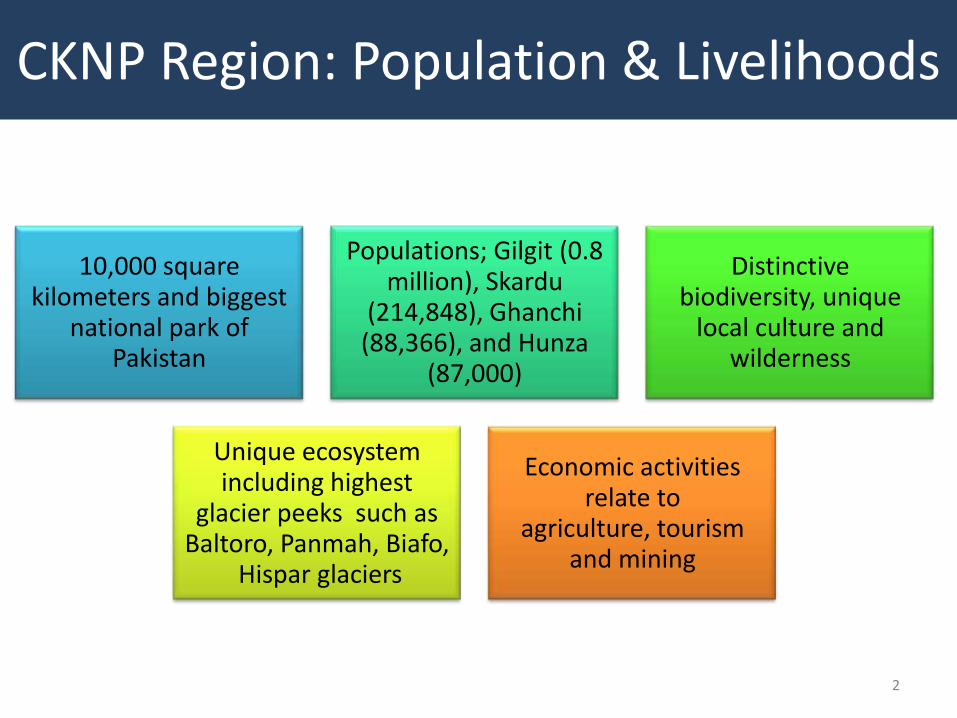
10,000 square kilometers and biggest
national park of Pakistan
Populations; Gilgit (0.8 million), Skardu
(214,848), Ghanchi(88,366), and Hunza
(87,000)
Distinctive biodiversity, unique
local culture and wilderness
Unique ecosystem including highest
glacier peeks such as Baltoro, Panmah, Biafo,
Hispar glaciers
Economic activities relate to
agriculture, tourism and mining
2
CKNP Region: Population & Livelihoods
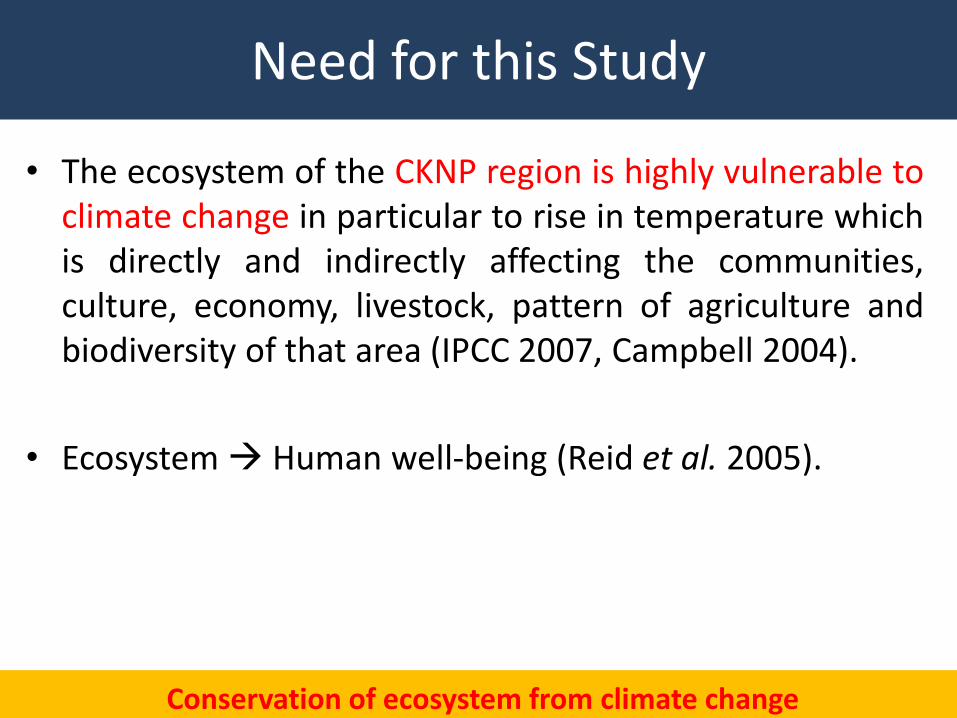
• The ecosystem of the CKNP region is highly vulnerable toclimate change in particular to rise in temperature whichis directly and indirectly affecting the communities,culture, economy, livestock, pattern of agriculture andbiodiversity of that area (IPCC 2007, Campbell 2004).
• Ecosystem Human well-being (Reid et al. 2005).
3
Need for this Study
Conservation of ecosystem from climate change
• Highlights the impacts of climate change on thecommunities of CKNP region.
• Identify vulnerable communities and regions that needpolicy focus for conservation of biodiversity and localecosystems.
• Possible Identification of vulnerabilities and link witheconomic growth in the region
4
Key Areas of Study
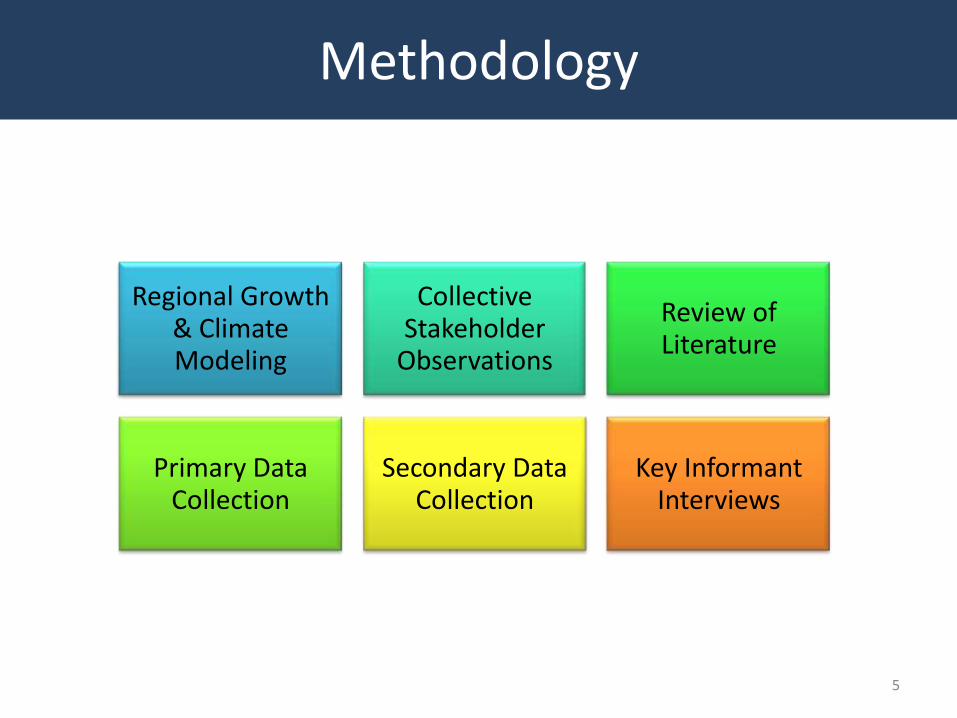
Regional Growth & Climate Modeling
Collective Stakeholder
Observations
Review of Literature
Primary Data Collection
Secondary Data Collection
Key Informant Interviews
5
Methodology

• Primary data
– Household survey conducted in Gilgit, Hunza, Skardu, Ghanchein April 2011 (sample size 300 households)
– Stakeholder’s interviews: AKCSP, EV-K2-CNR, MGPO, PARC,PMD, WWF and CKNP Directorate
• Secondary data by PMD
– For Gilgit: temperatures, precipitation, relative humidity,sunshine hours, and relative humidity
– For Hunza and Skardu data provided was on wind speed, winddirection, and relative humidity
• Secondary data by Pakistan Bureau of Statistics
– Production and Consumption data
• Government of Gilgit-Baltistan: Institutional Review 6
Data Sources

• Khan, B., Ali, F. Understanding Sectoral Impacts of Climate ChangeOn Gilgit-Baltistan. WWF, UNDP, OCHA
• Salerno et al., 2009. Integrated case study of a selected valley inthe Central Karakoram National Park. The Bagrot Valley. HKKHPartnership Project. EV-K2-CNR. 81-103
• Shah, A., et al. 2009. Land Cover Mapping of the CentralKarakoram National Park.WWF, Pakistan
• Mayer, C., et al. 2006. Glaciological Characteristics of the AblationZone of Baltoro Glacier, Karakoram, Pakistan. InternationalGlaciological Society
Existing Literature

• Mihalcea, C., et al. 2006. Ice Ablation and MeteorologicalConditions on the Debris-Covered Area of Baltoro Glacier,Karakoram, Pakistan. International Glaciological Society
• CESVI., Daconto, G. 2007. Exploring the Future: Strategic Analysisof Future Scenarios for Central Karakorum National Park. CESVI.
• Belò, M., et al. 2008. The Recent Evolution of Liligo Glacier,Karakoram, Pakistan, and Its Present Quiescent Phase.International Glaciological Society.
Three of these studies were on glaciers, two were on climatechange, and the rest were generally on CKNP
Existing Literature (Contd..)

• Update and further research, advocacy and outreach required for CKNP region
• There is a need of integrated study for the CKNP region that tries to explore issues and remedies through a social, economic and environmental appraisal
• Missing link with sectoral economic growth
• Link the various facets of climate change impacts with the resource availability and capacity to deal with the challenges.
Gaps in Existing Literature
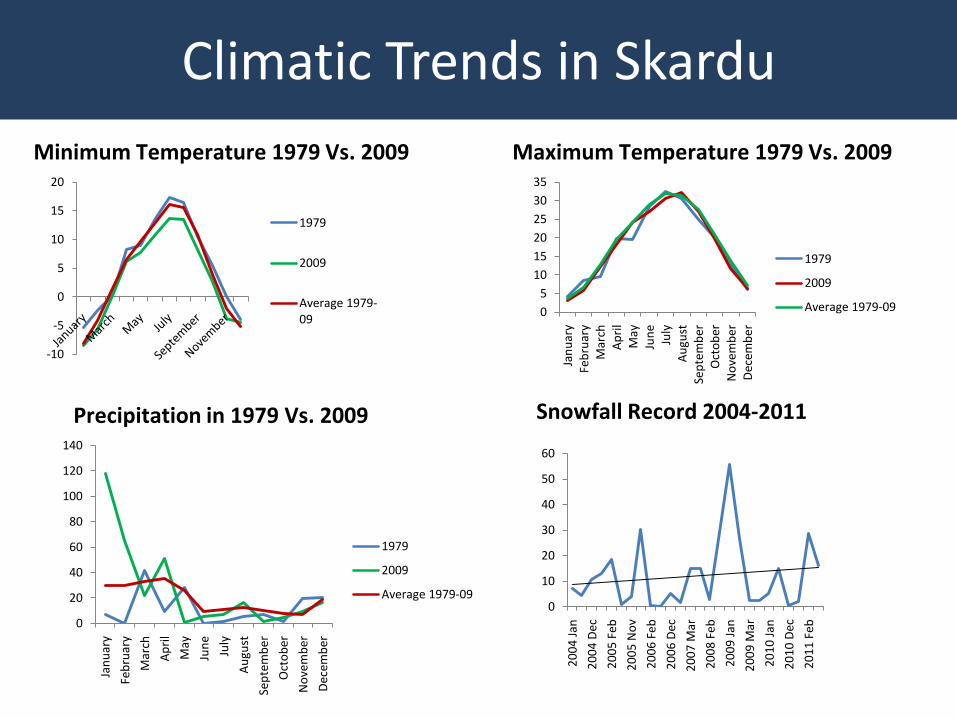
Climatic Trends in Skardu
-10
-5
0
5
10
15
20
1979
2009
Average 1979-09
0
5
10
15
20
25
30
35
Jan
uar
yFe
bru
ary
Mar
chA
pri
lM
ayJu
ne
July
Au
gust
Sep
tem
ber
Oct
ob
erN
ove
mb
erD
ecem
ber
1979
2009
Average 1979-09
Minimum Temperature 1979 Vs. 2009 Maximum Temperature 1979 Vs. 2009
0
20
40
60
80
100
120
140
Jan
uar
y
Feb
ruar
y
Mar
ch
Ap
ril
May
Jun
e
July
Au
gust
Sep
tem
ber
Oct
ob
er
No
vem
ber
Dec
emb
er
1979
2009
Average 1979-09
Precipitation in 1979 Vs. 2009 Snowfall Record 2004-2011
0
10
20
30
40
50
60
20
04
Jan
20
04
Dec
20
05
Feb
20
05
No
v
20
06
Feb
20
06
Dec
20
07
Mar
20
08
Feb
20
09
Jan
20
09
Mar
20
10
Jan
20
10
Dec
20
11
Feb
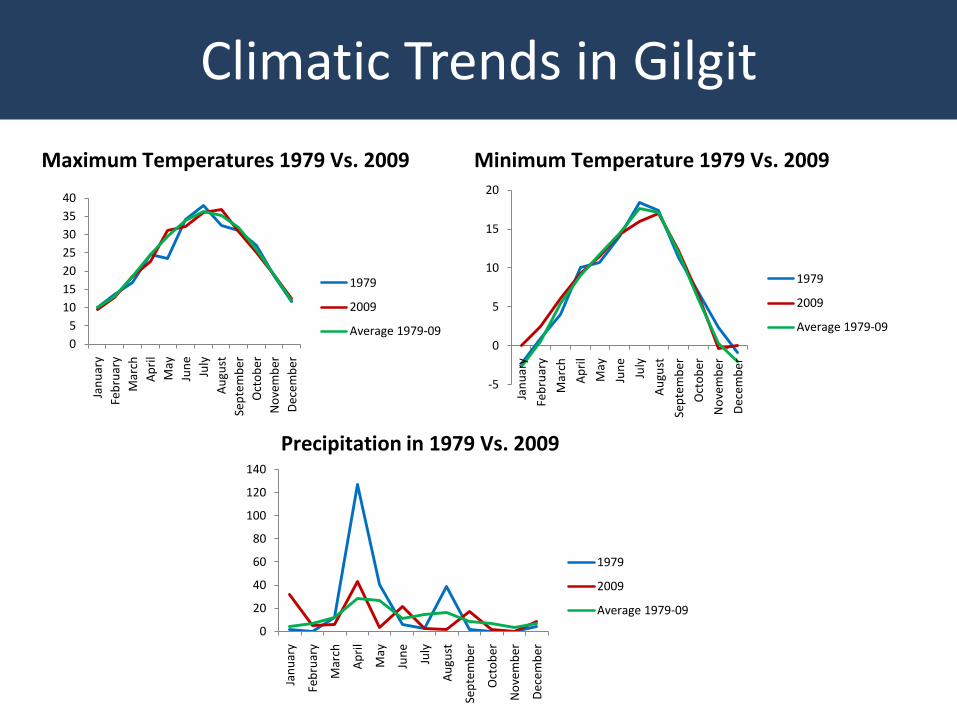
Climatic Trends in Gilgit
0
5
10
15
20
25
30
35
40
Jan
uar
y
Feb
ruar
y
Mar
ch
Ap
ril
May
Jun
e
July
Au
gust
Sep
tem
ber
Oct
ob
er
No
vem
ber
Dec
emb
er1979
2009
Average 1979-09
Maximum Temperatures 1979 Vs. 2009 Minimum Temperature 1979 Vs. 2009
-5
0
5
10
15
20
Jan
uar
y
Feb
ruar
y
Mar
ch
Ap
ril
May
Jun
e
July
Au
gust
Sep
tem
ber
Oct
ob
er
No
vem
ber
Dec
emb
er
1979
2009
Average 1979-09
0
20
40
60
80
100
120
140
Jan
uar
y
Feb
ruar
y
Mar
ch
Ap
ril
May
Jun
e
July
Au
gust
Sep
tem
ber
Oct
ob
er
No
vem
ber
Dec
emb
er
1979
2009
Average 1979-09
Precipitation in 1979 Vs. 2009

Economic Growth Projections
• growth in agribusinessScenario A
• growth in agribusiness and tourism
Scenario B
• growth in agribusiness, tourism and mining
Scenario C
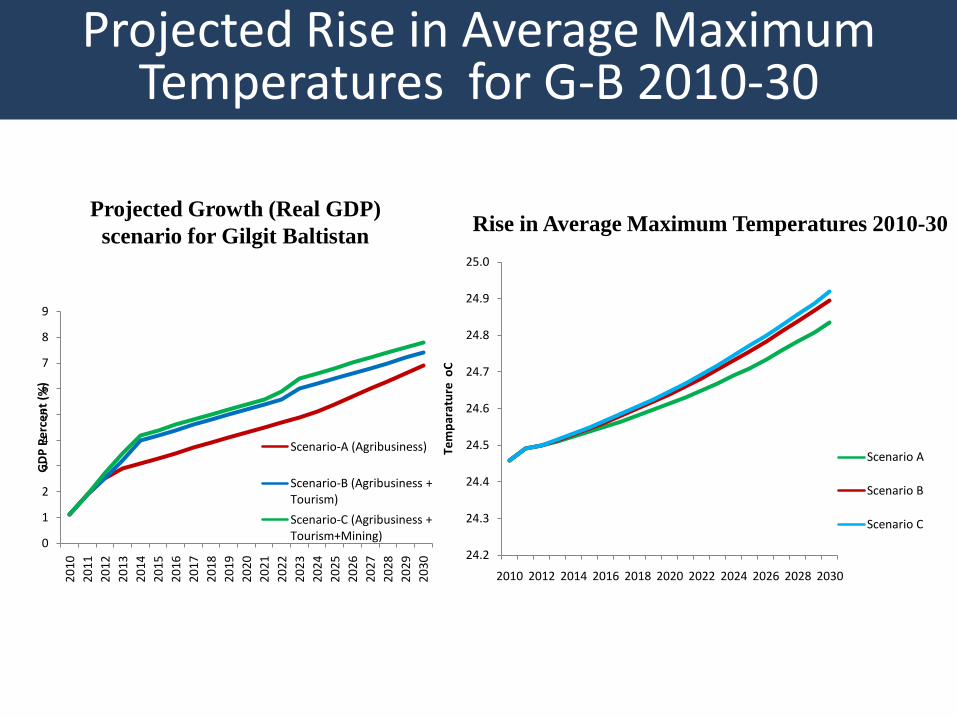
Projected Rise in Average Maximum Temperatures for G-B 2010-30
Projected Growth (Real GDP)
scenario for Gilgit Baltistan
0
1
2
3
4
5
6
7
8
9
20
10
20
11
20
12
20
13
20
14
20
15
20
16
20
17
20
18
20
19
20
20
20
21
20
22
20
23
20
24
20
25
20
26
20
27
20
28
20
29
20
30
GD
P P
erc
en
t (%
)
Scenario-A (Agribusiness)
Scenario-B (Agribusiness + Tourism)
Scenario-C (Agribusiness + Tourism+Mining)
Rise in Average Maximum Temperatures 2010-30
24.2
24.3
24.4
24.5
24.6
24.7
24.8
24.9
25.0
2010 2012 2014 2016 2018 2020 2022 2024 2026 2028 2030
Tem
par
atu
re o
CScenario A
Scenario B
Scenario C
• Advocacy before research
• The problem was that majority of population in CKNPwas not being educated above secondary school,explanation of these concepts was sometimes madedifficult
• Most vulnerable resources in CKNP:
– Glaciers
– Forests
– Pastures
– Biodiversity
Challenges with Household-level Survey

• Climatic Conditions (becoming warmer region, increasedin rainfall pattern, snow pattern changed)
• Land Use Pattern (increased due to urbanization,agriculture pattern has changed, cash crops)
• Flora of CKNP (lose of plant species, lessen fruitproduction)
• Domestic animals (GLOF causing epidemic diseases)
• Wildlife (endangered species, human interferences,deforestation)
Social, Environmental and Economic Impacts Because of Climate Change

• Drinking Water (increase in water availability and rainfed areas facing shortages, occurrence of water borndiseases)
• Forest Cover (loss in forest cover due to urbanization andused as a source of energy)
• Natural disasters (frequency has increased)
Social, Environmental and Economic Impacts Because of Climate Change
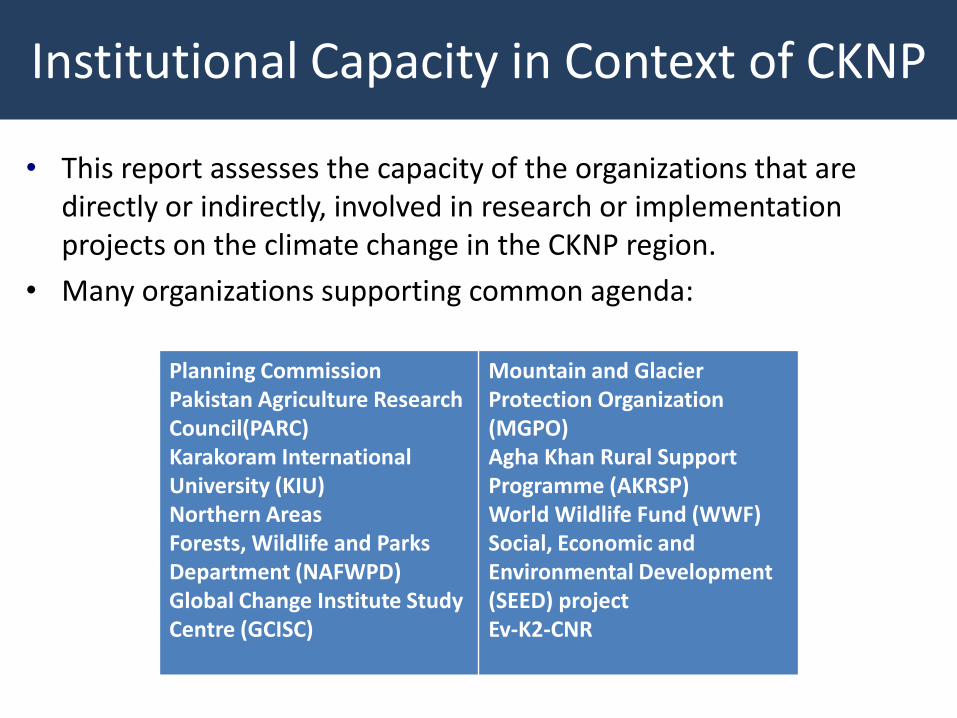
• This report assesses the capacity of the organizations that are directly or indirectly, involved in research or implementation projects on the climate change in the CKNP region.
• Many organizations supporting common agenda:
Institutional Capacity in Context of CKNP
Planning CommissionPakistan Agriculture Research Council(PARC)Karakoram International University (KIU)Northern Areas Forests, Wildlife and Parks Department (NAFWPD)Global Change Institute Study Centre (GCISC)
Mountain and Glacier Protection Organization (MGPO) Agha Khan Rural Support Programme (AKRSP)World Wildlife Fund (WWF)Social, Economic and Environmental Development (SEED) projectEv-K2-CNR
The parameters used to assess the capacity of the aforesaid organizations:
• Institutional Setup
• Qualified/Trained Manpower
• Database Management
• Availability of GIS or Geographic Information
• Allied Equipment (Hardware/Software)
• Past projects on Climate Change
• Ongoing projects on Climate Change
• Budget Allocations for Climate Change Projects
• Specific Achievements in the related discipline
Institutional Capacity Assessment Parameters

G-B Government Policies
• Investment Opportunities
– Hydro-power
– Mineral Development
• Mega Projects
– KKH, Daimer-Bhasha Dam, Bunji Power Project, SatparaDam
• PM’s directives on public works
Institutions: Policy Threats to Climate
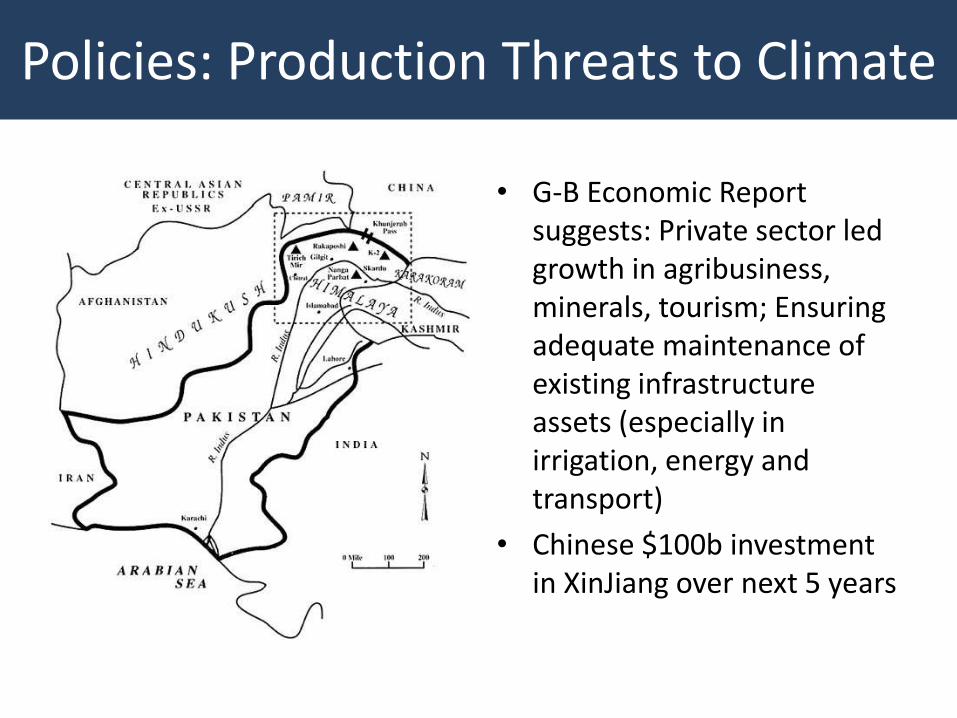
Policies: Production Threats to Climate
• G-B Economic Report suggests: Private sector led growth in agribusiness, minerals, tourism; Ensuring adequate maintenance of existing infrastructure assets (especially in irrigation, energy and transport)
• Chinese $100b investment in XinJiang over next 5 years

Formulating Appropriate Adaptation Strategies – for Implementation
• Environmental appraisal of public sector development programs in the region – role of G-B government
• Regulate (environmental) private sectors entry
– Free trade agreements with China (and India-MFN)
• Planning economic growth in compliance with environmental quality and social equity – role of federal government
• Capacity and will to undertake reform – role of civil society
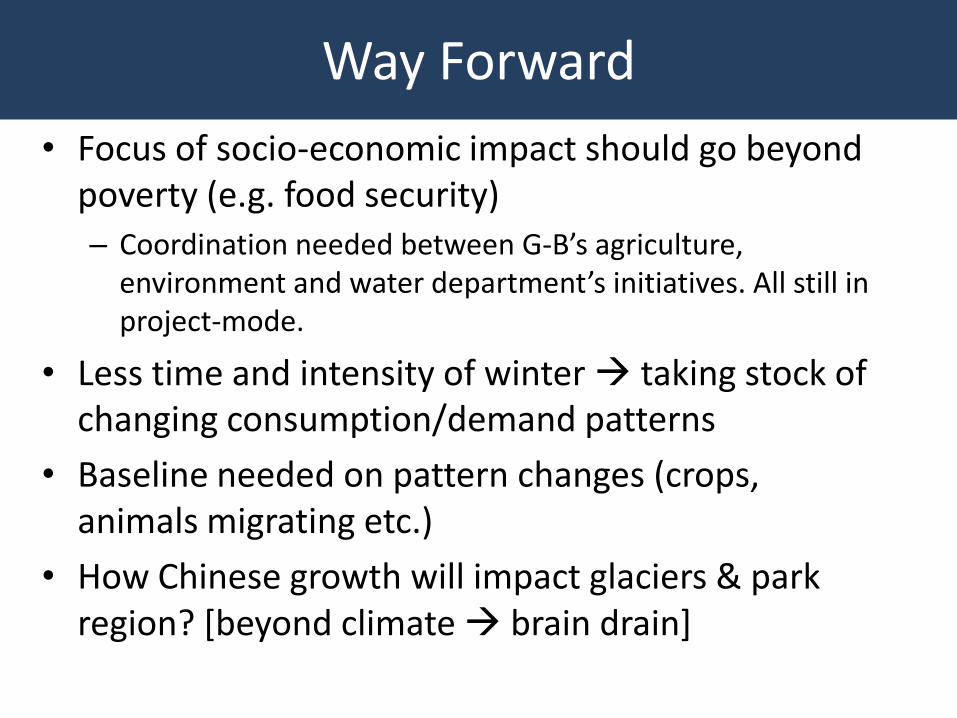
Way Forward
• Focus of socio-economic impact should go beyond poverty (e.g. food security)– Coordination needed between G-B’s agriculture,
environment and water department’s initiatives. All still in project-mode.
• Less time and intensity of winter taking stock ofchanging consumption/demand patterns
• Baseline needed on pattern changes (crops, animals migrating etc.)
• How Chinese growth will impact glaciers & park region? [beyond climate brain drain]