easyCBM:Benchmarking and Progress Monitoring
System
Jack B. Monpas-Huber, Ph.D.Director of Assessment & Student Information
Shereen HenryMath Instructional
Specialist
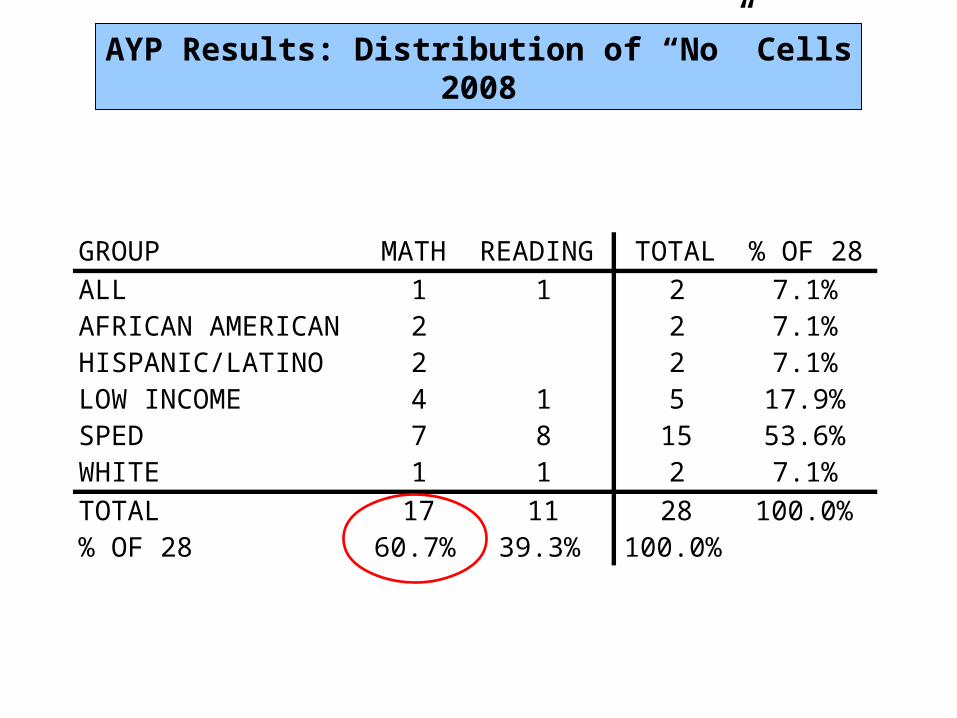
GROUP MATH READING TOTAL % OF 28ALL 1 1 2 7.1%AFRICAN AMERICAN 2 2 7.1%HISPANIC/LATINO 2 2 7.1%LOW INCOME 4 1 5 17.9%SPED 7 8 15 53.6%WHITE 1 1 2 7.1%TOTAL 17 11 28 100.0%% OF 28 60.7% 39.3% 100.0%
AYP Results: Distribution of “No” Cells2008
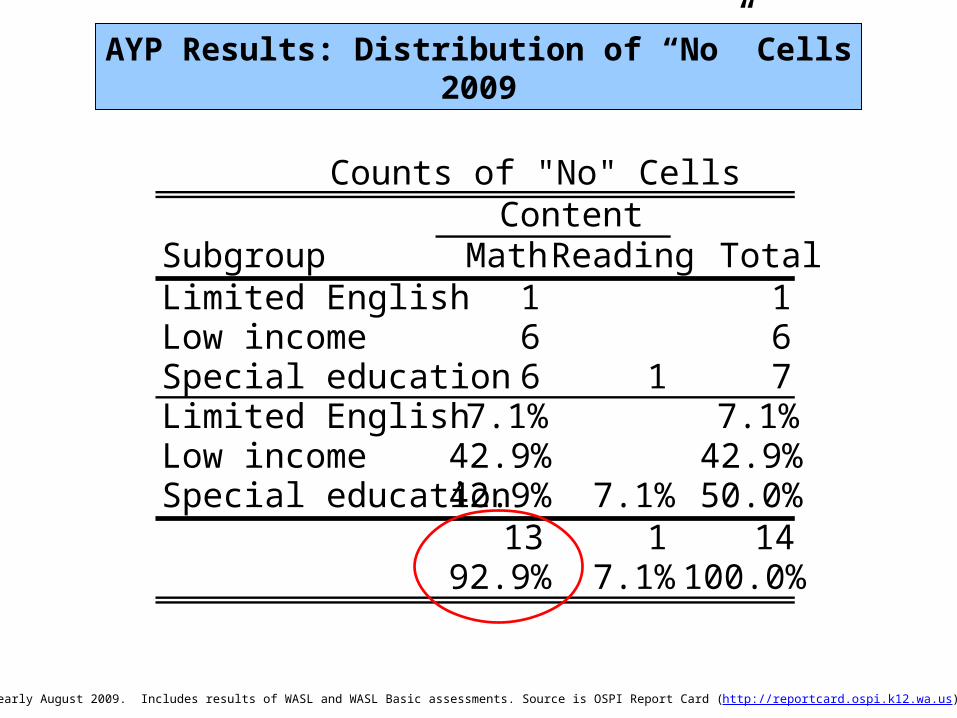
Subgroup Math Reading TotalLimited English 1 1Low income 6 6Special education 6 1 7Limited English 7.1% 7.1%Low income 42.9% 42.9%Special education 42.9% 7.1% 50.0%
13 1 1492.9% 7.1% 100.0%
ContentCounts of "No" Cells
1As of early August 2009. Includes results of WASL and WASL Basic assessments. Source is OSPI Report Card (http://reportcard.ospi.k12.wa.us).
AYP Results: Distribution of “No” Cells2009
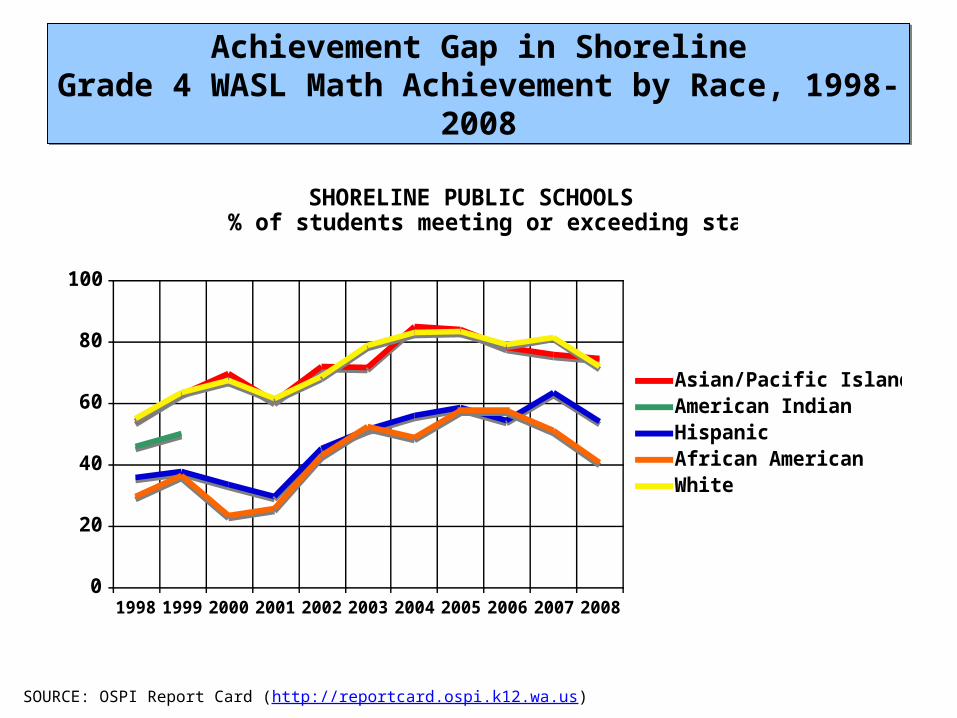
Achievement Gap in ShorelineGrade 4 WASL Math Achievement by Race, 1998-
2008
Achievement Gap in ShorelineGrade 4 WASL Math Achievement by Race, 1998-
2008
SHORELINE PUBLIC SCHOOLS% of students meeting or exceeding standard
0
20
40
60
80
100
1998 1999 2000 2001 2002 2003 2004 2005 2006 2007 2008
Asian/Pacific IslanderAmerican IndianHispanicAfrican AmericanWhite
SOURCE: OSPI Report Card (http://reportcard.ospi.k12.wa.us)
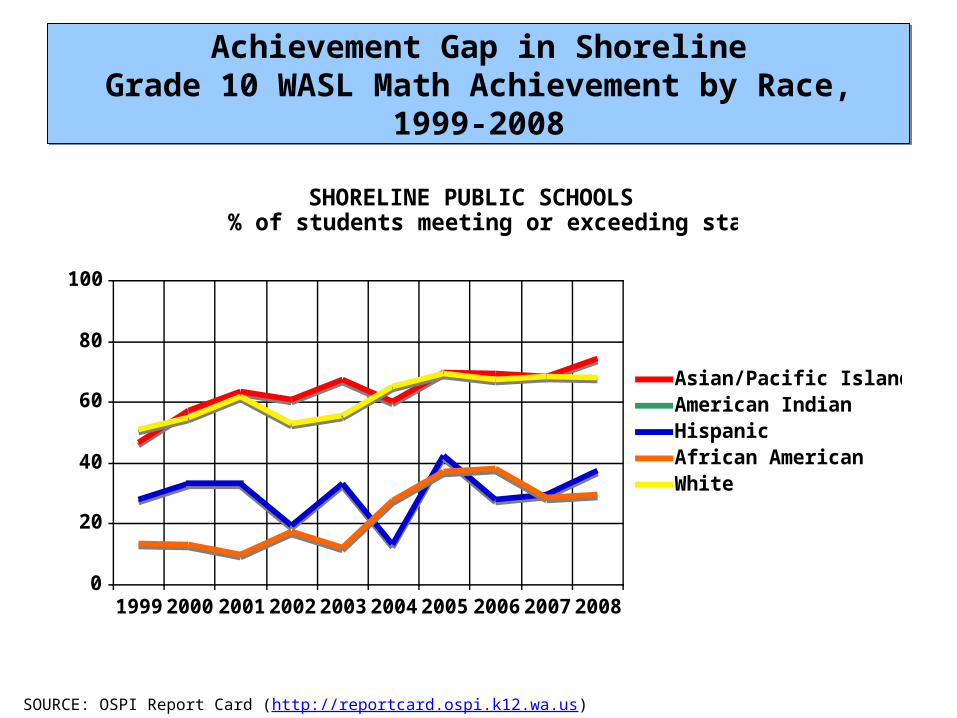
Achievement Gap in ShorelineGrade 10 WASL Math Achievement by Race,
1999-2008
Achievement Gap in ShorelineGrade 10 WASL Math Achievement by Race,
1999-2008
SHORELINE PUBLIC SCHOOLS% of students meeting or exceeding standard
0
20
40
60
80
100
1999 2000 2001 2002 2003 2004 2005 2006 2007 2008
Asian/Pacific IslanderAmerican IndianHispanicAfrican AmericanWhite
SOURCE: OSPI Report Card (http://reportcard.ospi.k12.wa.us)
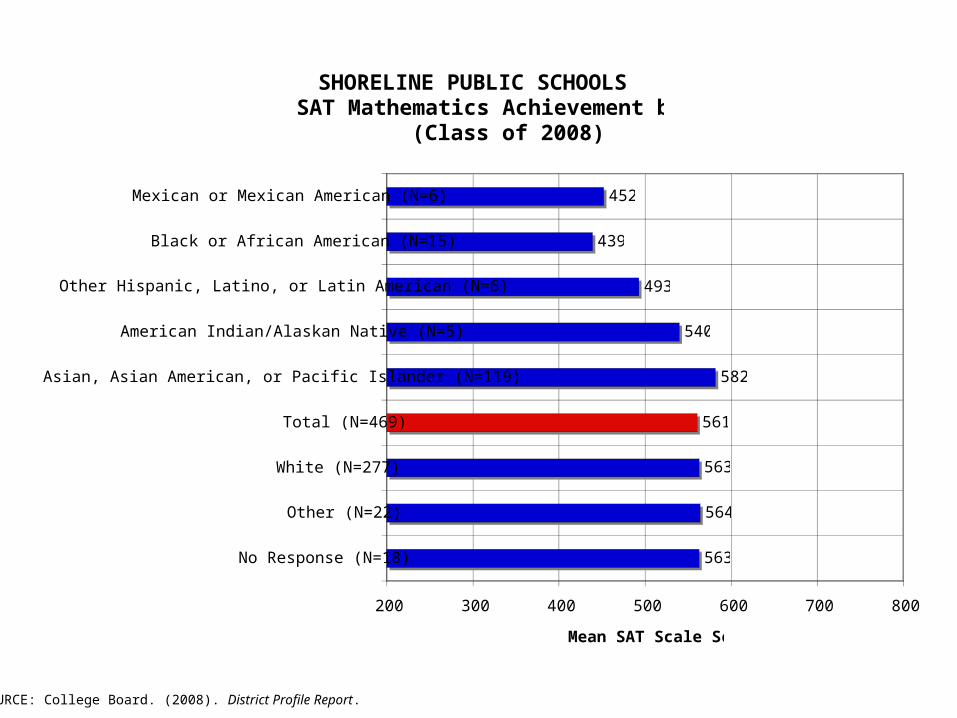
SHORELINE PUBLIC SCHOOLSSAT Mathematics Achievement by Race
(Class of 2008)
563
564
563
561
582
540
493
439
452
200 300 400 500 600 700 800
No Response (N=18)
Other (N=22)
White (N=277)
Total (N=469)
Asian, Asian American, or Pacific Islander (N=119)
American Indian/Alaskan Native (N=5)
Other Hispanic, Latino, or Latin American (N=6)
Black or African American (N=15)
Mexican or Mexican American (N=6)
Mean SAT Scale Score
SOURCE: College Board. (2008). District Profile Report.
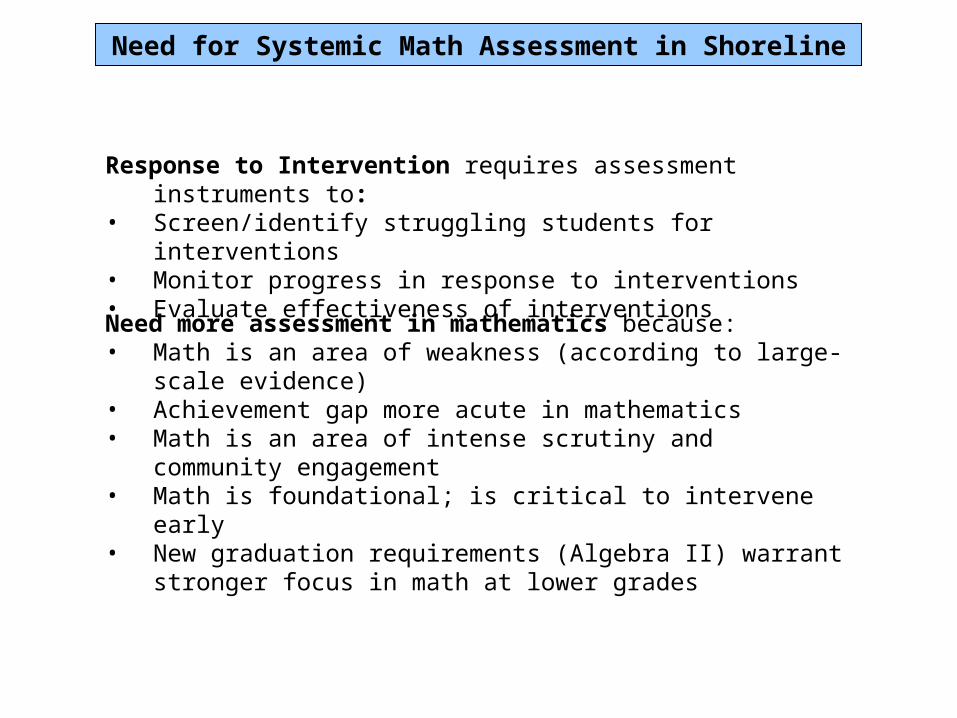
Need for Systemic Math Assessment in Shoreline
Response to Intervention requires assessment instruments to:
• Screen/identify struggling students for interventions
• Monitor progress in response to interventions• Evaluate effectiveness of interventionsNeed more assessment in mathematics because:• Math is an area of weakness (according to large-scale evidence)• Achievement gap more acute in mathematics• Math is an area of intense scrutiny and community engagement• Math is foundational; is critical to intervene early• New graduation requirements (Algebra II) warrant stronger focus
in math at lower grades
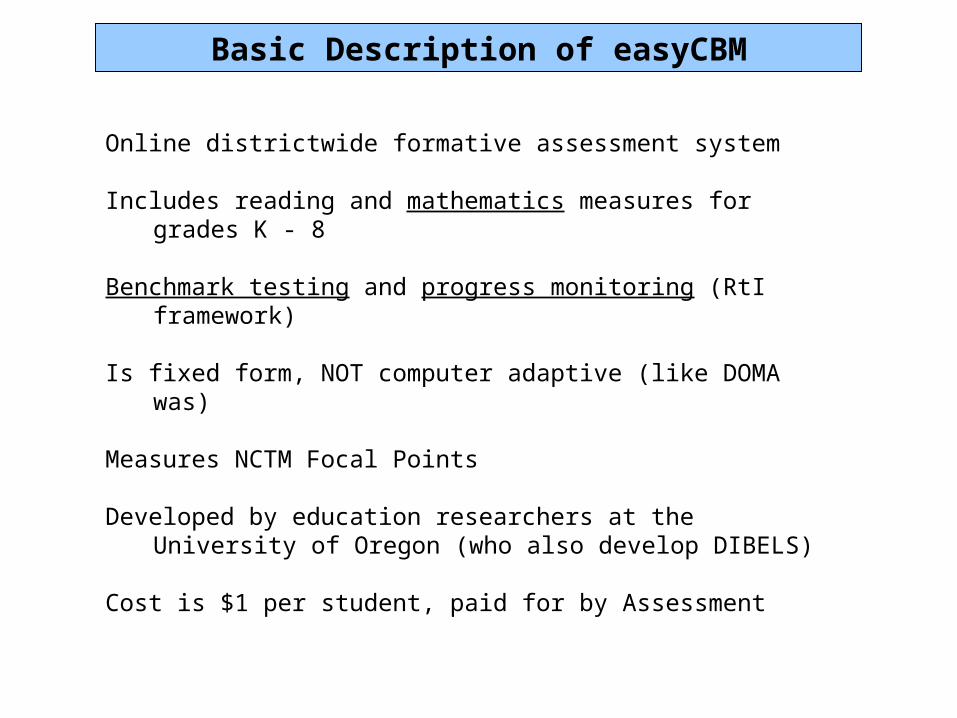
Basic Description of easyCBM
Online districtwide formative assessment system
Includes reading and mathematics measures for grades K - 8
Benchmark testing and progress monitoring (RtI framework)
Is fixed form, NOT computer adaptive (like DOMA was)
Measures NCTM Focal Points
Developed by education researchers at the University of Oregon (who also develop DIBELS)
Cost is $1 per student, paid for by Assessment
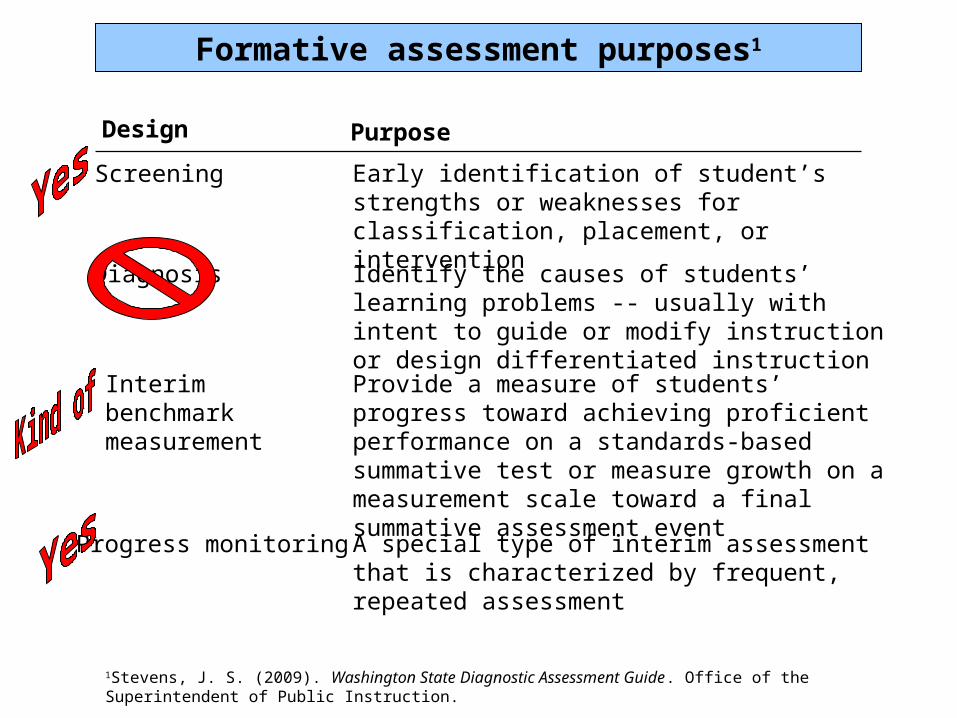
Formative assessment purposes1
Design Purpose
Screening
Diagnosis
Interim benchmark measurement
Progress monitoring
Early identification of student’s strengths or weaknesses for classification, placement, or intervention
1Stevens, J. S. (2009). Washington State Diagnostic Assessment Guide. Office of the Superintendent of Public Instruction.
Identify the causes of students’ learning problems -- usually with intent to guide or modify instruction or design differentiated instructionProvide a measure of students’ progress toward achieving proficient performance on a standards-based summative test or measure growth on a measurement scale toward a final summative assessment eventA special type of interim assessment that is characterized by frequent, repeated assessment

easyCBM Benchmark testing
PurposeTo identify/screen students who are below grade
level and need intervention
Three benchmark windows (determined by district)Fall -- September 15 to October 14Winter -- January 11 to 29Spring -- May 31 to June 18
Why three windows?This first year is baseline year when we are
collecting our own norm data on how much Shoreline kids grow in math. It is a linear growth model which requires three solid data points.
District Expectations• All K-8 students participate in all three
benchmark windows• All students take benchmark test at grade level
easyCBM Progress monitoring
PurposeTo monitor progress toward grade level goals in response to intervention/s
About 2-3 weeks after the intervention has been applied.
For most situations, do only one skill at a time. Start with the most foundational skill and build from there. May progress monitor at any grade level below.
Move onto the next skill when a student has reached the 50th percentile.
State the intervention used in your report.
QuickTime™ and a decompressor
are needed to see this picture.
QuickTime™ and a decompressor
are needed to see this picture.
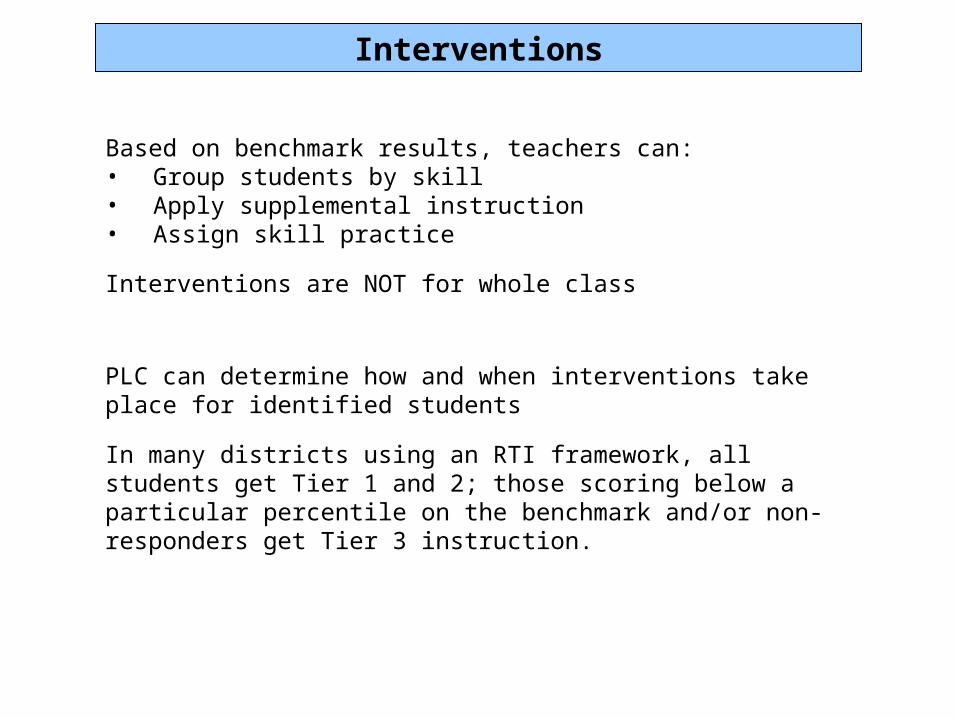
Interventions
Based on benchmark results, teachers can:• Group students by skill• Apply supplemental instruction• Assign skill practice
PLC can determine how and when interventions take place for identified students
Interventions are NOT for whole class
In many districts using an RTI framework, all students get Tier 1 and 2; those scoring below a particular percentile on the benchmark and/or non-responders get Tier 3 instruction.
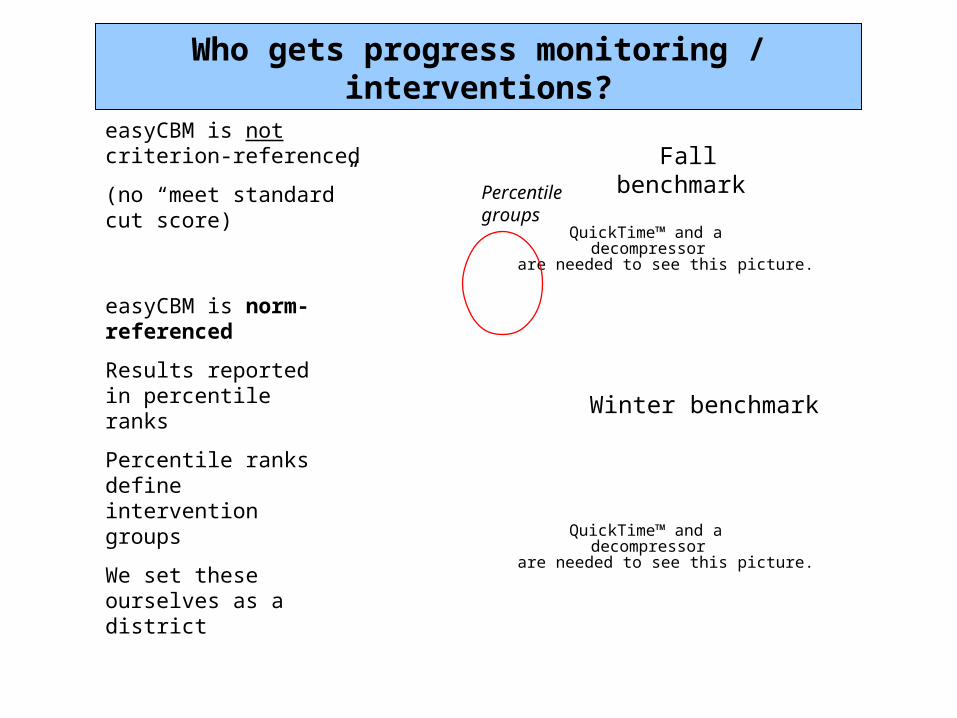
Who gets progress monitoring / interventions?
QuickTime™ and a decompressor
are needed to see this picture.
QuickTime™ and a decompressor
are needed to see this picture.
Fall benchmark
Winter benchmark
Percentilegroups
easyCBM is not criterion-referenced
(no “meet standard” cut score)
easyCBM is norm-referenced
Results reported in percentile ranks
Percentile ranks define intervention groups
We set these ourselves as a district
What easyCBM measures, 1/2
NCTM Focal Points• What is expected for students to learn at grade
level by the end of the year• Were used in development of new Washington math
standards• Preliminary alignment analysis suggests more
overlap at some grade levels and content strands (i.e., geometry) than others
easyCBM and Shoreline curriculum materials• easyCBM is not aligned to Shoreline curriculum
materials; more important is alignment to state standards.
• Fall and winter easyCBM benchmark assessments will assess content that many students have not been taught. This will introduce some error into the scores.
• Spring benchmark assessment therefore becomes critical because students should have seen all grade level content.
What easyCBM measures, 2/2
Three Focal Points per grade
For benchmark assessments, all three are assessed
For progress monitoring, can test all three or focus on a single domain area
Each test has 16 items
Items are ordered by increasing difficulty except that Item 16 and Item 5 are switched
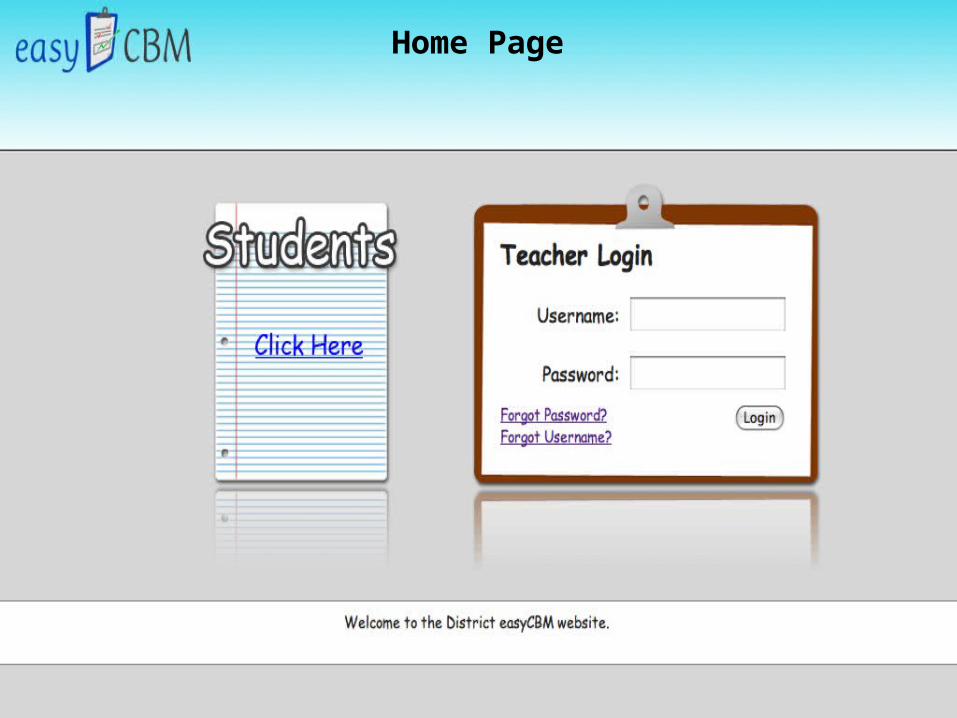
Home Page
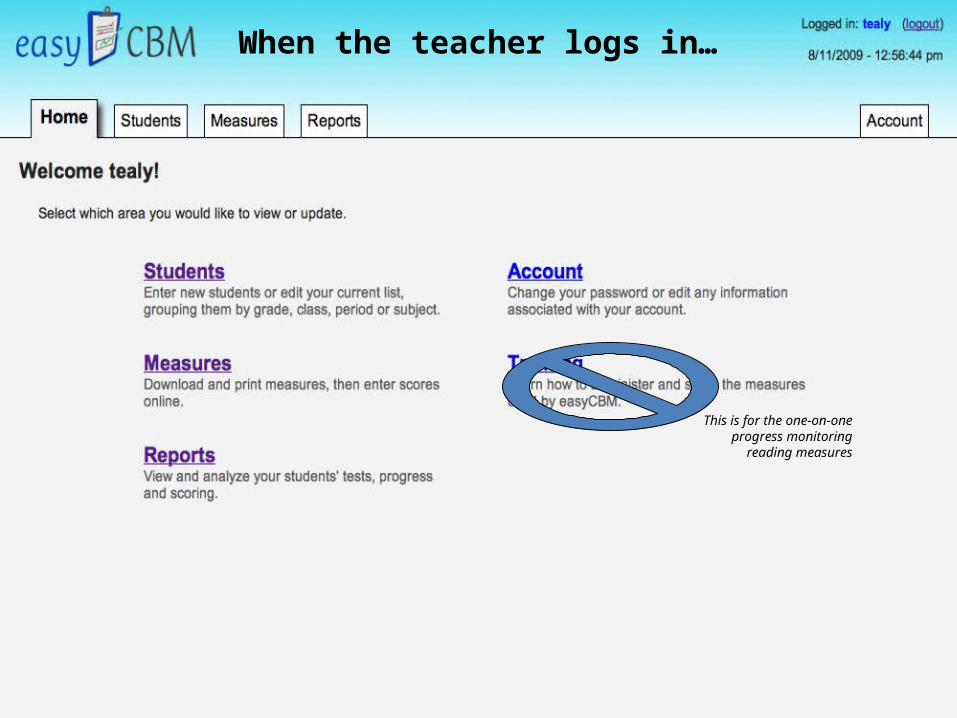
When the teacher logs in…
This is for the one-on-one progress
monitoring reading measures
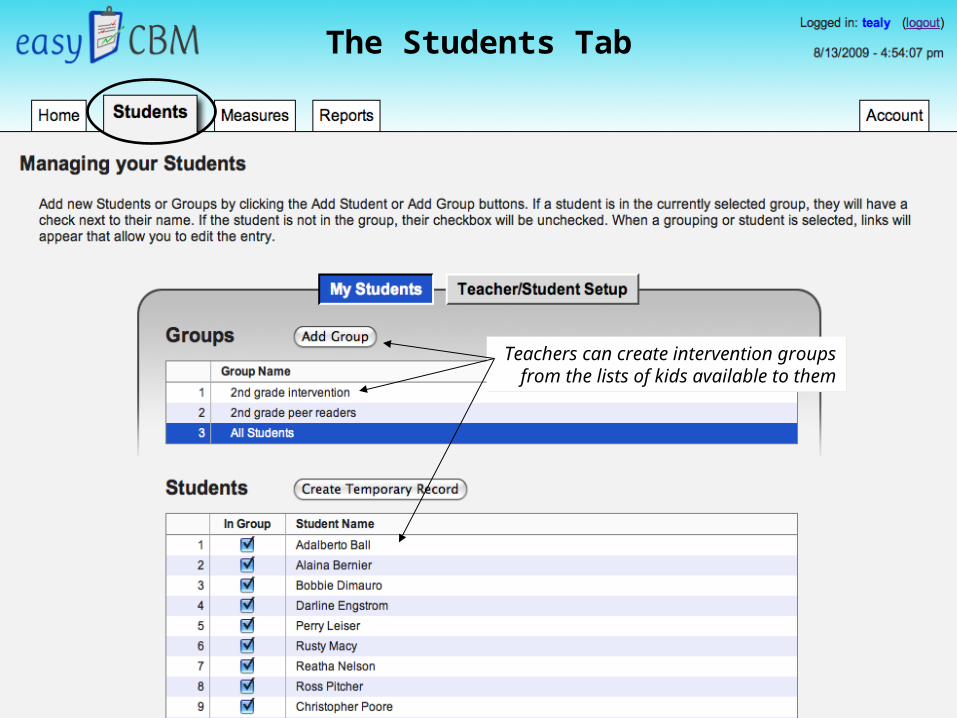
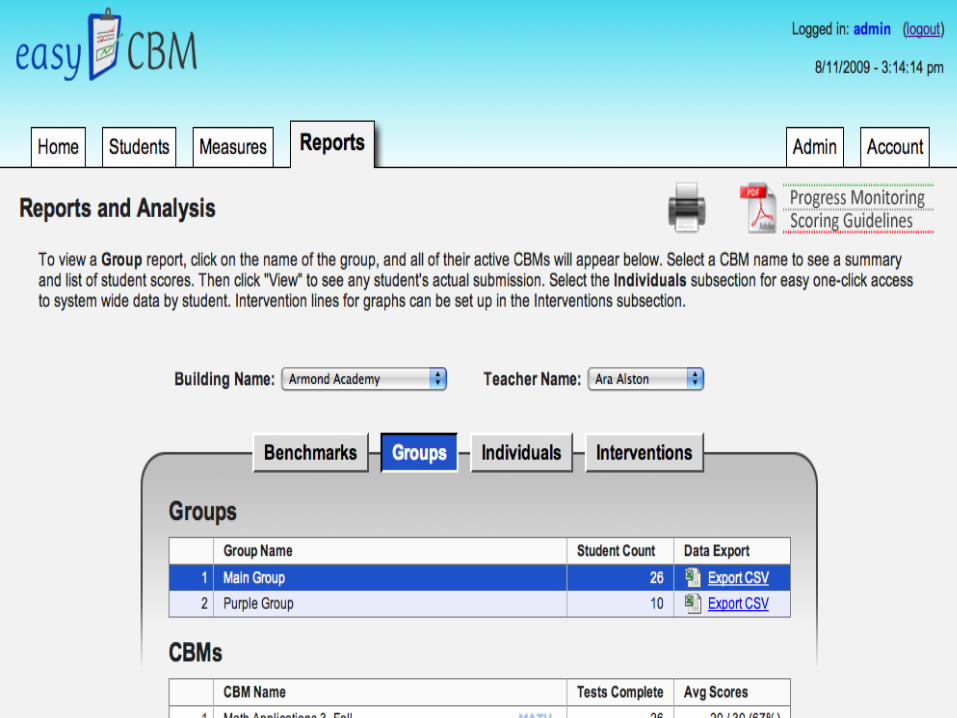
Teachers can create intervention groups from the lists of kids available to
them
Teachers can create intervention groups from the lists of kids available to
them
The Students Tab
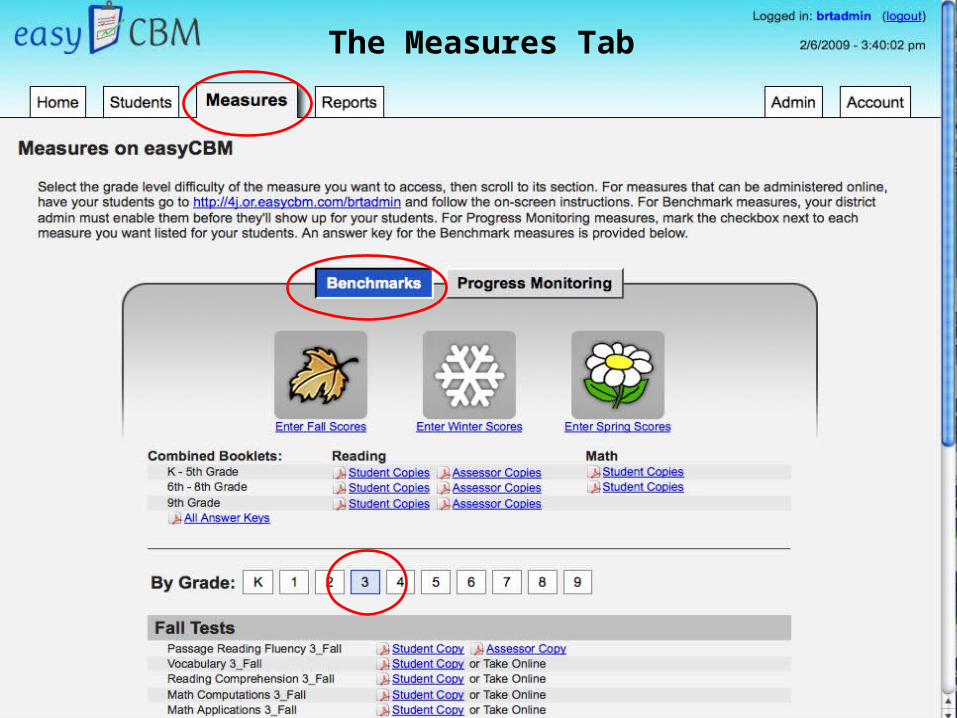
The Measures Tab
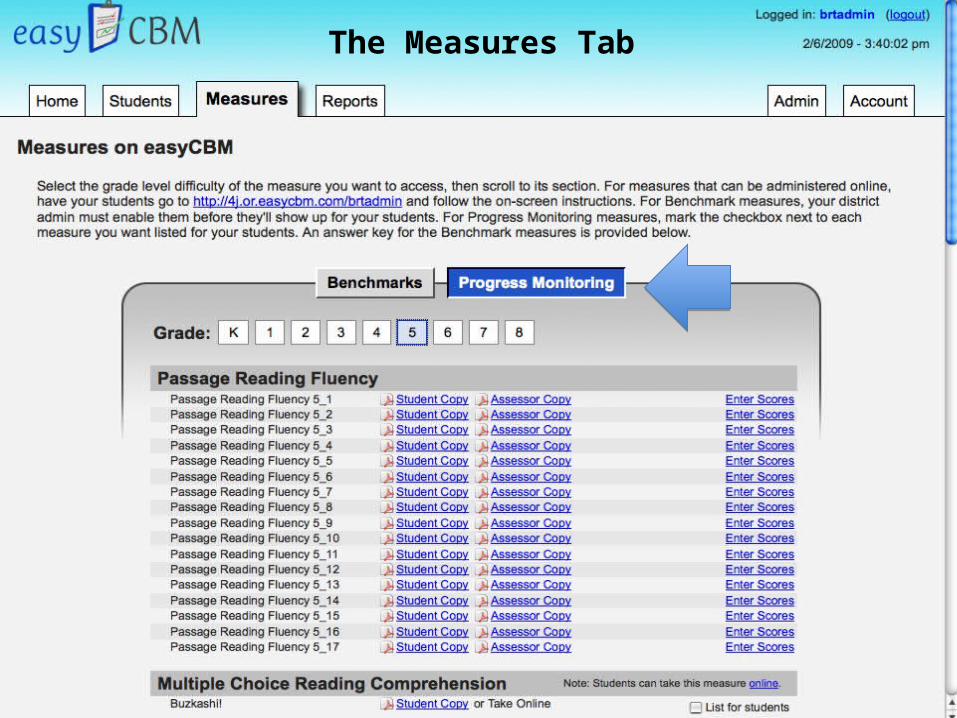
The Measures Tab
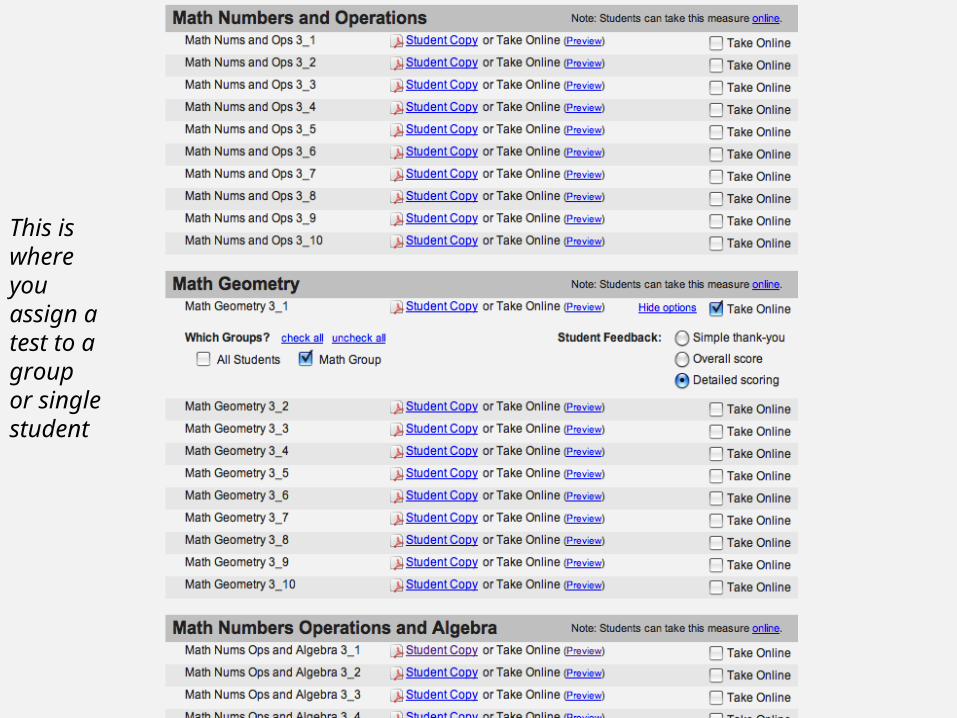
This is where you assign a test to a group or single student
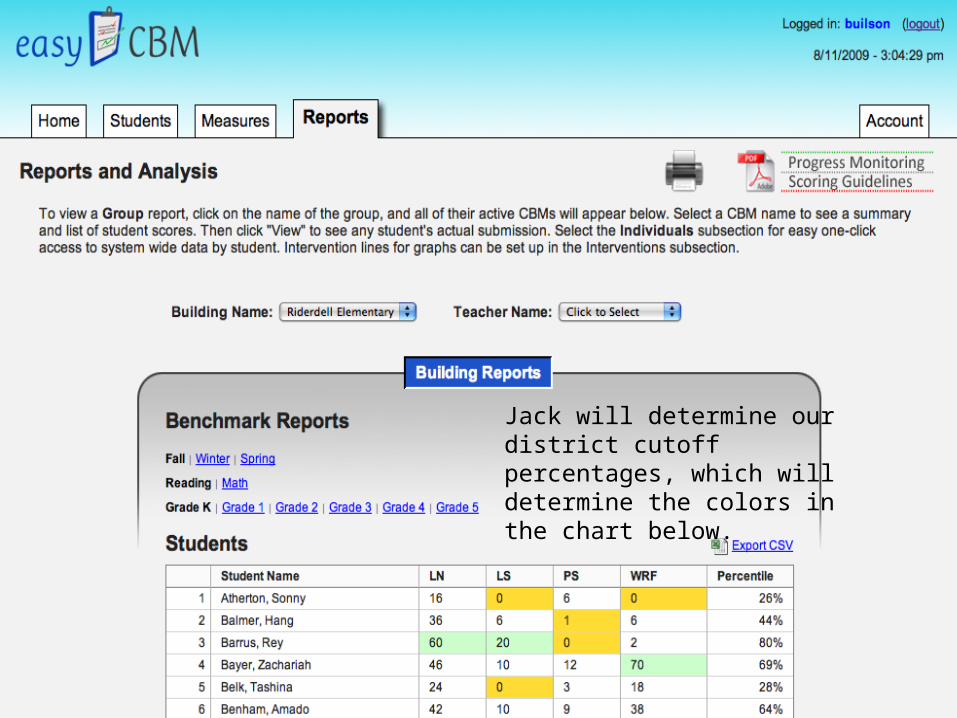
Jack will determine our district cutoff percentages, which will determine the colors in the chart below.
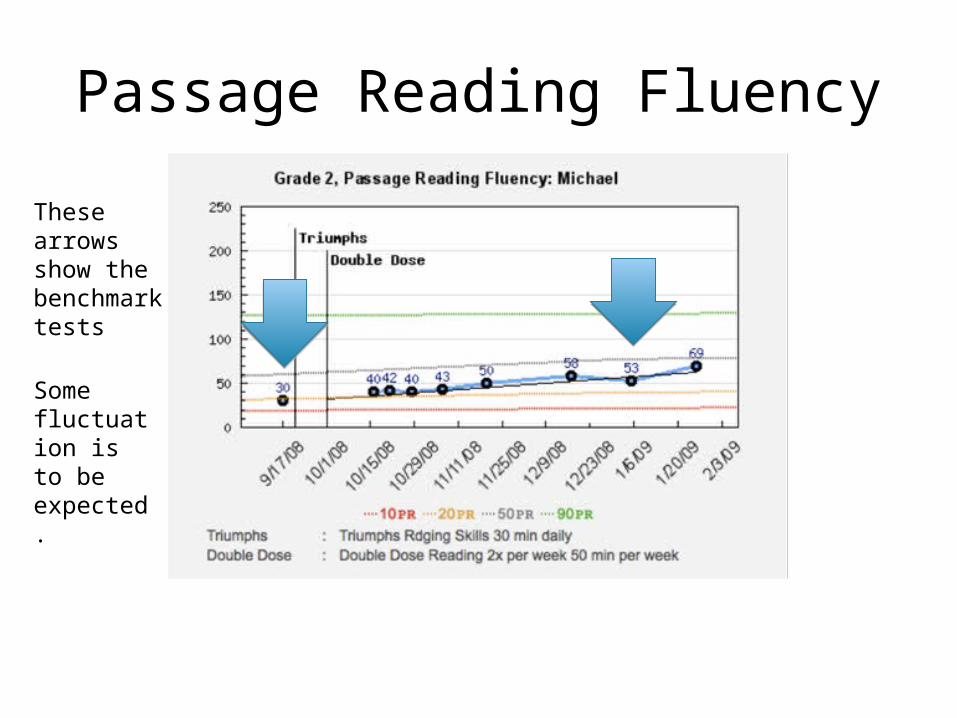
Passage Reading Fluency
These arrows show the benchmark tests
Some fluctuation is to be expected.
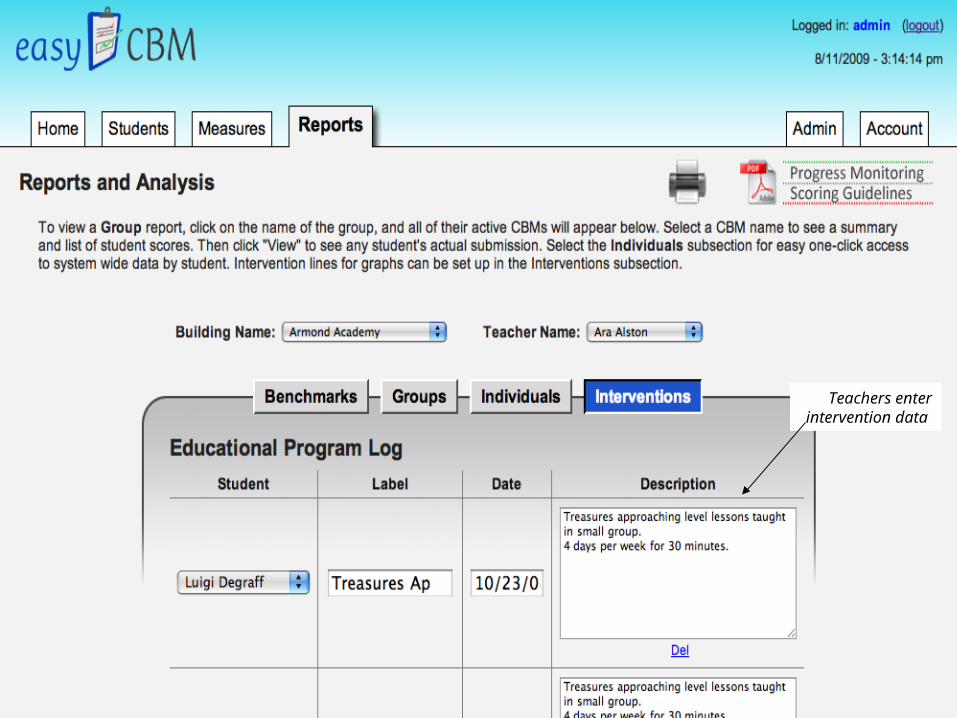
Teachers enter intervention data
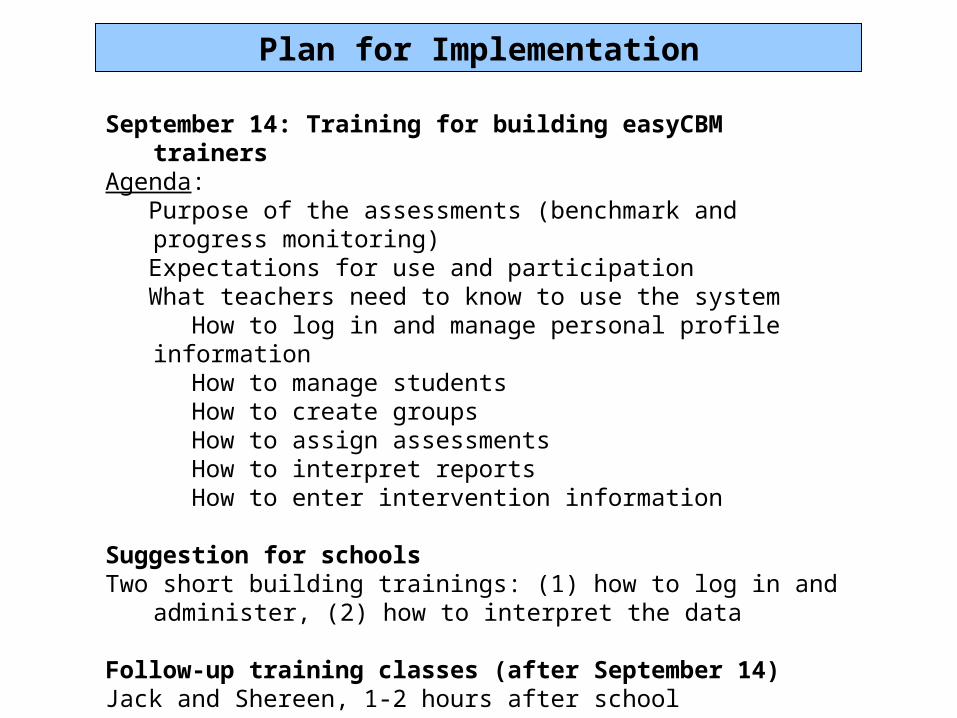
Plan for Implementation
September 14: Training for building easyCBM trainers
Agenda: Purpose of the assessments (benchmark and
progress monitoring) Expectations for use and participation What teachers need to know to use the system How to log in and manage personal profile
information How to manage students How to create groups How to assign assessments How to interpret reports How to enter intervention information
Suggestion for schoolsTwo short building trainings: (1) how to log in and
administer, (2) how to interpret the data
Follow-up training classes (after September 14)Jack and Shereen, 1-2 hours after school
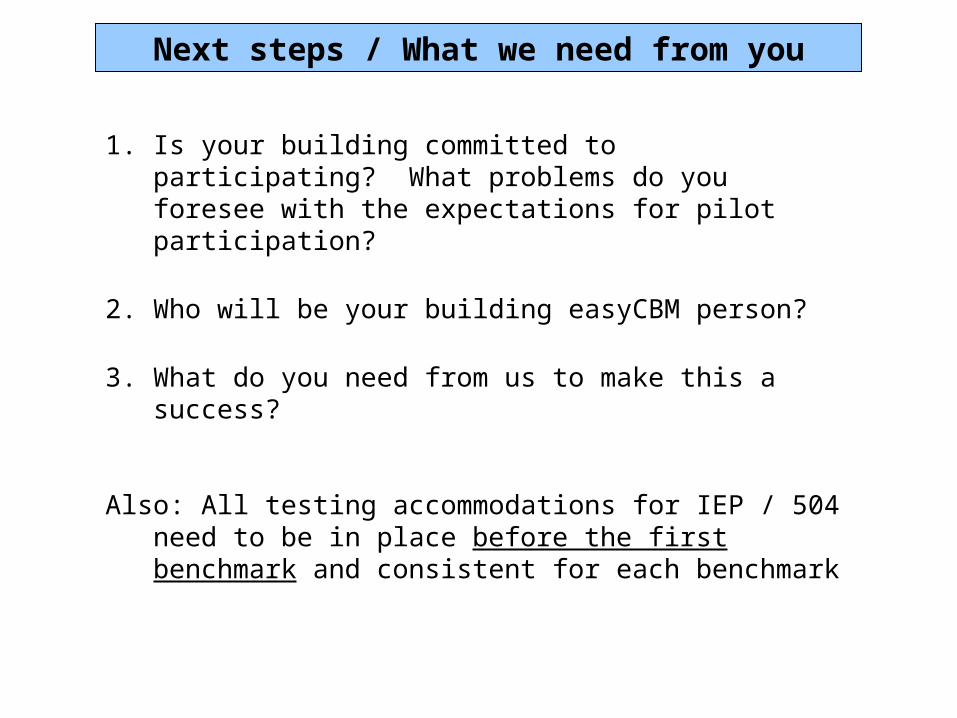
Next steps / What we need from you
1. Is your building committed to participating? What problems do you foresee with the expectations for pilot participation?
2. Who will be your building easyCBM person?
3. What do you need from us to make this a success?
Also: All testing accommodations for IEP / 504 need to be in place before the first benchmark and consistent for each benchmark


