Aced. And. d Pm. Vol. lb. No. I. pp. 19-36. 1984 ooo1475,64 33.00 * 00 Pnnrcd in Great Britain. % 1984 Pcrgvaoa Press Ltd.
DRIVER FATALITIES VERSUS CAR MASS USING A NEW EXPOSURE APPROACH
LEONARD EVANS Transportation Research Department. General Motors Research Laboratories. Warren, MI 48090,
U.S.A.
(Received 1 July 1982; in recked form 24 March 1983)
Abstract-A new approach to estimating exposure is presented and applied to determining relations between car mass and driver fatality likelihood. The new approach considers two groups of fatal crashes in the FARS files. The tirst group contains crashes in which car drivers are killed in single car crashes or in crashes with trucks. These are both examples of non-two car crashes. It is hypothesized that the likelihood of a car driver fatality in such crashes depends on car mass. The second group of fatal crashes contains crashes in which either pedestrians or motorcyclists are killed in crashes with cars. It is hypothesized that the likelihood of the pedestrian or motorcyclist being killed in such crashes is independent of the mass of the car. The new exposure approach implies that the ratio of the number of people killed in the mass dependent crash to those killed in the mass independent crash gives an estimate of how car mass affects the likelihood of a driver fatality. The approach further implies that the estimate obtained is an estimate of the physical effect of mass, essentially independent of driver behavior. It is found that the new exposure approach yields relationships between driver fatality likelihood and car mass that are more precise and consistent than can normally be obtained in accident research. The effects found, which are attributed to the physical properties of the vehicle, essentially independent of driver behavior, are larger (for example, a driver of a 900 kg car is 2.6 times as likely to be killed as is a driver of a 1800 kg car) than those based on fatalities per car.
The exposure problem
INTRODUCTION
One of the most vexing problems in traffic accident research is the question of exposure. We illustrate the difficulties by discussing a specific example-the question of the re- lationship between accident involvement and driver sex. Although there are copious data available on the number of accidents in which male and female drivers are involved, the question of which sex, other factors being equal, is more likely to be involved in accidents remains unresolved. To answer a question requires comparison of the number of accidents per “unit of exposure” for each group.
Various “units of exposure” are generally used, such as “per driver”, “per car”, or “per unit distance of travel”. Results based on any such measures of exposure are always open to criticism or “alternative explanations”. For example, to use simply “per driver” does not take into account that males and females may differ in the distance they drive per year. To use “per unit distance of travel” does not take into account that males and females may differ in the prdportion of distance driven at night, on rural roads, in small cars, while exhausted, while accompanied, while intoxicated, in rain, at weekends, etc.
What then is exposure if it is not “per unit distance of travel”? The following definition is offered:
“Exposure is, collectively, all the factors that might affect the accident rate, with the exception of the particular factor whose effect is being investigated.”
For example, if we wish to investigate car size effects on occupant fatalities, driver age is component of exposure [Evans, 19821 Smith and O’Day, 19821. However, if we were attempting to answer the question “How does driver age affect the likelihood of an occupant fatality?” then we should include car mass effects as a component of exposure.
In the present work, a new approach to the problem of exposure is proposed and used to determine relations between driver fatalities and car mass for two specific types of crashes which, together, account for more than half of all car occupant fatalities. These are single car crashes and crashes between cars and trucks, and together represent nearly all non-two car crashes. Two car (i.e. car-car) crashes are not considered. The results obtained are
I9

20 LEONARD EVANS
characterized by a consistency and absence of scatter found rarely in accident analyses. The high resolution of the method permits separating the data into finer details than is usually possible. For example, we concentrate exchrsively on cars with only one occupant, the driver, and thereby avoid effects due to occupancy rates. in addition, we segment into three driver age groups.
The results obtained are interpreted to give the physical effect of car mass on driver fatality likelihood, irrespective of driver behavior considerations. This interpretation, in common with all interpretations based on field data, is not invulnerabie to “alternate explanations”, some of which will be discussed.
Car muss relations The question of relations between car mass and fatality likelihood has been previously
addressed by Evans [1982], using “per car” as the exposure measure. The results for non-two car crashes showed an increase in fatality likelihood with decreasing car mass. However, there was considerable scatter in the data, which may arise from many sources (e.g. driver behavior may be a function (possibly non-systematic) of car mass, identical cars may have been coded with somewhat different masses in the fatal accident and car registration files due to the variety of definitions of car mass that are in use, etc).
Others [e.g. Joksch, 1976; Smith and O’Day, 1982; Stewart and Stutts, 1978; and Campbelt and Reinfurt, 19731 have also previously addressed questions of car mass effects on driver safety. However, comparisons of the present work with past work will focus mainly on the study of Evans [ 19821 because of that study’s use of FARSt data.
In this study, as in Evans [I9821 we focus on the variable “car mass”. However, it should be borne in mind that a relationship between car mass and fatality rate does not necessarily imply that car mass as such is the causative factor. Clearly, a wide variety of vehicular characteristics are correlated with car mass (e.g. wheelbase, track, “size” in general, hood length, trunk size, engine size, etc.). For two-car crashes, mass is involved directly through conservation of momentum-other factors being equal, the lighter car undergoes the larger speed change with consequent larger acceleration forces. For a single car crash into any heavy object which moves or distorts on impact, car mass will influence the resulting dynamics. However, there is no simple explanation why car mass as such should play a direct role in single car crashes into immovable rigid objects. This paper obtains relations between car mass and driver fatality rates using a new exposure approach-it does not attempt to identify the mechanisms that lead to such relations.
METHOD
New exposure approach Let us represent the exposure of cars of mass m s~bolically by
E(m) = E,(m) x E,(m) x E,(m). . . x E,(m). . * (1)
where each E,(m) represents the contribution to exposure of cars of mass m of such factors as; number of cars, average annual distance of travel per car, model year distribution, rural versus urban use, occupancy rate,. . ., driver age distribution, driver sex distribution, driver personality factors in car selection (do certain types of drivers tend to choose cars of different masses?), driver alcohol consumption, . . , , etc., etc.
In accident analyses, only a few of the .Ei(m)‘s can be included in the analysis because of data limitations. These few which can be used, such as number of cars of mass 171, usually contain uncertainties such as imprecise definitions. Here, E(m) may be conveniently considered to represent the number of cars of mass m, how far they are driven, how they are driven and by whom.
In the present approach we make the following hypotheses: (1) The likelihood of a pedestrian or a motorcyclist being killed in a crash with a car
does not depend on the mass of the car.
fFata1 Accident Reporting System, National Highway Traffic Safety Administ~tion, U.S. Department of Transportation.

Driver fatalitks versus car mass using a new exposure approach ?I
(2) The likelihood of a car driver fatality depends on the car mass in (i) single car crashes. (ii) crashes between cars and trucks.
(3) The dependence of car mass is the same for single car crashes and for car-truck crashes.
The basis for the first hypothesis is that in a crash between a car and either a pedestrian or a motorcyclist, the mass disparity if so great that the car’s speed is relatively unaffected by the impact. so that the intensity of the impact forces on the pedestrian or motorcyclist depends primarily on the initial speed of the striking car but not on its mass. It came to our attention at time of writing that Joksch and Knoop [1981] were also planning to use car occupants killed per pedestrian killed to study car size effects.
The second hypothesis is suggested by the prior work of Evans [1982] which showed car mass effects in non-two car crashes.
The third hypothesis will be supported by the analysis presented here. Let us introduce the following terminology: SC(m) = number of drivers of cars of mass m killed in single car crashes. CTR(m) = number of drivers of cars of mass m killed in crashes with trucks (gross
vehicle weight 2 10000 lbs). PED(m) = number of pedestrians killed in crashes with cars of mass m. MCY(m) = number of motorcyclists killed in crashes with cars of mass m. In order to avoid having to consider effects due to relationships between car occupancy
and car mass [Evans, 19821 only cars with one occupant, the driver, are considered. Therefore, the four quantities defined above all refer to a car of mass m containing an unaccompanied driver.
Our first hypothesis implies that the number of pedestrians (or motorcyclists) killed by cars of mass m should be proportional to the exposure of such cars. That is
PED(m) a E(m) (2)
and
MCY(m) a E(m) (3)
Our second hypothesis implies that the numberof drivers killed in single car crashes (or car-truck crashes) depends on the mass of the car as well as the exposure. Therefore, we have
and
SC(m)a L(m)E(m)
CTR(m) a L(m)E(m)
(4)
(5)
where L(m) is the functional dependence of the likelihood of a driver fatality on the mass of the car, which, because of our third hypothesis is assumed to be the same for single car and car-truck crashes.
Basically, E(m) represents how the number of crashes involving cars of mass m depends on m. It is assumed that this mass dependence is the same for all the types of crashes considered. The quantities on the left hand side of eqns (2-5) all give the probability that the indicated person is killed, given that the crash. has occurred.
Equations (2-5) give the following relationships
SC/PED a L(m) (6)
SC/MCY a L(m) (7)
CTR/PED a L(m) (8)
CTR/MCY a L(m) (9)

22 LEONARD EVANS
PED/MCY = constant. independent of m (10)
SC&XR = constant, independent of m (11)
Each of the four eqns (6-9) provides an estimate of L(m). It is the primary purpose of the present work to estimate L(m), the dependence of driver fatality likelihood on car mass. Note that L(m) does not depend on driver behavior, because we assume that driver behavior effects are represented by E,‘s that appear in both numerator and denominator of eqns (9-1 l), and accordingly cancel when the ratios to estimate L(m) are calculated. Thus L(m) is an estimate of how the physical attributes of the car influence the likelihood of a driver fatality.
To test the hypotheses, we compute the ratios in eqns (6-9). A mass dependence of similar magnitude in the ratios in eqns (6-9) will be interpreted as supportive of the hypotheses. Further, the absence of any mass dependence in the ratios in eqns (IO) and (11) will be interpreted as further supportive evidence of the hypotheses,
Datu Data from the Fatal Accident Reporting System (FARS) for 1975 through 1980
combined were used to compute the ratios in the Ieft hand side of eqns 6-l 1. The data were divided into three driver age groups 16-24 yr, 25-34 yr and > 35 yr. By
dividing the data into these three age groups, we generate three estimates for each of the six relations (eqns 6-I I), and thereby obtain 18 relations with which to test our hypotheses. As L(m) is presumed to be a “pure” mass effect, as contrasted to one resulting in part from interactions between mass and such characteristics as driver behavior or use patterns, the results should be independent of driver age, thus providing further tests of the hypotheses.
All the data were segmented by car mass, m, into groups.. . (600 rt 50) kg, (700 f 50) kg. . . etc.
RESULTS
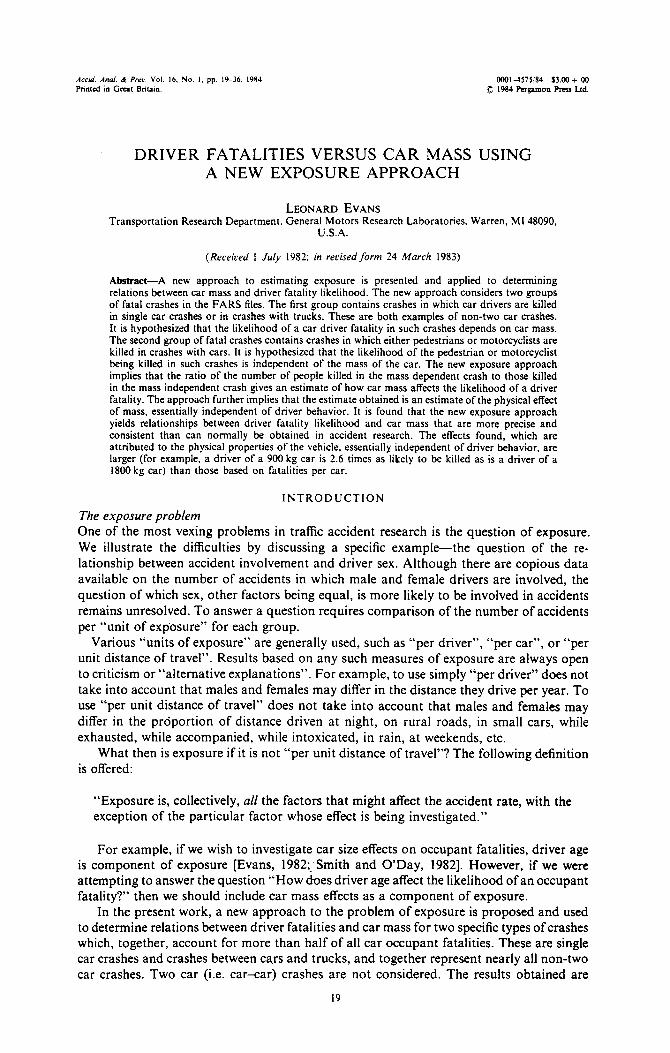
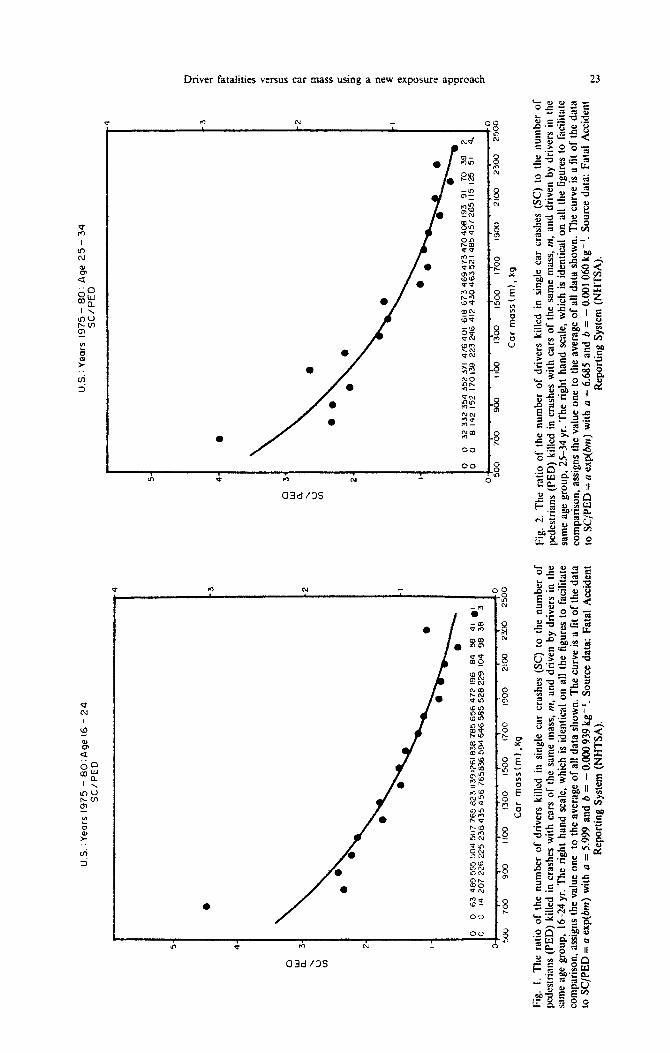
The fatality ratios computed from the FARS data are shown in Figs. l-18. The raw data are shown at the bottom of each figure. For example, from Fig. 1 we note that 1261 drivers were killed in single car crashes in cars of mass (1500 + 50) kg and that 836 pedestrians were killed by cars of mass (1500 -_t: 50) kg. The ratio of these, 1.5 1, is the point plotted (left hand scale) at m = 1500 kg. The right hand scale assigns the value one to the average of ail the data plotted in that figure (e.g. total drivers killed in single car crashes divided by total pedestrians killed, as given in Fig. 1) so that all figures may be conveniently compared.
The data in each figure have been fitted to the function
y =u exp(bm) (12)
by a least squares linear regression of m on log b). Only ratios involving a total of 10 or more fatalities, with at least 4 in the denominator, contribute to the ftt. However, all ratios are plotted, and the raw data (i.e. numbers of fatalities) are shown at the bottom of each graph. The few cases where the ratio is beyond the boundaries of the graph are identified by an arrow on top of the figure.
The values of b for all 18 cases are shown in Table 1. As a guide to the goodness of fit of eqn 12 to the data, the 1% error limits on b are shown in Table 1; these were computed from the standard error of the estimate of b in the least squares fit of log (Y) vs m. The dashed line divides the 12 cases- (four ratios times these age groups), for which we hypothesize a mass effect from the 6 cases for which we hypothesize no mass effect.
It is immediately apparent that.ali 18 cases are consistent with our hypotheses. All I2 cases that are hypothesized to be mass dependent yield highly consistent mass
effects. In addition to the 1% error limits shown in Table 1, the correlations between the raw data and the values estimated by eqn (12) with the b value in Table 1 were examined. In
5 4 2 C
U.S
.: Ye
ars
1975
-
80:A
ge
16 -
24
S
C/P
ED
U.S
.: Y
ears
197
5 -
80:
Age
25
-
34
SC
/PE
D
I 0
63
489
555
504
507
765
d23
11
3912
6163
8 78
5 65
6 47
2 19
6 84
58
41
0
14
207
226
225
236
435
456
7658
36
594
646
585
528
229
104
98
38
@I 3
t I
- r
J 70
0 90
0 ilo
o
1300
15
00
1700
I9
00
21#
2xX
1 2
Car
m
ass(
m),
kg
Fig.
I.
The
ra
tio
of
the
nu
mb
er o
f d
rive
rs k
illed
in
sin
gle
car
cra
shes
(S
C)
to t
he
nu
mb
er o
l’ p
edes
tria
ns
(PE
D)
kille
d i
n c
rash
es w
ith
car
s o
f th
e sa
me
mas
s, m
, an
d d
rive
n b
y d
rive
rs i
n t
he
sam
e ag
e g
rou
p,
16-2
4 yr
. T
he
rig
ht
han
d s
cale
, wh
ich
is
iden
tica
l o
n a
ll th
e fi
gu
res
to f
acili
tate
co
mp
aris
on
, ass
ign
s th
e va
lue
on
e to
th
e av
erag
e o
f al
l d
ata
show
n. T
he c
urve
is
a fi
t of
the
dat
a to
SC
/PE
D
= a
exp
(6m
) w
ith u
= 5
.999
and
6 =
-
0.00
0 93
9 kg
-‘.
Sour
ce
data
: Fa
tal
Acc
iden
t R
epor
ting
Syst
em (
NH
TSA
).
5 4 2 0
b
0 32
33
2 35
4 35
2 37
1 47
6 40
1 61
6 67
3 46
9473
47
0406
19
3 91
70
39
-2
,
0 8
142
152
1701
39
2232
46
412
4304
6352
1495
4572
6511
5 12
5 51
4.
II 70
0 90
0 I. loo
I.
I. r.
1
.’ 1
1300
15
00
I 700
19
m
2100
23
00
2’
Car
mo
ss(m
),
kg
Fig
. 2.
T
he
rati
o
of
the
nu
mb
er o
f d
rive
rs k
illed
in
sin
gle
car
cra
shes
(S
C)
IO t
he
nu
mb
er
or
ped
estr
ian
s (P
ED
) ki
lled
in
cra
shes
wit
h c
ars
of
the
sam
e m
ass,
m,
and
dri
ven
by
dri
vers
in
th
e sa
me
age
gro
up
, 25
-34
yr.
Th
e ri
gh
t h
and
sca
le, w
hic
h i
s id
enti
cal
on
all
the
fig
ure
s IO
fac
ilita
te
com
par
iso
n,
assi
gn
s th
e va
lue
on
e to
th
e av
erag
e o
f al
l d
ata
sho
wn
. T
he
curv
e is
a l
it o
f th
e d
ata
to S
C/P
ED
=
o e
xp@
m)
wit
h o
= 6
.685
an
d b
=
- 0.
0010
60
kg-‘
. S
ou
rce
dat
a: F
atal
A
ccid
enl
Rep
ort
ing
Sys
tem
(N
HT
SA
).

U.S
. :Y
ears
19
Sz;
::;A
ge
> =
35
I 0
2’8
31,
376
327
347
523
538
684
696
769
909
853,
149
586
244
237
1%
15
0 I
I 79
11
4 I
IO
127
208
251
5364
71
532
713
653
9045
69
3053
00
173
24
1 -
1 .
1
3 70
0 90
0 I
IO0
1300
15
00
1700
19
00
2100
23
00
:
Co
r m
a55
Im),
kg
3
US
.:Y
eors
19
75-8
0’A
ge
16-2
4 S
C/
MC
Y
0 65
48
9555
50
4 50
7 76
5ti2
3 11
3912
6185
8 78
56?
6 4,
;’
I96
Y.1
W
4,
u
2
51
57
49
51
BG
10
2 18
7 72
7 15
1 16
3 13
9 11
3 64
28
20
;J
:
Fig
. 3.
T
he
r&ti
o
of
the
nu
mb
er
or
dri
vers
ki
lled
in
si
ng
le
c:tr
cr
nsh
es
(SC
) to
th
e n
um
ber
o
f’
pcd
cstr
im~s
(P
ED
) ki
lled
in
crn
shcs
w
ith
cx
s o
f th
e s;
m~c
mo
ss,
IPI.
and
d
rive
n
by
dri
vers
in
th
e F
ig.
4.
Th
e r~
[tio
of‘
th
e n
um
bo
r o
f d
rive
rs
kille
d
in
sin
gic
ca
r cr
nsh
cs
(SC
) to
tb
c n
lmtb
cr
of
SX
W
:I&
2 !P
UP
, 2
3.5
yr.
‘k
c ri
gh
t h
lld
W
lk,
wh
ich
is
id
dcd
o
n
ull
th
e ti
gu
rcs
10
t&ili
tate
m
oto
rcyc
lists
(M
C’Y
) ki
lled
in
cru
shes
w
ith
c;
!rs
of
the
s;lm
c III
;IS
S, 1
1,. a
nd
d
rive
n
by
dri
vers
in
th
e
com
piir
iso
n,
itss
ign
s th
e V
~UC
O
M
to
the
aver
qc
OF
nil
dat
n
sho
wn
. T
he
curv
e is
;L
tit
of
the
dtt
(a
s;[m
c ag
e g
rou
p,
16-2
4 y
r.
Th
e ri
gh
t h
;ln
d
sCi&
, w
hi&
is
i&
nti
c;ll
01
1 a
ll
the
lig
ure
s (0
f;
lCil
ita
te
to S
C/l’
ED
=
u c
Xp
(fW
t)
wit
h
U =
7.
419
and
h
=
- 0.
000
907
kg _
‘.
So
urc
e d
nta
: F
uta
l A
ccid
ent
com
pn
riso
n,
assi
gn
s th
e vt
llue
on
e to
th
e av
crag
c o
l’ u
ll d
itta
sh
ow
n.
Th
e cu
rve
is a
fit
of
the
dxt
;t
Rep
ort
ing
S
yste
m
(NH
TS
A).
to
SC
/MC
Y
= (1
cxp
(h,,r
) w
ilh
(1
=
23.1
65
itn
d 0
=
- t)
.t)t
)t) (
)()2
kg
‘.
So
urc
e d
;ita
: F
nta
l A
ccid
ent
Rep
ort
ing
S
ys~c
m (
NH
TS
A).
Driver fatalities versus car mass using a new exposure approach
h3W / 35

US
: Y
ears
19
;“,;
yOp
:EA
ge
16 -
24
U.S
.:Y
ears
19
75-l
30.A
ge
25-3
4 C
TR
/PE
D
0 I3
9,
75
13
5 88
10
7 Ill
14
8 14
4 11
3 10
6 95
78
28
IO
IO
4
0 0
14 2
0722
6 22
5 23
6 43
5 45
6 76
5 83
694
646
585
5282
29
104
96
38
3
700
900
1100
I3
OC
15
00
I700
19
00
2100
23
00
2
Car
m
ass(
m),
kg
08
06
0 ii!
h
z
04
02 0
4 +
I 0
7 61
61
54
59
66
67
96
94
94
96
74
99
30
15
16
5
, 0
6 14
2 15
2 17
0 13
9223
246
412
4304
63
521
465
4572
65
II5
125
51
4”
3 70
0 90
0 ,1
00
1300
I5
00
I700
19
00
2100
23
00
i
Car
m
oss
(m),
kg
I I >
c T ? 6
1 3
Fig
. 7.
T
he
rati
o
of
the
nu
mb
er or
driv
ers k
illed
in
car
-tru
ck
cras
hes
(C
TR
) to
th
e n
um
ber
o
f p
edes
tria
ns
(PE
D)
kille
d
in c
rash
es
wit
h c
ars
of
the
sam
e m
ass,
m,
and
d
rive
n
by
dri
vers
in
th
e
Sam
e ag
e cr
ou
p,
16-M
yr
. T
he
firs
t ri
gh
t h
and
sc
ale,
wh
ich
is
iden
tica
l o
n t
he
fig
ure
s to
fac
ilita
te
com
par
iso
n,
assi
gn
s th
e va
lue
on
e to
th
e av
erag
e o
f al
l d
ata
sho
wn
. T
he
curv
e is
a f
it
of
the
dat
a IO
CT
R/P
ED
=
(I e
xp(b
m)
wit
h
a =
1.17
2 an
d
b =
-0
.001
13
9 kg
-‘.
So
urc
e d
ata:
F
atal
Acc
iden
t R
epo
rtin
g
Sys
tem
(N
HT
SA
).
Fig
. g
. T
he
rati
o
of’
th
e n
um
ber
o
f d
rive
rs
kille
d
in c
ar-t
ruck
cr
ash
es
(CT
R)
lo
the
nu
mb
er
of
ped
estr
ian
s (P
ED
) ki
lled
in
cra
shes
w
ith
ca
rs o
f th
e sa
me
mas
s, m
, an
d
dri
ven
b
y d
rive
rs
in t
he
Sam
e ag
e g
rou
p,
X-3
4 yr
. T
he
rig
ht
han
d
scal
e, w
hic
h
is id
enti
cal
on
all
the
fig
ure
s to
fac
ilita
te
com
par
iso
n,
assi
gn
s th
e va
lue
on
e to
th
e av
erag
e o
f al
l d
ata
sho
wn
. T
he
curv
e is
a l
it
of
the
dat
a to
aR
/PE
D
= u
exp
(bm
) w
ith
a
= 1.
260
and
b
= -
0.00
1 I
IO k
g -
‘. S
ou
rce
dat
a:
Fat
al
Acc
iden
t R
eDo
rtin
e.
Sys
tem
(N
HT
SA
).

US
..Yea
rs
1975
-83:
Ag
e 16
-24
CT
R/M
CY
$ 06
a \ E
u
04
02 0
0 6
69
82
Bti
95
132
155
241
144
2002
37
207
261
135
49
63
38
5 0
II 79
114
1101
2720
8251
53
647,
53
2713
6539
0456
9305
30
0173
24
1 70
0 90
0 I1
00
1300
I5
00
1700
19
00
2100
23
00
2
Car
m
ass(
ml,
kg
Fig
. 9.
T
he
rati
o
of
the
nu
mb
er
of
dri
vers
ki
lled
in
car
-tru
ck
cras
hes
(C
TR
) to
th
e n
um
ber
o
f p
edes
tria
ns
(PE
D)
kille
d
in c
rash
es
wit
h
cars
of
the
sam
e m
ass,
m,
and
d
rive
n
by
dri
vers
in
th
e sa
me
age
gro
up
, >
35 y
r. T
he
rig
ht
han
d
scal
e, w
hic
h
is i
den
tica
l o
n a
ll th
e fi
gu
res
to f
acili
tate
co
mp
aris
on
, as
sig
ns
the
valu
e o
ne
to
the
aver
age
of
all
dat
a sh
ow
n.
Th
e cu
rve
is a
tit
of
the
dat
a IO
CT
R/P
ED
=
u e
xp(b
tn)
wit
h
u =
1.
832
and
b =
-0.000 9
86 k
g-r
. S
ou
rce
dat
a:
Fat
al
Fig
. IO
. T
he
rati
o
of
the
nu
mb
er
of
dri
vers
ki
lled
in
car
-tru
ck
cras
hes
(C
’TR
) IO
th
e n
um
ber
o
f m
oto
rcyc
lists
(M
CY
) ki
lled
in
cra
shes
w
ith
cd
rs o
f th
e sa
me
mas
s, !
)I,
and
d
rive
n
by
dri
vers
in
th
e sa
me
age
gro
up
, 16
24
yr.
Th
e ri
gh
t h
and
sc
ale,
w
hic
h
is i
den
tica
l o
n
all
the
fig
ure
s to
fu
cilit
ate
com
par
iso
n,
assi
gn
s th
e va
lue
on
e to
th
e av
erag
e o
l’ al
l d
ata
sho
wn
. T
he
curv
e is
a
tit
of
the
dat
a to
C
TR
/MC
Y
= II
exp
(hm
) w
ith
u
= 4
.144
an
d
h =
-0
.001
05
3 kg
-‘.
So
urc
e A
ccid
ent
Rep
ort
ing
S
yste
m
(NH
TS
A).
d
ata:
F
atal
A
ccid
ent
Rep
ort
ing
S
yste
m
(NH
TS
A).
> Y
\ E
u
I I 0 0 < 1
500
0 I.,
91
75
85
B
B
107
,:I,
146
I44
II3
IOG
95
78
20
IO
IO
4
0 0
2 51
57
49
51
66
10
2 16
7227
IS
I 16
3139
II3
64
26
20
IO
0
700
900
II00
1300
15
00
I700
19
00
2100
23
00
i
Car
m
asst
ml,
kg

US
.Y
ears
19
75-8
0:
Age
25
-34
CT
R
/MC
Y
U.S
:Y
eors
t9
75-8
0’A
ge
>=
35
CT
R/M
CY
4
3.
z-
,-
C
(
of-
50 1
0 7
61
81
54
59
68
67
96
94
94
96
74
93
30
15
16
5 0
) 0
3 23
26
36
43
55
53
99
9,
83
95
12
3 93
56
25
23
8
0
0 70
0 9&
J II0
0 I i
o,
I500
I7
00
1900
ZI
OO
23
00
:
Car
m
ass(
m
),kg
b’ig
. I I
. T
he
rati
o
of
the
nu
mb
er
of
dri
vers
ki
lled
in
ca-
tru
ck
cras
hes
(C
TR
) to
th
e n
um
ber
of
mo
torc
yclis
ts
(MC
Y)
kille
d
in c
rash
es
wit
h
cars
o
l th
e sa
me
mas
s, m
, an
d
dri
ven
b
y d
rive
rs
in t
he
sam
e ag
e g
rou
p,
25-3
4 yr
. T
he
rig
ht
han
d
scal
e,
wh
ich
is
id
enti
cal
on
al
l th
e fi
gu
res
to
licili
tate
co
mp
aris
on
, as
sig
ns
the
valu
e o
ne
to
the
aver
age
or
all
dat
a sh
ow
n.
Th
e cu
rve
is a
li
t V
T t
he
dal
a to
C
TR
/MC
Y
= 11
exp
(bn
t)
wit
h
(I =
4.6
06
and
b
=
- 0.
000
94s
kg-
‘. S
ou
rce
dat
;l:
l~;~
tal A
ccid
ent
Rep
ort
ing
S
yste
m
(NIIT
SA
).
0
0
0 a
69
82
88
95
13%
155
24
1 14
4 20
02:7
10
7x1
I35
49
63
38
5 0
1 20
3,
30
39
66
73
16
8 13
9 15
4225
2O
cfZ
28
171
95
7G
33
7
1 )
700
900
1100
1300
IW
O
I700
I9
00
P,“
U
1 S
K,
“
Car
m
ass(
ml,
kg
Th
e ra
tio
o
f !h
e n
um
ber
o
f d
rive
rs
kille
d
in c
ar-l
ruck
cr
ash
es
(CT
R)
lo
the
nu
mb
er
or
mo
torc
yclis
ts
(MC
Y)
kille
d
in c
rash
es
wit
h
curs
of
the
sam
e m
ass,
m,
and
d
rlvc
n
by
dri
vers
in
th
e sa
me
age
gro
up
, 2
35 y
r.
Th
e ri
gh
t h
and
sc
ale,
w
hic
h
is i
den
tica
l o
n
all
the
fig
ure
s lo
fa
cilir
ate
com
par
iso
n,
assi
gn
s th
e va
lue
on
e to
th
e n
vera
gc
or
all
d;r
ln s
ho
wn
. T
he
curv
e is
a
lil
of
the
dal
a IO
CT
R/M
CY
=
(1 e
xp(b
n)
wit
h
(1 =
6.
524
un
d
b =
-0
.000
9X2
kg
I. S
ou
rce
del
a:
1:;1
~11 A
ccid
ent
Rep
ort
ing
S
yste
m
(NI
ITS
A).
,, ‘.“
“.--
..---
--“I
1

U.S
.-Y
ears
19
;;;,
8;)C
yAq
e 16
- 24
0
14 207 226 225236
435 456765836594646
585 528 229104
98
38
3
0
2
51
57
49
51
86 102 187227
I51 163 139 113 64 28 20
IO
0
700
900
1100
1300
1500
1700
1900
2100
2300
;
Car
m
asst
ml,h
q
Fig
. 13
. T
he
ralio
o
f th
e n
um
ber
o
f p
cdcs
tri;
ms
(I’E
D)
kille
d
to
the
nu
mb
er
ol
mo
torc
yclis
ts
(MC
Y)
kille
d
in c
rush
es w
ith
c;
lrs
ol’t
he
SIII
IIC‘ ~
IISS
. 1~
. ;m
d d
rive
n
by
dri
vers
in
th
e sa
me
z&e
gro
up
, 16
-24y
r.
Th
e ri
gh
t h
and
sc
ale,
w
hic
h
is
ide
ntic
al
on
a
ll th
e
figu
res
to
fac
ilita
te
co
mp
aris
on
, a
ssig
ns
the
va
lue
on
e t
o
the
ave
rag
e o
f al
l d
ata
sho
wn
. T
he
curv
e is
a f
it
of
the
dat
n
to
PE
D/M
CY
=
,I cx
p(b
nt)
w
ith
(1
=
4.W
iO n
od
h
=
-0.0
0005
5 kg
‘.S
ou
rcc
dn
l:~
: F
:It;
tI
Izig. 1
4.
Th
e r;
itio
o
f th
e n
um
ber
o
f p
edp
s1ri
;ln
s (I
’IXD
) ki
lled
IO
th
e n
um
ber
.ol
nio
torc
yclis
ls
(MC
Y)
kille
d
in c
rush
es
wit
h
cars
o
l’ th
e sa
me
mu
ss,
m,
and
d
rive
n
by
dri
vers
in
th
e sa
me
age
gro
up
. 25
-34y
r.
Th
e ri
gh
t h
and
sc
ale,
w
hic
h
is
iden
tica
l o
n
all
the
ligu
rcs
to
Ibci
lilat
e
com
par
iso
n,
assi
gn
s th
e v;
du
e o
ne
to
1he
ever
;lg
e o
l‘ ;I
II d
ata
sho
wn
. T
he
curv
e is
il
lit
01’ t
he
d:l
t;l
10 p
ED
/MC
Y
_ 0
cxp
(/~,
) wilt) rr =
4.40
0 ;I
II~
b
= O
.tM
H)t
)62
kg
‘. S
~ttr
cc
d;l
lti:
l’
:It:
ll
Ac
cid
en
t Re
po
rtin
g
Sys
~cm
(N
i IT
SA
).
Acc
iden
t R
epo
r1in
g
Sys
1en
l (N
I IT
SA
).
0
8 142 152 170 139223246
412 430463521485457
265 II5 I25 51
4
0
3
23
26
36
43
55
53
99
91
83 9:, 123 93
26
25
23
8
0
1.
1.
I
700
900
1100
1300
I500
1700
1900
PI00
2300
2
Car
m
asst
m),
kg

I 0 0
I, I 20
79
I1
4 31
I 30 10
12
7 39
20
8 66
251 73
536
168
471
I39
532
1542
25 71
3 20
9 65
3 90
4 22
8 56
9 17
1 30
5 95
300 76
17
3 33
24
7
0 70
0 9G
O
1100
I3
00
1500
17
00
1900
21
00
2300
i
Car
m
oss(
m),
kg
U S
Y
ears
19
75 -
80’
Age
>=35
P
EO
/MC
Y
Fig.
15
. The
rat
io o
f th
e nu
mbe
r of
ped
estr
ians
(P
ED
) ki
lled
to t
he n
umbe
r of
mot
orcy
clis
ts
(MC
Y)
kille
d in
cra
shes
with
car
s of
the
sam
e m
ass,
m,
and
driv
en
by d
rive
rs
in t
he s
ame
age
grou
p,
t 3S
yr.
The
ri
ght
hand
sc
ale,
w
hich
is
id
enlic
al
on
all
the
figu
res
to
faci
litat
e co
mpa
riso
n,
assi
gns
the
valu
e on
e to
the
ave
rage
of
all
data
sh
own,
T
he c
urve
is
a fi
t of
the
da
ta
to
PED
/MC
Y
= a
exp
(6m
) w
ith a
= 3
.234
and
b
= O.
ooOO
S5
kg-‘.
Sour
ce
data
: Fa
tal
Acc
iden
t R
epor
ting
Syst
em
(NH
TSA
).
trS
..Yeo
rs
1975
-8O
.Age
16
-24
SC
/CT
R
, 0
63
489
555
504
507
765
823
1139
12
6183
8 78
5 65
6 47
2 19
6 84
56
41
1
, 0
13
91
75
85
813
107
, ,
I 14
8 !4
4 I1
3 10
6 95
78
28
IO
IO
4
0
4 1
‘, 1
I. I
500
700
900
,100
13
00
1500
17
00
,900
21
00
2300
2
Car
mos
stm
), kg
Fig.
16
. T
he r
atio
of
the
num
ber
of d
rive
rs
kille
d in
sin
gie
car
cras
hes
(SC
) to
the
num
ber
of
driv
ers
kille
d in
car
-tru
ck
cras
hes
(CT
R)
kille
d in
cra
shes
w
ith c
ars
of t
he s
ame
mZl
SS,
m,
and
driv
en
by d
rive
rs
in t
he s
ame
age
grou
p,
16-2
4 yr
. T
he r
ight
han
d sc
ale,
whi
ch i
s id
entic
al
on
all
the
figu
res
to f
acili
tate
com
pari
son,
as
sign
s th
e va
lue
one
to t
he a
vera
ge o
f al
l da
ta
show
n.
The
cur
ve i
s a
fit
of t
he d
ata
to S
C/C
TR
=
a e
xp(b
m)
with
(I
= 5
.120
and
6 =
0.0
00 2
00 k
g-‘.
So
urce
da
ta:
Fata
l A
ccid
ent
Rep
ortin
g Sy
stem
(N
HT
SA).

20
I5
a c Y x
5 0
U.S
. :‘
t’ea
rs t
975-
80
:Ag
e 25
-34
SO
KT
R
A
0 32
33
2 35
4 35
2 31
1 47
6 40
1 0
7 61
61
54
59
68
67
61
6 67
3 46
9473
47
0406
19
3 91
70
39
2
9%
94
94
96
74
99
30
JS
16
5 0
‘ 3
3 70
0 90
0 11
00
1300
1500
17
00
1900
21
00
2300
i
Ca
r m
oss
(M
1,
kg
Fig
. 17
. T
he
rati
o o
f th
e n
um
ber
of
dri
vers
kill
ed i
n s
ing
le c
ar c
rash
es (S
C)
to t
he
nu
mb
er a
f d
rive
rs k
illed
in
car
-tru
ck
cras
hes
(CT
R)
kille
d i
n c
rash
es w
ith
car
s o
f th
e sa
me
mas
s, m
, an
d
dri
ven
by
dri
vers
in
th
e sa
me
age
gro
up
, 25
-34
yr.
Th
e ri
gh
t h
and
sca
le, w
hic
h i
s id
enti
cal
on
al
l th
e fi
gu
res
to B
cilit
ate
com
par
iso
n,
assi
gn
s th
e va
lue
on
e to
th
e av
erag
e o
f al
l d
ata
sho
wn
. T
he
curv
e is
a f
it o
f ti
re d
ata
to S
C/C
TR
=
a ex
p@
m)
wit
h I
I =
5.30
4 an
d b
= O
.oo
O 05
0 kg
-l.
So
urc
e d
a&t:
Fat
al
Acc
iden
t R
epo
rtin
g S
yste
m (
PIH
TS
A),
Co
r m
oss
tmf,
kg
U.S
.:
Yea
rs ‘
9$,,-
;.A
ge
>=35
Cl
29
31,
376
327
357
$23
536
664
696
769
409
033
1149
566
34
4 23
7 I’%
? I5
C
l 8
69
02
66
95
152
\55
24\
L44
2M
32.3
7 20
7 26
L
135
49
63
38
5
700
I .
, 1
900
J lo
o I3
00
is0
I?#
1900
m
m
2300
2
Fig
. IS
. T
he
rati
o a
T th
e n
um
ber
of
dri
vers
kill
ed i
n s
ing
le c
rash
es (S
C)
to t
he
nu
mb
er o
f d
rive
rs
kille
d i
n c
ar-t
ruck
cr
ash
es (C
TR
) ki
lled
in
cra
shes
wit
h c
ars
of
the
sam
e m
ass,
m,
and
dri
ven
by
dri
vers
in
th
e sa
me
age
gro
up
, 2
35 y
r. T
he
rig
ht
han
d s
cale
, wh
ich
is
iden
tica
l o
n a
ll th
e fi
gu
res
to f
acili
tate
co
mp
aris
on
, as
sig
ns
the
vah
re o
ne
to t
he
aver
age
of
all
dat
a sh
ow
n.
Th
e cu
rve
is a
ht
of
the
dat
a lo
SC
/CT
R
= C
I exp
(bm
) w
ith
a =
4.0
50 a
nd
b =
-
0.00
0 01
I kg
- ‘+
So
urc
e d
ata:
Fat
al
Acc
iden
t R
epo
rtin
g S
yste
m (
NU
TS
A).

LEONARD EVANS
Table I. Values of the parameter b in eqn I2 which characterizes the dependence of likelihood of a driver fatality on car mass. The first entry should be intevreted as 6 = - (0.000 94 2 0.000 26) kg- ‘. etc. The errors indicate the IS/, error limits on the estimate of b
dspeaden:
on car mass
independent
of car mass
Val
Ratio 15 - 26
SCIPED 9&?26
f
sc/ncu 9Ot23
CTRIPED llLt29
CTR/WY 105t29
_____________t_________
PEDIMCY 6217
SCICTR -20?26
of b(-I x lo-‘kg-‘) .iver we. wars
25-3L 1 235
all 12 cases, eqn 12 gave a better fit to the data than a linear function of m, justifying the choice of the exponential. The percent variance explained by eqn 12 ranged from 79 to 94x, with an average of 88%.
All 6 cases hypothesized to be independent of mass yielded values of b not statistically significantly different from zero at the 1% level (see Table 1). Even the value most suggestive of a mass effect (- 0.000 20 kg- ‘), is not statistically significantly different from zero at the 1% level. Thus not one of the 6 cases hypothesized to be mass independent shows any mass effect.
In order to examine in more detail the 12 cases hypothesized to be mass dependent, an analysis of variance was performed on the 12 values obtained for b (Table 1). This analysis gave no suggestion of any statistically significant effects (no effect was statistically significant beyond the 30% level). That is, b does not depend on either driver age nor on type of crash. Accordingly, we take the average of the 12 values of b to represent how mass affects the likelihood of an occupant fatality. That is,
L(m) cc exp (-0.001 06m). (13)
The standard deviation of the 12 values of b is 0.000 073 kg-‘. yielding confidence limits on b, at the 1% level of:
b = ( - 0.00106 + 0.000 05) kg-’ (14)
The error limits reflect a high degree of consistency between the 12 values of 6. It is not claimed that the physical effect of car mass on fatality likelihood is determined to this high degree of precision, as discussed later.
The data have in all cases been fitted to the simplest two parameter equation (eqn 12) that effectively summarizes the main features and may be used to compare the relationships for different cases. No claim is made that more complex functions (say, including mass squared terms) do not provide better fits to the data. In view of the various questions of interpretation discussed below, more complex functions than the one used are considered to be of little value for the purposes of the present study.
The 12 values of L(900 kg)/L,(1800 kg) calculated using each of the individual values of b in Table 1 range from a low of 2.33 to a high of 2.72. Using the average value of b and error limits given in eqn 14 gives
L(.90Okg)/L(l800 kg) = 2.60 &- 0.12. (15)
That is, a driver in a 900 kg car is 2.60 times as likely to be killed as is a driver in a 1800 kg car.

Driver fatalities versus car mass using a new exposure approach
DISCUSSION
Dnra consistently sqpxt hypotheses
33
The data presented here show remarkable consistency. All 18 empirical relations are consistent with the hypotheses proposed and suggest a dependence of fatality likelihood on car mass for single car crashes and for car-truck crashes that is systematic, consistent and with little scatter.
Note also that not only are the functional relations in all cases similar for different age groups. but in addition the values of the ratios (the left hand scale in the figures) are also similar for different age groups. Thus, although the number of fatahties per car is highly dependent on driver age. the number of drivers killed per pedestrian is not and similarly for the other cases.
htn are reinticely scatter free
The reason the results here are so free from scatter compared to the earlier results of Evans 119821 is believed to be largely that the present results are all derived from one data source whereas the earlier results, in common with most studies using traditional exposure measures, bring together data from different sources. These different sources generally differ in many ways. For example the FARS data, R. L. Polk data, and the Michigan State data used by Evans [I9823 do not use identicai mass definitions. Indeed, there is every reason to suspect that a group of cars all given the same mass in FARS may be assigned many somewhat different masses in the R. L. Polk data, and a different set of masses in the Michigan State data. In the FARS data used by Evans [1982], about 27% of cars were of unknown mass; in the R. L. Polk data 17% were of unknown mass. All these discrepancies have the potential to affect results by unknown amounts.
Contrast this with the exposure measures used here. Cars of unknown mass do not, per se. affect results, because they are equally missing from both denominator and numerator for ail ratios calculated. The car mass definitions, whatever approximations, inadequacies or inconsistencies they may contain, are in all cases identical in both numerator and denominator.
The present study has focused exclusively on non-two car crashes, in which the question ofexposure is paramount. However, the same approach to the two car problem as was used by Evans ft952] was again applied by using pedestrians killed or motorcyclists killed as the exposure measures rather than the earlier physical assumption; results essentially in agree- ment with those of Evans [I9821 were obtained.
Alternute espianations
The material shown in Figs. 1-12 has been interpreted here to show a large and consistent increase in the likelihood of a driver fatality as car mass decreases. What other interpretations of this information are possible?
All I2 ratios could increase with decreasing car mass even if driver fatality likelihood were independent of car mass provided that, other factors being equal, larger cars were much more likely to kill pedestrians and motorcyclists. To determine relations between car mass and pedestrian fatality likelihood in pedestrian-car crashes is a problem of complexity similar to that ofdetermining relations between car mass and driver fatality likelihood. Any study of it runs into the same exposure problems noted in the introduction to this paper.
Although there is an extensive literature on vehicle impacts with pedestrians [Ashton, 1983, gives 234 Refs.] only a few papers provide information that may be relevant to the assumption used here. namely, that in crashes between cars and pedestrians, pedestrian fatality likelihood is independent of car mass. The results of these studies are mentioned briefly below-a detailed discussion or synthesis is beyond the scope of the present study.
Wolfe and O’Day [ 1982, Table 9, p. 141 give the percent of pedestrians injured (at different levels of severity) in both urban and rural areas of New York State per police reported car-pedestrian crash. Their data, which include over 20,000 cases, show a remarkable lack of even a hint that injury rate depends on car mass.
Garrett [ I98 I] examined pedestrian fatalities per pedestrian accident for data coIlected in the Pedestrian Injury Causation Study (PICS) [see Fell and Toth, 19811 for five U.S. cities.
AAP Vol. 16. No. I -C
34 LEONARD EVANS
The data hint that as car size increases, the proportion of fatalities increases. However, the relationship goes in the other direction for luxury,/limousine cars. All the car data together do not come even close to giving a statistically significant relationship between the propor- tion of pedestrian fatalities and car mass (p >> 0.1). When later data were added to those of Garrett [1981], there is even less of a suggestion of a systematic relation between car mass and pedestrian fatality likelihood in a pedestrian crash [Fell and Toth, 19811.
More recently, Blodgett [1983], also using PICS data, found a remarkable absence of even a hint that pedestrian injury rate was dependent on car mass in pedestrian car crashes.
Joksch [I9761 reported that the probability of a pedestrian death in a pedestrian accident does not depend on car mass. Steward and Stutts [I9781 examined the percent of pedestrian accidents that led to pedestrian serious injury or death. They state that they find no clear weight effect for either urban or rural, or all combined.
McLean [1972] compared one specific small car to one specific large car, the models being chosen because of large differences in frontal geometry. Larger pedestrian fatality risk was reported for the larger car which the author attributed to hood geometry effects and not to car mass as such. It is possible that geometrical properties of cars associated with pedestrian fatalities may, in the aggregate, be correlated with car mass.
As should be apparent from the discussion below, measures such as pedestrians killed per car (see for example Table 32 (revised November 1981) of Wolfe and O’Day [1981]) do not directly bear on the assumption being addressed.
At present the literature does not provide convincing evidence toreject the assumption used here that pedestrian fatality likelihood is independent of car mass. There is, however, a suggestion that pedestrian fatality likelihood may be somewhat lower in very small cars. If later research establishes a relationship between car mass and pedestrian fatality likelihood then the equations reported here should be modified.
Note that, if, as has been speculated [see Peltzman, 1975 and Conybeare, 19801 drivers of larger cars kill more pedestrians by changes in driver behavior, this should not affect results as such behavior changes are presumed to affect numerator and denominator equally.
Another assumption implicit in the approach is that the exposure of the cars of different masses is homogeneous with respect to factors that might affect the ratios of the fatalities. If, for example, light cars were driven where there are few pedestrians and heavy cars were driven where there are many pedestrians, then, other factors being equal, the ratio of drivers to pedestrians killed would vary with mass even if there were no car mass influence on driver fatality likelihood. The possibility that such biases might affect the results has been examined for a number of possibly contaminating variables.
For example, the entire analysis described in this paper was repeated using only the subset of crashes coded as rural. The resulting figures naturally have substantially different absolute values of the dependent variables, but the dependence on mass was found to be essentially indistinguishable from that reported. The entire analysis was further repeated for crashes coded as urban. Again, despite different absolute values of the various ratios, the mass effect found was essentially indistinguishable from that reported here. Such invariance of the mass effect with respect to whether urban or rural crashes are used is strongly supportive of the interpretation that physical effects due to the car and not effects due to driver behavior or use patterns are being measured. The similar mass dependence is found even though, for example, the value of SC/PED is on average 3.7 times as large for rural as for urban crashes.
In similar spirit, the data were divided into crashes occurring during three different times of day (8:00 p.m.-3:59 aim., 4:00 a.m.-l 1.59 a.m., and noon-7:59 p.m.). Here, values of b were, compared to those reported earlier, somewhat higher for the 4:00a.m.-I 1:59 a.m. period, but lower for the other two periods. In any event, the differences were all within about 15% of the value reported here suggesting a small confounding interaction with tim_e of day, but one whose effects are much smaller than the mass effects reported.
Clearly, one cannot exclude the possibility that other factors might be influencing the results. However, such effects would have to occur reasonably equally for drivers of

Driver fatalities versus car mass using a new exposure approach 35
different ages, and also be of similar relative magnitude with respect to the different types of fatalities studied.
Certainly, other s~ulations are possible. However, note that differences such as maneuverability or braking capabilities being different for different size cars are not expected to influence the results if it is assumed that they operate equally on the numerator and denominator of all ratios. Similarly, the smaller cross section for collision due to the smaller frontal area of the smaller car should reduce the number of crashes with pedestrians and other objects in similar proportions.
Why are car mass effects larger than those preGousfy reported? In the remainder of this discussion we assume that the effects observed do indicate that
for single car and car-truck crashes, the likelihood of a driver fatality is affected by car mass according to eqn (1) with b = -0.001 06kg-’ (or L(900 kg)/L(1800 kg) = 2.60). Because driver behavior effects are presumed to be present equally in the numerator and denominator of all ratios calculated, this relationship is an estimate of a physical, or pure mass effect, as previously discussed. it is an estimate of how the likelihood of an occupant fatality depends on car mass, all other factors being equal.
These results should be contrasted with the finding of Evans [1982] that the likelihood of driver fatality in non-two car crashes depends on car mass in accord with eqn 1 but with a substantially lower value of b = - 0.000 58 kg- ’ (or L(900 kg)/L( 1800 kg) = 1.68). In the discussion section of Evans [I9821 it was stressed that determining car mass effects by dividing the number of fatalities by the number of cars generates relations that could reflect both changes in driver behavior associated with car mass as well as pure effects. In addition, it was mentioned that there is evidence in the literature suggesting that drivers of smaller cars exhibit greater caution, possibly in response to a perception of greater danger [see also Evans and Wasielewski, 1982; Wasielewski, 19831. Evans [1982] concluded with the comment that if drivers of smaller cars were more cautious, then the effects derived in that work would underestimate the pure mass effect, a conjecture borne out by the present study.
A plausible interpretation of the results of the present work is therefore that b = -0.00106 kg-’ represents the pure mass effect, and b = -0.000 58 kg-’ represents the observed dependence of driver fatality likelihood on car mass resulting from both the purely physical effects and driver behavior effects dependent on car mass.
These results suggest that about half of the increase in fatality likelihood that results from the purely physical differences of smaller cars is being negated by subtle compen- satory changes in driver behavior in response to an increased perception of danger. The possibility of such compensatory changes in driver behavior has been discussed widely in the safety literature [see, e.g. Wilde, 1983; Peltzman, 1975; Conybeare, 19801. The focus hitherto has been on the possibility that safety measures, such as requiring seat belt use [Evans, Wasielewski and von Buseck, 1982; Adams, 19821 will generate increases in driver risk taking that will reduce, negate or even reverse the desired safety benefits. Here we find evidence suggesting that possible changes in driver protection with car mass may have generated decreases in driver risk taking that have partially offset the expected increase in fatalities. If in the future small cars were perceived to be less safe than they are currently perceived to be, further driver behavior changes might result which could negate, or even reverse, any safety disadvantage of the smaller car.
CONCLUSIONS
(1) The new exposure approach gives relationships between driver fatality likelihood and car mass that are interpreted to result from the physical properties of the car, essentially independent of driver behavior or use patterns.
(2) This physical effect found here is about twice as large as that obtained by considering driver fatalities per registered car (for example, the new exposure approach gives that a driver of a 900 kg car is 160% more likely to be killed than is a driver of a 1800 kg car; the corresponding value determined using driver fatalities per car is 70%).

36 hONARD &AS5
(3) Drivers of smaller cars appear to be reducing their risk taking in response to an increased perception of danger and thereby partially compensating for the mass effect.
(4) The findings suggest that driver risk perception is a key factor in determining whether or not accidents occur.
clcX_no,~ledgpmenrs-The new exposure approach was discussed with Martin J. Beckmann, Dennis E. Blumenfeld. Richard W. Rothery. Paul Wasielewski and Richard A. Wilson. A number of their valuable inputs have been incorporated into this paper. The data processing computer graphic packages were developed by Sandra J. Egan. Thanks are due to Jim Ayers. who discovered a computational error in an earlier version of this report. The help of my colleague Paul Wasielewski in performing the revised calculations in the present version is gratefully acknowledged.
REFERENCES
Adams J. G. U.. The efficacy of seat belt legislation, Society of Automotive Engineers, SAE Technical Paper Series. Paper No. 820819, Troy. Michigan (1982).
Ashton S., A bibliography of pedestrian accident reference with emphasis on vehicle design and pedestrian injury. included in SAE special publication Pl21, Pedestrian Injury and Assessment, p. 265-275. Society of Automotive Engineers, Warrendale, PA March 1983.
Blodgett R. J.. Pedestrian injuries and the downsizing of cars, SAE paper 830050, included in SAE special publication Pl2l. Pedestrian Injury and Assessment, p. 17-27. Society of Automotive Engineers, Warrendale, PA hlarch 1983.
Campbell B. J. and Reinfurt D. W.. Relationship between driver crash injury and passenger car weight. Highway Safety Research Center. University of North Carolina, Chapel Hill, N.C., 1973.
Conybeare J. A. C., Evaluation of automobile safety regulations: the case of compulsory seat beit legislation in Australia, Policy Sci. 12, 27-39 (1980).
Evans. Leonard, Car mass and likelihood of occupant fatality, Society of Automotive Engineers, SAE Technical Paper Series, Paper No. 820807, Troy, Michigan (1982).
Evans L.. Wasielewski P. and von Buseck C. R.. Compulsory seat belt usage and driver risk taking behavior, If~dmun Facfors 24, 41-48 (1982).
Evans L. and Wasielewski P., Risky driving related to driver and vehicle characteristics, AC&. Anal. & Prm. 15, I21 (1983).
Fell James C., Pedestrian accidents a state-of-the-art 1970-1980. Report No. DOT-HE806 270 (1981). Garrett J. W., An analysis of fatal pedestrian accidents. Society of Automotive Engineers, Paper No. 810323,
Detroit, February (1981). Joksch Hans C. and Knoop Jim C., Dnver fatality risk and car size, CEM Report No. 4283-725a. Center for
the Environment and Man (CEM), Inc. June 1981. Joksch H. C.. Analysis of the future effects of fuel shortage and increased small car usage upon traffic deaths
and injuries. PB-251 892/8GI, p. 41, June 1976. McLean A. J., Car shape and pedestrian injury. Paper included in National Road Safety Symposium. 179-192,
Canberra, Australia, March 1972. Peltzman S., The effects of automobile safety regulation, 1. Polificul Eon. 83, 677-725 (1975). Smith K. and @Day J., Simpson’s paradox: an example using accidents from the state of Texas, Accid. Anal.
& Prer. 14, I31 (1982). Stewart J. R. and Stutts J. C., A categorical analysis of the relationship between vehicle weight and driver injury
in automobile accidents. Highway Safety Research Center, North Carolina, May 1978. Society of Automotive Engineers, Pedestrian impact injury and assessment, SAE Publication PI21 (1983). Wasielewski P., Speed as a measure of driver risk: observed speeds vs driver and vehicle characteristics, Accid.
Annl. & Pm. (to be published). Wilde G. J. S., The theory of risk homeostasis: implications for safety and health, Risk Anal. 2, 209 (1983). Wolfe A. and O’Day J.. Fact book on U.S. pedestrian accidents, Report UM-HSRI-81-05. The University of
Michigan Highway Safety Research Institute, February 198 I. Wolfe A. C. and O’Day J., A study of vehicle factors related to type and severity of pedestrian injury. Report
UM-HSRI-82-20. The University of Michigan Highway Safety Research Institute, May 1982.


