Acc
epte
d A
rtic
leDR. JESSE MITCHEM (Orcid ID : 0000-0001-9833-0320) DR. THOMAS R. KATONA (Orcid ID : 0000-0001-9949-7237) MS. ELIZABETH A. S. MOSER (Orcid ID : 0000-0002-2673-3662)
Article type : Original Article
Title Does the presence of an occlusal indicator product affect the contact forces between full dentitions?
Short title Occlusal contact forces Article category Original article Name Jesse A. Mitchem
Thomas R. Katona Elizabeth A. S. Moser
Affiliations Jesse A. Mitchem: Department of Orthodontics and Oral Facial Genetics School of Dentistry Indiana University Indianapolis, USA
Thomas R. Katona: Department of Orthodontics and Oral Facial Genetics School of Dentistry Indiana University Indianapolis, USA
Elizabeth A. S. Moser: Department of Biostatistics School of Medicine Indiana University Indianapolis, USA
Corresponding author Dr. T. R. Katona Indiana University School of Dentistry IUPUI 1121 W. Michigan St. Indianapolis, IN 46202, USA [email protected]
_________________________________________________________________________________ This is the author's manuscript of the article published in final edited form as:
Mitchem, J. A., Katona, T. R. and Moser, E. A. S. (), Does the presence of an occlusal indicator product affect the contact forces between full dentitions?. J Oral Rehabil. Accepted Author Manuscript. http://dx.doi.org/10.1111/joor.12543
Acc
epte
d A
rtic
le
This article is protected by copyright. All rights reserved.
Does the presence of an occlusal indicator product affect the contact forces
between full dentitions?
SUMMARY: Studies have explored occlusal marking interpretation, repeatability and
accuracy. But, when an occlusion detection product is interposed between teeth, direct tooth-
tooth occlusal contact relationships are replaced by tooth-material-tooth structures. Thus, the
marks cannot reflect the original contacts. This has been shown for single tooth pair contacts.
The purpose of this laboratory study was to similarly examine full dentitions. A dentiform
was set into Class I centric occlusion with the mandible supported by a load cell. The
maxillary arch was guided by precision slides. As the weighted (~52 N) upper assembly was
lowered onto and raised off the mandibular arch, the loads on the mandible were measured.
With and without (control) occlusal marking material, the steps were: (cleaning – control 1 –
material 1) … (cleaning – control 6 – material 6). The 6 materials were: Accufilm I and II,
Rudischhauser Thick and Thin, Hanel Articulating Silk, and T-Scan. Then, the 6 sets of
(cleaning – control – material) measurements were repeated with the mandibular assembly
shifted, in turn, by 0.1 mm in the Anterior, Posterior, Right and Left directions. The 5
(Centric and four 0.1 mm shifted) occlusal relationships produced grossly different tooth-
tooth (control) load profiles. And, in general, these controls were affected, in different ways,
by the marking products. Among the 5 conventional products, the Rudischhausers fared the
worst and the electronic T-Scan was an extreme outlier. Thus, in general, popular occlusal
detection products alter the occlusal contact forces, and therefore, their markings cannot
characterize the actual occlusion.
KEYWORDS: articulating paper, dental occlusion, occlusal equilibration, occlusal force, T-Scan, bite force
Introduction
When an occlusal contact marking product is interposed between teeth, the recorded
markings reflect a tooth-product-tooth, not the actual tooth-tooth, configuration (1). As these
products are universal dental armamentaria in many laboratory and clinical procedures (2-4),
this presents potentially serious and widespread ramifications. There is considerable literature
Acc
epte
d A
rtic
le
This article is protected by copyright. All rights reserved.
about these products’ efficacy and the interpretations of their markings (5-7), and some
believe that there are too many concerns to use them as diagnostic tools (3, 8, 9).
Reproducibility of visual occlusal detection methods is unreliable (7, 9, 10) even
when identical occlusal marking mediums are used on identical occlusal contacts (8, 9).
Conflicting results have been published about the relationships between contact mark size
and force magnitude (5-7, 11) and between mark size and product thickness (6, 9, 12-14).
Another study demonstrated that thick products elicit a proprioceptive response, comparable
to occluding on a cotton roll, which can alter the direction of the mandible on closing, while
thinner products tend to allow the mandible and its musculature to act similarly to a natural
bite (15).
Furthermore, engineering analyses suggest a link between the presence of these
products and changes in the occlusal contact forces (16, 17). Rather than relying on visual
evidence, a study demonstrated changes in loads on single pairs of contacting teeth with, and
without, the presence of marking indicators (1). The purpose of this project was to measure
load alterations caused by six common occlusal detection products on a full arch of teeth.
Materials and methods
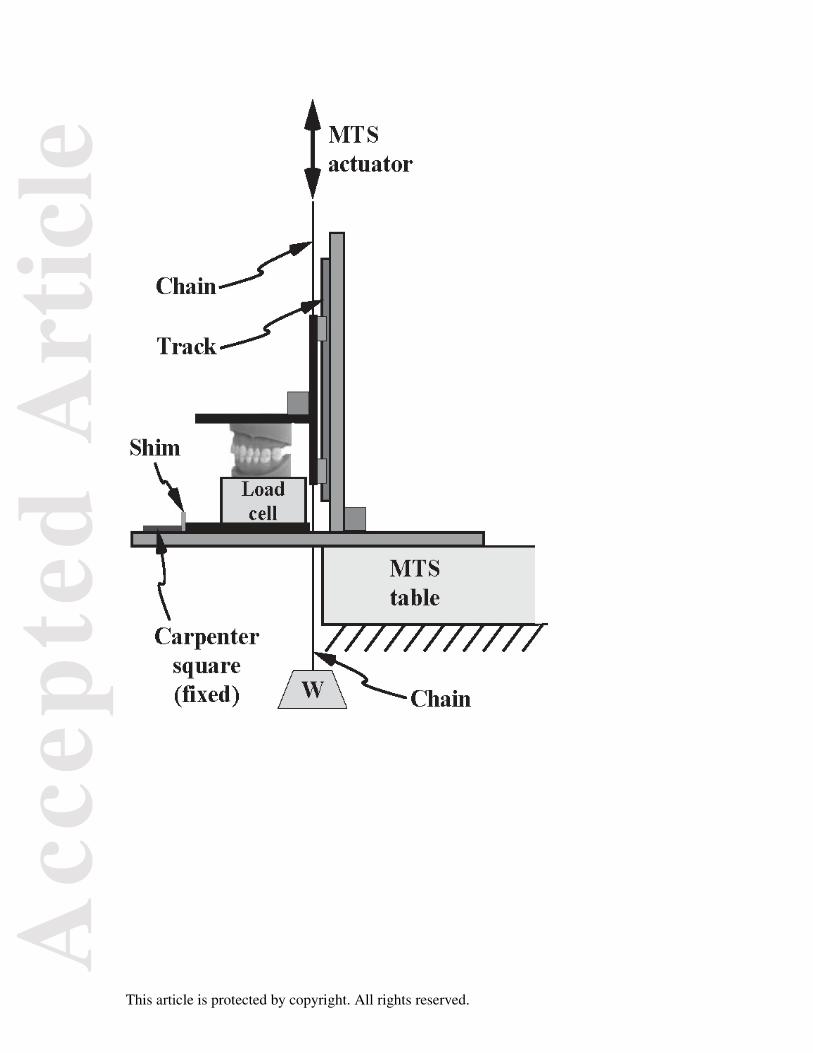
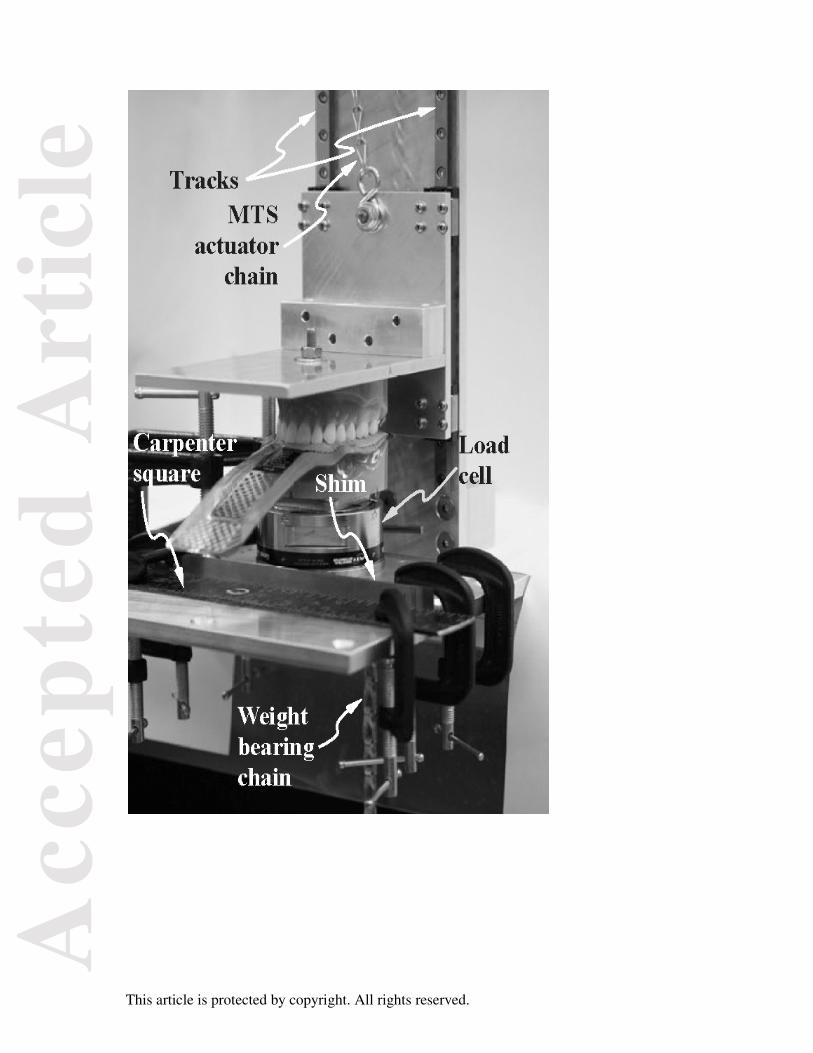
A full dentiform (REF 600 210, 3M Unitek, Monrovia, CA, USA) was set into its as-
manufactured centric occlusion, Figs 1a and b. The mandibular arch was supported by a load
cell (Gamma Transducer, SI-65-5, ATI Industrial Automation, Apex, NC, USA) that
measured forces and moments 0 - 65 ± 0.2 N and 0 - 5000 ± 0.9 N-mm, respectively. The
maxillary arch was carried by a pair of vertically mounted precision slides (Mini-Guide,
Double Carriage, Model #SEBS 9BUU2-275, Nippon Bearing Co, Ojiya, Japan). The entire
assembly was bolted onto a mechanical testing machine (MTS Bionix 858, MTS Corporation,
Minneapolis, MN, USA).
The MTS machine was used to manually lower the maxillary assembly (~52 N) onto
the mandibular arch until a slight slack developed in the supporting chain (Figs 1a and b),
thus ensuring that the arches were fully seated. That position of the hydraulic MTS actuator
was set as its 0 mm point. The arches were then manually separated with the MTS, and then
with or without (the controls) the products, the programmed ramp cycle (2 mm amplitude at
0.2 Hz) was run for 3 cycles. The load cell readings during the second cycle were used as
data. The loads on the mandible (Fig. 2) were recorded by a dedicated laptop computer at a
Acc
epte
d A
rtic
le
This article is protected by copyright. All rights reserved.
rate of 100/sec using the load cell-packaged NI-DAQmx software (National Instruments
Corporation, Austin, TX, USA).
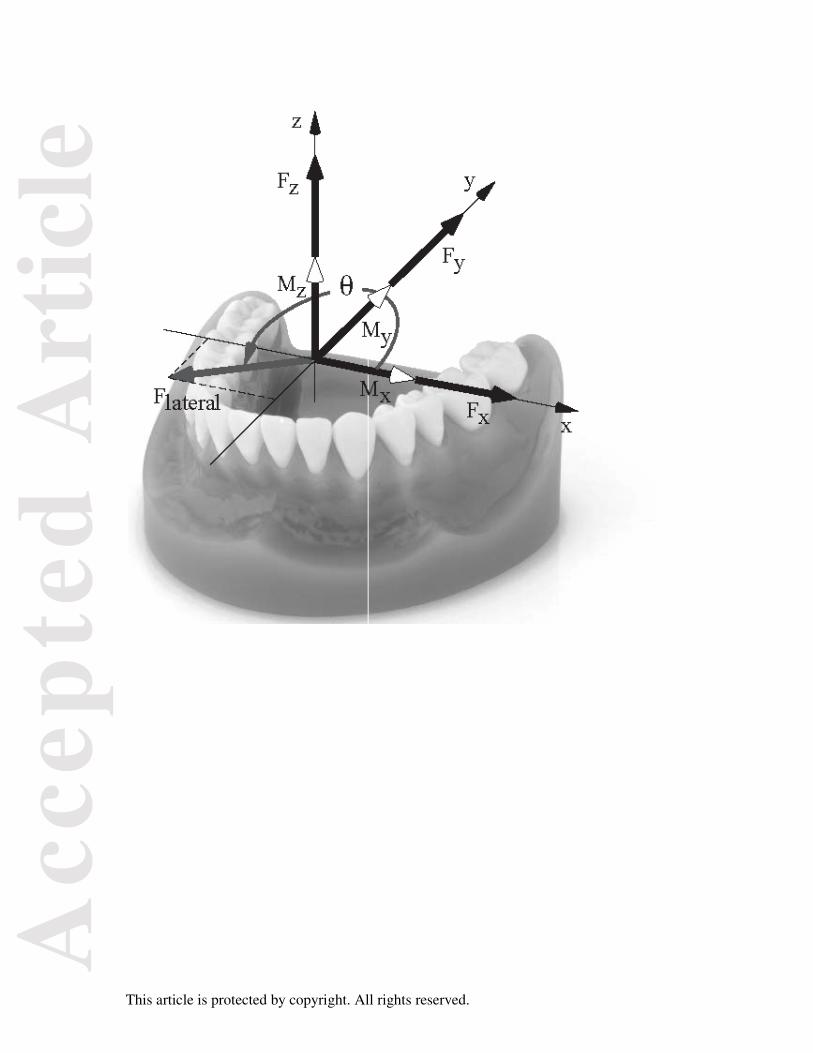
Flateral, the magnitude of the force component that acts within the occlusal plane was
calculated with the Pythagorean Theorem,
Flateral = F + F ,
where Fx and Fy are the right-left and the anterior-posterior force components, respectively,
measured by the load cell (Fig. 2). Flateral’s direction, θ, measured counterclockwise from the
positive x-axis, is equal to
θ = ATANF F .
Also measured by the load cell, Fz, is the occlusal force that is applied as the upper member is
lowered onto the mandibular arch, and Mx, My and Mz, the moment vector components
indicated by the white arrowheads in Fig. 2. The directions of the M-induced rotational
tendencies of the mandible are given by the Right-Hand-Rule (18). For example, a positive
Mx would tend to “open” rotate the mandible, while a negative Mx would tend to “close” it.
The magnitude of the moment vector is,
M = M +M +M .
Tests of the 6 products (Table 1) were conducted in the following sequence: (cleaning
– control 1 – material 1) – (cleaning – control 2 – material 2) – (cleaning – control 3 –
material 3) – (... – ... – material 6). With this protocol, each material measurement had its
own control. The 6 materials, tested in random order, were: Accufilm I (Af1) and II (Af2),
Rudischhauser Thick (RThick) and Thin (RThin), Hanel Articulating Silk (Silk), and T-Scan
(TScan). Then, the 6 sets of (cleaning – control – material) measurements were repeated, in
random order each time, with the mandibular assembly shifted, in turn, by 0.1 mm in the
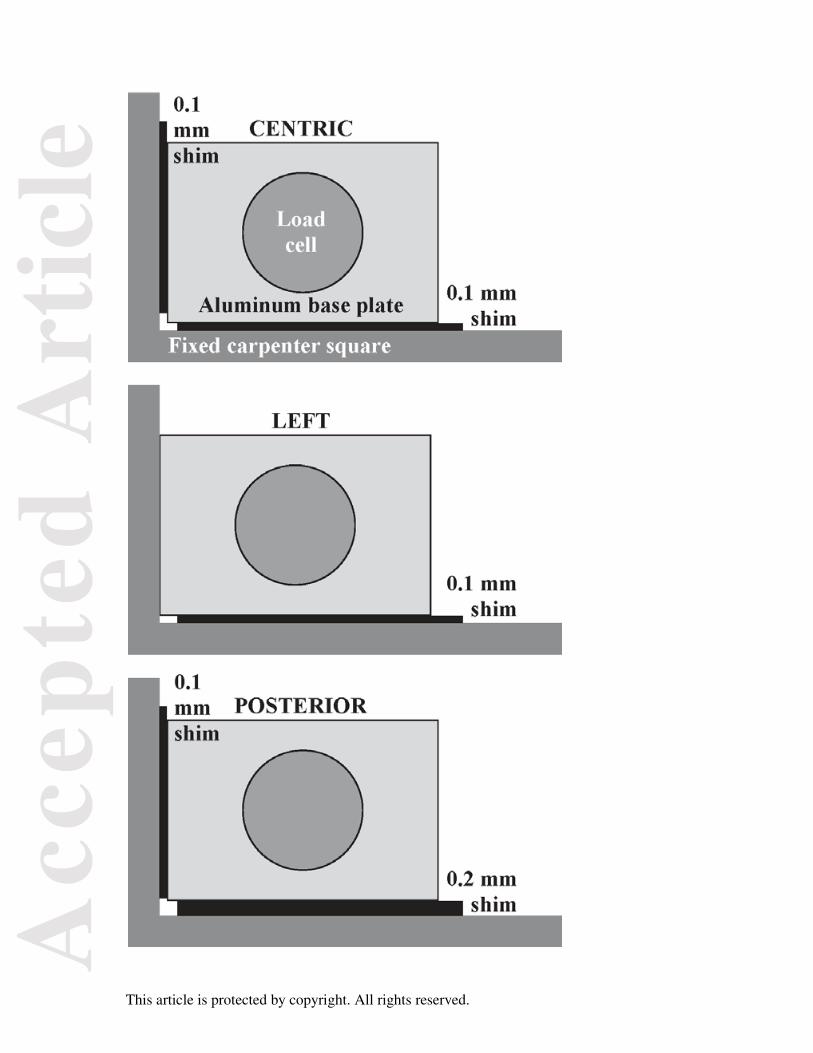
Anterior, Posterior, Left and Right directions, Fig. 1c.
Acc
epte
d A
rtic
le
This article is protected by copyright. All rights reserved.
The cleaning at each measurement consisted of thoroughly removing any traces of the
previous product’s markings with a 95% ethanol alcohol solution on a two-inch by two-inch
cotton gauze (generic), dried with cotton gauze and compressed air. If the product was not
available in a horseshoe shape, 2 pieces were laid on the lower dentition.
Statistical Methods & Sample Size
Summary statistics (mean, range and standard deviation) of the measured loads were
calculated for each of the products. Due to non-normality and the presence of interactions,
one-way nonparametric tests were used for all comparisons. A Wilcoxon rank-sum test was
used to compare the materials and their controls for Flateral, θ, Mx, My, Mz and M. A one-way
ANOVA of the ranks rank-transformed data was used to compare the effects of the (Anterior,
Posterior, Left and Right) shifts on Flateral and θ of the control measurements. A 5%
significance level was used for all tests without controlling for multiple comparisons and with
the understanding that this may have led to some false discovery. Reliability was assessed by
the comparisons of these 6 controls within each of the 5 occlusal relationships, i.e., the left
column in Fig. 3b. Reliability was also tested by continuously recording a Centric control
through 11 complete cycles and calculating intraclass correlation coefficients.
For the “overall” (Flateral, θ, Mx, My, Mz, and M for each of the products) groups,
there were 90 observations, (9 Fz values x 2 directions x 5 shifts = 90). For the data broken
down by the direction of the shift, we had 18 observations (9 Fz values x 2 directions = 18).
RESULTS
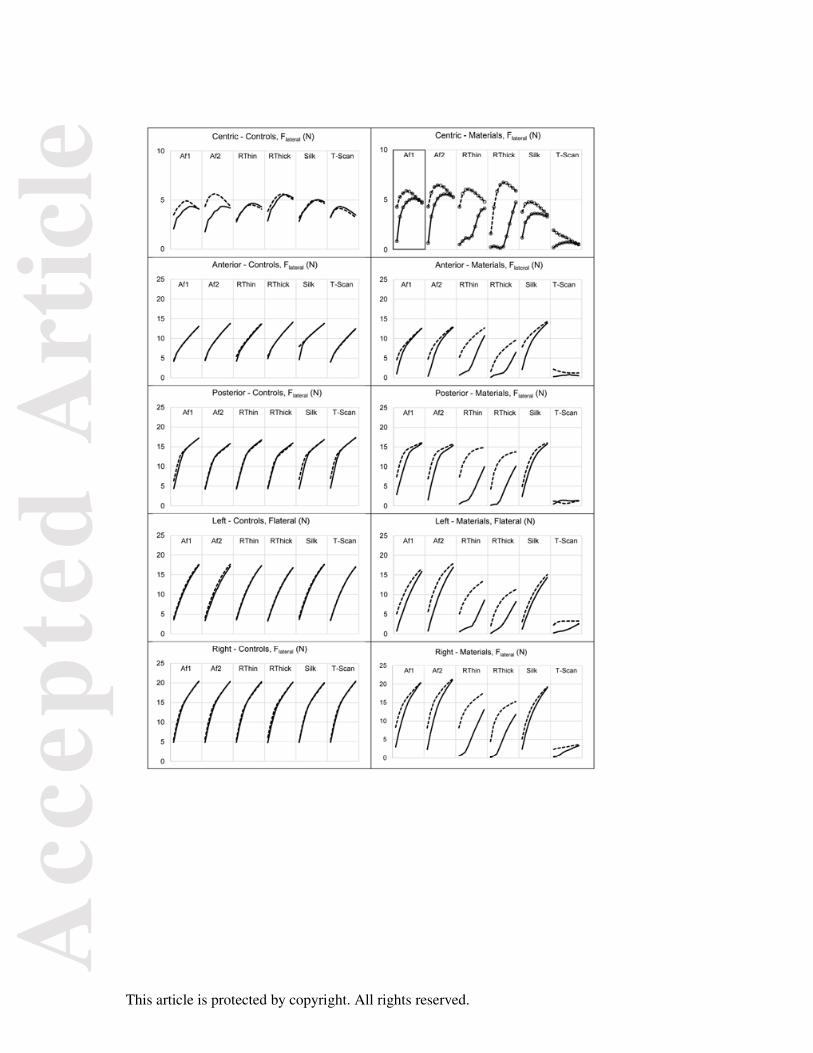
Six products were tested in 5 occlusal relationships, for a total of 30 combinations, Table 2. In
addition, each combination had its own control. The measurements are presented in the form
of Flateral and its direction, θ, Figs 3b and 3c, respectively. The right columns in Figs 3b and
3c contain the 30 position/material measurements (#1 - #30), while the left columns show their
corresponding controls (#1C - #30C). Although the materials were tested in different random
sequences within each of the 5 occlusal relationships, they are consistently presented in the
Af1, Af2, RThin, RThick, Silk and T-Scan order. The intraclass correlation coefficients were
0.94 and 0.72 for Flateral and θ, respectively.
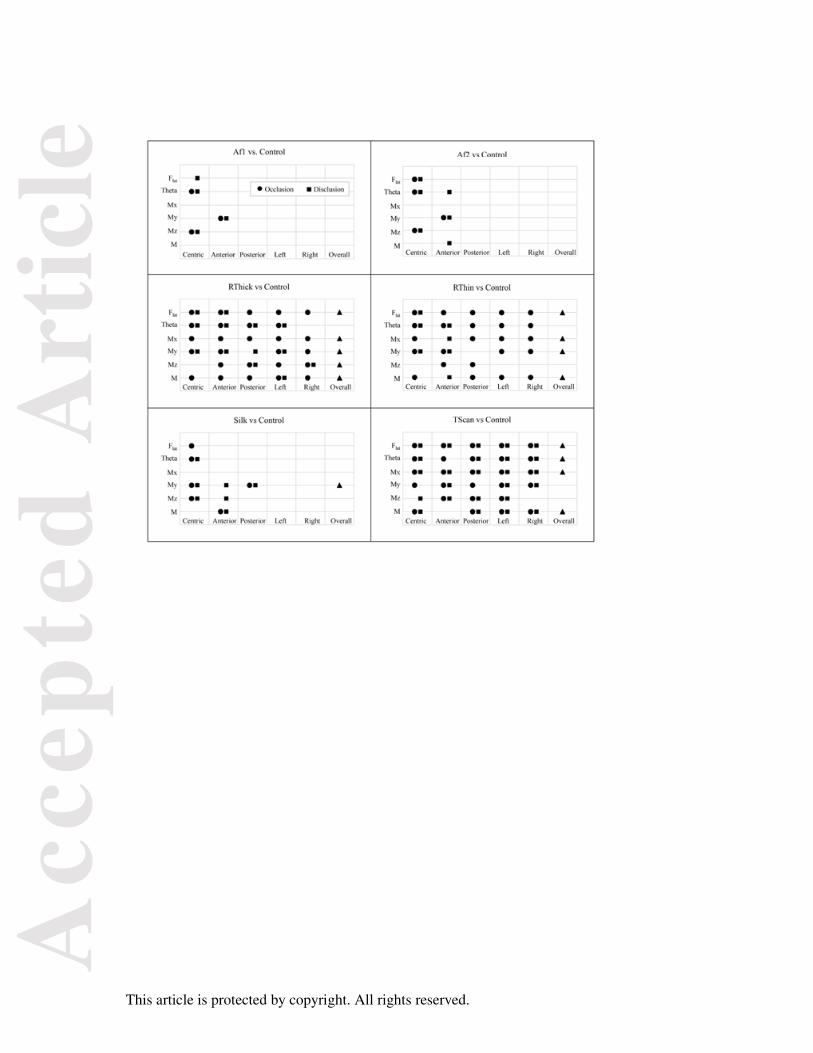
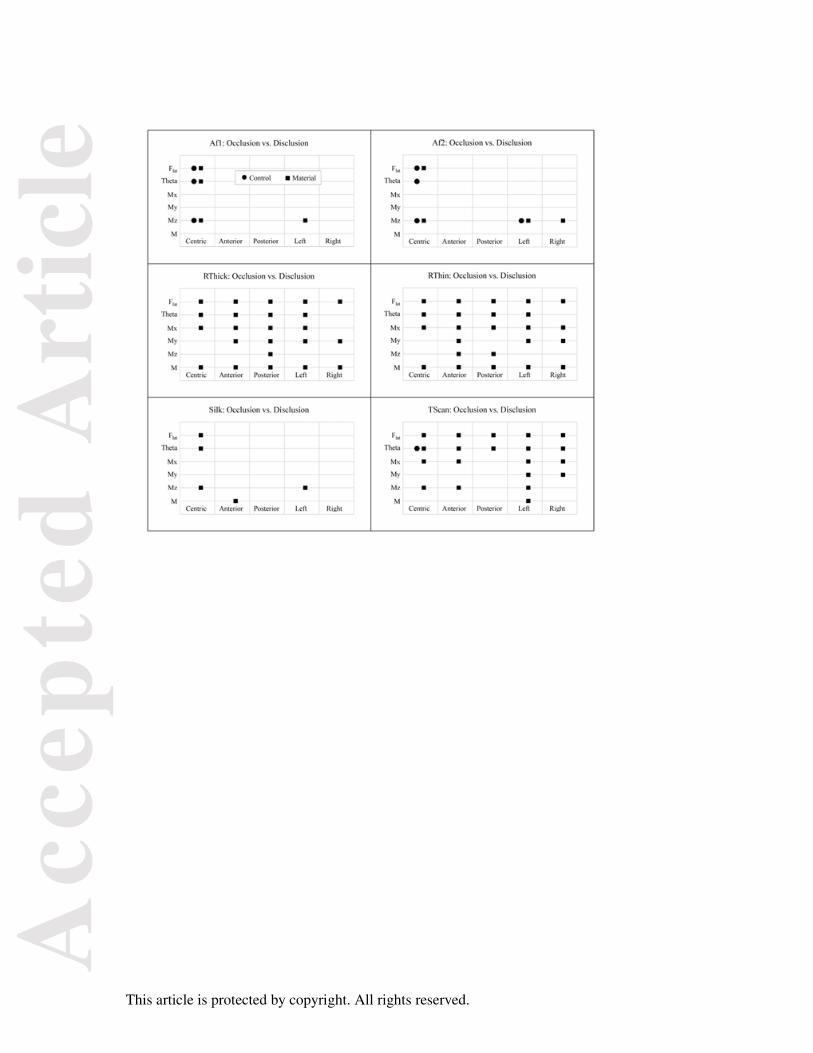
Statistical results are summarized in Fig. 4. The primary focus, the comparison of
loads measured with and without (control) the presence of a product, is shown in Fig. 4a.
Figure 4b highlights the occlusion vs. disclusion differences. The p-values in the Overall
Acc
epte
d A
rtic
le
This article is protected by copyright. All rights reserved.
columns of Fig. 4a are shown in Table 2. Although Mx, My, Mz and M are not presented in
detail as in Fig. 3, they are included in Fig. 4 and Table 2.
DISCUSSION
Primary emphasis is on Flateral (the force component in the occlusal plane) and its
direction, θ, both calculated from the measured Fx and Fy force components, Fig. 2. Based
solely on Flateral and/or θ, Fig. 4a, it can be concluded that these products alter the loading
experienced by the arches. The moment measurements (Fig. 4a) and the Overall values (Fig.
4a and Table 2) can only reinforce this conclusion. The least emphasis should be placed on Mz
because generally it is small.
All 4 (Anterior, Posterior, Left and Right) 0.1 mm shifts of the mandibular arch
produced significant changes in control Flateral and θ when compared to Centric and to each
other, all with p-values <0.0001. (Compare the sets of curves in the left columns of Figs 3b
and 3c.) Thus, the 5 occlusal arrangements can be considered as distinctly different occlusal
relationships, thereby satisfying a requirement for the statistical analyses. It is also
noteworthy that a 0.1 mm mandibular shift is sufficient to produce such changes in the
occlusal contact forces.
It was found that the 6 control Flateral and θ measurements within the Anterior,
Posterior, Left and Right offset groups were not statistically different, but those within the
Centric relationship were different from each other. This possibility was anticipated, and it is
precisely the reason for the repeated (cleaning – control – material) sequence in the
experimental design. The need for the individual controls was based on the risk that the
cleanings could ever-so-slightly disturb the apparatus. The Centric relationship is the most
stable position and so it seems that the slightest perturbations away from it induce the greatest
relative changes.
Product performance assessment was based on the difference between the product’s
measurements and its corresponding control measurements. As an example, for θ, the
difference was defined as the quantity, θproduct – θcontrol. This calculation was performed for
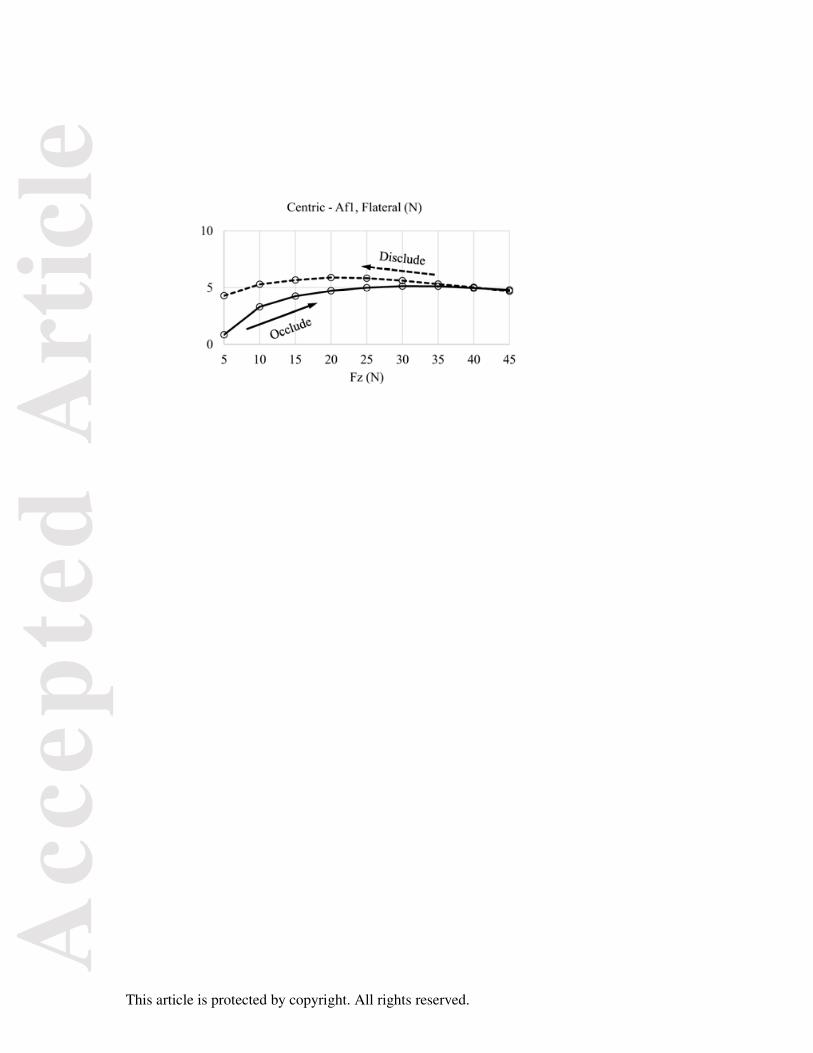
values of θ that were linearly interpolated to correspond to Fz = 5, 10, 15, ... 45 N. (These 9
data points are illustrated in Fig. 3a and in the top right panel of Fig. 3b.) The smaller the
deviation from the respective control, the better the performance.
Expressed in terms of p-values relative to 0.05, Af1, Af2 and Silk performed better
than RThin, RThick and T-Scan, Fig. 4a and Table 2. (Of the same 6 materials, Silk fared the
Acc
epte
d A
rtic
le
This article is protected by copyright. All rights reserved.
best in a study of single pair tooth contact (1)). T-Scan is a thick material, Table 1, and
perhaps more importantly, it is stiff. Thus, it acts to “bridge” the cusp tips, effectively
converting the bite into a flat-plane occlusion. This is entirely consistent with its relatively
small Flateral magnitudes, Fig. 3b.
The causes of discrepancies between the other materials and their controls, and
between each material’s occlusion and disclusion (Fig. 4b), are more complicated. It appears
that the products act to cushion the contacts, thus the initial (Fz = 5 N) control Flateral
magnitudes are consistently higher than those with the products, Fig. 3b. On disclusion, the
path in the material is already crushed or ploughed, hence there is less discrepancy between
control and material. The occlusion/disclusion differences also suggest a link to friction (19)
and because these differences are much less pronounced with Af1, Af2 and Silk than with
RThin and RThick, it may be due to the lubricating quality of their marking ink. (This is not
to suggest that a good lubricant is better or worse than a poor lubricant.)
It is interesting to note that Af1 is half as thick as Af2, yet Af1’s performance is only
marginally better, Fig. 4a. In turn, Silk is more than twice as thick as Af2, yet their
performances are similar. It therefore appears that the relatively good performances of Af1,
Af2 and Silk may be attributable to serendipitous combinations of material thickness,
stiffness and lubricative property.
The evidence demonstrates that RThick, RThin and TScan cannot replicate actual
tooth-tooth contacts (Fig. 4a) and that Af1, Af2 and Silk exhibit deficiencies in Centric
occlusion. Thus, it appears that long-standing controversies about occlusal mark
interpretations are focused on artefactual observations.
These products are used in a wide range of applications, ranging from hinge-mounted
models, ankylosed teeth and implant supported bridges, to periodontally compromised teeth.
Somewhere within that broad stiffness spectrum are healthy teeth, full dentures and our
apparatus. Clearly, extreme caution should be exercised in generalizing these study results,
but it is not unreasonable to suggest that the deficiency phenomena described herein are
inherent in all applications of these materials. More research is needed to better define the
details of those inadequacies.
DISCLOSURES
The authors have no conflicts of interest, ethics approval was not required, and only internal
support was utilized. We thank Mr. George Eckert for his assistance with the statistics.
Acc
epte
d A
rtic
le
This article is protected by copyright. All rights reserved.
REFERENCES
1. Helms RB, Katona TR, Eckert GJ. Do occlusal contact detection products alter the
occlusion? J Oral Rehabil. 2012;39:357-363.
2. Aubrey RB. Occlusal objectives in orthodontic treatment. Am J Orthod. 1978;74:162-
175.
3. Baba K, Tsukiyama Y, Clark GT. Reliability, validity, and utility of various occlusal
measurement methods and techniques. J Prosthet Dent. 2000;83:83-89.
4. Kimmel SS. Rationale and technique for achieving occlusal harmony. N Y State Dent
J. 2009;75:39-43.
5. Carey JP, Craig M, Kerstein RB, Radke J. Determining a relationship between applied
occlusal load and articulating paper mark area. Open Dent J. 2007;1:1-7.
6. Saad MN, Weiner G, Ehrenberg D, Weiner S. Effects of load and indicator type upon
occlusal contact markings. J Biomed Mater Res B Appl Biomater. 2008;85:18-22.
7. Kerstein RB, Radke J. Clinician accuracy when subjectively interpreting articulating
paper markings. Cranio. 2014;32:13-23.
8. Gazit E, Fitzig S, Lieberman MA. Reproducibility of occlusal marking techniques. J
Prosthet Dent. 1986;55:505-509.
9. Millstein P, Maya A. An evaluation of occlusal contact marking indicators. A
descriptive quantitative method. J Am Dent Assoc. 2001;132:1280-1286; quiz 1319.
10. Halperin GC, Halperin AR, Norling BK. Thickness, strength, and plastic deformation
of occlusal registration strips. J Prosthet Dent. 1982;48:575-578.
11. Komiyama O, Obara R, Iida T, Asano T, Masuda M, Uchida T et al. Comparison of
direct and indirect occlusal contact examinations with different clenching intensities. J
Oral Rehabil. 2015;42:185-191.
12. Schelb E, Kaiser DA, Brukl CE. Thickness and marking characteristics of occlusal
registration strips. J Prosthet Dent. 1985;54:122-126.
13. Toledo MF, Joias RP, Marques-Iasi YS, Neves AC, Rode Sde M. Thickness and
marking quality of different occlusal contact registration strips. J Appl Oral Sci.
2014;22:516-521.
14. Brizuela-Velasco A, Alvarez-Arenal A, Ellakuria-Echevarria J, del Rio-Highsmith J,
Santamaria-Arrieta G, Martin-Blanco N. Influence of Articulating Paper Thickness on
Occlusal Contacts Registration: A Preliminary Report. Int J Prosthodont.
2015;28:360-362.
Acc
epte
d A
rtic
le
This article is protected by copyright. All rights reserved.
15. Forrester SE, Presswood RG, Toy AC, Pain MT. Occlusal measurement method can
affect SEMG activity during occlusion. J Oral Rehabil. 2011;38:655-660.
16. Katona TR. The effects of cusp and jaw morphology on the forces on teeth and the
temporomandibular joint. J Oral Rehabil. 1989;16:211-219.
17. Katona TR. An engineering analysis of dental occlusion principles. Am J Orthod
Dentofacial Orthop. 2009;135:696.e691-698; discussion 696-697.
18. Beer FP, Johnston ER, Mazurek DF. Vector Mechanics for Engineers - Statics, 11th
ed. New York: McGraw Hill; 2016.
19. McCrea ES, Katona TR, Eckert GJ. The effects of salivas on occlusal forces. J Oral
Rehabil. 2015;42:348-354.
20. Barzilay I. Articulation paper and other occlusal marking devices revisited. Dentist's
Guide / CDE. 1996:23-26.
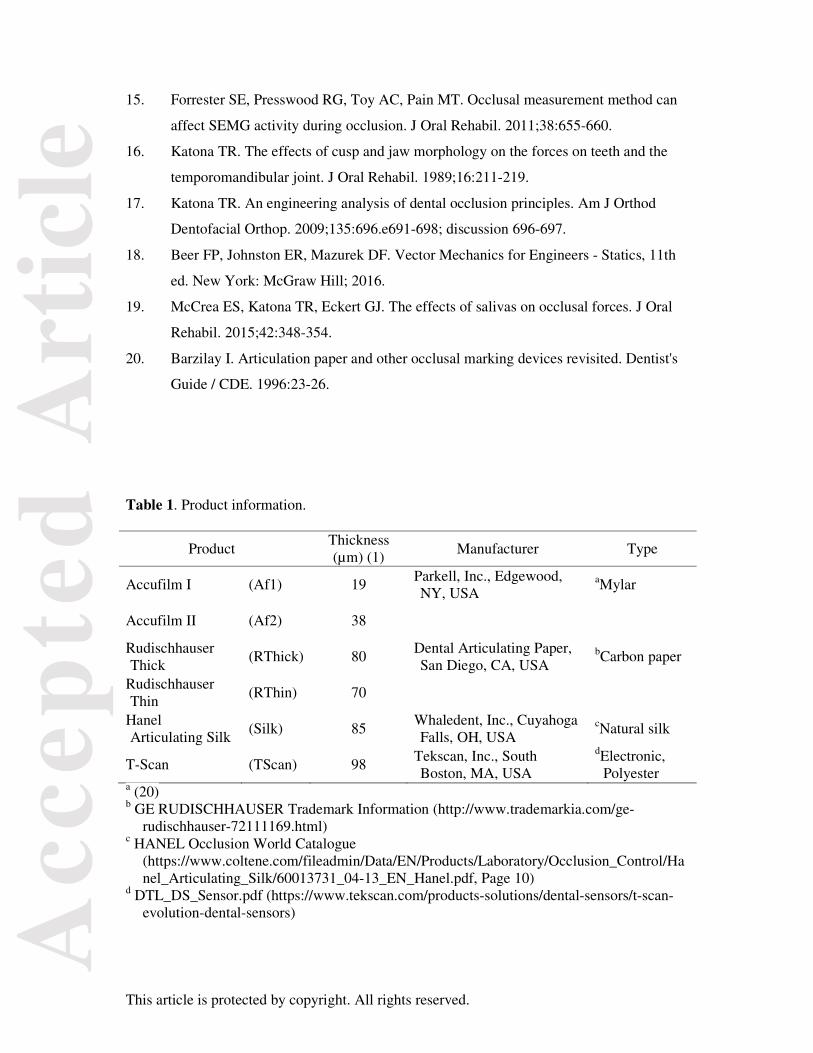
Table 1. Product information.
Product Thickness (µm) (1)
Manufacturer Type
Accufilm I (Af1) 19 Parkell, Inc., Edgewood, NY, USA
aMylar
Accufilm II (Af2) 38
Rudischhauser Thick
(RThick) 80 Dental Articulating Paper, San Diego, CA, USA
bCarbon paper
Rudischhauser Thin
(RThin) 70
Hanel Articulating Silk
(Silk) 85 Whaledent, Inc., Cuyahoga Falls, OH, USA
cNatural silk
T-Scan (TScan) 98 Tekscan, Inc., South Boston, MA, USA
dElectronic, Polyester
a (20) b GE RUDISCHHAUSER Trademark Information (http://www.trademarkia.com/ge-
rudischhauser-72111169.html) c HANEL Occlusion World Catalogue
(https://www.coltene.com/fileadmin/Data/EN/Products/Laboratory/Occlusion_Control/Hanel_Articulating_Silk/60013731_04-13_EN_Hanel.pdf, Page 10)
d DTL_DS_Sensor.pdf (https://www.tekscan.com/products-solutions/dental-sensors/t-scan-evolution-dental-sensors)
Acc
epte
d A
rtic
le
This article is protected by copyright. All rights reserved.
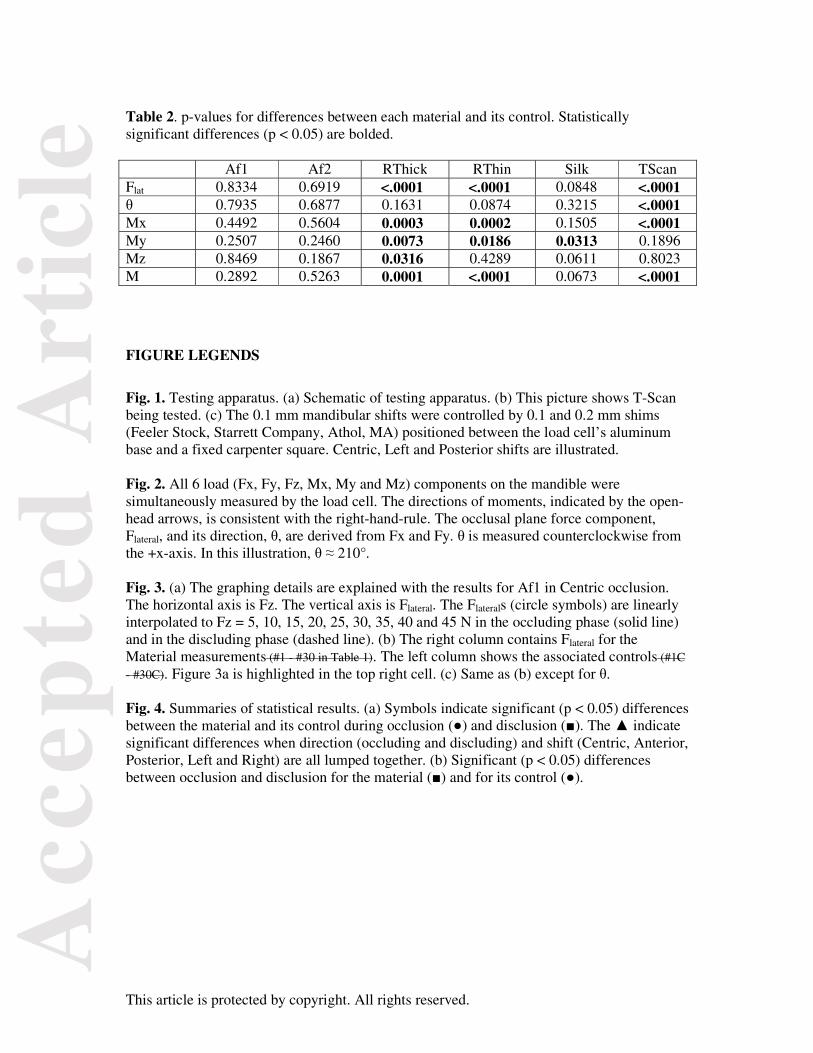
Table 2. p-values for differences between each material and its control. Statistically significant differences (p < 0.05) are bolded.
Af1 Af2 RThick RThin Silk TScanFlat 0.8334 0.6919 <.0001 <.0001 0.0848 <.0001 θ 0.7935 0.6877 0.1631 0.0874 0.3215 <.0001 Mx 0.4492 0.5604 0.0003 0.0002 0.1505 <.0001 My 0.2507 0.2460 0.0073 0.0186 0.0313 0.1896 Mz 0.8469 0.1867 0.0316 0.4289 0.0611 0.8023 M 0.2892 0.5263 0.0001 <.0001 0.0673 <.0001
FIGURE LEGENDS
Fig. 1. Testing apparatus. (a) Schematic of testing apparatus. (b) This picture shows T-Scan being tested. (c) The 0.1 mm mandibular shifts were controlled by 0.1 and 0.2 mm shims (Feeler Stock, Starrett Company, Athol, MA) positioned between the load cell’s aluminum base and a fixed carpenter square. Centric, Left and Posterior shifts are illustrated. Fig. 2. All 6 load (Fx, Fy, Fz, Mx, My and Mz) components on the mandible were simultaneously measured by the load cell. The directions of moments, indicated by the open-head arrows, is consistent with the right-hand-rule. The occlusal plane force component, Flateral, and its direction, θ, are derived from Fx and Fy. θ is measured counterclockwise from the +x-axis. In this illustration, θ ≈ 210°. Fig. 3. (a) The graphing details are explained with the results for Af1 in Centric occlusion. The horizontal axis is Fz. The vertical axis is Flateral. The Flaterals (circle symbols) are linearly interpolated to Fz = 5, 10, 15, 20, 25, 30, 35, 40 and 45 N in the occluding phase (solid line) and in the discluding phase (dashed line). (b) The right column contains Flateral for the Material measurements (#1 - #30 in Table 1). The left column shows the associated controls (#1C
- #30C). Figure 3a is highlighted in the top right cell. (c) Same as (b) except for θ. Fig. 4. Summaries of statistical results. (a) Symbols indicate significant (p < 0.05) differences between the material and its control during occlusion (●) and disclusion (■). The ▲ indicate significant differences when direction (occluding and discluding) and shift (Centric, Anterior, Posterior, Left and Right) are all lumped together. (b) Significant (p < 0.05) differences between occlusion and disclusion for the material (■) and for its control (●).
Acc
epte
d A
rtic
le
This article is protected by copyright. All rights reserved.
Acc
epte
d A
rtic
le
This article is protected by copyright. All rights reserved.
Acc
epte
d A
rtic
le
This article is protected by copyright. All rights reserved.
Acc
epte
d A
rtic
le
This article is protected by copyright. All rights reserved.
Acc
epte
d A
rtic
le
This article is protected by copyright. All rights reserved.
Acc
epte
d A
rtic
le
This article is protected by copyright. All rights reserved.

Acc
epte
d A
rtic
le
This article is protected by copyright. All rights reserved.
Acc
epte
d A
rtic
le
This article is protected by copyright. All rights reserved.
Acc
epte
d A
rtic
le
This article is protected by copyright. All rights reserved.
![Neue Normteile für Stanzerei ... - zotter-normalien.at€¦ · DIN 9833 Leader pins for large dies, DIN 9833 FS 410 [5] Führungssäulen für Großwerkzeuge, DIN 9833 Leader pins](https://cdn.vdocuments.site/doc/165x107/5f791372328ac07cbf58eebe/neue-normteile-fr-stanzerei-zotter-din-9833-leader-pins-for-large-dies.jpg)


