The Housing Authority of the City of Seattle, Washington Comprehensive Annual Financial Report For the year ended December 31, 2012

THE HOUSING AUTHORITY OF THE CITY OF SEATTLE, WASHINGTON
Comprehensive Annual Financial Report
December 31, 2012
Issued by Department of Finance & Administrative Services
Shelly Yapp, Chief Financial Officer

THE HOUSING AUTHORITY OF THE CITY OF SEATTLE, WASHINGTON
Table of Contents
Exhibit Page(s) SECTION I – INTRODUCTORY SECTION: Principal Officials i Organization Chart ii Transmittal Letter iii – xxii Government Finance Officers Association of the United States and Canada (GFOA)
December 31, 2011 Certificate xxiii
SECTION II – FINANCIAL SECTION: Independent Auditors’ Report 1 – 3 Management’s Discussion and Analysis 4 – 13 Basic Financial Statements:
A-1 Statement of Net Position 16 – 17 A-2 Statement of Revenues, Expenses, and Changes in Net Position 18 A-3 Statement of Cash Flows 19
Notes to Basic Financial Statements 20 – 84 Cost Certificates: WA00100003909G
WA00100001709R WA00100009009T WA19P001501-08 WA19P001501-09
87 88 89 90 91
Table
SECTION III – STATISTICAL SECTION (UNAUDITED): Financial Trends:
1 Net Assets by Component – Primary Government 94 2 Changes in Net Position – Primary Government 95 Revenue Capacity:
3 Operating Revenues by Source – Primary Government 96 4 Nonoperating Revenues by Source – Primary Government 97 Debt Capacity:
5 Schedule of General Revenue Bond Coverage 98 – 100 6 Ratio of Debt to Capital Assets – Primary Government 101 Demographics and Economic Statistics:
7 Tenant Demographics – Population Statistics 102 – 103 8 Regional Demographics – Population Statistics 104 9 Principal Industries 105 Operating Information:
10 Number of Units by Program, Households Served and Waiting List Data 106 11 Property Characteristics and Dwelling Unit Composition 107 – 109 12 Regular Staff Headcount by Department 110

THE HOUSING AUTHORITY OF THE CITY OF SEATTLE, WASHINGTON
Introductory Section
Section I

THE HOUSING AUTHORITY OF THE CITY OF SEATTLE, WASHINGTON
Principal Officials
i
Commissioners as of December 31, 2012
Name Term expires
John Littel, Chair October 1, 2014Nora Gibson, Vice Chair March 20, 2015Aser Ashkir, Commissioner (Appointed January 14, 2013) October 1, 2014Juan Martinez, Commissioner March 20, 2015Kollin Min, Commissioner March 20, 2016Doug Morrison, Commissioner March 20, 2014Deborah Canavan Thiele, Commissioner (Appointed January 14, 2013) March 20, 2017
Administrative Staff
Andrew Lofton, Secretary-Treasurer/Executive Director
Shelly Yapp, Chief Financial Officer
Janet Hayes, Controller

THE HOUSING AUTHORITY OF THE CITY OF SEATTLE, WASHINGTON
Organization Chart
ii

iii (Continued)
iiSeattleHOUSINGAUTHORITY
May 17, 2013
Members of the Board of Commissioners
The Housing Authority of the City of Seattle, Washington:
Introduction
We are pleased to present The Housing Authority of the City of Seattle, Washington's (referred to
hereafter as "the Seattle Housing Authority", "the Authority" or "SHA"}Comprehensive Annual
Financial Report (CAFR) for the year ended December 31, 2012. This report was prepared by the
Authority's Finance staff, and was audited by the international public accounting firm of KPMG LLP,
with assistance from the Seattle accounting firm of Francis &Company PLLC. The unmodified opinion
of the independent auditors is presented on page 1.
The data presented in this report are the responsibility of the management of the Authority. To the
best of our knowledge and belief, the data as presented are accurate in all material respects; are
presented in a manner designed to fairly state the financial position and results of operations of the
Authority; and include all necessary disclosures to enable the reader to gain a thorough understanding
of the Authority's financial affairs. For a complete overview, please review Management's Discussion
and Analysis found in Section II: FINANCIAL SECTION, in tandem with this transmittal letter.
Profile of Seattle Housing Authority
Independent Public Jurisdiction: The Authority is an independent municipal entity created by the City
of Seattle (City) in 1939 pursuant to state law and the National Housing Act of 1937. Although it
maintains close ties with the City in several respects, the Authority is not a component unit of the City,
as defined by the pronouncements of the Governmental Accounting Standards Board. The City is not
financially accountable for the operations of the Authority, has no responsibility to fund its deficits or
receive its surpluses, and has not guaranteed the Authority's debt. The Authority is the largest housing
authority in the Pacific Northwest.
Moving to Work Housing Authority: The Authority is one of 35 housing authorities, of more than
4,000 in the country, designated as a "Moving to Work" (MTW) housing authority. An MTW agency is
one that is part of a demonstration created in the 1996 Congressional appropriation for the
Department of Housing and Urban Development (HUD). MTW agencies have three statutory
objectives:
• Reduce cost and achieve greater costs effectiveness in Federal expenditures;
• Give incentives to families with children where the head of household is working, is seeking
work, or is preparing for work by participating in job training, educational, or job referral
programs, to obtain employment and become economically self-sufficient; and,
• Increase housing choices for low-income families.
iii (Continued)

iv (Continued)
Transmittal Letter
2012 Comprehensive Annual Financial Report
As an MTW agency, Seattle Housing Authority has flexibility to develop operating policies and
procedures that differ from those prescribed in regulations implementing Sections 8 and 9 of the
Housing Act of 1937. The Authority also is authorized to combine public housing and housing choice
voucher funds into a MTW Block Grant and to allocate those funds to best meet local low income
housing needs.
Governing Body and Strategic Guidance: The governing body of the Authority is its Board of
Commissioners. The Board is comprised of seven members appointed by the Mayor and confirmed by
the City Council. The Board appoints an Executive Director to administer the affairs of the Authority.
The programs and actions of the Authority are guided by the FY 2011-2015 Strategic Plan. The Plan
was adopted by the Board in October 2010, following a twelve month planning and community
participation process. The underpinnings for the Strategic Plan are the Authority's Mission and Values
statements:
Our Mission
Our mission is to enhance the Seattle community by creating and sustaining decent, safe and
affordable living environments that foster stability and increase self-sufficiency for people with
low-income.
Our Values
As stewards of the public trust, we pursue our mission and responsibilities in a spirit of service,teamwork, and respect. We embrace the values of excellence, collaboration, innovation, andappreciation.
Seattle Housing Authority's 2011-2015 Strategic Plan lays out five broad strategic directions that guide
the primary goals and objectives of the Authority over the period:
1. Expand housing for low-income residents across Seattle by maintaining and expanding low-
income housing stock.
2. Expand housing access and choice across Seattle for low-income residents using Housing Choice
Vouchers.
3. Assist housing participants in gaining access to education and employment opportunities so they
can improve their lives.
4. Provide additional services and increase the stock of housing for low-income seniors.
5. Partner with others to create healthy, welcoming and supportive living environments in Seattle
Housing Authority communities.
In addition to these strategic directions, the Board identified three areas for internal focus. They
represent management and administrative conditions that are necessary for our success:
1. Manage the Seattle Housing Authority as effectively as possible to meet the agency's mission.
2. Identify and implement sustainable practices throughout the agency to minimize impact on the
environment.
3. Promote a healthy, engaged and productive workforce.
u
iv (Continued)

Transmittal Letter
2012 Comprehensive Annual Financial Report
Housing Profile: The Authority is the developer and the general partner and management agent for 17
Component Units, the owners of which are Low Income Housing Tax Credit limited partnerships or
limited liability limited partnerships.
The agency owns and manages or manages more than 8,000 units of housing and administers over
9,600 rental vouchers, providing rental housing or rental assistance to nearly 30,000 low income
people in the City of Seattle.
The Authority operates low-income housing in four large family communities — NewHolly, Rainier
Vista, High Point, and Yesler Terrace; in twenty-eight high-rise buildings, and in single, duplex, triplex,
and small apartment buildings across the city. The Authority also administers the Housing Choice
Voucher programs that provide tenant-based or project-based vouchers that serve as rent
supplements for qualified low-income tenants.
The Authority works with local agencies to provide community, social, and health services to some
low-income residents. These services include recreation, job training, elder services, instruction in
English as a second language, health and dental clinics, and various educational programs.
In the mid-1990s, the agency began along-term program to redevelop its housing stock to transform
the family communities to new mixed-income neighborhoods, while assuring that all low-income
tenants of these neighborhoods receive relocation assistance. Replacement housing, either on or
offsite has also been built or acquired in order to maintain or increase Seattle's inventory of low-
income housing. The Authority's redevelopment activities continue today and into the future.
Budget Process and Monitoring: The annual budget for the Authority is prepared by the Executive
Director with significant involvement of the agency's top executive staff and the support and analysis
of the agency's Budget staff. At the front-end of the budget process, the Cabinet with the Executive
Director agrees on the financial forecast on which the budget will be prepared and establish the key
areas of focus for the coming year from the Strategic Plan. At the end of the budget process, the
Cabinet, with the Executive, determines the final actions to balance the proposed budget.
The Board of Commissioners adopts the annual budget for the Authority after the Executive Director
has presented both the Annual MTW Plan and the agency's Proposed Budget for public review and
comment. The MTW Plan and the Proposed Budget are primary tools for implementing the 2011-2015
Strategic Plan. The annual proposed budget includes four components —the Operating, HAPs (housing
Assistance Payments), Capital, and Development budgets. MTW federal funds comprise 70-75 percent
of the combined Operating HAPs, and Capital revenues. The operating and capital budgets are
developed from the community or program level up in the Authority's project-based budgeting
process. The development programs of the Authority, to rebuild and rehabilitate the family
communities, senior program buildings, and high-rise public housing buildings, are supported through
mixed financings, including low-income housing tax-credit partnerships, bond and mortgage financing,
federal HOPE VI and Choice Neighborhood Initiative funds, and federal, state and local grants.
Once adopted by the Board, the annual budgets are implemented and monitored by all departments
of the Authority, with support from the Finance and Administration Department and the Asset
Management Department. Monthly reports on budget versus actual performance are reviewed by the
Budget Office and the Departments. Quarterly budget and portfolio reviews are conducted at the
management and executive levels, and budget revisions and actions to address variances against
budget, as needed, are taken to ensure appropriate budget control.
iii
v (Continued)

Transmittal Letter
2012 Comprehensive Annual Financial Report
Financial Outlook — Effects of Economic Conditions
State and Local Economy — Forecast Highlightsl
The economic recovery from the Great Recession (which officially ended in the 4thQ 2009) continues at
a moderate and erratic rate. Continuing threats to the U.S. recovery from the weakness in European
countries and the slowdown in Asia are joined in 2013 by the fiscal tightening from the "Fiscal CIifY'
resolution and by the across the board sequestration federal budget cuts. These are expected to place
a drag on the economy and produce slower economic growth, despite other signs of strengthening in
the economy. Overall, most economists foresee continued slow growth and a weak labor market.
Highlights of economic data from U.S., Washington, and Puget Sound economic forecasts show the
mostly positive signs below:
• The housing market continues to strengthen. Existing home sales in January 2013 were 9.1
percent above the year-ago sales rate. The Case-Shiller 20-city price index has shown gains in
housing sales for 11 consecutive months through the end of 2012. Housing starts in January
2013 were nearly 24 percent above the January 2012 level.
• Consumer confidence appears to have picked up. This is reflected in increases in the
Conference Board's index and the University of Michigan's consumer sentiment survey, and by
improvement in durable goods and retail sales.
• Job growth in the U.S. has been slow during the recovery. While the national unemployment
rate in January was 7.9 percent, job growth of 247,000 jobs in November was followed by a job
gain of only 157,000 new jobs in January and February 2013.
• Federal fiscal tightening as a result of the "fiscal cliff" agreement and sequestration will cause
the recovery to proceed haltingly. Personal income growth will be reduced below what it
would otherwise be and economic growth (GDP) will be lower. While a return of the recession
is not anticipated, economic growth is projected to slow from an annual rate of 3.3 percent to
1.8 percent and with it slower employment growth.
• Washington State and the Puget Sound Region are outpacing the national economy in the
recovery by most measures:
✓ Employment growth in the Puget Sound Region is expected to be 2.7 percent in 2012,
twice the national pace. The unemployment rate fell to 7.8 percent by the end of 2012
and by March 2013 stood at 6.0 percent.
✓ Construction employment growth has turned positive and is expected to accelerate over
the next three years. Meantime, manufacturing employment remains strong.
✓ While seeing continued growth in the number of jobs created in Washington, the growth
in work hours and hourly earnings has stalled.
This economic outlook information is significantly informed by the "Puget Sound Economic Forecaster"
produced by Conway Pedersen Economics, Inc. and by the "Washington Economic and Revenue Forecast"
prepared by the Washington State Economic and Forecast Council.
iv
vi (Continued)

Transmittal Letter
2012 Comprehensive Annual Financial Report
✓ Initial claims for unemployment continue a downward trend and are now 45 percent
below the peak during the recession, but still 26 percent above levels before the recession.
✓ Washington's personal income rose in 2012 by 4.5 percent, the 4th highest among the
states and well above the 3.5 percent increase for the U.S. as a whole.
✓ Washington employment growth is expected to be positive and increase annually over the
period 2013-2017 by 1.8 percent. While this pace remains modest, this is an acceleration
and is expected to return Washington to the pre-recession peak by the end of 2014.
✓ Seattle area inflation is expected to remain moderate, ranging from 2.8 to 2.2 percent over
the period 2013-2017.
Impact of Economic Conditions on Seattle Housing Authority
Seattle Housing is not immune to the ups and downs of the economy, nor are the residents and
voucher participants we serve. Here are a few of the positive impacts and continuing concerns that
predicted economic conditions present for the Housing Authority in 2012 and beyond:
• Consumers, including residents, remain cautious about the future. As a result, more people are
staying put. The Housing Choice Voucher program is experiencing lower than usual turnover, and
vacancy rates in our housing units remain at historic lows.
• The expected acceleration in job growth should provide greater opportunity for work hours and
employment to working and work-able residents/participants. On the other hand, those who
are working saw their income reduced in 2013 when the payroll tax cut expired.
• A large number of Seattle Housing Authority residents and voucher holders rely on financial aid
from the State and/or on social services provided through federal, State and local government
funds. With federal budget reductions as a result of sequestration and the State's budget gap in
funding public schools, it is not likely that we will see restoration of programs and income
support cut during the recession and through 2011.
• The pick-up in the housing recovery has enhanced land sales to private developers in our mixed
income communities of Rainier Vista and High Point and home sales in these communities. Land
sale prices are not back to pre-recession levels, but they are increasing. In 2012, all available for
sale residential parcels in these communities were either under a Purchase Agreement or had
Letters of Intent.
• The Housing Authority is also beginning to see more investors return to the low-income housing
tax credit market, along with recovery in tax credit pricing. This market seems to have stabilized,
but investor and lender requirements for protections against risk are adding costs and workload.
• We are beginning to see accelerated construction pricing, which is stretching project budgets
developed over the past few years.
• Most prognoses anticipate that inflation will remain under control and relatively low, while the
Federal Reserve maintains its policy to keep interest rates low as a means of stimulating
investments to promote economic growth.
On balance, the economy is moving in a positive direction for the well-being of our residents and in the
interest of the Housing Authority's financial stability and access to financing.
►~
vii (Continued)

Transmittal Letter
2012 Comprehensive Annual Financial Report
Financial Outlook — Effects of Federal Funding Actions
Federal Funding -Status and Outlook
Budget Control Act of 2011: With Congress split between a Republican majority in the House ofRepresentatives and a Democratic majority in the Senate, the federal government has spent much of
the past two and a half years in brinkmanship over fiscal policy, the debt ceiling, and deficit reduction
versus economic stimulus measures. The impasses persist until the last minute to act and have been
resolved or deferred just short of government shutdowns and, in 2011, were accompanied by a
downgrade of the federal government's credit rating by Standard and Poors. Deficit reduction has
won out over use of fiscal policy to stimulate the economy, first with passage of budget reductions of
nearly $1.0 trillion, particularly indiscretionary programs, in exchange for raising the debt ceiling in
2011. This was followed by the Budget Control Act of 2011 ("the Act") that established reduced
spending ceilings for defense and non-defense mandatory and discretionary programs over the period
2012 through 2021. The initial round of federal spending reductions was reflected in the 2012 Budget
appropriations adopted by Congress.
The Act also established a Committee of House and Senate legislators ("the Super Committee")
charged with recommending to Congress further deficit reduction measures of at least $1.5 trillion
over 2013-2021. The Super Committee failed to meet its deadline for reaching agreement on such a
deficit reduction plan. The Act anticipated this potential outcome and provided a mechanism for
automatic spending reductions of $1.2 trillion to apply across the board to defense and non-defense
programs effective January 1, 2013; these reductions were to be made via "sequestration", or by
imposing reductions to the budget adopted by Congress for 2013.
The Fiscal Cliff.• The "fiscal cliff"-- to occur January 1, 2013 -- became the moniker to describe the
convergence of a series of events set to occur on that date, unless Congress and the President acted to
forestall the automatic measures. The principal elements of the fiscal cliff that were to occur on
January 1St were:
• Sequestration would go into place;
• Bush era tax cuts (along with some other prior tax cuts) would expire;
• The temporary Payroll Tax cut would expire;
• The Farm Bill would expire;
• Pay to doctors for Medicare services would be greatly reduced; and
• Emergency Unemployment Benefits extension would expire.
The American Taxpayer Relief Act (ATRA) was enacted and signed on the last day of the year to avert
some elements of the fiscal cliff, postpone others, and to allow others to go into place. The ATRA's
main provisions in relation to the potential events above were:
• Sequestration for 2013 was reduced from $109.3 to $85.3 billion and deferred two
months to March 1, 2013, with enforcement to begin March 27, 2013; this had the
effect of reducing the impact of sequestration from a 7.5 percent to a 5.0 percent
reduction of nondefense discretionary programs.
vi
viii (Continued)

Transmittal Letter
2012 Comprehensive Annual Financial Report
• Bush-era tax cuts for persons making less than $400,000 were made permanent; the
tax cuts were allowed to expire for persons making more than $400,000, thus
changing the tax rate affecting these people from 36.0 to 39.6 percent.
• The temporary payroll tax (FICA) reduction was allowed to expire at the end of 2012,
increasing FICA taxes for wage earners from 4.2 percent back to 6.2 percent.
• The Farm Bill and its subsidies were temporarily extended.
Payment levels to doctors providing Medicare services were restored.
• Emergency Unemployment Benefits were temporarily extended.
The 2013 Federal Budget and Sequestration: Congress was unable to agree on 2013 Federal Budget
appropriations and so in late September 2012, in order to prevent a government shutdown, enacted a
six months Continuing Resolutions (CR), whereby funding levels enacted for 2012 were continued for
the first six month of 2013. The CR was set to expire March 27, 2013, the same day Sequestration was
scheduled to be enforced. Thus, Congress would have to act on either a set of 2013 Federal Budget
appropriations or further extend the CR by March 27tH
There was strong bipartisan agreement that sequestration took an indiscriminant meat axe to the
budget with automatic across the board cuts. There was also a broad consensus among economists
and analysts that sequestration would be a setback to the country's economic recovery. Despite these
conclusions, however, no agreement emerged on a plan to achieve deficit reduction through
alternative spending cuts and revenue measures. So, sequestration went into effect on March 15t
Once it had taken effect, Congress couldn't find the will to significantly change sequestration and
enacted a continuation of the CR for the remainder of the year in late March. This meant that 2012
appropriation levels would be frozen through 2013 and would be reduced across the board for
nondefense discretionary programs by 5 percent through sequestration.
Outlook for Nondefense Discretionary Funding: As part of the American Taxpayer Relief Act, the
federal spending caps were revised for the next ten years (2014-2023) and future sequestration
reductions were embedded in the ten year spending limits. This results in an estimated small decrease
-- (0.3) to (0.6) percent — in nondefense discretionary targets for 2014, followed by modest inflationary
increases (2.2-2.6 percent annually) for the remainder of the ten years. At this time, this represents
current law. There will definitely be continuing efforts to reduce the deficit through spending cuts and
revenue increases. The primary issues will continue to be how to increase revenues that a majority of
Congress will support and how to reduce the cost of mandatory programs — principally Social Security
and Medicare.
Seattle Housing Authority's Response to Federal Funding Changes
Importance of Federal Resources for Low Income Housing: Annual HUD funding for ongoing lowincome housing programs, rental assistance, and capital repair funds represents 70-75 percent of the
Authority's annual budgets for housing operations, housing assistance payments, and capital repairs.
Accordingly, what happens with the federal budget is of crucial importance to the Seattle Housing
Authority.
Seattle Housing Authority has three very important assets to help us deal with changes in federal
funding. First, as a "Moving to Work" (MTW) agency we have flexibility in allocating our three streams
of MTW federal funds to best meet our local housing needs, and we have the ability to waive certain
vii
ix (Continued)

Transmittal Letter
2012 Comprehensive Annual Financial Report
provisions of the 1937 Housing Act and regulations in order to demonstrate cost effective alternatives.
These tools enable us to adapt to federal funding changes with the capacity to moderate the intensity
of their impacts on our housing portfolios and rental assistance programs.
Second, we have a long and continuing history of successfully competing for and effectively
implementing federal, state, and local capital and service grants. In the past few years as federal
funding has declined, we have competed successfully twice for Choice Neighborhood Initiative
Implementation grants, which have provided the catalyst for the first two phases of Yesler Terrace
redevelopment and a total of 212 replacement units to be completed by 2016. The Authority
continually competes successfully for grants providing services supporting resident self-sufficiency and
leverages grant funds with local and foundation funds to maximize program effectiveness.
Third, the Authority encourages a culture that seeks continuous improvement and actions that will
enhance the efficiency of our operations, while continuing to serve the same number or more
residents/rental assistance participants. A couple of examples of our success stand out. We
reorganized the ways we serve Housing Choice Voucher participants and changed our operating
practices to achieve a more optimal and even distribution of work over the year. These changes are
smoothing caseloads over the year and allowing more time for staff to focus on providing supportive
services and referrals to address the needs of different participant groups.
In Housing Operation, we implemented changes designed to better align responsibility and authority
for budget decisions at the property level and we concentrated attention on reducing the cost of unit
turnovers. In each of the last two years, these changes have paid dividends in operating cost savings.
In both departments, these changes are being monitored and modified as we gain experience, and, so
far, our progress is promising. These and many other budget and operations decisions we have made
are changing the way we do business to gain efficiencies and maintain service, even as resources are
more constrained.
Impacts of Federal Budget on Seattle Housing Authority: The reductions in federal funds for publichousing operations, public housing capital, and housing choice vouchers —the three federal sources
that comprise the MTW Block Grant and represent 70-75 percent of our sources for operations, capital
repairs, and rental assistance —have produced forecasted revenue shortfalls relative to status quo
program costs of $10.3 million for 2012, $4.5 million for 2013, and a projected $1.5 million for 2014.
In the Calendar Year (CY) 2012 and CY 2013 Seattle Housing Authority Annual Budgets, the Authority
planned for federal funding reductions based on spending cuts embedded in the Budget Control Act of
2011, enacted in the 2012 Budget, and forecast for the 2013 federal budget. Thus, we adopted
reductions to close the projected $10.3 million and $4.5 million, respectively, in 2012 and 2013. These
reductions included the elimination of 106 full-time equivalent positions or 18 percent of the agency's
staffing capacity. At the same time, the Authority has continued to serve at least the same number of
residents and voucher participants.
While service levels are in some areas were necessarily reduced, many of the reductions came from
planned changes in the methods of doing business to capture efficiencies. These changes, for
example, involved better and more extensive use of technology to streamline operations; changes in
workflow to optimize caseloads in the voucher program; reorganization of functions to better align
budget responsibility and authority and quantified standards for such things as the average cost of
turnovers. These changes have not been easy and continue to be refined with the advice and
viii
x (Continued)
Transmittal Letter
2012 Comprehensive Annual Financial Report
involvement of affected staff and feedback from customers. The commitment to continuous
improvement, however, is increasingly a shared value and core strength of the agency.
In spite of the funding challenges described above, the Seattle Housing has been able to advance
several key aims of our Strategic Plan. Here are examples of 2012 accomplishments:
• Increased service to low-income people;
• Secured $30 million in federal funds to be the catalyst to for the first and second phases of
Yesler Terrace redevelopment;
• Completed construction and lease-up of the rental housing at Rainier Vista Northeast, thereby
completing Rainier Vista rental housing plans.
• Completed the building envelope rehabilitation and window replacement in two Seattle Senior
Housing Program (SSHP) Buildings — Blakeley Manor and Bitter Lake Manor.
• Secured Public Housing Capital Grant funds for the Senior Housing Program to address long-term
portfolio capital needs;
• Refined and extended the Preventive Maintenance program to each property to extend the life
of assets and preserve valuable warranties.
• Provided 70 project-based vouchers to nonprofits undertaking development of new low income
housing units with Housing Levy funds.
• Added over 830 new vouchers awarded in late 2011 through early 2012: 100 Family Unification
Program, 37 additional Veteran Assistance (VASH) and up to 697 Tenant Protection vouchers - to
expand housing opportunities for qualified low income participants.
• Reorganized Community Police Teams to provide more efficient and flexible service on a
geographic rather than a property basis.
• Implemented efficiencies and modified operating procedures to maintain critical direct services
to residents and clients; and,
• Continued to meet our financial policy objectives for Operating Cash Reserves.
As the federal government continues its emphasis on deficit reduction, we expect to see flat to
moderately reduced federal revenues that are outstripped by the inflationary pressures on
expenditures, with the result that we will have to reduce expenses or raise new revenues to balance
our budgets.
While we are planning for near term constraints on federal funding support, provision of housing for
our most vulnerable populations has been a continuous federal commitment and funding priority for
nearly 75 years. This partnership endures and we are confident that federal policy and financial
support for low-income housing — operations, maintenance, and development —will continue over the
long run.
ix
xi (Continued)

Transmittal Letter
2012 Comprehensive Annual Financial Report
Financial Management and Oversight
The Authority's management is responsible for establishing and maintaining an internal control
structure designed to ensure that the Authority's assets are protected from loss, theft or misuse, and
that representation of the Authority's assets and liabilities are accurately reflected on the agency's
financial statements, in conformance with generally accepted accounting principles. The internal
control structure is designed to provide reasonable, but not absolute, assurance that these objectives
are met. The concept of reasonable assurance recognizes that the costs and benefits require estimates
and the exercise of judgments by management.
As a recipient of federal and state financial assistance, the Authority is also responsible for ensuring
that an adequate internal control structure is in place to ensure compliance with applicable laws and
regulations related to those programs. The internal control structure is subject to periodic evaluation
by management and the compliance staff of the Authority.
Single Audit
In compliance with the Single Audit Act Amendments of 1996, tests are made to determine the
adequacy of the Authority's internal control structure, including that portion related to federal
financial assistance programs, as well as to determine whether the Authority has complied with
applicable laws and regulations. The Authority's single audit was carried out by the international public
accounting firm of KPMG LLP. The audit for the year ended December 31, 2012 resulted in two A-133
findings of significant deficiencies: one related to the need for annual review of debarment status of
vendors; the other pertaining to failure ofnon-profit sub-recipients under contract to the Authority in
the Mod Rehab Program to submit annual performance reports and to inadequate controls by SHA to
ensure the reports were made in a timely manner. There were no significant deficiencies found by
KPMG in the Housing Authority's Financial Statements.
On the first A-133 finding, the auditors noted that while SHA routinely reviews debarment/suspension
listings for all new contractors/vendors prior to contract award, the agency has not routinely reviewed
vendors with multi-year contracts to ensure that they have not been debarred subsequent to initial
contract award or conducted annual reviews of non-contract vendors with transactions in excess of
$25,000. The auditors recommended a change in SHA practices to ensure all contractors/vendors are
reviewed as to debarment status annually. SHA concurred in the recommendation and a revised policy
and monitoring procedures for multi-year contracts has been established and implemented and a
review will be performed annually of Purchasing Card vendors with transactions in excess of $25,000.
On the second A-133 finding, this is a repeat Reporting finding from 2011. The Authority thought we
had corrected the problem last year by reminding one specific non-profit provider of the reporting
responsibilities and securing their compliance with submission of the 2011 report. The Authority has
repeated the reporting requirement responsibility to the sub-recipients out of compliance and will
increase monitoring oversight to ensure the reports are submitted to the Authority and HUD by the
due dates.
Budgeting Control and Program Accountability
The objective of budgetary controls maintained by the Authority is to ensure appropriate financial
management by Authority department managers of actual expenditures in relation to the approved
budget. The Finance and Administration Department provides quarterly reports to managers and
x
xii (Continued)

Transmittal Letter
2012 Comprehensive Annual Financial Report
executive staff on the status of the budget and on any actions needed to ensure that the Authority
operates within the adopted budget. Additionally, monthly financial reports comparing actual
revenues and expenses to budget are provided to Department and program managers to assist them
with timely information for managing their budgets from the individual community level to the overall
management level.
An integral part of budget control is to review needs for and impacts of budget revisions following
adoption of the annual budget by the Board. These reviews occur at least quarterly and where
adjustments are justified, the adopted budget is revised. There are also quarterly reviews of all
Housing Portfolios by the agency's Asset Management Team. During these sessions budget status is
reviewed; vacancies and rent collections trends are noted; unit turnover cost and length of time to
return a vacated unit to a new lease are reviewed against standards and past performance, and
general conditions of the property and welfare of the residents are presented by property
management staff.
Financial Policy Oversight
The Authority has two ongoing Committees —one internal and one a Board Committee —that provide
financial oversight. The Board Committee is the Audit Committee consisting of the Chair of the Board,
two other Board members, and two outside independent members with expertise in finance and
accounting. All members are appointed by the Board chair and serve staggered terms of three years.
The Committee meets two to four times a year, as needed, to conduct entry meetings with the
independent auditor and the State Auditor and to hear reports and findings of the Auditors. The Audit
Committee reports its activities to the full Board, along with any conclusions or recommendations they
have to continue to strengthen the Authority's financial management.
Internally, the Authority has a Financial Policy Oversight Committee that meets monthly and is
comprised of the Executive Director, the Deputy Executive Director, the Director of Housing
Operations, the Director of Development, the Director of Housing Finance and Asset Management, the
Chief Financial Officer (who leads the Committee), the Controller, and the Budget Manager.
The Financial Policy Oversight Committee is charged with overseeing the financial conditions and
financial management decisions of the Authority and ensuring that current or implied financial
commitments/conditions receive the full scrutiny of the Authority's top managers and expert line staff.
This committee has enhanced agency-wide consideration of and decisions on credit and debt
management; development opportunities, project selection, and financing plans and policies;
coordination of timing on actions; planning and monitoring of interim financing repayment plans;
management of cash reserves; and, risk assessment. The Financial Policy Oversight Committee also
administers the agency's policy on unrestricted cash balances and unassigned cash (Operating Cash
Reserves), which was adopted by the Board of Commissioners in April 2011 and is scheduled for Board
review and revisions in May 2013.
Component Units:
The Authority has seventeen discretely-presented component units as of December 31, 2012. Two
new limited-liability limited partnerships were created in 2012. As the Authority has expanded its
redevelopment activities using mixed financing, component units have become a larger and larger
share of our strategy of providing low-income housing. At the end of 2012, the Authority's component
units represented over 47 percent of all rental housing units operated directly by the Authority.
xi
xiii (Continued)

Transmittal Letter
2012 Comprehensive Annual Financial Report
In 2012 the two new partnerships are the 1105 E. Fir Limited Liability Limited Partnership and the
Leschi Limited Liability Limited Partnership.
Prudently Managing Public Housing Properties
The Authority has continued to take an active asset management approach to managing its properties,
treating each of them as a distinctive "community" with the goal of efficiently using each property to
its fullest potential toward meeting our mission. This means the Authority is actively reviewing its
existing real estate holdings to ensure that all assets are managed in acost-effective and efficient
fashion and are contributing to the overall mission of creating and sustaining decent, safe, and
affordable living environments for the low-income people of Seattle. As noted above, the internal
Asset Management Committee with management representatives from all departments conducts
quarterly portfolio reviews with property managers and notes issues for further discussion and review
and circumstances requiring corrective measures. The Authority's approach is spelled out in the "Local
Asset Management Plan" included in the agency's annual MTW Plan.
The Authority will continue to supplement its tenant rental income, operating revenues, and HUD
subsidies by actively competing for additional federal funds for modernization, redevelopment, and
resident support activities; by applying for local and state grant opportunities; by expanding
partnerships with community organizations and private foundations, and by building new partnerships
with schools, from elementary through vocational/technical colleges to universities. The Authority
continues to compete successfully wherever we see new funding or partnership opportunities.
We also continue to forge new and strengthen existing partnerships around educational and job
training opportunities with foundations and schools. The U.S. Department of Labor through the King
County Workforce Development Council is funding a two year program — Pathways Out of Poverty; this
grant is designed to support low-income people in gaining access to pre-apprenticeship construction
training and placement into construction jobs. In addition, we are using these grant funds to support
parent engagement work for Yesler parents so they can better support and advocate for their
children's educational success.
The City's streetcar project has selected a route that runs through the heart of the Yesler Terrace
Transformation Plan area and $32 million of project investments will occur within the boundaries of
the Plan area. The streetcar extension is expected to open in 2014.
Long-Term Planning for Redevelopment
At the end of 2012, the Authority had completed redevelopment of all low income rental housing in
three of our four extremely low-income family communities; had completed construction of a new
sustainable model "green" family community for low-income people; and had secured City approval of
critical land use entitlements and development agreements for redevelopment of the remaining family
community, Yeller Terrace.
Beginning in the 1990s, the Authority began planning for the redevelopment and major rehabilitation
of much of its public housing stock and for the creation of new mixed-income communities. To
implement these long-range plans, the Authority received HUD HOPE VI Urban Revitalization grant
awards for the redevelopment of its Holly Park and Rainier Vista communities in southeast Seattle, and
the Roxbury and High Point communities in southwest Seattle, and Lake City in the north Seattle.
While important, federal funds comprise a minority share of the funding for redeveloping these
xii
xiv (Continued)

Transmittal Letter
2012 Comprehensive Annual Financial Report
communities. In undertaking renewal of its housing stock, the Authority sought new funding sources
and partnerships.
These new partnerships have included mixed-finance strategies, including the following:
• Use of low-income housing tax-credit partnerships for equity investment;
• Use of local bond or mortgage financing to be repaid through operating income;
• Involvement of partners such as Habitat for Humanity and service providers in developing
homes and facilities;• Use of lines of credit or reserve funds as interim financing of property acquisition, design,
predevelopment,and infrastructure to be repaid through land sale proceeds;
• Use of interim or bridge financing for predevelopment activities; and,
• In 2010 and 2011, use of stimulus funds from the American Recovery and Reinvestment Act
(ARRA).
Seattle Housing has completed redevelopment of NewHolly, Roxbury Village (renamed Westwood
Heights), Phases I and II of Rainier Vista and of High Point rental housing. Final completion of Rainier
Vista and High Point will occur when all for-sale parcels for privately-developed affordable and market
rate homes are complete and the new housing is sold.
Despite the lethargy of the housing market as we continue to emerge from the Great Recession, the
Authority enjoyed a very positive year in 2012 in sale of land parcels. Builders have also enjoyed
success in their sales. All parcels available for the market rate housing at Rainier Vista were under a
Letter of Intent or a Purchase and Sales Agreement by the end of 2012. At High Point, we saw a steady
pattern of a private developer purchasing blocks, building homes, starting to sell the homes and
buying additional blocks for development throughout much of 2011 and 2012. Development of
market rate properties and sale of homes in both High Point and Rainier Vista begun to pick-up in
2011 and hit full stride in 2012. We foresee of the market rate housing at both communities will be
fully built out and sold over the next two to four years.
Yesler Terrace Redevelopment -- SHA's most significant Long Term Initiative
Yesler Terrace is Seattle's oldest public housing community, constructed in 1939 on 30+acres adjacent
to downtown. The community houses more than 1,000 low-income people in 561 apartment units.
The Authority's Board of Commissioners adopted a comprehensive set of guiding principles for the
redevelopment of Yesler Terrace in December 2007 .These guiding principles were developed by a
Citizen Review Committee (CRC) chaired by former Mayor Norman Rice. Conceptual site alternatives
were defined in 2009 based on these principles. In 2010 the Environmental Impact Statement (EIS)
process got underway. The draft EIS was issued in late 2010 and the final EIS was issued in April 2012.
In May 2012 the Board approved the Redevelopment Plan to guide development on the site over the
next 10-20 years. This Development Plan provides for:
• Up to 4.3 million square feet of housing (5,000 units);
• Up to 900,000 square feet of office space;
• Up to 65,000 square feet of neighborhood services, including the existing Yesler Community
Center;
• Up to 88,000 square feet of neighborhood retail;
• 15.9 acres of parks and semi-private open space; and,
X111
xv (Continued)

Transmittal Letter
2012 Comprehensive Annual Financial Report
• Up to 5,100 parking spaces to serve residential, retail, and office uses.
Yesler Terrace's redevelopment is the major initiative of the Seattle Housing Authority that will extend
over the next 15-20 years. Yesler Terrace is the most urban and unique of the family communities and
redevelopment planning has already been ongoing for six years. Redevelopment to be implemented
with the involvement of the Housing Authority, non-profit housing providers, a co-development
partner, and individual market housing and office developers, as well as legions of community
organizations, educational institutions, public agencies, and service providers. These partners will be
instrumental in helping the community reach its aspirations for educational advancement and
opportunity and for meaningful long-term employment prospects.
The year 2012 was one of major "critical path" milestones to propel the Yesler Terrace redevelopment
project from the predevelopment to implementation phases. Here are highlights of the critical steps
forward:
Receipt of a second Choice Neighborhoods grant award, in the amount of $19,730,000, from
the Federal Department of Housing and Urban Development. This brings the Housing
Authority's total grant award from HUD to $30,000,000 to support the redevelopment of
Yesler Terrace.
• Receipt of $750,000 in funding from the JPMorgan Chase Foundation to support Yesler
redevelopment efforts, in particular the Hillclimb between Little Saigon and Yesler Terrace.
• City Council approval of a comprehensive package of legislation that enables implementation
of Yesler Terrace redevelopment to begin. The legislation includes:
✓ Zoning Changes: A new Master Planned Communities zone will allow height and density
similar to that of adjacent downtown neighborhoods.
✓ Design guidelines: Design guidelines for the project will ensure high quality design and
livability.
✓ Street Vacation: This approval allows for adjustments in the current street right-of-way
that will result in better circulation to and through the neighborhood.
✓ Cooperative Agreement: This Agreement outlines commitments from the City of Seattle
for funding to support the project and housing affordability requirements for the life of the
project.
Development of an Infrastructure Master Plan that identifies all improvements necessary to
transform the physical infrastructure at the site.
Undertaking of a robust competitive process for selecting a potential Development Partner.
This process extended over a planning schedule of a year. A Request for Qualifications and
intensive review and engagement process occurred over a nine month period. The result was
of the process was the selection of a firm with whom the Authority would engage in an
exclusive negotiating period, which is expected to conclude in mid-2013.
The Authority selected Phase I contractors to deliver the first replacement projects in 2014 --
1105 Fir St. and the Baldwin Apartments. The Authority also bid and selected contractors to
carry-out the work of rehabilitating the historic Steam Plant with a Community Facilities Grant
from HUD and matching funds from SHA.
X1V
xvi (Continued)

Transmittal Letter
2012 Comprehensive Annual Financial Report
• Finally, the Authority engaged a private developer for the first affordable housing and market
rate development at 12th and Yesler.
STRATEGIC PLAN INITIATIVES TO ADVANCE LONG-TERM GOALS
The Authority uses its Five Year Strategic Plan as the foundation of establishing work plans and
resource allocations, particularly on the margin, in the annual budget process. Below are the
highlights of the initiatives and accomplishments planned for 2013 to advance the eight priority
objectives from the 2011-2015 Strategic Plan.
REDEVELOPING YESLER TERRACE
• Begin construction on the 1105 E. Fir Street Apartments; this rental housing includes 83
replacement units and 20 tax credit units, completion in 2014.
• Coordinate development activities with the private developer of a market rate property at 12th
and Yesler, a mixed use project to be completed in 2014 that includes ground level retail.
~ Undertake rehabilitation of the Baldwin Apartments to provide 15 replacement housing rental
units; completion in early 2014.
• Complete the renovation of the historic Steam Plant to house an early childhood and new job
training center, including a permanent home for Head Start.
• Work with the City and the community to plan and design the 10th Avenue Hillclimb connecting
Yesler Terrace with Little Saigon, with construction expected to be initiated in mid-2014.
• Begin work with the City and community to implement the Horiuchi Park P-Patch, located just
north of the 1105 Fir Street Apartments on the east side of Boren Avenue.
• Implement the initial stages of relocation plans under the leadership of the Housing Operations
Division:
✓ Complete resident interviews, education, and counseling regarding the initial relocation
process and continue planning to implement relocation over a number of years. The
interview and support counseling in 2012 and 2013 is expected to address the needs of 200-
250 Yesler Terrace households.
✓ Begin initial moves of Yesler residents in mid to late 2013 in order to undertake Phase II
housing and infrastructure work.
• Undertake a host of Master Plan and Development Plan implementation activities during 2013:
✓ Complete the Final Plat for the entire site and 100% Street Improvement Plan for the
southwest sector of Yesler Terrace.
✓ Work with the selected Development Partner to refine project sequencing and identify
funding sources and financing for construction of infrastructure and pedestrian amenities.
✓ Work with the Parks Department in the design of the neighborhood park and schedule its
construction and completion in relation to other construction work.
xv
xvii (Continued)

Transmittal Letter
2012 Comprehensive Annual Financial Report
✓ With the Phase II Choice Neighborhoods Initiative grant, undertake initial design of Phase 2
housing and procure contractors for infrastructure and housing projects to take place in
2014.
• Complete the Community Workforce Agreement with Labor to cooperatively undertake all
publicly funded housing at YT and ensure construction training, apprenticeships, and job
opportunities for low income residents, women and minorities, and women and minority
businesses.
PRESERVING EXISTING HOUSING
• Begin design work for an occupied rehabilitation of Leschi House, a 34 unit senior building, and
construction of a new wing with 35 additional units serving seniors; built to the Evergreen
Sustainable Development Standard; complete construction in 2014.
• Review opportunities and properties for a second phase of repositioning the Scattered Site
portfolio. Identify properties for disposition and a plan for replacement to be initiated in 2014.
• Complete rehabilitation or replacement of elevators in two Senior Housing buildings as part of a
portfolio-wide program to address all the senior housing buildings with one elevator which is
reaching its useful life.
• Complete rehab of six Scattered Site units to make them compliant with USAF, pursuant to SHA's
compliance agreement with HUD.
• Expand the SHA Preventive Maintenance model to additional portfolios and properties. This
model is a cost effective approach to extend the life of assets and preserves valuable warranties.
EXPANDING CHOICE AND OPPORTUNITY FOR VOUCHER PARTICIPANTS
• Increase support for mobility efforts with expanded long-term linkages to service providers
throughout the City; seek their assistance, advice, and support for our mobility efforts.
• Provide more targeted information to participants and the waiting list about housing choice and
the benefits of living in a high opportunity area - including school outcomes, crime rates,
job/transit/services proximity.
• Increase our housing counseling services to reach more voucher participants. Through
individualized housing counseling assistance and "Ready to Rent" classes, assist voucher
participants in making informed decisions about housing selection.
• Increase the supply of affordable units in medium and high opportunity areas through targeted
and increased landlord recruitment and retention and monitor changes in rental supply
dispersion across the city.
• Explore housing choices and child welfare outcomes by working in partnership with the
MacArthur Foundation and the Urban Institute on amulti-year study.
XVl
xviii (Continued)

Transmittal Letter
2012 Comprehensive Annual Financial Report
SUPPORTING EDUCATION OPPORTUNITIES FOR YOUTH
• Help residents and participants access services and programs funded through the City of
Seattle's Family and Education Levy.
• Partner with the College Success Foundation to market College Bound and other scholarship
opportunities to HCV participants, individuals on the HCV wait list, and public housing families.
• Continue to work with partners to support SHA youth academic success through youth tutoring,
computer labs, and access to educational information and support.
• Continue to implement the Yesler education initiative with our partners- Seattle University,
Seattle Public Schools, College Success Foundation and Neighborhood House -to provide a
continuum of educational support for at-risk youth under the Choice Neighborhoods grant.
ADVANCING EDUCATIONAL ACCESS AND EMPLOYMENT OPPORTUNITIES
• Expand opportunities for workforce training and job placement through partners, such as Port
Jobs, the Workforce Development Council, Seattle Vocational Institute and private sector
employers, including those in construction, healthcare and higher education.
• Pursue a partnership with nearby area hospitals to train Yesler residents for jobs in the
healthcare industry, as part of the Phase II Choice Neighborhoods Initiative grant.
• Continue to develop partnerships with public and non-profit agencies providing financial
benefits and services, including Social Security Administration, Department of Social and Health
Services, Employment Security and organizations offering credit counseling and financial literacy
classes.
• Implement a new financial matching program to support savings opportunities for residents
working toward moving from subsidized housing.
INCREASING EFFICIENCY AND COST EFFECTIVENESS OF OUR SERVICES AND OPERATIONS
• Implement Yardi Voyager starting in fall of 2012 and capture significant administrative
efficiencies by consolidating different software systems into one property management
software. Improve workflows for reporting, inspections, work orders and other key property
management functions.
• Implement a pilot site-focused-services project for the high-rise properties in the Low Income
Public Housing (LIPH) portfolio. Resident Managers along with Maintenance Mechanics will be
the core of the site-focused services pilot.
• Implement a reorganization of Housing Choice Vouchers staffing through electronic optimization
of caseloads and differentiation of caseload demands for different client groups. This is expected
to result in smoother client workloads and enhance services to different client groups.
• Expand implementation of e-payables for electronic payments to the Authority's vendors and
contractors. The goal is to move a majority of larger vendors/contractors to e-payables during
2013 to reduce banking and mailing costs.
xvii
xix (Continued)

Transmittal Letter
2012 Comprehensive Annual Financial Report
Expand direct deposits of Housing Assistance Payments to landlords by requiring landlord
conversion to direct deposit or stored value cards and provide pay advices electronically. These
actions reduce banking and mailing costs.
• Use MTW authority to improve efficiency, productivity, customer service and to obtain cost
savings and/or increased revenues. Some proposed policy changes include: triennial reviews for
more households, $200 income change threshold for interim reviews, establishing common
minimum rents between public housing and the voucher program; undertake a comprehensive
rent reform examination.
STRENGTHENING OUR FINANCIAL CONDITION AND CREDITWORTHINESS FOR THE LONG RUN
• Maintain the Authority's Operating Cash Reserve at a minimum of one month and a maximum of
six months of operating plus average debt service expenditures, or approximately $12-13 million
in 2013. The Authority's unassigned and undesignated cash reserve —the "Operating Reserve" is
expected to be at two months of expenses thru 2013.
• Prepare a proposed policy, through the Financial Policy Oversight Committee, to establish a
Development Reserve, pursuant to recommendations from our financial advisors for prudent
management of risks, and propose to the Board "Committed Cash" reserves for their adoption
as obligations of the agency.
• Refinance bond-financed properties to help make needed capital repairs, and/or build capital
reserves, and improve cash-flow by reducing bond payments.
• Establish an on-going system for assessing/projecting exit strategies for tax credit limited
partnerships that will be at or near the year in which the partnership has used all of its tax
advantages and may exit:
• Work with Standard and Poors in their annual surveillance credit report and review of the
Authority's credit rating with the aim of maintaining the agency's rating of A+.
PARTNERING WITH OUR UNIONS AND EMPLOYEES TO MEET FINANCIAL CHALLENGES TOGETHER
• Through the active programs of the Safety Officer and the Safety Committee, reduce accidents
to enhance worker safety, thereby also reducing lost time, and reducing Workers' Compensation
costs.
• Develop safety and wellness programs that reduce employee work-related injuries and illnesses.
• Negotiate contract extensions with the Office &Professional Employees International Union
(OPEIU), Teamsters and the Trades for 2013 through 2015. Work with the unions to ensure the
contracts are consistent with SHA's financial capacity and efforts to create efficiencies in
operations and costs containment.
Awards and Recognition
Over the period 2010 through 2012, the Housing Authority of the City of Seattle received distinctions
and recognitions, including:
• For the fifteenth year in a row, a Certificate of Achievement for Excellence in Financial Reporting
by the Government Finance Officers Association (GFOA) of the U.S. and Canada for the fiscal year
xvui
xx (Continued)

Transmittal Letter
2012 Comprehensive Annual Financial Report
ending December 31, 2011 for the Seattle Housing Authority Comprehensive Annual Financial
Report. A Certificate of Achievement is valid for a period of one year only. We believe our current
report continues to conform to the Certificate of Achievement program requirements, and we are
submitting it to the GFOA for their assessment again this year.
• Seattle Housing Authority received an entity credit rating of A+under Standard and Poors' new
international rating criteria for housing authorities/social housing in the U.S. and Europe.
A High Performing Housing Authority designation: SHA was designated a high performing agency
in 1993 under HUD's Public Housing Management Assessment Program (PHMAP). As a result, the
Authority became one of six original participants under contract with HUD in its Moving to Work
(MTW) Demonstration Program. SHA has signed a contract with HUD for aten-year extension of
its MTW status through 2018; pending HUD's revisions of its Public Housing Assessment System or
designation of an alternate evaluation tool, Seattle Housing retains its high performer designation.
~ On September 4, 2012, the Seattle City Council unanimously adopted an extensive legislative
package to implement the redevelopment of Yesler Terrace.
• The Cooperative Agreement between the City of Seattle and the Authority reflects an expectation
for City financial contributions of $30 million over the life of the project and commits up to $10.92
million of City funding for development of housing and parks for Phases 1 and 2.
• In December 2012, the U.S. Department of Housing and Urban Development granted $19.7 million
from its Choice Neighborhoods Initiative (CNI) to Seattle Housing Authority, bringing CNI support
for the project to $30.0 million.
• The Yesler Development Project received $750,000 from the JPMorgan Chase Foundation to help
fund the 10th Avenue Hillclimb between Little Saigon and Yesler Terrace and a feasibility analysis
of the Friends of Little Saigon development proposal.
• The Rainier Vista redevelopment project received a Merit Award from the American Institute of
Architects for the high quality of its overall design.
• The Housing Authority Insurance Group presented the agency with a 2010 Best Practice Award for
our Safety Hot Topic Program, which is a communication program aimed at reducing work-related
accidents and worker compensation costs.
• Seattle Housing Authority won a Merit Award from the National Association of Housing and
Redevelopment Officials (NAHRO) for the policies and materials we developed to serve clients with
limited English proficiency.
• A "Community Service Award" to Seattle Housing Authority was made by the Seattle Section 3
Advisory Committee was in recognition of placement of 89 Section 3 residents on the High Point
rental housing construction project;
• A Housing Authority Risk Retention Innovation Award in recognition for outstanding Risk Control
Innovation in Loss Prevention and Loss Control, presented by the Housing Authority Insurance
Group (September 2010);
• Recognition for advocacy work by the Pacific Northwest Regional Council of the National
Association of Housing and Redevelopment Officers for efforts including promoting increased
awareness among staff and residents of the importance of various legislative bodies;
X1X
xxi (Continued)

Transmittal Letter
2012 Comprehensive Annual Financial Report
Design and Sustainability Awards: The Authority has been recognized locally, nationally, and
internationally for the quality of our redevelopment communities. In 2007, the Authority received
the prestigious Urban Land Institute Global Award for Excellence. This award is broadly recognized
as the pinnacle award for design excellence on a worldwide scale and is an apt reflection of the
Authority's commitment to sustainability and to the innovative designs and programs
implemented at High Point. The Authority's most recent redevelopment projects have also
received the following awards:
Yesler Terrace:
✓ Received an award from Futurewise for Yesler Terrace Redevelopment Planning.
✓ The Yesler Terrace redevelopment project received a Recognition Award for promoting
sustainable growth from the Quality Growth Alliance, which is made up of real estate,
environmental, and civic organizations.HighPoint
✓ Received a KaBoom grant for playground and outdoor exercise equipment at Bataan Park.
Acknowledgments
The preparation of this report has been accomplished through the hard work of the Finance
Department staff and the support of other staff members throughout the Seattle Housing Authority. A
special thanks to Janet Hayes, Seattle Housing Authority's Controller, whose talents, dedication, and
commitment to accurate and thorough financial reporting and whose oversight of strong internal
controls are largely responsible for more than a decade of Awards of Excellence in Financial Reporting
from the Government Finance Officers Association and consistently unqualified opinions on SHA's
Financial Statements by our independent auditors. We wish to thank, as well, the management and
staff of KPMG LLP and Francis &Company PLLC who provided the necessary expertise and technical
assistance in conducting the independent audit and organizing this report.
We would also like to take this opportunity, on behalf of the staff and residents of the Seattle Housing
Authority, to acknowledge the members of the Board of Commissioners for their tireless support and
guidance.
Ily submitted,
Andrew J~LcExecutive Di
cc: SHA Cabinet members
xx
xxii

xxiii

xxiv
(This page intentionally left blank)

THE HOUSING AUTHORITY OF THE CITY OF SEATTLE, WASHINGTON
Financial Section
Section II

KPMG LLPSuite 29001918 Eighth AvenueSeattle, WA 98101
KPMG LLP is a Delaware limited liability partnership, the U.S. member firm of KPMG International Cooperative (“KPMG International”), a Swiss entity.
Independent Auditors’ Report
The Board of Commissioners The Housing Authority of the City of Seattle, Washington:
Report on the Financial Statements
We have audited the accompanying financial statements of the business-type activities (primarily government) and the aggregate discretely presented component units of The Housing Authority of the City of Seattle, Washington (the Authority) as of and for the year ended December 31, 2012, which collectively comprise the Authority’s basic financial statements as listed in the table of contents.
Management’s Responsibility for the Financial Statements
Management is responsible for the preparation and fair presentation of these financial statements in accordance with U.S. generally accepted accounting principles; this includes the design, implementation, and maintenance of internal control relevant to the preparation and fair presentation of financial statements that are free from material misstatement, whether due to fraud or error.
Auditors’ Responsibility
Our responsibility is to express opinions on these financial statements based on our audit. We did not audit the financial statements of the aggregate discretely presented component units of the Authority, which represent 100% of the assets, net position, and revenues of the discretely presented component units. Those financial statements were audited by other auditors whose reports thereon have been furnished to us, and our opinion on the basic financial statements, insofar as it relates to the amounts included for the discretely presented component units, is based solely on the reports of the other auditors. We conducted our audit in accordance with auditing standards generally accepted in the United States of America and the standards applicable to financial audits contained in Government Auditing Standards, issued by the Comptroller General of the United States. Those standards require that we plan and perform the audit to obtain reasonable assurance about whether the financial statements are free from material misstatement.
An audit involves performing procedures to obtain audit evidence about the amounts and disclosures in the financial statements. The procedures selected depend on the auditors’ judgment, including the assessment of the risks of material misstatement of the financial statements, whether due to fraud or error. In making those risk assessments, the auditor considers internal control relevant to the entity’s preparation and fair presentation of the financial statements in order to design audit procedures that are appropriate in the circumstances, but not for the purpose of expressing an opinion on the effectiveness of the entity’s internal control. Accordingly, we express no such opinion. An audit also includes evaluating the appropriateness of accounting policies used and the reasonableness of significant accounting estimates made by management, as well as evaluating the overall presentation of the financial statements.

2
We believe that the audit evidence we have obtained is sufficient and appropriate to provide a basis for our audit opinions.
Opinions
In our opinion, based on our audit and the reports of other auditors, the financial statements referred to above present fairly, in all material respects, the respective financial position of the business-type activities and the aggregate discretely presented component units of The Housing Authority of the City of Seattle, Washington, as of December 31, 2012, and the respective changes in financial position, and where applicable, cash flows thereof for the year then ended in accordance with U.S. generally accepted accounting principles.
Other Matters
Required Supplementary Information
U.S. generally accepted accounting principles require that the management’s discussion and analysis on pages 4 through 13 be presented to supplement the basic financial statements. Such information, although not a part of the basic financial statements, is required by the Governmental Accounting Standards Board who considers it to be an essential part of financial reporting for placing the basic financial statements in an appropriate operational, economic, or historical context. We have applied certain limited procedures to the required supplementary information in accordance with auditing standards generally accepted in the United States of America, which consisted of inquiries of management about the methods of preparing the information and comparing the information for consistency with management’s responses to our inquiries, the basic financial statements, and other knowledge we obtained during our audit of the basic financial statements. We do not express an opinion or provide any assurance on the information because the limited procedures do not provide us with sufficient evidence to express an opinion or provide any assurance.
Supplementary and Other Information
Our audit was conducted for the purpose of forming opinions on the financial statements that collectively comprise the Authority’s basic financial statements. The cost certificates for projects WA00100009009T, WA00100001709R, WA00100003909G, WA19P001501-08, and WA19P001501-09 are presented for purposes of additional analysis and are not a required part of the basic financial statements.
The cost certificates are the responsibility of management and were derived from and relate directly to the underlying accounting and other records used to prepare the basic financial statements. Such information has been subjected to the auditing procedures applied in the audit of the basic financial statements and certain additional procedures, including comparing and reconciling such information directly to the underlying accounting and other records used to prepare the basic financial statements or to the basic financial statements themselves, and other additional procedures in accordance with auditing standards generally accepted in the United States of America. In our opinion, the cost certificates are fairly stated in all material respects in relation to the basic financial statements as a whole.
The introductory and statistical sections are presented for the purposes of additional analysis and are not a required part of the basic financial statements. Such information has not been subjected to the auditing procedures applied in the audit of the basic financial statements, and accordingly, we do not express an opinion or provide any assurance on them.

3
Other Reporting Required by Government Auditing Standards
In accordance with Government Auditing Standards, we have also issued our report dated May 17, 2013 on our consideration of the Authority’s internal control over financial reporting and on our tests of its compliance with certain provisions of laws, regulations, contracts, and grant agreements and other matters. The purpose of that report is to describe the scope of our testing of internal control over financial reporting and compliance and the results of that testing, and not to provide an opinion on internal control over financial reporting or on compliance. That report is an integral part of an audit performed in accordance with Government Auditing Standards in considering the Authority’s internal control over financial reporting and compliance.
Seattle, Washington May 17, 2013

THE HOUSING AUTHORITY OF THE CITY OF SEATTLE, WASHINGTON
Management’s Discussion and Analysis
December 31, 2012
4 (Continued)
Overview of the Financial Statements
The Housing Authority of the City of Seattle, Washington (the Authority) is pleased to present its basic financial statements for the year ended December 31, 2012, which have been prepared in accordance with U.S. generally accepted accounting principles (GAAP). GAAP requires the inclusion of three basic financial statements: the statement of net position (balance sheet); the statement of revenues, expenses, and changes in net position; and the statement of cash flows. In addition, GAAP requires the inclusion of this management’s discussion and analysis (MD&A) section as required supplementary information.
The basic financial statements provide both long-term and short-term information about the Authority’s overall financial condition. The basic financial statements also include notes that explain some of the information in the basic financial statements and provide more detailed data.
As provided for under GAAP, the Authority uses the accrual basis of accounting to prepare its basic financial statements. Under this basis of accounting, revenues are recognized in the period in which they are earned and expenses, including depreciation are recognized in the period in which they are incurred. All assets and liabilities associated with the operation of the Authority are included in the statement of net position.
This section of the Authority’s annual financial report presents our discussion and analysis of the Authority’s financial performance during the year ended December 31, 2012, with comparative data for the year ended December 31, 2011. Please read this section in conjunction with the transmittal letter in the introductory section of this report and the Authority’s basic financial statements, which immediately follow this section.
Financial Highlights
• Assets of the Authority exceeded liabilities at December 31, 2012 by $421.7 million (net position). Of this amount, $213.1 million represents unrestricted net position which includes committed, assigned and unassigned funds that may be used to meet the Authority’s ongoing obligations and to provide an undesignated, unrestricted reserve.
• Total net position increased by $1.9 million or less than 1%.
• The Authority’s current ratio that measures liquidity has increased during the year from 1.52% to 1.73%. This increase was primarily a result of reclassifying $4.2 million of capital assets at High Point and Rainier Vista to the held for sale category and an increase of $5.1 million in cash and cash equivalents, restricted cash, investments, and restricted investments. Also, the Authority is holding $5.5 million of proceeds from the sale of the Porchlight building in restricted investments which will be used to pay off the related bonds in 2013.
• Long-term notes receivable increased from $205.8 million to $211.8 million. The Authority has made loans to other low-income housing providers and to its component units that are redeveloping housing communities under the HOPE VI Redevelopment program and other tax credit projects. The largest

THE HOUSING AUTHORITY OF THE CITY OF SEATTLE, WASHINGTON
Management’s Discussion and Analysis
December 31, 2012
5 (Continued)
change in long-term notes receivable from 2011 to 2012 was a result of additions to loans made to Rainier Vista Northeast LLLP.
• The Authority’s total debt decreased from $147.0 million to $139.5 million during the current reporting period. There most significant reason for the reduction was the payment in the amount of $8.0 million on the infrastructure note with Bank of America. The percentage of total debt to net capital assets increased from 45.6% at December 31, 2011 to 47.9% at December 31, 2012. Although total debt decreased, capital assets also decreased as a result of sales, transfers to the city and reclassification of assets held for sale.
Financial Analysis
Statement of Net Position
The statement of net position presents the assets, deferred inflows, liabilities, deferred outflows and net position of the Authority at the end of the fiscal year. The purpose of the statement of net position is to give the financial statement readers a snapshot of the fiscal condition of the Authority as of a certain point in time. It presents end-of-year data for assets, liabilities, and net position (assets minus liabilities). Also shown is the sum of total liabilities and net position, which equals total assets.
Total assets of the Authority at December 31, 2012 and 2011 amounted to $620.9 million and $629.2 million, respectively. The significant components of current assets are short term investments, receivables from component units, and restricted cash. The noncurrent assets are long term investments, capital assets, receivables from component units, and notes receivable. Capital assets include land, land improvements, leasehold improvements, structures, construction in progress, and equipment. All capital assets except for land and construction in progress are shown net of accumulated depreciation. The principal changes in assets from December 31, 2011 to December 31, 2012 were decreases in capital assets.
Total liabilities of the Authority are $199.1 million and $209.3 million at December 31, 2012 and 2011, respectively. Current liabilities include accounts payable, accrued liabilities, deferred revenue, current portion of long-term debt, and short-term borrowings. Current liabilities have increased slightly. Although there were decreases in accounts payable and deferred revenue, there were increases in short-term borrowings and the current portion of long-term debt that offset the reductions. Noncurrent liabilities are primarily made up of the long-term portion of the notes and bonds payable. Noncurrent liabilities decreased by approximately $10.4 million as a result of decreases in long-term borrowings.
Net position represents the Authority’s equity, a portion of which is restricted for certain uses. Net position is divided into three major categories. The first category, net investment in capital assets represents the Authority’s equity in land, structures, construction in progress, and equipment, net of related capital debt outstanding. The next net position category is restricted for debt service; this shows the amounts reserved to service the debts until they mature. The last category is unrestricted net position; these funds are available to use for any lawful and prudent purpose of the Authority. Unrestricted net position increased by 14.2% during the year from

THE HOUSING AUTHORITY OF THE CITY OF SEATTLE, WASHINGTON
Management’s Discussion and Analysis
December 31, 2012
6 (Continued)
$186.5 million to $213.1 million. This was primarily the result of increases in notes receivable from the component units and decreases in investments in capital assets net of related debt.
Condensed Statement of Net Position
(In thousands)
December 312012 2011
Assets:Current assets, net $ 77,373 67,513 Noncurrent investments and cash 9,691 8,515 Capital assets, net 291,056 322,532 Notes receivable, long term, net 211,839 205,788 Other noncurrent receivables and other 30,913 24,820
Total assets $ 620,872 629,168
Liabilities:Current liabilities $ 44,613 44,405 Noncurrent liabilities 154,513 164,909
Total liabilities 199,126 209,314
Net position:Invested in capital assets, net of related debt 199,274 224,771 Restricted for debt service 9,406 8,544 Unrestricted 213,066 186,539
Total net position 421,746 419,854
Total liabilities and net position $ 620,872 629,168
Statement of Revenues, Expenses, and Changes in Net Position
The purpose of the statement of revenues, expenses, and changes in net position is to present the revenues earned by the Authority, both operating and nonoperating, and the expenses incurred, operating and nonoperating, and any other revenues, expenses, gains, and losses of the Authority. Generally, operating revenues are amounts received for providing housing to the Authority’s tenants as well as subsidies and grants received from the U.S. Department of Housing and Urban Development (HUD) that provide significant funding for the operations of the Authority’s housing programs. Operating expenses are those incurred to maintain the housing units and provide other services for the tenants of the Authority. Nonoperating revenues are revenues earned for which goods and services are not provided, for example, interest income. Capital contributions represent revenues earned from HUD for public housing capital repairs and rehabilitation, Hope VI redevelopment and other capital activities.

THE HOUSING AUTHORITY OF THE CITY OF SEATTLE, WASHINGTON
Management’s Discussion and Analysis
December 31, 2012
7 (Continued)
The condensed statement of revenues, expenses and changes in net position, which follows this section, reflects the year ended December 31, 2012 compared to the year ended December 31, 2011. Overall, operating revenues increased by approximately 1.3% or $2.1 million from 2011 to 2012 and operating expenses decreased by approximately 2.0% or approximately $3.1 million for the year; net nonoperating expenses decreased by 22.3% or approximately $5.0 million; and capital contributions decreased approximately 61.8% or $21.4 million as a result of a decrease in economic stimulus funding from HUD under the American Recovery and Reinvestment Act (ARRA) because nearly all the projects under the grant were completed in 2011. Net position increased in 2012 by approximately $1.9 million. Explanations of principal reasons for these changes follows.
For operating revenues, tenant rentals decreased by $.6 million. Although there were fewer vacancies during the year, tenant revenues have generally decreased due to the economic downturn and reductions in state and federal income support program funding. The decrease of $3.7 million in other revenues was primarily due to a decrease in local government grants of $1.9 million and a decrease in revenue from Impact Property Services, the Authority’s skilled trades and maintenance group that provides services to the Authority’s housing properties, limited partnership and other external properties.
Operating expenses decreased, approximately 2.0%, primarily due to lower maintenance costs. Fewer unit turnovers, staff reductions, and other cost saving measures in our maintenance areas were the primary reasons for the lower maintenance costs.
Net nonoperating expenses decreased by approximately $5.0 million during the year. The decrease was mainly a result of higher asset dispositions in the prior year. In 2012, dispositions were comprised of $10.3 million related to transferring infrastructure costs to the City of Seattle (City) related to the Hope VI redevelopment projects including Rainier Vista, New Holly and High Point with the largest portion related to redevelopment at Rainier Vista and approximately $2.0 million related to the sales of the Porchlight building, Coach House and Keystone properties.
Capital contributions for the year ended December 31, 2012 were made up of $.4 million from Hope VI redevelopment grants and $12.9 million from HUD capital grants. Of the capital grants, $.5 million was from ARRA funding. The net result is that the Authority added $1.9 million to net position for the year ended December 31, 2012.

THE HOUSING AUTHORITY OF THE CITY OF SEATTLE, WASHINGTON
Management’s Discussion and Analysis
December 31, 2012
8 (Continued)
Statement of Revenues, Expenses, and Changes in Net Position
(In thousands)
Year ended December 312012 2011
Operating revenues:Tenant rentals $ 20,690 21,338 Housing assistance payment subsidies 105,422 95,646 Operating subsidies and grants 19,523 22,814 Other 18,081 21,763
Total operating revenues 163,716 161,561
Operating expenses:Housing operations and administration 41,664 43,986 Tenant services 3,603 3,938 Utility services 5,394 4,999 Maintenance 15,082 18,824 Housing assistance payments 79,478 76,943 Other 2,022 1,319 Depreciation and amortization 10,328 10,676
Total operating expenses 157,571 160,685
Operating income (loss) 6,145 876
Nonoperating revenues (expenses):Interest expense (5,722) (6,888) Interest income 1,397 1,537 Change in fair value of investments (75) 69 Loss on notes receivable written off — (479) Loss on investment in limited partnerships (760) (1) Disposition of assets (12,343) (16,774)
Net nonoperating expenses (17,503) (22,536)
Change in net position before capital contributions (11,358) (21,660)
Capital contributions 13,250 34,675
Change in net position 1,892 13,015
Net position, beginning of year 419,854 406,839
Net position, end of year $ 421,746 419,854
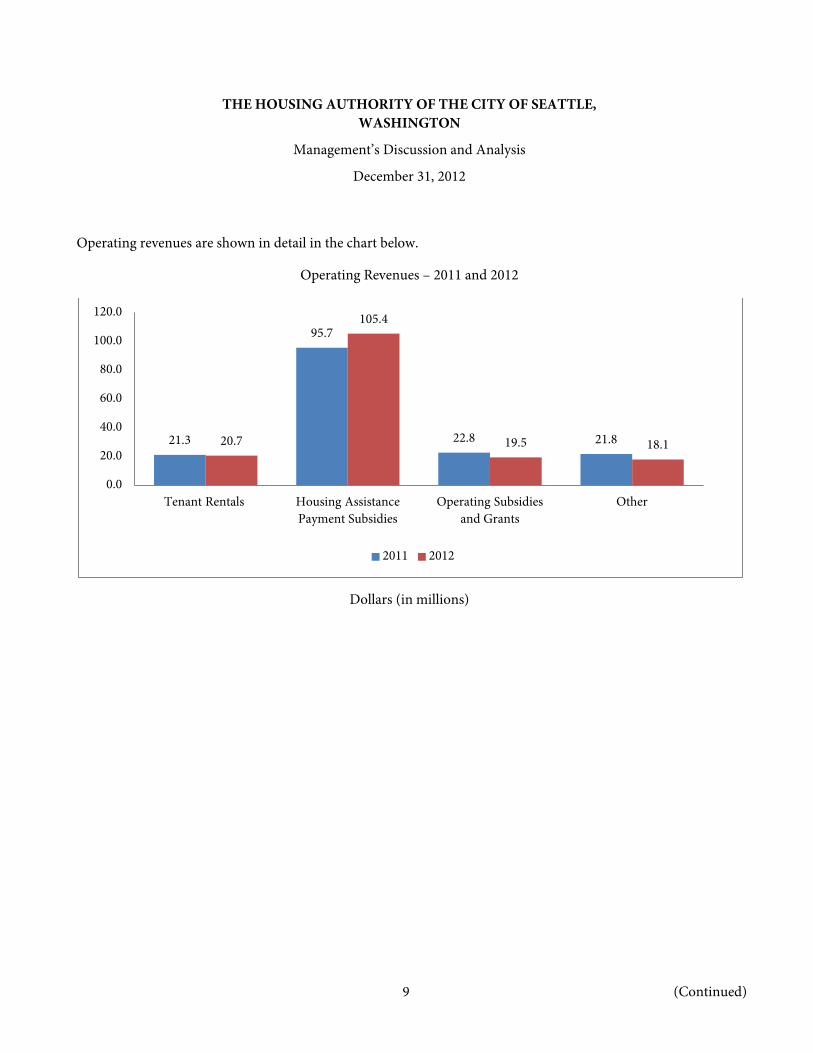
THE HOUSING AUTHORITY OF THE CITY OF SEATTLE, WASHINGTON
Management’s Discussion and Analysis
December 31, 2012
9 (Continued)
Operating revenues are shown in detail in the chart below.
Operating Revenues – 2011 and 2012
Dollars (in millions)
21.3
95.7
22.8 21.8 20.7
105.4
19.5 18.1
0.0
20.0
40.0
60.0
80.0
100.0
120.0
Tenant Rentals Housing Assistance Payment Subsidies
Operating Subsidies and Grants
Other
2011 2012

THE HOUSING AUTHORITY OF THE CITY OF SEATTLE, WASHINGTON
Management’s Discussion and Analysis
December 31, 2012
10 (Continued)
Operating expenses are shown in detail in the chart below:
Operating Expenses – 2011 and 2012
Dollars (in millions)
Capital Asset and Debt Administration
The Authority reduced capital assets during the year ended December 31, 2012 by $31.5 million. Although there were increases in construction in progress related to development projects, there were also reductions of approximately $45.9 million. The major decreases in construction in progress were a result of transfers of land improvements amounting to $17.6 million; transfers of infrastructure to the City related to the Rainier Vista redevelopment project of $8.4 million; soft cost expenses of $3.6 million; as well as other transfers to structures and sales of property held for sale. In addition, $10.2 million of land improvements for the Rainier Vista and Highpoint developments were classified as held for sale. The decrease in structures was due primarily to the sale of the Porchlight Building in August as well as the sale of Keystone and Coach House buildings.
10.7
1.3
76.9
18.8
5.0 4.0
44.0
10.3
2.0
79.5
15.1
5.4 3.6
41.7
0
20
40
60
80
100
Depreciation and
Amortization
Other Housing Assistance Payments
Maintenance Utility Services
Tenant Services Housing Operations and Administration
2011 2012

THE HOUSING AUTHORITY OF THE CITY OF SEATTLE, WASHINGTON
Management’s Discussion and Analysis
December 31, 2012
11 (Continued)
The table below shows the Authority’s capital assets, net of accumulated depreciation, at December 31, 2012 and December 31, 2011 (in thousands).
2012 2011
Land $ 65,386 70,372 Land improvements 40,933 34,569 Structures 175,804 183,538 Leasehold improvements 531 466 Equipment 1,795 1,866 Construction in progress 6,608 31,721
Total capital assets, net $ 291,057 322,532
Note 5 to the Authority’s basic financial statements provide additional detail regarding the changes in capital assets during the fiscal year.
Total debt outstanding decreased from 2011 to 2012 by $7.4 million. The Authority increased short-term borrowings by $.8 million. The decrease of $5.6 million in notes payable reflects a decrease of $8.0 million in the Authority’s infrastructure note, offset by additional borrowing for Senior housing rehabilitation projects.
2012 2011
Short-term borrowings $ 12,828 12,077 Notes payable 49,565 55,222 Bonds payable 77,128 79,676
Total debt outstanding $ 139,521 146,975
Notes 6 and 7 to the Authority’s basic financial statements provide additional detail regarding the debt changes during the fiscal year.
Federal Funding Support to the Authority
Federal appropriation levels for HUD programs, such as Section 8 Housing Choice Voucher Program and Public Housing Operating Subsidies, and the various capital programs continue to have a major impact on the Authority’s budget. Federal housing dollars make up the largest source of revenue for the Authority. During 2012, the Authority earned $124.9 million in federal dollars for its operating programs and $13.3 million for its capital projects. In addition, federal financial support from HUD has been an important source of seed money and leverage funding for acquiring or developing a majority of the Authority’s $291.1 million of capital assets as of December 31, 2012. In the redevelopment of the Authority’s family communities as mixed-income communities at New Holly, High Point, Rainier Vista, and Lake City Court and in the rehabilitation of twenty-two of the agency’s twenty-four public housing high rises, success has relied on public: private mixed

THE HOUSING AUTHORITY OF THE CITY OF SEATTLE, WASHINGTON
Management’s Discussion and Analysis
December 31, 2012
12 (Continued)
financings. The mixed-financings at these properties have used federal HOPE VI funds, ARRA funds, Public Housing capital grant funds, and other competitive awards of federal capital funds to leverage tax credit partnership equity, grants from State and local government, equity contributions from the Authority, and proceeds from sale of land, and bonds to complete these projects.
The federal government has been a principal source of funds for low-income housing operations, maintenance and capital since the enactment of the National Housing Act of 1937. While the level of federal support of public housing has ebbed and flowed with different administrations over the decades, the record of federal financial support for low-income housing is unbroken since the Act.
In 2011, Congress began a shift in focus from stimulating the economy in order to spur recovery from the Great Recession to concern over the level of the federal deficit and national debt. As a result, the Budget Control Act of 2011 implemented a budget reduction plan to cut federal spending on discretionary nondefense programs by $1.0 trillion for 2012-2021. This resulted in significant reductions to federal funds for the 2012 Housing and Urban Development Budget for Public Housing Operating and Capital fund allocations and static funding for the Housing Choice Voucher (HCV) program, except for honoring conversion of tenant protection vouchers to HCV after a year. The Budget Control Act also set the stage for continuing deficit reduction measures by providing for processes to achieve an additional $1.2 trillion in deficit reduction over ten years, either through a proposed plan by a bipartisan Congressional Committee – the “Super Committee” – or failing that, by automatic across the board spending reductions shared equally by defense and nondefense agencies and between discretionary and mandatory spending for those agencies.
Congressional actions, with the acquiescence of the President, set the stage for significant long-term reductions in federal support for a whole spectrum of discretionary programs from space exploration to air traffic control, to health and human services, to farm support, to environmental protection, to transportation and housing and urban development. The Authority has responded by implementing changes designed to reduce costs with the least adverse effects on service and while maintaining housing for existing residents and voucher participants, and when possible serving more low income people.
So, for the 2012 CY Budget for the Authority, the agency implemented several measures to reduce staffing by changing business practices to realize efficiencies while minimizing reductions in service. And we have continued that planning during 2012 to add reorganization and business practice changes to help us reduce staffing costs further through cost savings changes in our practices. As a result, the Authority reduced staffing positions in the 2012 and 2013 budgets that cut our staff positions by nearly 18% or by 106 full-time equivalent positions over those two years. As a result of the actions the agency has taken in 2012 and 2013 budgets, the Authority is positioned to weather 2013 without further capacity reductions.

THE HOUSING AUTHORITY OF THE CITY OF SEATTLE, WASHINGTON
Management’s Discussion and Analysis
December 31, 2012
13
Local Housing Market
Since the Seattle Housing Authority is a developer of low income housing, as well as a landlord that operates and maintains the housing, the local housing market affects the Authority’s ability to meet goals for creating mixed income communities by partnering with private developers to build for sale and rental units at market rate levels. The long-term prospects for the housing market are strong in Seattle and for Authority properties; thus, our challenge continues to be one of timing. The Authority is nearing completion of our redevelopment commitments in Rainier Vista and High Point and our new development at Lake City Village. As the recovery of the housing market strengthens, we expect to complete sale of properties for market rate housing development in these mixed income communities over the next three years.
The Authority has begun implementing the first phase of redevelopment at the last of the agency’s “garden communities,” Yesler Terrace. In 2012, the Authority completed master planning, adopted a development plan, and submitted all materials for land use entitlements to the City of Seattle planning agency and began secured City authorizations for the land use and zoning approvals needed for the project master plan. The Authority also secured a HUD commitment for one of the inaugural six competitive grants under the new Choice Neighborhoods Initiative (CNI) program in 2011 and a second CNI grant in 2012 for phase two of the redevelopment, totaling federal support of approximately $27 million. In early 2012, the agency began architectural design work on the first phase of the redevelopment with 118 low-income units of new construction and 18 units in rehabilitation of an existing building in the neighborhood. Construction work on phase one projects will begin in 2013 and design will start on phase two projects in 2013.
Request for Information
This financial report is designed to provide a general overview of the Authority’s finances for all those interested. Questions concerning any of the information presented in this report or requests for additional information should be addressed to Janet Hayes, Controller, 190 Queen Anne Ave North, Seattle, WA 98109.

14
This page intentionally left blank

BASIC FINANCIAL STATEMENTS

16 (Continued)
Exhibit A-1THE HOUSING AUTHORITY OF THE CITY OF SEATTLE,
WASHINGTONStatement of Net Position
December 31, 2012
Primary ComponentAssets government units
Current assets:Cash and cash equivalents $ 7,286,569 3,169,405 Restricted cash 8,787,203 15,803,996 Investments 41,563,517 — Accounts receivable:
Tenant rentals and service charges 697,976 623,958 Other 933,551 57,911
Due from:Other governments 1,191,851 — Primary government — 370,331 Component units 4,487,464 —
Inventory and prepaid items 556,957 813,708 Restricted investments 5,537,200 — Deferred charges 931,801 4,890,041 Notes receivable 204,887 — Notes receivable from component units 983,897 — Assets held for sale 4,189,732 — Other 20,478 —
Total current assets 77,373,083 25,729,350
Noncurrent assets:Investments 3,004,153 — Cash restricted for long-term purpose 585,001 — Restricted investments 6,102,219 899,621 Due from component units, net of allowance 22,922,547 — Assets held for sale 6,478,559 — Other 1,511,015 35,244
Capital assets:Land 65,386,393 5,099,274 Land improvements 43,597,675 20,544,250 Leasehold improvements 897,974 — Structures 372,495,735 377,660,978 Equipment 16,242,205 8,494,533 Construction in progress 6,607,896 1,776,305 Less accumulated depreciation (214,171,394) (66,435,943)
Capital assets, net 291,056,484 347,139,397
Notes receivable (net of allowance of $519,553) 14,058,094 — Notes receivable from component units (net of allowance and
excess loss on investment of $1,675,000 and $2,265,645) 197,781,274 —
Total noncurrent assets 543,499,346 348,074,262
Total assets $ 620,872,429 373,803,612
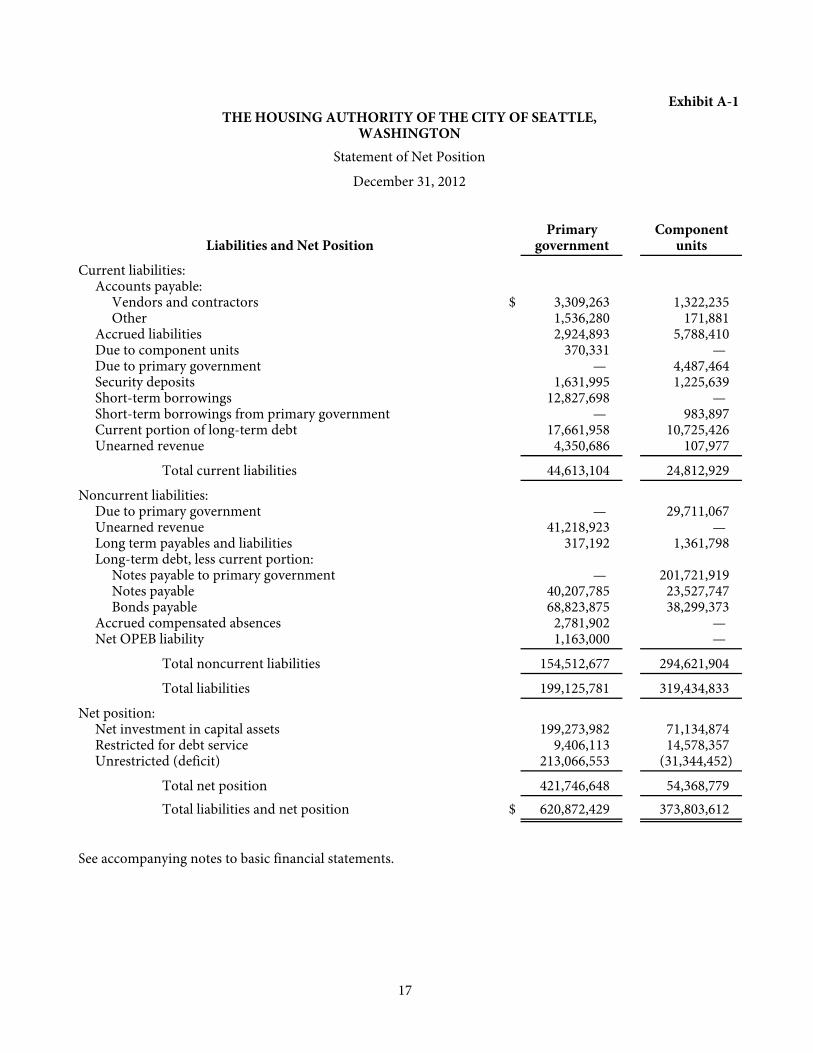
17
Exhibit A-1THE HOUSING AUTHORITY OF THE CITY OF SEATTLE,
WASHINGTONStatement of Net Position
December 31, 2012
Primary ComponentLiabilities and Net Position government units
Current liabilities:Accounts payable:
Vendors and contractors $ 3,309,263 1,322,235 Other 1,536,280 171,881
Accrued liabilities 2,924,893 5,788,410 Due to component units 370,331 — Due to primary government — 4,487,464 Security deposits 1,631,995 1,225,639 Short-term borrowings 12,827,698 — Short-term borrowings from primary government — 983,897 Current portion of long-term debt 17,661,958 10,725,426 Unearned revenue 4,350,686 107,977
Total current liabilities 44,613,104 24,812,929
Noncurrent liabilities:Due to primary government — 29,711,067 Unearned revenue 41,218,923 — Long term payables and liabilities 317,192 1,361,798 Long-term debt, less current portion:
Notes payable to primary government — 201,721,919 Notes payable 40,207,785 23,527,747 Bonds payable 68,823,875 38,299,373
Accrued compensated absences 2,781,902 — Net OPEB liability 1,163,000 —
Total noncurrent liabilities 154,512,677 294,621,904
Total liabilities 199,125,781 319,434,833
Net position:Net investment in capital assets 199,273,982 71,134,874 Restricted for debt service 9,406,113 14,578,357 Unrestricted (deficit) 213,066,553 (31,344,452)
Total net position 421,746,648 54,368,779
Total liabilities and net position $ 620,872,429 373,803,612
See accompanying notes to basic financial statements.

18
Exhibit A-2THE HOUSING AUTHORITY OF THE CITY OF SEATTLE,
WASHINGTONStatement of Revenues, Expenses, and Changes in Net Position
Year ended December 31, 2012
Primary Componentgovernment units
Operating revenues:Tenant rentals $ 20,690,177 22,973,639 Housing assistance payment subsidies 105,422,182 — Operating subsidies and grants 19,522,792 — Other 18,081,083 1,166,388
Total operating revenues 163,716,234 24,140,027
Operating expenses:Housing operations and administration 41,664,544 8,516,233 Tenant services 3,602,554 — Utility services 5,393,684 3,000,934 Maintenance 15,081,988 5,327,065 Housing assistance payments 79,478,249 — Other 2,021,796 3,001,647 Depreciation and amortization 10,327,767 11,981,958
Total operating expenses 157,570,582 31,827,837
Operating income (loss) 6,145,652 (7,687,810)
Nonoperating revenues (expenses):Interest expense (5,721,825) (7,281,627) Interest income 1,397,221 62,265 Change in fair value of investments (74,996) 57,396 Loss on investment in limited partnerships (760,305) — Disposition of assets (12,343,242) —
Net nonoperating expenses (17,503,147) (7,161,966)
Change in net position before contributions (11,357,495) (14,849,776)
Contributions:Capital contributions 13,249,971 — Partners’ contributions — 5,242,868
Total contributions 13,249,971 5,242,868
Change in net position 1,892,476 (9,606,908)
Total net position at beginning of year 419,854,172 63,975,687
Total net position at end of year $ 421,746,648 54,368,779
See accompanying notes to basic financial statements.

19
Exhibit A-3THE HOUSING AUTHORITY OF THE CITY OF SEATTLE,
WASHINGTONStatement of Cash Flows
Year ended December 31, 2012
Primarygovernment
Cash flows from operating activities:Receipts from residents $ 20,973,772 Receipts from other sources 18,300,338 Operating grants and subsidies received 123,077,254 Payments to vendors (52,439,617) Housing assistance payments (79,478,249) Payments to employees (15,708,522)
Net cash provided by operating activities 14,724,976
Cash flows from capital and related financing activities:Capital contributions 14,359,523 Acquisition and construction of capital assets (22,556,145) Proceeds from dispositions of property and equipment 19,995,277 Proceeds from short-term borrowings 1,850,274 Proceeds from long-term borrowings 6,658,218 Payments on notes and bonds (15,961,748) Interest payments (5,721,825)
Net cash used in capital and related financing activities (1,376,426)
Cash flows from investing activities:Interest received 313,742 Maturity of investment securities 45,149,924 Purchases of investment securities (49,947,975) Receipt on notes receivable 871,924 Issuance of notes receivable (8,220,411)
Net cash used in investing activities (11,832,796)
Increase in cash and cash equivalents 1,515,754
Cash and cash equivalents at beginning of year 15,143,019 Cash and cash equivalents at end of year $ 16,658,773
Reconciliation of operating income to net cash provided by operating activities:Operating income $ 6,145,652 Adjustments to reconcile operating income to net cash provided by operating activities:
Depreciation and amortization 10,327,767 Changes in assets and liabilities:
Accounts receivable and other assets 107,239 Inventory and prepaid items 112,031 Accounts payable and other liabilities (228,600) Accrued compensated absences (141,901) Deferred revenue and other (1,597,212)
Total adjustments 8,579,324 Net cash provided by operating activities $ 14,724,976
Supplemental disclosure of noncash activities:Disposition of assets $ (12,343,242) Transfer of assets held for sale from capital assets 10,668,291
See accompanying notes to basic financial statements.

THE HOUSING AUTHORITY OF THE CITY OF SEATTLE, WASHINGTON
Notes to Basic Financial Statements
December 31, 2012
20 (Continued)
(1) Summary of Significant Accounting Policies
(a) Organization and Program Descriptions
The Housing Authority of the City of Seattle, Washington (the Authority) was created in 1939 as a municipal corporation that derives its powers from Washington State (State) Law RCW 35.82. The Authority was created for the acquisition, development, modernization, operation, and administration of public housing programs. The primary purpose of the Authority is to provide safe, decent, sanitary, and affordable housing to low-income and elderly families in Seattle, Washington, and to operate its housing programs in accordance with federal and State laws and regulations. The Authority’s programs are administered through the U.S. Department of Housing and Urban Development (HUD) under provisions of the U.S. Housing Act of 1937, as amended.
The Authority, recognized by HUD as a high-performing, large housing authority, was selected to participate in HUD’s Moving to Work (MTW) Demonstration Program effective January 13, 1999. The program allows the Authority an exemption from a multitude of HUD regulations and reporting requirements, and significant flexibility to combine its HUD funding for reallocation among the Authority’s administrative, capital, and development activities.
The Authority presents its activities as a single enterprise proprietary fund and its primary operations comprised a number of housing and grant programs as follows:
The Public Housing Program – operates under HUD’s Annual Contributions Contract (ACC) SF-151 and consists of the operations of low-rent public housing properties totaling 6,335 units which includes 894 units of senior housing under (see below). The purpose of the program is to provide decent and affordable housing to low-income families at reduced rents. The properties are owned, maintained, and managed by the Authority. The properties are acquired, developed, and modernized under HUD’s Capital Funds Program and through HUD Hope VI Urban Revitalization grants. Financing for the properties is obtained through bond issues and grants. Funding of the program is provided by federal annual contributions and operating subsidies and tenant rentals (determined as a percentage of family income, adjusted for family composition).
The Seattle Senior Housing Program (SSHP) – operates 994 units acquired and developed under a 1981 City of Seattle (City) bond issue. The purpose of this program is to provide low rent housing for the elderly, handicapped, and disabled. Funding for the management and operation of these nonsubsidized housing units is provided exclusively from rental income. During 2011, the Authority received approval from HUD and from the City to include 894 of the SSHP units in the Public Housing program. This change took effect January 1, 2012.
The Section 8 Program – consists of several Section 8 housing programs including the Section 8 Housing Choice Voucher program, the Section 8 New Construction and Substantial

THE HOUSING AUTHORITY OF THE CITY OF SEATTLE, WASHINGTON
Notes to Basic Financial Statements
December 31, 2012
21 (Continued)
Rehabilitation program, and the Moderate Rehabilitation program. The Housing Choice Voucher program provides rental housing assistance subsidies in support of 9,668 housing units. The purpose of the program is to provide decent and affordable housing to low-income families and elderly and handicapped persons wherein rental assistance is provided by HUD. The associated units are maintained and managed by private landlords.
The purpose of the Section 8 New Construction and Substantial Rehabilitation program is to construct or purchase and rehabilitate rental housing units to provide decent and affordable housing to low-income, elderly, and handicapped individuals whereby rental assistance is provided by HUD. Funding of the program is provided by federal housing assistance contributions and tenant rentals. The Authority owns two housing developments totaling 130 units.
The Section 8 Moderate Rehabilitation program operates under HUD’s ACC S-0068K and consists of the operations of 759 privately owned family housing units. The purpose of the program is to rehabilitate substandard rental housing units and provide decent and affordable housing to low-income families whereby rental assistance is provided by HUD. The associated developments are maintained and managed by private landlords. Funding of the program is provided by federal housing assistance contributions.
Other Housing Programs – operates 876 units of low-income housing. These projects are financed primarily through bond issues and receive no external funding. On-site management for these units may be done by the Authority or contracted with other management companies. In addition, the Authority also has 596 nonpublic housing units within the HOPE VI redeveloped communities.
The basic financial statements of the Authority have been prepared in conformity with U.S. generally accepted accounting principles (GAAP) as applied to governmental units. The Governmental Accounting Standards Board (GASB) is the accepted standard-setting body for establishing governmental accounting and financial reporting principles. Significant accounting policies are described below.
(b) Reporting Entity
The governing body of the Authority is its Board of Commissioners (Board), comprising seven members appointed by the Mayor of the City. The Authority is not financially dependent on the City and is not considered a component unit of the City.
As defined by GAAP, the reporting entity consists of the primary government, as well as its component units, which are legally separate organizations for which the elected officials of the primary government are financially accountable. Financial accountability is defined as appointment

THE HOUSING AUTHORITY OF THE CITY OF SEATTLE, WASHINGTON
Notes to Basic Financial Statements
December 31, 2012
22 (Continued)
of a voting majority of the component units’ board, and either (a) the ability to impose will by the primary government, or (b) the possibility that the component unit will provide a financial benefit to or impose a financial burden on the primary government, or (c) the component unit is financially dependent on the primary government.
Component units are reported as part of the reporting entity under either the blended or discrete method of presentation. Blending involves merging the component unit data and data with the primary government. The discrete method presents the financial statements of the component unit outside of the basic financial statement totals of the primary government. There are two situations where blending is allowed: (1) when the board of the component unit is substantially the same as that of the primary government, and (2) when the component unit serves the primary government exclusively, or almost exclusively.
The Authority is the 0.01% owner and the general partner in 17 real estate limited partnerships as of December 31, 2012. The limited partnership interests are held by third parties unrelated to the Authority. As the general partner, the Authority has certain rights and responsibilities, which enable it to impose its will on the limited partnerships. The Authority is financially accountable for the limited partnerships as they are fiscally dependent on the Authority according to the terms of the partnership agreements. Additionally, in some cases, the Authority is legally obligated to fund operating deficits. The Authority also has outstanding loans and net advances to the limited partnerships amounting to approximately $226 million at December 31, 2012. The limited partnerships do not serve the primary government exclusively, or almost exclusively, and therefore, are shown as discretely presented component units.
The 17 component units are: the Ravenna School Limited Partnership (RSLP), the Othello Street Limited Partnership (OSLP), Desdemona Limited Partnership (DLP), the Escallonia Limited Partnership (ELP), the High Point North Limited Partnership (HPNLP), the High Point South Limited Partnership (HPSLP), the Ritz Apartments Limited Partnership (RALP), the Alder Crest Limited Partnership (ACLP), the High Rise Rehabilitation Phase I Limited Partnership (HRRILP), the Seattle High Rise Phase II Limited Partnership (SHRIILP), Seattle High Rise Phase III Limited Partnership (SHRIIILP), Douglas Apartments Limited Partnership (DALP), Tamarack Place Limited Partnership (TPLP), Lake City Village Limited Liability Limited Partnership (LCVLLLP), Rainier Vista Northeast Limited Liability Limited Partnership (RVNLLLP), Leschi House LLLP (LHLLLP) and 1105 E Fir LLLP (EFLLLP).
The RSLP is a separate legal entity formed in 1998 to take advantage of low-income housing tax credits needed to finance the planned rehabilitation of the Ravenna School Apartments. The 39-unit apartment complex, owned by the Authority under its Senior Housing Program, has been leased to RSLP for a nominal amount under a 99-year operating lease. The Authority is the 0.01% general partner of the RSLP and also serves as developer of the $1.5 million rehabilitation project. In
THE HOUSING AUTHORITY OF THE CITY OF SEATTLE, WASHINGTON
Notes to Basic Financial Statements
December 31, 2012
23 (Continued)
addition, the Authority will continue to serve as property manager of the Ravenna School Apartments. In July 1999, a tax credit investor was formally admitted as a limited partner to the RSLP. The project was completed during fiscal year 2000. The Authority is the 0.01% general partner and is obligated to fund operating deficits by contributing or loaning funds to the partnership.
The OSLP is a separate legal entity created on September 9, 1999 to undertake phase two of the redevelopment activities at the Holly Park community. Development activities are completed and the OSLP will continue to operate and manage the rental units. The Authority participates as the 0.01% managing general partner of the OSLP. During fiscal year 2000, a tax credit investor was admitted to the partnership as a 99.99% limited partner. The Authority has leased the land for phase two of the Holly Park redevelopment project to the OSLP for a nominal amount under a noncancelable operating lease. The Authority is the 0.01% general partner of the OSLP and is obligated to fund an operating deficit up to $250,000.
The DLP is a separate legal entity created on May 10, 2002 to undertake phase three of the redevelopment activities at the Holly Park community. Development activities are completed and the DLP will continue to operate and manage the rental units. The Authority has leased the land for phase three of the Holly Park redevelopment project to the DLP for a nominal amount under a noncancelable operating lease. The Authority is the 0.01% general partner of the DLP and is obligated to fund an operating deficit without limitation as to amount. As of December 31, 2012, the DLP owed the Authority for developer fees in the amount of $2,319,517.
The ELP is a separate legal entity created on May 10, 2002 to undertake phase one of the redevelopment activities at the Rainier Vista community. Development activities are complete and the ELP will continue to operate and manage the rental units. The Authority participates as the 0.01% managing general partner of the ELP. The Authority has leased the land for phase one of the Rainier Vista redevelopment project to the ELP for a nominal amount under a noncancelable operating lease. As of December 31, 2012, the ELP owed the Authority for developer fees in the amount of $485,418.
The HPNLP is a separate legal entity created on October 31, 2003 to undertake phase one of the redevelopment activities at the High Point community. The Authority participates as the 0.01% managing general partner of the HPNLP. The Authority has leased the land for phase one of the High Point redevelopment project to the HPNLP for a nominal amount under a noncancelable operating lease. The Authority is obligated to fund operating or other cash shortfalls of the partnership. The amount the Authority is obligated to fund is unlimited prior to the project’s stabilization date as defined in the limited partnership agreement, and is limited to $1,200,000 after the project’s stabilization date. The amount is further limited to $750,000 after 10 consecutive years of the partnership’s operating subsidy being fully funded. As of December 31, 2012, the HPNLP owed the Authority developer fees in the amount of $1,843,575.

THE HOUSING AUTHORITY OF THE CITY OF SEATTLE, WASHINGTON
Notes to Basic Financial Statements
December 31, 2012
24 (Continued)
The HPSLP is a separate legal entity created on July 12, 2007 to undertake phase two of the redevelopment activities at the High Point community. The Authority participates as the 0.01% managing general partner of the HPSLP. The Authority has leased the land for phase two of the High Point redevelopment project to the HPSLP for a nominal amount under a noncancelable operating lease. The Authority is obligated to fund operating or other cash shortfalls of the partnership. As of December 31, 2012, the HPSLP owed the Authority $2,323,068 for developer fees.
The RALP is a separate legal entity created on August 12, 2004 to undertake rehabilitation of the Ritz Apartments. During fiscal year 2005, the RALP admitted a tax credit investor to the partnership as a 99.99% limited partner. The Authority participates as the 0.01% managing general partner of the RALP. The partnership agreement does not specify the obligation of the general partner in regards to funding operating shortfalls. As of December 31, 2012, the RALP owed the Authority $170,515 for developer fees.
The ACLP is a separate legal entity created on January 1, 2005 to undertake rehabilitation of the Alder Crest Apartments. The ACLP admitted a tax credit investor to the partnership as a 99.99% limited partner. The Authority participates as the 0.01% managing general partner of the ACLP. The Authority has leased the building to ACLP. As of December 31, 2012, the ACLP owed the Authority oversight developer fees amounting to $39,748.
The HRRILP is a separate legal entity created on July 26, 2005 to undertake phase one of a three-phase rehabilitation of 21 public housing high-rise buildings owned by the Authority. Each phase of the project will cover seven buildings, which are leased to the component unit. The Authority participates as the 0.01% managing partner. As of December 31, 2012, the HRRILP has no outstanding developer fee payable to the Authority.
The SHRIILP is a separate legal entity created on August 11, 2006 to undertake phase two of the three-phase rehabilitation of 21 public housing high-rise buildings owned by the Authority. Phase two also covers seven buildings, which are leased to the component unit. The Authority participates as the 0.01% managing partner. As of December 31, 2012, the SHRIILP has no outstanding developer fee payable to the Authority.
The SHRIIILP is a separate legal entity created on September 13, 2007 to undertake phase three of the three-phase rehabilitation of 21 public housing high-rise buildings owned by the Authority. Phase three also covers seven buildings, which are leased to the component unit. The Authority participates as the 0.01% managing partner. As of December 31, 2012, the SHRIIILP has no outstanding developer fee payable to the Authority.
The DALP is a separate legal entity created on September 17, 2007 to undertake rehabilitation of the Douglas Apartments, which were purchased by the Authority during the year. The DALP admitted a tax credit investor to the partnership as a 99.99% limited partner. The Authority participates as the

THE HOUSING AUTHORITY OF THE CITY OF SEATTLE, WASHINGTON
Notes to Basic Financial Statements
December 31, 2012
25 (Continued)
0.01% managing general partner of the DALP. As of December 31, 2012, the DALP owed the Authority developer fees in the amount of $283,146.
The TPLP is a separate legal entity created on October 15, 2008 to undertake phase two of the redevelopment activities at the Rainier Vista community. During 2010, the TPLP has admitted a tax credit investor to the partnership as a 99.99% limited partner. The Authority participates as the 0.01% managing general partner of the TPLP. As of December 31, 2012, TPLP owed the Authority developer fees in the amount of $315,378.
The LCVLLLP is a separate legal entity created on December 3, 2009 to undertake redevelopment activities at the site formerly occupied by Lake City Village which was demolished in 2002 due to severe flooding damage to the housing units. During 2010, the LCVLLLP admitted a tax credit investor to the partnership as a 99.99% limited partner. The Authority participates as the 0.01% managing general partner of the LCVLLLP. As of December 31, 2012, LCVLLLP owed the Authority developer fees in the amount of $834,446.
The RVNLLLP is a separate legal entity created on January 29, 2010 to undertake phase three of the redevelopment activities at the Rainier Vista Community. During 2010, the RVNLLLP has admitted a tax credit investor to the partnership as a 99.99% limited partner. The Authority participates as the 0.01% managing general partner of the RVNLLLP. As of December 31, 2012, RVNLLLP owed the Authority developer fees in the amount of $240,000.
The LHLLLP is a separate legal entity created on October 8, 2012 to undertake the redevelopment of Leschi House, a property in the Senior Housing portfolio. The LHLLLP has not yet admitted a tax credit investor to the partnership. The Authority plans to participate as the 0.01% managing general partner of the LHLLLP.
The EFLLLP is a separate legal entity created on October 23, 2012 to undertake the first phase of the redevelopment of Yesler Terrace. The EFLLLP has not yet admitted a tax credit investor to the partnership. The Authority plans to participate as the 0.01% managing general partner of the EFLLLP.
All 17 component units have a December 31 year-end. The component units’ financial statements are presented as of December 31, 2012 and may be obtained by contacting the Authority.
(c) New Accounting Standards Adopted
Governmental Accounting Standards Board (GASB) Statement No. 62, Codification of Accounting and Financial Reporting Guidance Contained in Pre-November 30, 1989 FASB and AICPA Pronouncements, incorporates into the GASB’s authoritative literature certain accounting and financial reporting guidance that is included in Financial Accounting Standards Board (FASB) Statements and Interpretations, Accounting Principles Board Opinions, and Accounting Research

THE HOUSING AUTHORITY OF THE CITY OF SEATTLE, WASHINGTON
Notes to Basic Financial Statements
December 31, 2012
26 (Continued)
Bulletins of the AICPA Committee on Accounting Procedures which does not conflict with or contradict other GASB pronouncements. The provisions of this Statement are effective for financial statements for periods beginning after December 15, 2011. GASB Statement No. 63, Financial Reporting of Deferred Outflows of Resources, Deferred Inflows of Resources, and Net Position, provides financial reporting guidance for deferred outflows of resources and deferred inflows of resources. The provisions of this Statement are effective for financial statements for periods beginning after December 15, 2011. As of January 1, 2012, the Authority adopted the above GASB standards, which did not have a significant impact to its financial statements.
(d) New Accounting Standard to be Adopted in Future Years
GASB Statement No. 61, The Financial Reporting Entity: Omnibus – an amendment of GASB Statements No. 14 and No. 34, addresses reporting entity issues that have arisen since the issuance of those statements. The provisions of this Statement are effective for financial statements for periods beginning after June 15, 2012. GASB Statement No. 66, Technical Corrections 2012 – an amendment of GASB Statements No. 10 and No. 62, resolves conflicting guidance that resulted from previously published GASB statements. The provisions of this Statement are effective for financial statements for periods beginning after December 15, 2012. GASB Statement No. 65, Items Previously Reported as Assets and Liabilities, establishes accounting and financial reporting standards that reclassify, as deferred outflows of resources or deferred inflows of resources, certain items that were previously reported as assets and liabilities and recognizes, as outflows of resources or inflows of resources, certain items that were previously reported as assets and liabilities. The requirements of this Statement are effective for periods beginning after December 15, 2012. GASB Statement No. 68, Financial Reporting for Pensions – an amendment of GASB No. 27, improves accounting and financial reporting by state and local governments for pensions. It also improves information provided by state and local governmental employers about financial support for pensions that is provided by other entities. This Statement results from a comprehensive review of the effectiveness of existing standards of accounting and financial reporting for pensions with regard to providing decision-useful information, supporting assessments of accountability and interperiod, equity and creating additional transparency. The requirements of this Statement are effective for periods beginning after June 15, 2014. The Authority will evaluate these new standards and determine to what extent they will have an impact on the Authority.
(e) Basis of Accounting
The financial statements of the Authority are reported using the economic resources measurement focus and the accrual basis of accounting, whereby all revenues are recorded when earned and expenses are recorded when a liability is incurred, regardless of the timing of related cash flows. Depreciation and amortization of assets is recognized in the statement of revenues, expenses, and changes in net position. All assets, deferred inflows, liabilities and deferred outflows associated with the operation of the Authority are included in the statement of net position. The principal operating

THE HOUSING AUTHORITY OF THE CITY OF SEATTLE, WASHINGTON
Notes to Basic Financial Statements
December 31, 2012
27 (Continued)
revenues of the Authority are rental revenues received from residents and subsidies received from HUD for qualified residents for housing assistance payments in the Section 8 program and for operations in the public housing program. Grants and similar items are recognized as operating revenue when all eligibility requirements have been met. Gains from sale of capital assets used in the core operations of the Authority are included in operating revenues – other. Operating expenses for the Authority include the costs of operating housing units, administrative expenses, depreciation and loss from sale of capital assets. All other revenues and expenses not meeting the definition of revenues and expenses are reported as nonoperating revenues and expenses or as contributions of capital.
The Authority reports unearned revenue on its statement of net position. Unearned revenues arise when potential revenue has not been earned in the current period. Unearned revenues also arise when resources are received by the Authority before it has a legal claim to them, as when grant moneys are received prior to meeting all eligibility requirements and/or the occurrence of qualifying expenditures. In subsequent periods, when both the revenue recognition criteria are met or when the Authority has a legal claim to the resources, the liability for unearned revenue is removed from the statement of net position and revenue is recognized.
(f) Cash and Investments
Cash and cash equivalents are comprised of cash on hand, demand deposits and short term investments with a term of less than one year. All of the Authority’s investments are reported at fair value. Fair value is determined based on quoted market prices for the investments.
The Authority is authorized by HUD and its Board to invest in time deposits, certificates of deposits, and obligations of the U.S. government or its agencies, and to enter into repurchase agreements. Repurchase agreements are secured by U.S. Treasury securities with a market value equal to or greater than the amount of the repurchase agreements. The Authority’s investment policies provide for the ability to sell investments prior to the investments’ contractual maturity.
(g) Accounts Receivable – Other
Other accounts receivable represent various receivables including accrued interest on investments, accrued interest on notes receivable, receivables from other housing authorities for Section 8 portability payments, receivables from component units for developer fees, and receivables from other rental projects that the Authority manages but does not own. The Authority will hold an allowance when collectability of the related receivable in uncertain.
(h) Inventories and Prepaid Items
Inventories are stated at lower of cost or market value and consist of expendable materials and supplies. Inventory items are expensed using the first-in, first-out method. Office supplies are

THE HOUSING AUTHORITY OF THE CITY OF SEATTLE, WASHINGTON
Notes to Basic Financial Statements
December 31, 2012
28 (Continued)
expensed using a moving weighted average cost method. Maintenance materials are expensed using the first-in, first-out method. Prepaid items are for payments made by the Authority for services or goods received in a subsequent fiscal year.
(i) Deferred Charges
Deferred charges consist of debt issuance costs and bond discounts, which are amortized over the term of the related note or bond.
(j) Capital Assets and Depreciation
Capital assets are stated at historical cost. Maintenance and repairs are charged to current period operating expenses while improvements are capitalized. Upon retirement or other disposition of property and equipment, the cost and related accumulated depreciation are removed from the respective accounts and any gains or losses are included in operating revenues and expenses. All capital assets with a value greater than $1,000 and a useful life of over one year are capitalized. Assets acquired through contribution are recorded at the fair value on the date donated.
Capital assets are generally depreciated on the straight-line method over estimated useful lives as follows:
Land improvements 50 yearsLeasehold improvements 10 yearsStructures 40 – 75 yearsEquipment 3 – 10 years
(k) Accounts Payable – Other
Other accounts payable include payables for escrow accounts related to construction activities and the Section 8 Family Self-Sufficiency program, as well as miscellaneous payables related to payroll.
(l) Compensated Absences
Cabinet level employees and certain other executive level staff are covered under an executive leave policy. The policy provides this group of employees with 200 hours of annual leave per year to be used within that calendar year and may carry over a maximum of 40 hours to the next calendar year.
All other employees earn 100 hours each year, and after the first year, additional hours are added based on the number of years of service up to a maximum of 200 hours per year. Unused vacation is allowed to accumulate to a maximum of 240 or 360 hours, depending on the employees’ date of hire. Employees are paid for all accumulated vacation pay upon termination.

THE HOUSING AUTHORITY OF THE CITY OF SEATTLE, WASHINGTON
Notes to Basic Financial Statements
December 31, 2012
29 (Continued)
The Authority recognizes and compensates employees for nine traditional holidays. Holiday pay is recorded as an expense when incurred.
Employees earn sick leave at a rate of 96 hours per year. Sick leave is allowed to accumulate with no maximum. Employees are compensated for accumulated unused sick leave at the rate of 25% upon termination, permanent disability, or death.
Accruals are recorded at year-end for unused annual leave and unused sick leave, based on balances of hours at December 31 for each fiscal year-end. See footnote 7(a) for detailed schedule.
(m) Management Fees
The Authority manages two residential rental properties for HUD. For the year ended December 31, 2012, the Bay View Tower project paid the Authority management fees of $49,624, which is equal to 5.2% of net rental revenues received. Market Terrace paid the Authority management fees of $13,284 based on a fee of $1,107 per month.
(n) Payments in Lieu of Taxes
Pursuant to an agreement with the City, the Authority may make payments in lieu of taxes (PILOT). PILOT may also be provided to other taxing districts in which property is owned. Upon mutual understanding with the City and other taxing districts, no PILOT was made in fiscal year 2012.
(o) Unearned Revenue – Operating Leases
The Authority has unearned revenue resulting from operating lease payments received from seven of its discretely presented component units: the RALP, the ACLP, the DALP, the LCVLLLP, the HRRILP, the SHRIILP and the SHRIIILP. The lease payments are recognized over the lease terms and unearned lease payments are shown as unearned revenue.
(p) Income Taxes
Income received or generated by the Authority is not subject to federal income tax, pursuant to Internal Revenue Code Section 115. The Authority is also exempt from State and local property taxes. Interest paid on obligations issued by the Authority is excludable from the gross income of the recipients, pursuant to Section 103(a) of the Internal Revenue Code of 1986, as amended. Contributions to the Authority are tax deductible contributions, pursuant to Sections 170(b)(l)(A)(v) and 170 (c)(l) of the Internal Revenue Code of 1986, as amended.
(q) Pension Plans
The Authority reports pensions in accordance with GASB Statement No. 27 (GASB 27), Accounting for Pensions by State and Local Governmental Employers. GASB 27 requires the Authority to record a

THE HOUSING AUTHORITY OF THE CITY OF SEATTLE, WASHINGTON
Notes to Basic Financial Statements
December 31, 2012
30 (Continued)
net pension obligation (benefit) for the difference between the required and actual employer contributions to its pension plans. The Authority funds all required contributions.
(r) Use of Estimates
The preparation of financial statements in conformity with GAAP requires management to make estimates and assumptions that affect the reported amounts of assets and liabilities, and disclosure of contingent assets and liabilities, at the date of the financial statements, and the reported amounts of revenue and expenses during the reporting period. Actual results could differ from those estimates.
(2) Deposits and Investments
(a) Deposits
As of December 31, 2012, the Authority’s carrying amount of deposits (excluding petty cash and U.S. Post Office deposits) was $16,651,492 and the bank balance was $17,396,690. The bank deposits are held with financial institutions and are entirely insured or collateralized and are classified as cash and cash equivalents in the statement of net position. All deposits in excess of the FDIC insurance limit of $250,000 are covered by the Public Deposit Protection Commission of the State of Washington, which is a multiple financial institution collateral pool, established under Chapter 39.58 of the Revised Code of Washington. The FDIC insurance was raised from $100,000 to $250,000 until December 31, 2013. In addition to bank deposits, the Authority has $2,500 held at the U.S. Post Office and $4,781 in petty cash funds. All deposits are either insured or registered and held by the Authority or its agent in the Authority’s name.
(b) Investments
The Authority’s investment policies require that all investments be made in accordance with the stated objectives of capital preservation, optimum liquidity, and return, while conforming to all applicable statutes and regulations. The Authority has established a maximum maturity of three years for operating reserves and a maximum maturity of five years for replacement reserves. Bond reserves may have maturities that match the bond maturity.
The Authority invests a portion of its funds with the Washington State Local Government Investment Pool (LGIP) managed by the State Treasurer’s office. The investments in this pool are comprised of repurchase agreements, government securities, and certificates of deposits. The LGIP operates in a manner consistent with the Security and Exchange Commission’s Rule 2a-7 of the Investment Company Act of 1940. As such, the LGIP uses amortized cost to report net position and share prices since that amount approximates fair value.
Since the Authority reports all of its investment at fair value, no additional disclosure is required under GASB Technical Bulletin No. 2003-1, Disclosure Requirements for Derivatives Not Reported at Fair Value on the Statement of Net Position.

THE HOUSING AUTHORITY OF THE CITY OF SEATTLE, WASHINGTON
Notes to Basic Financial Statements
December 31, 2012
31 (Continued)
The Authority intends to adhere fully to its investment policy, which expressly prohibits the making of speculative or leveraged investments and requires that all investments be made prudently and with due care to ensure compliance with all statutes and regulations.
The Authority restricts its participation in money market mutual funds to those investing only in U.S. Treasury securities. However, the Authority’s indirect exposure to any risks arising from derivative instruments utilized by such funds and programs is unknown.
Custodial Risk
Custodial risk for investments is the risk that in the event of failure of the counterparty to a transaction, the Authority will not be able to recover the value of the investments. As of December 31, 2012, all investments were insured or registered, and held by the Authority or its agent in the Authority’s name, or uninsured and unregistered, with securities held by the counterparty’s trust department or agent in the Authority’s name, or investment pools that are not classified since the investments are not evidenced by securities that exist in physical or book entry form. Therefore, the investments are not exposed to custodial risk.
Investments in U.S. Treasury-backed short-term money market funds are investments held by the trustee in the Authority’s name for bond issues.
Concentration of Credit Risk, Credit Risk, and Interest Rate Risk
Concentration of credit risk is the risk of loss that may occur due to the amount of investments in a single issuer (not including investments issued or guaranteed by the U.S. government, investments in a mutual fund, or external investment pools).
Credit risk of investments is the risk that the issuer or other counterparty will not meet its obligations. This credit risk is measured by the credit quality rating of investments in debt securities, as described by a national statistical rating organization such as Standard and Poor’s (S&P). The Authority’s policy provides that investments in corporate bonds and other fixed income securities must have a rating of A or better.
Interest rate risk is the risk that changes in interest rates will adversely affect the fair value of an investment. The Authority’s policy is to select investments of varied maturities to mitigate this risk.

THE HOUSING AUTHORITY OF THE CITY OF SEATTLE, WASHINGTON
Notes to Basic Financial Statements
December 31, 2012
32 (Continued)
The following chart shows the Authority’s exposure to these risks:
S&P N/A or less More thancredit rating than 1 year 1 – 5 years 10 years Total
Money market funds n/a $ 7,267,146 — — 7,267,146 U.S. agency securities AAA — 3,004,153 3,633,473 6,637,626 Repurchase agreements n/a — — 738,800 738,800 State investment pool AAA 41,563,517 — — 41,563,517
Total investments $ 48,830,663 3,004,153 4,372,273 56,207,089
Investments are presented in the following financial statement captions in statement of net position as investments, current and long-term and restricted investments, current and long-term.
(c) Component Unit Deposits
As of December 31, 2012, the component units’ carrying amount of deposits (excluding petty cash) was $18,973,401 and the bank balance was $18,859,367. The bank balances held with financial institutions are entirely insured or collateralized and are classified as cash and cash equivalents in the statement of net position. All deposits in excess of the FDIC insurance limit of $250,000 are covered by the Public Deposit Protection Commission of the State of Washington, which is a multiple financial institution collateral pool, established under Chapter 39.58 of the Revised Code of Washington. The FDIC insurance was raised from $100,000 to $250,000 until December 31, 2013. In addition to bank deposits, the component units have $1,000 in petty cash funds.
(d) Component Unit Investments
As of December 31, 2012, investments of $899,621 were held in trust and restricted for the development of the component units’ redevelopment projects, replacement reserves and operating reserves.
Custodial Risk
The investments of the component units are guaranteed investment contracts collateralized by U.S. government investment securities. As of December 31, 2012, all investments were insured or registered, and held by the component unit or its agent in the component unit’s name, or uninsured and unregistered, with securities held by the counterparty’s trust department or agent in the component unit’s name. Therefore, the investments are not exposed to custodial risk.

THE HOUSING AUTHORITY OF THE CITY OF SEATTLE, WASHINGTON
Notes to Basic Financial Statements
December 31, 2012
33 (Continued)
The component units of the Authority are subject to the same concentration of credit risk, credit risk, and interest rate risk as the Authority. The chart below shows the exposure to these risks:
S&P N/A or less More thancredit rating than 1 year 10 years Total
U.S. government moneymarket funds n/a $ 322,998 — 322,998
Repurchase agreements n/a — 576,623 576,623
Total investments $ 322,998 576,623 899,621
(3) Restricted Assets
(a) Security Deposits
Upon moving into a project, tenants are required to pay a security deposit, which is refundable when the tenant vacates the apartment, provided the apartment’s physical condition is satisfactory. The Authority held security deposits for residential tenants as well as commercial tenants as of December 31, 2012 as shown in the schedule below:
Residential Commercial Total
Total security deposits $ 1,202,165 429,830 1,631,995

THE HOUSING AUTHORITY OF THE CITY OF SEATTLE, WASHINGTON
Notes to Basic Financial Statements
December 31, 2012
34 (Continued)
(b) Bond Trust Funds and Mortgage Reserves
As of December 31, 2012, funds held for bond trust funds and mortgage reserves are shown below:
Balance
Cash and investments are held in trust for the redemption of the PorchLightbonds that will be retired in May, 2013. The investments consist ofUS treasury government securities and bear interest atapproximately 0.0014%. $ 5,537,203
Investments for Gamelin/Genesee bonds are restricted for the payment ofprincipal and interest. The investments consist of money market fundsand bear no interest. 268,694
Cash is held for replacement reserves on the public housing units of theOthello Limited Partnership. Interest is paid at approximately 0.25%as of December 31, 2012. 201,327
Cash and investments for the Villa Park bonds are restricted for thepayment of bond principal and interest. Such investments consist ofmoney market funds and bears interest at approximately 0.01%. 147,205
Investments for the Telemark bonds are restricted for the payment ofbond principal and interest. Such investments consist of money marketfunds and bear interest at approximately 0.01%. 223,535
Investments held for the Market Terrace and Mary Avenue bonds arerestricted for the payment of principal and interest and consist ofmoney market funds bear no interest. 219,500
Investments for the Montridge bonds are restricted for the payment ofprincipal and interest. The investments consist of money market fundsand bears interest at approximately 0.01%. 131,702
Investments for the Replacement Housing bonds are restricted for thepayment of principal and interest. The investments consist of notes,mortgages, and contracts and bear interest at approximately 4.0%. 753,575
Investments for the Longfellow Creek bonds are restricted for thepayment of principal and interest. The investments consist of notes,mortgages, and contracts and bear no interest. 244,910
Cash is held for Tamarack commercial property for operating reserves asrequired by the loan agreement 30,064
Investments for the Wisteria Court bonds are restricted for the paymentof principal and interest. The investments consist of GNMA securitiesand bear interest at approximately 5.06%. 3,709,203
Reserves are held in restricted cash accounts for the mortgage onWedgwood Estates and bear interest at approximately 0.01%. 936,016
Reserves are held in restricted cash accounts for taxes and insurancefor Wedgewood Estates and bear no interest. 124,927

THE HOUSING AUTHORITY OF THE CITY OF SEATTLE, WASHINGTON
Notes to Basic Financial Statements
December 31, 2012
35 (Continued)
Balance
Reserves are held in restricted cash accounts for the mortgage onWisteria Court Apartments and bear interest at approximately 0.17%. $ 225,796
Reserves are held in restricted cash accounts for taxes and insurancefor Wisteria Court Apartments and bear no interest. 28,575
Investments are held for the Yesler Community Center ReplacementHousing bonds and are restricted for the payment of principal andinterest. The investments consist of treasury obligations and bearno interest. 145,504
Investments are held for the Bayview Tower and Lake City Commonsbonds. These funds are restricted for the payment of principal andinterest and consist of money market funds bearing interest atapproximately 0.011%. 258,391
Restricted cash is held for Bayview Tower and Lake City Commonsreplacement reserves. The investments consist of money market fundsand bear interest at approximately 0.25%. 550,541
Restricted cash is held for the Beacon operating reserves and replacement.reserves. The funds consist of money market funds and bear interestat approximately 0.01%. 87,671
Reserves are held in restricted cash accounts for the capital replacementand operations of Villa Park and bear interest at approximately 0.1%. 161,802
Reserves are held in restricted cash accounts for the capital replacementand operations of Telemark, Mary Avenue, Montridge, LongfellowCreek, Main St Apts, Main Street Place, Yesler Court and New HollyPhase I, bearing interest at approximately 0.1%. 1,083,557
Investments are held for the Holly Park Phase I bonds and are restricted forpayment of principal and interest. The funds are invested mainly in highlyliquid, short-term U.S. Treasury obligations. 265,225
Reserves are held in restricted cash accounts for the Holly Park Phase Ioperating reserve and tax credit replacement reserve and bear interestat approximately 0.25%. 2,178,655
Restricted cash is held in money market accounts for debt service on HighRise Rehabilitation projects, bearing no interest. 520
Restricted cash is held for operating reserves and replacement reserves forSenior Housing projects Willis House, Reunion House, Nelson Manorand Olmsted Manor and bear interest of approximately 0.25%. 138,222
Restricted cash is held for critical repairs at Wedgewood Estates related tothe refinancing of the building. The account bears no interest. 691,579
Total $ 18,343,899
(c) Other Restricted Funds
As of December 31, 2012, restricted cash amounts of $317,192 are held in trust for the Family Self-Sufficiency (FSS) program. Families in the Section 8 and Low Rent programs may sign up for the

THE HOUSING AUTHORITY OF THE CITY OF SEATTLE, WASHINGTON
Notes to Basic Financial Statements
December 31, 2012
36 (Continued)
FSS program and any rent increase due to an increase in income may be deposited into an escrow account. The tenant may request reimbursement from the trust account for certain allowable expenditures.
Restricted cash amounts of $366,069 are held for retainage for construction projects.
HUD requires the Authority to maintain restricted investments equal to the required reserves for the Market Terrace project. HUD must approve any release or disbursement of reserve funds in advance. Restricted investments for required reserves of $70,794 were held as of December 31, 2012.
Restricted cash amounts of $59,420 are held in the Development fund for the Dream Big Scholarship fund, which provides scholarships for residents of the Authority’s communities.
Restricted cash amounts of $222,254 are held in an endowment trust for residents of High Point. The funds are to be used only for planning, providing, and evaluating community and support services for the primary benefit of the public housing residents of High Point housing development and former residents occupying other public housing in accordance with the plan approved by HUD. A portion of the interest may be spent each year and the High Point Endowment Trust will continue to exist in perpetuity. Upon approval from HUD on August 28, 2009, grant funds in the amount of $220,995 were deposited to the account. During the year, there were no withdrawals and the account increased in value by $555.

THE HOUSING AUTHORITY OF THE CITY OF SEATTLE, WASHINGTON
Notes to Basic Financial Statements
December 31, 2012
37 (Continued)
(4) Notes Receivable
(a) Other Than from Component Units
December 31, Due within2012 one year
Due from Community Psychiatric Clinic for the purchaseof two properties. The notes bear no interest andmature November 30, 2013, with annual paymentsrequired. $ 48,223 48,223
Due from Stone View Village I Limited Partnershipand Stone View Village II Limited Partnership.The notes bear interest at rates ranging from 0.5%to the lowest applicable federal rate as determinedunder the Internal Revenue Code of 1986, and allinterest and principal are due in March andApril 2039. 1,373,835 —
Due from Lutheran Alliance to Create Housing(LATCH) Roxbury Limited Partnership. The notebears no interest for the first 30 years. Interestaccrues beginning February 1, 2030 at 2%, withannual payments of $73,388 until the note matureson January 31, 2050. 1,200,000 —
Two notes due from the Low Income HousingInstitute (LIHI), a Washington nonprofit corporation,and the Lakeview Apartments Limited Partnership.The note in the amount of $494,600 bearsinterest at 3% annually and all interest and principalwill be forgiven December 2040, if the project isoperated according to the loan regulatory agreement.The note in the amount of $13,520 bears interestat 6% annually and is due January 2016. Principaland interest payments of $5,058 are due annually. 508,120 4,247
Due from the Plymouth Housing Group (PHG), aWashington nonprofit corporation. The loan bearsinterest at 1% annually and all principal and interestare due January 2041. Provided the borrowercomplies with the loan regulatory agreement, allprincipal and interest will be forgiven January 2041. 856,912 —

THE HOUSING AUTHORITY OF THE CITY OF SEATTLE, WASHINGTON
Notes to Basic Financial Statements
December 31, 2012
38 (Continued)
December 31, Due within2012 one year
Notes due from the Mount Baker HousingAssociation for the Starlighter Apartments, whichare secured by a deed of trust on the property. Thenote bears interest at an annual rate of 1% which isdeferred until October 31, 2040, at which time theloan will be forgiven if the project is operated inin accordance with the loan agreement. $ 270,000 —
Due from the Retirement Housing Foundation. Thenote requires annual payments and is payable infull by December 2016. The interest rate isapproximately 3.27%. 690,245 127,435
Due from Madison Housing Partners Phase I, LLCand Madison Housing Partners Phase II, LLC.The notes are for the Views at MadisonApartments I and Views at Madison II, respectively,and are secured by deeds of trust on the properties.Both notes bear interest at an annual rate of 1.0%and are payable December 31, 2042. 826,106 —
Due from the Seattle Chinatown International DistrictPublic Development Authority (SCIDPDA). Thenote bears interest at a rate of 1% per annum andall interest and principal are due on the maturitydate of December 31, 2043. 1,622,881 —
Two notes due from the LIHI NW 85th, LLC, whichare secured by a deed of trust on the property. Oneof the $500,000 notes bears interest at 1% perannum and is payable in full on December 31, 2042,provided the project is operated in accordance withLow Income Housing regulatory agreement and theterms of the loan agreement. The other note bearsinterest at 3% per annum. The balance of principaland accrued interest as of December 31, 2004 shallbe amortized over a period of 20 years beginning onJanuary 1, 2005. Payments of $2,942 will berequired monthly until final maturity onDecember 31, 2025. 855,390 24,982

THE HOUSING AUTHORITY OF THE CITY OF SEATTLE, WASHINGTON
Notes to Basic Financial Statements
December 31, 2012
39 (Continued)
December 31, Due within2012 one year
Due from the Andover Court Associates, LLC andsecured by a deed of trust on the property. Thenote bears interest at 1% per annum and ispayable in full on the maturity date of March 31, 2043,provided the project is operated in accordance withthe Low Income Housing regulatory agreement andthe terms of the loan agreement. $ 743,179 —
Due from LIHI Meadowbrook Associates, LLC.The note bears interest at a rate of 1% per annum.The balance of principal and interest is due infull on the maturity date of December 31, 2052. 600,000 —
Due from HRG for the purchase of Judkins ParkApartments. The note is secured by a deed oftrust on the property and bears interest at 1%.Principal and interest are due on the maturitydate of February 29, 2044. 400,340 —
Due from the Archdiocesan Housing Authority andML King Housing Limited Partnership. The noteis secured by a deed of trust on the property andbears interest at 1%. Principal and interest are dueon the maturity date of July 31, 2044. 266,013 —
Due from the Kateri House Association. The note issecured by a deed of trust on the property andbears interest at 1% per annum. Principal andaccrued interest are due when the title istransferred or the property is sold. 83,793 —
Due from Main Street Interim, LLC. The note issecured by a deed of trust, bears interest at 1%per annum, and matures December 1, 2054.Principal and interest are due on the maturity date. 1,055,568 —
Due from Denny Park, LLC. The note is secured bya deed of trust on the property and bears interestat 1%. Principal and interest are due onthe maturity date of September 3, 2044. 250,000 —
Due from CHHIPS Pantages Apartments LLC.The note is secured by a deed of trust on the propertyand bears interest at 1%. Principal and interest arepayable on the maturity date of August 16, 2044. 548,465 —

THE HOUSING AUTHORITY OF THE CITY OF SEATTLE, WASHINGTON
Notes to Basic Financial Statements
December 31, 2012
40 (Continued)
December 31, Due within2012 one year
Due from Stoneway Apartments, LLC. The note issecured by a deed of trust on the property and bearsinterest at 1% per annum. Principal and interest arepayable on the maturity date of July 31, 2055. $ 1,499,999 —
Due from CHHIPS for the construction of Broadwayand Pine Apartments. The note is secured by adeed of trust and bears interest at 1%. Principal andinterest are due on the maturity date ofNovember 4, 2055. 548,465 —
Due from Delridge Neighborhood Development,managing member of the West Seattle ResourceCenter, LLC. The note is secured by a deed of trustand bears interest at 1%. Principal and interest arepayable on the maturity date of February 1, 2056. 325,000 —
Due from Neighborhood House for land sold at RainierVista. The note is secured by a deed of trust on theproperty and bears no interest. The note matureson August 31, 2054. 210,000 —
Allowance for loss (519,553) — Total notes receivable, net $ 14,262,981 204,887
The Authority has gross notes receivable and an allowance of $6,285,338 for loans made to Neighborhood House, Boys and Girls Club, and Solid Ground that are excluded from the table above. The allowance fully covers the loans as a portion of the loan amounts is forgivable each year provided they comply with the terms of the loan agreements.

THE HOUSING AUTHORITY OF THE CITY OF SEATTLE, WASHINGTON
Notes to Basic Financial Statements
December 31, 2012
41 (Continued)
(b) Notes Receivable from Component Units
BalanceDecember 31, Due within
2012 one year
Two notes due from High Rise Rehabilitation Phase ILimited Partnership. One note for $12,000,000bears interest at 4.82% per annum duringrehabilitation and 2.75% per annum thereafter.The other note in the amount of $12,000,000 bearsinterest at 4.68% per annum during rehabilitationand 2.75% per annum thereafter. Both notesmature on January 1, 2046 with principal andinterest payments due quarterly during rehabilitationand annually from available cash flows thereafter.As of December 31, 2012, the amount of interestpayable to the Authority was $3,484,250. $ 24,000,000 —
Two notes due from Escallonia Limited Partnership.One note in the amount of $12,732,292 and onenote in the amount of $10,614,802. Both notes bearinterest at 1% per annum and mature in fiscal year2058. Interest payments are due annually fromavailable net cash flows. As of December 31, 2012,interest payable to the Authority was $1,943,955. 23,347,094 —
Two notes due from High Point North LimitedPartnership in the amounts of $8,500,000 and$16,652,733. The notes bear compounding interestat 1% per annum and mature in fiscal year 2054.Interest payments are due annually from availablenet cash flows. As of December 31, 2012, interestpayable to the Authority was $2,203,007. 25,152,734 —
Due from Ritz Apartments Limited Partnership. Thenote bears interest at 1% per annum and maturesMarch 30, 2054. Principal and interest paymentsare due annually from available cash flows.Interest payable to the Authority onDecember 31, 2012 was $38,996. 265,856 —
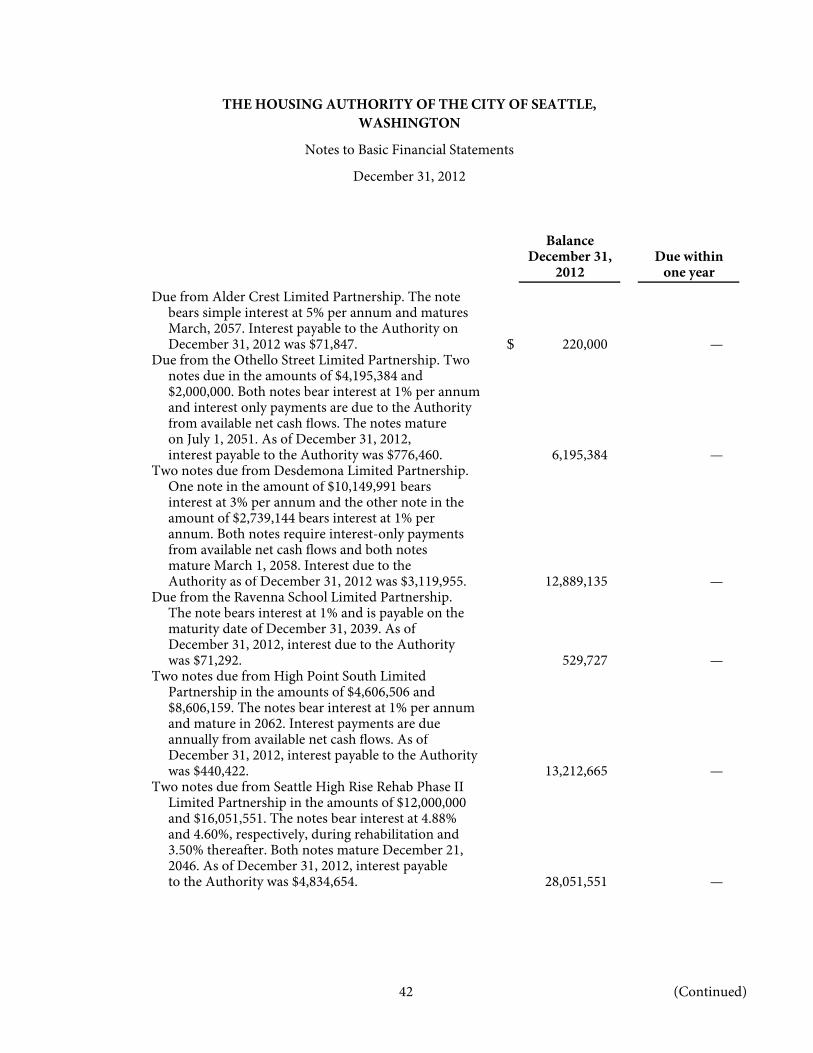
THE HOUSING AUTHORITY OF THE CITY OF SEATTLE, WASHINGTON
Notes to Basic Financial Statements
December 31, 2012
42 (Continued)
BalanceDecember 31, Due within
2012 one year
Due from Alder Crest Limited Partnership. The notebears simple interest at 5% per annum and maturesMarch, 2057. Interest payable to the Authority onDecember 31, 2012 was $71,847. $ 220,000 —
Due from the Othello Street Limited Partnership. Twonotes due in the amounts of $4,195,384 and$2,000,000. Both notes bear interest at 1% per annumand interest only payments are due to the Authorityfrom available net cash flows. The notes matureon July 1, 2051. As of December 31, 2012,interest payable to the Authority was $776,460. 6,195,384 —
Two notes due from Desdemona Limited Partnership.One note in the amount of $10,149,991 bearsinterest at 3% per annum and the other note in theamount of $2,739,144 bears interest at 1% perannum. Both notes require interest-only paymentsfrom available net cash flows and both notesmature March 1, 2058. Interest due to theAuthority as of December 31, 2012 was $3,119,955. 12,889,135 —
Due from the Ravenna School Limited Partnership.The note bears interest at 1% and is payable on thematurity date of December 31, 2039. As ofDecember 31, 2012, interest due to the Authoritywas $71,292. 529,727 —
Two notes due from High Point South LimitedPartnership in the amounts of $4,606,506 and$8,606,159. The notes bear interest at 1% per annumand mature in 2062. Interest payments are dueannually from available net cash flows. As ofDecember 31, 2012, interest payable to the Authoritywas $440,422. 13,212,665 —
Two notes due from Seattle High Rise Rehab Phase IILimited Partnership in the amounts of $12,000,000and $16,051,551. The notes bear interest at 4.88%and 4.60%, respectively, during rehabilitation and3.50% thereafter. Both notes mature December 21,2046. As of December 31, 2012, interest payableto the Authority was $4,834,654. 28,051,551 —

THE HOUSING AUTHORITY OF THE CITY OF SEATTLE, WASHINGTON
Notes to Basic Financial Statements
December 31, 2012
43 (Continued)
BalanceDecember 31, Due within
2012 one year
Two notes due from Seattle High Rise Rehab Phase IIILimited Partnership in the amounts of $9,200,000and $11,750,000. The notes bear interest at 4.13%and 5.04%, respectively, during rehabilitation and4.25%, thereafter. Both notes matureDecember 19, 2047. As of December 31, 2012,interest payable to the Authority was $3,307,913. $ 20,950,000 —
Due from Tamarack Place Limited Partnership. Thenote bears interest at 1% per annum and maturesin 2049. Interest payments are due annually fromavailable net cash flows. As of December 31, 2012,interest payable to the Authority was $338,000. 10,400,000 —
Two notes due from Rainier Vista Northeast LLLP. Onenote in the amount of $10,000,000 and one note in theamount of $6,604,268. Both notes bear interest at0.25% per annum and mature in 2060. Interestpayments are due annually from available cash flows.As of December 31, 2012, interest payable to theAuthority was $318,223. 16,604,268 —
Due from Lake City Village LLLP. The amount of thenote is up to $16,402,326. The note accrues interestat 0.8% per annum and matures May 2065. As ofDecember 31, 2012, interest payable to the Authoritywas $478,308. 16,358,505 —
Due from Douglas Apartments Limited Partnership forbond proceeds. The note accrues interest at 4.80%per annum and matures June 2040. As ofDecember 31, 2012, interest payable to the Authoritywas $7,800. 1,900,000 30,000
Due from 1105 E Fir LLLP for predevelopmentadvances and does not accrue interest. 953,897 953,897
Total notes from component units $ 201,030,816 983,897
The Authority has gross notes receivable and an allowance of $1,675,000 for a loan made to Lake City Village LLLP which is excluded from the table above. The allowance fully covers the loan which is payable to the Authority and dependent on uncertain cash flows. Interest payable as of December 31, 2012 was $198,208.

THE HOUSING AUTHORITY OF THE CITY OF SEATTLE, WASHINGTON
Notes to Basic Financial Statements
December 31, 2012
44 (Continued)
(5) Capital Assets
The following is a summary of changes in capital assets of the Authority for the year ended December 31, 2012:
Balance Additions Dispositions BalanceJanuary 1, and and December 31,
2012 transfers in transfers out 2012
Capital assets, not being depreciated:Land $ 70,371,965 — (4,985,572) 65,386,393 Construction in progress 31,721,093 20,785,254 (45,898,451) 6,607,896
Total capital assets, notbeing depreciated 102,093,058 20,785,254 (50,884,023) 71,994,289
Depreciable capital assets:Land improvements 36,224,637 17,582,405 (10,209,367) 43,597,675 Structures 374,414,441 4,047,063 (5,965,769) 372,495,735 Leasehold improvements 753,508 144,466 — 897,974 Equipment 16,277,666 627,482 (662,943) 16,242,205
427,670,252 22,401,416 (16,838,079) 433,233,589
Less accumulated depreciation for:Land improvements (1,655,471) (1,009,192) — (2,664,663) Structures (190,877,160) (8,478,359) 2,663,637 (196,691,882) Leasehold improvements (287,113) (80,376) — (367,489) Equipment (14,411,471) (689,887) 653,998 (14,447,360)
Total accumulateddepreciation (207,231,215) (10,257,814) 3,317,635 (214,171,394)
Total capital assets,being depreciated, net 220,439,037 12,143,602 (13,520,444) 219,062,195
Total capital assets, net $ 322,532,095 32,928,856 (64,404,467) 291,056,484
Substantial restrictions are imposed by HUD, as well as by State and local governments, on the use and collateralization of the Authority’s capital assets.
Construction in Progress
Capital improvements made on the Authority’s Low Rent housing stock are financed by grant funds provided by HUD under Capital Grants and the Urban Revitalization Demonstration Grant (URD/HOPE VI). The funds provided through these programs are used to rehabilitate the housing stock, which extends the useful life of the buildings. Capital grants are awarded annually based on a

THE HOUSING AUTHORITY OF THE CITY OF SEATTLE, WASHINGTON
Notes to Basic Financial Statements
December 31, 2012
45 (Continued)
comprehensive modernization plan submitted by the Authority. Hope VI grants are awarded based on a specific application request. The Authority’s construction in progress in the Low Rent program consists of the costs for modernization of public housing units. When modernization grants are completed, HUD issues a modernization cost certificate for each grant, at which time construction in progress for that grant is recorded in the building category. For the Hope VI redevelopment grants, some construction in progress amounts represent infrastructure costs which will be ultimately transferred to and maintained by the City of Seattle. These transfers occur when the projects are complete.
The following schedule shows the significant components of the construction in progress as of December 31, 2012:
Modernization funds – Capital grants $ 2,589,757 Modernization funds – Choice neighborhood
grant 392,338 Other programs 3,625,801
Total construction in progress $ 6,607,896

THE HOUSING AUTHORITY OF THE CITY OF SEATTLE, WASHINGTON
Notes to Basic Financial Statements
December 31, 2012
46 (Continued)
Component Units
The following is a summary of changes in the capital assets of the Authority’s component units for the year ended December 31, 2012:
Balance Additions Dispositions BalanceJanuary 1, and and December 31,
2012 transfers in transfers out 2012
Capital assets, not being depreciated:Land $ 5,099,274 — — 5,099,274 Construction in progress 9,412,927 4,830,007 (12,466,629) 1,776,305
Total capital assets notbeing depreciated 14,512,201 4,830,007 (12,466,629) 6,875,579
Depreciable capital assets:Land improvements 18,037,509 2,506,741 — 20,544,250 Structures 367,091,247 10,569,731 — 377,660,978 Equipment 9,032,225 724,881 (1,262,573) 8,494,533
394,160,981 13,801,353 (1,262,573) 406,699,761
Less accumulated depreciation for:Land improvements (1,444,008) (2,380,446) — (3,824,454) Structures (51,372,700) (8,221,234) — (59,593,934) Equipment (2,005,702) (1,011,853) — (3,017,555)
Total accumulateddepreciation (54,822,410) (11,613,533) — (66,435,943)
Total capital assets,being depreciated, net 339,338,571 2,187,820 (1,262,573) 340,263,818
Total capital assets, net $ 353,850,772 7,017,827 (13,729,202) 347,139,397
(6) Short-Term Borrowings
The Authority maintains a $6 million line of credit, which provides the Authority with a ready means of short-term financing for general operations of the Authority. The line of credit bears interest at 65% of the bank’s prime rate plus 0.96% or 3.07% at December 31, 2012, which is payable monthly. The line of credit matures August 2013 and may be extended by the Executive Director of the Authority annually until August 2016, with the consent of the bank as long as the interest rate formula does not produce rates greater than two percent higher than the previous rate formula. The total amount outstanding at December 31, 2012 was $532,482.

THE HOUSING AUTHORITY OF THE CITY OF SEATTLE, WASHINGTON
Notes to Basic Financial Statements
December 31, 2012
47 (Continued)
The Authority maintains a $15 million revolving real property line of credit in order to provide a ready means of financing real property acquisitions. The Authority entered a new agreement with the bank effective June 22, 2010. Under the terms of the new agreement, the line of credit was split into series A in the amount of $9.25 million and series B in the amount of $5.75 million. Series A bears interest at 65.01% of the bank’s prime rate plus 0.96% and is for a term of one year. The line may be extended annually by the Executive Director until June 22, 2015 with consent of the bank. The rate at December 31, 2012 was 3.07%. Series B has a three year term and may be extended for an additional three year term by the Executive Director until June 22, 2016 with consent of the bank. Series B bears interest at 65.01% of the bank’s prime rate plus 0.96% or 3.07% as of December 31, 2012. As of December 31, 2012, the Authority had drawn $7,130,777 which was all on the series A portion of the line.
The Authority has also established a $7 million revolving taxable line of credit for the purpose of obtaining bridge financing for the Authority’s acquisition of commercial or other nontax-exempt properties over the next five to seven years. The line of credit bears interest at Key Bank’s prime rate minus 0.9% or 2.35% as of December 31, 2012, which is payable monthly. The line matures on December 3, 2013, and is renewable annually through 2015. The total amount outstanding at December 31, 2012 was $5,164,439.

THE HOUSING AUTHORITY OF THE CITY OF SEATTLE, WASHINGTON
Notes to Basic Financial Statements
December 31, 2012
48 (Continued)
The following is a summary of changes in the Authority’s short-term borrowings for the year ended December 31, 2012:
Balance BalanceJanuary 1, December 31,
2012 Additions Retirements 2012
Real estate line of credit for purchaseof 12-plex at 5983 Rainier Ave S. $ 439,856 — — 439,856
Real estate line of credit for purchaseof 5-plex at 924 MLK Jr Way South. 326,650 — — 326,650
Real estate line of credit for purchaseof two triplexes on DelridgeWay SW. 451,380 — — 451,380
Real estate line of credit payable for7343 MLK Jr Way S. 1,083,625 — — 1,083,625
Real estate line of credit payable forvarious properties includingHighpoint substation, 109 12thAve, 5656 32nd Ave SW, and3200 SW Juneau. 957,591 — — 957,591
Real estate line of credit payable forthe purchase of land at 38th &S Willow. 250,358 — — 250,358
Operating line of credit payable forpurchase of the Salvation ArmyBuilding. 532,482 — — 532,482
Taxable line of credit for purchaseof properties in the Developmentfund, including 6919 MLK Jr Way S,103 12th Ave S, 6058 35th Ave SW,and 6927 MLK Jr Way S. 2,843,038 — — 2,843,038
Real estate line of credit for purchaseof 6-plex at 3809 Willow. 580,274 — — 580,274
Real estate line of credit for purchaseof Lee Apartments. 1,058,400 — — 1,058,400
Taxable line of credit payable forpurchase of 6558 35th Ave SW. 988,574 — — 988,574
Real estate line of credit for purchaseof the Baldwin Apartments. 335,899 — — 335,899

THE HOUSING AUTHORITY OF THE CITY OF SEATTLE, WASHINGTON
Notes to Basic Financial Statements
December 31, 2012
49 (Continued)
Balance BalanceJanuary 1, December 31,
2012 Additions Retirements 2012
Taxable line of credit for purchase ofApartments at 6927 MLK Jr Way S. $ 1,129,297 — — 1,129,297
Taxable line of credit for constructionof commercial space at Tamarack. 1,100,000 — 1,100,000 —
Real estate line of credit for MainStreet properties pending refinance. — 1,646,744 — 1,646,744
Taxable line of credit for Main Streetcommercial pending refinance. — 203,530 — 203,530
Total short-termborrowings $ 12,077,424 1,850,274 1,100,000 12,827,698
(7) Long-Term Debt and Other Long-Term Obligations
(a) Authority Debt and Accrued Compensated Absences
The following is a summary of changes in the Authority’s long-term debt and accrued compensated absences for the year ended December 31, 2012:
Balance BalanceJanuary 1, December 31, Due within
2012 Additions Retirements 2012 one year
Loan payable to the City ofSeattle for the EpsteinBuilding remodel financedby HUD CommunityDevelopment Block Grantfunds. The loan will befully forgiven onDecember 31, 2017 if theproperty is kept forlow-income use. $ 200,000 — — 200,000 —

THE HOUSING AUTHORITY OF THE CITY OF SEATTLE, WASHINGTON
Notes to Basic Financial Statements
December 31, 2012
50 (Continued)
Balance BalanceJanuary 1, December 31, Due within
2012 Additions Retirements 2012 one year
Notes payable issued in 1998to the City of Seattle’sGeneral Fund, UrbanRenewal, and CapitalFacilities Fund for NewHolly Phase I. Interestaccrues at 1% simple interestper year and is forgiven at therate of 5% per year beginningon the 21st year subject tocompliance with certaincovenants. Principalpayments may be deferred ifthe property is kept for low-income housing. If theAuthority remains incompliance with the debtcovenants for 75 years, theunpaid principal balance willbe forgiven. $ 2,417,263 — — 2,417,263 —
Note payable to the City ofSeattle’s HousingDevelopment fund forNew Holly Phase II.Interest accrues at 1%simple interest per yearand is payable on orbefore September 11, 2040. 1,700,000 — — 1,700,000 —
Notes payable issued in 2001to the City of Seattle’sCumulative ReserveFund and HOME Programfor New Holly Phase II.Interest accrues at 1% simpleinterest per year up to the20th year and is forgiven atthe rate of 5% per yearbeginning on the 21st year,subject to compliance withcertain covenants. Principaland interest payments maybe deferred if the propertyis kept for low-income use.If the Authority remains incompliance with the debtcovenants for 75 years, theunpaid principal balance andaccrued interest will beforgiven. 2,800,000 — — 2,800,000 —

THE HOUSING AUTHORITY OF THE CITY OF SEATTLE, WASHINGTON
Notes to Basic Financial Statements
December 31, 2012
51 (Continued)
Balance BalanceJanuary 1, December 31, Due within
2012 Additions Retirements 2012 one year
Note payable to the Stateof Washington for theVilla Park project. Interestaccrues at 1% per yearcompounded monthly,with 50 annual paymentsof $27,698. The note issecured by a deed oftrust on the property. $ 833,933 — 19,359 814,574 19,552
Note payable to the Cityfor the Villa ParkApartments. Interestaccrues at 1% simpleinterest per year for thefirst 20 years and isforgiven at the rate of 5%per year beginningon the 21st year, subjectto compliance withcertain covenants.Principal payments maybe deferred if the propertyis kept for low-incomehousing. If the Authorityremains in compliancewith debt covenants for75 years, the unpaidprincipal balance will beforgiven. The note issecured by a deed oftrust on the property. 1,785,723 — — 1,785,723 —
Mortgage loan forWedgewood Estatespayable to CBRE. Term is35 years, with final maturitySeptember 1, 2046. Theinterest rate is 4.10% withmonthly payments of $75,102.The loan is guaranteed withFHA insurance. 16,662,225 — 222,222 16,440,003 211,850

THE HOUSING AUTHORITY OF THE CITY OF SEATTLE, WASHINGTON
Notes to Basic Financial Statements
December 31, 2012
52 (Continued)
Balance BalanceJanuary 1, December 31, Due within
2012 Additions Retirements 2012 one year
Mortgage loan for WisteriaCourt payable toPrudential. Term is35 years, with finalmaturity August 1, 2038.The interest rate is 5.51%,with monthly paymentsof $21,114. The loanis guaranteed with FHAInsurance. $ 3,546,531 — 59,445 3,487,086 62,804
Mortgage loan payable toCS Capital for the purchaseof Main Street Propertiesbearing interest at a rateof 6%, with maturity dateof November 1, 2012.The mortgage is securedby a deed of trust on theproperty. 1,708,993 — 1,708,993 — —
Note payable to the Cityfrom 1992 for the BeaconHouse project. Interestaccrues at 1% simple interestper year for the first20 years and is forgivenat the rate of 5% per yearbeginning on the 21st year,subject to compliance withcertain covenants.Principal payments maybe deferred if theproperty is kept forlow-income housing. Ifthe Authority remainsin compliance with thedebt covenants for75 years, the unpaidprincipal balance will beforgiven. 329,260 — — 329,260 —
Mortgage loan payable to CWCapital for the purchaseof Main Street Properties,bearing interest at a rate of6%, with maturity date ofNovember 1, 2012. Themortgage is secured by adeed of trust on theproperty. 211,225 — 211,225 — —

THE HOUSING AUTHORITY OF THE CITY OF SEATTLE, WASHINGTON
Notes to Basic Financial Statements
December 31, 2012
53 (Continued)
Balance BalanceJanuary 1, December 31, Due within
2012 Additions Retirements 2012 one year
Note payable to Bank ofAmerica for constructionof infrastructure at HighPoint and Rainier Vista.The note requires annualpayments and matures in2013. Interest is tied to theLIBOR rate. $ 16,925,000 — 8,035,672 8,889,328 8,889,328
Note payable to City of Seattle,Office of Housing for futuredevelopment at OthelloStation, 7301 MLK Jr WayS. Loan will be forgiven ifdevelopment agreementshave been finalized on orbefore the maturity date ofDecember 2012. The interestrate is 3% per annum andpayable on the maturitydate. 2,000,000 — — 2,000,000 —
Note payable to State Office ofCommunity Trade andEconomic Developmentfor New Holly Phase I.The note is secured by alien on the property andmatures December 31, 2040. 1,700,000 — — 1,700,000 —
Loans payable to Seattle Officeof Housing for the rehab ofWillis House and ReunionHouse. Loans bear interestat 1% which is payable atmaturity, December 2059. 850,000 — — 850,000 —
Loans payable to Seattle Officeof Community Trade andEconomic Development forrehab at Willis House andReunion House. Forgivableon maturity dateDecember 2049. 879,273 — — 879,273 —
Loan payable to the City ofSeattle for utilityinfrastructure at New Holly,Rainier Visa and High Point. — 2,700,000 1,539,350 1,160,650 160,874

THE HOUSING AUTHORITY OF THE CITY OF SEATTLE, WASHINGTON
Notes to Basic Financial Statements
December 31, 2012
54 (Continued)
Balance BalanceJanuary 1, December 31, Due within
2012 Additions Retirements 2012 one year
Loans payable to Seattle Officeof Housing for the rehab ofNelson Manor. The loanbears interest at 1%, whichis payable at maturity, inAugust 2061. $ 832 477,233 478,065 —
Loan payable to Seattle Officeof Housing for the rehab ofOlmsted Manor. The loanwhich is payable at maturity,August 2061. 47,574 430,400 — 477,974 —
Loan payable to Seattle Officeof Housing for the rehab ofBlakely Manor. The loanis payable at maturityNovember 18, 2061.Interest rate is 1% — 984,155 — 984,155 —
Loan payable to Seattle Officeof Housing for the rehab ofBitter Lake Manor. Theloan bears interest at 1%and is payable at maturity,January 25, 2062. — 978,930 — 978,930 —
Loan for Beacon House,payable at maturity, inMarch, 2043. 114,212 — — 114,212 —
Loan payable to Wa StateCommunity ReinvestmentAssn for TamrackCommercial property. Termis 15 years. Note bearsineterest at 6.5% and is dueMarch, 2027. — 1,087,500 9,042 1,078,458 12,761
Other notes payable 509,547 — 509,547 — —
Total notespayable 55,221,591 6,658,218 12,314,855 49,564,954 9,357,169

THE HOUSING AUTHORITY OF THE CITY OF SEATTLE, WASHINGTON
Notes to Basic Financial Statements
December 31, 2012
55 (Continued)
Balance BalanceJanuary 1, December 31, Due within
2012 Additions Retirements 2012 one year
Bonds payable for thePorchLight Building whichwas sold in September,2012. The bonds will beredeemed in May,2013. $ 5,515,000 — 140,000 5,375,000 5,375,000
Bonds payable for theWallingford property inannual payments of$64,716, includinginterest at 7%; final duedate is January 11, 2015.The bonds are securedby a pledge of the generalrevenues of the Authority. 179,006 — 53,893 125,113 57,789
Bonds payable tax-exemptseries A and taxableseries B for the Gamelinand Genesse commercialcondo units. Annualpayments areapproximately $300,000and interest rates are 5.7%and 7.5%. Final due datesare October 31, 2035 andOctober 31, 2020. Bondsare secured by a pledge ofthe general revenues ofthe Authority. 3,490,000 — 78,000 3,412,000 87,000
Bonds payable for the HighRise Rehabilitation project,Phase I. The bondsmature on November 1,2025. The bonds aresecured by a deed oftrust and the interest ratewas 4.868% as ofDecember 31, 2012. 9,380,000 — 485,000 8,895,000 505,000
Bonds payable for the HighRise Rehabilitation project,Phase II. The bonds matureNovember 1, 2026 and aresecured by a deed oftrust. The interest ratewas 4.553% as ofDecember 31, 2012. 13,291,551 — 600,000 12,691,551 625,000

THE HOUSING AUTHORITY OF THE CITY OF SEATTLE, WASHINGTON
Notes to Basic Financial Statements
December 31, 2012
56 (Continued)
Balance BalanceJanuary 1, December 31, Due within
2012 Additions Retirements 2012 one year
Bonds payable for the HighRise Rehabilitation project,Phase III. The bonds matureNovember 1, 2027 and aresecured by a deed of trust.The interest rate was 5.15%on December 31, 2012. $ 10,500,000 — 360,000 10,140,000 375,000
Bonds payable for the VillaPark Apartments in annualpayments of $25,000 to$1,065,000 plus interest atrates of 4.5% to 6.5%;final due date November 1,2026. The bonds aresecured by a pledge ofgeneral revenues of theAuthority, and a deed oftrust on the Villa ParkApartments. 1,395,000 — 60,000 1,335,000 60,000
Bonds payable for TelemarkApartments, Stone AveTownhomes and 532 N104th St Townhomes.Annual payments are$25,000 to $420,000plus interest at rates of3.500% to 6.125%; finaldue date is June 1, 2031.The bonds are securedby a deed of trust onthe property. 2,555,000 — 55,000 2,500,000 60,000
Fixed rate bonds payablefor Market Terrace andMary Avenue townhomes.Annual payments are$45,000 to $415,000 plusinterest at rates of 2.35% to5.80%, with final due dateof August 31, 2032. Thebonds are secured by adeed of trust on theproperties. 2,680,000 — 65,000 2,615,000 65,000

THE HOUSING AUTHORITY OF THE CITY OF SEATTLE, WASHINGTON
Notes to Basic Financial Statements
December 31, 2012
57 (Continued)
Balance BalanceJanuary 1, December 31, Due within
2012 Additions Retirements 2012 one year
Fixed rate bonds payablefor Montridge ArmsApartments. Annualpayments are $25,000 to$125,000 plus interest atrates of 2.5% to 6.0%,with final due date ofFebruary 1, 2032. Thebonds are secured by adeed of trust on theproperty. $ 1,555,000 — 40,000 1,515,000 40,000
Fixed rate bonds payable forLongfellow CreekApartments. Annualpayments are $15,000 to$235,000 plus interest atrates of 1.90% to 5.35%with final due date ofOctober 1, 2033. Thebonds are secured by apledge of the generalrevenue of the Authorityand certain revenues andreceipts available from theproperty. 3,165,000 — 80,000 3,085,000 85,000
Fixed rate bonds payablefor HOPE VI replacementhousing properties ofRoxbury Apartments, LamBow, and various otherunits purchased fromDecker properties in theamount of $10,000,000.Annual payments are$125,000 to $695,000plus interest rates at 6.125%with final due date ofDecember 1, 2032. Thebonds are secured by apledge of the general revenueof the Authority and certainrevenues and receiptsavailable from the property. 8,570,000 — 210,000 8,360,000 225,000
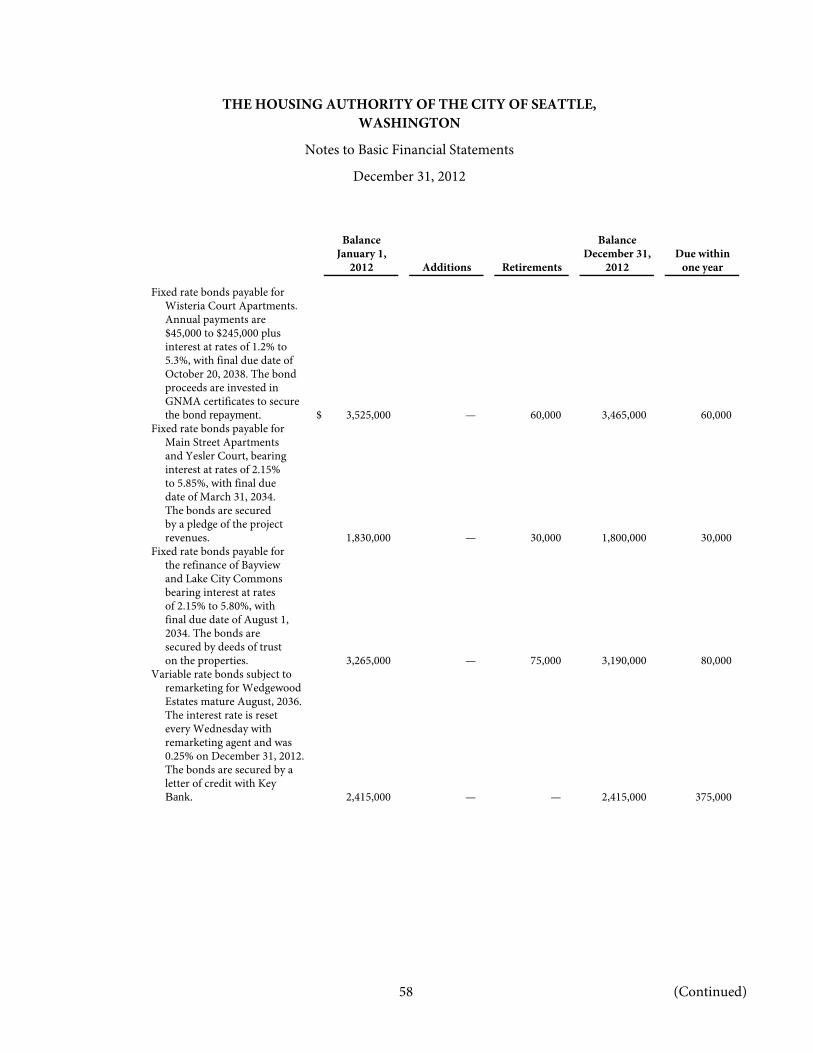
THE HOUSING AUTHORITY OF THE CITY OF SEATTLE, WASHINGTON
Notes to Basic Financial Statements
December 31, 2012
58 (Continued)
Balance BalanceJanuary 1, December 31, Due within
2012 Additions Retirements 2012 one year
Fixed rate bonds payable forWisteria Court Apartments.Annual payments are$45,000 to $245,000 plusinterest at rates of 1.2% to5.3%, with final due date ofOctober 20, 2038. The bondproceeds are invested inGNMA certificates to securethe bond repayment. $ 3,525,000 — 60,000 3,465,000 60,000
Fixed rate bonds payable forMain Street Apartmentsand Yesler Court, bearinginterest at rates of 2.15%to 5.85%, with final duedate of March 31, 2034.The bonds are securedby a pledge of the projectrevenues. 1,830,000 — 30,000 1,800,000 30,000
Fixed rate bonds payable forthe refinance of Bayviewand Lake City Commonsbearing interest at ratesof 2.15% to 5.80%, withfinal due date of August 1,2034. The bonds aresecured by deeds of truston the properties. 3,265,000 — 75,000 3,190,000 80,000
Variable rate bonds subject toremarketing for WedgewoodEstates mature August, 2036.The interest rate is resetevery Wednesday withremarketing agent and was0.25% on December 31, 2012.The bonds are secured by aletter of credit with KeyBank. 2,415,000 — — 2,415,000 375,000

THE HOUSING AUTHORITY OF THE CITY OF SEATTLE, WASHINGTON
Notes to Basic Financial Statements
December 31, 2012
59 (Continued)
Balance BalanceJanuary 1, December 31, Due within
2012 Additions Retirements 2012 one year
Variable rate bonds subject toremarketing for DouglasApartments rehabilitationproject and matureJune 2040. The interest rateis reset every Wednesdaywith remarketing agent andwas 0.29% onDecember 31, 2012. Thebonds are secured by a letterof credit with Key Bank. $ 1,950,000 — 20,000 1,930,000 60,000
Fixed rate bonds for New Hollyphase I acquired from HollyPark Limited partnership.Interest rates are 4.7-5.9%payable twice a year. Thebonds matureJanuary 1, 2030. 4,415,000 — 135,000 4,280,000 140,000
Total bondspayable 79,675,557 — 2,546,893 77,128,664 8,304,789
Accrued compensatedabsences 3,267,635 2,462,508 2,604,409 3,125,734 343,832
Total long-termobligations $ 138,164,783 9,120,726 17,466,157 129,819,352 18,005,790
For variable rate bonds, the Authority estimated interest payments based on the interest rates in effect at the end of the fiscal year and principal payments based on the maturity date on the bond indentures assuming the bonds will not be called before the maturity dates.

THE HOUSING AUTHORITY OF THE CITY OF SEATTLE, WASHINGTON
Notes to Basic Financial Statements
December 31, 2012
60 (Continued)
The following is a summary of debt service requirements of the Authority for long-term obligations as of December 31, 2012:
TotalBonds Notes Principal Interest
2013 $ 12,098,725 10,667,549 17,661,958 5,104,316 2014 6,423,664 3,636,895 5,363,975 4,696,584 2015 6,363,037 1,576,896 3,452,428 4,487,505 2016 6,367,994 1,576,898 3,620,934 4,323,958 2017 6,390,585 1,776,903 4,013,630 4,153,858 2018 – 2022 31,945,086 7,268,228 21,346,033 17,867,281 2023 – 2027 30,459,331 7,674,806 26,123,957 12,010,180 2028 – 2032 14,396,957 6,535,220 14,659,947 6,272,230 2033 – 2037 3,859,200 8,303,142 9,111,507 3,050,835 2038 – 2042 590,806 13,785,541 12,985,249 1,391,098 2043 – 2047 — 3,821,093 3,376,343 444,750 2048 – 2052 — 1,066,977 879,273 187,704 2053 – 2057 — 187,430 — 187,430 2058 – 2062 — 3,911,654 3,769,124 142,530 2063 – 2067 — 329,260 329,260 —
Totalrequirements $ 118,895,385 72,118,492 126,693,618 64,320,259
There are several limitations and restrictions contained in the various debt instruments primarily requiring the Authority to maintain certain levels of low-income tenants. Authority management believes it is in compliance with all significant limitations and restrictions. As of December 31, 2012, all bond issues met debt coverage ratio requirements. Failure to meet debt coverage ratio requirements does not constitute an event of default under related bond documents.
(b) Conduit Debt
The Authority has issued special revenue bonds to provide financial assistance to not-for-profit agencies and private developers for the purpose of constructing low-income housing. The bonds are limited obligation bonds of the Authority and are payable solely from project revenue. These nonrecourse conduit bonds are secured by the property financed and are often collateralized by a letter of credit issued by a major bank. The Authority is not obligated in any manner, and accordingly, the bonds have not been recorded in the accompanying financial statements.
As of December 31, 2012, there were 48 series of these special revenue bonds outstanding. The aggregate principal amount payable for the series issued after September 30, 1996 was $318,756,110. The aggregate principal amount payable for the 10 series issued prior to October 1, 1996 could not be determined; their original issue amount totaled $41,769,554.

THE HOUSING AUTHORITY OF THE CITY OF SEATTLE, WASHINGTON
Notes to Basic Financial Statements
December 31, 2012
61 (Continued)
(c) Component Unit Debt
The Ravenna School Limited Partnership has outstanding debt in the amount of $529,727 payable to the Authority at December 31, 2012. Two notes for $131,115 and $398,612 are payable by December 31, 2039 and bear interest at 1% per year.
The Othello Street Limited Partnership (OSLP) has bonds outstanding at December 31, 2012 of $2,080,000. The bonds were issued by the Authority on behalf of the component unit and are backed by a deed of trust on OSLP’s leasehold interest in the Holly Park redevelopment project. The bonds are further secured by a pledge of the Authority’s unobligated general revenue. The bonds bear interest at 7.0% per year and mature on January 1, 2032.
As of December 31, 2012, OSLP has other long-term debt totaling $8,195,384. Of this, $6,195,384 represents the general partner loans made by the Authority and is secured by liens on OSLP’s property. These loans accrue interest at the annual rate of 1%, and interest-only payments on the outstanding principal balances are due to the general partner from available net cash flows. As of December 31, 2012, no interest payments had been made to the Authority. The remaining $2,000,000 represents a loan from the Washington State Office of Assistance Program. Payments of principal and interest are deferred for 30 years until December 31, 2032, with interest accruing at 1% per annum during the deferral period. Beginning December 31, 2032, all unpaid principal and accrued interest will be paid over 20 years, with annual payments of $149,383.
The Desdemona Limited Partnership (DLP) has fixed rate bonds outstanding at December 31, 2012 of $7,085,000. The bonds were issued by the Authority on behalf of the component unit and are backed by an irrevocable letter of credit issued by Key Bank and secured by a deed of trust on DLP’s leasehold interest in the Holly Park redevelopment project. The bonds are further secured by a pledge of the Authority’s unobligated general revenue. At December 31, 2012, the interest rate on the bonds ranged from 6.0% to 6.25%, based on the maturity schedule in the First Supplemental Trust Indenture. The bonds mature on December 1, 2035.
As of December 31, 2012, DLP has other long-term debt totaling $16,955,806 secured by liens on DLP’s property. Of this, $12,889,135 represents the general partner loans made by the Authority and is secured by liens on DLP’s property. These loans accrue interest at the annual rate of 1%, and interest-only payments on the outstanding principal balances are due to the general partner from available net cash flows. As of December 31, 2012, no interest payments had been made to the Authority. DLP also has a loan from the State of Washington Department of Community, Trade, and Economic Development, Office of Community Development in the amount of $2,000,000. Payments of principal and interest are deferred for 10 years until December 1, 2015, with interest accruing at 1% per annum during the deferral period. Beginning December 1, 2015, all unpaid principal and accrued interest will be paid over 20 years, with annual payments of $22,104 for the first 10 years and $122,060 for the remaining 10 years and the final payment due on or before October 1, 2045. The

THE HOUSING AUTHORITY OF THE CITY OF SEATTLE, WASHINGTON
Notes to Basic Financial Statements
December 31, 2012
62 (Continued)
DLP also owes the City for a loan in the amount of $2,066,671. The loan accrues interest at 1% annually and matures on August 7, 2053. Payments of principal and interest begin June 30, 2006 from available net cash flows.
The Escallonia Limited Partnership (ELP) has bonds outstanding at December 31, 2012 totaling $4,645,000. The bonds were issued by the Authority on behalf of the component unit and are backed by a deed of trust on ELP’s leasehold interest in the Rainier Vista redevelopment project. The bonds are further secured by a pledge of the Authority’s unobligated general revenue. Interest is due monthly at a fixed rate of 3.98% under the interest rate swap agreement on the variable rate bonds. The bonds mature on December 1, 2036.
As of December 31, 2012, ELP has other long-term debt totaling $23,347,094 of general partner loans made by the Authority and secured by liens on ELP’s property. These loans accrue noncompounding interest at the annual rate of 1% and mature in fiscal year 2058. Interest-only payments on the loans are due to the general partner from available net cash flows. As of December 31, 2012, no interest payments had been made to the Authority.
The High Point North Limited Partnership (HPNLP) has fixed rate bonds outstanding at December 31, 2012 totaling $9,463,365. The bonds were issued by the Authority on behalf of the component unit and are backed by a deed of trust on HPNLP’s leasehold interest in the High Point Phase I redevelopment project. The bonds are further secured by a pledge of the Authority’s unobligated general revenue. At December 31, 2012, interest was 5.295%. The bonds mature on June 1, 2036.
As of December 31, 2012, HPNLP has other long-term debt totaling $27,152,733. Of this, $25,152,734 represents the general partner loans made by the Authority and is secured by liens on HPNLP’s property. These loans accrue compounding interest at the annual rate of 1% and mature in fiscal year 2054. Interest-only payments on the loans are due to the general partner from available net cash flows. As of December 31, 2012, no interest payments had been made to the Authority. The remaining $2,000,000 represents a loan from the State of Washington Housing Assistance Program. Payments of principal and interest are deferred for 12 years, with interest accruing at 1% a year during the deferral period. Beginning April 30, 2016, quarterly interest payments are due, and beginning April 30, 2021, quarterly payments of principal and interest are required until the final maturity date of January 31, 2046.
The High Point South Limited Partnership (HPSLP) has bonds outstanding at December 31, 2012 totaling $15,785,000. The bonds were issued by the Authority on behalf of the component unit and are backed by a deed of trust on HPSLP’s leasehold interest in the High Point Phase II redevelopment project. The bonds are further secured by a pledge of the Authority’s unobligated general revenue. Interest is due monthly at a fixed rate of 3.98% through an interest rate swap agreement, and at the

THE HOUSING AUTHORITY OF THE CITY OF SEATTLE, WASHINGTON
Notes to Basic Financial Statements
December 31, 2012
63 (Continued)
variable rate of 65.01% of the one month LIBOR rate plus 2.54%. The bonds mature on March 1, 2039.
As of December 31, 2012, HPSLP has other long-term debt totaling $15,212,665. Of this, $13,212,665 represents the general partner loans made by the Authority and is secured by liens on HPSLP’s property. These loans accrue noncompounding interest at the annual rate of 1% and mature in fiscal year 2062. Interest-only payments on the loans are due to the general partner from available net cash flows. As of December 31, 2012, no interest payments had been made to the Authority. The remaining $2,000,000 represents a loan from the State of Washington Housing Trust Fund. Payments of principal and interest are deferred for 12 years, with interest accruing at 1% a year during the deferral period. Beginning December 31, 2019, quarterly interest payments are due, and beginning December 31, 2029, quarterly payments of principal and interest are required until the final maturity date of September 30, 2059.
The Ritz Apartments Limited Partnership (RALP) has total loans outstanding totaling $1,836,361 as of December 31, 2012. The construction loan of $1,010,515 bears interest at 5.496%, requires monthly principal and interest payments, and is due September 1, 2036.
As of December 31, 2012, RALP has other long-term notes payable outstanding totaling $825,856. Of this amount, $560,000 represents a note to the City that bears simple interest at 1% annually. Payments are due annually beginning June 30, 2006 from available net cash flows and the note is payable in full by August 9, 2054. The remaining $265,856 is payable to the general partner and bears interest at 1% annually. Payments are due annually beginning March 30, 2006 from available net cash flows, with final maturity on December 31, 2054.
The Alder Crest Limited Partnership (ACLP) has outstanding long-term obligations in the amount of $2,370,092 as of December 31, 2012. Of this amount, $992,283 represents a loan payable to the City that bears interest at 1% per annum and matures March 31, 2057. ACLP also has a loan payable to the City in the amount of $111,124. The loan bears interest at 2% per annum and matures March 31, 2057. The loan is secured by a third deed of trust on the property. ALP has a loan payable to the State in the amount of $1,046,685. Of this amount, $496,685 requires quarterly payments. The entire amount bears no interest and is payable in full March 31, 2057. In addition, ACLP also has other borrowings outstanding in the amount of $220,000 from the Authority which bears interest at 5% per annum and is secured by a fourth deed of trust on the property and matures March 31, 2057.
The High Rise Rehabilitation Phase I Limited Partnership (HRRILP) has long-term obligations totaling $24,000,000 as of December 31, 2012. Of this, $12,000,000 represents a promissory note from the general partner made by the Authority and secured by a deed of trust encumbering HRRILP’s interest in the project. During the rehabilitation phase of the project, interest-only payments are due quarterly beginning April 1, 2006, with interest accruing at a rate of 4.82%. After the rehabilitation stage, principal and interest shall be paid from available cash flows at an annual interest rate of
THE HOUSING AUTHORITY OF THE CITY OF SEATTLE, WASHINGTON
Notes to Basic Financial Statements
December 31, 2012
64 (Continued)
2.75%. The loan matures on January 1, 2046. The HRRILP has another loan from the general partner made by the Authority and secured by the land, buildings, and improvements in the amount of $12,000,000 as of December 31, 2012. During the rehabilitation phase of the project, interest only payments are due quarterly beginning April 1, 2006, with interest accruing at a rate of 4.82%. After the rehabilitation stage, principal and interest shall be paid from available cash flows at an annual interest rate of 2.75%. The loan matures on January 1, 2046.
The Seattle High Rise Limited Partnership Phase II (SHRIILP) has long-term obligations totaling $28,051,551 as of December 31, 2012. Of this, $12,000,000 represents a promissory note from the general partner made by the Authority and secured by a deed of trust encumbering SHRIILP’s interest in the project. During the rehabilitation phase of the project, interest-only payments are due quarterly beginning April 1, 2007, with interest accruing at a rate of 4.88%. After the rehabilitation stage, principal and interest shall be paid from available cash flows at an annual interest rate of 3.5%. The loan matures on December 21, 2046. The SHRIILP has another loan from the general partner made by the Authority and secured by the land, buildings, and improvements in the amount of $16,051,551 as of December 31, 2012. During the rehabilitation phase of the project, interest-only payments are due quarterly beginning April 1, 2007, with interest accruing at a rate of 4.6%. After the rehabilitation stage, principal and interest shall be paid from available cash flows at an annual interest rate of 3.5%. The loan matures on December 21, 2046.
The Seattle High Rise Limited Partnership Phase III (SHRIIILP) has long-term obligations totaling $20,950,000 as of December 31, 2012. Of this, $9,200,000 represents a promissory note from the general partner made by the Authority and secured by a deed of trust encumbering SHRIIILP’s interest in the project. During the rehabilitation phase of the project, interest-only payments are due quarterly beginning April 1, 2008, with interest accruing at a rate of 4.13%. After the rehabilitation stage, principal and interest shall be paid from available cash flows at an annual interest rate of 4.25%. The loan matures on December 19, 2047. The SHRIIILP has another loan from the general partner made by the Authority and secured by the land, buildings, and improvements in the amount of $11,750,000 as of December 31, 2012. During the rehabilitation phase of the project, interest-only payments are due quarterly beginning April 1, 2008, with interest accruing at a rate of 5.04%. After the rehabilitation stage, principal and interest shall be paid from available cash flows at an annual interest rate of 5.04%. The loan matures on December 19, 2047.
The Douglas Apartments Limited Partnership (DALP) has outstanding long-term obligations in the amount of $8,050,000 as of December 31, 2012. Of this amount, $3,650,000 represents a loan payable to the City that bears interest at 2% per annum and matures June 30, 2060. Also, the DALP has a long-term note payable to the Authority in the amount of $1,900,000 which bears interest at 4.8% annually and matures June 1, 2040. The DALP has another note payable to the Department of Commerce with the face amount of $2,500,000. The note bears no interest and is payable on June 30, 2060.

THE HOUSING AUTHORITY OF THE CITY OF SEATTLE, WASHINGTON
Notes to Basic Financial Statements
December 31, 2012
65 (Continued)
As of December 31, 2012, Tamarack Place Limited Partnership (TPLP) has outstanding long-term obligations in the amount of $11,383,947. Of this amount, $983,947 represents a fixed rate construction loan payable to Washington Community Reinvestment Association (WCRA). As of December 31, 2012, the rate was 6.5%. In addition, the TPLP has a loan payable to the Authority in the amount of $10,400,000. The loan bears interest at 1% per annum and is secured by a leasehold deed of trust on the project.
As of December 31, 2012 Lake City Village Limited Liability Limited Partnership (LCVLLLP) has outstanding long-term obligations in the amount of $27,906,471. Of this amount, $9,872,966 represents a variable rate construction loan payable to Key Bank. As of December 31, 2012, the rate was 1.9875%. In addition, the LCVLLLP has a note payable to the Authority in the amount of $16,358,505. The loan bears interest at 0.8% per annum and is secured by a leasehold dead of trust on the project. LCVLLLP also has a lease payable to the Authority in the amount $1,675,000, which is payable from available cash flows.
As of December 31, 2012, Rainier Vista Northeast Limited Liability Limited Partnership (RVNLLLP) has outstanding long-term obligations in the amount of $19,304,268. In December of 2012, RVNLLP retired all outstanding variable bonds in the amount of $12,844,920. In connection with the bond retirement, a new fixed rate note payable to U.S. Bank was established in the amount of $2,700,000 which is secured by a deed of trust on the property. As of December 31, 2012, the note had a rate of 4.83% and had an outstanding balance of $2,700,000. The remaining long-term obligation balance consists of two loans payable to the Authority. Loan one bears interest at 1.5% per annum and is secured by a leasehold deed of trust on the project. As of December 31, 2012, $10,000,000 was outstanding. Loan two bears interest at 1.5% per annum and is also secured by a leasehold deed of trust on the project. As of December 31, 2012, $6,604,268 was outstanding.
As of December 31, 2012 1105 E Fir Limited Liability Limited Partnership (EFLLLP), has outstanding obligations in the amount of $953,897 for a predevelopment loan from the Authority that bears no interest. Repayment is expected in 2013 when permanent funding is received by the limited partnership.

THE HOUSING AUTHORITY OF THE CITY OF SEATTLE, WASHINGTON
Notes to Basic Financial Statements
December 31, 2012
66 (Continued)
The following is a summary of changes in long-term obligations for the component units:
Balance BalanceJanuary 1, Additions/ December 31, Due within
2012 transfers Retirements 2012 one year
Loans payable to primarygovernment from RavennaSchool Limited Partnership $ 529,727 — — 529,727 —
Loans payable to primarygovernment from OthelloStreet Limited Partnership 6,195,384 — — 6,195,384 —
Loan payable to WashingtonState Office of AssistanceProgram from Othello StreetLimited Partnership 2,000,000 — — 2,000,000 —
Loans payable to primarygovernment from DesdemonaLimited Partnership 12,889,135 — — 12,889,135 —
Loan payable to WashingtonState Housing Trust fundfrom Desdemona LimitedPartnership 2,000,000 — — 2,000,000 —
Operating deficit loan payablefrom Desdemona LimitedPartnership to primarygovernment 51,759 — 51,759 — —
Loan payable to City of SeattleHOME fund fromDesdemona LimitedPartnership 2,066,671 — — 2,066,671 —
Loans payable to primarygovernment from EscalloniaLimited Partnership 23,347,094 — — 23,347,094 —

THE HOUSING AUTHORITY OF THE CITY OF SEATTLE, WASHINGTON
Notes to Basic Financial Statements
December 31, 2012
67 (Continued)
Balance BalanceJanuary 1, Additions/ December 31, Due within
2012 transfers Retirements 2012 one year
Loans payable to primarygovernment from High PointNorth Limited Partnership $ 25,152,734 — — 25,152,734 —
Loan payable to WashingtonState Housing Trust fundfrom High Point NorthLimited Partnership 2,000,000 — — 2,000,000 —
Loans payable to primarygovernment from High PointSouth Limited Partnership 13,212,665 — — 13,212,665 —
Loan payable to WashingtonState Housing Trust fundfrom High Point SouthLimited Partnership 2,000,000 — — 2,000,000 —
Loans payable to primarygovernment from the RitzApartments LimitedPartnership 265,856 — — 265,856 —
Loans payable to the City ofSeattle from the RitzApartments LimitedPartnership 560,000 — — 560,000 —
Loans payable to WashingtonMutual from the RitzApartments LimitedPartnership 1,030,640 — 20,135 1,010,505 21,270
Loan payable to City ofSeattle from Alder CrestLimited Partnership 992,283 — — 992,283 —
Loan payable to City ofSeattle from Alder CrestLimited Partnership 111,124 — — 111,124 —
Loan payable to primarygovernment from AlderCrest Limited Partnership 220,000 — — 220,000 —
Loan payable to WashingtonState Housing Trust fundfrom Alder CrestLimited Partnership 1,057,909 — 11,224 1,046,685 11,224
Loans payable to primarygovernment from High RiseRehabilitation Phase ILimited Partnership 24,000,000 — — 24,000,000 —

THE HOUSING AUTHORITY OF THE CITY OF SEATTLE, WASHINGTON
Notes to Basic Financial Statements
December 31, 2012
68 (Continued)
Balance BalanceJanuary 1, Additions/ December 31, Due within
2012 transfers Retirements 2012 one year
Loans payable to primarygovernment from SeattleHigh Rise RehabilitationPhase II Limited Partnership $ 28,051,551 — — 28,051,551 —
Loans payable to primarygovernment from Seattle HighRise Rehabilitation Phase IIILimited Partnership 20,950,000 — — 20,950,000 —
Loan payable to City of Seattlefrom Douglas ApartmentsLimited Partnership 3,650,000 — — 3,650,000 —
Loan payable to primarygovernment from DouglasApartments LimitedPartnership 1,950,000 — 50,000 1,900,000 30,000
Loan payable tothe Department ofCommerce from DouglasApartments 2,500,000 — — 2,500,000 —
Loans payable to primarygovernment from TamarackPlace Limited Partnership 10,400,000 — — 10,400,000 —
Loan payable to WCRA fromTamarck Place LimitedPartnership 995,431 — 11,484 983,947 12,253
Loans payable to primarygovernment from RainierVista North East LLLP 9,824,792 6,779,476 — 16,604,268 —
Loan payable to US Bank forconstruction of Rainier VistaNorth East — 2,700,000 — 2,700,000 48,721
Loan payable to Key Bank forconstruction at Lake CityVillage LLLP 9,367,397 505,569 — 9,872,966 9,872,966
Loan payable to primarygovernment from Lake CityVillage LLLP 16,051,467 307,038 — 16,358,505 —
Lease payable to primarygovernment from Lake CityVillage LLLP 1,675,000 — — 1,675,000 —
Loan payable to primarygovernment from 1105 EFir LLLP for predevelopment — 953,897 — 953,897 953,897
Total notespayable 225,098,619 11,245,980 144,602 236,199,997 10,950,331

THE HOUSING AUTHORITY OF THE CITY OF SEATTLE, WASHINGTON
Notes to Basic Financial Statements
December 31, 2012
69 (Continued)
Balance BalanceJanuary 1, Additions/ December 31, Due within
2012 transfers Retirements 2012 one year
Bonds payable – Othello StreetLimited Partnership $ 2,130,000 50,000 2,080,000 50,000
Bonds payable – DesdemonaLimited Partnership 7,230,000 145,000 7,085,000 150,000
Bonds payable – EscalloniaLimited Partnership 4,750,000 105,000 4,645,000 110,000
Bonds payable – High PointNorth Limited Partnership 9,662,476 199,111 9,463,365 208,992
Bonds payable – High PointSouth Limited Partnership 16,025,000 240,000 15,785,000 240,000
Bonds payable – Rainier VistaNortheast LLLP 9,146,083 3,698,837 12,844,920 — —
Total bondspayable 48,943,559 3,698,837 13,584,031 39,058,365 758,992
Total long-termobligations $ 274,042,178 14,944,817 13,728,633 275,258,362 11,709,323
Debt service requirements of long-term obligations of the component units as of December 31, 2012 are as follows:
TotalBonds Notes Principal Interest
2013 $ 2,644,935 15,589,842 11,709,323 6,525,454 2014 2,674,704 4,742,079 953,258 6,463,525 2015 2,691,864 4,754,523 1,014,916 6,431,471 2016 17,345,278 4,793,747 15,727,127 6,411,898 2017 1,779,248 4,786,170 795,986 5,769,432 2018 – 2023 11,547,853 25,861,667 10,203,476 27,206,044 2023 – 2027 7,420,264 23,966,160 5,457,570 25,928,854 2028 – 2032 7,401,464 24,847,523 7,511,389 24,737,598 2033 – 2037 4,170,582 25,548,102 6,521,128 23,197,556 2038 – 2042 — 25,443,002 2,872,875 22,570,127 2043 – 2047 — 94,347,951 74,381,383 19,966,568 2048 – 2052 — 26,935,095 17,403,259 9,531,836 2053 – 2057 — 37,998,649 30,336,160 7,662,489 2058 – 2062 — 76,527,933 72,337,007 4,190,926 2063 – 2067 — 19,358,701 18,033,505 1,325,196
Total — requirements $ 57,676,192 415,501,144 275,258,362 197,918,974

THE HOUSING AUTHORITY OF THE CITY OF SEATTLE, WASHINGTON
Notes to Basic Financial Statements
December 31, 2012
70 (Continued)
(8) Unearned Revenue – Operating Leases
The Authority leased the building and land of the Ritz Apartments to the Ritz Apartments Limited Partnership (RALP) beginning in August 2004. The lease term is 75 years and the Authority has received all required payments. The lease includes a purchase option in which RALP has the right to require the Authority to convey legal title to the property for a total purchase price equal to $1 plus the sum of the amount remaining to be paid or outstanding on the bonds any time after all lease payments have been made. Assets held for lease included the land of $194,480 and building and improvements with a cost of $1,395,225 and accumulated depreciation at December 31, 2012 of $319,652.
The Authority leased the building and land of the Alder Crest Apartments to the Alder Crest Limited Partnership (ACLP) beginning in December 2005. The lease matures December 31, 2080. The lease includes a purchase option in which ACLP has the right to require the Authority to convey legal title to the property for a total purchase price of $1 any time after December 31, 2104. The Authority has received all payments required under the terms of the lease. Assets held for lease included land of $595,017 and building and improvements with a cost of $1,405,230 and accumulated depreciation at December 31, 2012 of $298,659.
The High Rise Rehabilitation Phase I Limited Partnership (HRRILP) has leased seven public housing buildings and the related land from the Authority for the purpose of rehabilitating and operating the properties. The initial lease amount was $11,434,751 and all payments have been received. The lease matures December 31, 2104. Assets held for lease included land of $982,235 and building and improvements with a cost of $17,052,143 and accumulated depreciation at December 31, 2012 of $16,442,143.
The Seattle High Rise Phase II Limited Partnership (SHRIILP) has leased seven public housing buildings and the related land from the Authority for the purpose of rehabilitating and operating the properties. The initial lease amount was $11,062,522 and all payments have been received. The lease matures December 31, 2105. Assets held for lease included land of $804,323 and building and improvements with a cost of $16,997,451 and accumulated depreciation at December 31, 2012 of $16,296,332.
The Seattle High Rise Phase III Limited Partnership (SHRIIILP) has leased seven public housing buildings and the related land from the Authority for the purpose of rehabilitating and operating the properties. The initial lease amount was $10,510,573 and the last required payment was received during the year. The lease matures December 31, 2106. Assets held for lease included land of $1,088,828 and building and improvements with a cost of $18,442,567 and accumulated depreciation at December 31, 2012 of $16,756,131.
The Authority leased the building and land of the Douglas Apartments to the Douglas Apartments Limited Partnership (DALP) beginning in December 2008. The lease matures December 31, 2083. The lease includes a purchase option in which DALP has the right to require the Authority to convey legal title to the

THE HOUSING AUTHORITY OF THE CITY OF SEATTLE, WASHINGTON
Notes to Basic Financial Statements
December 31, 2012
71 (Continued)
property for a total purchase price of $1 any time after December 31, 2058. The Authority has received all payments required under the terms of the lease. Assets held for lease included land of $813,062 and building and improvements with a cost of $2,856,708 and accumulated depreciation at December 31, 2012 of $422,294.
The Lake City Village LLLP has leased land and improvements to the Authority beginning May, 2010 for the purpose of constructing an 86 unit affordable apartment building in northeast Seattle. The initial lease amount was $1,075,000, the remaining $1,675,000 is in the form of a note payable to the Authority no later than May 1, 2065 and payments are subject to available cash flow of the partnership. The lease matures December 31, 2109. Assets held for lease include land with a cost of $951,658.
Unearned lease payments are shown as unearned revenue on the statement of net position. The LCVLLP has payments due to the Authority in the amount of $1,675,000. The following schedule shows related unearned rental revenue as of December 31, 2012.
Original Unearnedlease amount revenue
Ritz Apartments $ 1,600,000 1,422,224 High Rise Rehabilitation, Phase I 11,434,750 10,626,531 Alder Crest Apartments 1,935,000 1,754,400 High Rise Rehabilitation, Phase II 12,171,533 11,430,231 High Rise Rehabilitation, Phase III 11,446,098 10,864,008 Douglas Apartments 3,650,000 3,455,332 Lake City Village LLLP 2,750,000 1,040,724
Total $ 44,987,381 40,593,450
(9) Pension Plans
Substantially all of the Authority’s full-time and qualifying part-time employees participate in the Washington State Public Employees Retirement System (PERS), a defined benefit, cost-sharing, multiple-employer public employee retirement system.
(a) Plan Description
The State legislature established PERS in 1947 under RCW Chapter 41.40. Membership in the system includes: elected officials; State employees; employees of the Supreme, Appeals, and Superior courts (other than judges); employees of legislative committees; college and university employees not in national higher education retirement programs; judges of district and municipal courts; noncertificated employees of school districts; and employees of local government. Approximately 50% of PERS members are State employees. PERS contains three tiers (Plans). Participants who joined the system by September 30, 1977 are enrolled in Plan I, while those joining thereafter are

THE HOUSING AUTHORITY OF THE CITY OF SEATTLE, WASHINGTON
Notes to Basic Financial Statements
December 31, 2012
72 (Continued)
enrolled in Plan II. Plan III applies to all employees joining after September 1, 2002 and employees in Plan II were allowed to transfer to Plan III during the period from September 1, 2002 to May 31, 2003. Retirement benefits are financed from employee and employer contributions and investment earnings. Retirement benefits in both Plan I and Plan II are vested after completion of 5 years of eligible service. Plan III members are vested after 10 years for new employees and 5 years for employees transferring from Plan II to Plan III.
Plan I members are eligible for retirement after 30 years of service, or at the age of 60 with 5 years of service, or at the age of 55 with 25 years of service. The annual retirement benefit is 2% of the final average salary per year of service, capped at 60%. Final average salary is based on the 24 consecutive highest-paid months.
Plan II members may retire at the age of 65 with 5 years of service, or at 55 with 20 years of service. The annual retirement benefit is 2% of the final average salary per year of service. Final average salary is based on the 60 consecutive highest-paid creditable months. Plan II retirements prior to age 65 are actuarially reduced. There is no cap on years of service credit and a cost-of-living allowance is granted, capped at 3% annually.
Plan III members may retire at the age of 65 with at least 10 years of service, or 5 years of service including one year of service after reaching age 55, or 5 years of service under Plan II. The annual retirement benefit is 1% of the final average salary per year of service. Final average salary is based on the 60 consecutive highest-paid creditable months. Plan III retirements prior to age 65 are actuarially reduced. There is no cap on years of service credit and a cost-of-living allowance is granted, capped at 3% annually. There is also a defined contribution component of this plan, and the amount varies between 5% and 15% depending on the option chosen by the employee.
The Authority’s payroll covered under PERS was $30,469,939 for the year ended December 31, 2012. Total payroll for the year ended December 31, 2012 was $30,680,472.
(b) Contributions
Each biennium, the legislature establishes Plan I and Plan III employer contribution rates and Plan II employer and employee contribution rates. Employee contribution rates for Plan I are established by legislative statute and do not vary from year to year. Employer rates for Plan I are not necessarily adequate to fully fund the system. The employer and employee contribution rates for Plan II and for Plan III are developed by the Office of the State Actuary to fully fund the system. The methods used to determine the contribution requirements were established under State statute. All employers are required to contribute at the level established by the legislature and the Office of the State Actuary.
The actual contribution rates for the employer were changed twice during the year. Effective April 27th, 2012 employer rates were decreased from 7.25% to 7.08% for all plans. And, effective
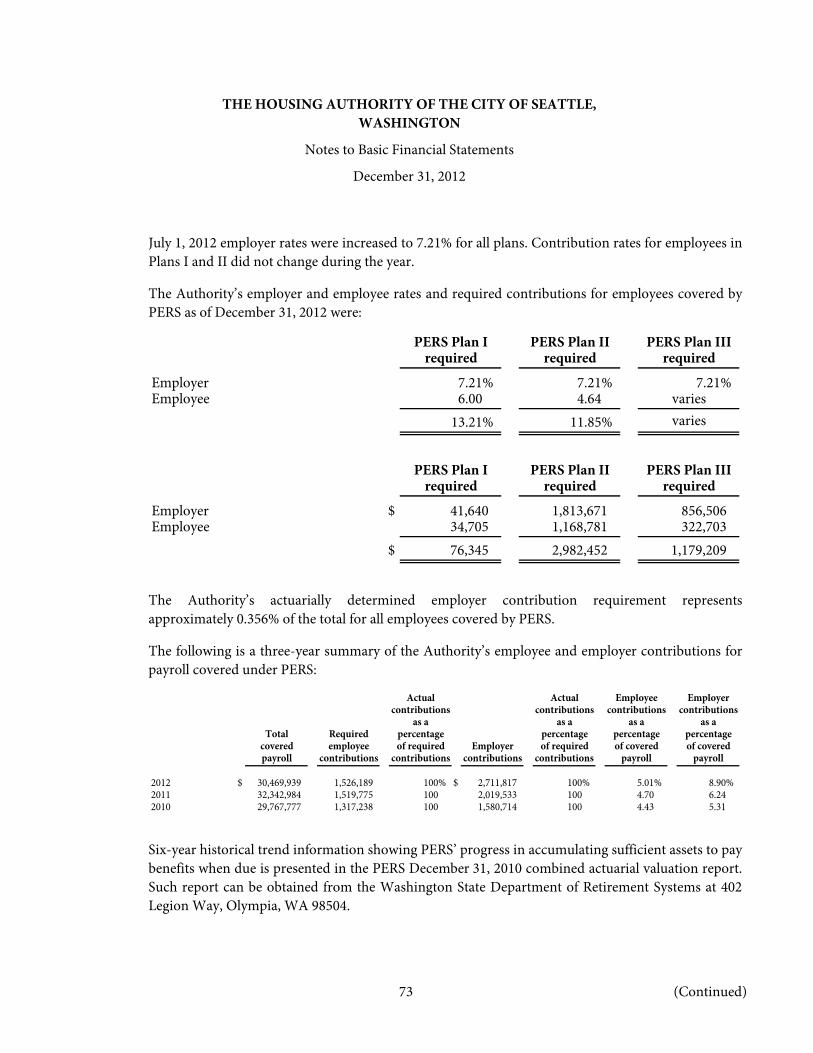
THE HOUSING AUTHORITY OF THE CITY OF SEATTLE, WASHINGTON
Notes to Basic Financial Statements
December 31, 2012
73 (Continued)
July 1, 2012 employer rates were increased to 7.21% for all plans. Contribution rates for employees in Plans I and II did not change during the year.
The Authority’s employer and employee rates and required contributions for employees covered by PERS as of December 31, 2012 were:
PERS Plan I PERS Plan II PERS Plan IIIrequired required required
Employer 7.21% 7.21% 7.21%Employee 6.00 4.64 varies
13.21% 11.85% varies
PERS Plan I PERS Plan II PERS Plan IIIrequired required required
Employer $ 41,640 1,813,671 856,506 Employee 34,705 1,168,781 322,703
$ 76,345 2,982,452 1,179,209
The Authority’s actuarially determined employer contribution requirement represents approximately 0.356% of the total for all employees covered by PERS.
The following is a three-year summary of the Authority’s employee and employer contributions for payroll covered under PERS:
Actual Actual Employee Employercontributions contributions contributions contributions
as a as a as a as aTotal Required percentage percentage percentage percentage
covered employee of required Employer of required of covered of coveredpayroll contributions contributions contributions contributions payroll payroll
2012 $ 30,469,939 1,526,189 100% $ 2,711,817 100% 5.01% 8.90%2011 32,342,984 1,519,775 100 2,019,533 100 4.70 6.242010 29,767,777 1,317,238 100 1,580,714 100 4.43 5.31
Six-year historical trend information showing PERS’ progress in accumulating sufficient assets to pay benefits when due is presented in the PERS December 31, 2010 combined actuarial valuation report. Such report can be obtained from the Washington State Department of Retirement Systems at 402 Legion Way, Olympia, WA 98504.

THE HOUSING AUTHORITY OF THE CITY OF SEATTLE, WASHINGTON
Notes to Basic Financial Statements
December 31, 2012
74 (Continued)
(10) Deferred Compensation Plan
The Authority, in conjunction with the State, offers its employees a deferred compensation plan created in accordance with Internal Revenue Code Section 457. The plan is managed by the Washington State Department of Retirement Systems. In June 1998, the State Deferred Compensation Program plan assets were placed into trust for the exclusive benefit of participants and their beneficiaries. Pursuant to GASB Statement No. 32, Accounting and Financial Reporting for Internal Revenue Code Section 457 Deferred Compensation Plans, since the Authority is not the owner of these assets, the plan assets and liabilities are not reported as part of the Authority.
(11) Other Post Employment Benefits (OPEB)
(a) Plan Description and Funding Policy
The Authority participates in the City Health Care Blended Premium Subsidy, a cost-sharing multiple-employer postemployment healthcare plan administered by the City. Employees who retire from the Authority and spouses of employees who have passed away may continue medical coverage until age 65. Eligible retirees self pay 100% of the premium based on blended rates which were established by including the experience of retirees with the experience of active employees for underwriting purposes. The Authority employees are included with the City of Seattle for this plan. The Authority provides implicit subsidy of the post-retirement health insurance costs and funds the subsidy on a pay as you go basis. The postemployment benefit provisions are established and may be amended by City Ordinances.
(b) OPEB Obligation
The actuarial valuation is updated biannually. The most recent actuarial valuation was as of January 1, 2012. The net OPEB obligation is recorded on the statement of net position as of December 31, 2012, which is calculated based on the excess of Annual Required Contribution over the actual contribution.

THE HOUSING AUTHORITY OF THE CITY OF SEATTLE, WASHINGTON
Notes to Basic Financial Statements
December 31, 2012
75 (Continued)
(c) Funded Status and Funding Progress
As of December 31, 2012, based on the actuarial valuation dates for each of the plans, the unfunded actuarial accrued liability (UAAL) was equal to the actuarial accrued liability (AAL) due to the Authority’s pay-as-you-go policy. Following is the funded status (in thousands) for the plans as of December 31, 2012:
Actuarial valuation date January 1, 2012Actuarial value of assets (a) $ — Entry age normal AAL (b) 2,273,000
UAAL (b-a) $ 2,273,000
Funded ratio (a/b)Covered payroll $ 30,469,939 UAAL as a percentage of covered
payroll ((b-a)/c) 7%
(d) Actuarial Methods and Assumptions
Projections of benefits are based on the substantive plan (the plan as understood by the employer and plan members) and include the types of benefits in force at the time of the valuation and the pattern of sharing of benefit costs between the employer and plan members to that point. Actuarial calculations reflect a long-term perspective and employ methods and assumptions that are designed to reduce short-term volatility in actuarial accrued liabilities and the actuarial value of any assets.
In the January 1, 2012 actuarial valuation, the entry age normal method was used and the actuarial assumptions included a discount rate of 3.88%. The medical inflation trend rate for the City of Seattle traditional and preventative plans was 9% initially and decreasing by 0.5% each year for 4 years, then increasing 1.02% in the fifth year, decreasing 1.62% in the sixth year, 0.49% in the seventh year and 0.16% in the eighth year until it reaches an ultimate rate of 5.75%. The medical inflation trend rate for the Group Health standard and deductible plans was 8.5% initially and decreasing by 0.5% each year for 7 years until it reaches an ultimate rate of 5.0%. Unfunded actuarial accrued liability is being amortized as a level amount over past and future service. The remaining amortization period at January 1, 2012 was 30 years.
(12) Risk Management
The Authority maintains insurance against most normal hazards. Property insurance coverage is at a limit of $100 million, with a deductible of $50,000. Earthquake insurance coverage is $1 million per occurrence, with a deductible of $100,000 per occurrence. The Authority participates in the Housing Authority Risk Retention Group (HARRG) in order to obtain stable and affordable general liability insurance coverage. General liability coverage provided is $15 million per year, with a deductible of $25,000 per occurrence.

THE HOUSING AUTHORITY OF THE CITY OF SEATTLE, WASHINGTON
Notes to Basic Financial Statements
December 31, 2012
76 (Continued)
The Authority also maintains a number of other insurance policies necessary and appropriate in the normal course of business, including employee fidelity and directors and officers insurance. The amount of settlements has not exceeded insurance coverage for each year of the past three fiscal years.
The Authority’s economic risk as a participant in HARRG is limited to the Authority’s initial surplus contribution of $90,000 and the payment of annual premiums for its general liability insurance coverage. Although the underwriting experience of HARRG may result in increased annual premium charges and/or assessments against each participant’s surplus contribution account, the Authority’s exposure to any net loss allocation is restricted to its surplus contribution account balance. Based on the results of HARRG’s latest annual independent actuarial study performed in accordance with GASB Statement No. 10, Accounting and Financial Reporting for Risk Financing and Related Insurance Issues, the level of reserve maintained by HARRG has been determined to be adequate to cover estimated claim liabilities.
The Authority has elected to pay for its employment security coverage via quarterly reimbursements to the Washington State Department of Employment Security. This reimbursable method of payment is in lieu of unemployment taxes and the election is authorized for all political subdivisions under Washington State Law (RCW 50.44.060).
(13) Contingencies
In connection with various federal and State grant programs, the Authority is obligated to administer related programs and spend the grant moneys in accordance with regulatory restrictions, and is subject to audit by the grantor agencies. In cases of noncompliance, the agencies involved may require the Authority to refund program moneys. The amount, if any, of expenses, which may be disallowed by the grantor, cannot be determined at this time although the Authority expects such amount, if any, to be immaterial.
As of December 31, 2012, the Authority and its component units have outstanding construction contracts and other commitments totaling approximately $1.6 million. These commitments are primarily related to the implementation of redevelopment activities and capital projects funded by federal, State, and local financial assistance, tax-exempt bonds, and tax credit equity contributions.
The Authority is also contingently liable in connection with claims and contracts arising in the normal course of its activities. Authority management is of the opinion that the outcome of such matters will not have a material effect on the accompanying financial statements.
The possibility exists that HUD contributions may decrease in the future. In the event such contributions were significantly reduced, the Authority would need to seek other funding sources to maintain operations at current levels.

THE HOUSING AUTHORITY OF THE CITY OF SEATTLE, WASHINGTON
Notes to Basic Financial Statements
December 31, 2012
77 (Continued)
(14) Pollution Remediation
During the year, the Authority worked on two pollution remediation projects in process as follows:
• 4561 MLK Jr Way S – Work on this site was initiated in 2011 and completed in May of 2012 in preparation for sale of the property. The work involved the removal of 5 underground storage tanks and the total cost of the project was $620,000. Of this amount $550,000 qualified for reimbursement under a grant from the Environmental Protection Agency.
• 7345 MLK Jr Way S – Work on this site of a former towing company was initiated in preparation for sale of the property and involves soil contamination. The total cost of the cleanup was $80,174. In November of 2011, the Authority received $150,000 from Chevron to cover the cost of cleanup at this site and other sites.
Another pollution remediation liability that has not yet been recognized because it is not reasonably estimable:
Property location Description
7301 MLK Jr Way S Former service station site. Authority is planning to sell this property,and Chevron has agreed to pay for cleanup costs, but the Authoritymay be liable for any costs not covered by Chevron.

THE HOUSING AUTHORITY OF THE CITY OF SEATTLE, WASHINGTON
Notes to Basic Financial Statements
December 31, 2012
78 (Continued)
(15) General Revenue Pledge
The Authority issues certain bonds and short-term borrowings that are backed by the general revenues of the Authority. The Authority also backs certain bonds issued by its discretely presented component units. For some borrowings, revenues from the properties are intended to be the primary source of repayment and the revenues of the Authority would be used only if those revenues are not sufficient to cover the required payments. Total pledged revenues as of December 31, 2012 are as follows:
Proportionof annual
debt servicepledged
Total future to 2012Year revenues general Term of
Description of debt Purpose of debt issued pledged revenue commitment
Obligations of the Authority:Project revenues are primary repayment source:
Fixed rate bonds Purchase of Villa ParkTownhomes 1996 $ 2,072,201 0.14% 2026
Fixed rate bonds Purchase of TelemarkApartments, Stone Ave N andN 104th St. properties 2001 4,350,670 0.20 2031
Fixed rate bonds Purchase of Montridge ArmsApartments 2002 2,594,751 0.12 2032
Fixed rate bonds Purchase of Market TerraceApartments and MaryAvenue Townhomes 2002 4,572,205 0.21 2032
Fixed rate bonds Purchase of various propertiesacquired to replace unitsdemolished related to Hope VIredevelopments 2002 14,724,792 0.71% 2032
Fixed rate bonds Purchase of Longfellow CreekApartments 2003 5,186,320 0.24 2033
Fixed rate bonds Purchase of Yesler Court andMain Street Place Apartments 2004 3,330,498 0.13 2034
Fixed rate bonds Refinancing of Bayview Towerand construction at Lake CityCommons 2004 5,680,700 0.25 2034
Fixed rate bonds Purchase of condominium units atGamelin and Gennesse mixeduse buildings 2005 4,901,160 0.13 2035
Fixed rate bonds Purchase of condominium units atGamelin and Gennesse mixeduse buildings 2005 1,304,050 0.15 2020
Fixed rate bonds Construction of housing units at NewHolly redevelopment, phase I 1998 6,924,941 0.37 2030

THE HOUSING AUTHORITY OF THE CITY OF SEATTLE, WASHINGTON
Notes to Basic Financial Statements
December 31, 2012
79 (Continued)
Proportionof annual
debt servicepledged
Total future to 2012Year revenues general Term of
Description of debt Purpose of debt issued pledged revenue commitment
Property sales are primary repayment source:Variable rate note Construction of infrastructure
Rainier Vista and High Pointredevelopments 2009 $ 9,049,525 8.40% 2013
General revenues are primary repayment source:Fixed rate bonds Purchase of medical office for
redevelopment atWallingford site 2000 $ 137,171 0.06 2015
Variable rate bonds Purchase Wedgewood EstatesApartment complex 2001 2,846,200 0.44 2036
Variable rate bonds Rehabilitation of Douglas Apartments 2009 3,204,770 0.08 2040Fixed rate bonds Purchase of Porchlight Office
building 2002 5,483,133 0.10 2032Operating line of Short-term financing for general
credit, $6 million operations of the Authority 2002 532,482 0.02 2013Real estate line of Purchase real estate for affordable
credit, $15 million housing 2003 7,130,777 0.21 2013Taxable line of credit, Purchase commercial properties
$7 million 2004 5,164,439 0.12 2013
Obligations of the Authority for component units:Project revenues are primary repayment source:
Fixed rate bonds Construction of housing units atNewHolly redevelopment,Phase II 2000 $ 3,855,550 0.19 2032
Fixed rate bonds Construction of housing units atRainier Vista redevelopment,Phase I 2003 5,600,104 0.28 2036
Fixed rate bonds Construction of housing units atNewHolly redevelopment,Phase III 2003 13,453,993 0.56 2035
Fixed rate bonds Construction of housing units atHigh Point redevelopment,Phase I 2004 16,531,059 0.67 2036
Fixed rate bonds Construction of housing units atHigh Point redevelopment,Phase II 2007 18,235,486 0.83 2039
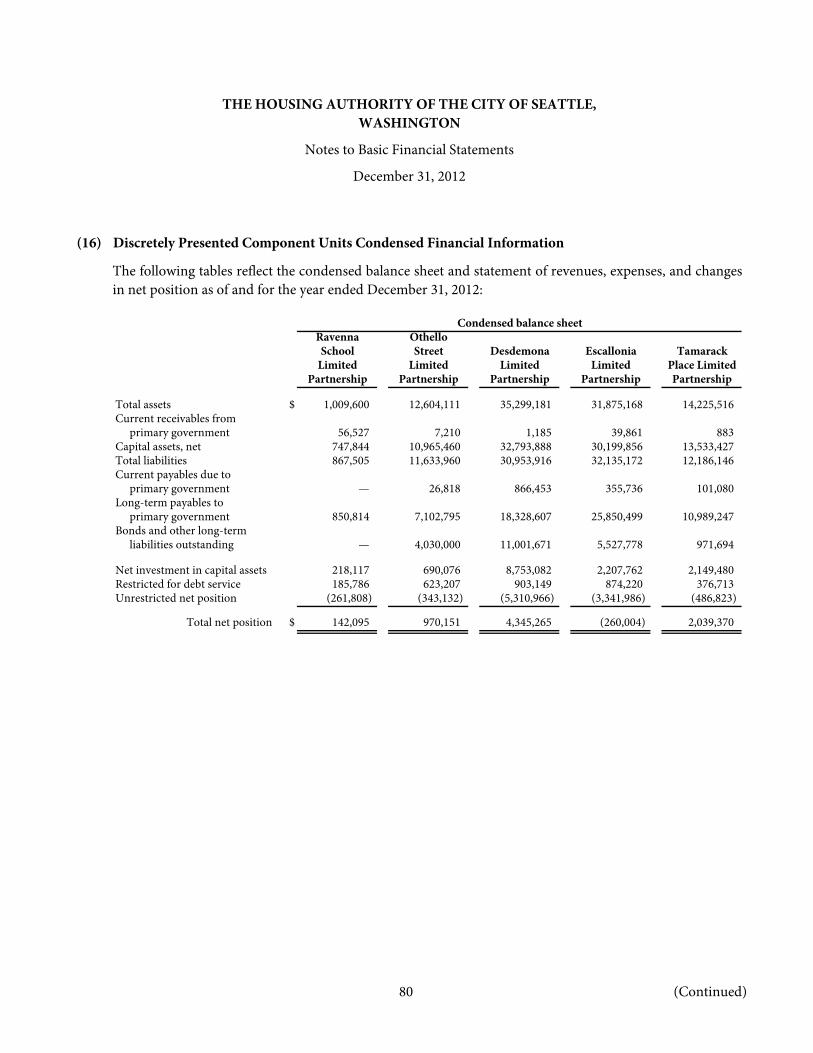
THE HOUSING AUTHORITY OF THE CITY OF SEATTLE, WASHINGTON
Notes to Basic Financial Statements
December 31, 2012
80 (Continued)
(16) Discretely Presented Component Units Condensed Financial Information
The following tables reflect the condensed balance sheet and statement of revenues, expenses, and changes in net position as of and for the year ended December 31, 2012:
Condensed balance sheetRavenna OthelloSchool Street Desdemona Escallonia Tamarack
Limited Limited Limited Limited Place LimitedPartnership Partnership Partnership Partnership Partnership
Total assets $ 1,009,600 12,604,111 35,299,181 31,875,168 14,225,516 Current receivables from
primary government 56,527 7,210 1,185 39,861 883 Capital assets, net 747,844 10,965,460 32,793,888 30,199,856 13,533,427 Total liabilities 867,505 11,633,960 30,953,916 32,135,172 12,186,146 Current payables due to
primary government — 26,818 866,453 355,736 101,080 Long-term payables to
primary government 850,814 7,102,795 18,328,607 25,850,499 10,989,247 Bonds and other long-term
liabilities outstanding — 4,030,000 11,001,671 5,527,778 971,694
Net investment in capital assets 218,117 690,076 8,753,082 2,207,762 2,149,480 Restricted for debt service 185,786 623,207 903,149 874,220 376,713 Unrestricted net position (261,808) (343,132) (5,310,966) (3,341,986) (486,823)
Total net position $ 142,095 970,151 4,345,265 (260,004) 2,039,370

THE HOUSING AUTHORITY OF THE CITY OF SEATTLE, WASHINGTON
Notes to Basic Financial Statements
December 31, 2012
81 (Continued)
Condensed balance sheetHigh Point High Point
North South Ritz Apts Alder Crest Douglas AptsLimited Limited Limited Limited Limited
Partnership Partnership Partnership Partnership Partnership
Total assets $ 53,770,049 56,313,728 2,416,974 6,072,965 10,409,954 Current receivables from
primary government 120,565 46,363 — 34,852 — Capital assets, net 49,395,101 53,691,671 2,248,124 5,664,425 9,728,445 Total liabilities 41,778,571 38,596,156 2,299,711 2,701,977 8,678,241 Current payables due to
primary government 745,313 127,585 36,745 — — Long-term payables due to
primary government 29,126,058 15,909,665 526,166 408,476 50,464 Bonds and other long-term
liabilities outstanding 11,254,373 17,545,000 1,627,170 2,138,868 2,153,146
Net investment in capital assets 12,779,002 22,694,006 411,763 3,294,333 1,678,445 Restricted for debt service 2,523,352 1,141,274 88,413 243,300 287,445 net position (3,310,876) (6,117,708) (382,913) (166,645) (234,453)
Total net position $ 11,991,478 17,717,572 117,263 3,370,988 1,731,437
Condensed balance sheetHigh Rise Seattle High Seattle High
Rehab Rise Rehab Rise Rehab Rainier Lake CityPhase I Phase II Phase III Vista NE VillageLimited Limited Limited LL Limited LL Limited
Partnership Partnership Partnership Partnership Partnership
Total assets $ 31,000,899 36,391,312 28,005,076 24,561,904 28,122,975 Current receivables from
primary government — — — 62,885 — Capital assets, net 27,486,350 33,045,112 25,676,120 22,841,449 27,422,067 Total liabilities 28,188,597 33,359,488 24,590,434 20,140,864 29,599,895 Current payables due to
primary government 373,644 161,515 77,876 164,927 1,075,169 Long-term payables due to
primary government 27,484,250 32,886,202 24,257,914 17,041,881 18,517,266 Bonds and other long-term
liabilities outstanding — — — 2,651,279 —
Net investment in capital assets 3,486,350 4,993,561 4,726,120 3,537,181 (484,404) Restricted for debt service 2,649,029 2,435,980 1,591,888 602,344 51,981 Unrestricted net position (3,323,077) (4,397,717) (2,903,366) 281,515 (1,044,497)
Total net position $ 2,812,302 3,031,824 3,414,642 4,421,040 (1,476,920)

THE HOUSING AUTHORITY OF THE CITY OF SEATTLE, WASHINGTON
Notes to Basic Financial Statements
December 31, 2012
82 (Continued)
Condensed balance sheetLeschi 1105House E Fir
LL Limited LimitedPartnership Partnership Total
Total assets $ 155,256 1,568,944 373,803,612 Current receivables from
primary government — — 370,331 Capital assets, net 155,256 1,544,802 347,139,397 Total liabilities 155,256 1,568,944 319,434,833 Current payables due to
primary government — 1,308,036 5,420,897 Long-term payables due to
primary government — — 229,330,304 Bonds and other long-term
liabilities outstanding — — 58,900,979
Net investment in capital assets — — 71,134,874 Restricted for debt service — — 14,578,081 Unrestricted net position — — (31,344,452)
Total net position $ — — 54,368,503
Statement of revenues, expenses, and changes in net positionRavenna OthelloSchool Street Desdemona Escallonia Tamarack
Limited Limited Limited Limited LimitedPartnership Partnership Partnership Partnership Partnership
Operating revenues $ 253,450 811,481 1,967,798 1,429,909 637,963 Operating expenses 349,207 1,029,796 2,602,644 2,146,970 862,798
Depreciation/amortization 53,729 427,865 1,159,280 1,114,883 407,858
Operating loss (95,757) (218,315) (634,846) (717,061) (224,835)
Nonoperating expenses (10,786) (228,141) (765,769) (464,117) (167,328)
Change in net position before contributions (106,543) (446,456) (1,400,615) (1,181,178) (392,163)
Partners’ contributions — 27,851 — — 214,603 Beginning net position 248,638 1,388,756 5,745,880 921,174 2,216,930
Ending net position $ 142,095 970,151 4,345,265 (260,004) 2,039,370

THE HOUSING AUTHORITY OF THE CITY OF SEATTLE, WASHINGTON
Notes to Basic Financial Statements
December 31, 2012
83 (Continued)
Statement of revenues, expenses, and changes in net positionHigh Point High Point Ritz Apts Alder Crest Douglas Apts
North Limited South Limited Limited Limited LimitedPartnership Partnership Partnership Partnership Partnership
Operating revenues $ 3,046,185 2,941,957 202,496 249,738 343,295 Operating expenses 3,947,881 3,717,203 217,586 443,345 454,409
Depreciation/amortization 1,803,217 2,026,358 107,205 234,773 252,199
Operating loss (901,696) (775,246) (15,090) (193,607) (111,114)
Nonoperating expenses (866,342) (1,026,321) (64,164) (21,484) (166,600)
Change in net position before contributions (1,768,038) (1,801,567) (79,254) (215,091) (277,714)
Partners’ contributions — — — — — Beginning net position 13,759,516 19,519,139 196,517 3,586,079 2,009,427
Ending net position $ 11,991,478 17,717,572 117,263 3,370,988 1,731,713
Statement of revenues, expenses, and changes in net position
High Rise Seattle High Seattle HighRehab Rise Rehab Rise Rehab Rainier Lake CityPhase I Phase II Phase III Vista VillageLimited Limited Limited LL Limited LL Limited
Partnership Partnership Partnership Partnership Partnership Total
Operating revenues $ 3,794,327 3,869,929 3,251,502 743,110 596,887 24,140,027 Operating expenses 4,410,974 4,853,870 3,867,024 1,469,657 1,454,473 31,827,837 Depreciation/amortization 854,168 1,126,080 761,634 785,791 866,918 11,981,958
Operating loss (616,647) (983,941) (615,522) (726,547) (857,586) (7,687,810)
Nonoperating expenses (653,327) (975,581) (886,290) (319,611) (546,105) (7,161,966)
Change in net position before contributions (1,269,974) (1,959,522) (1,501,812) (1,046,158) (1,403,691) (14,849,776)
Partners’ contributions — — 5,000,414 — 5,242,868 Beginning net position 4,082,276 4,991,346 4,916,454 466,784 (73,229) 63,975,687
Ending net position $ 2,812,302 3,031,824 3,414,642 4,421,040 (1,476,920) 54,368,779

THE HOUSING AUTHORITY OF THE CITY OF SEATTLE, WASHINGTON
Notes to Basic Financial Statements
December 31, 2012
84
(17) Lease Commitment
During August 2011, the Authority executed a long-term operating lease for the central office. The lease began on April 1, 2012 and the following schedule shows the future minimum rentals under the lease:
2013 $ 1,404,295 2014 1,404,295 2015 1,404,295 2016 1,404,295 2017 1,451,546 Thereafter 7,703,309
Total $ 14,772,035
(18) Subsequent Events
The Authority has evaluated the subsequent events from the balance sheet date through May 17, 2013, the date at which the financial statements were issued, and determined there are no other items to disclose.

85
This page intentionally left blank

COST CERTIFICATES

87

88

89

90

91

92
This page intentionally left blank

THE HOUSING AUTHORITY OF THE CITY OF SEATTLE, WASHINGTON
Statistical Section (Unaudited)
Section III

THE HOUSING AUTHORITY OF THE CITY OF SEATTLE, WASHINGTON
Statistical Section
93
Statistical Section
This section provides additional information regarding the Authority in the following categories:
Financial Trends show how the Authority’s financial position has changed over time
Tables 1 – 2
Revenue Capacity the tables in this section show the Authority’s ability to generate revenue
Tables 3 – 4
Debt Capacity shows the Authority’s debt burden over time and provide information on the ability to issue debt
Tables 5 – 6
Demographics and Economic Statistics
the tables in this section portray the socioeconomic environment and provide information to allow comparisons over time and comparisons to other governments
Table 7 – 9
Operating Information
the purpose of these tables is to show the Authority’s operations and provide information to assess the government’s economic condition
Tables 10 – 12

94
Table 1THE HOUSING AUTHORITY OF THE CITY OF SEATTLE,
WASHINGTONFinancial Trends
Net Position by Component – Primary Government
Last Ten Fiscal Years (Unaudited)
Netinvestment
Fiscal year in capitalended September 30 (a) assets Restricted Unrestricted Total
2003 $ 177,298,605 5,192,219 76,931,411 259,422,235 2004 204,283,445 7,788,390 71,066,202 283,138,037 2005 223,381,297 5,194,324 101,203,466 329,779,087 2006 174,593,252 5,448,150 144,625,694 324,667,096
2007 (a) 211,875,842 9,725,557 132,651,693 354,253,092 2008 (a) 222,001,336 5,326,536 142,674,746 370,002,618 2009 (a) 227,083,324 5,550,146 151,794,210 384,427,680 2010 (a) 229,826,301 6,486,917 170,526,030 406,839,248 2011 (a) 224,771,337 8,543,577 186,539,258 419,854,172 2012 (a) 209,744,861 14,997,306 197,004,481 421,746,648
Notes: (a) Beginning in fiscal year 2007, the Authority’s fiscal year-end date changed to December 31from September 30.

95
Table 2THE HOUSING AUTHORITY OF THE CITY OF SEATTLE,
WASHINGTON
Financial Trends
Changes in Net Position – Primary Government
Last Ten Fiscal Years (Unaudited)
2003 2004 2005 2006 2007 (a) 2008 (a) 2009 (a) 2010 (a) 2011 (a) 2012 (a)
Operating revenues:Tenant rentals $ 18,776,018 19,990,759 20,697,641 19,888,907 23,958,442 18,548,105 18,963,514 19,853,164 21,338,005 20,690,177 Housing assistance payment subsidies 71,278,909 75,725,763 80,263,996 77,907,735 107,528,715 84,099,962 87,253,047 96,202,546 95,645,677 105,422,182 Operating subsidies and grants (b) 17,701,294 17,347,758 16,668,848 16,038,328 19,109,472 17,523,075 18,006,286 21,258,217 22,814,568 19,522,792 Other 5,622,755 13,619,504 49,240,885 21,232,065 35,381,503 22,594,560 19,212,557 19,480,446 21,762,895 18,081,083
Total operating revenues 113,378,976 126,683,784 166,871,370 135,067,035 185,978,132 142,765,702 143,435,404 156,794,373 161,561,145 163,716,234
Operating expenses:Housing operations and administration 28,035,895 26,024,065 29,152,797 30,248,810 46,408,207 41,515,711 38,998,671 42,453,709 43,986,025 41,664,544 Tenant services 2,877,693 2,242,826 2,436,512 2,750,585 3,171,644 1,307,592 1,644,363 3,729,452 3,937,994 3,602,554 Utility services 5,254,899 5,177,870 4,922,362 4,827,108 5,252,632 4,092,002 4,540,982 4,718,662 4,998,955 5,393,684 Maintenance 16,275,910 18,133,133 17,281,723 16,388,539 21,461,247 17,053,995 18,159,325 20,082,664 18,824,304 15,081,988 Housing assistance payments 65,156,211 71,889,208 68,212,519 62,296,993 80,300,757 64,270,568 71,064,302 73,550,131 76,942,437 79,478,249 Other 8,436,704 1,712,092 3,413,099 6,031,825 2,585,630 2,767,976 2,115,315 4,209,600 1,318,772 2,021,796 Depreciation and amortization 10,199,726 11,166,605 11,656,022 11,929,183 15,155,490 10,299,572 9,281,594 10,059,962 10,676,293 10,327,767
Total operating expenses 136,237,038 136,345,799 137,075,034 134,473,043 174,335,607 141,307,416 145,804,552 158,804,180 160,684,780 157,570,582
Operating income (loss) (22,858,062) (9,662,015) 29,796,336 593,992 11,642,525 1,458,286 (2,369,148) (2,009,807) 876,365 6,145,652
Nonoperating revenues (expenses):Interest expense (4,002,391) (4,811,281) (5,510,982) (7,849,402) (10,755,826) (8,532,367) (7,956,814) (7,479,432) (6,887,452) (5,721,825) Interest income 2,079,480 1,450,061 3,190,698 5,625,496 7,637,844 6,547,470 5,337,931 5,257,848 1,536,648 1,397,221 Change in fair value of investments — 972,676 (718,763) (273,517) 140,142 (332,725) 430,908 44,842 68,742 (74,996) Loss on notes receivable — — — — — — — — (479,017) — Loss on investment in limited partnerships — — — — — (1,505,687) (1,480) (67,624) (1,321) (760,305) Disposition of assets (9,272,216) (5,070,867) (1,932,491) (13,426,642) (6,673,827) (1,735,402) (4,472,397) (19,878,330) (16,774,091) (12,343,242)
Net nonoperating expenses (11,195,127) (7,459,411) (4,971,538) (15,924,065) (9,651,667) (5,558,711) (6,661,852) (22,122,696) (22,536,491) (17,503,147)
Change in net position beforecontributions (34,053,189) (17,121,426) 24,824,798 (15,330,073) 1,990,858 (4,100,425) (9,031,000) (24,132,503) (21,660,126) (11,357,495)
Capital contributions 45,193,125 40,837,228 21,816,252 10,218,082 27,595,138 19,849,951 23,456,062 46,544,071 34,675,050 13,249,971
Increase (decrease) in net position 11,139,936 23,715,802 46,641,050 (5,111,991) 29,585,996 15,749,526 14,425,062 22,411,568 13,014,924 1,892,476
Net position at beginning of year 248,282,299 259,422,235 283,138,037 329,779,087 324,667,096 354,253,092 370,002,618 384,427,680 406,839,248 419,854,172
Net position at end of year $ 259,422,235 283,138,037 329,779,087 324,667,096 354,253,092 370,002,618 384,427,680 406,839,248 419,854,172 421,746,648
Notes: (a) Fiscal years 2002 through 2006 represent a year-end date of September 30. Beginning in 2007, the fiscal year-end date isDecember 31, and in 2007, the statement of revenues, expenses, and changes in net position reflects a fifteen-month period.
(b) Effective for reporting year 2010, the Authority has classified Operating subsidies and grants as operating revenues. Prior yearshave been restated on this schedule to reflect comparative results.

96
Table 3THE HOUSING AUTHORITY OF THE CITY OF SEATTLE,
WASHINGTON
Revenue Capacity
Operating Revenues by Source – Primary Government
Last Ten Fiscal Years (Unaudited)
Housing assistance OperatingTenant rentals payment subsidies subsidies and grants Other Total
Percentage Percentage Percentage PercentageYear (a) Amount of total Amount of total Amount of total Amount of total Amount Total
2003 $ 18,776,018 16.6% $ 71,278,909 62.8% $ 17,701,294 15.6% $ 5,622,755 5.0% $ 113,378,976 100.0%2004 19,990,759 15.8 75,725,763 59.7 17,347,758 13.7 13,619,504 10.8 126,683,784 100.02005 20,697,641 12.4 80,263,996 48.1 16,668,848 10.0 49,240,885 29.5 166,871,370 100.02006 19,888,907 14.7 77,907,735 57.7 16,038,328 11.9 21,232,065 15.7 135,067,035 100.02007 23,958,442 12.9 107,528,715 57.8 19,109,472 10.3 35,381,503 19.0 185,978,132 100.02008 18,548,105 13.0 84,099,962 58.9 17,523,075 12.3 22,594,560 15.8 142,765,702 100.02009 18,963,514 13.2 87,253,047 60.9 18,006,286 12.6 19,212,557 13.3 143,435,404 100.02010 19,853,164 12.7 96,202,546 61.3 21,258,217 13.6 19,480,446 12.4 156,794,373 100.02011 21,338,005 12.7 95,645,677 56.8 22,814,568 13.5 21,762,895 17.0 161,561,145 100.02012 20,690,177 12.6 105,422,182 64.4 19,522,792 11.9 18,081,083 11.1 163,716,234 100.0
Notes: (a) Fiscal years 2002 through 2006 represent a year-end date of September 30. Beginning in 2007, the fiscal year-end date isDecember 31, and in 2007, the statement of revenues, expenses, and changes in net position reflects a fifteen-month period.

97
Table 4THE HOUSING AUTHORITY OF THE CITY OF SEATTLE,
WASHINGTON
Revenue Capacity
Nonoperating Revenues by Source – Primary Government
Last Ten Fiscal Years (Unaudited)
Change in fair valueInterest income of investments Total
Percent of Percent ofYear (a) Amount total Amount total Amount Total
2003 $ 2,079,480 10.5 $ — — $ 2,079,480 100.0%2004 1,450,061 59.9 972,676 40.0 2,422,737 100.02005 3,190,698 129.1 (718,763) (29.1) 2,471,935 100.02006 5,625,496 105.1 (273,517) (5.1) 5,351,979 100.02007 7,637,844 98.2 140,142 1.8 7,777,986 100.02008 6,547,470 105.3 (332,725) (5.3) 6,214,745 100.02009 5,337,931 92.8 430,908 7.2 5,768,839 100.02010 5,257,848 99.2 44,842 0.8 5,302,690 100.02011 1,536,648 95.7 68,742 4.3 1,605,390 100.02012 1,397,221 105.7 (74,996) (5.7) 1,322,225 100.0
Notes: (a) Fiscal years 2002 through 2006 represent a year-end date of September 30. Beginning in 2007, thefiscal year-end date is December 31, and in 2007, the statement of revenues, expenses, and changesin net position reflects a fifteen-month period.

(Continued)98
Table 5THE HOUSING AUTHORITY OF THE CITY OF SEATTLE,
WASHINGTON
Debt Capacity
Schedule of General Revenue Bond Coverage
Last Ten Fiscal Years (Unaudited)
Ratio ofdebt service
Debt service Total General to generalFiscal year Principal Interest debt service expense (b) expenses
Villa Park 1996 Bonds:2003 $ 30,000 114,873 144,873 178,085 0.8 2004 35,000 113,147 148,147 179,791 0.8 2005 35,000 110,406 145,406 190,861 0.8 2006 40,000 106,550 146,550 337,199 0.4 2007 (a) 50,000 133,255 183,255 282,354 0.6 2008 45,000 102,534 147,534 252,675 0.6 2009 50,000 99,612 149,612 239,185 0.6 2010 50,000 96,691 146,691 251,264 0.6 2011 55,000 92,919 147,919 280,945 0.5 2012 60,000 90,263 150,263 263,439 0.6
Wakefield 2000 Bonds for Wallingford:2003 28,236 36,480 64,716 7,490 8.6 2004 30,299 34,417 64,716 16,021 4.0 2005 32,491 32,225 64,716 23,470 2.8 2006 34,840 22,636 57,476 18,115 3.2 2007 (a) 47,093 33,620 80,713 15,327 5.3 2008 40,749 24,278 65,027 6,070 10.7 2009 43,711 20,971 64,682 710 91.1 2010 46,871 17,845 64,716 825 78.4 2011 50,259 14,456 64,715 — — 2012 — — — — —
Telemark 2001 Bonds:2003 30,000 172,896 202,896 89,037 2.3 2004 30,000 171,756 201,756 128,387 1.6 2005 35,000 170,556 205,556 222,399 0.9 2006 35,000 168,544 203,544 111,717 1.8 2007 (a) 50,000 208,287 258,287 112,065 2.3 2008 40,000 164,536 204,536 112,669 1.8 2009 45,000 162,431 207,431 161,058 1.3 2010 50,000 160,035 210,035 161,343 1.3 2011 50,000 156,910 206,910 120,290 1.7 2012 55,000 154,809 209,809 130,366 1.6
Wedgewood 2001 Variable Rate Bonds:2003 130,000 44,802 174,802 979,865 0.2 2004 135,000 39,831 174,831 897,686 0.2 2005 140,000 74,056 214,056 963,775 0.2 2006 150,000 105,939 255,939 943,339 0.3 2007 (a) 187,500 151,700 339,200 922,274 0.4 2008 160,000 69,529 229,529 808,109 0.3 2009 165,000 40,280 205,280 812,350 0.3 2010 170,000 12,862 182,862 1,900,927 0.1 2011 — 13,320 13,320 1,029,342 0.0 2012 — 7,755 7,755 1,031,344 0.0
PorchLight 2002 Bonds: (c)2003 100,000 479,398 579,398 773,846 0.7 2004 130,000 477,972 607,972 854,780 0.7 2005 130,000 471,191 601,191 823,119 0.7 2006 135,000 350,194 485,194 729,875 0.7 2007 (a) 175,000 576,430 751,430 730,729 1.0 2008 145,000 455,540 600,540 902,813 0.7 2009 155,000 440,037 595,037 798,750 0.7 2010 160,000 441,565 601,565 646,107 0.9 2011 (c) 1,720,000 374,890 2,094,890 672,441 3.1 2012 (c) — — — — —

(Continued)99
Table 5THE HOUSING AUTHORITY OF THE CITY OF SEATTLE,
WASHINGTON
Debt Capacity
Schedule of General Revenue Bond Coverage
Last Ten Fiscal Years (Unaudited)
Ratio ofdebt service
Debt service Total General to generalFiscal year Principal Interest debt service expense (b) expenses
Mary Avenue 2002 Bonds:2003 $ 45,000 164,663 209,663 146,551 1.4 2004 45,000 169,719 214,719 141,603 1.5 2005 45,000 168,292 213,292 149,021 1.4 2006 50,000 166,827 216,827 152,883 1.4 2007 (a) 62,500 165,847 228,347 231,906 1.0 2008 55,000 175,305 230,305 178,955 1.3 2009 55,000 160,255 215,255 196,758 1.1 2010 60,000 157,763 217,763 270,925 0.8 2011 60,000 155,055 215,055 183,154 1.2 2012 65,000 153,445 218,445 172,933 1.3
Montridge Arms 2002 Bonds:2003 25,000 103,690 128,690 97,468 1.3 2004 25,000 102,965 127,965 105,846 1.2 2005 30,000 101,782 131,782 110,403 1.2 2006 30,000 100,430 130,430 112,855 1.2 2007 (a) 37,500 123,911 161,411 117,360 1.4 2008 30,000 97,615 127,615 133,722 1.0 2009 35,000 95,869 130,869 114,649 1.1 2010 35,000 94,158 129,158 60,775 2.1 2011 35,000 92,411 127,411 132,118 1.0 2012 40,000 90,225 130,225 166,796 0.8
Longfellow Creek 2003 Bonds:2004 — 143,739 143,739 496,191 0.3 2005 15,000 180,645 195,645 476,275 0.4 2006 65,000 179,215 244,215 255,770 1.0 2007 (a) 87,500 221,437 308,937 428,712 0.7 2008 70,000 175,085 245,085 282,268 0.9 2009 75,000 172,891 247,891 343,526 0.7 2010 75,000 170,379 245,379 335,457 0.7 2011 80,000 167,670 247,670 420,657 0.6 2012 80,000 165,450 245,450 445,630 0.6
HOPE VI Replacement Housing Bonds:2004 125,000 608,672 733,672 674,351 1.1 2005 130,000 598,208 728,208 454,761 1.6 2006 140,000 589,735 729,735 508,423 1.4 2007 (a) 188,750 690,082 878,832 603,954 1.5 2008 165,000 569,624 734,624 724,984 1.0 2009 175,000 558,625 733,625 664,970 1.1 2010 190,000 548,800 738,800 667,486 1.1 2011 200,000 535,172 735,172 687,160 1.1 2012 210,000 524,913 734,913 773,740 0.9
Bayview/Lake City Commons 2004 Bonds:2005 60,000 192,915 252,915 460,249 0.5 2006 65,000 195,575 260,575 497,517 0.5 2007 (a) 81,250 222,891 304,141 680,237 0.4 2008 65,000 192,216 257,216 544,688 0.5 2009 70,000 189,021 259,021 693,499 0.4 2010 70,000 186,428 256,428 683,532 0.4 2011 75,000 183,606 258,606 697,836 0.4 2012 75,000 181,856 256,856 631,961 0.4

100
Table 5THE HOUSING AUTHORITY OF THE CITY OF SEATTLE,
WASHINGTON
Debt Capacity
Schedule of General Revenue Bond Coverage
Last Ten Fiscal Years (Unaudited)
Ratio ofdebt service
Debt service Total General to generalFiscal year Principal Interest debt service expense (b) expenses
Yesler Community Replacement Bonds:2005 $ 15,000 109,504 124,504 68,783 1.8 2006 15,000 109,144 124,144 64,738 1.9 2007 (a) 18,750 135,850 154,600 88,859 1.7 2008 20,000 107,832 127,832 76,361 1.7 2009 20,000 109,307 129,307 97,884 1.3 2010 25,000 106,362 131,362 76,764 1.7 2011 25,000 105,327 130,327 74,775 1.7 2012 30,000 104,398 134,398 85,292 1.6
Gamelin/Genesse Bonds:2007 (a) 30,000 288,150 318,150 37,079 8.6 2008 17,000 229,901 246,901 58,525 4.2 2009 21,000 229,052 250,052 43,951 5.7 2010 62,000 228,955 290,955 17,837 16.3 2011 70,000 219,218 289,218 10,204 28.3 2012 — — — — —
Notes: (a) Fiscal years 2002 through 2006 represent a year-end date of September 30. Beginning in 2007, thefiscal year-end date is December 31, and in 2007, the statement of revenues, expenses, and changesin net assets reflects a fifteen-month period.
(b) General expense includes operating expenses except for depreciation and amortization.
(c) In 2012, there was a extraordinary mandatory redemption for the portion of the bonds that financed the Wakefield building.

101
Table 6THE HOUSING AUTHORITY OF THE CITY OF SEATTLE,
WASHINGTON
Debt Capacity
Ratio of Debt to Capital Assets – Primary Government
Last Ten Fiscal Years (Unaudited)
Ratio ofFiscal year total debt
ended Bonds Notes Short-term Total Capital to capitalSeptember 30 (a) payable payable borrowings debt assets, net assets
2002 $ 40,718,092 35,163,081 2,179,574 78,060,747 241,767,416 32.292003 57,620,244 41,966,362 3,609,826 103,196,432 280,495,038 36.792004 62,439,614 35,539,012 20,132,303 118,110,929 300,731,249 39.272005 60,277,566 34,244,424 17,071,307 111,593,297 314,126,900 35.522006 85,476,724 33,750,623 31,154,788 150,382,135 304,561,566 49.382007 130,867,182 33,016,355 45,212,312 209,095,849 329,120,245 63.532008 123,459,433 32,485,160 48,603,302 204,547,895 337,110,417 60.682009 108,984,688 60,573,959 16,321,253 185,879,900 337,089,410 55.142010 98,950,816 62,277,978 16,077,424 177,306,218 343,138,706 51.672011 79,675,557 55,221,591 12,077,424 146,974,572 322,532,095 45.572012 77,128,664 49,564,954 12,827,698 139,521,316 291,056,484 47.94
Note: (a) The Authority changed its fiscal year-end date from September 30 to December 31 beginning in fiscal year 2007.

(Continued)102
Table 7
WASHINGTON
Demographics and Economic Statistics
Tenant Demographics – Population Statistics
Last Ten Fiscal Years (Unaudited)
Public housing programTotal Nonelderly
Calendar number handicapped/year Adults Elderly Minors of tenants disabled
2003 4,754 1,615 2,517 8,886 1,997 2004 4,824 1,625 2,548 8,997 1,930 2005 4,944 1,657 2,755 9,356 1,953 2006 4,731 1,662 2,648 9,041 1,793 2007 4,598 1,727 2,587 8,912 1,709 2008 4,730 1,685 2,814 9,229 1,739 2009 4,897 1,767 3,230 9,894 1,782 2010 4,888 1,823 3,089 9,800 1,839 2011 5,029 1,909 3,180 10,118 1,807 2012 5,140 1,970 3,317 10,427 1,774
Section 8 program (a)Total Nonelderly
Calendar number handicapped/year Adults Elderly Minors of tenants disabled
2003 7,362 1,446 5,838 14,646 2,665 2004 7,631 1,501 5,933 15,065 2,718 2005 7,149 1,421 5,636 14,206 2,615 2006 7,209 1,857 5,102 14,168 2,727 2007 7,426 1,801 5,311 14,538 2,863 2008 7,616 1,970 5,258 14,844 3,044 2009 8,084 1,995 5,998 16,077 3,289 2010 8,371 2,059 5,937 16,367 3,451 2011 8,694 2,307 5,949 16,950 3,520 2012 8,654 2,477 5,938 17,069 3,520
THE HOUSING AUTHORITY OF THE CITY OF SEATTLE,

103
Table 7
WASHINGTON
Demographics and Economic Statistics
Tenant Demographics – Population Statistics
Last Ten Fiscal Years (Unaudited)
Senior and local housing programs (b)Total Nonelderly
Calendar number handicapped/year Adults Elderly Minors of tenants disabled
2003 572 867 186 1,625 266 2004 596 899 222 1,717 240 2005 640 903 746 2,289 196 2006 661 904 278 1,843 192 2007 723 913 345 1,981 186 2008 711 906 310 1,927 170 2009 924 1,023 424 2,371 126 2010 926 1,001 424 2,351 117 2011 994 1,039 426 2,459 86 2012 1,023 1,042 434 2,499 110
Agencywide totalsTotal Nonelderly
Calendar number handicapped/year Adults Elderly Minors of tenants disabled
2003 12,688 3,928 8,541 25,157 4,928 2004 13,051 4,025 8,703 25,779 4,888 2005 12,733 3,981 9,137 25,851 4,764 2006 12,601 4,423 8,028 25,052 4,712 2007 12,747 4,441 8,243 25,431 4,758 2008 13,057 4,561 8,382 26,000 4,953 2009 13,905 4,785 9,652 28,342 5,197 2010 14,185 4,883 9,450 28,518 5,407 2011 14,717 5,255 9,555 29,527 5,413 2012 14,817 5,489 9,689 29,995 5,404
Notes(a) Includes port-ins and excludes port-outs and participants living in the Authority’s Senior Housing program.
(b) Effective 2009, Senior and Local Housing Programs includes tenants from privately managed properties.
THE HOUSING AUTHORITY OF THE CITY OF SEATTLE,

104
Table 8THE HOUSING AUTHORITY OF THE CITY OF SEATTLE,
WASHINGTONDemographics and Economic Statistics
Regional Demographics – Population Statistics
Last Ten Fiscal Years (Unaudited)
King CountySeattle Per capital Per capita average annual
King County population income King income King Public school unemploymentYear (a) (a) County (b) region (b) enrollment (c) rate (d)
2003 1,779,300 571,900 45,334 41,778 46,699 6.82004 1,788,300 572,600 49,118 45,122 46,420 4.62005 1,808,300 573,000 48,116 45,242 46,239 4.82006 1,835,300 578,700 52,655 48,522 45,634 4.22007 1,861,300 586,200 57,710 53,061 45,276 4.52008 1,884,200 592,800 58,141 53,999 45,572 5.72009 1,909,300 602,000 56,904 53,369 45,944 8.52010 1,931,249 608,660 54,927 51,698 47,008 8.42011 1,942,600 612,100 57,837 N/A 48,496 7.12012 1,957,000 616,500 N/A N/A 49,864 6.1
Notes: (a) As of April 1, source: Washington State Office of Financial Management, 2012 PopulationTrends for Washington State estimates only.
(b) Source: U.S. Bureau of Economic Analysis, 2010 is most current available.
(c) Seattle Public Schools
(d) Preliminary source: Washington State Employment Security Department.

105
Table 9THE HOUSING AUTHORITY OF THE CITY OF SEATTLE,
WASHINGTON
Demographics and Economic Statistics
Principal Industries
Last Ten Fiscal Years (Unaudited)
2012 2011 2010Number of Percentage of Number of Percentage of Number of Percentage of
Industry employees Employment Rank employees Employment Rank employees Employment Rank
Retail trade 113,600 9.62% 1 109,300 9.47% 1 105,900 9.33% 1 Professional and technical 102,200 8.66 2 97,900 8.49 2 93,400 8.23 2 Local government 89,100 7.55 3 88,800 7.70 3 89,300 7.87 3 Information 80,900 6.85 4 80,200 6.95 4 79,400 7.00 4 Manufacturing durable goods 80,000 6.78 5 77,100 6.68 5 75,200 6.63 5 Food services and drinking places 79,600 6.74 6 76,400 6.62 6 74,400 6.56 6 Administrative and waste services 64,000 5.42 7 63,000 5.46 7 61,000 5.37 7 Wholesale trade 59,400 5.03 8 58,500 5.07 8 58,000 5.11 8 State government 55,500 4.70 9 55,000 4.77 9 55,800 4.92 9 Ambulatory health care services 49,200 4.17 10 48,400 4.20 10 47,400 4.18 10 Finance and insurance 43,600 3.69 11 44,400 3.85 11 44,500 3.92 11 Transportation and warehousing 42,700 3.62 12 43,400 3.76 12 42,400 3.74 12
859,800 72.83% 842,400 73.02% 826,700 72.86%
2009 2008 2007Number of Percentage of Number of Percentage of Number of Percentage of
Industry employees Employment Rank employees Employment Rank employees Employment Rank
Retail trade 106,000 9.19% 1 116,900 9.62% 1 119,800 9.86% 1 Professional and technical 92,900 8.05 2 100,600 8.28 2 94,700 7.80 2 Local government 89,300 7.74 3 89,500 7.37 3 87,300 7.19 3 Information 80,200 6.95 4 79,800 6.57 5 75,600 6.23 6 Manufacturing durable goods 79,000 6.85 5 83,700 6.89 4 86,900 7.16 4 Food services and drinking places 74,000 6.42 6 77,700 6.39 6 77,100 6.35 5 Administrative and waste services 61,100 5.30 7 72,500 5.97 7 73,900 6.09 7 Wholesale trade 59,700 5.18 8 63,400 5.22 8 64,200 5.29 8 State government 55,800 4.84 9 57,100 4.70 9 55,300 4.55 9 Ambulatory health care services 46,400 4.02 11 44,800 3.69 12 42,800 3.52 12 Finance and insurance 46,900 4.07 10 49,000 4.03 10 50,600 4.17 10 Transportation and warehousing 43,500 3.77 12 46,600 3.83 11 48,700 4.01 11
834,800 72.38% 881,600 72.56% 876,900 72.22%
2006 2005 2004Number of Percentage of Number of Percentage of Number of Percentage of
Industry employees Employment Rank employees Employment Rank employees Employment Rank
Retail trade 120,900 10.06% 1 123,000 10.47% 1 121,600 10.64% 1 Professional and technical 88,600 7.37 2 84,700 7.21 3 79,700 6.97 3 Local government 86,000 7.15 4 85,800 7.31 2 85,700 7.50 2 Information 72,500 6.03 7 70,100 5.97 7 68,600 6.00 6 Manufacturing durable goods 87,200 7.25 3 83,800 7.13 4 77,900 6.82 4 Food services and drinking places 75,900 6.31 5 74,100 6.31 5 70,200 6.14 5 Administrative and waste services 75,000 6.24 6 71,300 6.07 6 65,900 5.77 7 Wholesale trade 64,700 5.38 8 63,900 5.44 8 63,500 5.56 8 State government 55,400 4.61 9 55,000 4.68 9 55,100 4.82 9 Ambulatory health care services 42,700 3.55 12 43,100 3.67 12 41,600 3.64 12 Finance and insurance 51,400 4.28 10 53,000 4.51 10 52,700 4.61 10 Transportation and warehousing 47,900 3.98 11 46,000 3.92 11 47,500 4.16 11
868,200 72.21% 853,800 72.69% 830,000 72.63%
2003Number of Percentage of
Industry employees Employment Rank
Retail trade 121,500 10.79% 1 Professional and technical 78,800 7.00 3 Local government 87,800 7.79 2 Information 68,200 6.05 6 Manufacturing durable goods 77,200 6.85 4 Food services and drinking places 69,600 6.18 5 Administrative and waste services 61,800 5.49 8 Wholesale trade 62,300 5.53 7 State government 54,800 4.87 9 Ambulatory health care services 39,600 3.52 12 Finance and insurance 53,700 4.77 10 Transportation and warehousing 46,700 4.15 11
822,000 72.99%
Source: Washington Employment Security Department Labor Market and Economic Analysis.
Data provided for King County, which includes the Seattle Metropolitan Area and other surrounding communities.

106
Table 10THE HOUSING AUTHORITY OF THE CITY OF SEATTLE,
WASHINGTON
Operating Information
Number of Units by Program
Last Ten Fiscal Years (Unaudited)
Other Hope IVPublic Senior housing nonpublic
Fiscal year housing Section 8 housing programs units Total
2003 5,380 8,464 994 810 178 15,826 2004 5,481 8,758 993 870 190 16,292 2005 5,441 9,199 993 875 290 16,798 2006 5,432 9,199 993 902 423 16,949 2007 5,250 9,202 993 1,008 423 16,876 2008 5,263 9,260 993 971 539 17,026 2009 5,261 9,425 993 910 629 17,218 2010 5,316 9,612 994 915 541 17,378 2011 5,408 10,164 994 915 587 18,068 2012 5,441 10,558 994 876 739 18,608
Households Served and Waiting List Data
Last Ten Fiscal Years (Unaudited)
Total Totalhouseholds households on
Fiscal year served (a) waiting lists (b)
2003 11,677 13,819 2004 12,027 8,546 2005 11,861 11,074 2006 11,869 12,284 2007 12,077 3,850 2008 12,359 6,879 2009 12,912 7,751 2010 13,220 8,179 2011 13,765 7,523 2012 13,769 7,586
Notes: (a) Excludes Mod rehab, outgoing portable vouchers, nonpublic housing tax credits, and local programs,but includes incoming portable vouchers.
(b) For years 1999 – 2003, waiting list figures include duplicates if applicant applied for more than oneprogram. 2004 – current reflects unique households. Excludes HOPE VI communities.

(Continued)107
Table 11THE HOUSING AUTHORITY OF THE CITY OF SEATTLE,
WASHINGTON
Operating Information
Property Characteristics and Dwelling Unit Composition
December 31, 2012 (Unaudited)
Public housingNumber of Year built
Name of development Address units or acquired
Ballard House 2445 NW 57th Street 79 1969Barton Place 9201 Rainier Avenue S. 91 1971Beacon Tower 1311 S. Massachusetts 108 1971Bell Tower 2215 1st Avenue 120 1970Cal-Mor Circle 6420 California Avenue SW 75 1968Capitol Park 525 14th Avenue E. 125 1970Cedarvale House 11050 8th Avenue NE 118 1970Cedarvale Village 11050 8th Avenue NE 24 1971Center Park 2121 26th Avenue S. 137 1969Center West 533 3rd Avenue W. 91 1969Denny Terrace 100 Melrose Avenue E. 220 1968Green Lake Plaza 505 NE 70th Street 130 1969Harvard Court 610 Harvard Avenue E. 81 1968High Point 3000 SW Graham Street 250 VariousHolly Court 3804 S. Myrtle 97 1980International Terrace 202 6th Avenue S. 100 1972Jackson Park House 14396 30th Avenue NE 71 1970Jackson Park Village 14396 30th Avenue NE 41 1970Jefferson Terrace 800 Jefferson Street 299 1967Lake City Court 12536 33rd Avenue NE 51 2011Lake City House 12546 33rd Avenue NE 115 1971Lictonwood 9009 Greenwood Avenue N. 81 1970Longfellow Creek* 5915 Delridge Way SW 30 1993New Holly 7050 32nd Avenue S. 400 VariousOlive Ridge 1700 17th Avenue 105 1969Olympic West 110 W. Olympic Place 75 1970Partnership units Various 50 VariousQueen Anne Heights 1212 Queen Anne Avenue N. 53 1970Rainier Vista 2917 S Snoqualmie St 251 VariousRoss Manor 1420 Western Avenue 100 1984Roxhill Court Apartments* 9940 27th Ave SW 13 1980Scattered Sites Various 715 VariousStewart Manor 6339 34th Avenue 74 1968Tri-Court 720 N. 143rd 87 1971University House 4700 12th Avenue NE 101 1971University West 4544 7th Avenue NE 113 1971West Town View 1407 2nd Avenue W 59 1977Westwood Heights 9455 27th Avenue SW 130 1978Wisteria Court* 7544 24th Ave SW 20 1987Yesler Terrace 903 E. Yesler Way 561 1941
Total units – public housing 5,441
*Nonpublic housing units are listed under “Other housing program” section.

(Continued)108
Table 11THE HOUSING AUTHORITY OF THE CITY OF SEATTLE,
WASHINGTON
Operating Information
Property Characteristics and Dwelling Unit Composition
December 31, 2012 (Unaudited)
Section 8Number of Year built
Name of development Address units or acquired
Housing Choice Vouchers Various 9,668 —Moderate Rehabilitation Various 760 —Bay View Tower 2614 4th Ave 100 1979Market Terrace 1115 NW Market St. 30 1980
Total number of Section 8 units 10,558
Senior housingNumber of Year built
Name of development Address units or acquired
Leschi House 1011 S. Weller 34 1988Ravenna School Apartments 6564 Ravenna Avenue NE 39 1979South Park Manor 520 S. Cloverdale 27 1983Bitter Lake Manor 620 N. 130th 72 1983Blakeley Manor 2401 NE Blakeley 70 1984Carroll Terrace 600 5th Avenue W. 26 1985Columbia Place 4628 S. Holly 66 1983Fort Lawton Place 3401 W. Government Way 24 1984Fremont Place 4601 Phinney Avenue N. 31 1983Gideon-Mathews Gardens 323 25th Avenue S. 45 1986Island View 3031 California Avenue SW 48 1984Michaelson Manor 320 W. Roy 57 1985Nelson Manor 220 NW 58th 32 1985Olmsted Manor 501 NE Ravenna Blvd. 35 1986Phinney Terrace 6561 Phinney Avenue N. 51 1984Pinehurst Court 12702 15th Avenue NE 73 1984Pleasant Valley Plaza 3801 34th Avenue W. 41 1984Primeau Place 308 14th Avenue E. 53 1984Reunion House 530 10th Avenue E. 28 1984Schwabacher House 1715 NW 59th Street 44 1984Sunrise Manor 1530 NW 57th Street 32 1985Wildwood Glen 4501 SW Wildwood 24 1983Willis House 6341 5th Ave NE 42 1983
Total number of seniorhousing units 994

109
Table 11THE HOUSING AUTHORITY OF THE CITY OF SEATTLE,
WASHINGTON
Operating Information
Property Characteristics and Dwelling Unit Composition
December 31, 2012 (Unaudited)
Other housing programsNumber of Year built
Name of development Address units or acquired
104th St Townhomes 528 N 104th 3 2001127th & Greenwood 12701 Greenwood Ave N 6 19835983 Rainier Ave S 5983 Rainier Ave S 12 2002924 MLK Jr Way S 924 MLK Jr Way S 5 1998Alder Crest Apartments 6520 35th Ave SW 36 1977Beacon House 1545 12th Ave S 6 1993Daybreak 1515 2nd Ave N. 3 1978Delridge Triplexes 8136 and 8144 Delridge Way SW 6 1993Fir Street Townhomes Various 7 VariousHeritage House 1533 Western Avenue 62 1990Lake City Commons 12745 30th Ave NE 15 2002Lam Bow Apartments 6935 Delridge Way SW 51 1970Longfellow Creek Apartments b 5915 Delridge Way SW 54 1993Main Place II 308 22nd Ave S 25 1993Main Street Apartments 2035 S Main St 12 1993Mary Avenue Townhomes 8550-84 Mary Ave NW 8 2001MLK Townhomes Various 6 1996Montridge Arms Apartments 9000 27th Ave SW 33 1968Norman Street Townhomes Various 15 VariousRavenna Springs/Bryant Apts Various 13 VariousReferendum 37 Various 2 VariousRitz Apartments 1302 E Yesler Way 30 1908Roxhill Court Apartments b 9940 27th Ave SW 11 1980Spruce Street Townhomes Various 10 1997South Shore Court 4811 S Henderson 44 1962Stone Ave Townhomes 8514 Stone Ave N 4 2001Telemark Apartments 2850 NW 56th St 24 1975Villa Park Townhomes 9111 50th Avenue S. 43 1997Wedgewood Estates 3716 NE 75th 203 1948Westwood Heights East Apts 9440 27th Ave SW 42 1997Wisteria Court b 7544 24th Ave SW 76 1987Yesler Court 114 23rd Ave 9 1994
Total other housing units 876 HOPE VI nonpublic housing units:
High Point 350 Lake City Village 35 NewHolly 220 Rainier Vista 134
Total HOPE VI Nonpublic housing 739
Total units – All programs (a) 18,608
Notes: (a) Includes overlap of other housing program units and senior housing units which also have project based andprogram based Housing Choice Vouchers.
(b) Public housing units are listed under the public housing section.

110
Table 12THE HOUSING AUTHORITY OF THE CITY OF SEATTLE,
WASHINGTON
Operating Information
Regular Staff Headcount by Department
Last Ten Fiscal Years (Unaudited)
Development Finance andand asset Housing Admissions administrative Information Human
Fiscal year Executive management operations and Section 8 services systems resources Total
2003 10 35 355 57 48 10 10 525 2004 12 37 347 53 47 10 10 516 2005 11 35 342 51 43 11 8 501 2006 13 37 333 56 44 14 7 504 2007 15 36 352 51 43 17 8 522 2008 16 31 362 60 42 18 10 539 2009 14 33 362 59 41 19 10 538 2010 15 33 350 63 43 22 10 536 2011 12 32 367 54 43 19 10 537 2012 12 33 343 54 45 18 10 515


