CHEMICAL, BIOLOGICAL, AND PHYSICAL
CHARACTERIZATION
OF THE CHURCH CREEK AND
PAROLE PLAZA NPDES MONITORING STATIONS: 2016 -
2017
FINAL REPORT
Prepared for
Anne Arundel County
Department of Public Works
Watershed Protection and Restoration Program
2662 Riva Road
Annapolis, MD 21401
Prepared by
Versar, Inc.
9200 Rumsey Road
Columbia, MD 21045
February 8, 2018

Table of Contents
iii
TABLE OF CONTENTS
Page
1 INTRODUCTION........................................................................................................... 1-1
2 METHODS ...................................................................................................................... 2-1 CHEMICAL MONITORING ................................................................................. 2-1
2.1.1 Monitoring Sites ........................................................................................ 2-1
2.1.2 Water Sample Collection and Data Analysis ............................................ 2-2 2.1.3 Monitoring Station Maintenance ............................................................... 2-6
BIOLOGICAL MONITORING ............................................................................. 2-7 2.2.1 Sampling Locations ................................................................................... 2-7 2.2.2 Stream Habitat Evaluation ......................................................................... 2-9
2.2.3 Water Quality Measurement ................................................................... 2-10 2.2.4 Biological Sample Collection .................................................................. 2-10 2.2.5 Biological Sample Processing and Identification .................................... 2-11
2.2.6 Biological Data Analysis ......................................................................... 2-11 PHYSICAL MONITORING ................................................................................ 2-13
2.3.1 Monitoring Sites ...................................................................................... 2-13 2.3.2 Physical Data Collection and Analysis ................................................... 2-13
LAND USE AND STORMWATER MANAGEMENT ASSESSMENT ............ 2-15 2.4.1 Church Creek Watershed Land Use ........................................................ 2-15
2.4.2 Church Creek Watershed BMP Inspections ............................................ 2-17
3 RESULTS ........................................................................................................................ 3-1
POLLUTANT CONCENTRATIONS .................................................................... 3-1 EVENT MEAN CONCENTRATIONS AND POLLUTANT LOADINGS .......... 3-2
BIOLOGICAL ASSESSMENT.............................................................................. 3-4 GEOMORPHIC ASSESSMENT............................................................................ 3-6
4 DISCUSSION .................................................................................................................. 4-1 WATER CHEMISTRY .......................................................................................... 4-1 PHYSICAL HABITAT AND BIOLOGICAL CONDITIONS ............................ 4-12 GEOMORPHIC CONDITIONS ........................................................................... 4-16
GENERAL CONCLUSIONS ............................................................................... 4-22
5 REFERENCES ................................................................................................................ 5-1
Table of Contents
iv
TABLE OF CONTENTS (CONTINUED)
APPENDICES Page
A STORM EVENT HYDROGRAPHS, NARRATIVES AND COMPOSITE
SAMPLING METHOD TECHNICAL MEMORANDUM ........................................... A-1
B MASTER TAXA LIST ....................................................................................................B-1
C BIOLOGICAL ASSESSMENT RESULTS ...................................................................C-1
D QA/QC INFORMATION ............................................................................................... D-1
E ROSGEN CLASSIFICATION SCHEME ....................................................................... E-1
F GEOMORPHOLOGICAL DATA................................................................................... F-1
G CHEMICAL MONITORING RESULTS....................................................................... G-1
H BMP CODES .................................................................................................................. H-1
I BMP ACRONYMS .......................................................................................................... I-1
List of Tables
v
LIST OF TABLES
Table No. Page
2-1. Drainage areas and site locations of monitoring stations in Church Creek watershed .... 2-1
2-2. Land use summary for the monitoring stations in the Church Creek subwatershed ....... 2-2
2-3. Analytes, detection limits, and analytical methods for the Church Creek and Parole
Plaza Monitoring stations ................................................................................................ 2-2
2-4. Rainfall data for sampled storm events ............................................................................ 2-4
2-5. Maryland Biological Stream Survey PHI scoring ........................................................... 2-9
2-6. EPA Rapid Bioassessment Protocol (RBP) scoring ...................................................... 2-10
2-7. Maryland COMAR water quality standards for use I Streams ...................................... 2-10
2-8. Biological condition scoring for the coastal plains metrics ........................................... 2-12
2-9. Maryland Biological Stream Survey BIBI scoring ........................................................ 2-13
2-10. Rosgen stream classification types ................................................................................ 2-14
2-11. Church Creek BMP overview ........................................................................................ 2-18
3-1. The percentage of non-detects by parameter ................................................................... 3-1
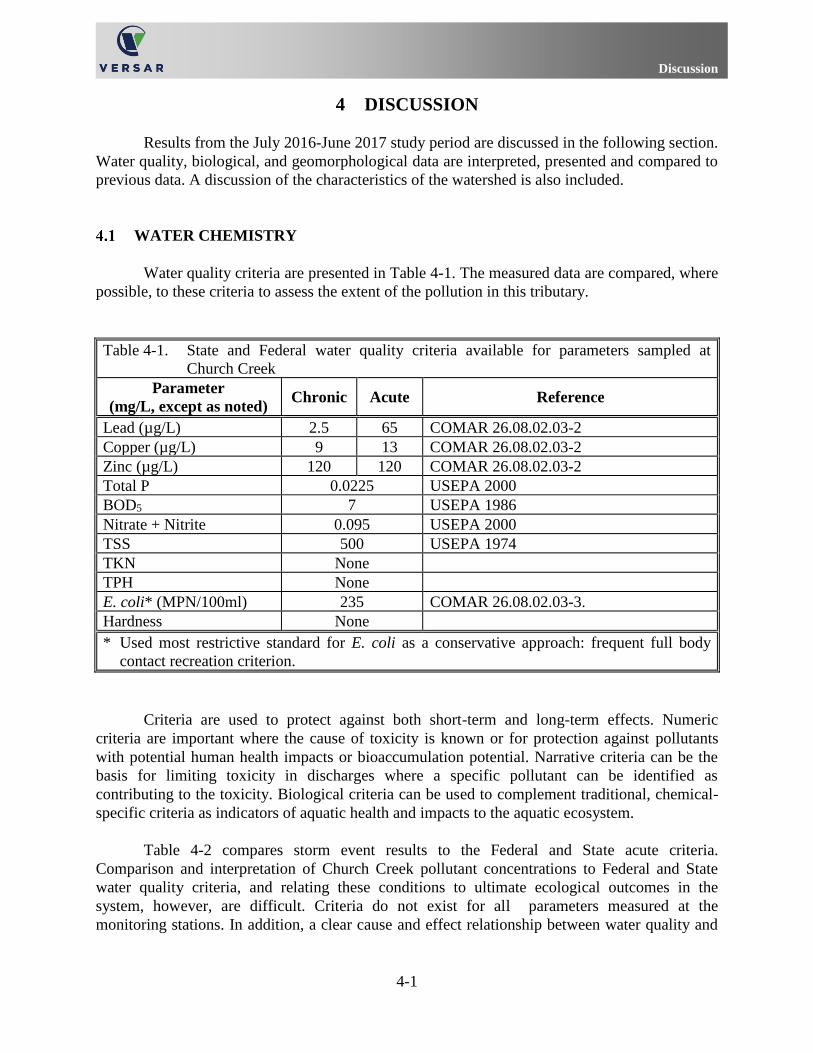
4-1. State and Federal water quality criteria available for parameters sampled at Church
Creek ................................................................................................................................ 4-1
4-2. Maximum concentrations observed for wet weather samples compared to
appropriate criteria ........................................................................................................... 4-2
4-3. Percentage of all wet weather samples that exceed appropriate criteria .......................... 4-3
4-4. Annual average event mean concentrations and criteria (parameters that exceeded
appropriate criteria are indicated) .................................................................................... 4-4
4-5. Total annual loading rates, in pounds, observed at the Parole Plaza Sampling Station
from 2002 to 2017 ............................................................................................................ 4-4
4-6. Total annual loading rates, in pounds, observed at the Church Creek Sampling
Station from 2002 to 2017 ............................................................................................... 4-5
4-7. Seasonal loading rates, in pounds, observed at the Church Creek and Parole Plaza
sampling stations in 2017................................................................................................. 4-6
List of Figures
vi
LIST OF FIGURES
Figure No. Page
2-1. Church Creek study area and stream monitoring locations ............................................... 2-8
2-2. Church Creek BMPs ........................................................................................................ 2-16
4-1. Parole station long-term monitoring: annual EMCs (TKN, NO2+NO3, TP,
TPH; mg/L) ....................................................................................................................... 4-7
4-2. Parole station long-term monitoring: annual EMCs (Cu, Pb, Zn; mg/L) .......................... 4-7
4-3. Parole station long-term monitoring: annual EMCs (TSS; mg/L) .................................... 4-8
4-4. Parole station long-term monitoring: annual EMCs (BOD5; mg/L) ................................. 4-8
4-5. Parole station long-term monitoring: annual EMCs (E. coli; MPN/100 mL) ................... 4-9
4-6. Church Creek station long-term monitoring: annual EMCs (TKN, NO2+NO3,
TP, TPH; mg/L) ............................................................................................................... 4-10
4-7. Church Creek station long-term monitoring: annual EMCs (Cu, Pb, Zn; mg/L) ............ 4-10
4-8. Church Creek station long-term monitoring: annual EMCs (TSS; mg/L) ...................... 4-11
4-9. Church Creek station long-term monitoring: annual EMCs (BOD5; mg/L) ................... 4-11
4-10. Church Creek station long-term monitoring: annual EMCs (E. coli; MPN/ 100 mL) .... 4-12
4-11. Comparison of PHI scores from 2006 to 2017 ................................................................ 4-14
4-12. Comparison of BIBI scores from 2006 to 2017 .............................................................. 4-16
4-13. Comparison of bankfull channel cross-sectional area to drainage area (CC = Church
Creek, 2017 data) ............................................................................................................ 4-18
4-14. Comparison of mean bankfull depth to drainage area (CC = Church Creek,
2017 data) ........................................................................................................................ 4-19
4-15. Comparison of bankfull width to drainage area (CC = Church Creek, 2017 data) ......... 4-20
Introduction
1-1
1 INTRODUCTION
In 1998, Anne Arundel County began implementing a long-term monitoring program that
satisfies requirements for its Countywide National Pollutant Discharge Elimination System
(NPDES) Municipal Separate Storm Sewer System Discharge Permit. Monitoring has continued
to be required as part of the terms of each renewed permit. Currently, monitoring is required to
satisfy conditions outlined in Section F: Assessment of Controls of the County’s new permit
issued in February 2014. The monitoring program includes chemical, biological, and physical
monitoring in the Church Creek subwatershed located within the larger South River watershed.
This document describes the monitoring effort undertaken from July 2016 through June 2017.
Biological and physical monitoring take place at monumented locations along the study
reach, as described in more detail below. The chemical monitoring activities take place at two
stations in the Church Creek subwatershed:
• Downstream of two high-imperviousness, commercial land use outfalls, called the
Parole Plaza monitoring station
• An instream station downstream of the Route 2 culvert, called the Church Creek
monitoring station
The basic permit requirements for storm event monitoring include sampling a target of
12 storms per year (three in each quarter) that are characterized by three representative (rising,
peak, and falling limbs of the hydrograph) discrete samples per storm event, the collection of
baseflow samples during extended dry periods, laboratory analysis of water quality parameters
specified in the permit, biological and physical characterizations of the study reach, and
continuous flow monitoring.
The County is interested in determining the extent to which the redevelopment of the
Parole Plaza site (now known as the Annapolis Towne Centre at Parole) has affected the quality
of the stormwater effluent from the site. Construction began in 2004, and the bulk of the site
work was completed by late 2008. Stream restoration construction took place on a portion of
Church Creek, as well as a tributary, from late 2015 into early 2016. This restoration included
reengineering of stream channel and resulted in minor changes in the profile of the stream from
2015 to 2016.
During 2016, the South River Federation, in cooperation with Anne Arundel County,
undertook restoration of a portion of Church Creek behind the Annapolis Harbor Center and
nearby the County’s existing biological and physical monitoring sites. This work consisted of
1,500 linear feet of stream restoration and implementation of step-pool storm conveyance, riffle
weirs, and grade control structures to improve habitat and increase floodplain connectivity. The
County’s existing biological and physical monitoring locations downstream of this restoration
will be useful in assessing the effects of this work.

Introduction
1-2
Methods
2-1
2 METHODS
CHEMICAL MONITORING
During the 2017 sampling period, July 2016 through June 2017, twelve storm events
were sampled and analyzed. This section describes the equipment and techniques used in this
sampling program. It includes discussions of sample collection, sample analysis, flow data
collection, and basin rainfall characterization. A summary of maintenance activities is also
included. Data and quarterly data reports (Versar 2017a, 2017b, and 2017c) were used to
prepare this annual summary report.
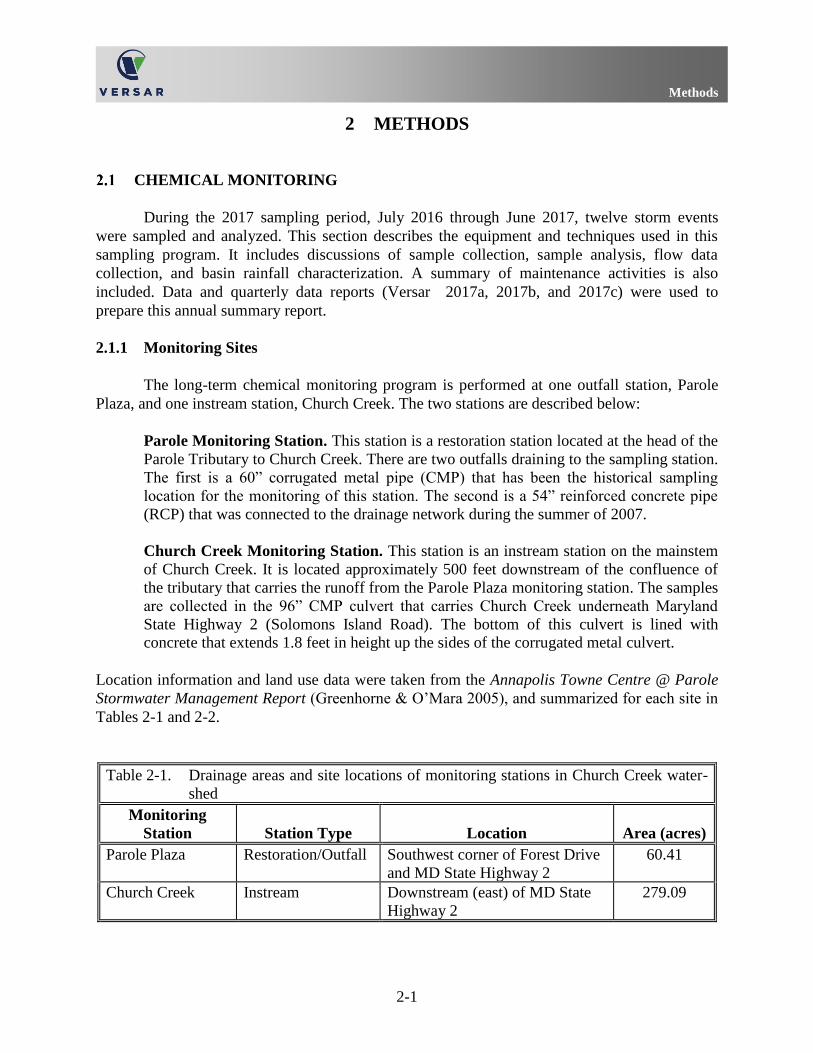
2.1.1 Monitoring Sites
The long-term chemical monitoring program is performed at one outfall station, Parole
Plaza, and one instream station, Church Creek. The two stations are described below:
Parole Monitoring Station. This station is a restoration station located at the head of the
Parole Tributary to Church Creek. There are two outfalls draining to the sampling station.
The first is a 60” corrugated metal pipe (CMP) that has been the historical sampling
location for the monitoring of this station. The second is a 54” reinforced concrete pipe
(RCP) that was connected to the drainage network during the summer of 2007.
Church Creek Monitoring Station. This station is an instream station on the mainstem
of Church Creek. It is located approximately 500 feet downstream of the confluence of
the tributary that carries the runoff from the Parole Plaza monitoring station. The samples
are collected in the 96” CMP culvert that carries Church Creek underneath Maryland
State Highway 2 (Solomons Island Road). The bottom of this culvert is lined with
concrete that extends 1.8 feet in height up the sides of the corrugated metal culvert.
Location information and land use data were taken from the Annapolis Towne Centre @ Parole
Stormwater Management Report (Greenhorne & O’Mara 2005), and summarized for each site in
Tables 2-1 and 2-2.
Table 2-1. Drainage areas and site locations of monitoring stations in Church Creek water-
shed
Monitoring
Station Station Type Location Area (acres)
Parole Plaza Restoration/Outfall Southwest corner of Forest Drive
and MD State Highway 2
60.41
Church Creek Instream Downstream (east) of MD State
Highway 2
279.09
Methods
2-2
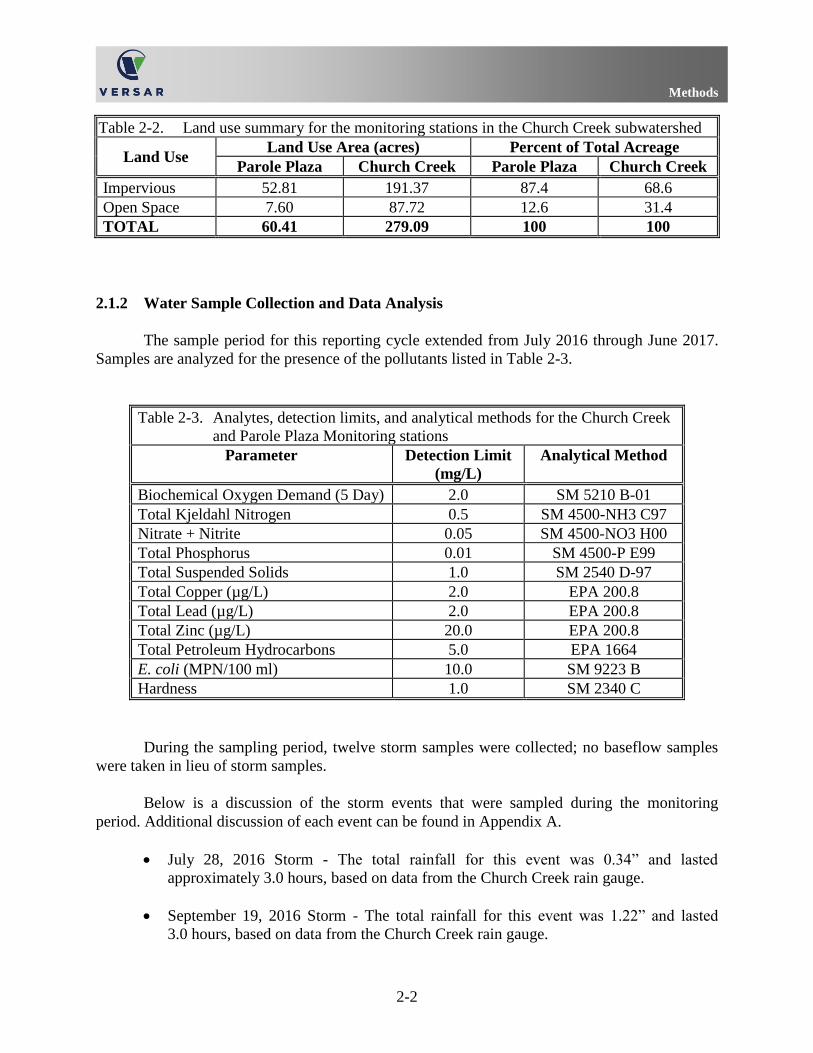
Table 2-2. Land use summary for the monitoring stations in the Church Creek subwatershed
Land Use Land Use Area (acres) Percent of Total Acreage
Parole Plaza Church Creek Parole Plaza Church Creek
Impervious 52.81 191.37 87.4 68.6
Open Space 7.60 87.72 12.6 31.4
TOTAL 60.41 279.09 100 100
2.1.2 Water Sample Collection and Data Analysis
The sample period for this reporting cycle extended from July 2016 through June 2017.
Samples are analyzed for the presence of the pollutants listed in Table 2-3.
Table 2-3. Analytes, detection limits, and analytical methods for the Church Creek
and Parole Plaza Monitoring stations
Parameter Detection Limit
(mg/L)
Analytical Method
Biochemical Oxygen Demand (5 Day) 2.0 SM 5210 B-01
Total Kjeldahl Nitrogen 0.5 SM 4500-NH3 C97
Nitrate + Nitrite 0.05 SM 4500-NO3 H00
Total Phosphorus 0.01 SM 4500-P E99
Total Suspended Solids 1.0 SM 2540 D-97
Total Copper (µg/L) 2.0 EPA 200.8
Total Lead (µg/L) 2.0 EPA 200.8
Total Zinc (µg/L) 20.0 EPA 200.8
Total Petroleum Hydrocarbons 5.0 EPA 1664
E. coli (MPN/100 ml) 10.0 SM 9223 B
Hardness 1.0 SM 2340 C
During the sampling period, twelve storm samples were collected; no baseflow samples
were taken in lieu of storm samples.
Below is a discussion of the storm events that were sampled during the monitoring
period. Additional discussion of each event can be found in Appendix A.
• July 28, 2016 Storm - The total rainfall for this event was 0.34” and lasted
approximately 3.0 hours, based on data from the Church Creek rain gauge.
• September 19, 2016 Storm - The total rainfall for this event was 1.22” and lasted
3.0 hours, based on data from the Church Creek rain gauge.
Methods
2-3
• September 27, 2016 Storm - The total rainfall for this event was 1.79” and lasted
4.5 hours, based on data from the Church Creek rain gauge.
• November 9, 2016 Storm - The total rainfall for this event was 0.11” and lasted
7.0 hours, based on data from the Church Creek rain gauge.
• November 29, 2016 Storm - The total rainfall for this event was 0.08” and lasted
approximately 7.0 hours, based on data from the Church Creek rain gauge. Because
October and November were very dry months with a total rainfall of only 2.8 inches,
this storm was accepted by Anne Arundel County though it did not meet the 0.1”
minimum rainfall requirement.
• December 6, 2016 Storm - The total rainfall for this event was 0.78” and lasted
12 hours, based on data from the Church Creek rain gauge.
• January 23, 2017 Storm - The total rainfall for this event was 0.49” and lasted
12.0 hours, based on data from the Church Creek rain gauge.
• February 28, 2017 Storm - The total rainfall for this event was 0.33” and lasted
approximately 9.0 hours, based on data from the Church Creek rain gauge.
• March 31, 2017 Storm - The total rainfall for this event was 1.12” and lasted 10
hours, based on data from the Church Creek rain gauge.
• April 25, 2017 - The total rainfall for this event was 0.39” and lasted approximately
5.0 hours, based on data from the Church Creek rain gauge.
• May 12, 2017 - The total rainfall for this event was 0.98” and lasted approximately
21.0 hours, based on data from the Church Creek rain gauge.
• June 19, 2017 - The total rainfall for this event was 0.36” and lasted approximately
4.0 hours, based on data from the Church Creek rain gauge.
Approximately 30.44 inches of precipitation was recorded at the Church Creek station
during the 2017 reporting period. Rainfall was measured using a tipping bucket rain gage located
at the Church Creek station. Due to branches hanging over the rain gauge, potentially interfering
with accurate rainfall data collection and clogging the rain gauge, some rain data are missing
from June 28, 2016 through July 13, 2016.
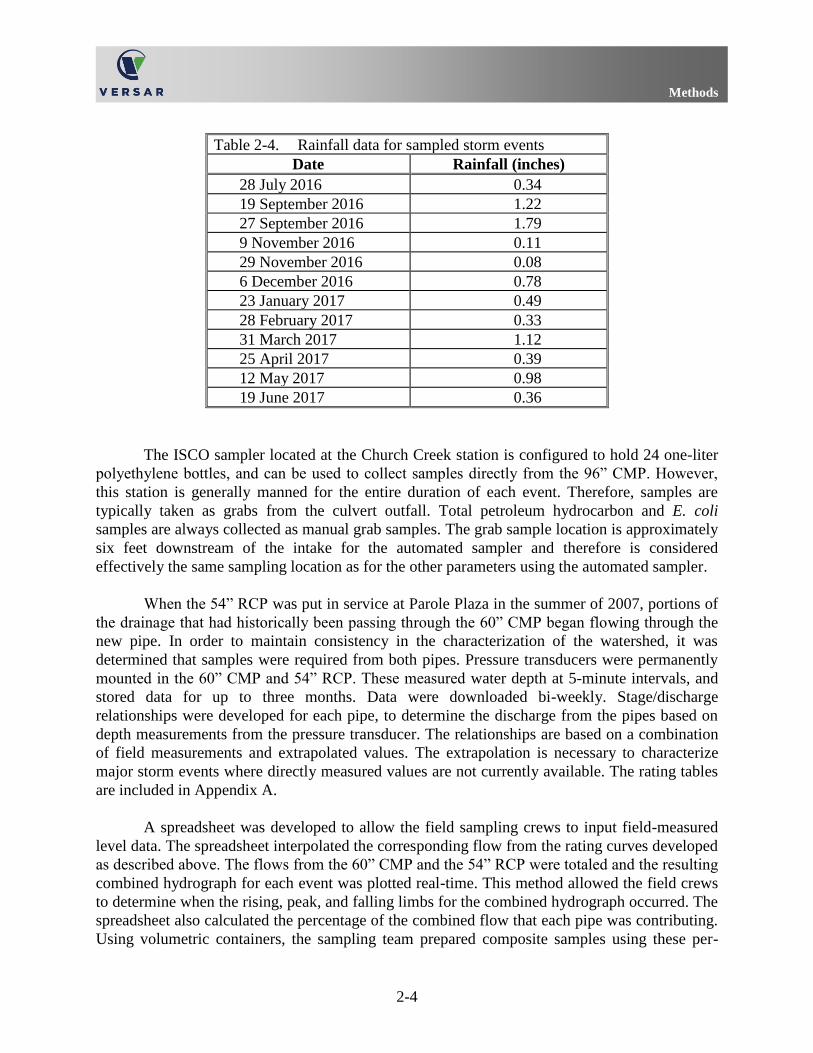
Table 2-4 lists the total rainfall for each sampled event. Hydrographs are provided in
Appendix A. These data, along with stream level readings collected at 5 minute intervals from a
permanently mounted pressure transducer, were logged into an ISCO 6712FR automated
sampler.
Methods
2-4
Table 2-4. Rainfall data for sampled storm events
Date Rainfall (inches)
28 July 2016 0.34
19 September 2016 1.22
27 September 2016 1.79
9 November 2016 0.11
29 November 2016 0.08
6 December 2016 0.78
23 January 2017 0.49
28 February 2017 0.33
31 March 2017 1.12
25 April 2017 0.39
12 May 2017 0.98
19 June 2017 0.36
The ISCO sampler located at the Church Creek station is configured to hold 24 one-liter
polyethylene bottles, and can be used to collect samples directly from the 96” CMP. However,
this station is generally manned for the entire duration of each event. Therefore, samples are
typically taken as grabs from the culvert outfall. Total petroleum hydrocarbon and E. coli
samples are always collected as manual grab samples. The grab sample location is approximately
six feet downstream of the intake for the automated sampler and therefore is considered
effectively the same sampling location as for the other parameters using the automated sampler.
When the 54” RCP was put in service at Parole Plaza in the summer of 2007, portions of
the drainage that had historically been passing through the 60” CMP began flowing through the
new pipe. In order to maintain consistency in the characterization of the watershed, it was
determined that samples were required from both pipes. Pressure transducers were permanently
mounted in the 60” CMP and 54” RCP. These measured water depth at 5-minute intervals, and
stored data for up to three months. Data were downloaded bi-weekly. Stage/discharge
relationships were developed for each pipe, to determine the discharge from the pipes based on
depth measurements from the pressure transducer. The relationships are based on a combination
of field measurements and extrapolated values. The extrapolation is necessary to characterize
major storm events where directly measured values are not currently available. The rating tables
are included in Appendix A.
A spreadsheet was developed to allow the field sampling crews to input field-measured
level data. The spreadsheet interpolated the corresponding flow from the rating curves developed
as described above. The flows from the 60” CMP and the 54” RCP were totaled and the resulting
combined hydrograph for each event was plotted real-time. This method allowed the field crews
to determine when the rising, peak, and falling limbs for the combined hydrograph occurred. The
spreadsheet also calculated the percentage of the combined flow that each pipe was contributing.
Using volumetric containers, the sampling team prepared composite samples using these per-
Methods
2-5
centages, and distributed them to the sample containers. Because of a strong sewage smell during
several storm events, the field crew has been sampling E. coli separately from each pipe at Parole
Plaza. A Technical Memorandum describing the composite sampling procedures in detail was
submitted to the Maryland Department of the Environment in May 2008, and is included in
Appendix A.
Water quality instruments for measuring pH, temperature, and conductivity were used at
both stations. At Parole, an In-Situ Troll 9500 unit mounted within each pipe was used to obtain
measurements during storm events; providing measurements every 5 minutes. Measurements for
these parameters were not available when personnel were not present due to the low flow
conditions at this station. Permanently installed probes would likely dry out and need to be
replaced often, thus these units are engaged only during storm events. At the Church Creek
station, a YSI 600 XL multiparameter sonde was permanently mounted within the culvert and
was connected directly to the ISCO automated sampler, providing measurements every 5
minutes. This unit operates continuously.
Samples were distributed into bottles provided by Martel Laboratories JDS, Inc. From the
beginning of the sampling until the March 31, 2017 storm event E. coli samples were delivered
to Chesapeake Environmental Lab for processing within six hours of being collected. Beginning
with the April 25, 2017 storm event, E. coli samples were delivered to Water Testing Labs of
Maryland. All other samples were delivered to Martel Laboratories within 48 hours.
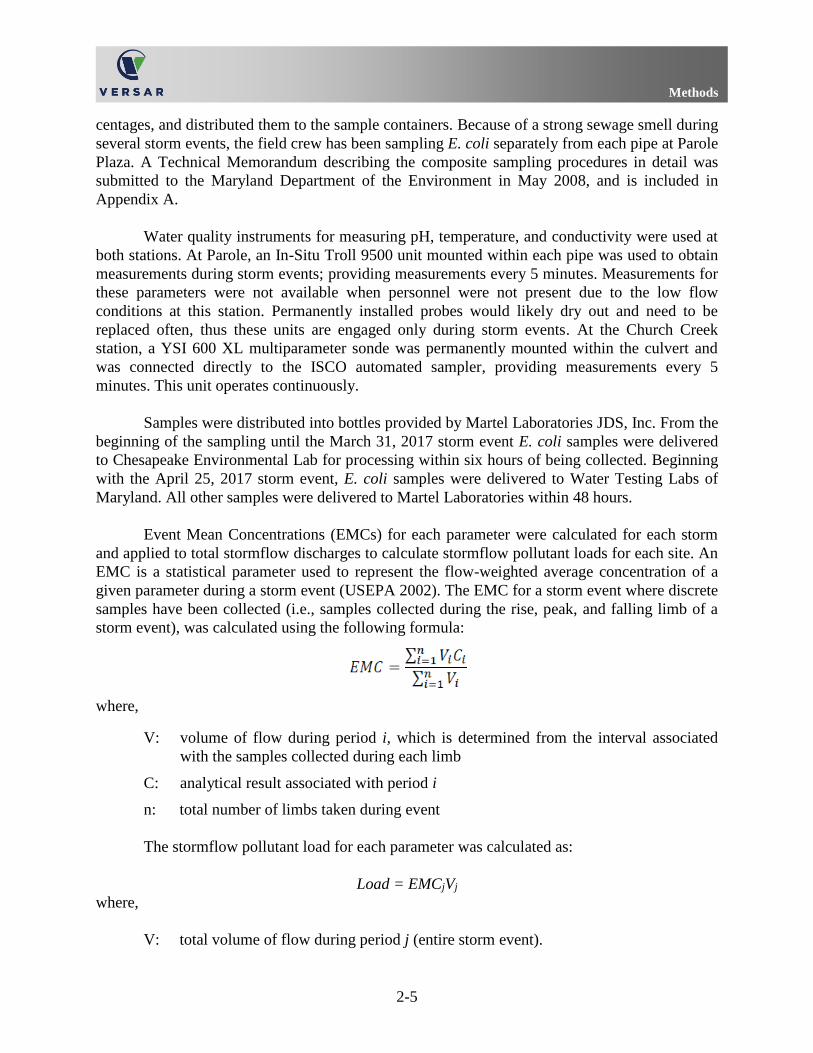
Event Mean Concentrations (EMCs) for each parameter were calculated for each storm
and applied to total stormflow discharges to calculate stormflow pollutant loads for each site. An
EMC is a statistical parameter used to represent the flow-weighted average concentration of a
given parameter during a storm event (USEPA 2002). The EMC for a storm event where discrete
samples have been collected (i.e., samples collected during the rise, peak, and falling limb of a
storm event), was calculated using the following formula:
where,
V: volume of flow during period i, which is determined from the interval associated
with the samples collected during each limb
C: analytical result associated with period i
n: total number of limbs taken during event
The stormflow pollutant load for each parameter was calculated as:
Load = EMCjVj
where,
V: total volume of flow during period j (entire storm event).
Methods
2-6
Average annual EMCs were calculated by taking the arithmetic average of EMCs
calculated when non-detects were set to zero and when non-detects were set to the detection
limit. Since the true concentration of non-detect samples falls somewhere between the detection
limit and the null value, this calculation represents a more accurate estimate than using EMCs
with non-detects set to either zero or the detection limit. Seasonal loads (also referred to as
quarterly loads) for monitored events were calculated by summing all monitored event loads for
a specific season. Total seasonal loads were calculated by multiplying the average seasonal EMC
by the total volume for the season. Annual loads were calculated by summing all seasonal loads.
2.1.3 Monitoring Station Maintenance
Maintenance was conducted at each sampling station on a biweekly basis. Maintenance
included calibration of all probes, inspection of the sampling equipment, intake lines, and pro-
gramming, and an overall cleaning and organization of the stations. A few issues concerning the
replacement of monitoring equipment and the loss of data occurred during the monitoring period;
below is a summary of these issues:
• On July 7, Anne Arundel County notified Versar that branches were hanging over the
rain gauge, potentially interfering with accurate rainfall data collection. During the
next maintenance trip, field staff clipped the branches, and cleared the rain gauge of
any debris. To avoid future clogging, on September 2, Versar field staff cut the
branches that were hanging over the rain gauge. Before sampling the storm on July
28, field staff noticed the submerged probe was not accurately recording level at the
Church Creek station, so it was adjusted for the storm. After the storm, the level
continued to drift higher; therefore, on August 18, an Onset HOBO stage logger was
installed in the stream to replace the malfunctioning Teledyne ISCO submerged
probe. On September 13, the HOBO logger was removed, and a working Teledyne
ISCO submerged probe was installed and reattached to the 720 module. Field staff
verified that the ISCO was accurately recording level before leaving the site. Staff
noted that the ISCO data had begun to drift on July 22, so Versar’s data analyst
corrected the data by factoring out the drift using linear regressions. The HOBO
logger data were post-processed and substituted into the Church Creek Continuous
Flow Data_07-09_16 Excel spreadsheet during the period of August 18, 2016 at 5
p.m. until September 13, 2016 at 1 p.m.
• On November 21, field staff replaced the YSI 600XL sonde at Church Creek with a
spare provided by Anne Arundel County. All probes subsequently properly recorded
water quality except for conductivity, which was inadvertently set by field staff to
record specific conductivity. During the routine maintenance on November 28 at 3:00
p.m., the field team corrected the sonde settings to record conductivity. The specific
conductivity readings are highlighted in the “Church Creek Continuous Flow
Data_10-12_16” file. Versar will convert specific conductivity to conductivity and
provide revised data in an addendum. Note that in the continuous flow data file, on
December 30, higher ambient temperature readings caused ice and snow melt which
Methods
2-7
resulted in a period of higher flow and conductivity readings. At Parole Plaza after
the storm on November 9, the Global Water loggers were adjusted to record data
using a time stamp set to daylight savings time.
• During the routine maintenance at Church Creek on February 7, field staff noticed
erroneous temperature readings (e.g., 101 degrees Fahrenheit) recorded by the YSI
600XL sonde. The problematic temperature data likely affected conductivity values.
The temperature/conductivity probe was removed immediately and Anne Arundel
County was informed that a new probe was needed. Also, during that visit, field staff
removed leaves, trash, and debris from the sonde and level logger area of the stream.
On February 23, staff installed the new temperature/conductivity probe and
confirmed that all probes properly logged water quality. After reviewing the data,
staff concluded that high conductivity readings did not result from salted road runoff,
but from the malfunctioning probe. Erroneous conductivity measurements were
removed from the data file where Versar determined the problem began. The
incorrect data included the storm event on January 23, so there are no temperature
and conductivity data for this storm on the EMC spreadsheet.
• The CMP Global Water logger was calibrated on May 24, 2017 because the level on
the logger was not reading accurately with the actual measurement taken by the field
staff. During the routine maintenance on June 8 at Parole Plaza both of the Global
Water loggers were adjusted to record data using a time stamp set to daylight savings
time.
BIOLOGICAL MONITORING
All biological assessment data were collected in accordance with the Anne Arundel
County Biological Monitoring and Assessment Program: Quality Assurance Project Plan (Anne
Arundel County 2010), which incorporates many elements of Maryland Department of Natural
Resources’ Maryland Biological Stream Survey (MBSS). Geomorphic assessment data were
collected in accordance with the standard operating procedures (SOPs) approved for the
County’s NPDES Program. All methods are consistent with previous years’ methods (with
applicable updates) to ensure data comparability between years. Collection methods are
summarized below. Field data were collected in 2017 by Versar, Inc., a consultant to Anne
Arundel County.
2.2.1 Sampling Locations
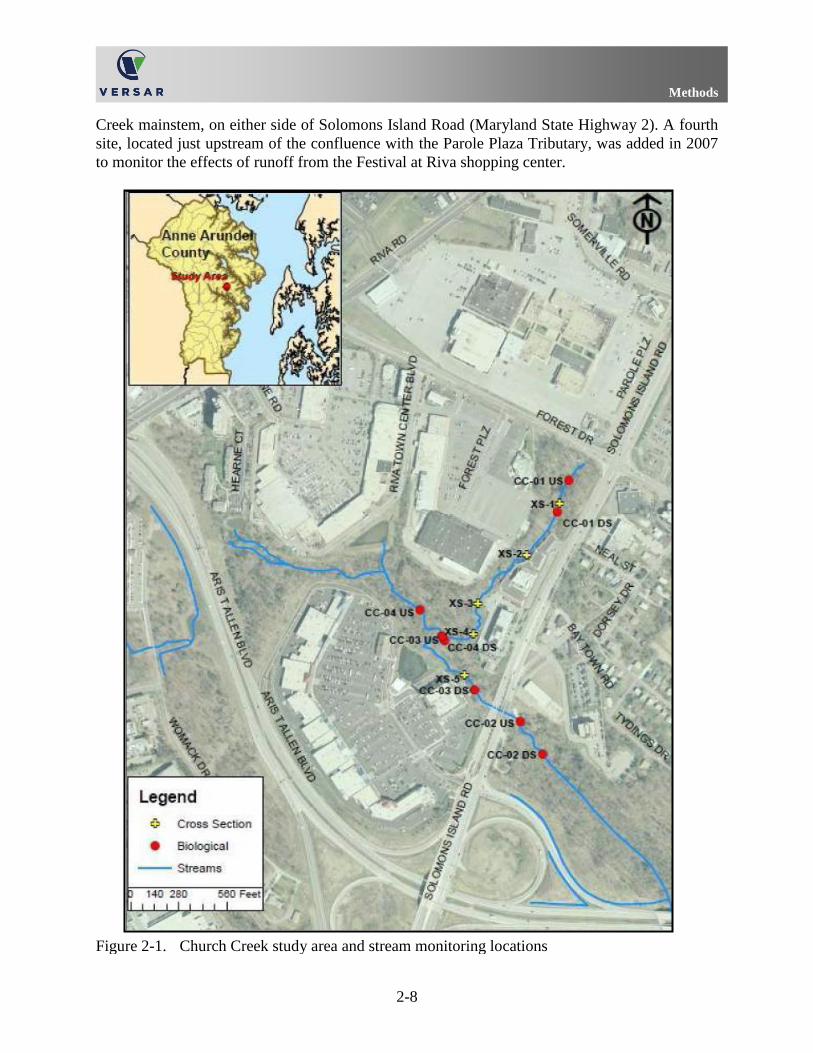
The study area is located in the northern portion of the Church Creek subwatershed,
within the larger South River watershed in Anne Arundel County, Maryland (Figure 2-1). A total
of four 75-meter biological monitoring sites are positioned along the study reach and are
monitored annually. Three sites were established and first monitored in 2006; one site is located
on the Parole Plaza Tributary just below Forest Drive, and two sites are located along the Church
Methods
2-8
Creek mainstem, on either side of Solomons Island Road (Maryland State Highway 2). A fourth
site, located just upstream of the confluence with the Parole Plaza Tributary, was added in 2007
to monitor the effects of runoff from the Festival at Riva shopping center.
Figure 2-1. Church Creek study area and stream monitoring locations
Methods
2-9
2.2.2 Stream Habitat Evaluation
To support the biological monitoring, a visual assessment of physical habitat was com-
pleted at each monitoring site to evaluate the reach’s ability to support aquatic life. Both the
MBSS Physical Habitat Index (PHI; Paul et al. 2003) and the U.S. Environmental Protection
Agency (U.S. EPA) Rapid Bioassessment Protocol (RBP) habitat assessment for low gradient
streams (Barbour et al. 1999) were used to visually assess the physical habitat at each site in
conjunction with the spring benthic monitoring. Both habitat assessments consist of a review of
biologically significant habitat parameters that evaluate a stream’s ability to support an
acceptable level of biological health.
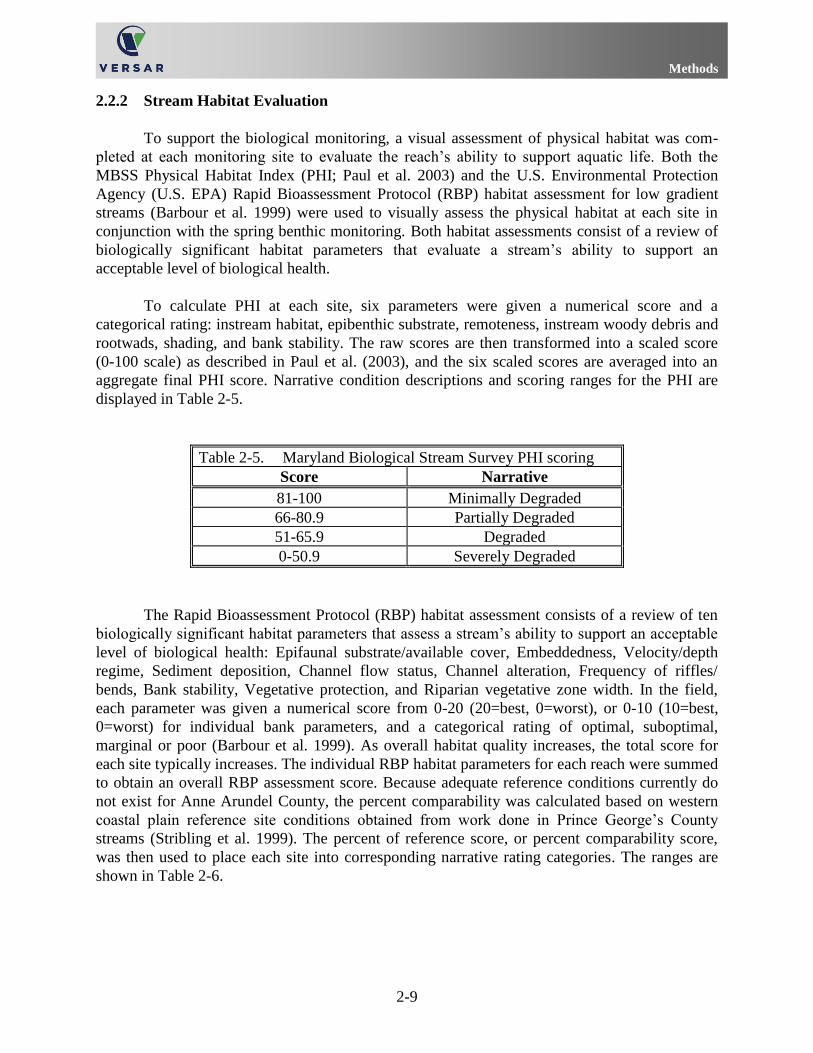
To calculate PHI at each site, six parameters were given a numerical score and a
categorical rating: instream habitat, epibenthic substrate, remoteness, instream woody debris and
rootwads, shading, and bank stability. The raw scores are then transformed into a scaled score
(0-100 scale) as described in Paul et al. (2003), and the six scaled scores are averaged into an
aggregate final PHI score. Narrative condition descriptions and scoring ranges for the PHI are
displayed in Table 2-5.
Table 2-5. Maryland Biological Stream Survey PHI scoring
Score Narrative
81-100 Minimally Degraded
66-80.9 Partially Degraded
51-65.9 Degraded
0-50.9 Severely Degraded
The Rapid Bioassessment Protocol (RBP) habitat assessment consists of a review of ten
biologically significant habitat parameters that assess a stream’s ability to support an acceptable
level of biological health: Epifaunal substrate/available cover, Embeddedness, Velocity/depth
regime, Sediment deposition, Channel flow status, Channel alteration, Frequency of riffles/
bends, Bank stability, Vegetative protection, and Riparian vegetative zone width. In the field,
each parameter was given a numerical score from 0-20 (20=best, 0=worst), or 0-10 (10=best,
0=worst) for individual bank parameters, and a categorical rating of optimal, suboptimal,
marginal or poor (Barbour et al. 1999). As overall habitat quality increases, the total score for
each site typically increases. The individual RBP habitat parameters for each reach were summed
to obtain an overall RBP assessment score. Because adequate reference conditions currently do
not exist for Anne Arundel County, the percent comparability was calculated based on western
coastal plain reference site conditions obtained from work done in Prince George’s County
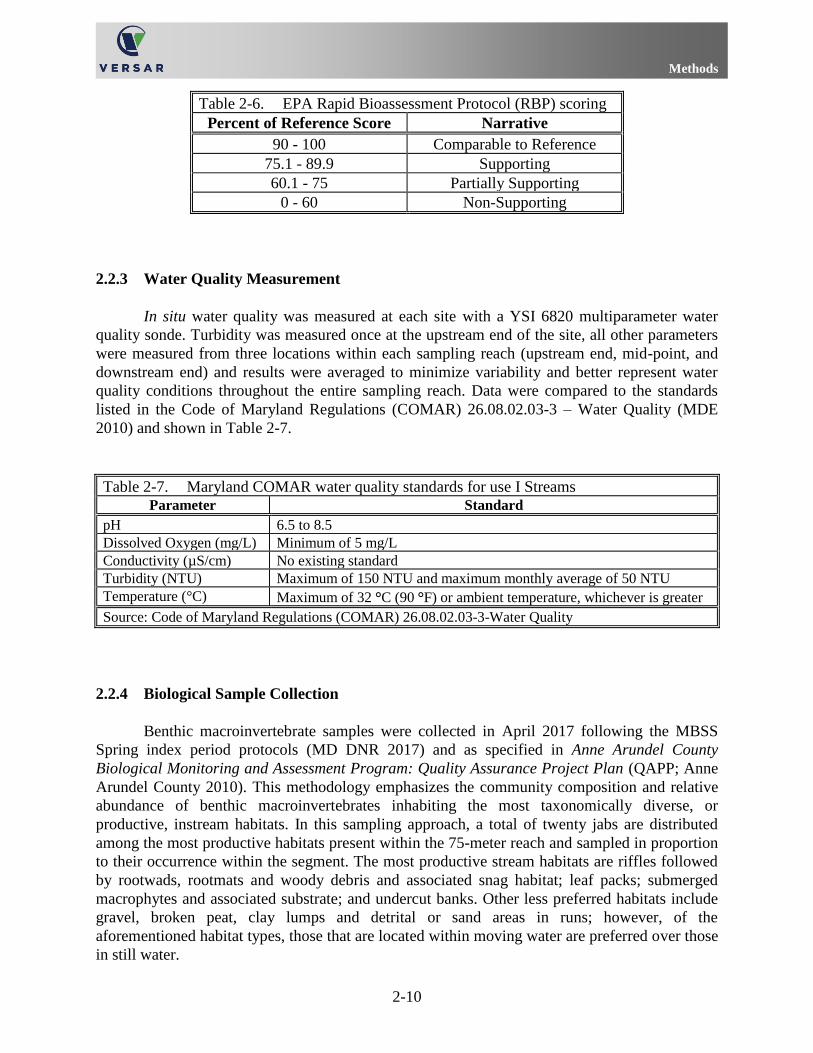
streams (Stribling et al. 1999). The percent of reference score, or percent comparability score,
was then used to place each site into corresponding narrative rating categories. The ranges are
shown in Table 2-6.
Methods
2-10
Table 2-6. EPA Rapid Bioassessment Protocol (RBP) scoring
Percent of Reference Score Narrative
90 - 100 Comparable to Reference
75.1 - 89.9 Supporting
60.1 - 75 Partially Supporting
0 - 60 Non-Supporting
2.2.3 Water Quality Measurement
In situ water quality was measured at each site with a YSI 6820 multiparameter water
quality sonde. Turbidity was measured once at the upstream end of the site, all other parameters
were measured from three locations within each sampling reach (upstream end, mid-point, and
downstream end) and results were averaged to minimize variability and better represent water
quality conditions throughout the entire sampling reach. Data were compared to the standards
listed in the Code of Maryland Regulations (COMAR) 26.08.02.03-3 – Water Quality (MDE
2010) and shown in Table 2-7.
Table 2-7. Maryland COMAR water quality standards for use I Streams Parameter Standard
pH 6.5 to 8.5
Dissolved Oxygen (mg/L) Minimum of 5 mg/L
Conductivity (µS/cm) No existing standard
Turbidity (NTU) Maximum of 150 NTU and maximum monthly average of 50 NTU
Temperature (°C) Maximum of 32 °C (90 °F) or ambient temperature, whichever is greater
Source: Code of Maryland Regulations (COMAR) 26.08.02.03-3-Water Quality
2.2.4 Biological Sample Collection
Benthic macroinvertebrate samples were collected in April 2017 following the MBSS
Spring index period protocols (MD DNR 2017) and as specified in Anne Arundel County
Biological Monitoring and Assessment Program: Quality Assurance Project Plan (QAPP; Anne
Arundel County 2010). This methodology emphasizes the community composition and relative
abundance of benthic macroinvertebrates inhabiting the most taxonomically diverse, or
productive, instream habitats. In this sampling approach, a total of twenty jabs are distributed
among the most productive habitats present within the 75-meter reach and sampled in proportion
to their occurrence within the segment. The most productive stream habitats are riffles followed
by rootwads, rootmats and woody debris and associated snag habitat; leaf packs; submerged
macrophytes and associated substrate; and undercut banks. Other less preferred habitats include
gravel, broken peat, clay lumps and detrital or sand areas in runs; however, of the
aforementioned habitat types, those that are located within moving water are preferred over those
in still water.
Methods
2-11
2.2.5 Biological Sample Processing and Identification
Benthic macroinvertebrate samples were processed and subsampled according to
Maryland Biological Stream Survey methods described in the MBSS laboratory methods manual
(Boward and Freidman, 2000) and as briefly summarized in the Anne Arundel County Biological
Monitoring and Assessment Program: Quality Assurance Project Plan (Anne Arundel County
2010). Subsampling is conducted to standardize the sample size and reduce variation caused by
field collection methods. In brief, the sample was washed of preservative in a 0.595 mm screen
and spread evenly across a tray comprised of 100 numbered 5cm x 5cm grids. A random number
between one and 100 was selected and the selected gird was picked entirely of
macroinvertebrates under a bright light source. This process was repeated until a count of 120
was reached. The 120 organism target was used following MBSS methods to allow for
specimens that are missing parts or are early instars, which cannot be properly identified.
The samples were taxonomically identified by Versar taxonomists certified by the
Society for Freshwater Science (SFS) (formerly known as the North American Benthological
Society, NABS). The taxonomic hierarchical level for most organisms was genus level when
possible with the exception of Oligochaeta, which were identified to the family level. Early
instars or damaged specimens were identified to the lowest possible level. Oligochaeta and
Chironomidae specimens were permanently slide mounted for identification. Counts and
identifications were recorded on a laboratory bench sheet and entered into a master database for
analysis. A list of all taxa identified is provided in Appendix B: Master Taxa List.
2.2.6 Biological Data Analysis
Benthic macroinvertebrate data were analyzed using methods developed by MBSS as
outlined in the New Biological Indicators to Better Assess the Condition of Maryland Streams
(Southerland et al. 2005). The Benthic Index of Biotic Integrity (BIBI) approach involves
statistical analysis using metrics that have a predictable response to water quality and/or habitat
impairment. The metrics selected fall into five major groups including taxa richness, composition
measures, tolerance to perturbation, trophic classification, and habit measures. Tolerance values
were obtained from Bressler et al. (2005).
Raw values from each metric are given a score of 1, 3, or 5 based on ranges of values
developed for each metric. The results are combined into a scaled BIBI score ranging from 1.0 to
5.0 and a corresponding narrative rating is assigned. Table 2-8 shows the thresholds for the
determination of the metric scoring. Three sets of metric calculations have been developed for
Maryland streams based on broad physiographic regions: Coastal Plain, Piedmont and Combined
Highlands. The Coastal Plain and Piedmont regions are divided by the Fall Line. The current
study area is located within the Coastal Plain region. The metrics calculated for Coastal Plain
streams are as follows:
Total Number of Taxa – Equals the richness of the community in terms of the total
number of genera at the genus level or higher. A large variety of genera typically indicate
better overall water quality, habitat diversity and/or suitability, and community health.
Methods
2-12
Number of EPT Taxa – Equals the richness of genera within the Ephemeroptera (may-
flies), Plecoptera (stoneflies), and Trichoptera (caddisflies). EPT taxa are generally con-
sidered pollution sensitive, thus higher levels of EPT taxa would be indicative of higher
water quality.
Number of Ephemeroptera Taxa – Equals the total number Ephemeroptera Taxa in the
sample. Ephemeroptera are generally considered pollution sensitive, thus communities
dominated by Ephemeroptera usually indicate lower disturbances in water quality.
Percent Intolerant Urban – Percentage of sample considered intolerant to urbanization.
Equals the percentage of individuals in the sample with a tolerance value of 0-3 out of 10.
As impairment increases the percent of intolerant taxa decreases.
Percent Ephemeroptera – Equals the percent of Ephemeroptera individuals in the
sample. Ephemeroptera are generally considered pollution sensitive, thus communities
dominated by Ephemeroptera usually indicate lower disturbances in water quality.
Number Scraper Taxa – Equals the number of scraper taxa in the sample, those taxa that
scrape food from the substrate. As the levels of stressors or pollution rise there is an
expected decrease in the numbers of Scraper taxa.
Percent Climbers – Equals the percentage of the total number of individuals who are
adapted to living on stem type surfaces. Higher percentages of climbers typically repre-
sent a decrease in stressors and overall better water quality.
All of the metric scores are summed and then averaged to obtain the final BIBI score.
Table 2-9 shows the scores and narrative rankings of the MBSS BIBI. The biological
assessment results are included in Appendix C. The QA/QC information is included in
Appendix D.
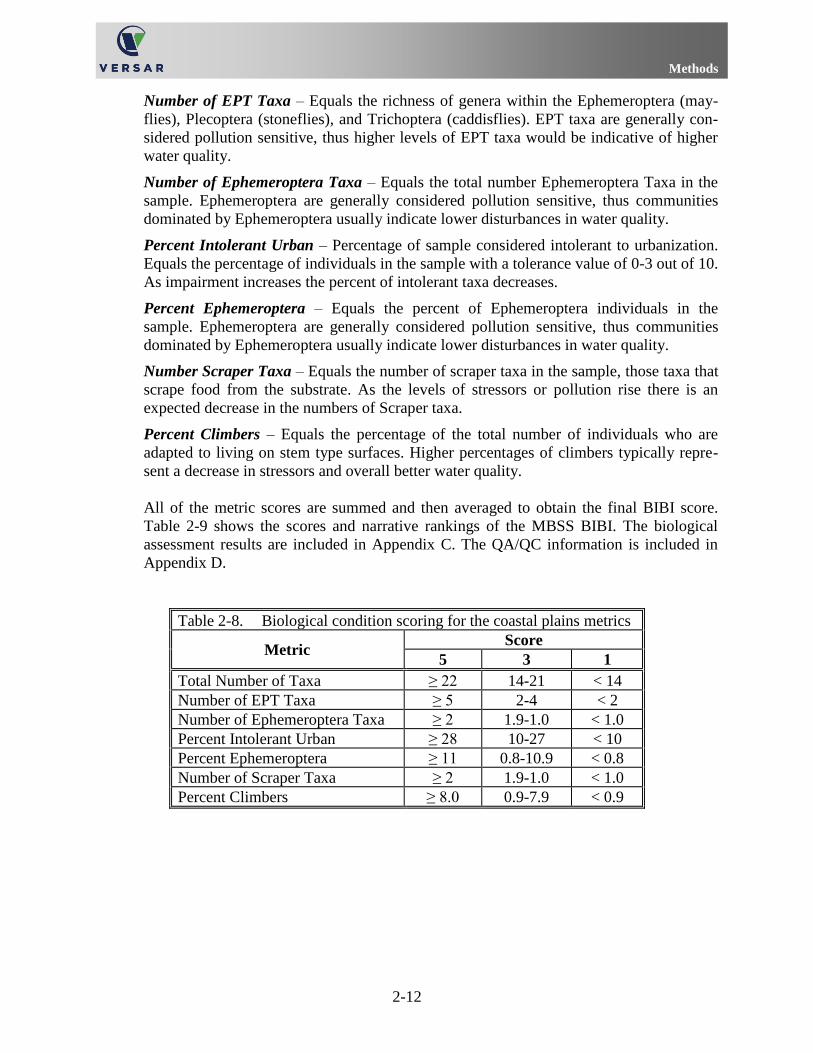
Table 2-8. Biological condition scoring for the coastal plains metrics
Metric Score
5 3 1
Total Number of Taxa ≥ 22 14-21 < 14
Number of EPT Taxa ≥ 5 2-4 < 2
Number of Ephemeroptera Taxa ≥ 2 1.9-1.0 < 1.0
Percent Intolerant Urban ≥ 28 10-27 < 10
Percent Ephemeroptera ≥ 11 0.8-10.9 < 0.8
Number of Scraper Taxa ≥ 2 1.9-1.0 < 1.0
Percent Climbers ≥ 8.0 0.9-7.9 < 0.9
Methods
2-13
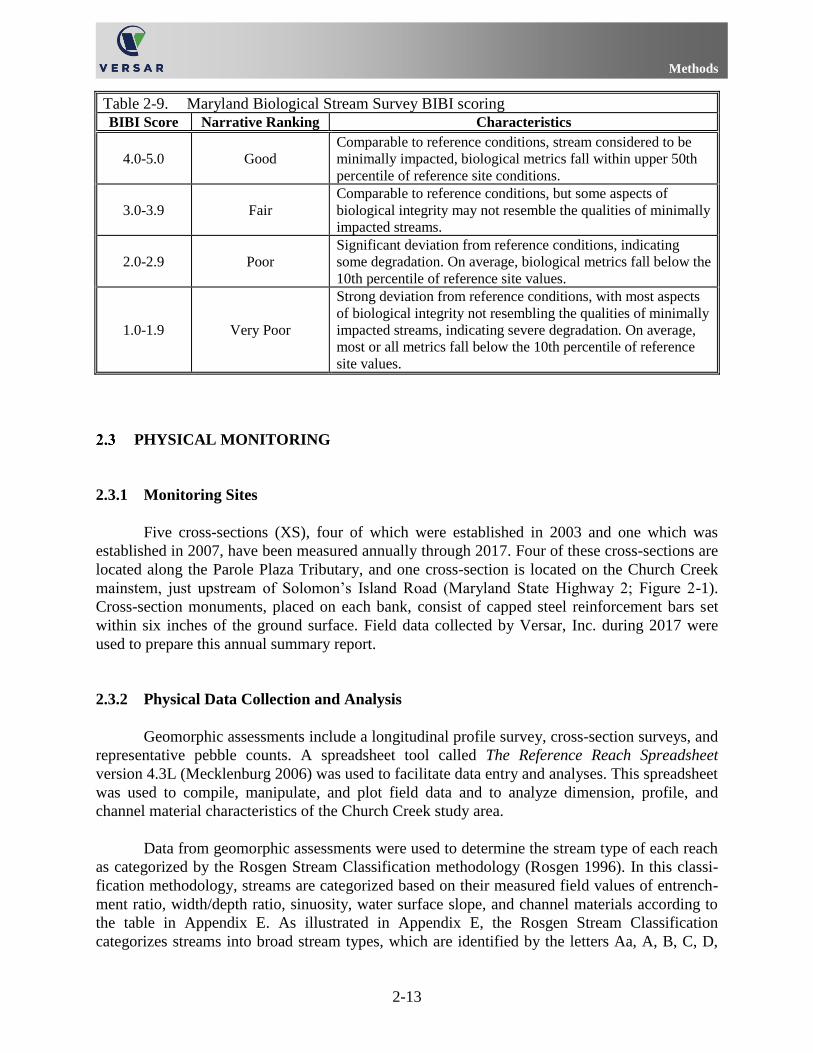
Table 2-9. Maryland Biological Stream Survey BIBI scoring
BIBI Score Narrative Ranking Characteristics
4.0-5.0 Good
Comparable to reference conditions, stream considered to be
minimally impacted, biological metrics fall within upper 50th
percentile of reference site conditions.
3.0-3.9 Fair
Comparable to reference conditions, but some aspects of
biological integrity may not resemble the qualities of minimally
impacted streams.
2.0-2.9 Poor
Significant deviation from reference conditions, indicating
some degradation. On average, biological metrics fall below the
10th percentile of reference site values.
1.0-1.9 Very Poor
Strong deviation from reference conditions, with most aspects
of biological integrity not resembling the qualities of minimally
impacted streams, indicating severe degradation. On average,
most or all metrics fall below the 10th percentile of reference
site values.
PHYSICAL MONITORING
2.3.1 Monitoring Sites
Five cross-sections (XS), four of which were established in 2003 and one which was
established in 2007, have been measured annually through 2017. Four of these cross-sections are
located along the Parole Plaza Tributary, and one cross-section is located on the Church Creek
mainstem, just upstream of Solomon’s Island Road (Maryland State Highway 2; Figure 2-1).
Cross-section monuments, placed on each bank, consist of capped steel reinforcement bars set
within six inches of the ground surface. Field data collected by Versar, Inc. during 2017 were
used to prepare this annual summary report.
2.3.2 Physical Data Collection and Analysis
Geomorphic assessments include a longitudinal profile survey, cross-section surveys, and
representative pebble counts. A spreadsheet tool called The Reference Reach Spreadsheet
version 4.3L (Mecklenburg 2006) was used to facilitate data entry and analyses. This spreadsheet
was used to compile, manipulate, and plot field data and to analyze dimension, profile, and
channel material characteristics of the Church Creek study area.
Data from geomorphic assessments were used to determine the stream type of each reach
as categorized by the Rosgen Stream Classification methodology (Rosgen 1996). In this classi-
fication methodology, streams are categorized based on their measured field values of entrench-
ment ratio, width/depth ratio, sinuosity, water surface slope, and channel materials according to
the table in Appendix E. As illustrated in Appendix E, the Rosgen Stream Classification
categorizes streams into broad stream types, which are identified by the letters Aa, A, B, C, D,
Methods
2-14
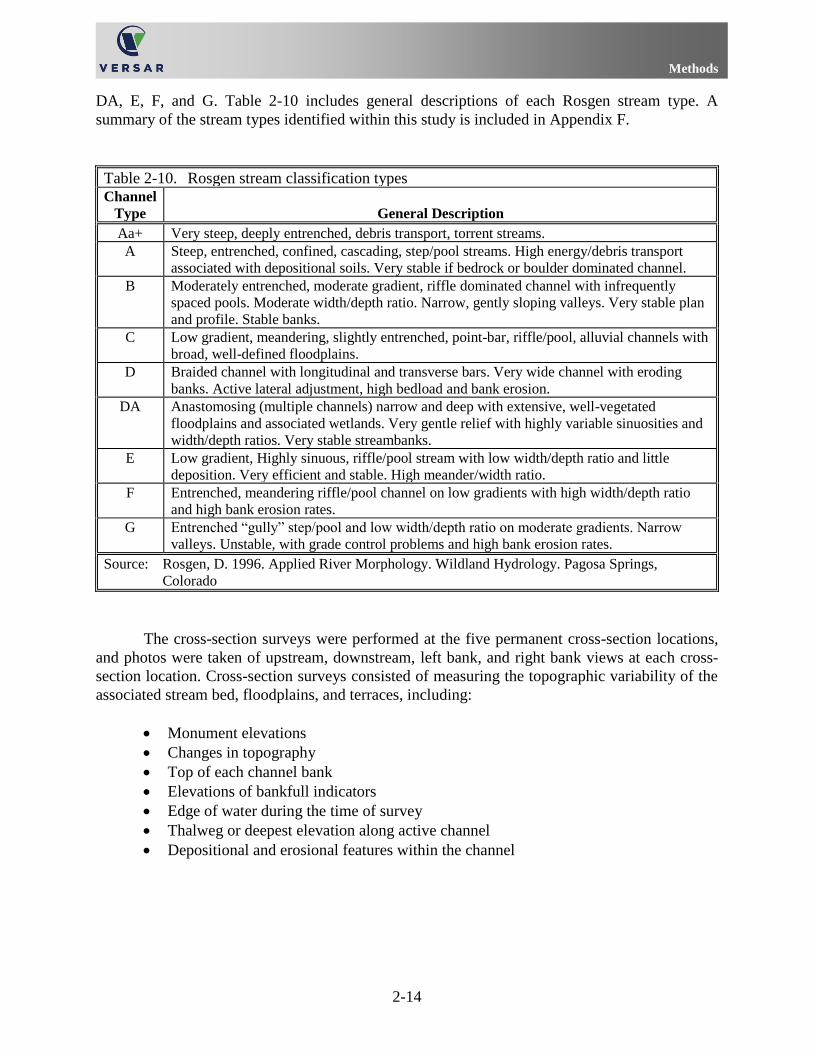
DA, E, F, and G. Table 2-10 includes general descriptions of each Rosgen stream type. A
summary of the stream types identified within this study is included in Appendix F.
Table 2-10. Rosgen stream classification types Channel
Type General Description
Aa+ Very steep, deeply entrenched, debris transport, torrent streams.
A Steep, entrenched, confined, cascading, step/pool streams. High energy/debris transport
associated with depositional soils. Very stable if bedrock or boulder dominated channel.
B Moderately entrenched, moderate gradient, riffle dominated channel with infrequently
spaced pools. Moderate width/depth ratio. Narrow, gently sloping valleys. Very stable plan
and profile. Stable banks.
C Low gradient, meandering, slightly entrenched, point-bar, riffle/pool, alluvial channels with
broad, well-defined floodplains.
D Braided channel with longitudinal and transverse bars. Very wide channel with eroding
banks. Active lateral adjustment, high bedload and bank erosion.
DA Anastomosing (multiple channels) narrow and deep with extensive, well-vegetated
floodplains and associated wetlands. Very gentle relief with highly variable sinuosities and
width/depth ratios. Very stable streambanks.
E Low gradient, Highly sinuous, riffle/pool stream with low width/depth ratio and little
deposition. Very efficient and stable. High meander/width ratio.
F Entrenched, meandering riffle/pool channel on low gradients with high width/depth ratio
and high bank erosion rates.
G Entrenched “gully” step/pool and low width/depth ratio on moderate gradients. Narrow
valleys. Unstable, with grade control problems and high bank erosion rates.
Source: Rosgen, D. 1996. Applied River Morphology. Wildland Hydrology. Pagosa Springs,
Colorado
The cross-section surveys were performed at the five permanent cross-section locations,
and photos were taken of upstream, downstream, left bank, and right bank views at each cross-
section location. Cross-section surveys consisted of measuring the topographic variability of the
associated stream bed, floodplains, and terraces, including:
• Monument elevations
• Changes in topography
• Top of each channel bank
• Elevations of bankfull indicators
• Edge of water during the time of survey
• Thalweg or deepest elevation along active channel
• Depositional and erosional features within the channel
Methods
2-15
During the cross-sectional survey, the following measurements and calculations of the
bankfull channel, which are critical for determining the Rosgen stream type of each reach, also
were collected:
• Bankfull Width (Wbkf): the width of the channel at the elevation of bankfull
discharge or at the stage that defines the bankfull channel.
• Mean Depth (dbkf): the mean depth of the bankfull channel.
• Bankfull Cross-sectional Area (Abkf): the area of the bankfull channel, estimated as
the product of bankfull width and mean depth.
• Width Depth Ratio (Wbkf/dbkf): the ratio of the bankfull width versus mean depth.
• Maximum Depth (dmbkf): the maximum depth of the bankfull channel, or the
difference between the thalweg elevation and the bankfull discharge elevation.
• Width of Floodprone Area (Wfpa): the width of the channel at a stage of twice the
maximum depth. If the width of the floodprone area was far outside of the channel, its
value was visually estimated or paced off.
• Entrenchment Ratio (ER): the ratio of the width of the floodprone area versus
bankfull width.
• Sinuosity (K): ratio of the stream length versus the valley length or the valley slope
divided by the channel slope. Sinuosity was visually estimated or the valley length
was paced off so that an estimate could be calculated.
To quantify the distribution of channel substrate particles sizes within the study area, a
modified Wolman pebble count (Rosgen 1996) was performed at each cross-section location.
Reach-wide proportional counts were used. Each pebble count consists of stratifying the reach
based on the frequency of channel features in that reach (e.g., riffle, run, pool, glide) and
measuring 100 particles across ten transects (i.e., 10 particles in each of 10 transects). The
transects are allocated across all feature types in the proportion at which they occur within the
reach. The intermediate axis of each measured pebble is recorded. The goal of the pebble count
is to measure 100 particles across the bankfull width of the channel and calculate the median
substrate particle size (i.e., D50) of the reach. This value is used for categorizing the sites into
the Rosgen Stream Classification (Rosgen 1996). If a channel was clearly a sand or silt bed
channel with no distinct variation in material size, the pebble count was not performed, and the
D50 was visually estimated. However, if the channel did have variation in bed material size from
feature to feature, a full pebble count was performed.
LAND USE AND STORMWATER MANAGEMENT ASSESSMENT
2.4.1 Church Creek Watershed Land Use
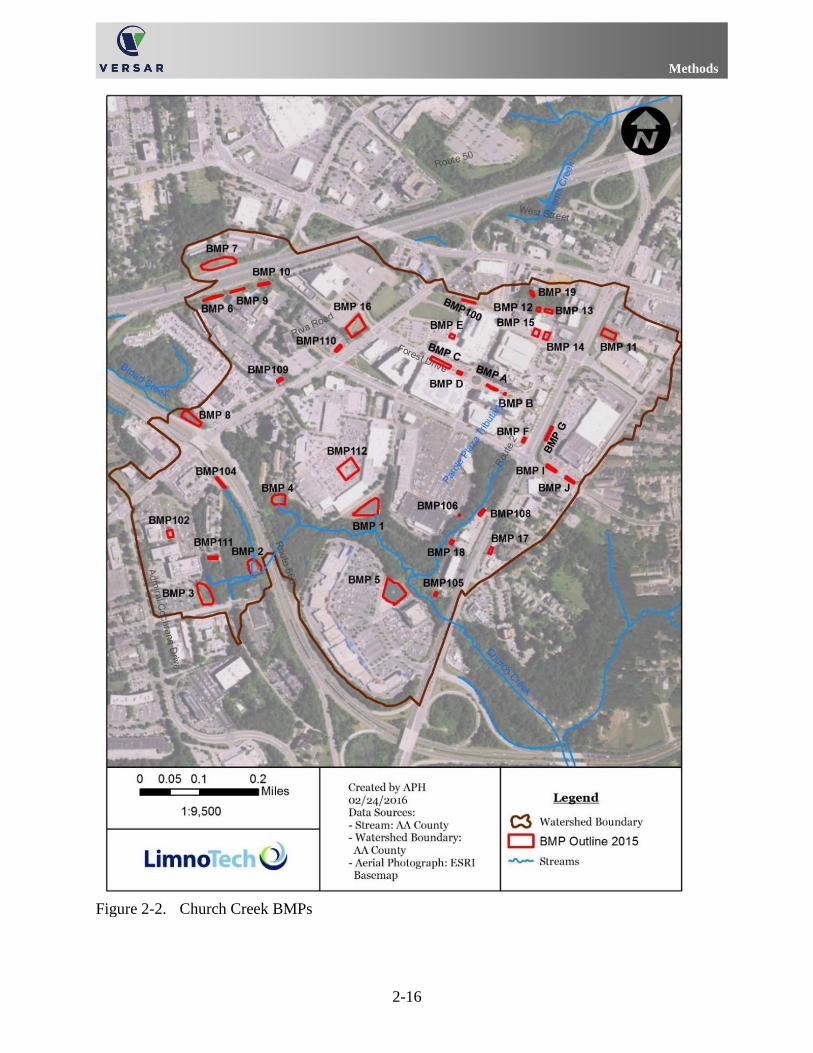
A previous report (Versar 2013) provided information on land use, based on field
reconnaissance conducted during 2013. As seen in an aerial photograph and stormwater best
management practice (BMP) facilities map (Figure 2-2), the watershed is predominantly
Methods
2-16
Figure 2-2. Church Creek BMPs
Methods
2-17
commercial with open space area adjacent to the stream channels. There is little available area
for further development in the watershed except for areas that are being redeveloped. Anecdotal
information indicates there has been no change in land use in this watershed since the 2013 land
use evaluation.
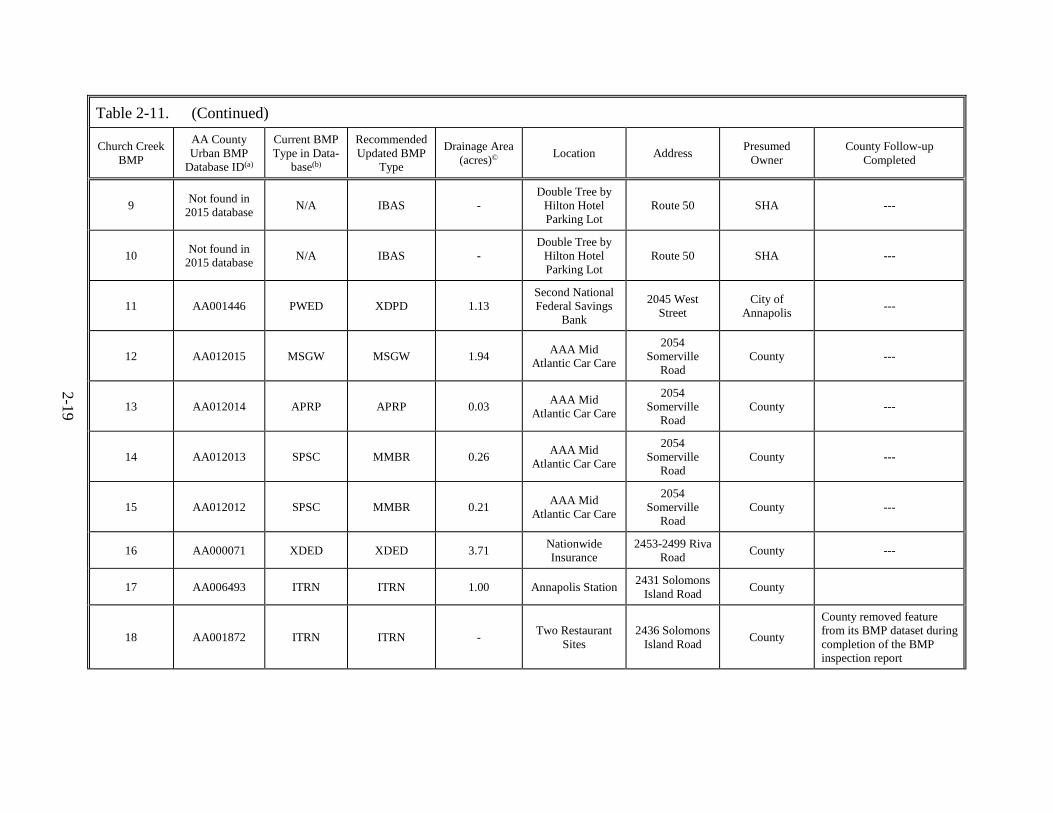
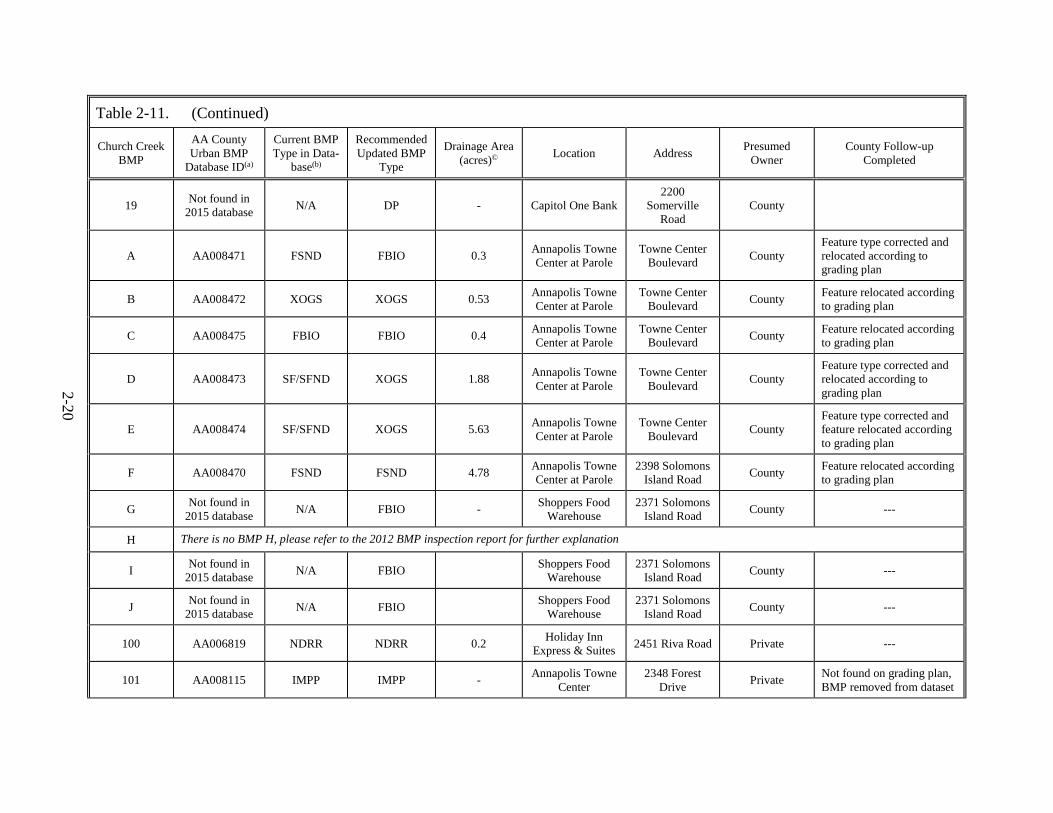
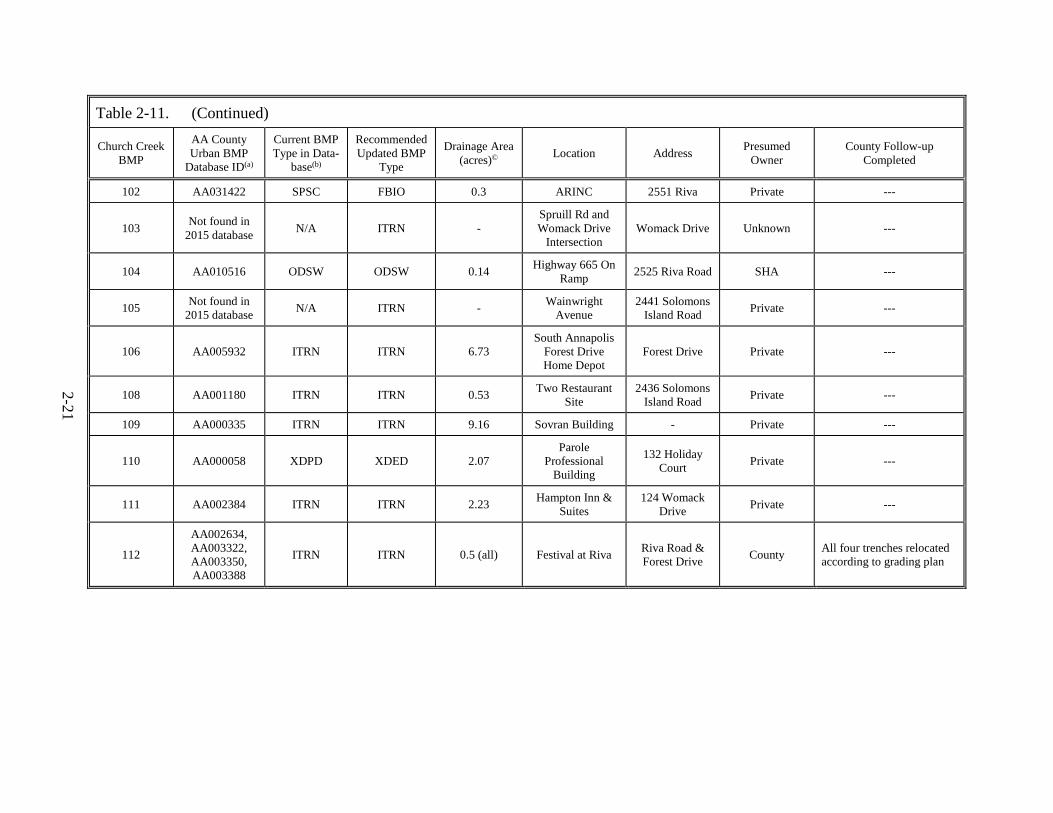
2.4.2 Church Creek Watershed BMP Inspections
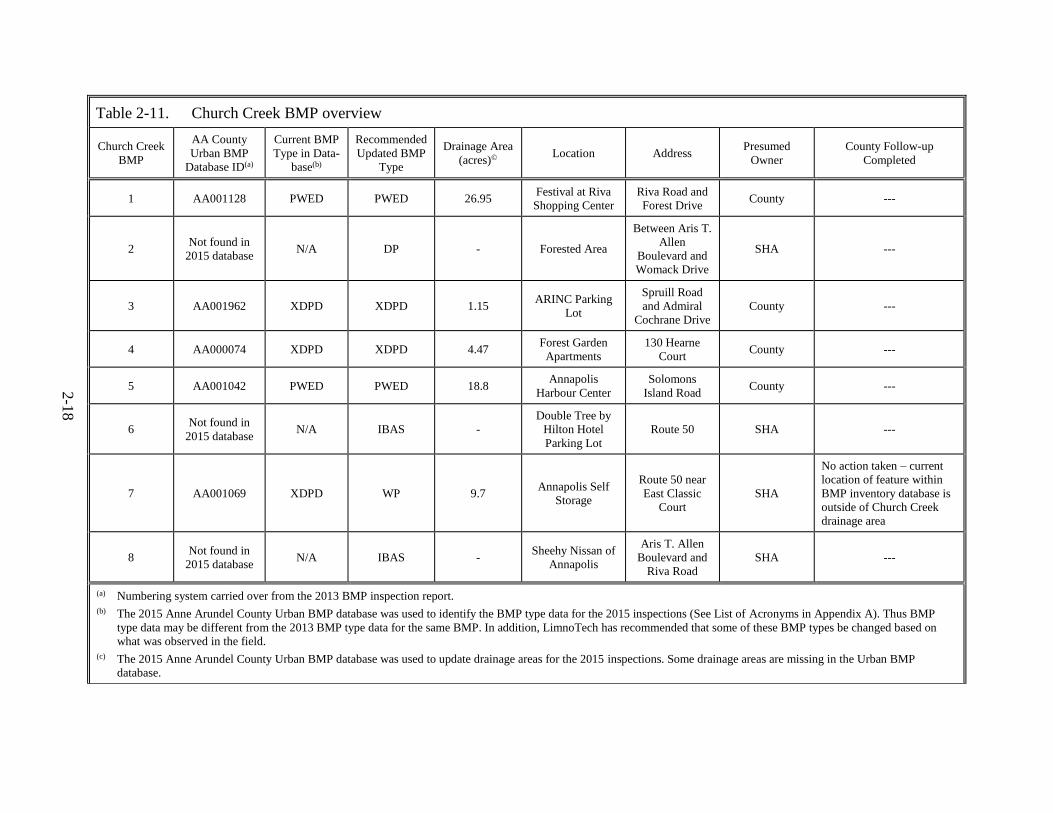
The Church Creek watershed contains 40 BMPs as shown in Figure 2-2 and Table 2-11.
Inspections were conducted on December 9 and 12, 2015 and January 13, 2016. Inspection and
maintenance information is currently being updated in the County’s BMP database. Inspection
reports are maintained at the County’s offices. Appendices H and I contain BMP codes and
acronyms.
2-1
8
Table 2-11. Church Creek BMP overview
Church Creek
BMP
AA County
Urban BMP
Database ID(a)
Current BMP
Type in Data-
base(b)
Recommended
Updated BMP
Type
Drainage Area
(acres)© Location Address
Presumed
Owner
County Follow-up
Completed
1 AA001128 PWED PWED 26.95 Festival at Riva
Shopping Center
Riva Road and
Forest Drive County ---
2 Not found in
2015 database N/A DP - Forested Area
Between Aris T.
Allen
Boulevard and
Womack Drive
SHA ---
3 AA001962 XDPD XDPD 1.15 ARINC Parking
Lot
Spruill Road
and Admiral
Cochrane Drive
County ---
4 AA000074 XDPD XDPD 4.47 Forest Garden
Apartments
130 Hearne
Court County ---
5 AA001042 PWED PWED 18.8 Annapolis
Harbour Center
Solomons
Island Road County ---
6 Not found in
2015 database N/A IBAS -
Double Tree by
Hilton Hotel
Parking Lot
Route 50 SHA ---
7 AA001069 XDPD WP 9.7 Annapolis Self
Storage
Route 50 near
East Classic
Court
SHA
No action taken – current
location of feature within
BMP inventory database is
outside of Church Creek
drainage area
8 Not found in
2015 database N/A IBAS -
Sheehy Nissan of
Annapolis
Aris T. Allen
Boulevard and
Riva Road
SHA ---
(a) Numbering system carried over from the 2013 BMP inspection report.
(b) The 2015 Anne Arundel County Urban BMP database was used to identify the BMP type data for the 2015 inspections (See List of Acronyms in Appendix A). Thus BMP
type data may be different from the 2013 BMP type data for the same BMP. In addition, LimnoTech has recommended that some of these BMP types be changed based on
what was observed in the field.
(c) The 2015 Anne Arundel County Urban BMP database was used to update drainage areas for the 2015 inspections. Some drainage areas are missing in the Urban BMP
database.
2-1
9
Table 2-11. (Continued)
Church Creek
BMP
AA County
Urban BMP
Database ID(a)
Current BMP
Type in Data-
base(b)
Recommended
Updated BMP
Type
Drainage Area
(acres)© Location Address
Presumed
Owner
County Follow-up
Completed
9 Not found in
2015 database N/A IBAS -
Double Tree by
Hilton Hotel
Parking Lot
Route 50 SHA ---
10 Not found in
2015 database N/A IBAS -
Double Tree by
Hilton Hotel
Parking Lot
Route 50 SHA ---
11 AA001446 PWED XDPD 1.13
Second National
Federal Savings
Bank
2045 West
Street
City of
Annapolis ---
12 AA012015 MSGW MSGW 1.94 AAA Mid
Atlantic Car Care
2054
Somerville
Road
County ---
13 AA012014 APRP APRP 0.03 AAA Mid
Atlantic Car Care
2054
Somerville
Road
County ---
14 AA012013 SPSC MMBR 0.26 AAA Mid
Atlantic Car Care
2054
Somerville
Road
County ---
15 AA012012 SPSC MMBR 0.21 AAA Mid
Atlantic Car Care
2054
Somerville
Road
County ---
16 AA000071 XDED XDED 3.71 Nationwide
Insurance
2453-2499 Riva
Road County ---
17 AA006493 ITRN ITRN 1.00 Annapolis Station 2431 Solomons
Island Road County
18 AA001872 ITRN ITRN - Two Restaurant
Sites
2436 Solomons
Island Road County
County removed feature
from its BMP dataset during
completion of the BMP
inspection report
2-2
0
Table 2-11. (Continued)
Church Creek
BMP
AA County
Urban BMP
Database ID(a)
Current BMP
Type in Data-
base(b)
Recommended
Updated BMP
Type
Drainage Area
(acres)© Location Address
Presumed
Owner
County Follow-up
Completed
19 Not found in
2015 database N/A DP - Capitol One Bank
2200
Somerville
Road
County
A AA008471 FSND FBIO 0.3 Annapolis Towne
Center at Parole
Towne Center
Boulevard County
Feature type corrected and
relocated according to
grading plan
B AA008472 XOGS XOGS 0.53 Annapolis Towne
Center at Parole
Towne Center
Boulevard County
Feature relocated according
to grading plan
C AA008475 FBIO FBIO 0.4 Annapolis Towne
Center at Parole
Towne Center
Boulevard County
Feature relocated according
to grading plan
D AA008473 SF/SFND XOGS 1.88 Annapolis Towne
Center at Parole
Towne Center
Boulevard County
Feature type corrected and
relocated according to
grading plan
E AA008474 SF/SFND XOGS 5.63 Annapolis Towne
Center at Parole
Towne Center
Boulevard County
Feature type corrected and
feature relocated according
to grading plan
F AA008470 FSND FSND 4.78 Annapolis Towne
Center at Parole
2398 Solomons
Island Road County
Feature relocated according
to grading plan
G Not found in
2015 database N/A FBIO -
Shoppers Food
Warehouse
2371 Solomons
Island Road County ---
H There is no BMP H, please refer to the 2012 BMP inspection report for further explanation
I Not found in
2015 database N/A FBIO
Shoppers Food
Warehouse
2371 Solomons
Island Road County ---
J Not found in
2015 database N/A FBIO
Shoppers Food
Warehouse
2371 Solomons
Island Road County ---
100 AA006819 NDRR NDRR 0.2 Holiday Inn
Express & Suites 2451 Riva Road Private ---
101 AA008115 IMPP IMPP - Annapolis Towne
Center
2348 Forest
Drive Private
Not found on grading plan,
BMP removed from dataset
2-2
1
Table 2-11. (Continued)
Church Creek
BMP
AA County
Urban BMP
Database ID(a)
Current BMP
Type in Data-
base(b)
Recommended
Updated BMP
Type
Drainage Area
(acres)© Location Address
Presumed
Owner
County Follow-up
Completed
102 AA031422 SPSC FBIO 0.3 ARINC 2551 Riva Private ---
103 Not found in
2015 database N/A ITRN -
Spruill Rd and
Womack Drive
Intersection
Womack Drive Unknown ---
104 AA010516 ODSW ODSW 0.14 Highway 665 On
Ramp 2525 Riva Road SHA ---
105 Not found in
2015 database N/A ITRN -
Wainwright
Avenue
2441 Solomons
Island Road Private ---
106 AA005932 ITRN ITRN 6.73
South Annapolis
Forest Drive
Home Depot
Forest Drive Private ---
108 AA001180 ITRN ITRN 0.53 Two Restaurant
Site
2436 Solomons
Island Road Private ---
109 AA000335 ITRN ITRN 9.16 Sovran Building - Private ---
110 AA000058 XDPD XDED 2.07
Parole
Professional
Building
132 Holiday
Court Private ---
111 AA002384 ITRN ITRN 2.23 Hampton Inn &
Suites
124 Womack
Drive Private ---
112
AA002634,
AA003322,
AA003350,
AA003388
ITRN ITRN 0.5 (all) Festival at Riva Riva Road &
Forest Drive County
All four trenches relocated
according to grading plan

2-2
2
Results
3-1
3 RESULTS
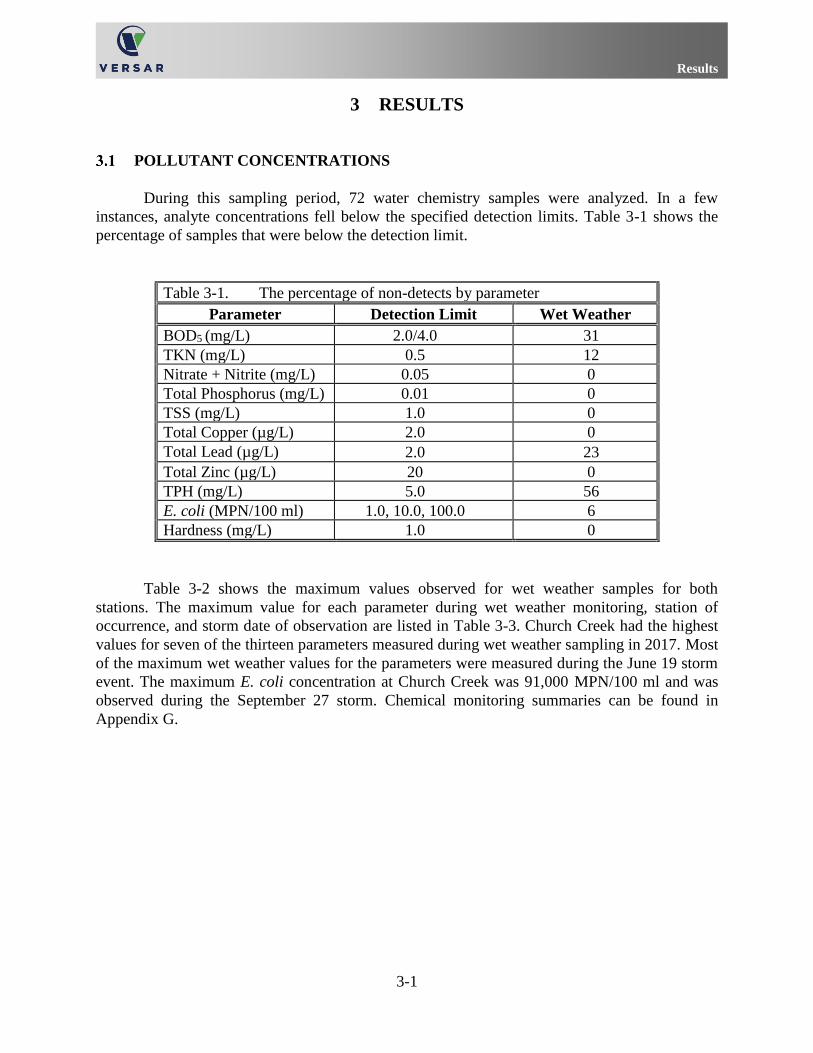
POLLUTANT CONCENTRATIONS
During this sampling period, 72 water chemistry samples were analyzed. In a few
instances, analyte concentrations fell below the specified detection limits. Table 3-1 shows the
percentage of samples that were below the detection limit.
Table 3-1. The percentage of non-detects by parameter
Parameter Detection Limit Wet Weather
BOD5 (mg/L) 2.0/4.0 31
TKN (mg/L) 0.5 12
Nitrate + Nitrite (mg/L) 0.05 0
Total Phosphorus (mg/L) 0.01 0
TSS (mg/L) 1.0 0
Total Copper (µg/L) 2.0 0
Total Lead (µg/L) 2.0 23
Total Zinc (µg/L) 20 0
TPH (mg/L) 5.0 56
E. coli (MPN/100 ml) 1.0, 10.0, 100.0 6
Hardness (mg/L) 1.0 0
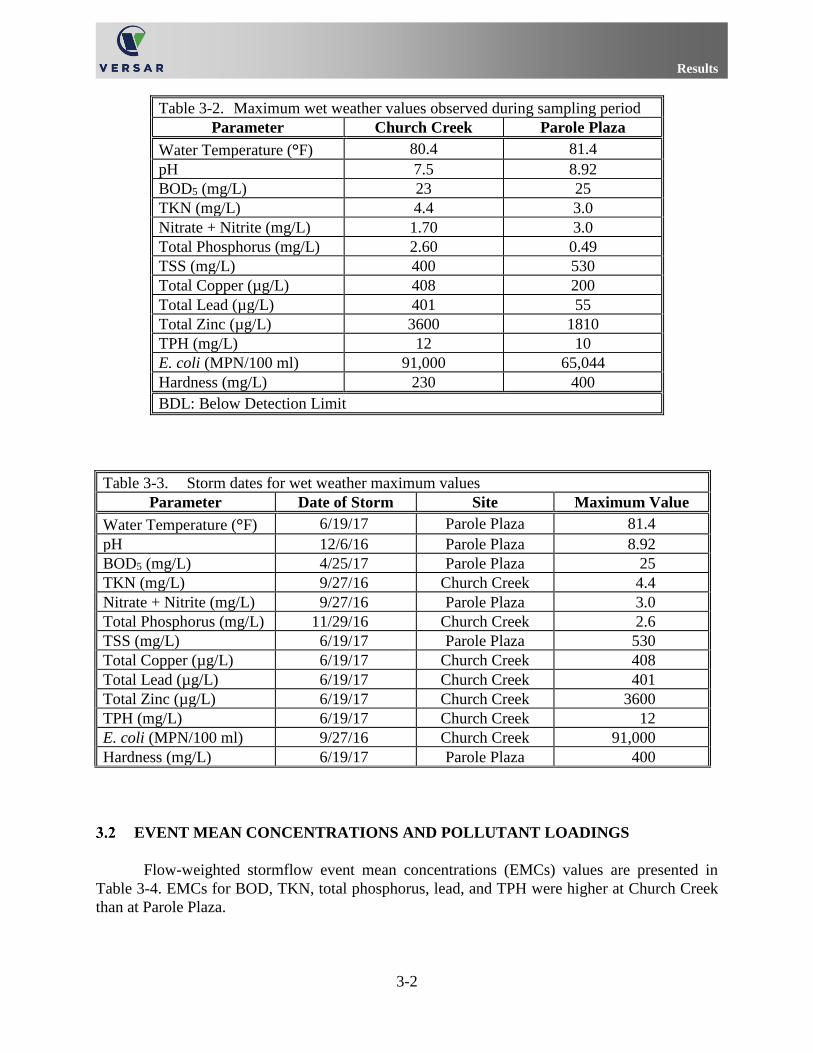
Table 3-2 shows the maximum values observed for wet weather samples for both
stations. The maximum value for each parameter during wet weather monitoring, station of
occurrence, and storm date of observation are listed in Table 3-3. Church Creek had the highest
values for seven of the thirteen parameters measured during wet weather sampling in 2017. Most
of the maximum wet weather values for the parameters were measured during the June 19 storm
event. The maximum E. coli concentration at Church Creek was 91,000 MPN/100 ml and was
observed during the September 27 storm. Chemical monitoring summaries can be found in
Appendix G.
Results
3-2
Table 3-2. Maximum wet weather values observed during sampling period
Parameter Church Creek Parole Plaza
Water Temperature (°F) 80.4 81.4
pH 7.5 8.92
BOD5 (mg/L) 23 25
TKN (mg/L) 4.4 3.0
Nitrate + Nitrite (mg/L) 1.70 3.0
Total Phosphorus (mg/L) 2.60 0.49
TSS (mg/L) 400 530
Total Copper (µg/L) 408 200
Total Lead (µg/L) 401 55
Total Zinc (µg/L) 3600 1810
TPH (mg/L) 12 10
E. coli (MPN/100 ml) 91,000 65,044
Hardness (mg/L) 230 400
BDL: Below Detection Limit
Table 3-3. Storm dates for wet weather maximum values
Parameter Date of Storm Site Maximum Value
Water Temperature (°F) 6/19/17 Parole Plaza 81.4
pH 12/6/16 Parole Plaza 8.92
BOD5 (mg/L) 4/25/17 Parole Plaza 25
TKN (mg/L) 9/27/16 Church Creek 4.4
Nitrate + Nitrite (mg/L) 9/27/16 Parole Plaza 3.0
Total Phosphorus (mg/L) 11/29/16 Church Creek 2.6
TSS (mg/L) 6/19/17 Parole Plaza 530
Total Copper (µg/L) 6/19/17 Church Creek 408
Total Lead (µg/L) 6/19/17 Church Creek 401
Total Zinc (µg/L) 6/19/17 Church Creek 3600
TPH (mg/L) 6/19/17 Church Creek 12
E. coli (MPN/100 ml) 9/27/16 Church Creek 91,000
Hardness (mg/L) 6/19/17 Parole Plaza 400
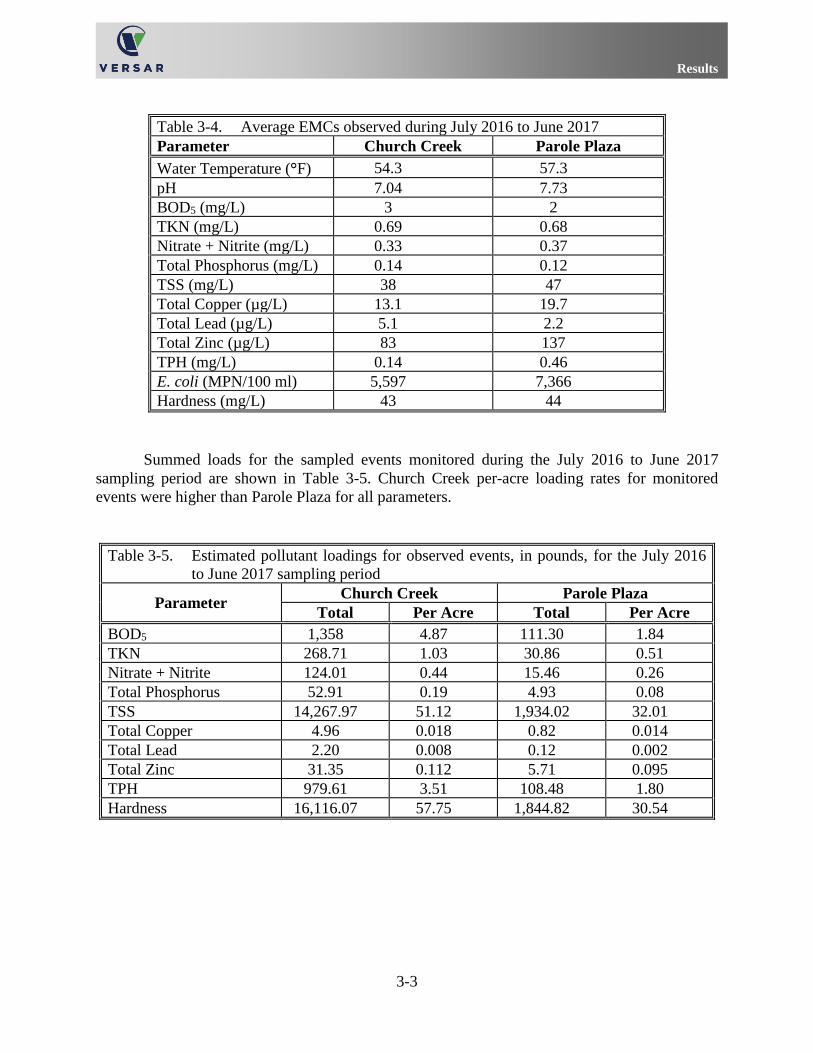
EVENT MEAN CONCENTRATIONS AND POLLUTANT LOADINGS
Flow-weighted stormflow event mean concentrations (EMCs) values are presented in
Table 3-4. EMCs for BOD, TKN, total phosphorus, lead, and TPH were higher at Church Creek
than at Parole Plaza.
Results
3-3
Table 3-4. Average EMCs observed during July 2016 to June 2017
Parameter Church Creek Parole Plaza
Water Temperature (°F) 54.3 57.3
pH 7.04 7.73
BOD5 (mg/L) 3 2
TKN (mg/L) 0.69 0.68
Nitrate + Nitrite (mg/L) 0.33 0.37
Total Phosphorus (mg/L) 0.14 0.12
TSS (mg/L) 38 47
Total Copper (µg/L) 13.1 19.7
Total Lead (µg/L) 5.1 2.2
Total Zinc (µg/L) 83 137
TPH (mg/L) 0.14 0.46
E. coli (MPN/100 ml) 5,597 7,366
Hardness (mg/L) 43 44
Summed loads for the sampled events monitored during the July 2016 to June 2017
sampling period are shown in Table 3-5. Church Creek per-acre loading rates for monitored
events were higher than Parole Plaza for all parameters.
Table 3-5. Estimated pollutant loadings for observed events, in pounds, for the July 2016
to June 2017 sampling period
Parameter Church Creek Parole Plaza
Total Per Acre Total Per Acre
BOD5 1,358 4.87 111.30 1.84
TKN 268.71 1.03 30.86 0.51
Nitrate + Nitrite 124.01 0.44 15.46 0.26
Total Phosphorus 52.91 0.19 4.93 0.08
TSS 14,267.97 51.12 1,934.02 32.01
Total Copper 4.96 0.018 0.82 0.014
Total Lead 2.20 0.008 0.12 0.002
Total Zinc 31.35 0.112 5.71 0.095
TPH 979.61 3.51 108.48 1.80
Hardness 16,116.07 57.75 1,844.82 30.54
Results
3-4
BIOLOGICAL ASSESSMENT
Biological and physical habitat assessments were completed on April 12 and 17, 2017.
Presented below are the summary results for each assessment site. For full bioassessment data
and results, refer to Appendix C. A complete taxonomic list can be found in Appendix B.
QA/QC information is in Appendix D. As introduced in Section 1, the South River Federation, in
cooperation with the County, undertook restoration of Church Creek in the vicinity of the
existing biological and physical monitoring sites beginning in late January, 2016. This work
consisted of 1,500 linear feet of stream restoration and implementation of step-pool storm
conveyance, riffle weirs, and grade control structures to improve habitat and increase floodplain
connectivity. All of the CC-04 and part of the CC-03 biological monitoring sites were within the
restored reach of stream.
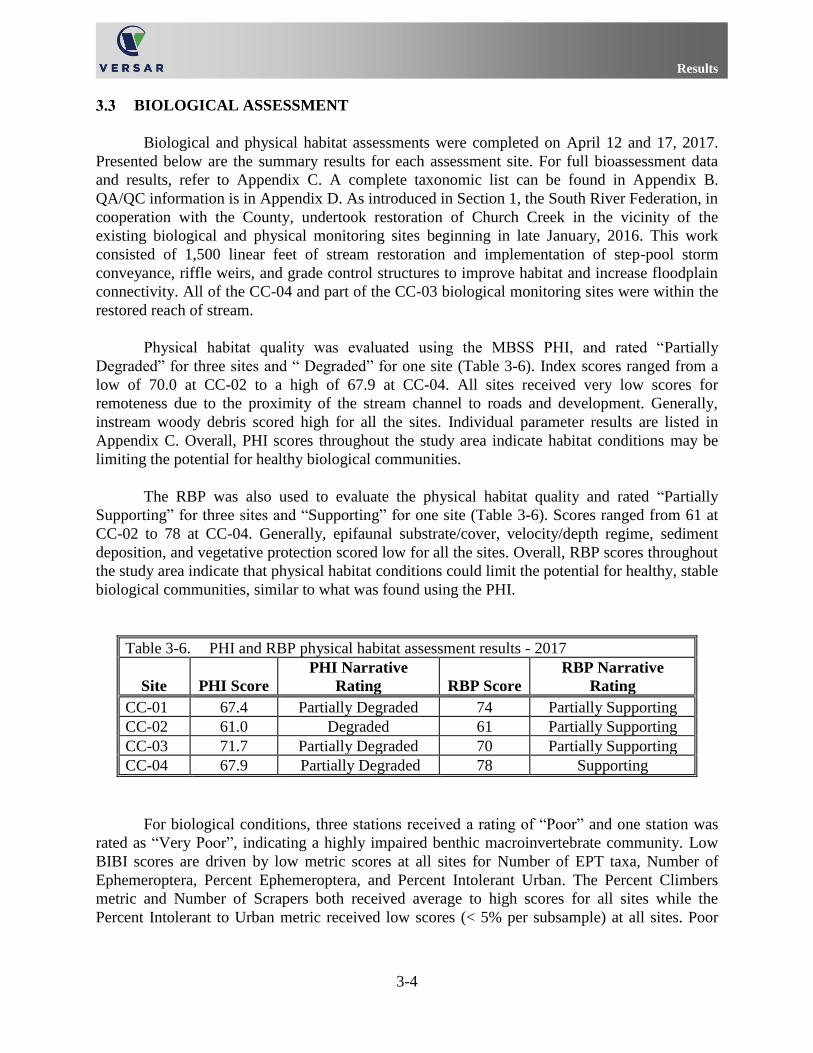
Physical habitat quality was evaluated using the MBSS PHI, and rated “Partially
Degraded” for three sites and “ Degraded” for one site (Table 3-6). Index scores ranged from a
low of 70.0 at CC-02 to a high of 67.9 at CC-04. All sites received very low scores for
remoteness due to the proximity of the stream channel to roads and development. Generally,
instream woody debris scored high for all the sites. Individual parameter results are listed in
Appendix C. Overall, PHI scores throughout the study area indicate habitat conditions may be
limiting the potential for healthy biological communities.
The RBP was also used to evaluate the physical habitat quality and rated “Partially
Supporting” for three sites and “Supporting” for one site (Table 3-6). Scores ranged from 61 at
CC-02 to 78 at CC-04. Generally, epifaunal substrate/cover, velocity/depth regime, sediment
deposition, and vegetative protection scored low for all the sites. Overall, RBP scores throughout
the study area indicate that physical habitat conditions could limit the potential for healthy, stable
biological communities, similar to what was found using the PHI.
Table 3-6. PHI and RBP physical habitat assessment results - 2017
Site PHI Score
PHI Narrative
Rating RBP Score
RBP Narrative
Rating
CC-01 67.4 Partially Degraded 74 Partially Supporting
CC-02 61.0 Degraded 61 Partially Supporting
CC-03 71.7 Partially Degraded 70 Partially Supporting
CC-04 67.9 Partially Degraded 78 Supporting
For biological conditions, three stations received a rating of “Poor” and one station was
rated as “Very Poor”, indicating a highly impaired benthic macroinvertebrate community. Low
BIBI scores are driven by low metric scores at all sites for Number of EPT taxa, Number of
Ephemeroptera, Percent Ephemeroptera, and Percent Intolerant Urban. The Percent Climbers
metric and Number of Scrapers both received average to high scores for all sites while the
Percent Intolerant to Urban metric received low scores (< 5% per subsample) at all sites. Poor
Results
3-5
habitat conditions and marginal water quality parameters may contribute to low BIBI scores at
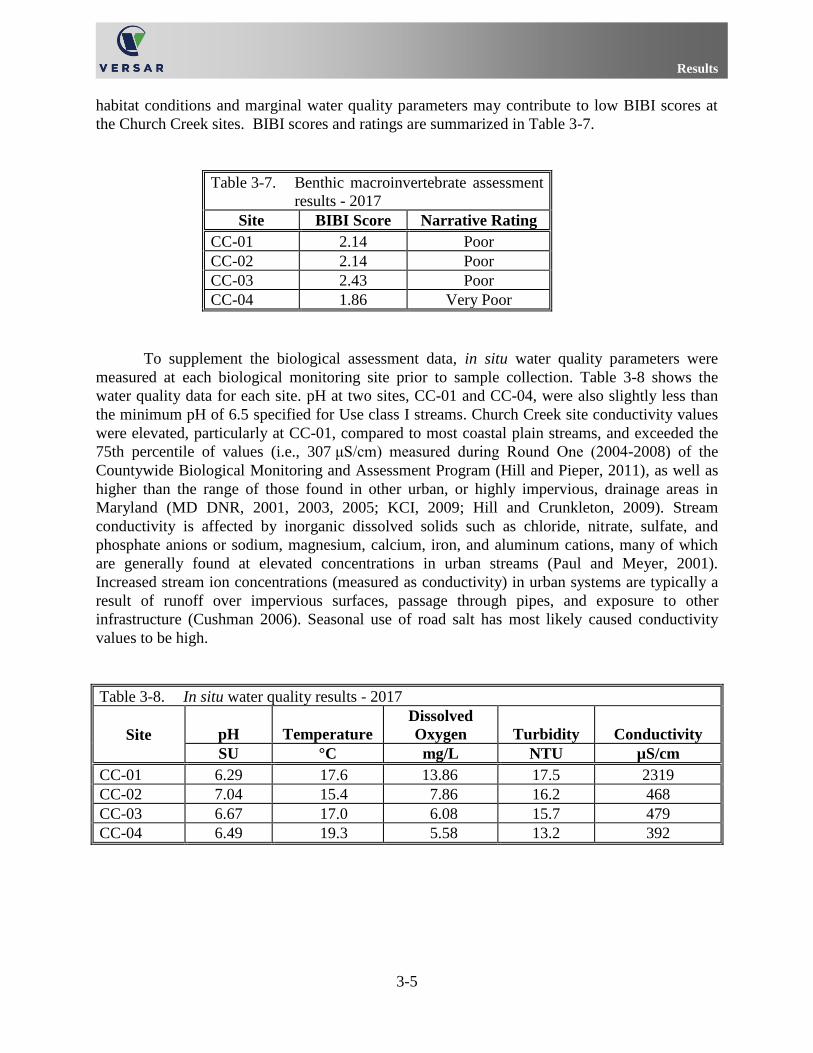
the Church Creek sites. BIBI scores and ratings are summarized in Table 3-7.
Table 3-7. Benthic macroinvertebrate assessment
results - 2017
Site BIBI Score Narrative Rating
CC-01 2.14 Poor
CC-02 2.14 Poor
CC-03 2.43 Poor
CC-04 1.86 Very Poor
To supplement the biological assessment data, in situ water quality parameters were
measured at each biological monitoring site prior to sample collection. Table 3-8 shows the
water quality data for each site. pH at two sites, CC-01 and CC-04, were also slightly less than
the minimum pH of 6.5 specified for Use class I streams. Church Creek site conductivity values
were elevated, particularly at CC-01, compared to most coastal plain streams, and exceeded the
75th percentile of values (i.e., 307 μS/cm) measured during Round One (2004-2008) of the
Countywide Biological Monitoring and Assessment Program (Hill and Pieper, 2011), as well as
higher than the range of those found in other urban, or highly impervious, drainage areas in
Maryland (MD DNR, 2001, 2003, 2005; KCI, 2009; Hill and Crunkleton, 2009). Stream
conductivity is affected by inorganic dissolved solids such as chloride, nitrate, sulfate, and
phosphate anions or sodium, magnesium, calcium, iron, and aluminum cations, many of which
are generally found at elevated concentrations in urban streams (Paul and Meyer, 2001).
Increased stream ion concentrations (measured as conductivity) in urban systems are typically a
result of runoff over impervious surfaces, passage through pipes, and exposure to other
infrastructure (Cushman 2006). Seasonal use of road salt has most likely caused conductivity
values to be high.
Table 3-8. In situ water quality results - 2017
Site pH Temperature
Dissolved
Oxygen Turbidity Conductivity
SU °C mg/L NTU µS/cm
CC-01 6.29 17.6 13.86 17.5 2319
CC-02 7.04 15.4 7.86 16.2 468
CC-03 6.67 17.0 6.08 15.7 479
CC-04 6.49 19.3 5.58 13.2 392
Results
3-6
GEOMORPHIC ASSESSMENT
Due to the highly altered conditions of the drainage area (i.e., high imperviousness,
altered flow regime, numerous stormwater outfalls) and stream channel (i.e., channelization,
stabilization) in the study area, reliable bankfull indicators were often difficult to locate in the
field. In the absence of reliable bankfull indicators, bankfull elevations were adjusted to match
the predicted values for bankfull area provided by the bankfull channel geometry relationship for
urban streams developed specifically for Anne Arundel County (AADPW 2002). Furthermore,
categorization of segments into the Rosgen Classification scheme for natural rivers required a
fair amount of professional judgment to interpret the data. When assigning the stream
classification types, values for some parameters would often fit into the prescribed ranges
according to the Rosgen Classification while others would not. Many of the features at the
existing cross-section locations have shifted from riffle features to pool features, which can skew
the channel dimensions since classifications are based on riffle dimensions. Consequently, it was
often necessary to apply best professional judgment and incorporate supplemental information
(e.g., presence of depositional features) in order to assign the most appropriate stream
classifications. The Rosgen classification system is summarized in Appendix E and 2017 data
for Church Creek sites are in Appendix F. Also noteworthy, prior to the 2016 geomorphic
survey, stream restoration occurred downstream of XS-4, on an unnamed tributary, and upstream
of XS-5 on the mainstem Church Creek in the vicinity of the Annapolis Harbor Center. Thus,
longitudinal profile length has shortened between the 2015 and 2016 surveying as a result of the
stream restoration construction and channel reengineering. The 2017 geomorphic survey gives a
first look at any changes a year after the restoration was completed between XS-4 and XS-5.
The most upstream reach on the Parole Plaza Tributary, XS-1, has been undergoing a
transition from a Rosgen C4/5 channel to a F4 channel, as evidenced by changes in the width/
depth and entrenchment ratios. Previous monitoring in 2010 suggested that this reach was
shifting from an E to a C channel as evidenced by channel degradation along the right bank and a
notable increase in sediment deposition and point bar formation along the right bank just
downstream. Additional degradation between 2010 and 2012 suggest that the channel had lost
connectivity to the floodplain and had likely shifted to an F stream type. Mid-channel
degradation continued between 2014 and 2017 showing approximately a 0.8 feet difference. In
2017, geomorphic assessment parameters continue to support the classification of this reach as
an F4 channel. The channel evolution is supported by a 61.3% increase in channel cross-
sectional area since 2003 and considerable widening and mid-channel bar formation immediately
downstream, which is indicative of a channel that it not stable and is undergoing a widening and
degradation phase. From 2014 to 2017, the cross-sectional area continues a steady increase. Left
bank widening was also apparent between 2013 and 2014 monitoring years and remained
consistent during 2015 and through 2017. However, it is also important to acknowledge that this
cross-section is no longer located in a riffle feature and is now in a pool feature, which affects
the channel dimensions and complicates classification using the Rosgen system.
The next site downstream on the Parole Plaza Tributary, XS-2, was classified as a Rosgen
G4c channel based on its continued low width/depth ratio, low slope, and gravel substrate. From
2016 to the 2017 survey, the substrate size decreased slightly. Since 2012 its entrenchment ratio
Results
3-7
was slightly higher than those typical of G streams, but in 2017 the ratio of entrenchment was
shown to decrease. This reach was previously classified as an E type channel; however, it was
noted that the reach was actively degrading and widening. While E streams are typically more
sinuous, this segment has been noticeably straightened and stabilized by a retaining wall and
rubble/fill along the left bank (facing downstream). The lack of sinuosity in the channel has
likely resulted in instability, and consequently resulted in a shift to a less-stable form.
Site XS-3, located along the restored segment of Parole Plaza Tributary, was not classi-
fied until 2013, after allowing 3 years of stabilization after restoration. In 2013 and 2014 it was
classified as a Rosgen G4c channel based on its low entrenchment ratio, low width/depth ratio,
and low slope. In 2015 XS-3 remained a G type channel; however, the substrate had become
coarser resulting in a G4/3c classification. Variable coarseness caused XS-3 to return to a G4c
during the 2016 survey and it has maintained that classification in 2017. Before restoration, this
cross-section was classified as a Rosgen G5c channel; however, since the Rosgen scheme was
developed to classify natural channels, or those that are shaped naturally by fluvial processes, it
was deemed inappropriate to classify immediately after construction. This section is still heavily
armored and reliable bankfull indicators are not easily identified. Not much change has been
documented at XS-3 but during the 2017 survey the right bank has begun to erode behind the
armored bank.
The most downstream site on the Parole Plaza Tributary, XS-4, has transitioned from a
Rosgen E5 channel to a C5/4 back to an E5/4 channel and now an E4/5 channel due to increased
substrate size and fluctuations in width/depth ratio. A large woody debris jam located just
downstream of the cross-section location has resulted in a considerable accumulation of fine
sediment and debris across the channel and, consequently, has led to aggradation and a reduction
in the cross-sectional area up until 2016. In 2016, before the cross-section survey was performed,
restoration on the reach began and was completed just downstream of XS-4. Construction
activities included the removal of the woody debris jam. A year after the construction it is likely
the fine sediment that was behind the debris jam has cleared resulting in the increase substrate
size. Between 2011 and 2015 cross-sectional area has consistently been lower than baseline
monitoring in 2003. Restoration in 2016 has caused cross-sectional area to increase by 9.8%
from 2003 monitoring. Subsequently, in 2017 the cross-sectional area decreased from 2016 by
15.3% and has decreased by 7.0 % since the 2003 monitoring.
Located on the mainstem of Church Creek, upstream of the MD Rt. 2 culvert, XS-5 has
transformed from a Rosgen C3/5 channel into a F4 channel due to a significantly decreased
entrenchment ratio from 4.0 to 1.7 between 2012 and 2017. Between 2015 and 2016 this portion
of the reach has become slightly less coarse from a D50 of 61 mm to 24 mm. In 2017, this reach
maintained the same D50 particle size. This segment shows evidence of previous alteration in the
form of cobble-sized riprap armoring along the bed and lower banks to protect a sewer line
crossing and obvious channel straightening, which explains the lack of sinuosity typical of F type
streams. The substantial amount of cobble-sized rip-rap in the stream channel has resulted in a
bi-modal distribution of substrate particles within this reach, with a predominance of gravel in
the pools and artificial cobbles in the riffles. In 2017, the cross-sectional area and the
width/depth ratio decreased slightly.

Results
3-8
Discussion
4-1
4 DISCUSSION
Results from the July 2016-June 2017 study period are discussed in the following section.
Water quality, biological, and geomorphological data are interpreted, presented and compared to
previous data. A discussion of the characteristics of the watershed is also included.
WATER CHEMISTRY
Water quality criteria are presented in Table 4-1. The measured data are compared, where
possible, to these criteria to assess the extent of the pollution in this tributary.
Table 4-1. State and Federal water quality criteria available for parameters sampled at
Church Creek
Parameter
(mg/L, except as noted) Chronic Acute Reference
Lead (µg/L) 2.5 65 COMAR 26.08.02.03-2
Copper (µg/L) 9 13 COMAR 26.08.02.03-2
Zinc (µg/L) 120 120 COMAR 26.08.02.03-2
Total P 0.0225 USEPA 2000
BOD5 7 USEPA 1986
Nitrate + Nitrite 0.095 USEPA 2000
TSS 500 USEPA 1974
TKN None
TPH None
E. coli* (MPN/100ml) 235 COMAR 26.08.02.03-3.
Hardness None
* Used most restrictive standard for E. coli as a conservative approach: frequent full body
contact recreation criterion.
Criteria are used to protect against both short-term and long-term effects. Numeric
criteria are important where the cause of toxicity is known or for protection against pollutants
with potential human health impacts or bioaccumulation potential. Narrative criteria can be the
basis for limiting toxicity in discharges where a specific pollutant can be identified as
contributing to the toxicity. Biological criteria can be used to complement traditional, chemical-
specific criteria as indicators of aquatic health and impacts to the aquatic ecosystem.
Table 4-2 compares storm event results to the Federal and State acute criteria.
Comparison and interpretation of Church Creek pollutant concentrations to Federal and State
water quality criteria, and relating these conditions to ultimate ecological outcomes in the
system, however, are difficult. Criteria do not exist for all parameters measured at the
monitoring stations. In addition, a clear cause and effect relationship between water quality and
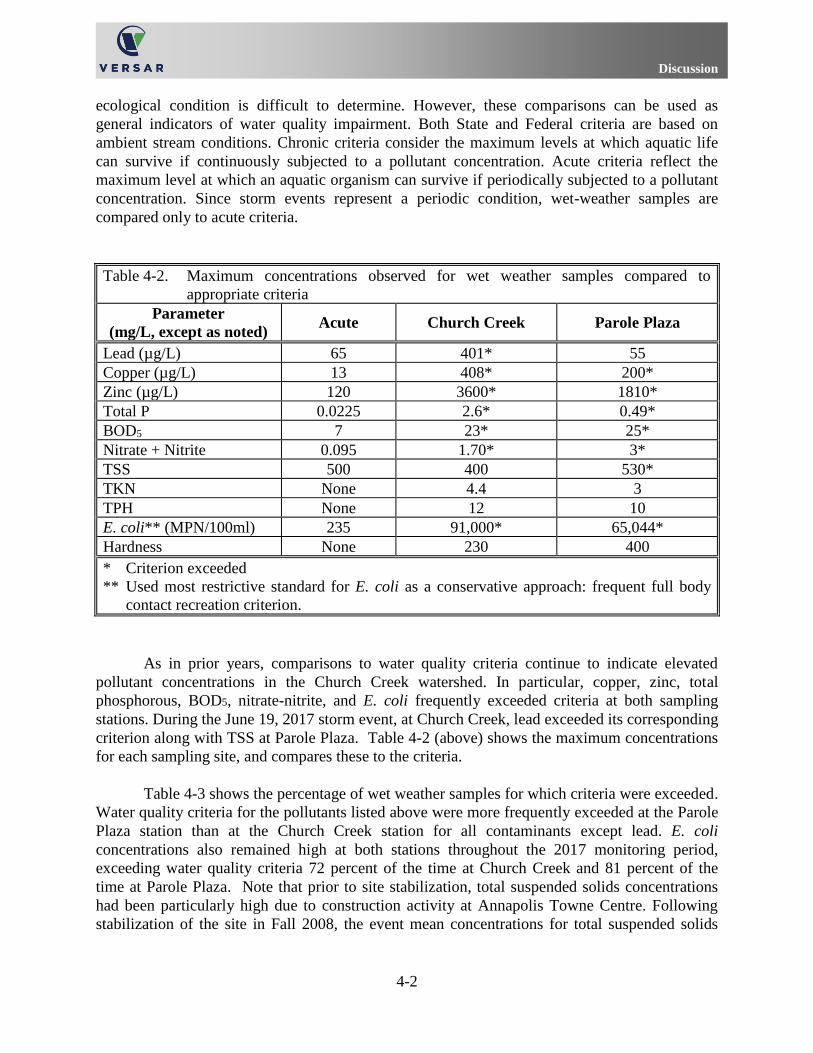
Discussion
4-2
ecological condition is difficult to determine. However, these comparisons can be used as
general indicators of water quality impairment. Both State and Federal criteria are based on
ambient stream conditions. Chronic criteria consider the maximum levels at which aquatic life
can survive if continuously subjected to a pollutant concentration. Acute criteria reflect the
maximum level at which an aquatic organism can survive if periodically subjected to a pollutant
concentration. Since storm events represent a periodic condition, wet-weather samples are
compared only to acute criteria.
Table 4-2. Maximum concentrations observed for wet weather samples compared to
appropriate criteria
Parameter
(mg/L, except as noted) Acute Church Creek Parole Plaza
Lead (µg/L) 65 401* 55
Copper (µg/L) 13 408* 200*
Zinc (µg/L) 120 3600* 1810*
Total P 0.0225 2.6* 0.49*
BOD5 7 23* 25*
Nitrate + Nitrite 0.095 1.70* 3*
TSS 500 400 530*
TKN None 4.4 3
TPH None 12 10
E. coli** (MPN/100ml) 235 91,000* 65,044*
Hardness None 230 400
* Criterion exceeded
** Used most restrictive standard for E. coli as a conservative approach: frequent full body
contact recreation criterion.
As in prior years, comparisons to water quality criteria continue to indicate elevated
pollutant concentrations in the Church Creek watershed. In particular, copper, zinc, total
phosphorous, BOD5, nitrate-nitrite, and E. coli frequently exceeded criteria at both sampling
stations. During the June 19, 2017 storm event, at Church Creek, lead exceeded its corresponding
criterion along with TSS at Parole Plaza. Table 4-2 (above) shows the maximum concentrations
for each sampling site, and compares these to the criteria.
Table 4-3 shows the percentage of wet weather samples for which criteria were exceeded.
Water quality criteria for the pollutants listed above were more frequently exceeded at the Parole
Plaza station than at the Church Creek station for all contaminants except lead. E. coli
concentrations also remained high at both stations throughout the 2017 monitoring period,
exceeding water quality criteria 72 percent of the time at Church Creek and 81 percent of the
time at Parole Plaza. Note that prior to site stabilization, total suspended solids concentrations
had been particularly high due to construction activity at Annapolis Towne Centre. Following
stabilization of the site in Fall 2008, the event mean concentrations for total suspended solids
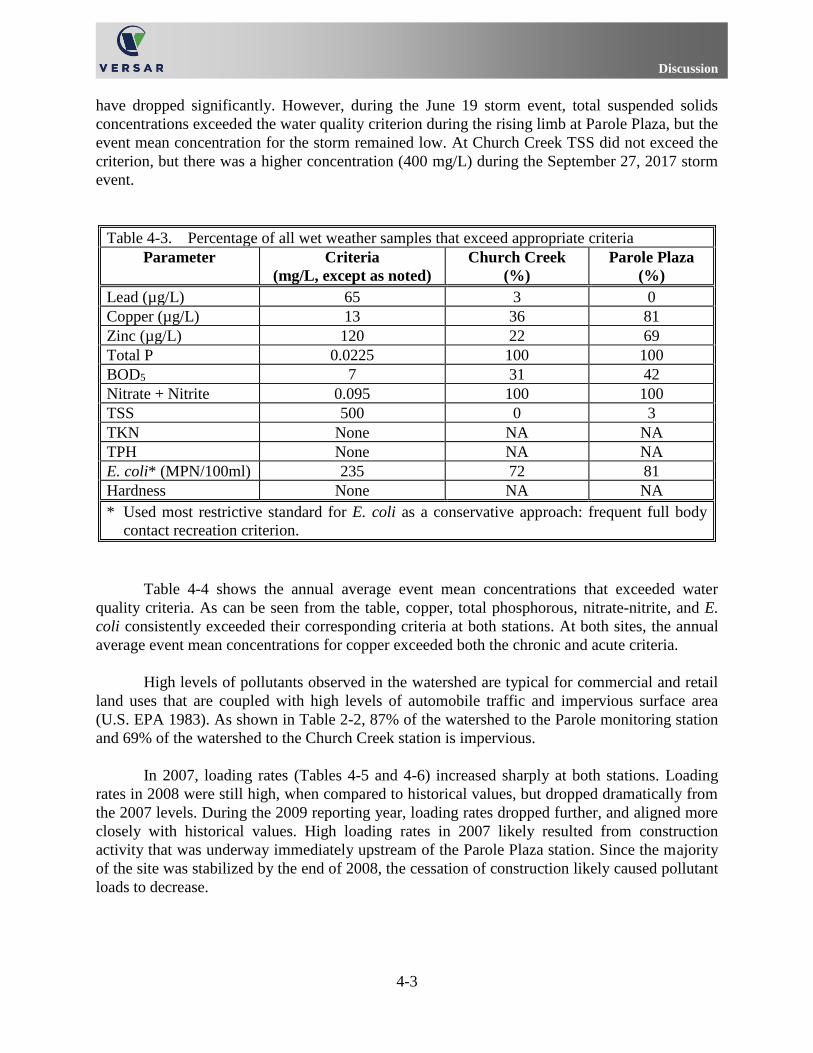
Discussion
4-3
have dropped significantly. However, during the June 19 storm event, total suspended solids
concentrations exceeded the water quality criterion during the rising limb at Parole Plaza, but the
event mean concentration for the storm remained low. At Church Creek TSS did not exceed the
criterion, but there was a higher concentration (400 mg/L) during the September 27, 2017 storm
event.
Table 4-3. Percentage of all wet weather samples that exceed appropriate criteria
Parameter
Criteria
(mg/L, except as noted)
Church Creek
(%)
Parole Plaza
(%)
Lead (µg/L) 65 3 0
Copper (µg/L) 13 36 81
Zinc (µg/L) 120 22 69
Total P 0.0225 100 100
BOD5 7 31 42
Nitrate + Nitrite 0.095 100 100
TSS 500 0 3
TKN None NA NA
TPH None NA NA
E. coli* (MPN/100ml) 235 72 81
Hardness None NA NA
* Used most restrictive standard for E. coli as a conservative approach: frequent full body
contact recreation criterion.
Table 4-4 shows the annual average event mean concentrations that exceeded water
quality criteria. As can be seen from the table, copper, total phosphorous, nitrate-nitrite, and E.
coli consistently exceeded their corresponding criteria at both stations. At both sites, the annual
average event mean concentrations for copper exceeded both the chronic and acute criteria.
High levels of pollutants observed in the watershed are typical for commercial and retail
land uses that are coupled with high levels of automobile traffic and impervious surface area
(U.S. EPA 1983). As shown in Table 2-2, 87% of the watershed to the Parole monitoring station
and 69% of the watershed to the Church Creek station is impervious.
In 2007, loading rates (Tables 4-5 and 4-6) increased sharply at both stations. Loading
rates in 2008 were still high, when compared to historical values, but dropped dramatically from
the 2007 levels. During the 2009 reporting year, loading rates dropped further, and aligned more
closely with historical values. High loading rates in 2007 likely resulted from construction
activity that was underway immediately upstream of the Parole Plaza station. Since the majority
of the site was stabilized by the end of 2008, the cessation of construction likely caused pollutant
loads to decrease.
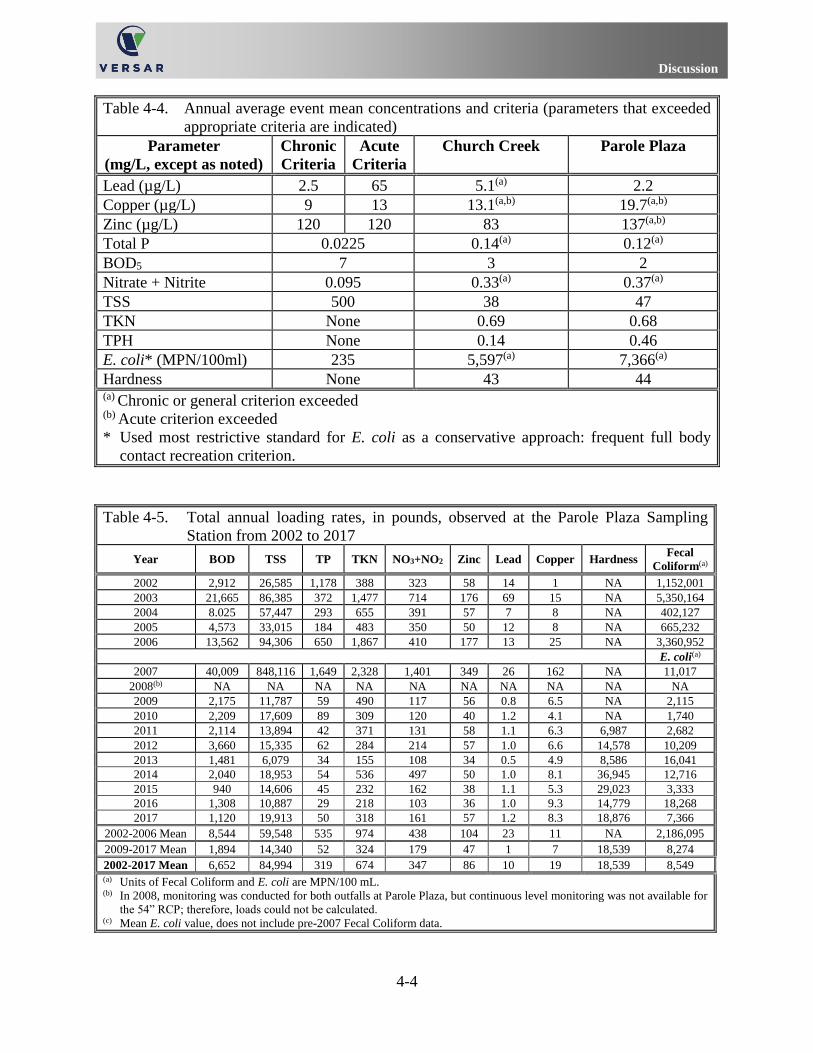
Discussion
4-4
Table 4-4. Annual average event mean concentrations and criteria (parameters that exceeded
appropriate criteria are indicated)
Parameter
(mg/L, except as noted)
Chronic
Criteria
Acute
Criteria
Church Creek Parole Plaza
Lead (µg/L) 2.5 65 5.1(a) 2.2
Copper (µg/L) 9 13 13.1(a,b) 19.7(a,b)
Zinc (µg/L) 120 120 83 137(a,b)
Total P 0.0225 0.14(a) 0.12(a)
BOD5 7 3 2
Nitrate + Nitrite 0.095 0.33(a) 0.37(a)
TSS 500 38 47
TKN None 0.69 0.68
TPH None 0.14 0.46
E. coli* (MPN/100ml) 235 5,597(a) 7,366(a)
Hardness None 43 44 (a) Chronic or general criterion exceeded
(b) Acute criterion exceeded
* Used most restrictive standard for E. coli as a conservative approach: frequent full body
contact recreation criterion.
Table 4-5. Total annual loading rates, in pounds, observed at the Parole Plaza Sampling
Station from 2002 to 2017
Year BOD TSS TP TKN NO3+NO2 Zinc Lead Copper Hardness Fecal
Coliform(a)
2002 2,912 26,585 1,178 388 323 58 14 1 NA 1,152,001
2003 21,665 86,385 372 1,477 714 176 69 15 NA 5,350,164
2004 8.025 57,447 293 655 391 57 7 8 NA 402,127
2005 4,573 33,015 184 483 350 50 12 8 NA 665,232
2006 13,562 94,306 650 1,867 410 177 13 25 NA 3,360,952
E. coli(a)
2007 40,009 848,116 1,649 2,328 1,401 349 26 162 NA 11,017
2008(b) NA NA NA NA NA NA NA NA NA NA
2009 2,175 11,787 59 490 117 56 0.8 6.5 NA 2,115
2010 2,209 17,609 89 309 120 40 1.2 4.1 NA 1,740
2011 2,114 13,894 42 371 131 58 1.1 6.3 6,987 2,682
2012 3,660 15,335 62 284 214 57 1.0 6.6 14,578 10,209
2013 1,481 6,079 34 155 108 34 0.5 4.9 8,586 16,041
2014 2,040 18,953 54 536 497 50 1.0 8.1 36,945 12,716
2015 940 14,606 45 232 162 38 1.1 5.3 29,023 3,333
2016 1,308 10,887 29 218 103 36 1.0 9.3 14,779 18,268
2017 1,120 19,913 50 318 161 57 1.2 8.3 18,876 7,366
2002-2006 Mean 8,544 59,548 535 974 438 104 23 11 NA 2,186,095
2009-2017 Mean 1,894 14,340 52 324 179 47 1 7 18,539 8,274
2002-2017 Mean 6,652 84,994 319 674 347 86 10 19 18,539 8,549 (a) Units of Fecal Coliform and E. coli are MPN/100 mL. (b) In 2008, monitoring was conducted for both outfalls at Parole Plaza, but continuous level monitoring was not available for
the 54” RCP; therefore, loads could not be calculated. (c) Mean E. coli value, does not include pre-2007 Fecal Coliform data.
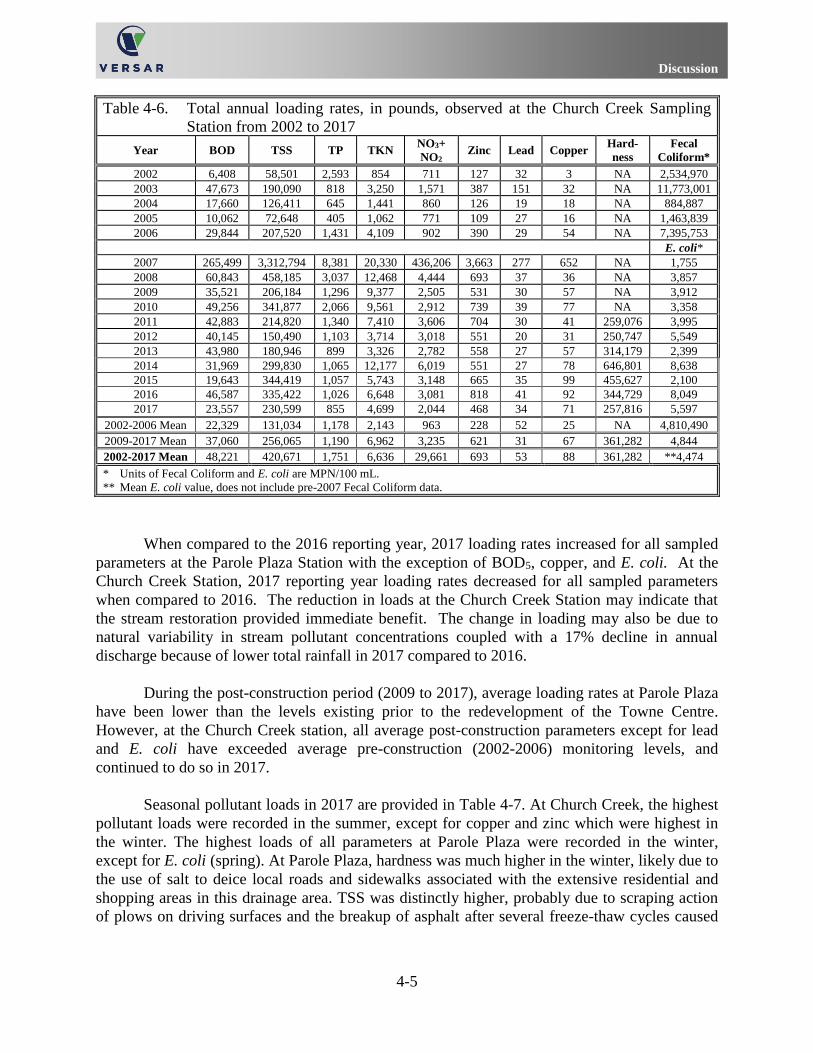
Discussion
4-5
Table 4-6. Total annual loading rates, in pounds, observed at the Church Creek Sampling
Station from 2002 to 2017
Year BOD TSS TP TKN NO3+
NO2 Zinc Lead Copper
Hard-
ness
Fecal
Coliform*
2002 6,408 58,501 2,593 854 711 127 32 3 NA 2,534,970
2003 47,673 190,090 818 3,250 1,571 387 151 32 NA 11,773,001
2004 17,660 126,411 645 1,441 860 126 19 18 NA 884,887
2005 10,062 72,648 405 1,062 771 109 27 16 NA 1,463,839
2006 29,844 207,520 1,431 4,109 902 390 29 54 NA 7,395,753
E. coli*
2007 265,499 3,312,794 8,381 20,330 436,206 3,663 277 652 NA 1,755
2008 60,843 458,185 3,037 12,468 4,444 693 37 36 NA 3,857
2009 35,521 206,184 1,296 9,377 2,505 531 30 57 NA 3,912
2010 49,256 341,877 2,066 9,561 2,912 739 39 77 NA 3,358
2011 42,883 214,820 1,340 7,410 3,606 704 30 41 259,076 3,995
2012 40,145 150,490 1,103 3,714 3,018 551 20 31 250,747 5,549
2013 43,980 180,946 899 3,326 2,782 558 27 57 314,179 2,399
2014 31,969 299,830 1,065 12,177 6,019 551 27 78 646,801 8,638
2015 19,643 344,419 1,057 5,743 3,148 665 35 99 455,627 2,100
2016 46,587 335,422 1,026 6,648 3,081 818 41 92 344,729 8,049
2017 23,557 230,599 855 4,699 2,044 468 34 71 257,816 5,597
2002-2006 Mean 22,329 131,034 1,178 2,143 963 228 52 25 NA 4,810,490
2009-2017 Mean 37,060 256,065 1,190 6,962 3,235 621 31 67 361,282 4,844
2002-2017 Mean 48,221 420,671 1,751 6,636 29,661 693 53 88 361,282 **4,474
* Units of Fecal Coliform and E. coli are MPN/100 mL.
** Mean E. coli value, does not include pre-2007 Fecal Coliform data.
When compared to the 2016 reporting year, 2017 loading rates increased for all sampled
parameters at the Parole Plaza Station with the exception of BOD5, copper, and E. coli. At the
Church Creek Station, 2017 reporting year loading rates decreased for all sampled parameters
when compared to 2016. The reduction in loads at the Church Creek Station may indicate that
the stream restoration provided immediate benefit. The change in loading may also be due to
natural variability in stream pollutant concentrations coupled with a 17% decline in annual
discharge because of lower total rainfall in 2017 compared to 2016.
During the post-construction period (2009 to 2017), average loading rates at Parole Plaza
have been lower than the levels existing prior to the redevelopment of the Towne Centre.
However, at the Church Creek station, all average post-construction parameters except for lead
and E. coli have exceeded average pre-construction (2002-2006) monitoring levels, and
continued to do so in 2017.
Seasonal pollutant loads in 2017 are provided in Table 4-7. At Church Creek, the highest
pollutant loads were recorded in the summer, except for copper and zinc which were highest in
the winter. The highest loads of all parameters at Parole Plaza were recorded in the winter,
except for E. coli (spring). At Parole Plaza, hardness was much higher in the winter, likely due to
the use of salt to deice local roads and sidewalks associated with the extensive residential and
shopping areas in this drainage area. TSS was distinctly higher, probably due to scraping action
of plows on driving surfaces and the breakup of asphalt after several freeze-thaw cycles caused
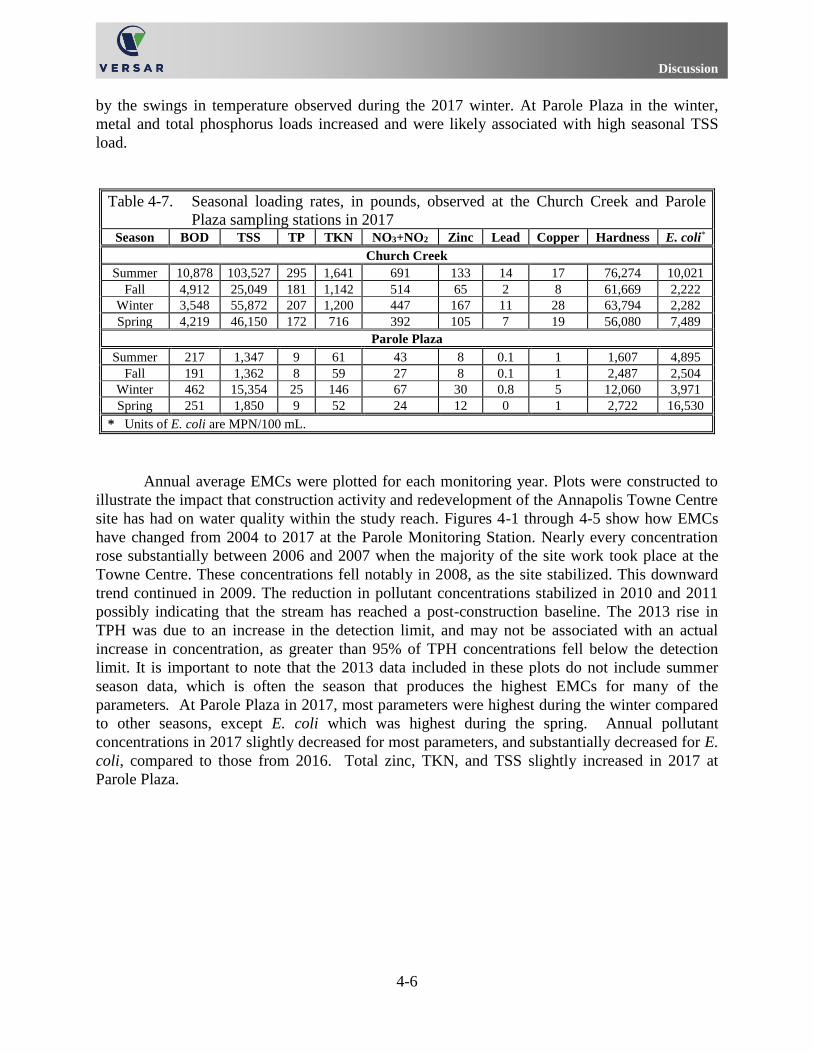
Discussion
4-6
by the swings in temperature observed during the 2017 winter. At Parole Plaza in the winter,
metal and total phosphorus loads increased and were likely associated with high seasonal TSS
load.
Table 4-7. Seasonal loading rates, in pounds, observed at the Church Creek and Parole
Plaza sampling stations in 2017 Season BOD TSS TP TKN NO3+NO2 Zinc Lead Copper Hardness E. coli*
Church Creek
Summer 10,878 103,527 295 1,641 691 133 14 17 76,274 10,021
Fall 4,912 25,049 181 1,142 514 65 2 8 61,669 2,222
Winter 3,548 55,872 207 1,200 447 167 11 28 63,794 2,282
Spring 4,219 46,150 172 716 392 105 7 19 56,080 7,489
Parole Plaza
Summer 217 1,347 9 61 43 8 0.1 1 1,607 4,895
Fall 191 1,362 8 59 27 8 0.1 1 2,487 2,504
Winter 462 15,354 25 146 67 30 0.8 5 12,060 3,971
Spring 251 1,850 9 52 24 12 0 1 2,722 16,530
* Units of E. coli are MPN/100 mL.
Annual average EMCs were plotted for each monitoring year. Plots were constructed to
illustrate the impact that construction activity and redevelopment of the Annapolis Towne Centre
site has had on water quality within the study reach. Figures 4-1 through 4-5 show how EMCs
have changed from 2004 to 2017 at the Parole Monitoring Station. Nearly every concentration
rose substantially between 2006 and 2007 when the majority of the site work took place at the
Towne Centre. These concentrations fell notably in 2008, as the site stabilized. This downward
trend continued in 2009. The reduction in pollutant concentrations stabilized in 2010 and 2011
possibly indicating that the stream has reached a post-construction baseline. The 2013 rise in
TPH was due to an increase in the detection limit, and may not be associated with an actual
increase in concentration, as greater than 95% of TPH concentrations fell below the detection
limit. It is important to note that the 2013 data included in these plots do not include summer
season data, which is often the season that produces the highest EMCs for many of the
parameters. At Parole Plaza in 2017, most parameters were highest during the winter compared
to other seasons, except E. coli which was highest during the spring. Annual pollutant
concentrations in 2017 slightly decreased for most parameters, and substantially decreased for E.
coli, compared to those from 2016. Total zinc, TKN, and TSS slightly increased in 2017 at
Parole Plaza.
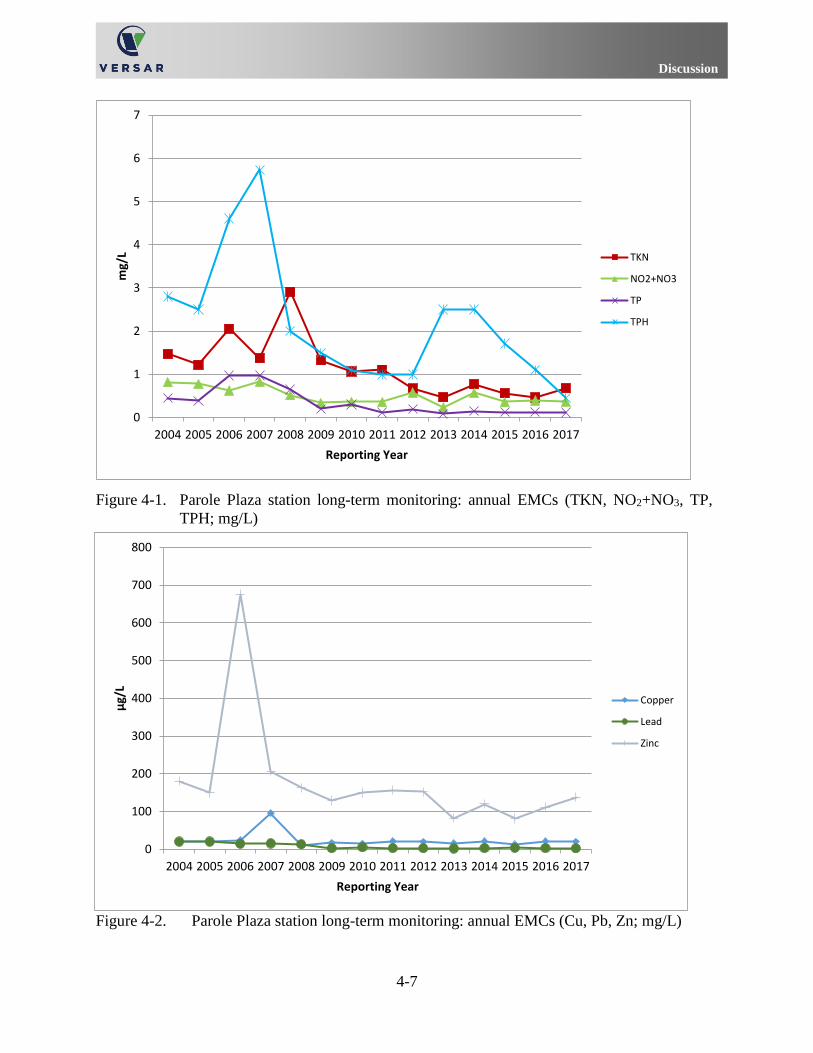
Discussion
4-7
Figure 4-1. Parole Plaza station long-term monitoring: annual EMCs (TKN, NO2+NO3, TP,
TPH; mg/L)
Figure 4-2. Parole Plaza station long-term monitoring: annual EMCs (Cu, Pb, Zn; mg/L)
0
1
2
3
4
5
6
7
2004 2005 2006 2007 2008 2009 2010 2011 2012 2013 2014 2015 2016 2017
mg/
L
Reporting Year
TKN
NO2+NO3
TP
TPH
0
100
200
300
400
500
600
700
800
2004 2005 2006 2007 2008 2009 2010 2011 2012 2013 2014 2015 2016 2017
µg/
L
Reporting Year
Copper
Lead
Zinc
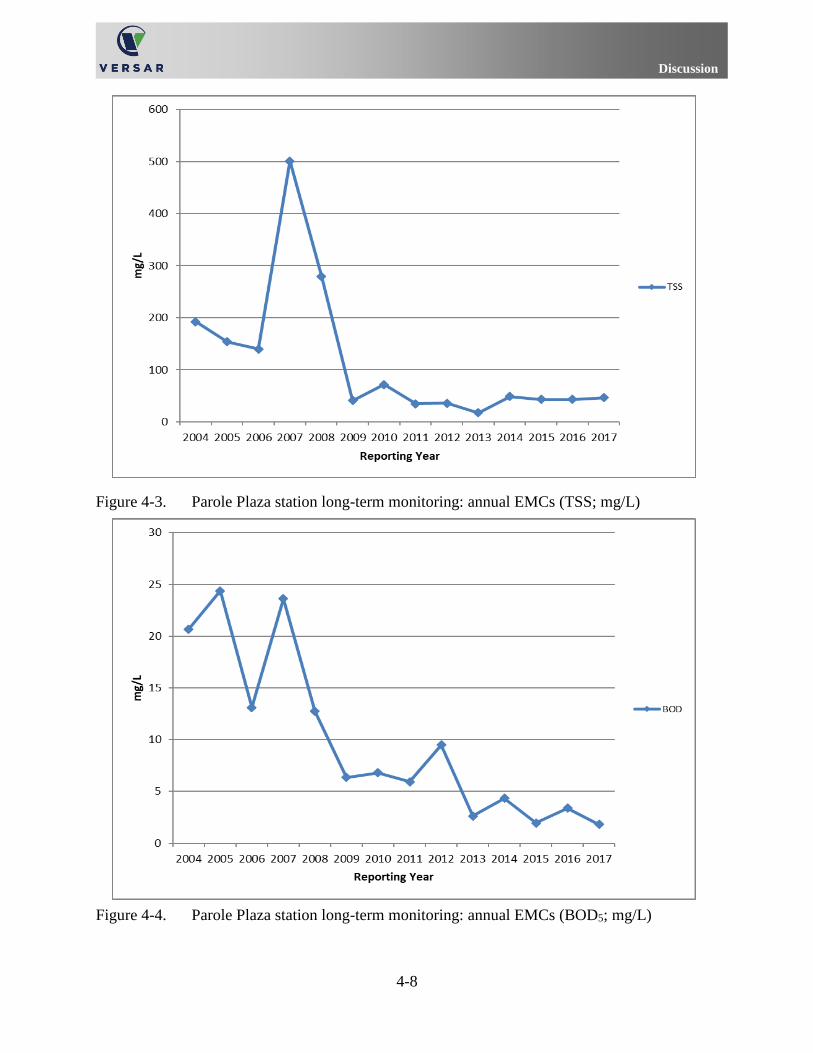
Discussion
4-8
Figure 4-3. Parole Plaza station long-term monitoring: annual EMCs (TSS; mg/L)
Figure 4-4. Parole Plaza station long-term monitoring: annual EMCs (BOD5; mg/L)
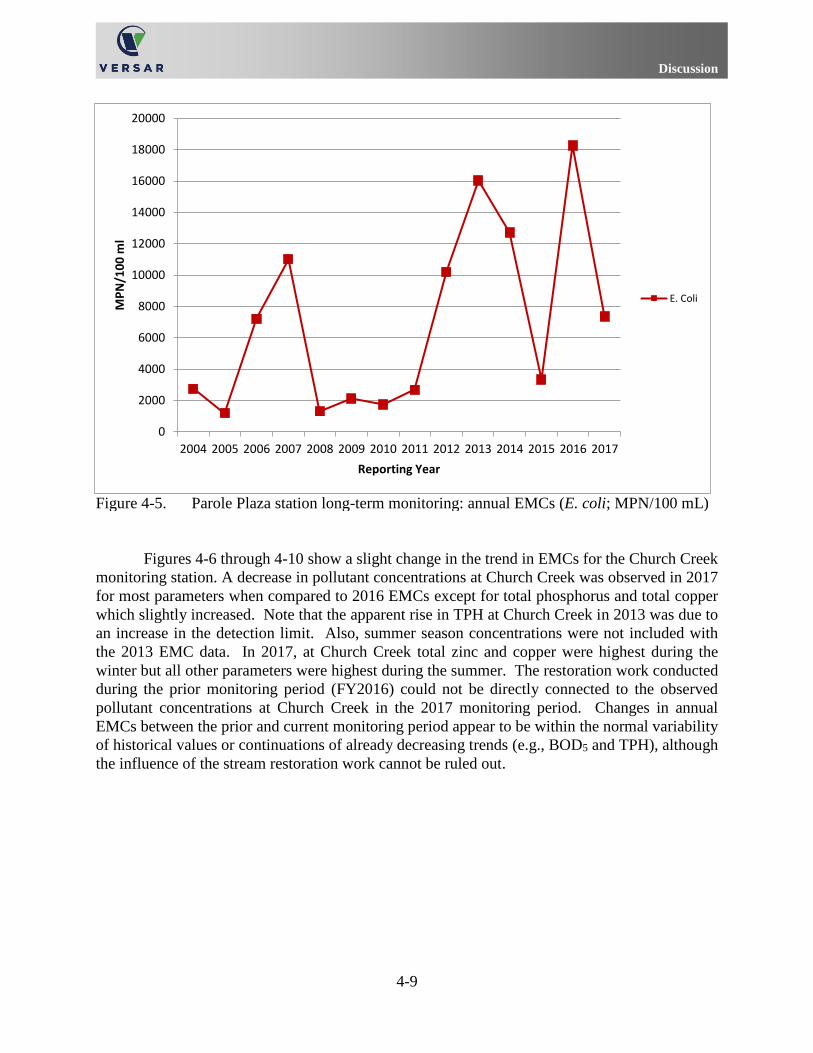
Discussion
4-9
Figure 4-5. Parole Plaza station long-term monitoring: annual EMCs (E. coli; MPN/100 mL)
Figures 4-6 through 4-10 show a slight change in the trend in EMCs for the Church Creek
monitoring station. A decrease in pollutant concentrations at Church Creek was observed in 2017
for most parameters when compared to 2016 EMCs except for total phosphorus and total copper
which slightly increased. Note that the apparent rise in TPH at Church Creek in 2013 was due to
an increase in the detection limit. Also, summer season concentrations were not included with
the 2013 EMC data. In 2017, at Church Creek total zinc and copper were highest during the
winter but all other parameters were highest during the summer. The restoration work conducted
during the prior monitoring period (FY2016) could not be directly connected to the observed
pollutant concentrations at Church Creek in the 2017 monitoring period. Changes in annual
EMCs between the prior and current monitoring period appear to be within the normal variability
of historical values or continuations of already decreasing trends (e.g., BOD5 and TPH), although
the influence of the stream restoration work cannot be ruled out.
0
2000
4000
6000
8000
10000
12000
14000
16000
18000
20000
2004 2005 2006 2007 2008 2009 2010 2011 2012 2013 2014 2015 2016 2017
MP
N/1
00
ml
Reporting Year
E. Coli
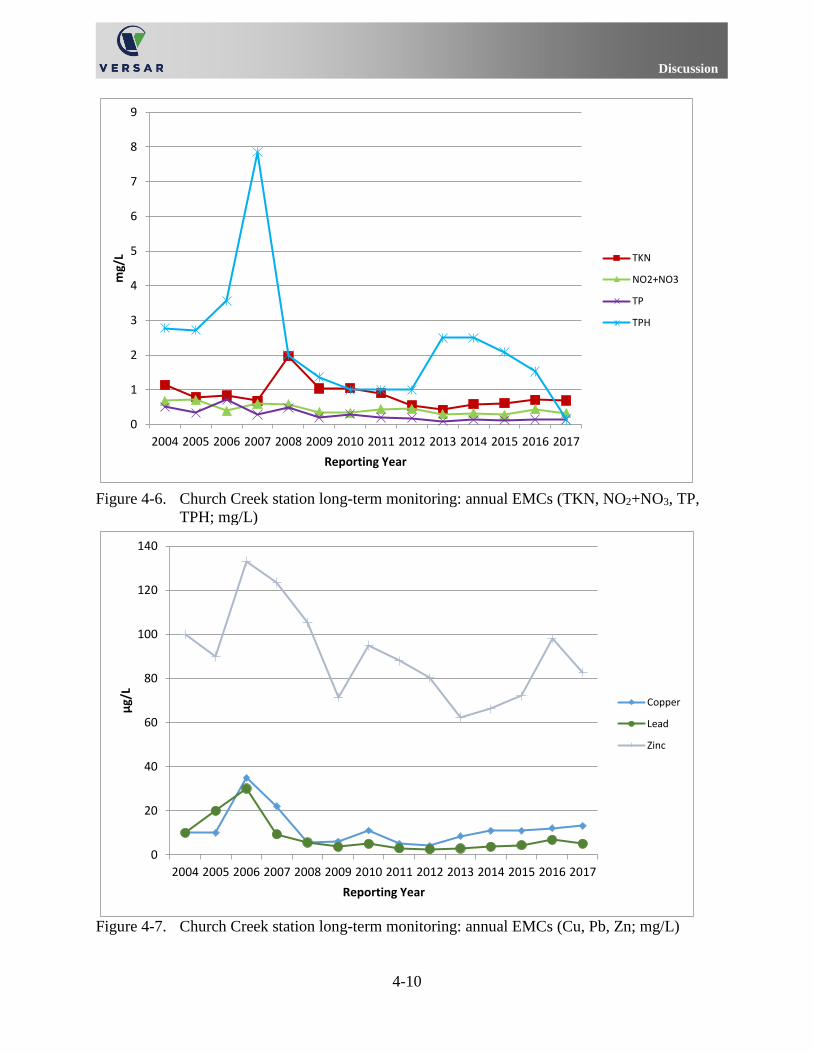
Discussion
4-10
Figure 4-6. Church Creek station long-term monitoring: annual EMCs (TKN, NO2+NO3, TP,
TPH; mg/L)
Figure 4-7. Church Creek station long-term monitoring: annual EMCs (Cu, Pb, Zn; mg/L)
0
1
2
3
4
5
6
7
8
9
2004 2005 2006 2007 2008 2009 2010 2011 2012 2013 2014 2015 2016 2017
mg/
L
Reporting Year
TKN
NO2+NO3
TP
TPH
0
20
40
60
80
100
120
140
2004 2005 2006 2007 2008 2009 2010 2011 2012 2013 2014 2015 2016 2017
µg/
L
Reporting Year
Copper
Lead
Zinc
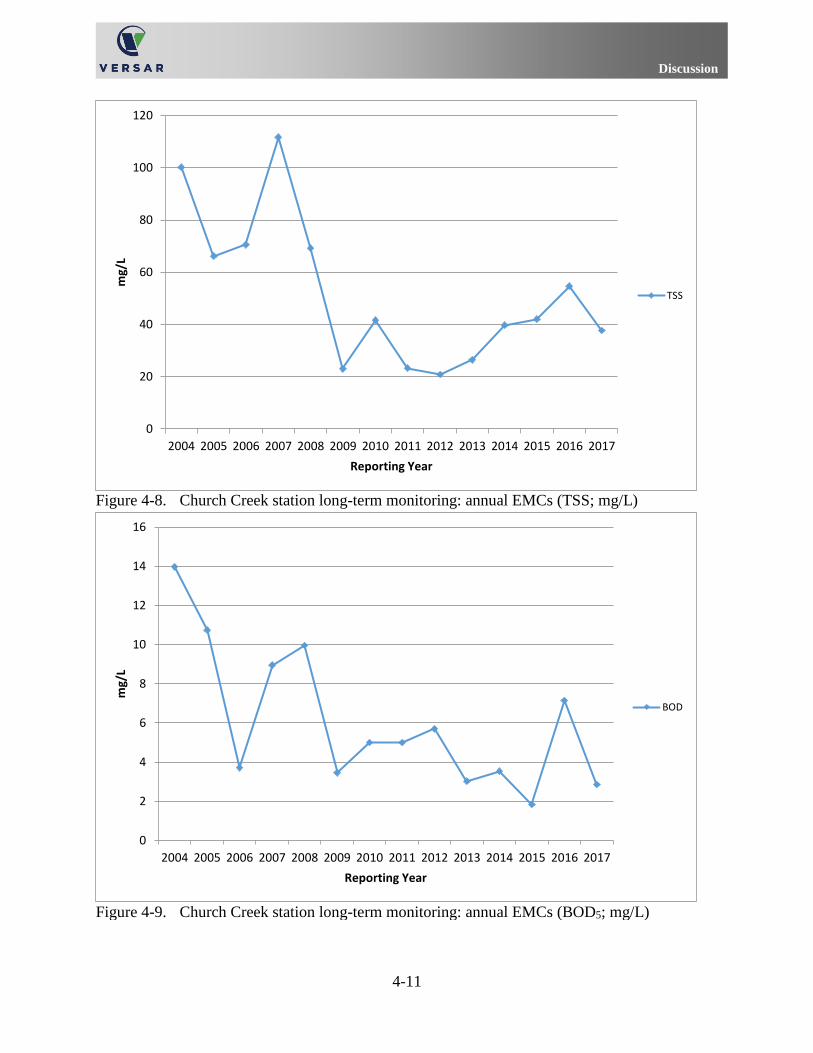
Discussion
4-11
Figure 4-8. Church Creek station long-term monitoring: annual EMCs (TSS; mg/L)
Figure 4-9. Church Creek station long-term monitoring: annual EMCs (BOD5; mg/L)
0
20
40
60
80
100
120
2004 2005 2006 2007 2008 2009 2010 2011 2012 2013 2014 2015 2016 2017
mg/
L
Reporting Year
TSS
0
2
4
6
8
10
12
14
16
2004 2005 2006 2007 2008 2009 2010 2011 2012 2013 2014 2015 2016 2017
mg/
L
Reporting Year
BOD
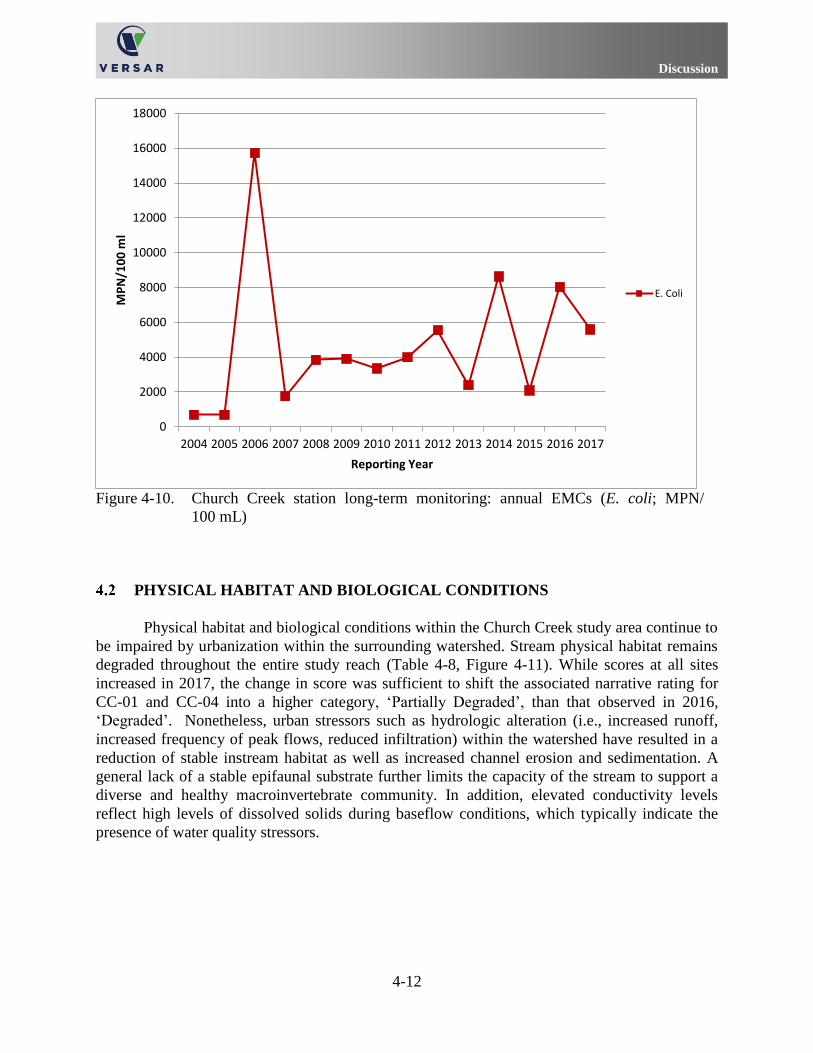
Discussion
4-12
Figure 4-10. Church Creek station long-term monitoring: annual EMCs (E. coli; MPN/
100 mL)
PHYSICAL HABITAT AND BIOLOGICAL CONDITIONS
Physical habitat and biological conditions within the Church Creek study area continue to
be impaired by urbanization within the surrounding watershed. Stream physical habitat remains
degraded throughout the entire study reach (Table 4-8, Figure 4-11). While scores at all sites
increased in 2017, the change in score was sufficient to shift the associated narrative rating for
CC-01 and CC-04 into a higher category, ‘Partially Degraded’, than that observed in 2016,
‘Degraded’. Nonetheless, urban stressors such as hydrologic alteration (i.e., increased runoff,
increased frequency of peak flows, reduced infiltration) within the watershed have resulted in a
reduction of stable instream habitat as well as increased channel erosion and sedimentation. A
general lack of a stable epifaunal substrate further limits the capacity of the stream to support a
diverse and healthy macroinvertebrate community. In addition, elevated conductivity levels
reflect high levels of dissolved solids during baseflow conditions, which typically indicate the
presence of water quality stressors.
0
2000
4000
6000
8000
10000
12000
14000
16000
18000
2004 2005 2006 2007 2008 2009 2010 2011 2012 2013 2014 2015 2016 2017
MP
N/1
00
ml
Reporting Year
E. Coli
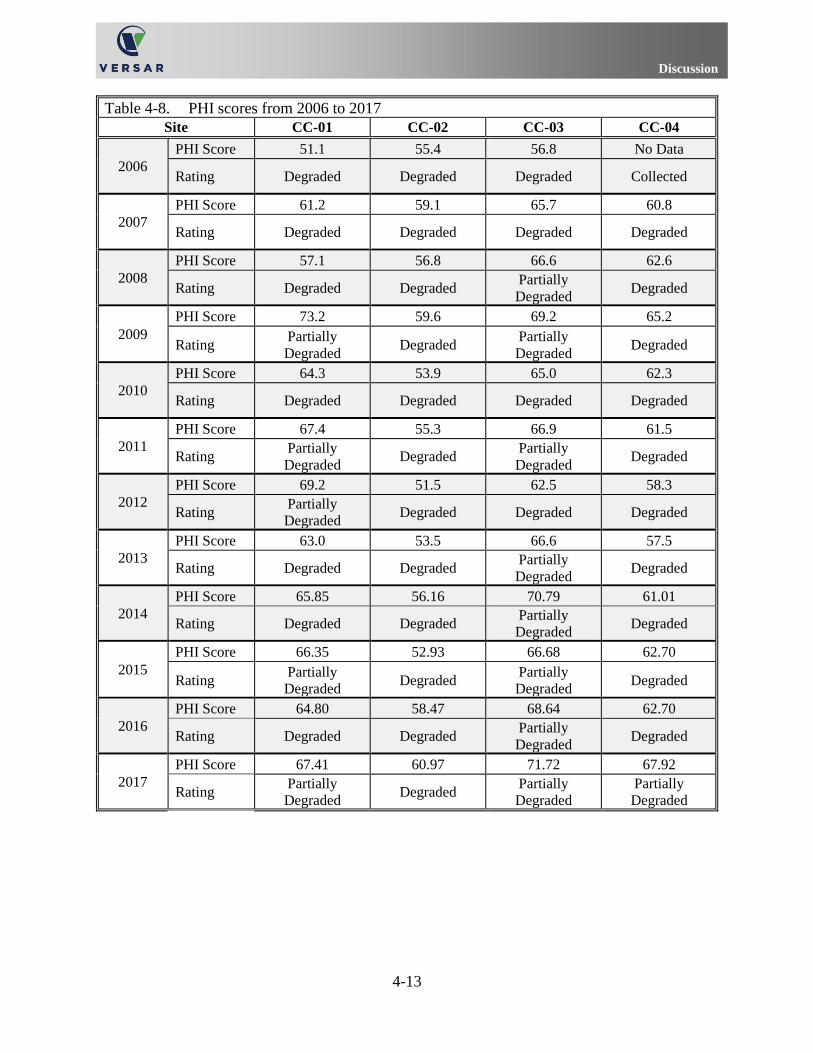
Discussion
4-13
Table 4-8. PHI scores from 2006 to 2017
Site CC-01 CC-02 CC-03 CC-04
2006
PHI Score 51.1 55.4 56.8 No Data
Rating Degraded Degraded Degraded Collected
2007
PHI Score 61.2 59.1 65.7 60.8
Rating Degraded Degraded Degraded Degraded
2008
PHI Score 57.1 56.8 66.6 62.6
Rating Degraded Degraded Partially
Degraded Degraded
2009
PHI Score 73.2 59.6 69.2 65.2
Rating Partially
Degraded Degraded
Partially
Degraded Degraded
2010
PHI Score 64.3 53.9 65.0 62.3
Rating Degraded Degraded Degraded Degraded
2011
PHI Score 67.4 55.3 66.9 61.5
Rating Partially
Degraded Degraded
Partially
Degraded Degraded
2012
PHI Score 69.2 51.5 62.5 58.3
Rating Partially
Degraded Degraded Degraded Degraded
2013
PHI Score 63.0 53.5 66.6 57.5
Rating Degraded Degraded Partially
Degraded Degraded
2014
PHI Score 65.85 56.16 70.79 61.01
Rating Degraded Degraded Partially
Degraded Degraded
2015
PHI Score 66.35 52.93 66.68 62.70
Rating Partially
Degraded Degraded
Partially
Degraded Degraded
2016
PHI Score 64.80 58.47 68.64 62.70
Rating Degraded Degraded Partially
Degraded Degraded
2017
PHI Score 67.41 60.97 71.72 67.92
Rating Partially
Degraded Degraded
Partially
Degraded
Partially
Degraded
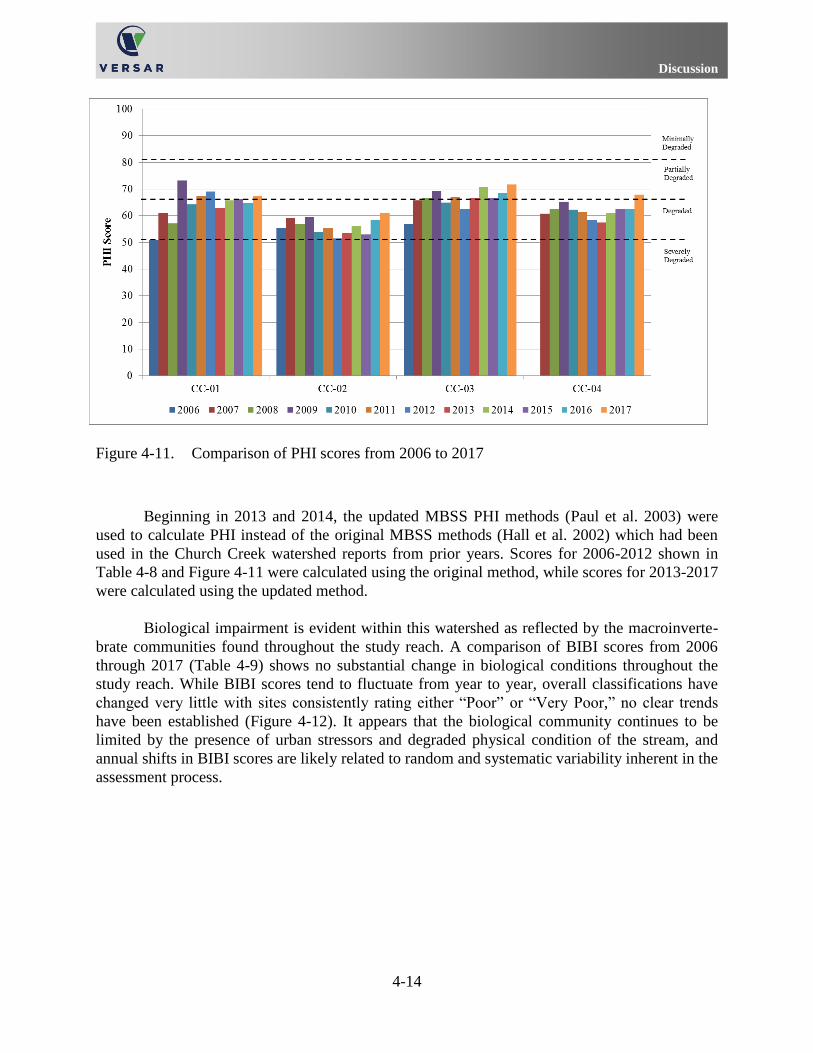
Discussion
4-14
Figure 4-11. Comparison of PHI scores from 2006 to 2017
Beginning in 2013 and 2014, the updated MBSS PHI methods (Paul et al. 2003) were
used to calculate PHI instead of the original MBSS methods (Hall et al. 2002) which had been
used in the Church Creek watershed reports from prior years. Scores for 2006-2012 shown in
Table 4-8 and Figure 4-11 were calculated using the original method, while scores for 2013-2017
were calculated using the updated method.
Biological impairment is evident within this watershed as reflected by the macroinverte-
brate communities found throughout the study reach. A comparison of BIBI scores from 2006
through 2017 (Table 4-9) shows no substantial change in biological conditions throughout the
study reach. While BIBI scores tend to fluctuate from year to year, overall classifications have
changed very little with sites consistently rating either “Poor” or “Very Poor,” no clear trends
have been established (Figure 4-12). It appears that the biological community continues to be
limited by the presence of urban stressors and degraded physical condition of the stream, and
annual shifts in BIBI scores are likely related to random and systematic variability inherent in the
assessment process.
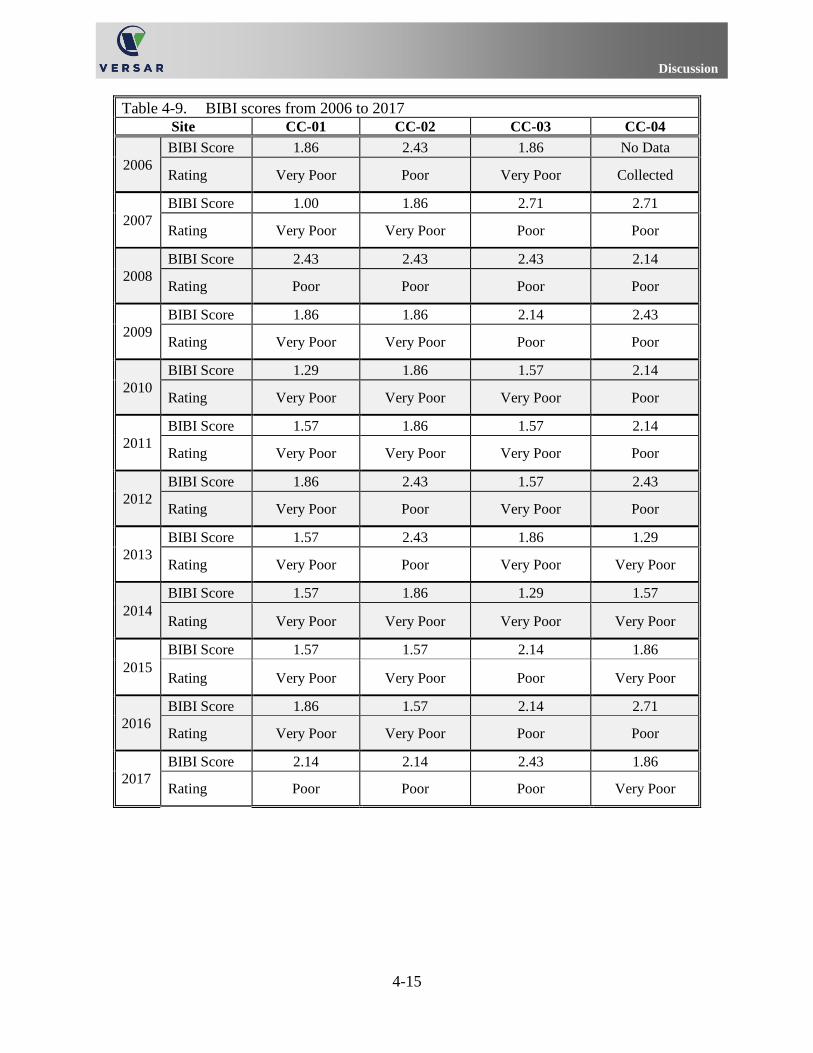
Discussion
4-15
Table 4-9. BIBI scores from 2006 to 2017 Site CC-01 CC-02 CC-03 CC-04
2006
BIBI Score 1.86 2.43 1.86 No Data
Rating Very Poor Poor Very Poor Collected
2007
BIBI Score 1.00 1.86 2.71 2.71
Rating Very Poor Very Poor Poor Poor
2008
BIBI Score 2.43 2.43 2.43 2.14
Rating Poor Poor Poor Poor
2009
BIBI Score 1.86 1.86 2.14 2.43
Rating Very Poor Very Poor Poor Poor
2010
BIBI Score 1.29 1.86 1.57 2.14
Rating Very Poor Very Poor Very Poor Poor
2011
BIBI Score 1.57 1.86 1.57 2.14
Rating Very Poor Very Poor Very Poor Poor
2012
BIBI Score 1.86 2.43 1.57 2.43
Rating Very Poor Poor Very Poor Poor
2013
BIBI Score 1.57 2.43 1.86 1.29
Rating Very Poor Poor Very Poor Very Poor
2014
BIBI Score 1.57 1.86 1.29 1.57
Rating Very Poor Very Poor Very Poor Very Poor
2015
BIBI Score 1.57 1.57 2.14 1.86
Rating Very Poor Very Poor Poor Very Poor
2016
BIBI Score 1.86 1.57 2.14 2.71
Rating Very Poor Very Poor Poor Poor
2017
BIBI Score 2.14 2.14 2.43 1.86
Rating Poor Poor Poor Very Poor
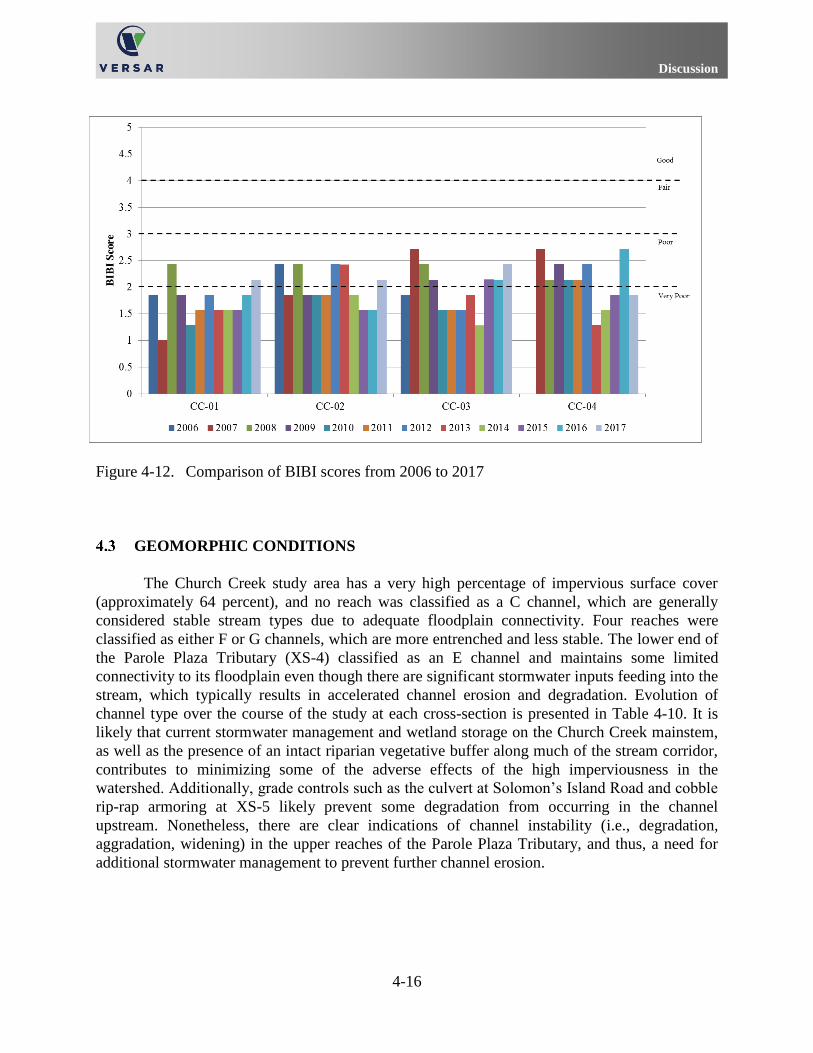
Discussion
4-16
Figure 4-12. Comparison of BIBI scores from 2006 to 2017
GEOMORPHIC CONDITIONS
The Church Creek study area has a very high percentage of impervious surface cover
(approximately 64 percent), and no reach was classified as a C channel, which are generally
considered stable stream types due to adequate floodplain connectivity. Four reaches were
classified as either F or G channels, which are more entrenched and less stable. The lower end of
the Parole Plaza Tributary (XS-4) classified as an E channel and maintains some limited
connectivity to its floodplain even though there are significant stormwater inputs feeding into the
stream, which typically results in accelerated channel erosion and degradation. Evolution of
channel type over the course of the study at each cross-section is presented in Table 4-10. It is
likely that current stormwater management and wetland storage on the Church Creek mainstem,
as well as the presence of an intact riparian vegetative buffer along much of the stream corridor,
contributes to minimizing some of the adverse effects of the high imperviousness in the
watershed. Additionally, grade controls such as the culvert at Solomon’s Island Road and cobble
rip-rap armoring at XS-5 likely prevent some degradation from occurring in the channel
upstream. Nonetheless, there are clear indications of channel instability (i.e., degradation,
aggradation, widening) in the upper reaches of the Parole Plaza Tributary, and thus, a need for
additional stormwater management to prevent further channel erosion.
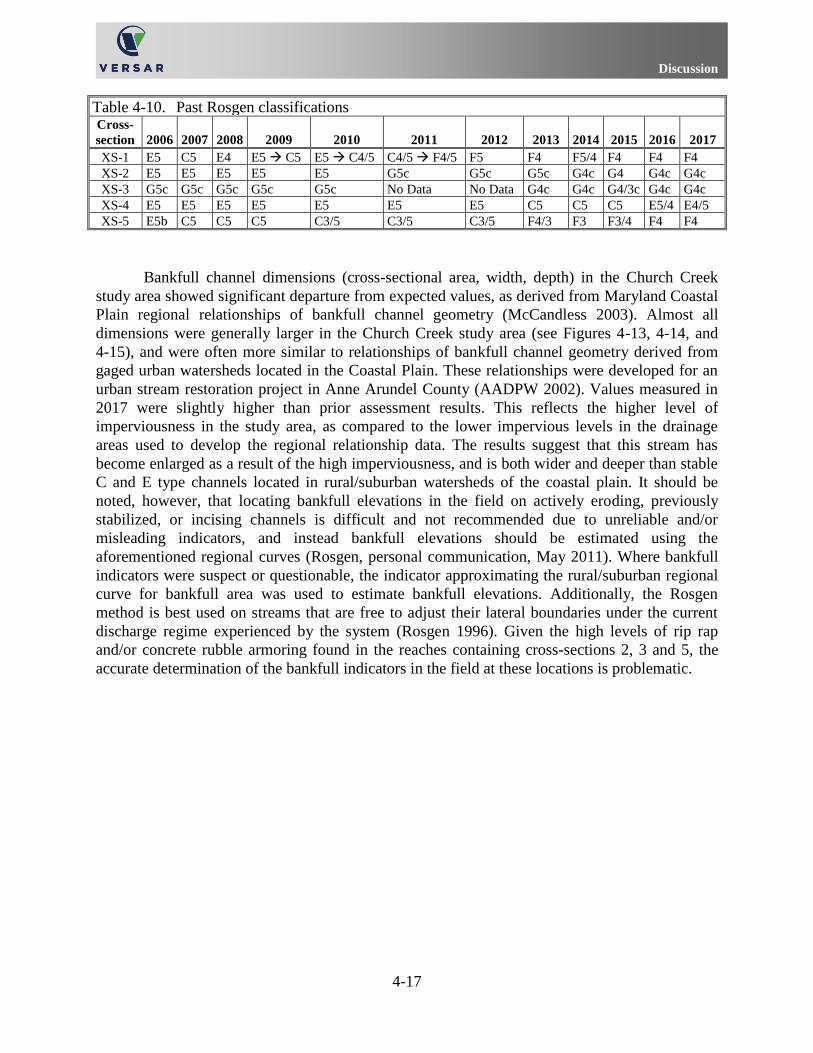
Discussion
4-17
Table 4-10. Past Rosgen classifications Cross-
section 2006 2007 2008 2009 2010 2011 2012 2013 2014 2015 2016 2017
XS-1 E5 C5 E4 E5 C5 E5 C4/5 C4/5 F4/5 F5 F4 F5/4 F4 F4 F4
XS-2 E5 E5 E5 E5 E5 G5c G5c G5c G4c G4 G4c G4c
XS-3 G5c G5c G5c G5c G5c No Data No Data G4c G4c G4/3c G4c G4c
XS-4 E5 E5 E5 E5 E5 E5 E5 C5 C5 C5 E5/4 E4/5
XS-5 E5b C5 C5 C5 C3/5 C3/5 C3/5 F4/3 F3 F3/4 F4 F4
Bankfull channel dimensions (cross-sectional area, width, depth) in the Church Creek
study area showed significant departure from expected values, as derived from Maryland Coastal
Plain regional relationships of bankfull channel geometry (McCandless 2003). Almost all
dimensions were generally larger in the Church Creek study area (see Figures 4-13, 4-14, and
4-15), and were often more similar to relationships of bankfull channel geometry derived from
gaged urban watersheds located in the Coastal Plain. These relationships were developed for an
urban stream restoration project in Anne Arundel County (AADPW 2002). Values measured in
2017 were slightly higher than prior assessment results. This reflects the higher level of
imperviousness in the study area, as compared to the lower impervious levels in the drainage
areas used to develop the regional relationship data. The results suggest that this stream has
become enlarged as a result of the high imperviousness, and is both wider and deeper than stable
C and E type channels located in rural/suburban watersheds of the coastal plain. It should be
noted, however, that locating bankfull elevations in the field on actively eroding, previously
stabilized, or incising channels is difficult and not recommended due to unreliable and/or
misleading indicators, and instead bankfull elevations should be estimated using the
aforementioned regional curves (Rosgen, personal communication, May 2011). Where bankfull
indicators were suspect or questionable, the indicator approximating the rural/suburban regional
curve for bankfull area was used to estimate bankfull elevations. Additionally, the Rosgen
method is best used on streams that are free to adjust their lateral boundaries under the current
discharge regime experienced by the system (Rosgen 1996). Given the high levels of rip rap
and/or concrete rubble armoring found in the reaches containing cross-sections 2, 3 and 5, the
accurate determination of the bankfull indicators in the field at these locations is problematic.

Discussion
4-18
Figure 4-13. Comparison of bankfull channel cross-sectional area to drainage area
(CC = Church Creek, 2017 data)
1
10
100
0.01 0.1 1
AADPW (2002) URBAN Prediction
McCandless (2003) RURAL/SUB Prediction
CC Field Data
(AADPW (2002) URBAN Prediction)
(McCandless (2003) RURAL/SUB Prediction)
Drainage Area (mi2)
Cro
ss-s
ecti
on
al A
rea
(fee
t2)
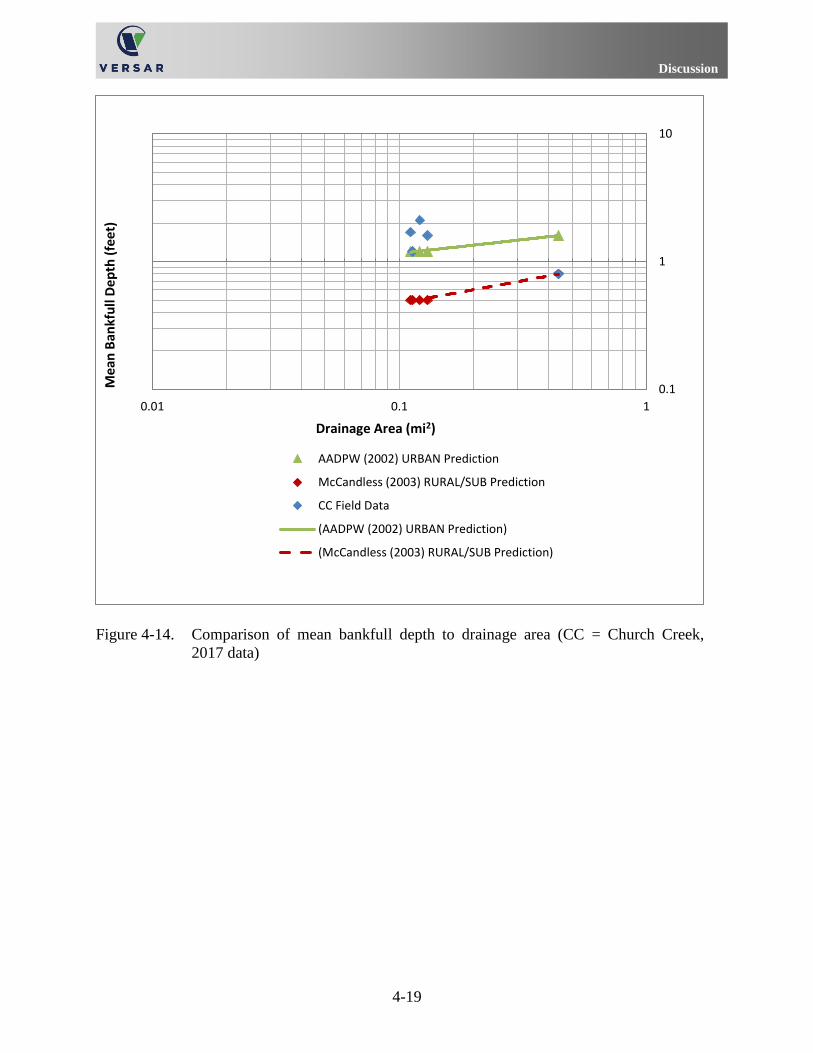
Discussion
4-19
Figure 4-14. Comparison of mean bankfull depth to drainage area (CC = Church Creek,
2017 data)
0.1
1
10
0.01 0.1 1
AADPW (2002) URBAN Prediction
McCandless (2003) RURAL/SUB Prediction
CC Field Data
(AADPW (2002) URBAN Prediction)
(McCandless (2003) RURAL/SUB Prediction)
Drainage Area (mi2)
Mea
n B
ankf
ull
De
pth
(fe
et)
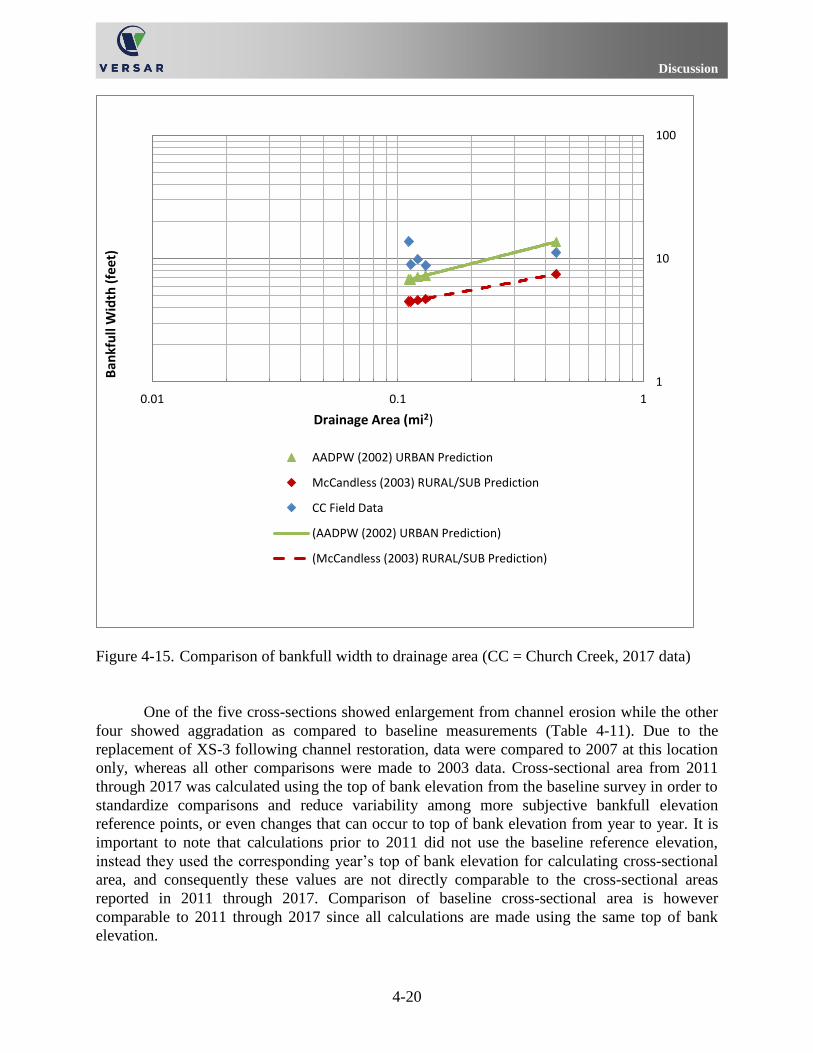
Discussion
4-20
Figure 4-15. Comparison of bankfull width to drainage area (CC = Church Creek, 2017 data)
One of the five cross-sections showed enlargement from channel erosion while the other
four showed aggradation as compared to baseline measurements (Table 4-11). Due to the
replacement of XS-3 following channel restoration, data were compared to 2007 at this location
only, whereas all other comparisons were made to 2003 data. Cross-sectional area from 2011
through 2017 was calculated using the top of bank elevation from the baseline survey in order to
standardize comparisons and reduce variability among more subjective bankfull elevation
reference points, or even changes that can occur to top of bank elevation from year to year. It is
important to note that calculations prior to 2011 did not use the baseline reference elevation,
instead they used the corresponding year’s top of bank elevation for calculating cross-sectional
area, and consequently these values are not directly comparable to the cross-sectional areas
reported in 2011 through 2017. Comparison of baseline cross-sectional area is however
comparable to 2011 through 2017 since all calculations are made using the same top of bank
elevation.
1
10
100
0.01 0.1 1
AADPW (2002) URBAN Prediction
McCandless (2003) RURAL/SUB Prediction
CC Field Data
(AADPW (2002) URBAN Prediction)
(McCandless (2003) RURAL/SUB Prediction)
Drainage Area (mi2)
Ban
kfu
llW
idth
(fe
et)
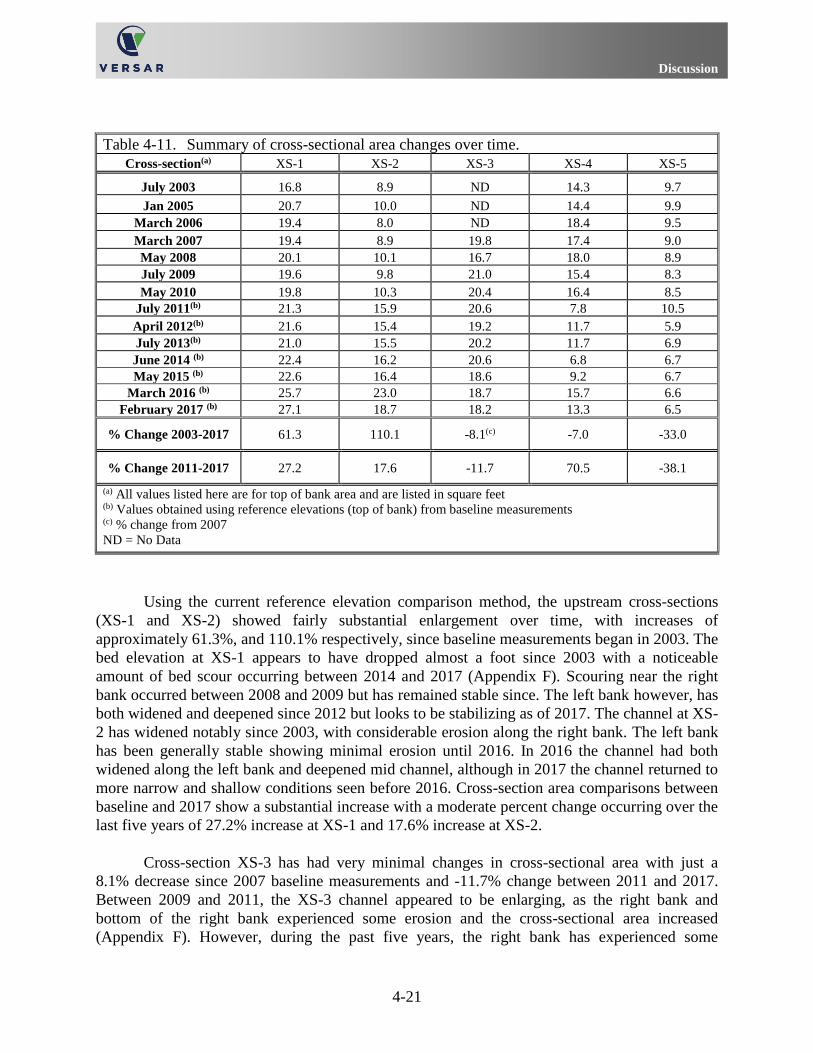
Discussion
4-21
Table 4-11. Summary of cross-sectional area changes over time.
Cross-section(a) XS-1 XS-2 XS-3 XS-4 XS-5
July 2003 16.8 8.9 ND 14.3 9.7
Jan 2005 20.7 10.0 ND 14.4 9.9
March 2006 19.4 8.0 ND 18.4 9.5
March 2007 19.4 8.9 19.8 17.4 9.0
May 2008 20.1 10.1 16.7 18.0 8.9
July 2009 19.6 9.8 21.0 15.4 8.3
May 2010 19.8 10.3 20.4 16.4 8.5
July 2011(b) 21.3 15.9 20.6 7.8 10.5
April 2012(b) 21.6 15.4 19.2 11.7 5.9
July 2013(b) 21.0 15.5 20.2 11.7 6.9
June 2014 (b) 22.4 16.2 20.6 6.8 6.7
May 2015 (b) 22.6 16.4 18.6 9.2 6.7
March 2016 (b) 25.7 23.0 18.7 15.7 6.6
February 2017 (b) 27.1 18.7 18.2 13.3 6.5
% Change 2003-2017 61.3 110.1 -8.1(c) -7.0 -33.0
% Change 2011-2017 27.2 17.6 -11.7 70.5 -38.1
(a) All values listed here are for top of bank area and are listed in square feet (b) Values obtained using reference elevations (top of bank) from baseline measurements (c) % change from 2007
ND = No Data
Using the current reference elevation comparison method, the upstream cross-sections
(XS-1 and XS-2) showed fairly substantial enlargement over time, with increases of
approximately 61.3%, and 110.1% respectively, since baseline measurements began in 2003. The
bed elevation at XS-1 appears to have dropped almost a foot since 2003 with a noticeable
amount of bed scour occurring between 2014 and 2017 (Appendix F). Scouring near the right
bank occurred between 2008 and 2009 but has remained stable since. The left bank however, has
both widened and deepened since 2012 but looks to be stabilizing as of 2017. The channel at XS-
2 has widened notably since 2003, with considerable erosion along the right bank. The left bank
has been generally stable showing minimal erosion until 2016. In 2016 the channel had both
widened along the left bank and deepened mid channel, although in 2017 the channel returned to
more narrow and shallow conditions seen before 2016. Cross-section area comparisons between
baseline and 2017 show a substantial increase with a moderate percent change occurring over the
last five years of 27.2% increase at XS-1 and 17.6% increase at XS-2.
Cross-section XS-3 has had very minimal changes in cross-sectional area with just a
8.1% decrease since 2007 baseline measurements and -11.7% change between 2011 and 2017.
Between 2009 and 2011, the XS-3 channel appeared to be enlarging, as the right bank and
bottom of the right bank experienced some erosion and the cross-sectional area increased
(Appendix F). However, during the past five years, the right bank has experienced some
Discussion
4-22
aggradation (Appendix F). Between 2012 and 2016 monitoring, there has been little change apart
from slight aggradation across the stream bed and toe of the right bank. In 2017 erosion began
occurring behind the armored right bank and some scouring was evident on both sides of the
channel bed. Cross-section XS-3 continues to have yard waste (i.e., grass clippings, leaves, and
branches) dumped along the left bank.
Cross-section XS-4 has had the most variation throughout the years. Between 2010 and
2011 cross-section XS-4 had shown moderate signs of aggradation. Within the next year, the
channel experienced erosion of the bed, particularly along the right hand side of the stream. In
the 2013 survey, signs of aggradation were again present and the stream bed characteristics
resemble those of the 2011 survey. In 2014 the stream bed remained elevated as in 2011 and
2013 however there was slight widening along the right bank. The debris jam at XS-4 which
formed between 2011 and 2012 and caused sediment accumulation, was removed during stream
restoration construction prior to the 2016 surveying. Consequently, the channel scoured
significantly and resulted in cross-sectional area increase. This scour slowed by 2017 and the
cross-sectional area decreased slightly from 2016. Cross-section XS-4 continues to be larger than
in 2011 (70.5%) but is 7.0% smaller than 2003.
Cross-section XS-5 has been armored with cobble-sized rip rap in its bed to protect the
sanitary sewer line. Between 2012 and 2013, XS-5 appears to have eroded by several inches of
sediment, most notably near the left bank. The cross-sectional area has decreased by 38.1% since
2011. During the past three years, however, there has been little change in both stream bed
elevation and bank stability (Appendix F). Cross-sectional area has remained relatively stable
from 2014 to 2017 with little to no change year to year.
GENERAL CONCLUSIONS
Based upon the data collected in 2017, most stream water quality parameters measured
have improved when compared to pre-construction and earlier post-construction monitoring
years, but biological and physical conditions within the Church Creek study area have not
improved and remain in a degraded and impaired condition. Although the stream channel has
been stabilized along several reaches, the effects on biota are yet to be seen from such efforts. In
2016, stream restoration occurred downstream of XS-4, on an unnamed tributary of Church
Creek, and upstream of XS-5 on the mainstem Church Creek. All of the CC-04 and part of the
CC-03 biological monitoring sites were within the restored reach of stream. At Church Creek,
annual average EMCs for most pollutants and annual loads for all pollutants were lower in 2017
compared to 2016. The reduced loadings and EMCs may have been the result of stream
restoration; however, given the size of the restored area in relation to the overall watershed,
water quality improvement may be difficult to discern from natural variations in pollutant levels,
especially in the short timespan in which post-restoration data are available. The reduction in
loads of pollutants at Church Creek may was also due, in part, to a 17% decline in total discharge
as a result of lower annual rainfall between 2016 and 2017. Over time, the restoration project
should result in less sediment transported downstream, increased stability at physical monitoring
stations, and could positively affect the biota at monitoring stations through habitat
improvement. In the year since restoration was completed, cross-section 5, downstream of the
Discussion
4-23
restored reach has maintained stability in its geomorphic parameters including consistent cross-
sectional area. No considerable changes have been observed in water chemistry, biota, or
physical habitat downstream of the restored reach; while increased categorical changes in PHI
were observed in 2017, these categorical ratings were still within the historical rankings for the
sites. Future monitoring efforts will be used to evaluate the effects of this restoration.

Discussion
4-24
References
5-1
5 REFERENCES
Anne Arundel County. 2010. Anne Arundel County Biological Monitoring and Assessment
Program: Quality Assurance Project Plan. Revised December 2010. Prepared by KCI
Technologies, Inc. for Anne Arundel County Department of Public Works, Watershed
Ecosystem and Restoration Services. Annapolis, MD. For additional information, contact
Mr. Chris Victoria (410-222-4240, <[email protected]>).
Anne Arundel County Department of Public Works (AADPW). 2002. Cypress Creek Tributary
Assessment and Findings Report. Prepared by Bayland Consultants and Designers, Inc.,
and Clear Creek Consulting. 32 pp., plus Appendices.
Barbour, M.T., J. Gerritsen, B.D. Snyder, J.B. Stribling. 1999. Rapid bioassessment protocols for
use in streams and wadeable rivers: Periphyton, benthic macroinvertebrates and fish,
2nd edition. EPA841-B-99-002. U.S. Environmental Protection Agency; Office of Water;
Washington, D.C.
Cushman, S.F. 2006. Fish movement, habitat selection, and stream habitat complexity in small
urban streams. Dissertation submitted to the Faculty of the Graduate School of the
University of Maryland, College Park, in partial fulfillment of the requirements for the
degree of Doctor of Philosophy.
Greenhorne and O’Mara. 2005. Annapolis Towne Centre @ Parole Stormwater Management
Report. Prepared for Annapolis Towne Centre @ Parole, LLC, Owings Mills, MD.
Hill C. R. and M. C. Crunkleton. 2009. Howard County Biological Monitoring and Assessment,
Dorsey Run, Hammond Branch, and Rocky Gorge Watersheds – 2009. Prepared by KCI
Technologies, Inc., Sparks, MD for Howard County, Department of Public Works.
Stormwater Management Division. Columbia, MD. October 2009.
Hill, C.R., and M.J. Pieper. 2011. Aquatic Biological Assessment of the Watersheds of Anne
Arundel County, Maryland: Round One 2004 – 2008. Anne Arundel County Department
of Public Works, Watershed, Ecosystem, and Restoration Services, Annapolis, Maryland.
KCI Technologies. 2009. Howard County Biological Monitoring and Assessment, Dorsey Run,
Hammond Branch, and Rocky Gorge Watersheds – 2009. Prepared for Howard County,
Department of Public Works. Stormwater Management Division. Columbia, MD.
October 2009.
Maryland Department of the Environment (MDE). 2010. Code of Maryland Regulations
(COMAR), Water Quality Criteria Specific to Designated Uses. Revised effective date:
April 19, 2010.
McCandless, T.L. 2003. Maryland stream survey: Bankfull discharge and channel
characteristics of streams in the Coastal Plain hydrologic region. U.S. Fish and Wildlife
Service, Annapolis, MD. CBFO-S03-02.
References
5-2
Maryland Department of Natural Resources (DNR). 2001. Maryland Biological Stream Survey
2000-2007 Volume 1: Ecological Assessment of Watersheds Sampled in 2000. CBWP-
MANTA-EA-01-05. Maryland Department of Natural Resources, Annapolis, MD.
Maryland DNR. 2003. Maryland Biological Stream Survey 2000-2007 Volume 2: Ecological
Assessment of Watersheds Sampled in 2001. CBWP-MANTA-EA-03-03. Maryland
Department of Natural Resources, Annapolis, MD.
Maryland DNR. 2005. Maryland Biological Stream Survey 2000-2007 Volume 4: Ecological
Assessment of Watersheds Sampled in 2003. CBWP-MANTA-EA-05-01. Maryland
Department of Natural Resources, Annapolis, MD. Publication # DNR-12-0105-0038.
Maryland DNR. 2017. Maryland Biological Stream Survey: Round Four Field Sampling Manual
Revised January 2017. Maryland Department of Natural Resources, Annapolis, MD.
Publication # 12-RAS-3142014-700.
Mecklenburg, D. 2006. The Reference Reach Spreadsheet. Version 4.3 L. Ohio Department of
Natural Resources.
Paul, M.J. and J.L. Meyer. 2001. Streams in the urban landscape. Annual Review of Ecology and
Systematics 32:333-365.
Paul, M.J., J.B. Stribling, R.J. Klauda, P. F. Kayzak, M.T. Southerland, and N. E. Roth. 2003. A
Physical Habitat Index for Wadeable Streams Maryland. Report to Monitoring and Non-
Tidal Assessment Division, Maryland Department of Natural Resources, Annapolis, MD.
Rosgen, D.L. 1996. Applied River Morphology. Wildland Hydrology, Pagosa Springs, CO.
Southerland, M., G. Rogers, M. Kline, R. Morgan, D. Boward, P. Kazyak, and S. Stranko. 2005.
Development of New Fish and Benthic Macroinvertebrate Indices of Biotic Integrity for
Maryland Streams. Report to Monitoring and Non-Tidal Assessment Division, Maryland
Department of Natural Resources, Annapolis, MD.
Stribling, J.B., E.W. Leppo, and C. Daley. 1999. Biological Assessment of the Streams and
Watersheds of Prince George’s County, Maryland. Spring Index Period 1999. PGDER
Report No. 99-1. Prince George’s County, Dept. of Env. Rsrs., Programs and Planning
Division, Largo, MD.
United States Environmental Protection Agency (U.S. EPA). 1974. National Water Quality
Inventory. 1974 Report to the Congress. Volume II. United States Environmental
Protection Agency, Office of Water Planning and Standards, Washington, D.C. EPA
440/9-74-001.
U.S. EPA. 1983. Final Report of the Nationwide Urban Runoff Program. United States
Environmental Protection Agency, Water Planning Division. Washington, D.C.
December.
References
5-3
U.S. EPA. 1986. Quality Criteria for Water 1986. United States Environmental Protection
Agency, Office of Water Regulations and Standards, Washington, DC. May. EPA 440/5-
86-001.
U.S. EPA. 2000. Ambient Water Quality Criteria Recommendations Information Supporting the
Development of State and Tribal Nutrient Criteria Rivers and Streams in Nutrient
Ecoregion IX. Office of Water, 4304. December 2000. EPA 822-B-00-019 [http://www2
.epa .gov/sites/production/files/documents/rivers9.pdf].
U.S. EPA. 2002. Urban Stormwater BMP Performance Monitoring: A Guidance Manual for
Meeting the National Stormwater BMP Database Requirements. EPA-821-B-02-001.
Versar, Inc. 2013. Chemical, Biological, and Physical Characterization of the Church Creek and
Parole Plaza NPDES Monitoring Stations: 2013. Prepared for Anne Arundel County
Department of Public Works. December 2013.
Versar, Inc. 2017a. Church Creek/Parole Plaza NPDES Water Chemistry Monitoring – Summer
2016 Quarter Report. Technical Memorandum Prepared by Versar, Inc., Columbia, MD
for Janis Markusic, Anne Arundel County Department of Public Works. January 2017.
Versar, Inc. 2017b. Church Creek/Parole Plaza NPDES Water Chemistry Monitoring – Fall 2016
Quarter Report. Technical Memorandum Prepared by Versar, Inc., Columbia, MD for
Janis Markusic, Anne Arundel County Department of Public Works. April 2017.
Versar, Inc. 2017c. Church Creek/Parole Plaza NPDES Water Chemistry Monitoring – Winter
2017 Quarter Report. Technical Memorandum Prepared by Versar, Inc., Columbia, MD
for Janis Markusic, Anne Arundel County Department of Public Works. August 2017.

References
5-4
Appendix A
A-1
APPENDIX A
STORM EVENT HYDROGRAPHS, NARRATIVES AND COMPOSITE SAMPLING METHOD TECHNICAL MEMORANDUM

Appendix A
A-2
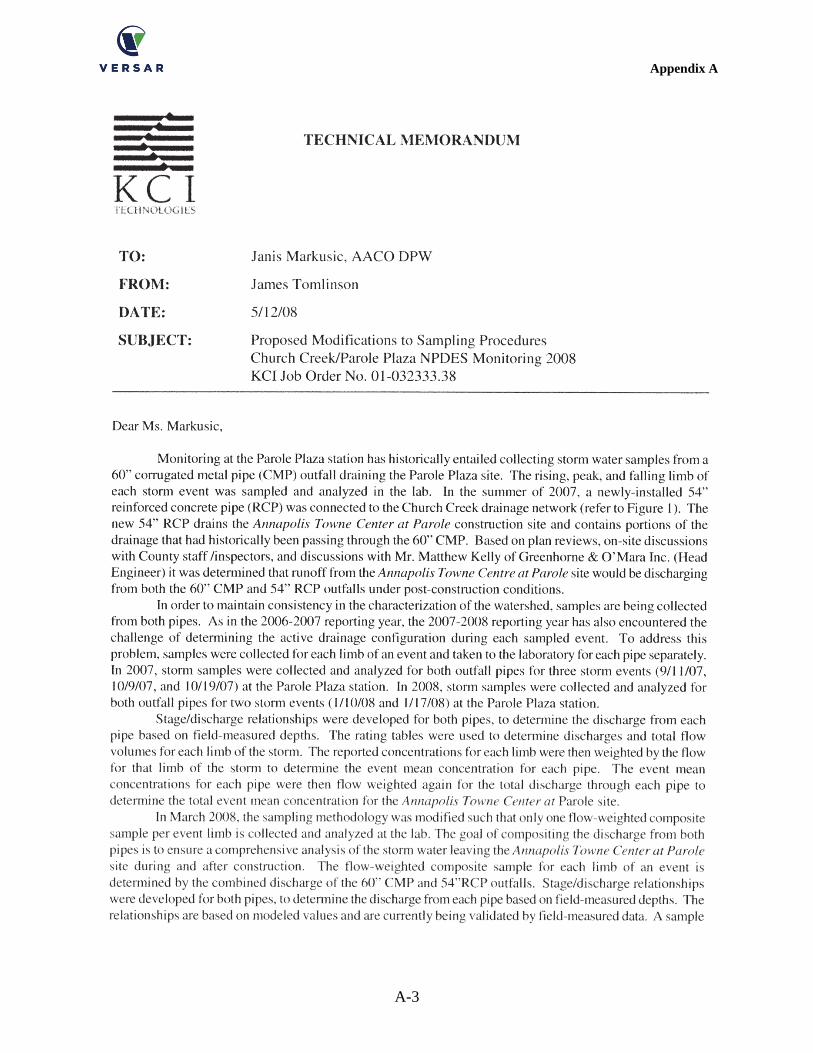
Appendix A
A-3
Appendix A
A-4
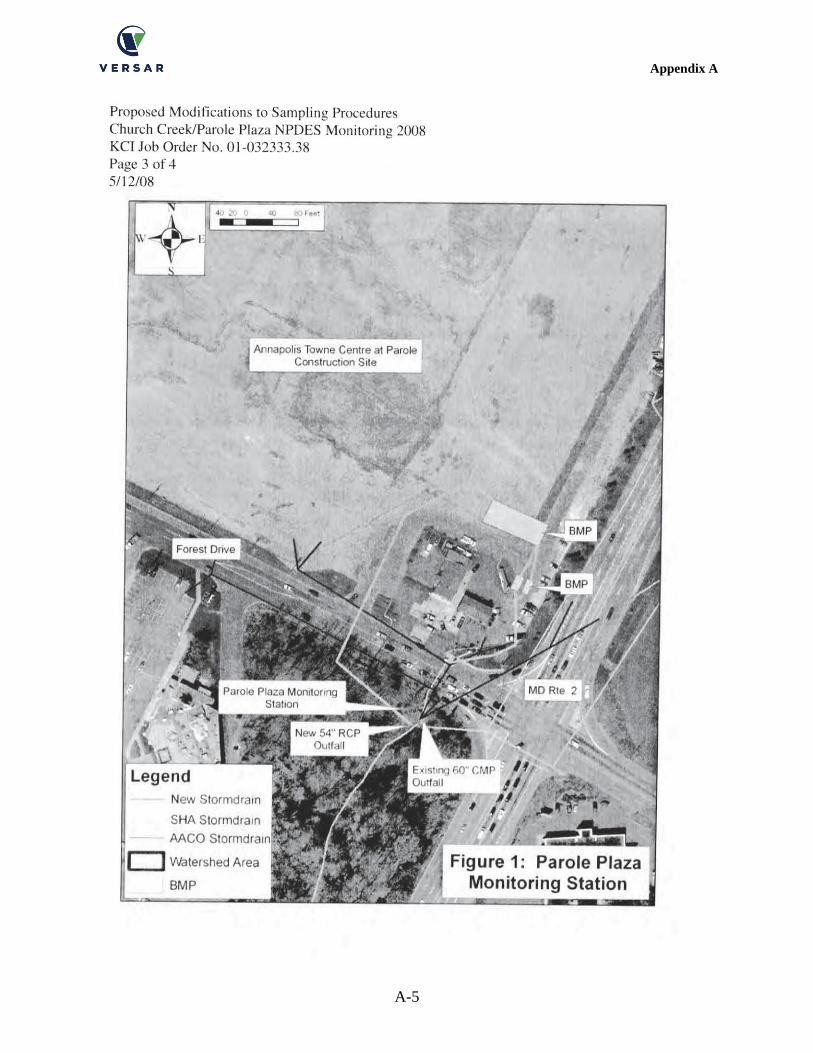
Appendix A
A-5
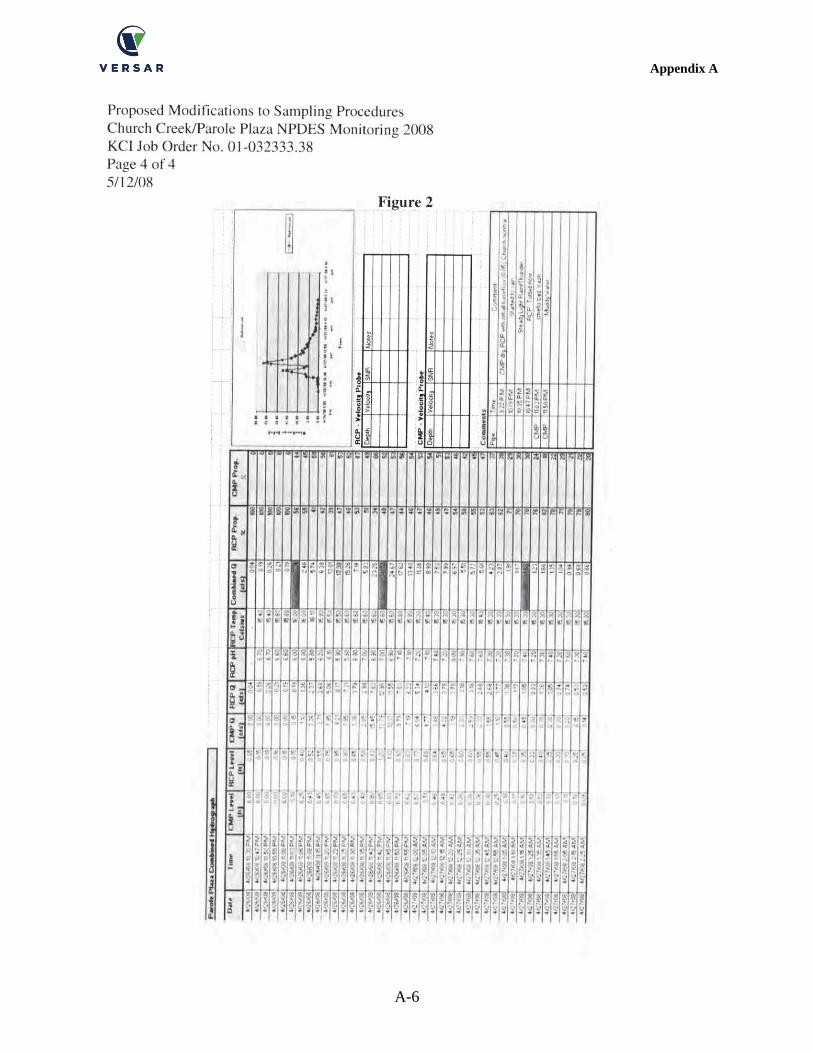
Appendix A
A-6
Appendix A
A-7
Storm Event Narratives
• July 28, 2016 - At Church Creek, only four of the parameter EMCs were greater than the
average concentrations of the storms captured since December 12, 2012. The EMC of
BOD exceeded its long-term historical average by 142%, which included a peak limb
concentration of 20 mg/L. The other three parameter EMCs (total Kjeldahl nitrogen,
nitrate-nitrite, and lead) exceeded their historical average values for storm runoff by
smaller percentages. Zinc had high concentrations during the rising limb (217 μg/L) and
peak limb (122 μg/L) of this storm, however neither concentration exceeded the threshold
to trigger reanalysis by the laboratory. Three of the parameter EMCs at Parole Plaza
during the storm were greater than the corresponding average concentrations of the
storms captured since December 12, 2012. The EMCs of BOD total Kjeldahl nitrogen,
and zinc exceeded their historical averages by 46%, 29.8%, and 3.3%, respectively. The
rising limb concentrations of BOD (25 mg/L) and total Kjeldahl nitrogen (2.7 mg/L) were
the cause of above-average EMCs for this storm. Individual zinc concentrations were
higher than the long-term average during the rising and peak limbs; however, the EMC
was generally comparable to the historical average value.
• September 19, 2016 Storm - At Church Creek, field staff inadvertently transferred sample
water into the incorrect set of bottles. Field staff went back to the site, and poured the
remaining volume into the correct sample bottles, but there was insufficient volume to
analyze for hardness. At Church Creek, three parameter EMCs were greater than the
average concentrations of the storms captured since December 12, 2012: TSS (41.9%),
lead (61.7%), and E. coli (132.9%). The higher than average EMCs for TSS and E.coli
resulted from the higher than average sample concentrations during the rising and peak,
and all three limbs, respectively. For lead, the concentrations during each limb were
comparable to each other, but were all above the long-term average. At Parole Plaza,
field staff noted an oily odor coming from the CMP during the event. The EMCs of only
two parameters, TSS (9.0%) and total phosphorus (30.4%), were greater than the
corresponding average concentrations of the storms captured since December 12, 2012.
Total phosphorus and TSS concentrations during the rising and peak limbs were higher
than the applicable long-term averages and contributed to the overall higher EMC values.
No concentrations of these analytes triggered reanalysis by the laboratory.
• September 27, 2016 Storm - Total Kjeldahl nitrogen, TSS, lead, and E. coli EMCs were
greater than the average concentrations of the storms captured since December 12, 2012
at Church Creek. The EMC for E.coli was greater than the corresponding historical
average by 194%. During the rising limb, the E. coli concentration was 91,000 MPN,
which was the highest concentration recorded during the last four years of sampling at
Church Creek. The total phosphorus EMC was similar to the historical average value.
Similar to Church Creek, the E. coli EMC at Parole Plaza was higher than the average
concentration of storms captured since December 12, 2012. However, individual limb
concentrations did not include record concentrations as was the case at Church Creek.
The total Kjeldahl nitrogen EMC was similar to (i.e., 4.5% higher than) the historical
average value.
Appendix A
A-8
• November 9, 2017 - Six of the parameter EMCs were greater than the long-term average
concentrations of the storms captured since December 12, 2012, at Church Creek. The
EMCs for total Kjeldahl nitrogen (TKN), nitrate-nitrite, total phosphorus, and hardness
exceeded their long-term historical averages by over 100%. The rising limb concentra-
tions for these parameters were possibly the main factor in the above-average EMCs for
this storm. At Parole Plaza, five of the parameter EMCs during the storm were greater
than the corresponding average concentrations of the storms captured since December 12,
2012. The EMCs of BOD, TKN, total phosphorus, and zinc exceeded their historical
averages by a small percentage. The unusual high concentrations of lead during all three
limbs at Parole Plaza and the blank samples caused doubt in the results therefore they
have been removed from the EMC spreadsheet for both sites. Also during this storm
event, field staff noticed the smell of cooking oil coming from the RCP.
• November 29, 2016 Storm - Because October and November were very dry months with
a total rainfall of only 2.8 inches, this storm was accepted by Anne Arundel County even
though it did not meet the 0.1” minimum rainfall requirement. At Church Creek, only two
parameter EMCs were greater than the average concentrations of the storms captured
since December 12, 2012: nitrate-nitrite (56.3%), and total phosphorus (108.6%). The
higher than average EMC for total phosphorus resulted from the higher than average
sample concentration during the peak limb. The individual concentration of 2.60 mg/L
for total phosphorus during the peak limb was the highest since December 12, 2012.
During this storm event, at Parole Plaza a large amount of leaves flowed through the
RCP, and affected the measured level and the EMCs calculations; therefore no EMC
calculations were completed for this storm at Parole Plaza. During the storm, field staff
continually cleared the leaves from the RCP to maintain accurate flow measurements.
Concentrations of TPH, zinc and BOD during the rising and peak limbs were higher than
the detection limit. The E. coli concentration was very high during the peak limb.
• December 6, 2016 Storm - None of the parameter EMCs were greater than the average
concentrations of the storms captured since December 12, 2012 at both stations. At
Church Creek, most concentrations were higher during the peak limb than the rising and
falling limbs, but were not high enough to cause EMCs to exceed long-term averages. At
Parole Plaza, the rising limb concentrations of most parameters were higher than the peak
and falling limbs. None of the individual concentrations during this event were identified
as a concern.
• January 23, 2017 Storm – At Church Creek, five of the parameter EMCs were greater
than the long-term average concentrations of the storms captured since December 12,
2012. The EMCs for total metals (copper, lead, and zinc) exceeded their long-term
historical averages by over 100%. The highest concentrations of metals during this event
occurred during the peak limb. The TSS EMC exceeded its long-term historical average
(by less than 25%), which may have contributed to the higher than average
concentrations of the metals. At Parole Plaza, EMCs for the same five parameters as
Church Creek, plus phosphorus, were greater than the corresponding average
concentrations of the storms captured since December 12, 2012. The TSS and lead EMCs
exceeded their historical averages by over 100%. Maximum concentrations for both
Appendix A
A-9
parameters occurred during the peak limb. During this storm event, field staff noticed that
the water discharging from the pipes was gray and smelled like gasoline and oil;
however, TPH results were below detection limits.
• February 28, 2017 Storm - At Church Creek, all parameter EMCs were less than the
average concentrations of the storms captured since December 12, 2012. During this
event, duplicate samples were collected at Church Creek during the falling limb. All of
the results were within 20% of each other. At Parole Plaza, the EMC of only one
parameter (TPH) was greater (69.8%) than the corresponding average concentration of
the storms captured since December 12, 2012. Specifically, concentrations of TPH during
the rising and peak limbs were higher than the detection limit. During this storm, the field
crew inadvertently failed to program the In-situ sonde to record pH from the CMP;
therefore, the pH readings on the EMC spreadsheet are only from the RCP for this event.
• March 31, 2017 Storm - During the March 31, 2017 event, the copper EMC was greater
than the average concentration of the storms captured since December 12, 2012 at Church
Creek, but only by 7.5%. Concentrations of copper were higher than the detection limit
during all three limbs which contributed to the overall higher EMC value, but none
exceeded concentrations that would be considered a concern. During this storm, at Parole
Plaza, the same parameters from the January 23, 2017 storm had greater EMCs than the
corresponding average concentrations of the storms captured since December 12, 2012.
Total phosphorus, TSS, copper, lead, zinc, and hardness exceeded their historical
averages by 6.3% to 34.1%.
• April 25, 2017 - During this storm event, E. coli samples were now being analyzed by
new laboratory (Water Testing Labs of Maryland). Since it was the first time analyzing
the E. coli samples they were not aware that the samples needed to be diluted; therefore,
none of the samples were diluted and none of results were included in the EMC
calculations. At Church Creek, the only parameter EMC that was greater than the average
concentrations of storms captured since December 12, 2012 was copper. The EMC of
copper was greater than the corresponding historical averages by 32.8%. At Parole Plaza,
five parameter EMCs (TKN, total phosphorus, copper, zinc, and TPH were greater than
the average concentrations of the storms captured since December 12, 2012. The
parameters greater than the corresponding historical averages ranged between 12.85 to
52.7%. The TPH concentration was 7 mg/L during the rising and peak limb of the storm
event causing the EMC to increase.
• May 12, 2017 - None of parameter EMCs were greater than the average concentrations of
the storms captured since December 12, 2012 at both stations. None of the parameter
concentrations were unusually high or stood out as a problem at either station.
• June 19, 2017 - At Church Creek, six parameter EMCs were greater than the average
concentrations of the storms captured since December 12, 2012. EMCs for BOD, TSS,
copper, lead, zinc and E. coli were greater than the corresponding historical averages by
18.5% to 226.2%. The concentration of metals were elevated during the rising limb
which contributed to the higher EMCs; have been requested to be reanalyzed by the
Appendix A
A-10
Martel along with TPH because they are over their parameter threshold for the laboratory.
Copper, zinc, and TPH EMCs were also greater than the average concentrations of the
storms captured since December 12, 2012 at Parole Plaza which can be explained by high
concentrations during the rising limb. The EMC for TPH was greater than the
corresponding historical averages by 420.7%. All of these parameters have been
requested to be reanalyzed as well.
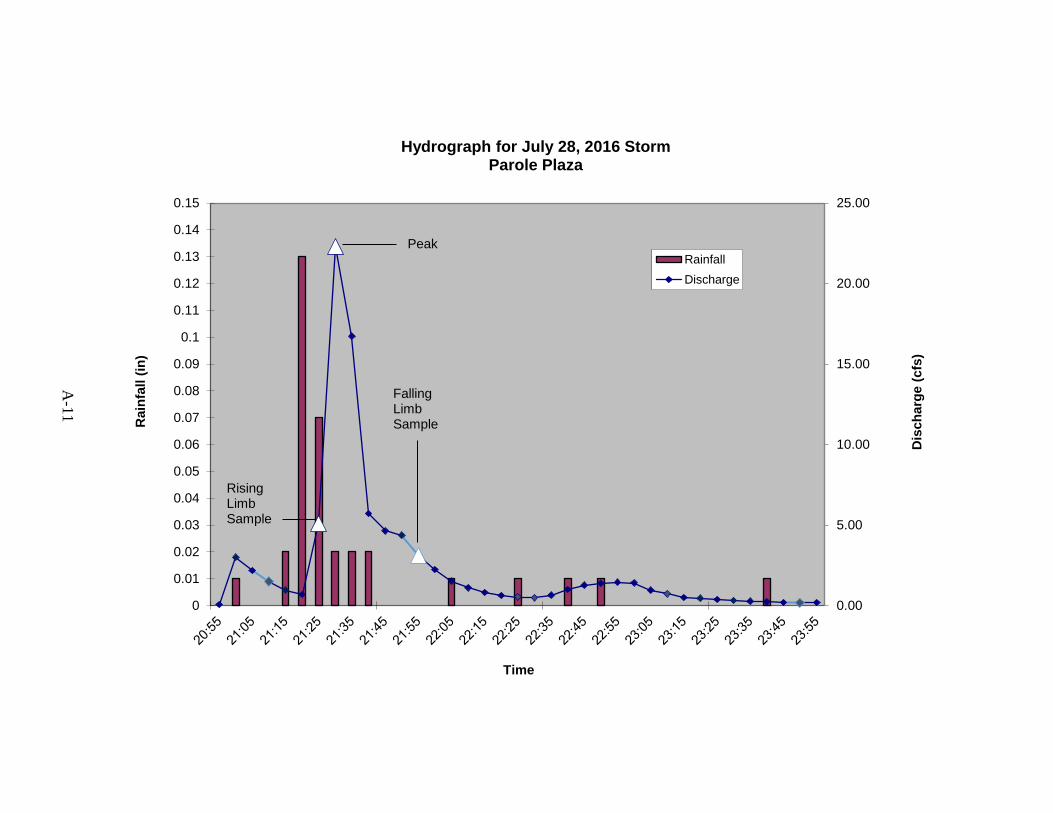
A-1
1
0.00
5.00
10.00
15.00
20.00
25.00
0
0.01
0.02
0.03
0.04
0.05
0.06
0.07
0.08
0.09
0.1
0.11
0.12
0.13
0.14
0.15
Dis
ch
arg
e (
cfs
)
Rain
fall (
in)
Time
Hydrograph for July 28, 2016 Storm Parole Plaza
Rainfall
Discharge
Peak
Rising Limb Sample
Falling Limb Sample

A-1
2
0.00
20.00
40.00
60.00
80.00
100.00
120.00
0
0.05
0.1
0.15
0.2
0.25
0.3
0.35
0.4
Dis
ch
arg
e (
cfs
)
Rain
fall (
in)
Time
Hydrograph for September 19, 2016 Storm Parole Plaza
Rainfall
Discharge
Peak
Rising Limb Sample
Falling Limb Sample
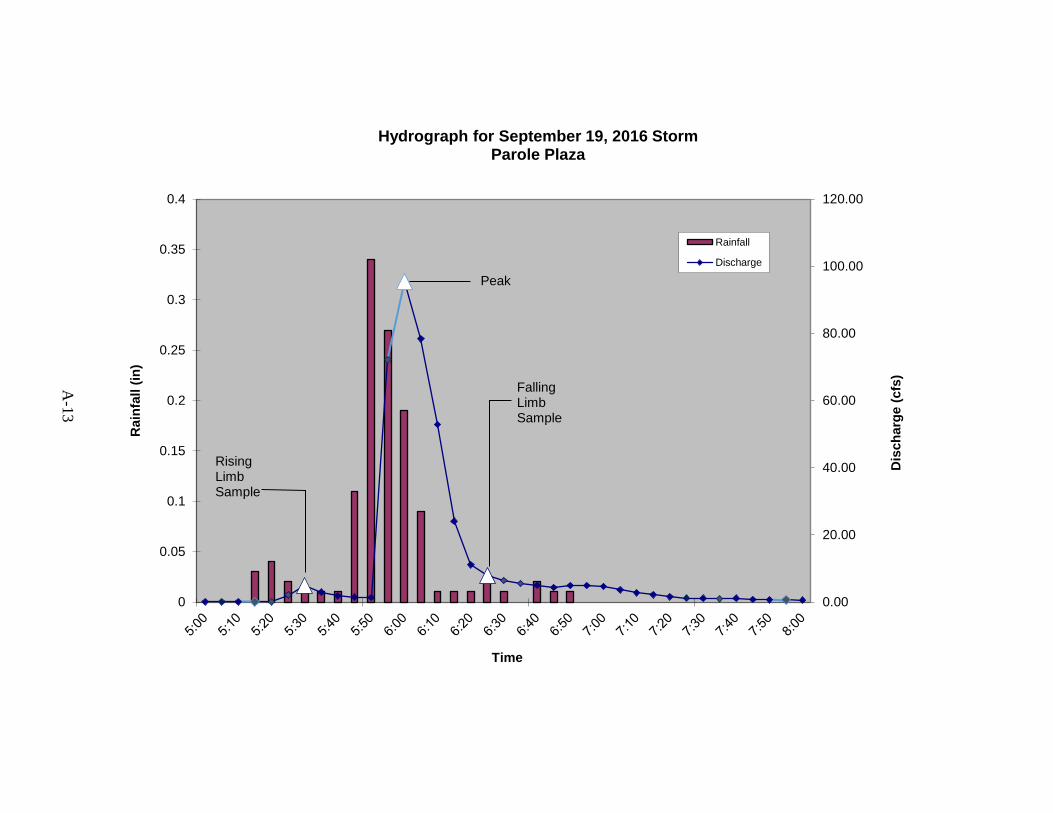
A-1
3
0.00
20.00
40.00
60.00
80.00
100.00
120.00
0
0.05
0.1
0.15
0.2
0.25
0.3
0.35
0.4
Dis
ch
arg
e (
cfs
)
Rain
fall (
in)
Time
Hydrograph for September 19, 2016 Storm Parole Plaza
Rainfall
Discharge
Peak
Rising Limb Sample
Falling Limb Sample
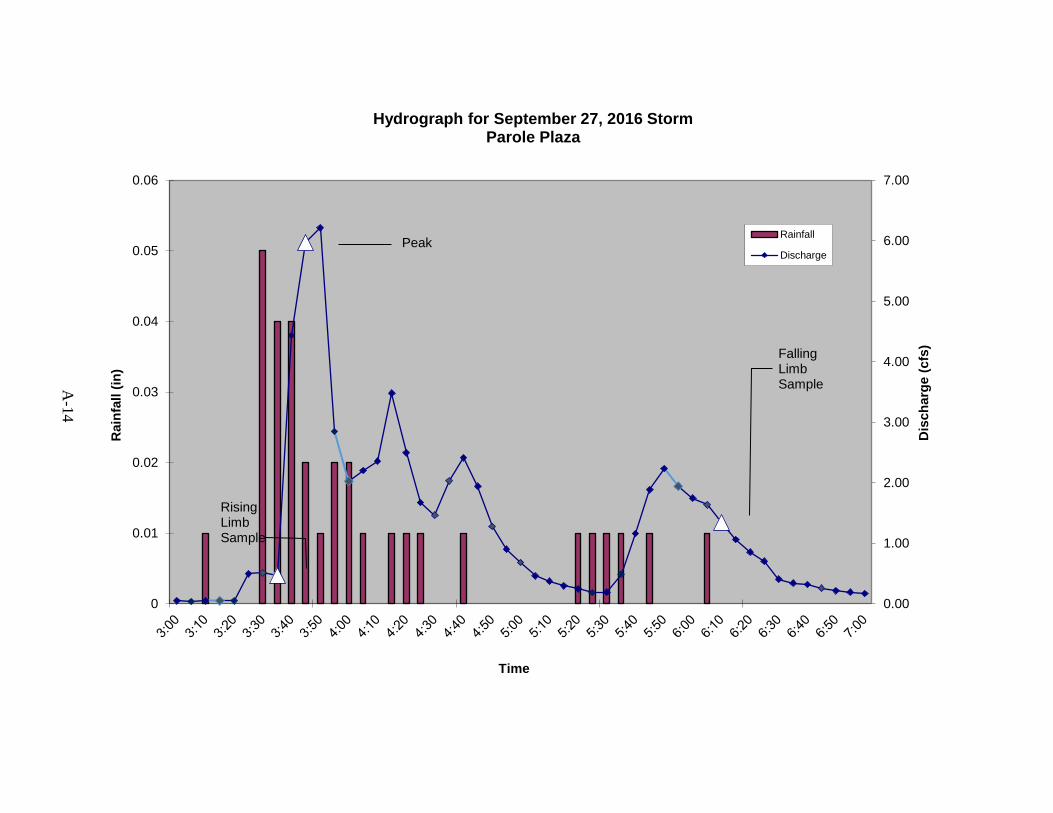
A-1
4
0.00
1.00
2.00
3.00
4.00
5.00
6.00
7.00
0
0.01
0.02
0.03
0.04
0.05
0.06
Dis
ch
arg
e (
cfs
)
Rain
fall (
in)
Time
Hydrograph for September 27, 2016 Storm Parole Plaza
Rainfall
DischargePeak
Rising Limb Sample
Falling Limb Sample
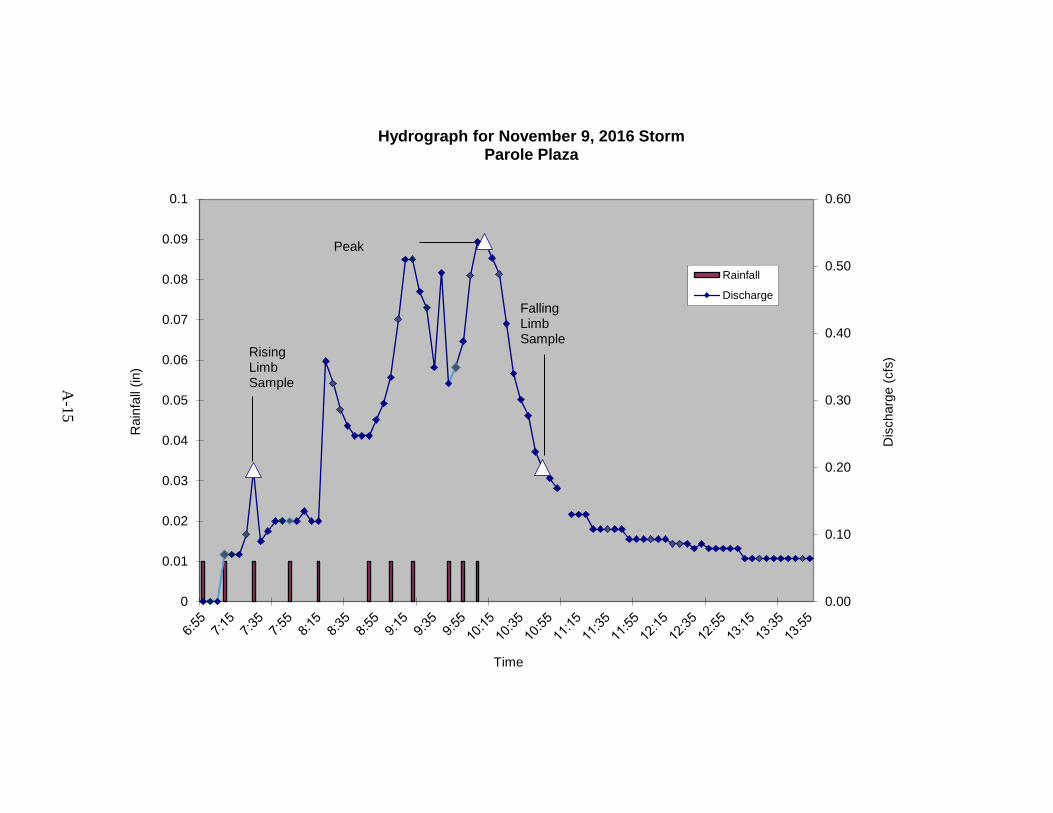
A-1
5
0.00
0.10
0.20
0.30
0.40
0.50
0.60
0
0.01
0.02
0.03
0.04
0.05
0.06
0.07
0.08
0.09
0.1
Dis
charg
e (
cfs
)
Rain
fall
(in)
Time
Hydrograph for November 9, 2016 Storm Parole Plaza
Rainfall
Discharge
Peak
Rising Limb Sample
Falling Limb Sample
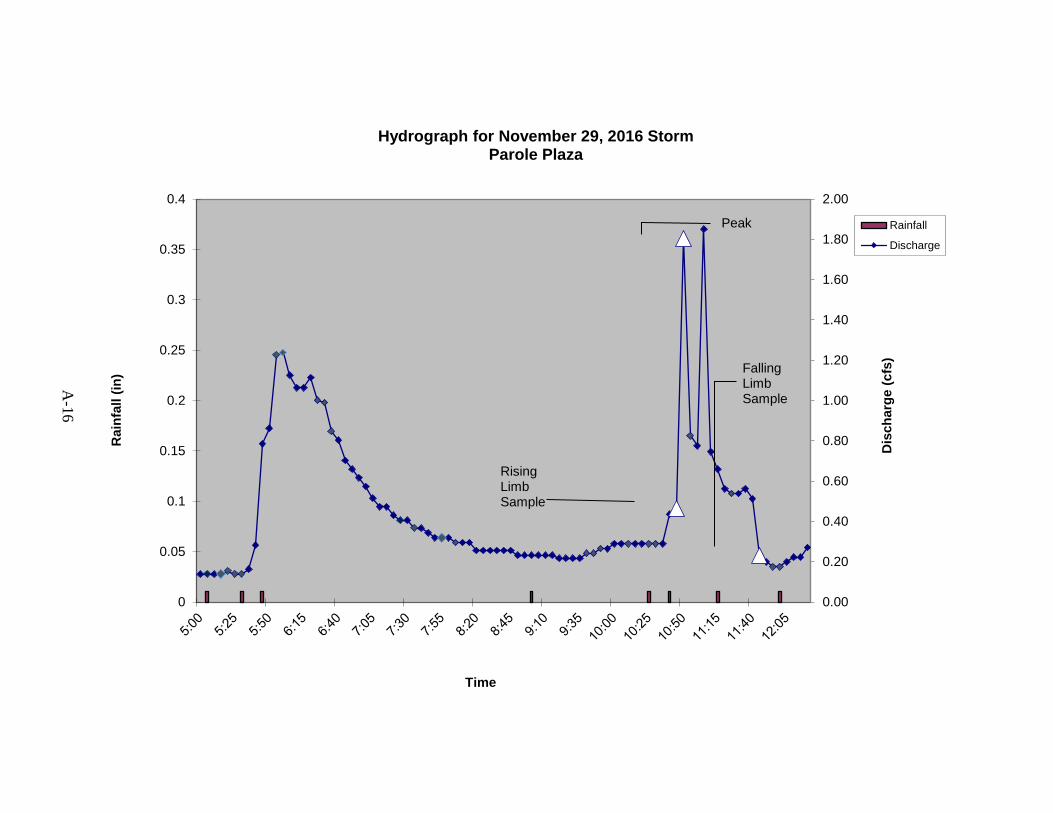
A-1
6
0.00
0.20
0.40
0.60
0.80
1.00
1.20
1.40
1.60
1.80
2.00
0
0.05
0.1
0.15
0.2
0.25
0.3
0.35
0.4
Dis
ch
arg
e (
cfs
)
Rain
fall (
in)
Time
Hydrograph for November 29, 2016 Storm Parole Plaza
Rainfall
Discharge
Peak
Rising Limb Sample
Falling Limb Sample
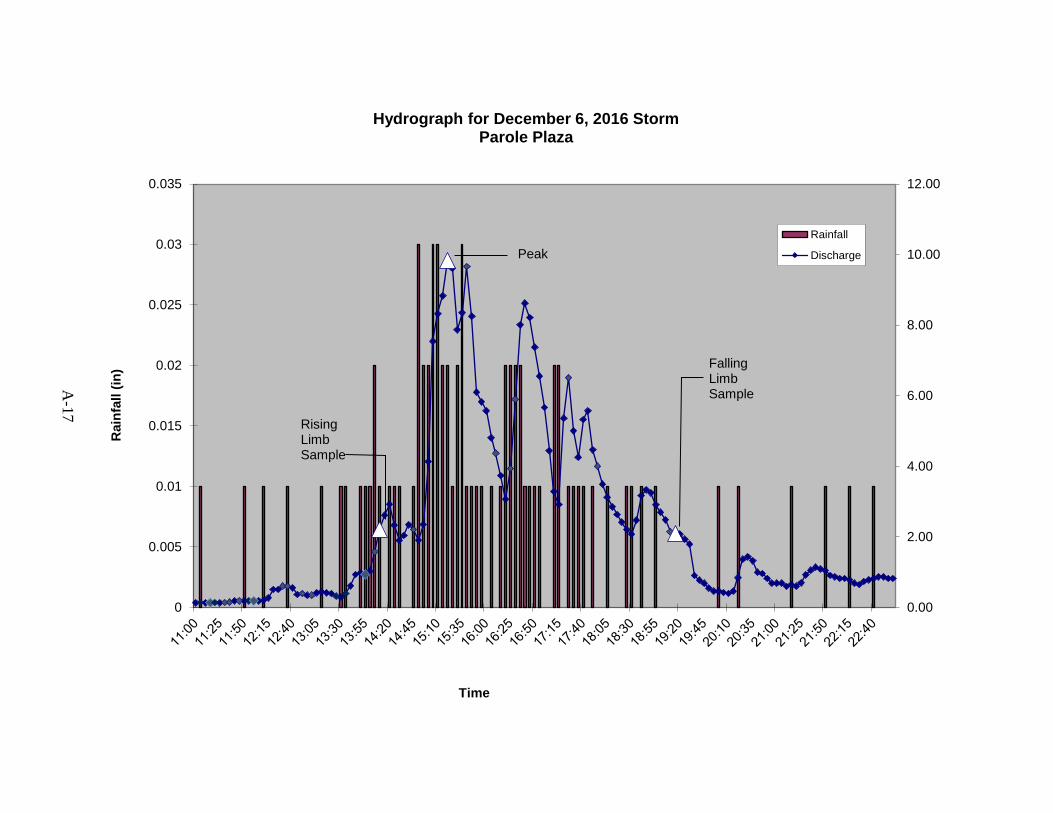
A-1
7
0.00
2.00
4.00
6.00
8.00
10.00
12.00
0
0.005
0.01
0.015
0.02
0.025
0.03
0.035
Rain
fall (
in)
Time
Hydrograph for December 6, 2016 Storm Parole Plaza
Rainfall
DischargePeak
Rising Limb Sample
Falling Limb Sample
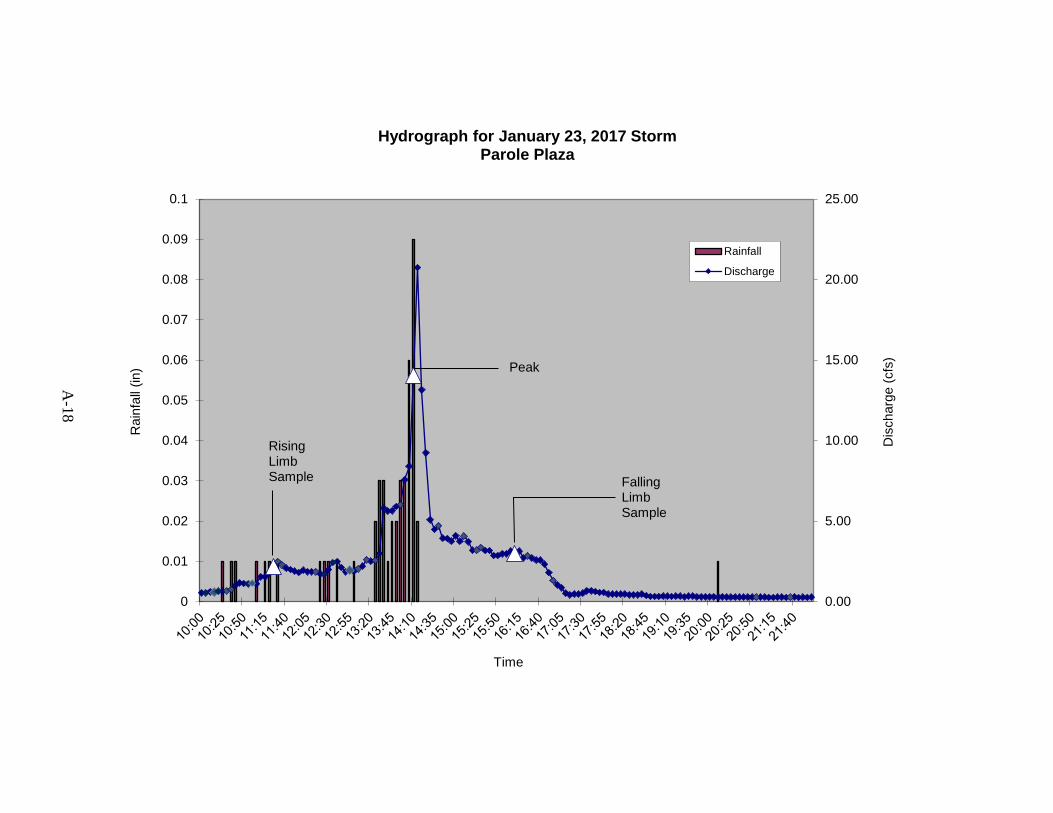
A-1
8
0.00
5.00
10.00
15.00
20.00
25.00
0
0.01
0.02
0.03
0.04
0.05
0.06
0.07
0.08
0.09
0.1
Dis
charg
e (
cfs
)
Rain
fall
(in)
Time
Hydrograph for January 23, 2017 Storm Parole Plaza
Rainfall
Discharge
Peak
Rising Limb Sample Falling
Limb Sample
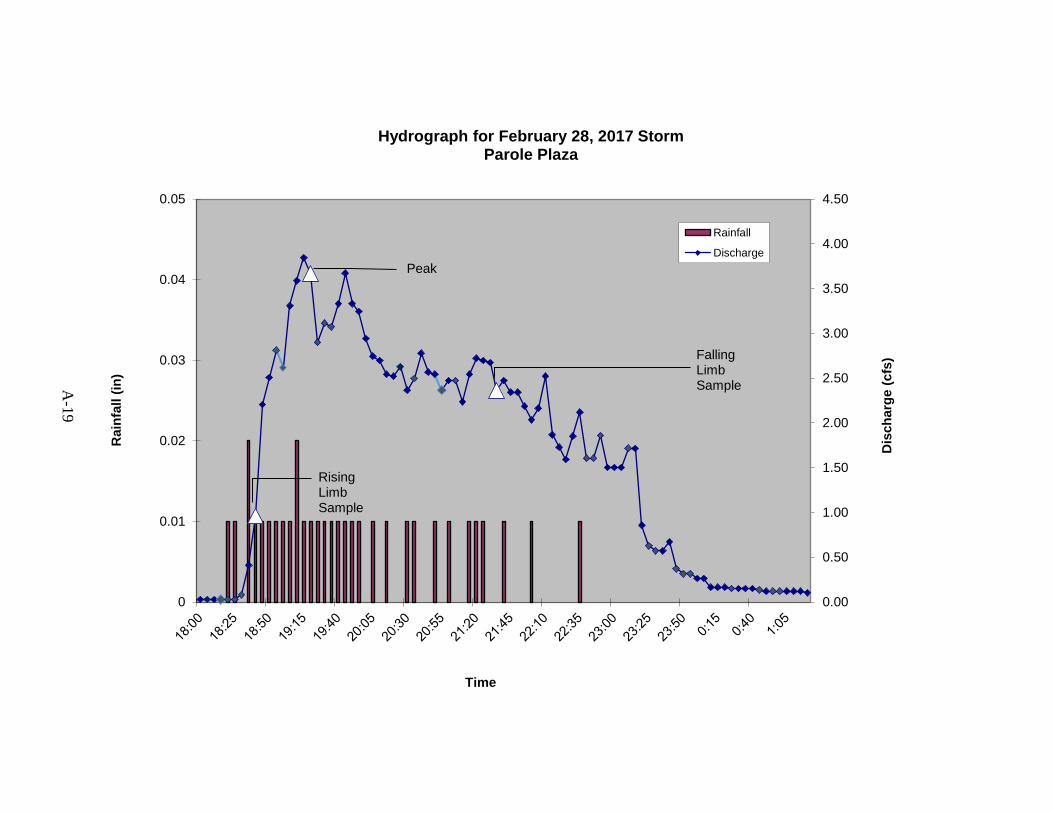
A-1
9
0.00
0.50
1.00
1.50
2.00
2.50
3.00
3.50
4.00
4.50
0
0.01
0.02
0.03
0.04
0.05
Dis
ch
arg
e (
cfs
)
Rain
fall (
in)
Time
Hydrograph for February 28, 2017 Storm Parole Plaza
Rainfall
Discharge
Peak
Rising Limb Sample
Falling Limb Sample
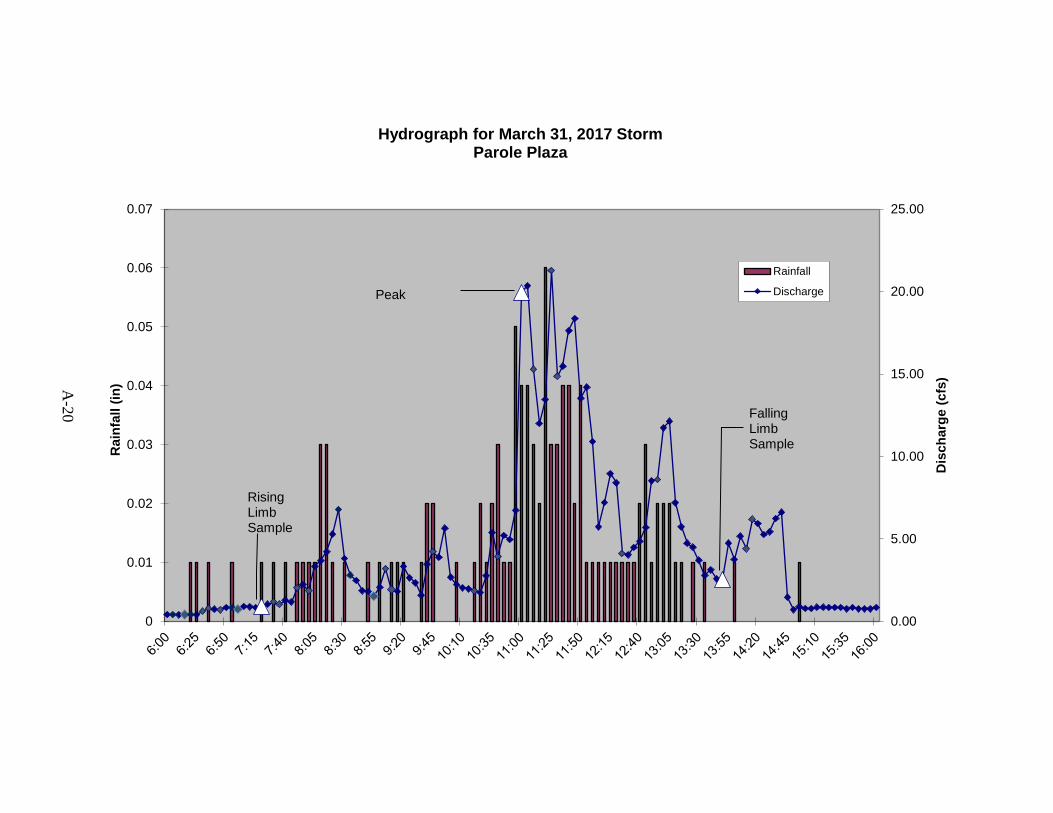
A-2
0
0.00
5.00
10.00
15.00
20.00
25.00
0
0.01
0.02
0.03
0.04
0.05
0.06
0.07
Dis
ch
arg
e (
cfs
)
Rain
fall (
in)
Hydrograph for March 31, 2017 Storm Parole Plaza
Rainfall
DischargePeak
Rising Limb Sample
Falling Limb Sample
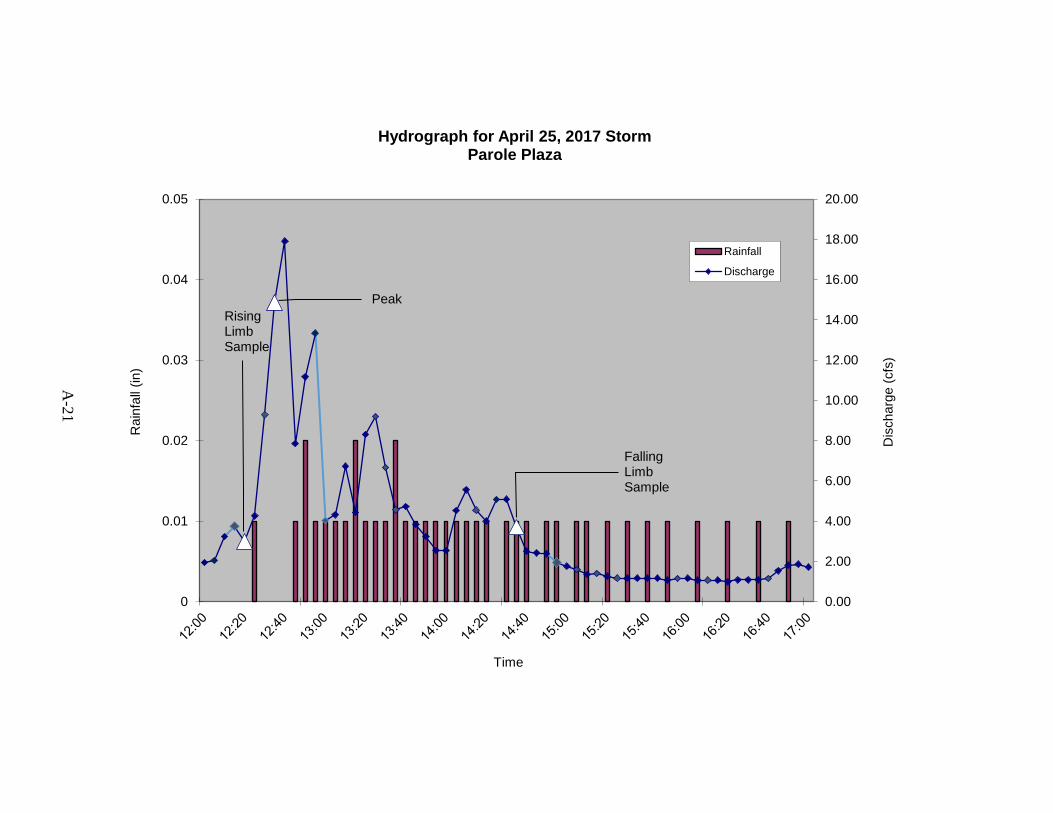
A-2
1
0.00
2.00
4.00
6.00
8.00
10.00
12.00
14.00
16.00
18.00
20.00
0
0.01
0.02
0.03
0.04
0.05
Dis
charg
e (
cfs
)
Rain
fall
(in)
Time
Hydrograph for April 25, 2017 Storm Parole Plaza
Rainfall
Discharge
Peak
Rising Limb Sample
Falling Limb Sample
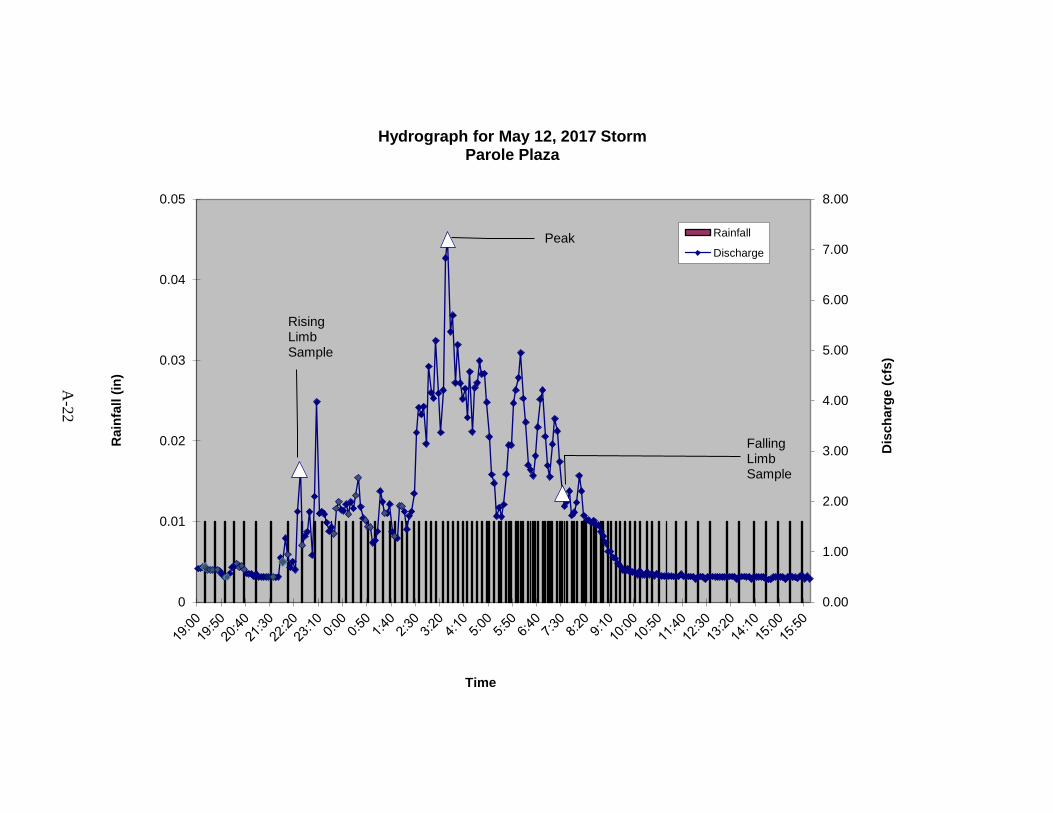
A-2
2
0.00
1.00
2.00
3.00
4.00
5.00
6.00
7.00
8.00
0
0.01
0.02
0.03
0.04
0.05
Dis
ch
arg
e (
cfs
)
Rain
fall (
in)
Time
Hydrograph for May 12, 2017 Storm Parole Plaza
Rainfall
Discharge
Peak
Rising Limb Sample
Falling Limb Sample
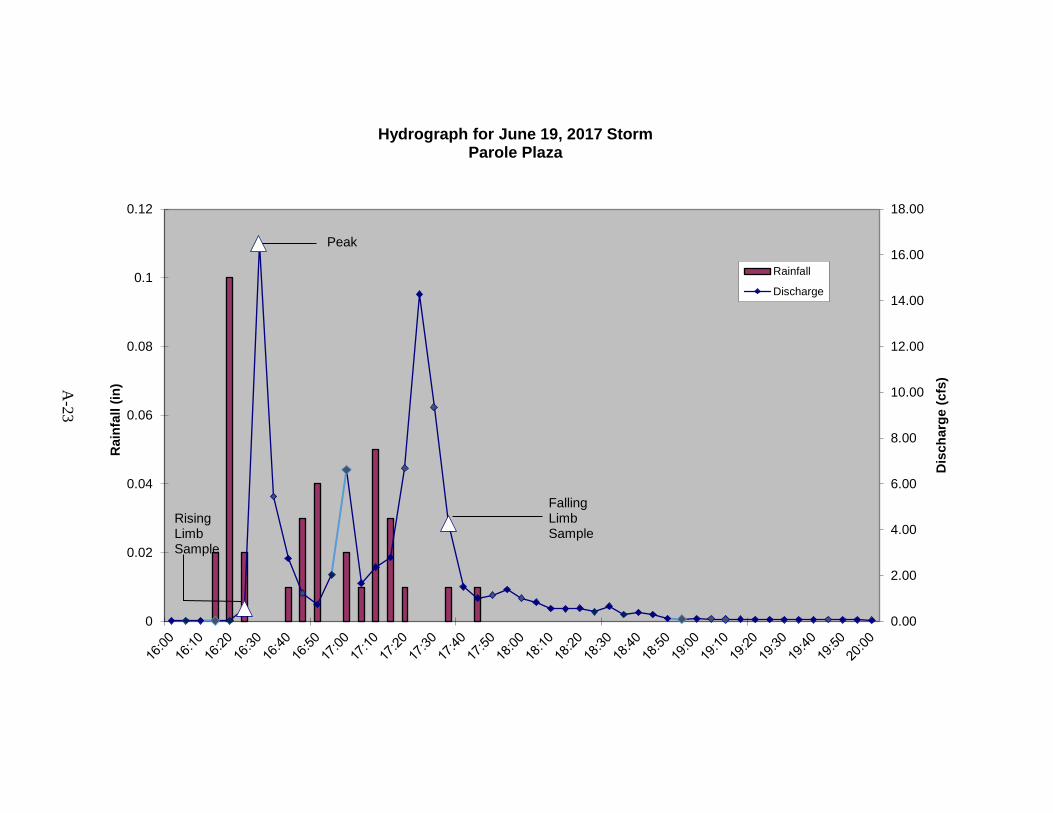
A-2
3
0.00
2.00
4.00
6.00
8.00
10.00
12.00
14.00
16.00
18.00
0
0.02
0.04
0.06
0.08
0.1
0.12
Dis
ch
arg
e (
cfs
)
Rain
fall (
in)
Hydrograph for June 19, 2017 Storm Parole Plaza
Rainfall
Discharge
Peak
Rising Limb Sample
Falling Limb Sample
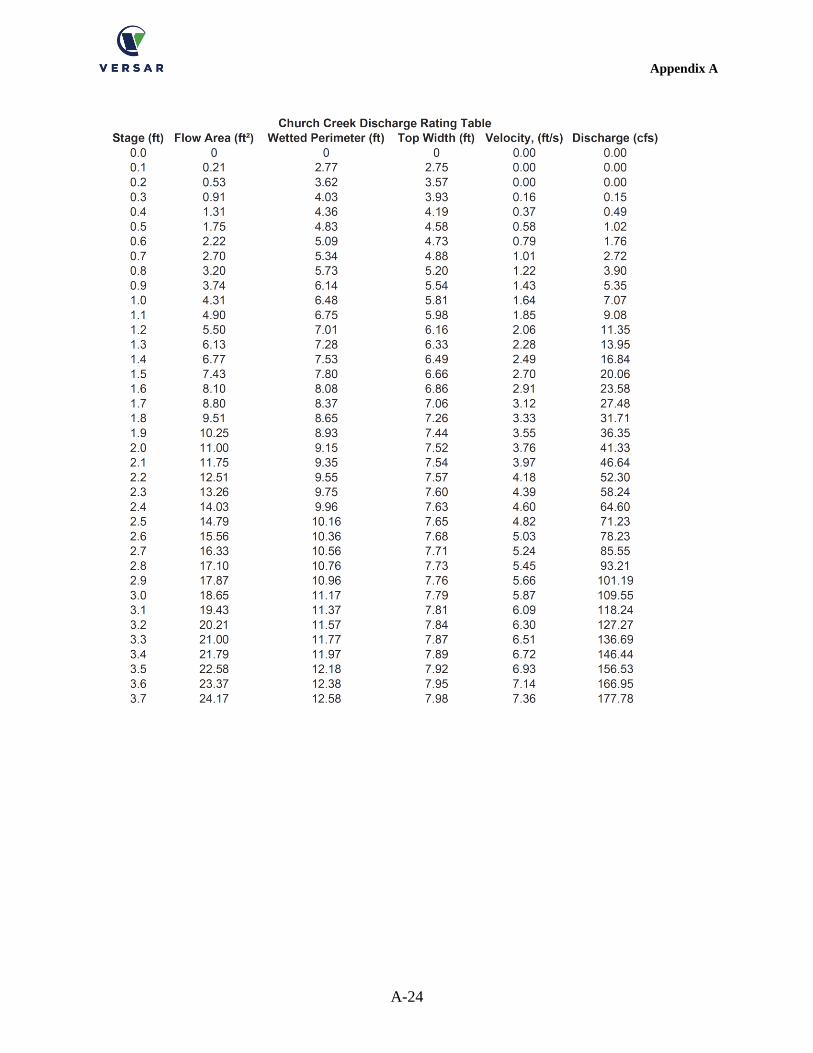
Appendix A
A-24
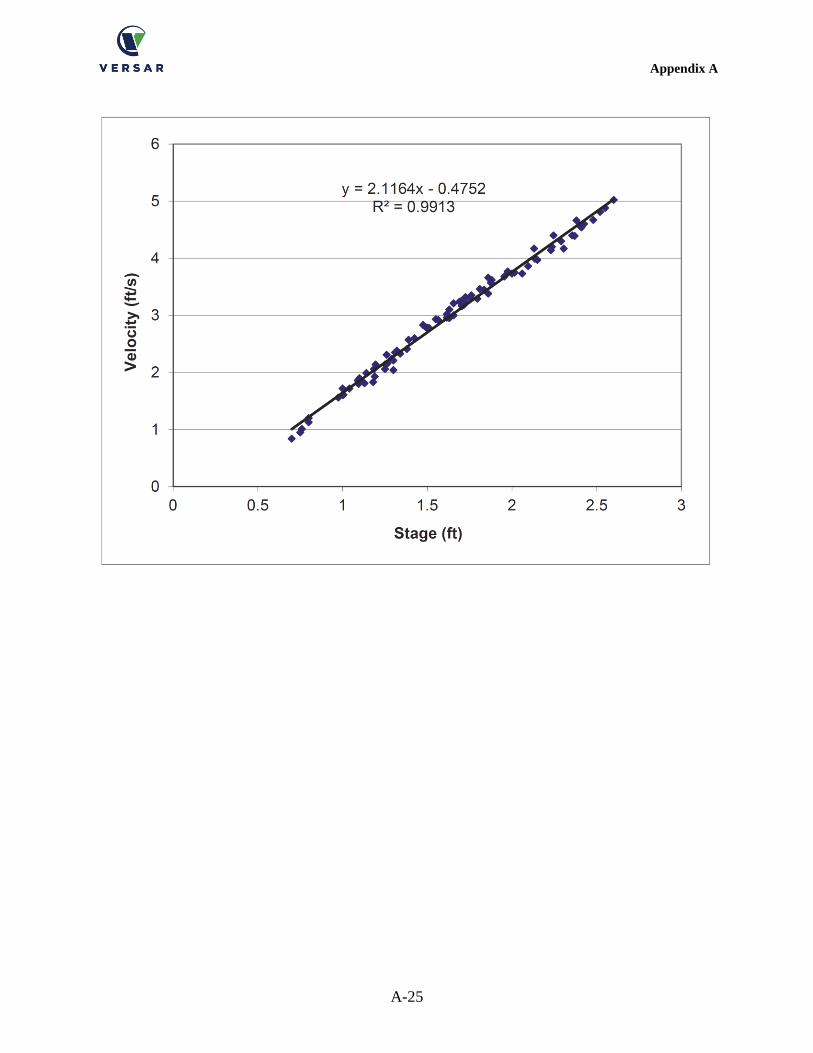
Appendix A
A-25
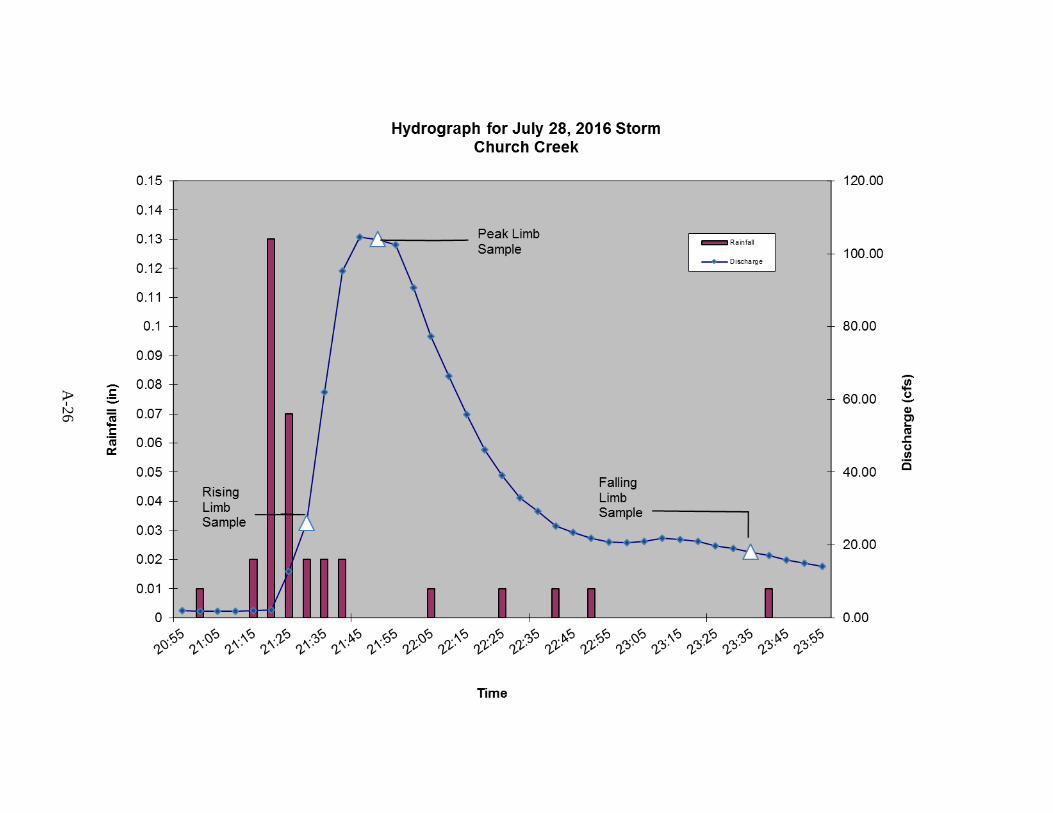
A-2
6
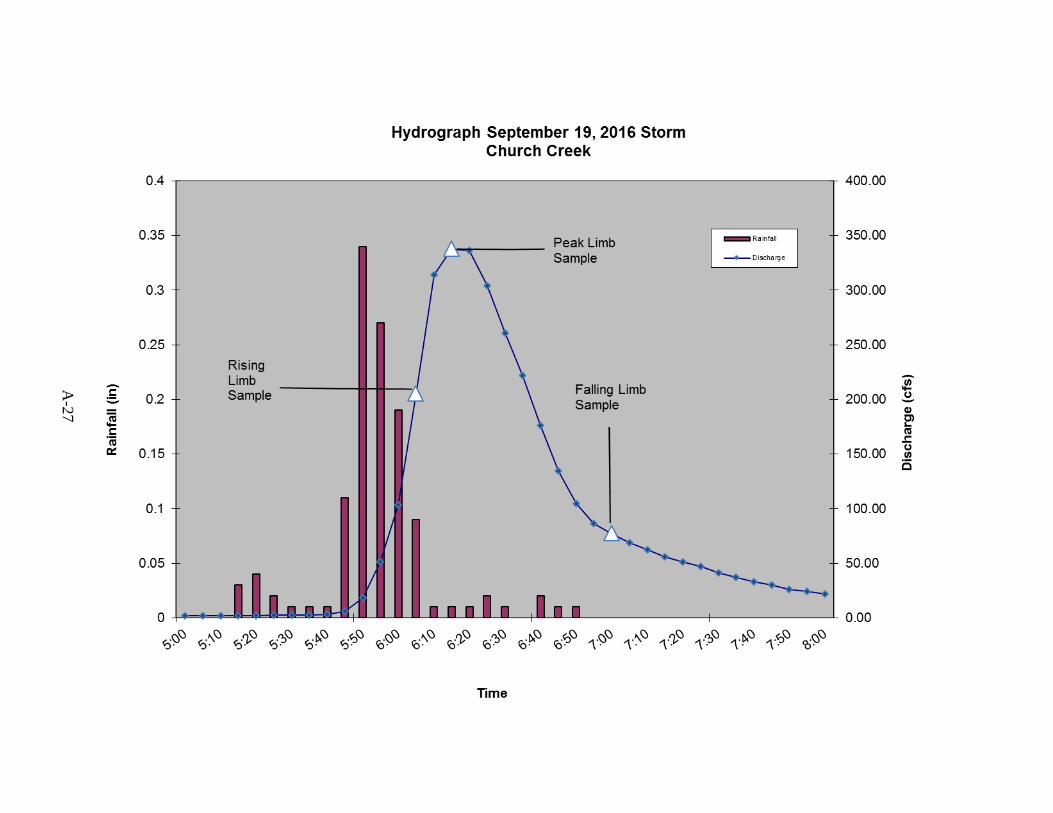
A-2
7
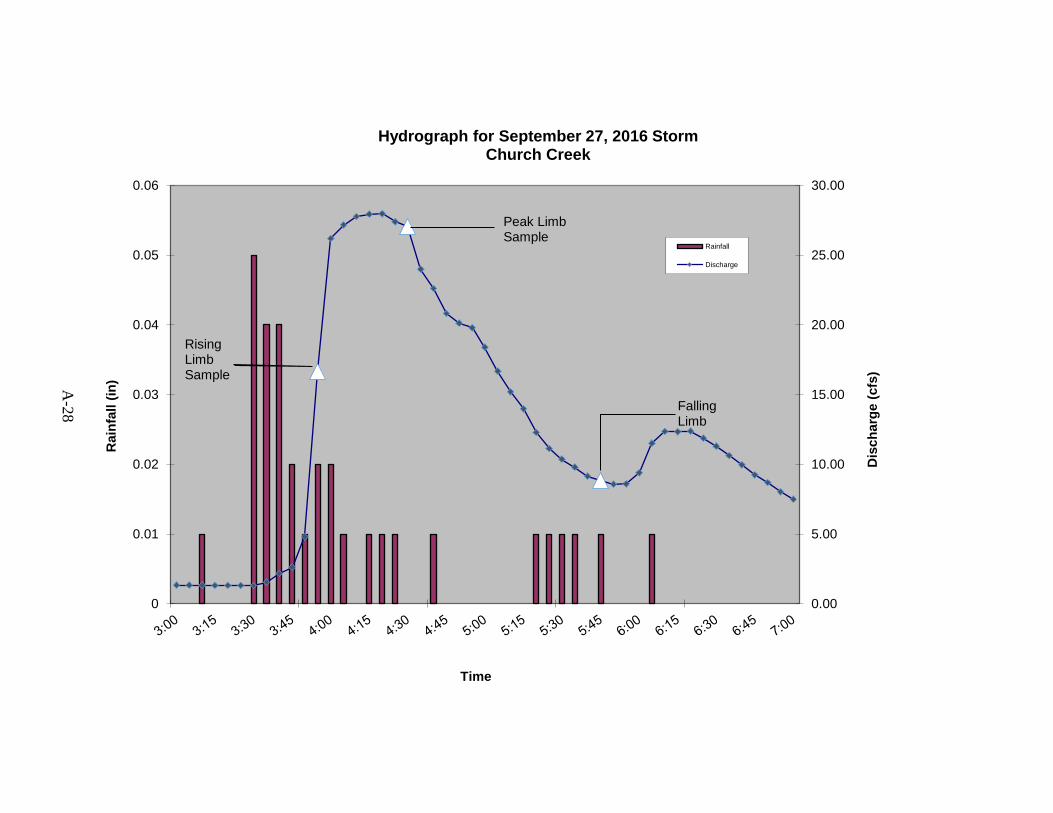
A-2
8
0.00
5.00
10.00
15.00
20.00
25.00
30.00
0
0.01
0.02
0.03
0.04
0.05
0.06
Dis
ch
arg
e (
cfs
)
Rain
fall (
in)
Time
Hydrograph for September 27, 2016 Storm Church Creek
Rainfall
Discharge
Rising Limb Sample
Falling Limb
Peak Limb Sample
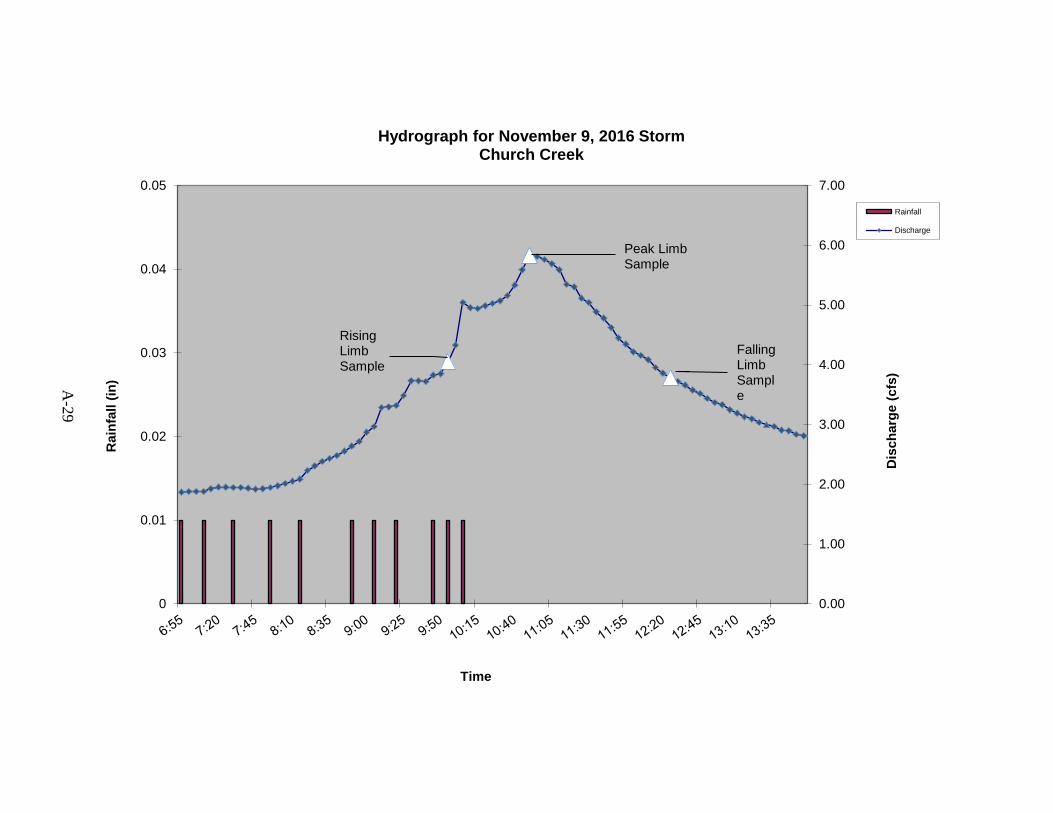
A-2
9
0.00
1.00
2.00
3.00
4.00
5.00
6.00
7.00
0
0.01
0.02
0.03
0.04
0.05
Dis
ch
arg
e (
cfs
)
Rain
fall (
in)
Time
Hydrograph for November 9, 2016 Storm Church Creek
Rainfall
Discharge
Rising Limb Sample
Falling Limb Sample
Peak Limb Sample
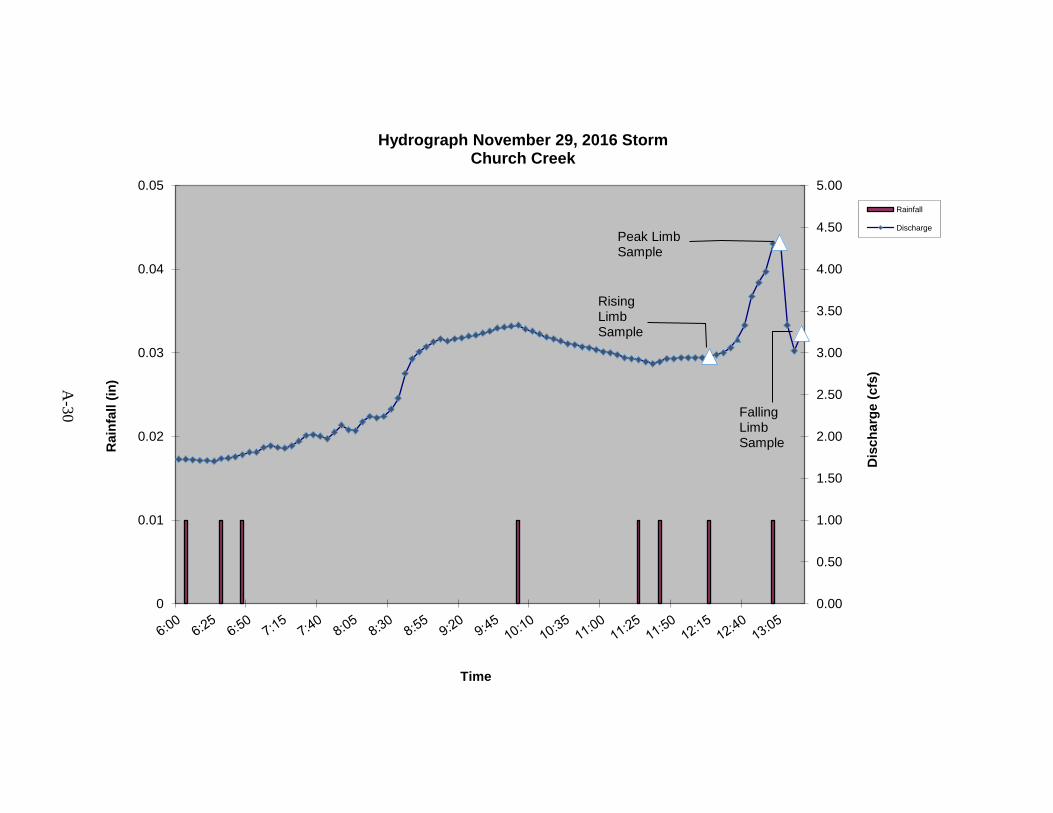
A-3
0
0.00
0.50
1.00
1.50
2.00
2.50
3.00
3.50
4.00
4.50
5.00
0
0.01
0.02
0.03
0.04
0.05
Dis
ch
arg
e (
cfs
)
Rain
fall (
in)
Time
Hydrograph November 29, 2016 Storm Church Creek
Rainfall
Discharge
Rising Limb Sample
Falling Limb Sample
Peak Limb Sample
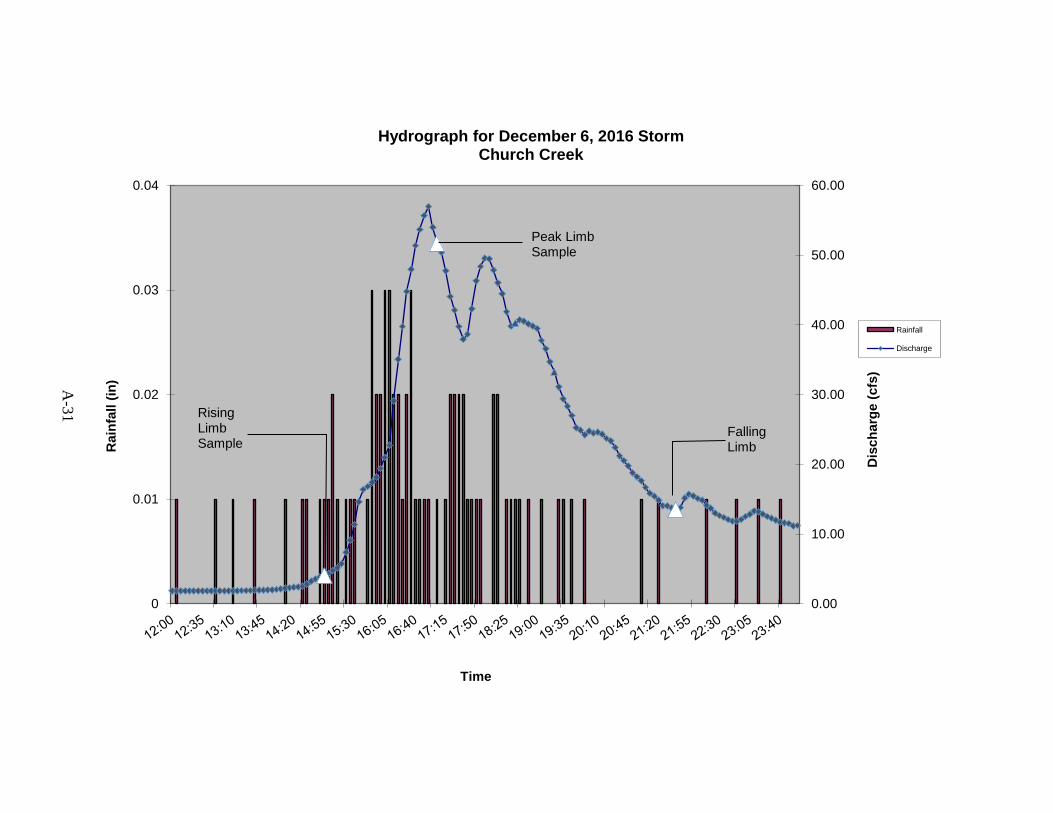
A-3
1
0.00
10.00
20.00
30.00
40.00
50.00
60.00
0
0.01
0.02
0.03
0.04
Dis
ch
arg
e (
cfs
)
Rain
fall (
in)
Time
Hydrograph for December 6, 2016 Storm Church Creek
Rainfall
Discharge
Rising Limb Sample
Falling Limb
Peak Limb Sample
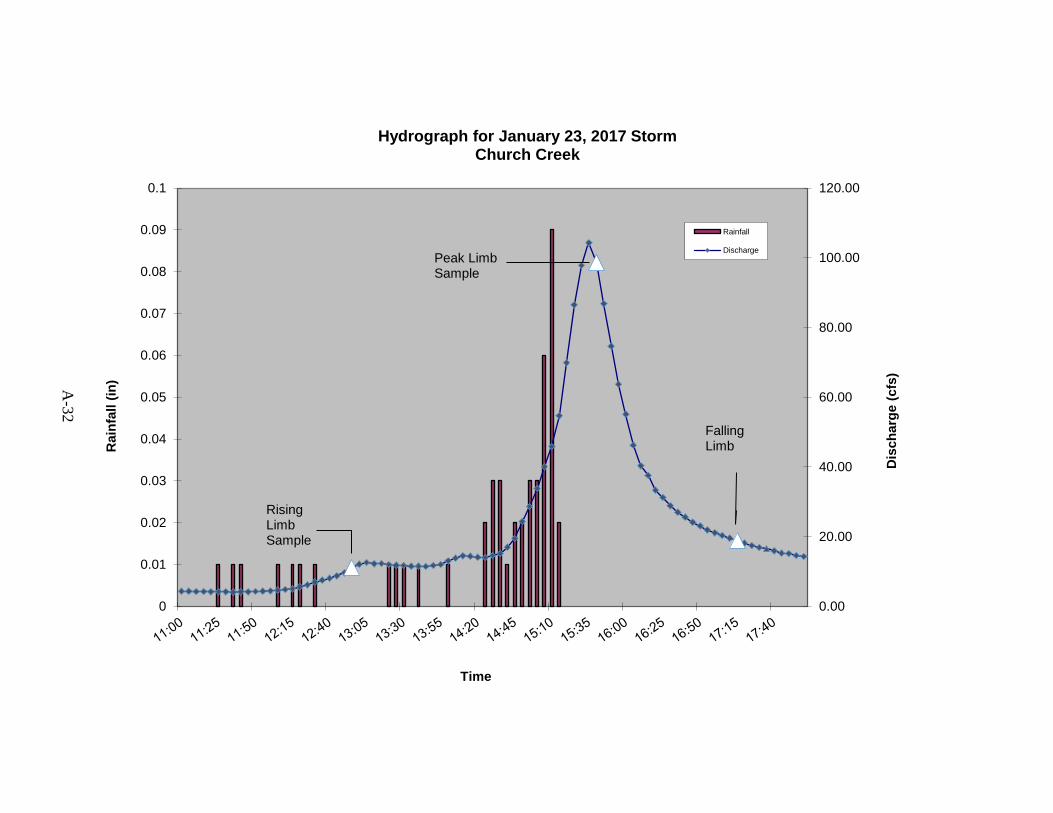
A-3
2
0.00
20.00
40.00
60.00
80.00
100.00
120.00
0
0.01
0.02
0.03
0.04
0.05
0.06
0.07
0.08
0.09
0.1
Dis
ch
arg
e (
cfs
)
Rain
fall (
in)
Time
Hydrograph for January 23, 2017 Storm Church Creek
Rainfall
Discharge
Rising Limb Sample
Falling Limb
Peak Limb Sample
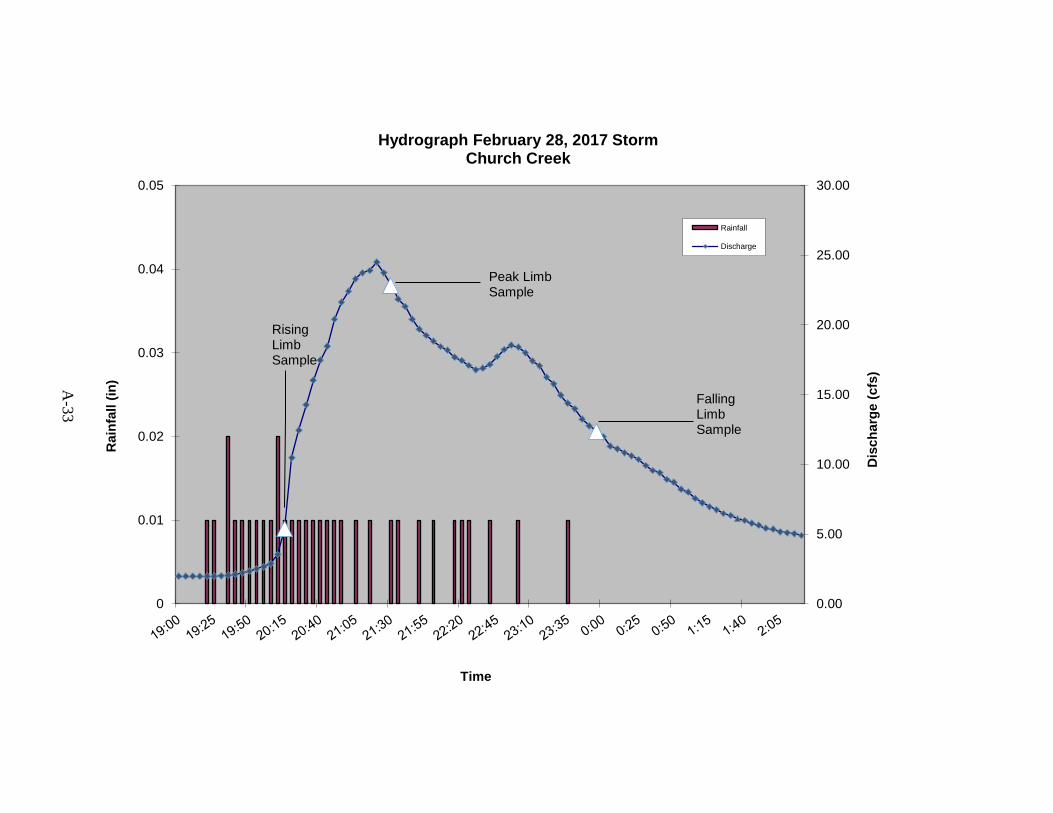
A-3
3
0.00
5.00
10.00
15.00
20.00
25.00
30.00
0
0.01
0.02
0.03
0.04
0.05
Dis
ch
arg
e (
cfs
)
Rain
fall (
in)
Time
Hydrograph February 28, 2017 Storm Church Creek
Rainfall
Discharge
Rising Limb Sample
Falling Limb Sample
Peak Limb Sample
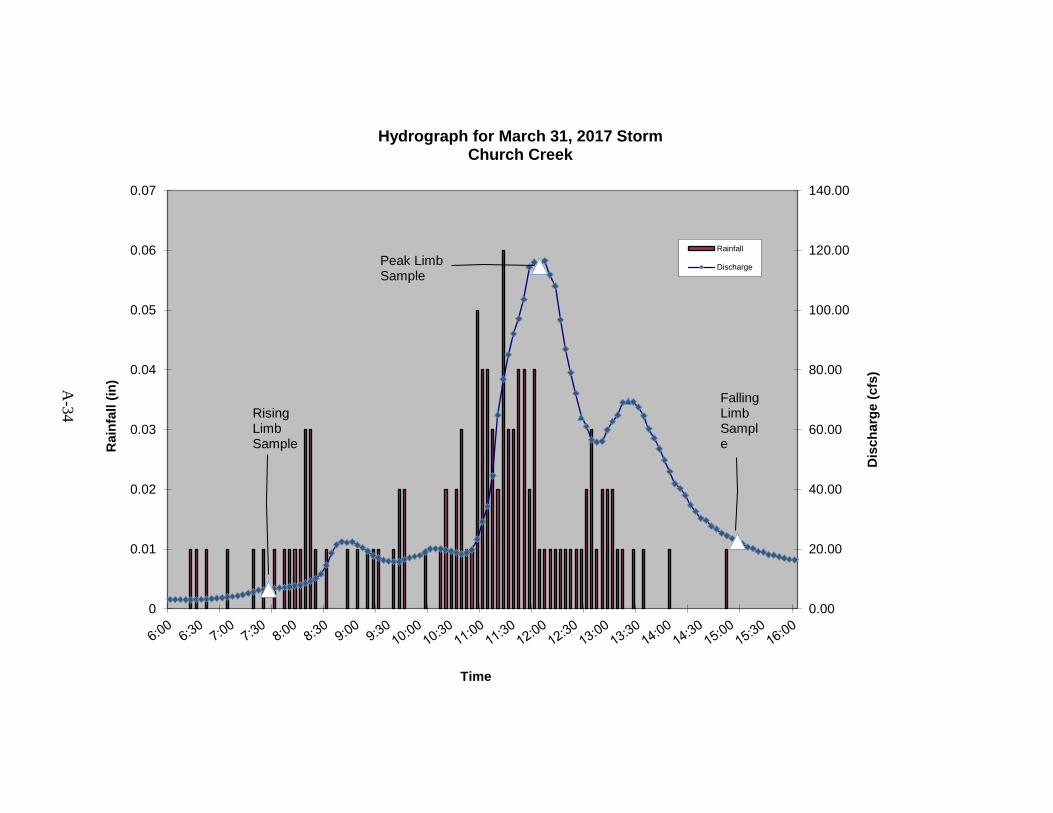
A-3
4
0.00
20.00
40.00
60.00
80.00
100.00
120.00
140.00
0
0.01
0.02
0.03
0.04
0.05
0.06
0.07
Dis
ch
arg
e (
cfs
)
Rain
fall (
in)
Time
Hydrograph for March 31, 2017 Storm Church Creek
Rainfall
Discharge
Rising Limb Sample
Falling Limb Sample
Peak Limb Sample
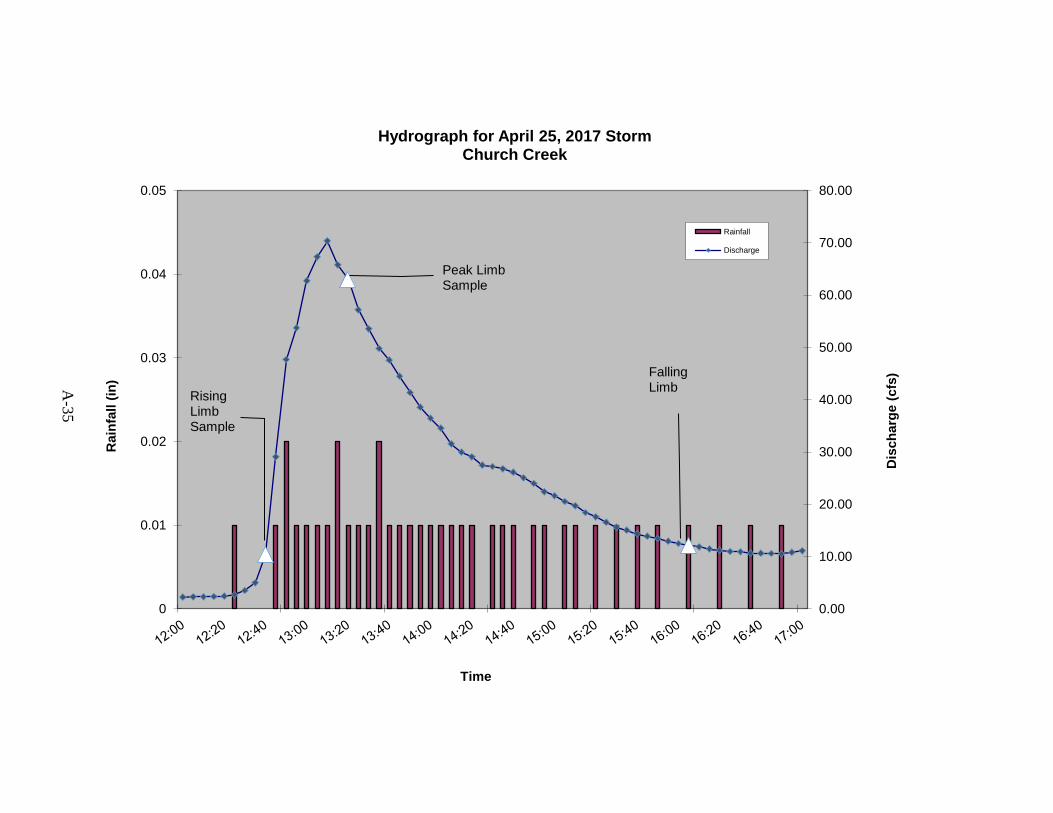
A-3
5
0.00
10.00
20.00
30.00
40.00
50.00
60.00
70.00
80.00
0
0.01
0.02
0.03
0.04
0.05
Dis
ch
arg
e (
cfs
)
Rain
fall (
in)
Time
Hydrograph for April 25, 2017 Storm Church Creek
Rainfall
Discharge
Rising Limb Sample
Falling Limb
Peak Limb Sample
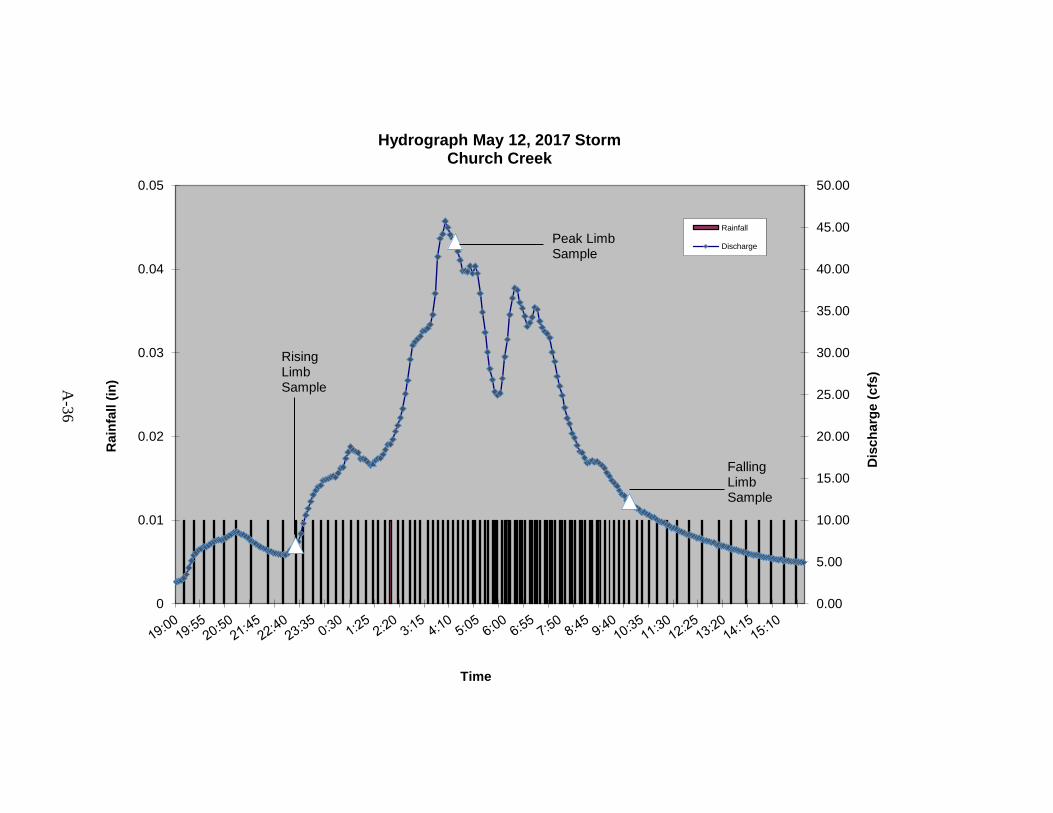
A-3
6
0.00
5.00
10.00
15.00
20.00
25.00
30.00
35.00
40.00
45.00
50.00
0
0.01
0.02
0.03
0.04
0.05
Dis
ch
arg
e (
cfs
)
Rain
fall (
in)
Time
Hydrograph May 12, 2017 Storm Church Creek
Rainfall
Discharge
Rising Limb Sample
Falling Limb Sample
Peak Limb Sample
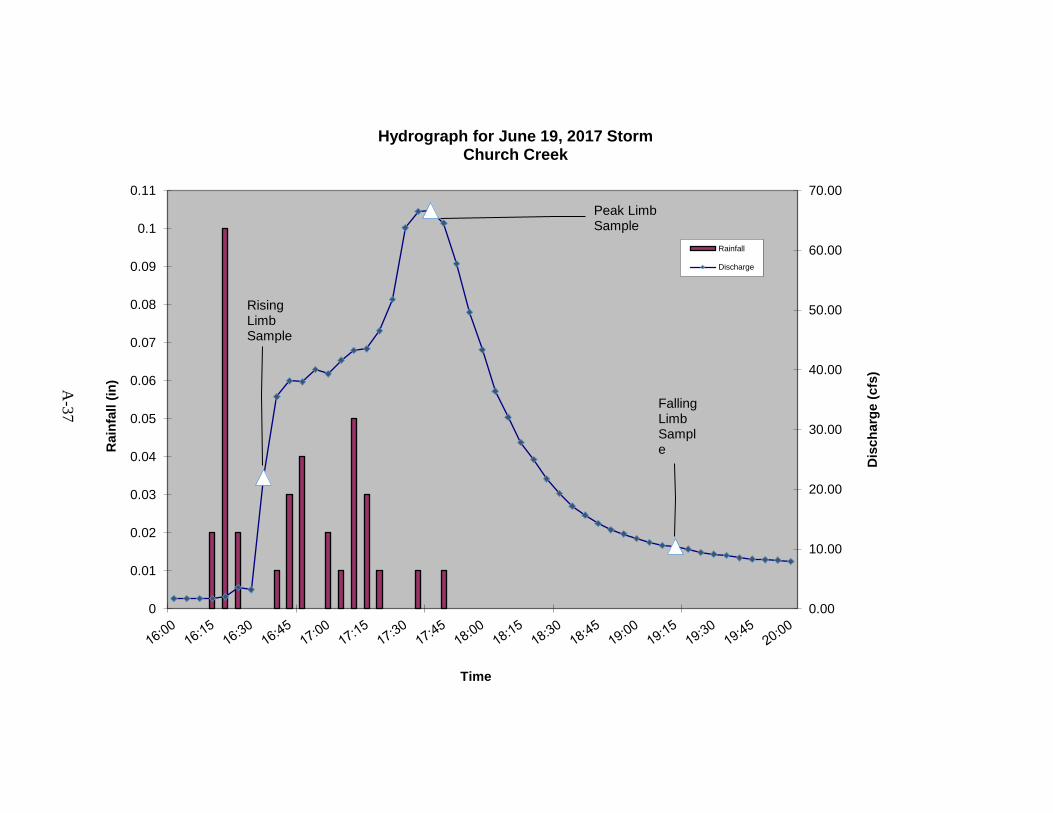
A-3
7
0.00
10.00
20.00
30.00
40.00
50.00
60.00
70.00
0
0.01
0.02
0.03
0.04
0.05
0.06
0.07
0.08
0.09
0.1
0.11
Dis
ch
arg
e (
cfs
)
Rain
fall (
in)
Time
Hydrograph for June 19, 2017 Storm Church Creek
Rainfall
Discharge
Rising Limb Sample
Falling Limb Sample
Peak Limb Sample

A-3
8
Appendix B
B-1
APPENDIX B
MASTER TAXA LIST

Appendix B
B-2
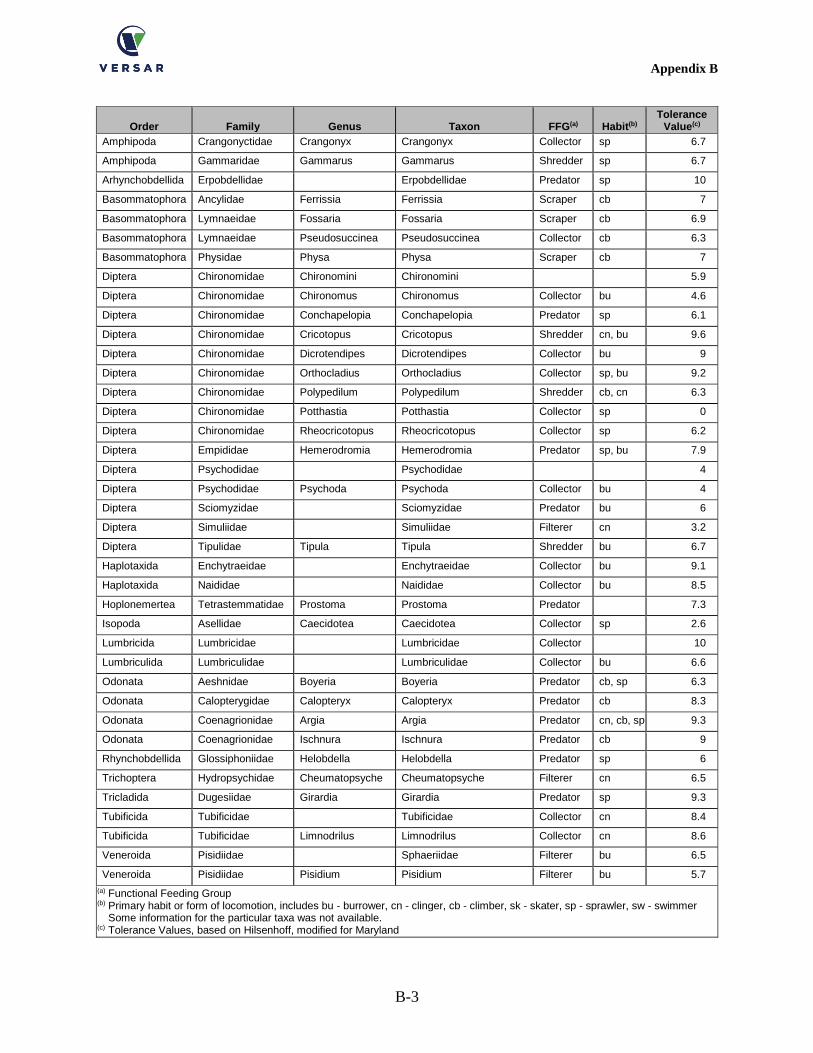
Appendix B
B-3
Order Family Genus Taxon FFG(a) Habit(b) Tolerance
Value(c)
Amphipoda Crangonyctidae Crangonyx Crangonyx Collector sp 6.7
Amphipoda Gammaridae Gammarus Gammarus Shredder sp 6.7
Arhynchobdellida Erpobdellidae Erpobdellidae Predator sp 10
Basommatophora Ancylidae Ferrissia Ferrissia Scraper cb 7
Basommatophora Lymnaeidae Fossaria Fossaria Scraper cb 6.9
Basommatophora Lymnaeidae Pseudosuccinea Pseudosuccinea Collector cb 6.3
Basommatophora Physidae Physa Physa Scraper cb 7
Diptera Chironomidae Chironomini Chironomini 5.9
Diptera Chironomidae Chironomus Chironomus Collector bu 4.6
Diptera Chironomidae Conchapelopia Conchapelopia Predator sp 6.1
Diptera Chironomidae Cricotopus Cricotopus Shredder cn, bu 9.6
Diptera Chironomidae Dicrotendipes Dicrotendipes Collector bu 9
Diptera Chironomidae Orthocladius Orthocladius Collector sp, bu 9.2
Diptera Chironomidae Polypedilum Polypedilum Shredder cb, cn 6.3
Diptera Chironomidae Potthastia Potthastia Collector sp 0
Diptera Chironomidae Rheocricotopus Rheocricotopus Collector sp 6.2
Diptera Empididae Hemerodromia Hemerodromia Predator sp, bu 7.9
Diptera Psychodidae Psychodidae 4
Diptera Psychodidae Psychoda Psychoda Collector bu 4
Diptera Sciomyzidae Sciomyzidae Predator bu 6
Diptera Simuliidae Simuliidae Filterer cn 3.2
Diptera Tipulidae Tipula Tipula Shredder bu 6.7
Haplotaxida Enchytraeidae Enchytraeidae Collector bu 9.1
Haplotaxida Naididae Naididae Collector bu 8.5
Hoplonemertea Tetrastemmatidae Prostoma Prostoma Predator 7.3
Isopoda Asellidae Caecidotea Caecidotea Collector sp 2.6
Lumbricida Lumbricidae Lumbricidae Collector 10
Lumbriculida Lumbriculidae Lumbriculidae Collector bu 6.6
Odonata Aeshnidae Boyeria Boyeria Predator cb, sp 6.3
Odonata Calopterygidae Calopteryx Calopteryx Predator cb 8.3
Odonata Coenagrionidae Argia Argia Predator cn, cb, sp 9.3
Odonata Coenagrionidae Ischnura Ischnura Predator cb 9
Rhynchobdellida Glossiphoniidae Helobdella Helobdella Predator sp 6
Trichoptera Hydropsychidae Cheumatopsyche Cheumatopsyche Filterer cn 6.5
Tricladida Dugesiidae Girardia Girardia Predator sp 9.3
Tubificida Tubificidae Tubificidae Collector cn 8.4
Tubificida Tubificidae Limnodrilus Limnodrilus Collector cn 8.6
Veneroida Pisidiidae Sphaeriidae Filterer bu 6.5
Veneroida Pisidiidae Pisidium Pisidium Filterer bu 5.7
(a) Functional Feeding Group (b) Primary habit or form of locomotion, includes bu - burrower, cn - clinger, cb - climber, sk - skater, sp - sprawler, sw - swimmer
Some information for the particular taxa was not available. (c) Tolerance Values, based on Hilsenhoff, modified for Maryland

Appendix B
B-4
Appendix C
C-1
APPENDIX C
BIOLOGICAL ASSESSMENT RESULTS

Appendix C
C-2
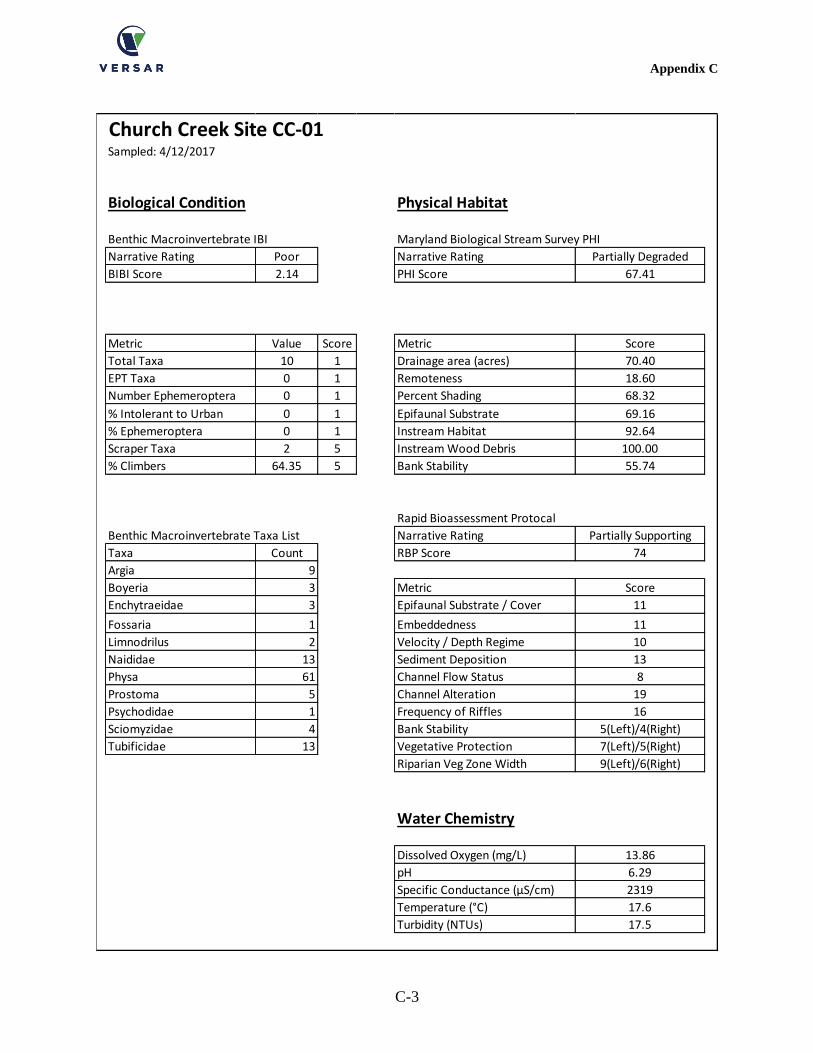
Appendix C
C-3
Sampled: 4/12/2017
Narrative Rating Poor Narrative Rating Partially Degraded
BIBI Score 2.14 PHI Score 67.41
Metric Value Score Metric Score
Total Taxa 10 1 Drainage area (acres) 70.40
EPT Taxa 0 1 Remoteness 18.60
Number Ephemeroptera 0 1 Percent Shading 68.32
% Intolerant to Urban 0 1 Epifaunal Substrate 69.16
% Ephemeroptera 0 1 Instream Habitat 92.64
Scraper Taxa 2 5 Instream Wood Debris 100.00
% Climbers 64.35 5 Bank Stability 55.74
Narrative Rating Partially Supporting
Taxa Count RBP Score 74
Argia 9
Boyeria 3 Metric Score
Enchytraeidae 3 Epifaunal Substrate / Cover 11
Fossaria 1 Embeddedness 11
Limnodrilus 2 Velocity / Depth Regime 10
Naididae 13 Sediment Deposition 13
Physa 61 Channel Flow Status 8
Prostoma 5 Channel Alteration 19
Psychodidae 1 Frequency of Riffles 16
Sciomyzidae 4 Bank Stability 5(Left)/4(Right)
Tubificidae 13 Vegetative Protection 7(Left)/5(Right)
Riparian Veg Zone Width 9(Left)/6(Right)
Water Chemistry
Dissolved Oxygen (mg/L) 13.86
pH 6.29
Specific Conductance (μS/cm) 2319
Temperature (°C) 17.6
Turbidity (NTUs) 17.5
Benthic Macroinvertebrate Taxa List
Benthic Macroinvertebrate IBI
Biological Condition
Church Creek Site CC-01
Physical Habitat
Maryland Biological Stream Survey PHI
Rapid Bioassessment Protocal
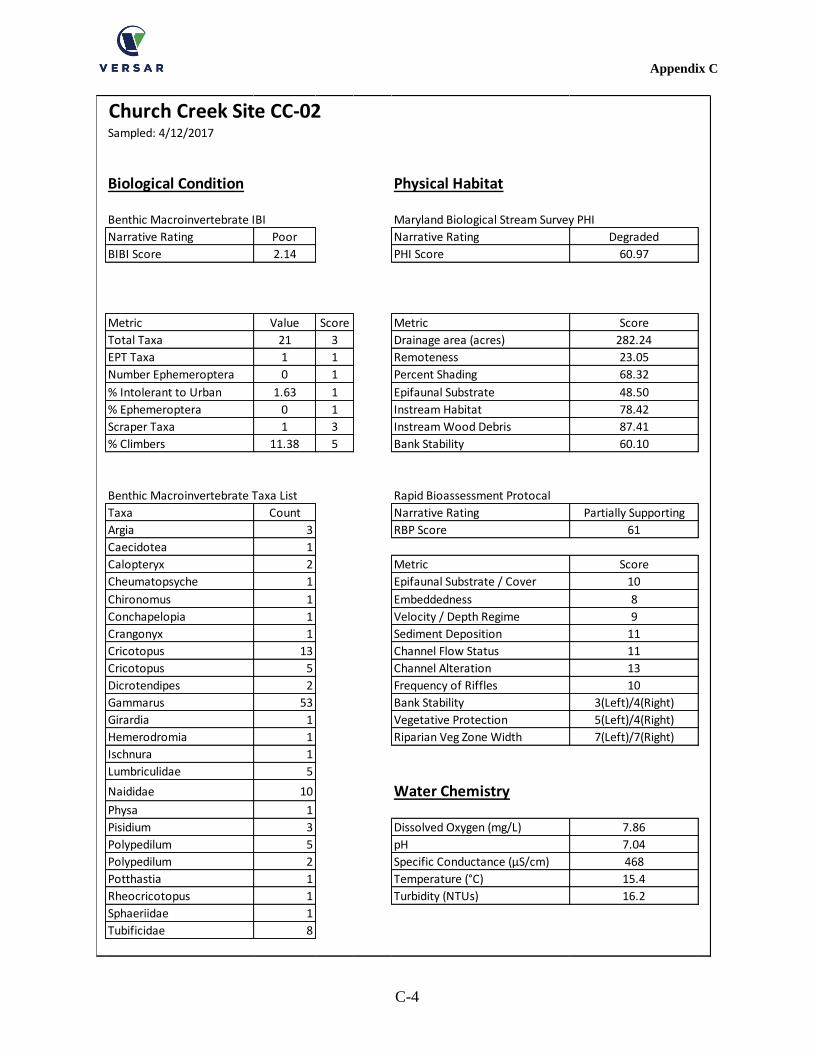
Appendix C
C-4
Sampled: 4/12/2017
Narrative Rating Poor Narrative Rating Degraded
BIBI Score 2.14 PHI Score 60.97
Metric Value Score Metric Score
Total Taxa 21 3 Drainage area (acres) 282.24
EPT Taxa 1 1 Remoteness 23.05
Number Ephemeroptera 0 1 Percent Shading 68.32
% Intolerant to Urban 1.63 1 Epifaunal Substrate 48.50
% Ephemeroptera 0 1 Instream Habitat 78.42
Scraper Taxa 1 3 Instream Wood Debris 87.41
% Climbers 11.38 5 Bank Stability 60.10
Taxa Count Narrative Rating Partially Supporting
Argia 3 RBP Score 61
Caecidotea 1
Calopteryx 2 Metric Score
Cheumatopsyche 1 Epifaunal Substrate / Cover 10
Chironomus 1 Embeddedness 8
Conchapelopia 1 Velocity / Depth Regime 9
Crangonyx 1 Sediment Deposition 11
Cricotopus 13 Channel Flow Status 11
Cricotopus 5 Channel Alteration 13
Dicrotendipes 2 Frequency of Riffles 10
Gammarus 53 Bank Stability 3(Left)/4(Right)
Girardia 1 Vegetative Protection 5(Left)/4(Right)
Hemerodromia 1 Riparian Veg Zone Width 7(Left)/7(Right)
Ischnura 1
Lumbriculidae 5
Naididae 10 Water ChemistryPhysa 1
Pisidium 3 Dissolved Oxygen (mg/L) 7.86
Polypedilum 5 pH 7.04
Polypedilum 2 Specific Conductance (μS/cm) 468
Potthastia 1 Temperature (°C) 15.4
Rheocricotopus 1 Turbidity (NTUs) 16.2
Sphaeriidae 1
Tubificidae 8
Benthic Macroinvertebrate Taxa List Rapid Bioassessment Protocal
Church Creek Site CC-02
Biological Condition Physical Habitat
Benthic Macroinvertebrate IBI Maryland Biological Stream Survey PHI
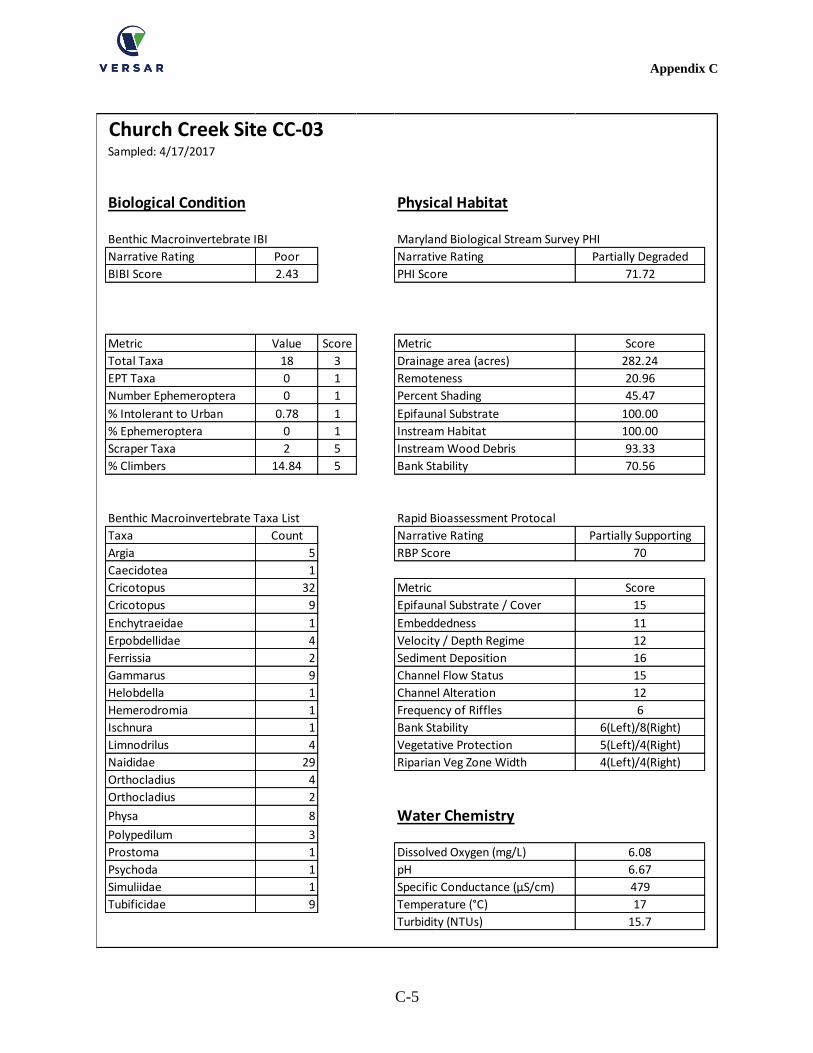
Appendix C
C-5
Sampled: 4/17/2017
Narrative Rating Poor Narrative Rating Partially Degraded
BIBI Score 2.43 PHI Score 71.72
Metric Value Score Metric Score
Total Taxa 18 3 Drainage area (acres) 282.24
EPT Taxa 0 1 Remoteness 20.96
Number Ephemeroptera 0 1 Percent Shading 45.47
% Intolerant to Urban 0.78 1 Epifaunal Substrate 100.00
% Ephemeroptera 0 1 Instream Habitat 100.00
Scraper Taxa 2 5 Instream Wood Debris 93.33
% Climbers 14.84 5 Bank Stability 70.56
Taxa Count Narrative Rating Partially Supporting
Argia 5 RBP Score 70
Caecidotea 1
Cricotopus 32 Metric Score
Cricotopus 9 Epifaunal Substrate / Cover 15
Enchytraeidae 1 Embeddedness 11
Erpobdellidae 4 Velocity / Depth Regime 12
Ferrissia 2 Sediment Deposition 16
Gammarus 9 Channel Flow Status 15
Helobdella 1 Channel Alteration 12
Hemerodromia 1 Frequency of Riffles 6
Ischnura 1 Bank Stability 6(Left)/8(Right)
Limnodrilus 4 Vegetative Protection 5(Left)/4(Right)
Naididae 29 Riparian Veg Zone Width 4(Left)/4(Right)
Orthocladius 4
Orthocladius 2
Physa 8 Water ChemistryPolypedilum 3
Prostoma 1 Dissolved Oxygen (mg/L) 6.08
Psychoda 1 pH 6.67
Simuliidae 1 Specific Conductance (μS/cm) 479
Tubificidae 9 Temperature (°C) 17
Turbidity (NTUs) 15.7
Benthic Macroinvertebrate Taxa List Rapid Bioassessment Protocal
Church Creek Site CC-03
Biological Condition Physical Habitat
Benthic Macroinvertebrate IBI Maryland Biological Stream Survey PHI
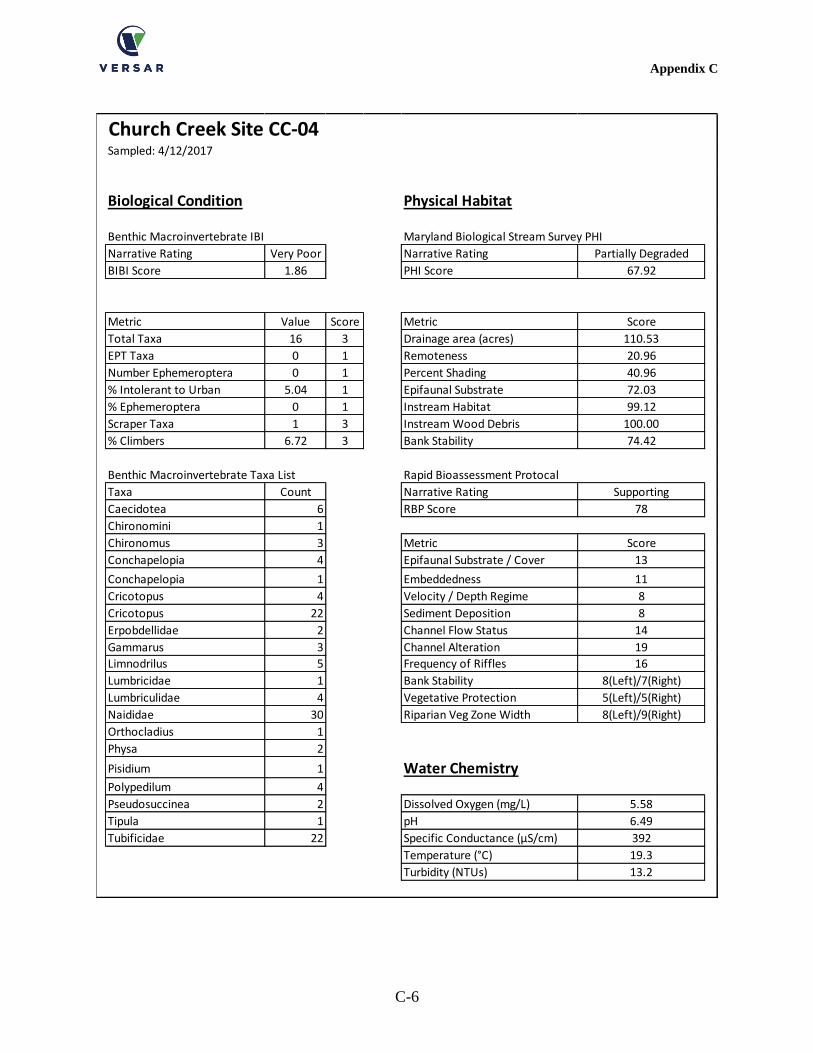
Appendix C
C-6
Sampled: 4/12/2017
Narrative Rating Very Poor Narrative Rating Partially Degraded
BIBI Score 1.86 PHI Score 67.92
Metric Value Score Metric Score
Total Taxa 16 3 Drainage area (acres) 110.53
EPT Taxa 0 1 Remoteness 20.96
Number Ephemeroptera 0 1 Percent Shading 40.96
% Intolerant to Urban 5.04 1 Epifaunal Substrate 72.03
% Ephemeroptera 0 1 Instream Habitat 99.12
Scraper Taxa 1 3 Instream Wood Debris 100.00
% Climbers 6.72 3 Bank Stability 74.42
Taxa Count Narrative Rating Supporting
Caecidotea 6 RBP Score 78
Chironomini 1
Chironomus 3 Metric Score
Conchapelopia 4 Epifaunal Substrate / Cover 13
Conchapelopia 1 Embeddedness 11
Cricotopus 4 Velocity / Depth Regime 8
Cricotopus 22 Sediment Deposition 8
Erpobdellidae 2 Channel Flow Status 14
Gammarus 3 Channel Alteration 19
Limnodrilus 5 Frequency of Riffles 16
Lumbricidae 1 Bank Stability 8(Left)/7(Right)
Lumbriculidae 4 Vegetative Protection 5(Left)/5(Right)
Naididae 30 Riparian Veg Zone Width 8(Left)/9(Right)
Orthocladius 1
Physa 2
Pisidium 1 Water ChemistryPolypedilum 4
Pseudosuccinea 2 Dissolved Oxygen (mg/L) 5.58
Tipula 1 pH 6.49
Tubificidae 22 Specific Conductance (μS/cm) 392
Temperature (°C) 19.3
Turbidity (NTUs) 13.2
Benthic Macroinvertebrate Taxa List Rapid Bioassessment Protocal
Church Creek Site CC-04
Biological Condition Physical Habitat
Benthic Macroinvertebrate IBI Maryland Biological Stream Survey PHI
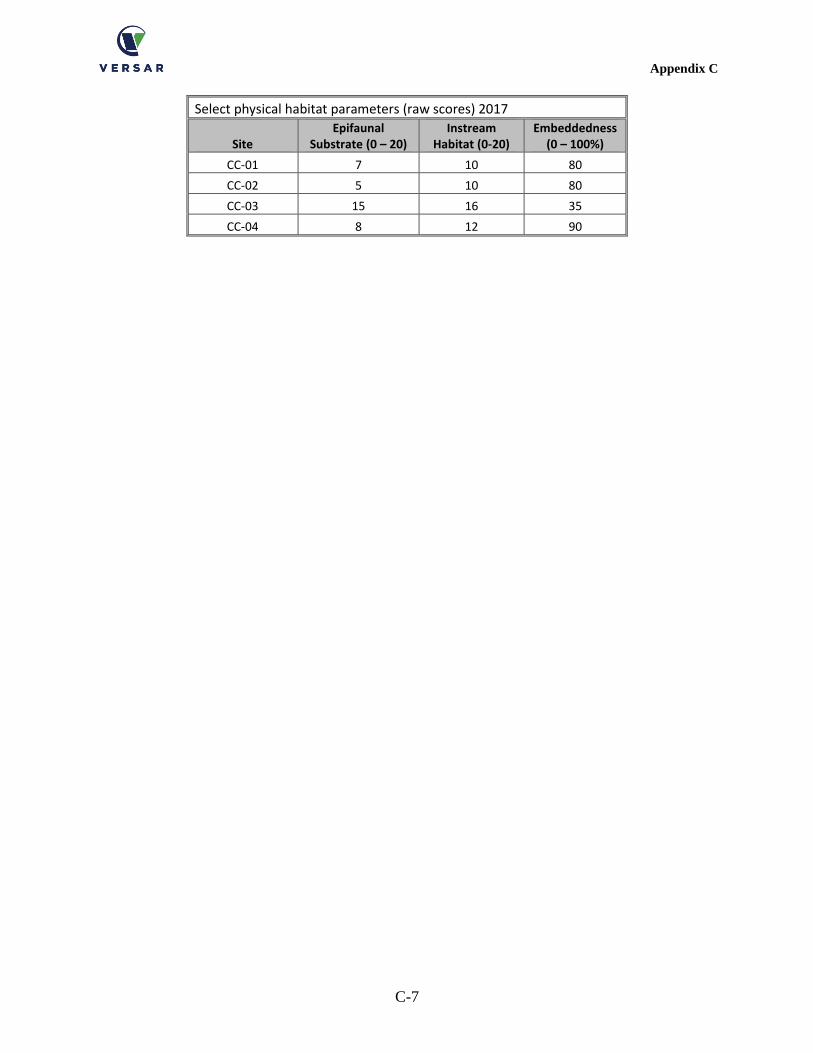
Appendix C
C-7
Select physical habitat parameters (raw scores) 2017
Site Epifaunal
Substrate (0 – 20) Instream
Habitat (0-20) Embeddedness
(0 – 100%)
CC-01 7 10 80
CC-02 5 10 80
CC-03 15 16 35
CC-04 8 12 90

Appendix C
C-8
Appendix D
D-1
APPENDIX D
QA/QC INFORMATION

Appendix D
D-2
Appendix D
D-3
Quality Assurance/Quality Control Summary for NPDES Monitoring
Activities
This section describes all Quality Assurance/Quality Control (QA/QC) procedures implemented
for this project including field sampling, laboratory sorting and subsampling, data entry, metric
calculation, final IBI calculation, geomorphic field sampling, and classification of stream types.
Field Sampling
Initial QA/QC procedures for benthic macroinvertebrate field sampling included formal training
for field crew leaders in MBSS Sampling Protocols. All field crew members have attended at
least one MBSS Spring Index Period Training. At least one crew member extensively trained and
certified in MBSS sampling protocols was present for each field sampling day. Also during field
sampling, each data sheet was double checked for completeness and sample bottle labels were
double checked for accuracy. Geomorphic assessment field crews have more than one year of
experience conducting similar assessment using the Rosgen Stream Classification Methodology,
and the Geomorphic Field Leader has completed two or more levels of Rosgen training.
Geomorphic assessment survey equipment is calibrated annually and regularly inspected to
ensure proper functioning. Cross-section and profile data were digitally plotted and analyzed in
Ohio Department of Natural Resources (ODNR) Reference Reach Spreadsheet Version 4.3L for
accuracy.
Water quality QA/QC procedures included calibration of the YSI multiprobe meter daily during
the sampling season. Dissolved oxygen probe membranes were inspected regularly and replaced
when dirty or damaged.
Laboratory Sorting and Subsampling
Sorting QA/QC was conducted on one sample since only seven samples were collected for this
survey (The four samples from Church Creek are analyzed concurrently with three samples taken
in Picture Spring Branch). This check consisted of entirely resorting the sorted grid cells of one
randomly selected sample. This QC met the sorting efficiency criterion of 90%, so no further
action was required. As a taxonomic QC, one sample was re-identified completely by another
Versar SFS-certified taxonomist following the same identification methods stated above. The
Percent Difference in Enumeration (PDE) and the Percent Taxonomic Disagreement (PTD) were
calculated, and no further action was required since both the PDE and PTD met MBSS and
County MQO requirements.
Data Entry
All data entered were double checked by someone other than the person who performed the
initial data entry. Any errors found during QA/QC were corrected to ensure 100% accuracy of
the data.
Metric and IBI Calculations
Ten percent of metric and IBI calculations were checked by hand using a calculator to ensure
correct calculation by the Access database. Any discrepancies were addressed at that time.
Appendix D
D-4
Identification of Stream Types
All stream types were determined by hand based on the methods of the Rosgen Stream
Classification (Rosgen 1996). Due to the natural variability, or continuum, of streams, adjust-
ments in the values of Width Depth Ratio (+/- 2.0) and Entrenchment Ratio (+/-0.2) are allowed,
which may result in assigning a different stream type. Therefore, all stream types assigned were
checked and any necessary adjustments were made.
Appendix E
E-1
APPENDIX E
ROSGEN CLASSIFICATION SCHEME

Appendix E
E-2
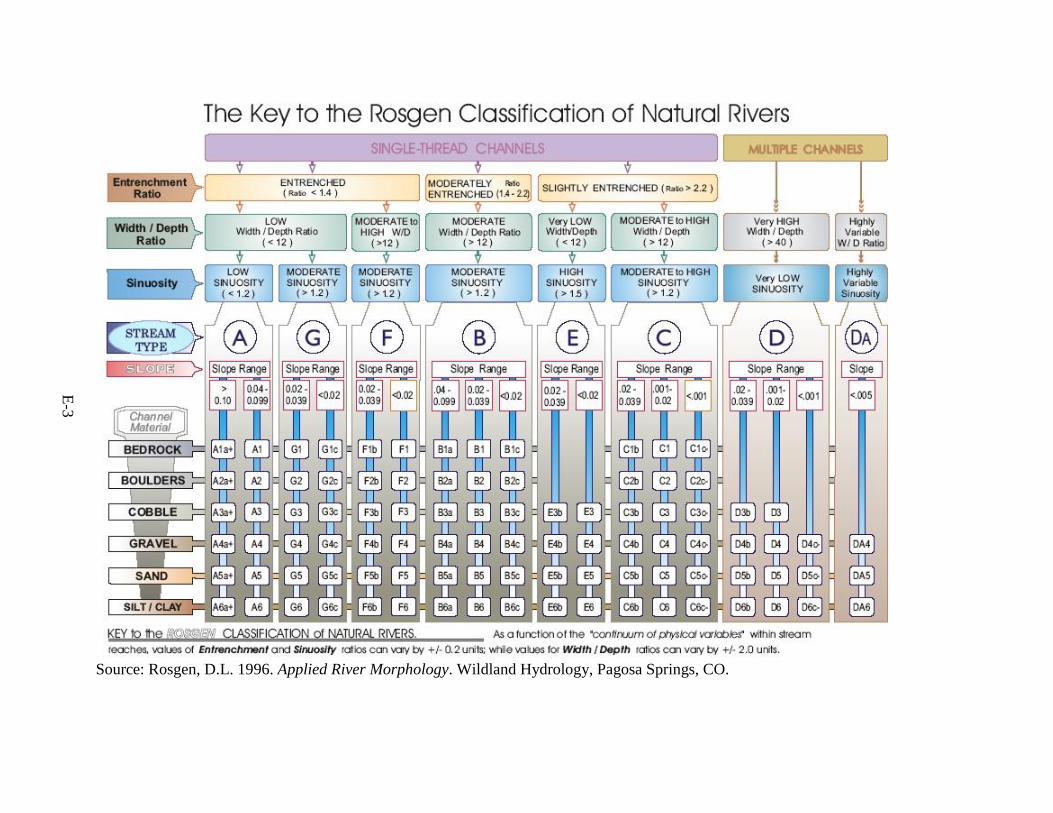
E-3
Source: Rosgen, D.L. 1996. Applied River Morphology. Wildland Hydrology, Pagosa Springs, CO.

E-4

Appendix F
F-1
APPENDIX F
GEOMORPHOLOGICAL DATA

Appendix F
F-2
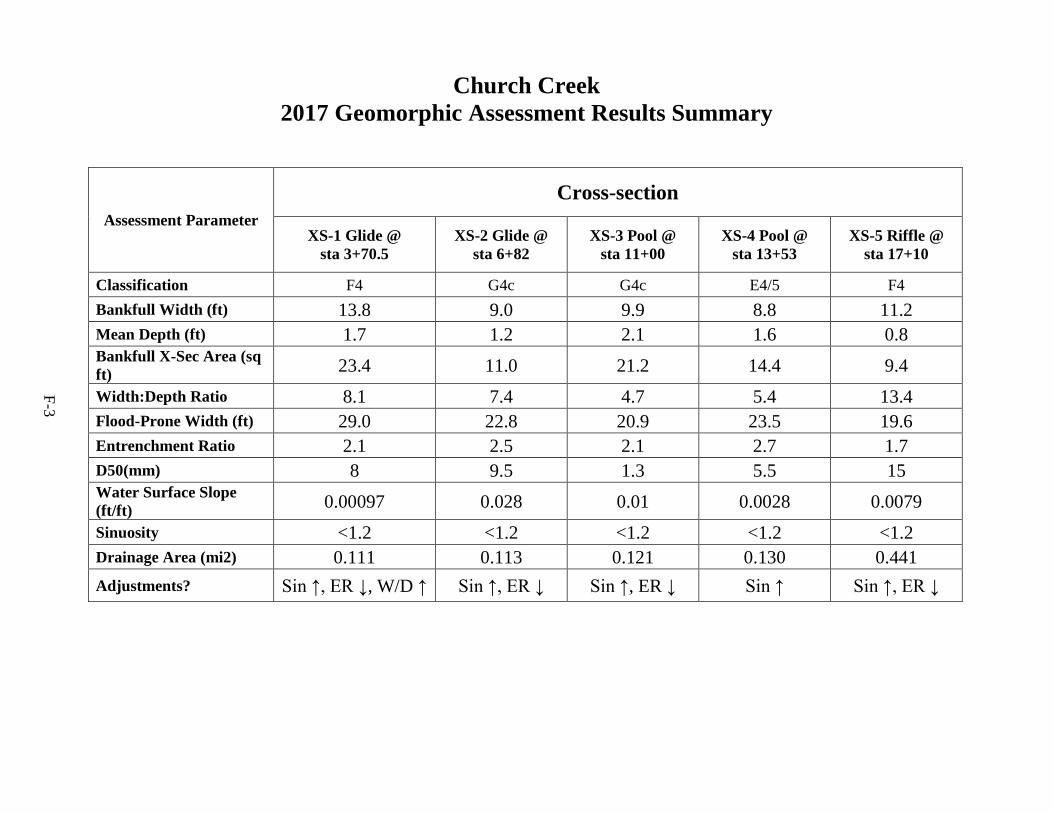
F-3
Church Creek
2017 Geomorphic Assessment Results Summary
Assessment Parameter
Cross-section
XS-1 Glide @
sta 3+70.5
XS-2 Glide @
sta 6+82
XS-3 Pool @
sta 11+00
XS-4 Pool @
sta 13+53
XS-5 Riffle @
sta 17+10
Classification F4 G4c G4c E4/5 F4
Bankfull Width (ft) 13.8 9.0 9.9 8.8 11.2
Mean Depth (ft) 1.7 1.2 2.1 1.6 0.8 Bankfull X-Sec Area (sq
ft) 23.4 11.0 21.2 14.4 9.4
Width:Depth Ratio 8.1 7.4 4.7 5.4 13.4
Flood-Prone Width (ft) 29.0 22.8 20.9 23.5 19.6
Entrenchment Ratio 2.1 2.5 2.1 2.7 1.7
D50(mm) 8 9.5 1.3 5.5 15 Water Surface Slope
(ft/ft) 0.00097 0.028 0.01 0.0028 0.0079
Sinuosity <1.2 <1.2 <1.2 <1.2 <1.2
Drainage Area (mi2) 0.111 0.113 0.121 0.130 0.441
Adjustments? Sin ↑, ER ↓, W/D ↑ Sin ↑, ER ↓ Sin ↑, ER ↓ Sin ↑ Sin ↑, ER ↓
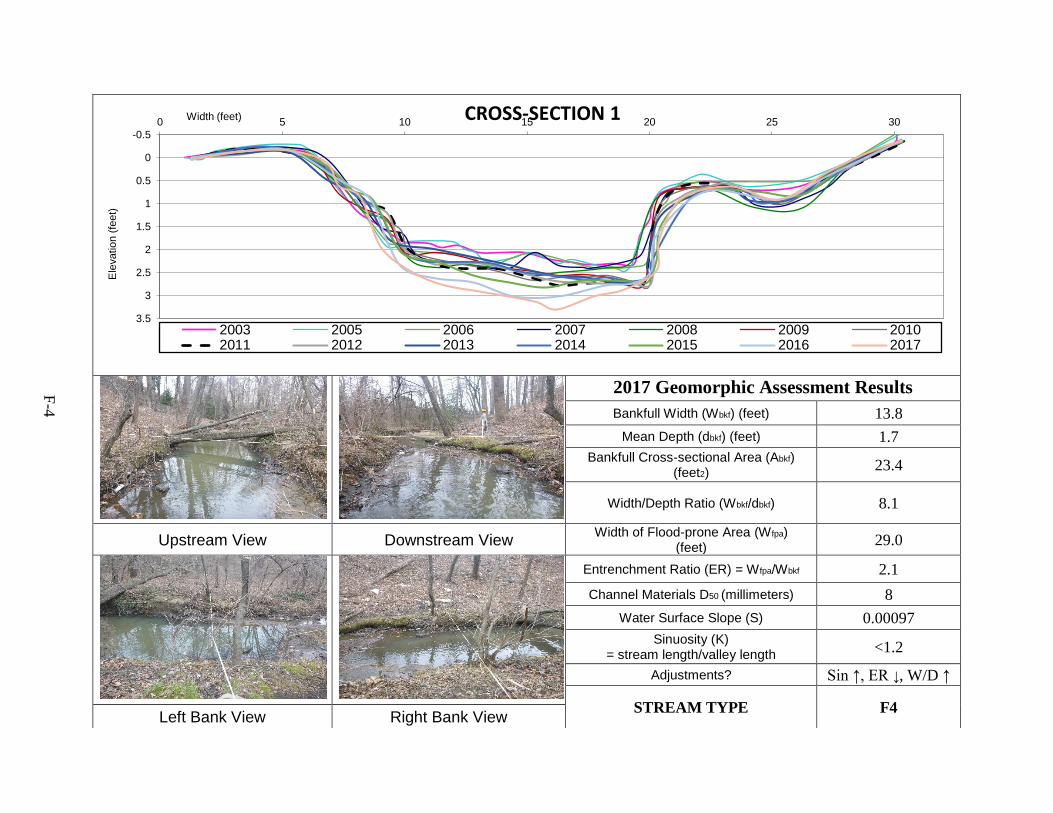
F-4
2017 Geomorphic Assessment Results
Bankfull Width (Wbkf) (feet) 13.8
Mean Depth (dbkf) (feet) 1.7
Bankfull Cross-sectional Area (Abkf) (feet2) 23.4
Width/Depth Ratio (Wbkf/dbkf) 8.1
Upstream View Downstream View Width of Flood-prone Area (Wfpa)
(feet) 29.0
Entrenchment Ratio (ER) = Wfpa/Wbkf 2.1
Channel Materials D50 (millimeters) 8
Water Surface Slope (S) 0.00097
Sinuosity (K) = stream length/valley length <1.2
Adjustments? Sin ↑, ER ↓, W/D ↑
STREAM TYPE F4 Left Bank View Right Bank View
-0.5
0
0.5
1
1.5
2
2.5
3
3.5
0 5 10 15 20 25 30E
levatio
n (
feet)
Width (feet)
2003 2005 2006 2007 2008 2009 20102011 2012 2013 2014 2015 2016 2017
CROSS-SECTION 1
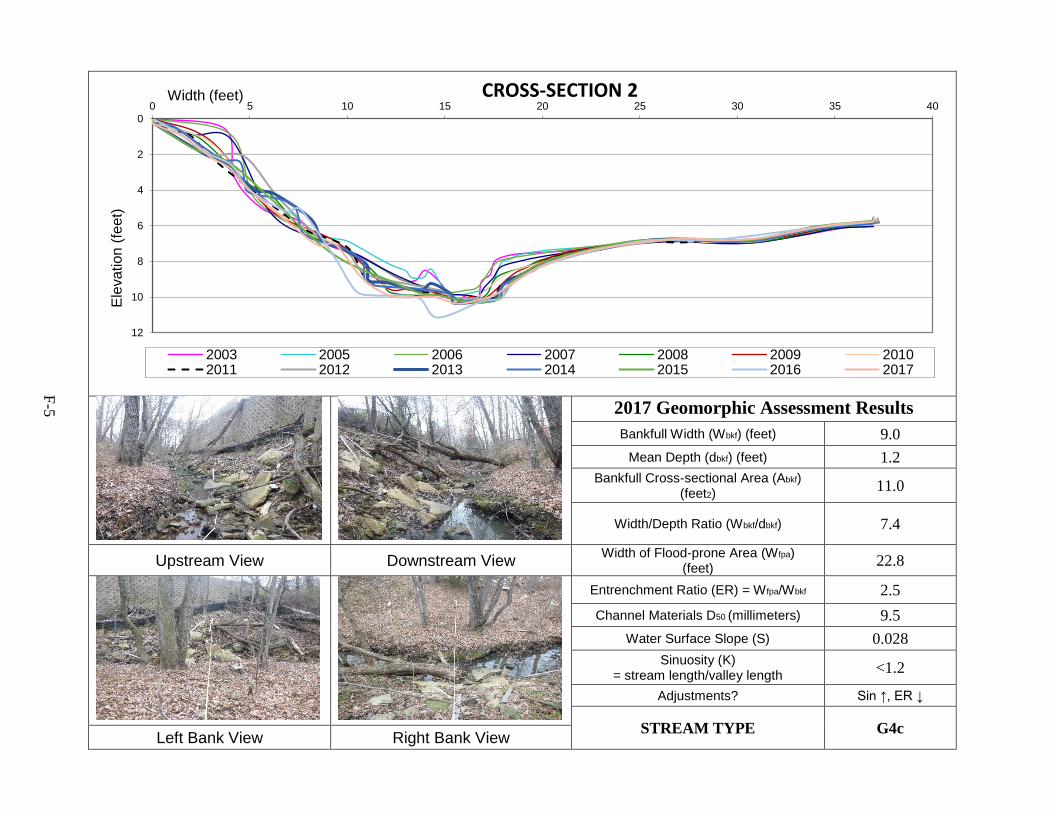
F-5
2017 Geomorphic Assessment Results
Bankfull Width (Wbkf) (feet) 9.0
Mean Depth (dbkf) (feet) 1.2
Bankfull Cross-sectional Area (Abkf) (feet2) 11.0
Width/Depth Ratio (Wbkf/dbkf) 7.4
Upstream View Downstream View Width of Flood-prone Area (Wfpa)
(feet) 22.8
Entrenchment Ratio (ER) = Wfpa/Wbkf 2.5
Channel Materials D50 (millimeters) 9.5
Water Surface Slope (S) 0.028
Sinuosity (K) = stream length/valley length <1.2
Adjustments? Sin ↑, ER ↓
STREAM TYPE G4c Left Bank View Right Bank View
0
2
4
6
8
10
12
0 5 10 15 20 25 30 35 40E
leva
tion
(fe
et)
Width (feet)
2003 2005 2006 2007 2008 2009 20102011 2012 2013 2014 2015 2016 2017
CROSS-SECTION 2
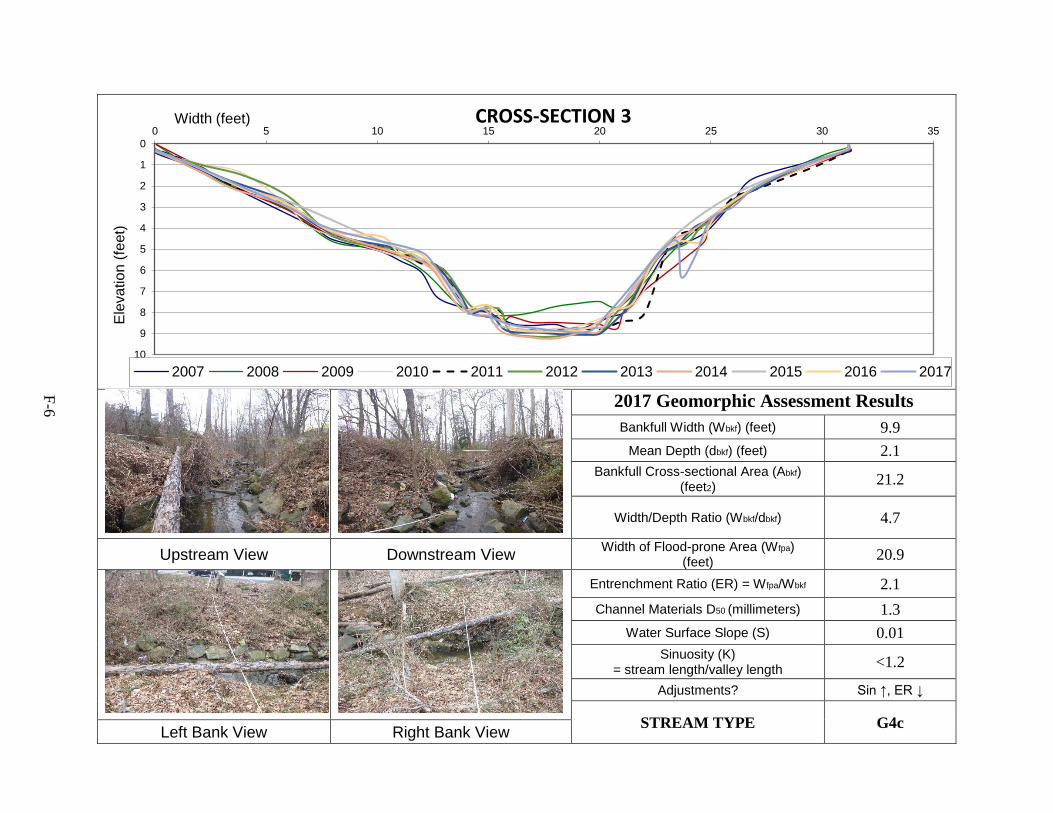
F-6
2017 Geomorphic Assessment Results
Bankfull Width (Wbkf) (feet) 9.9
Mean Depth (dbkf) (feet) 2.1
Bankfull Cross-sectional Area (Abkf) (feet2) 21.2
Width/Depth Ratio (Wbkf/dbkf) 4.7
Upstream View Downstream View Width of Flood-prone Area (Wfpa)
(feet) 20.9
Entrenchment Ratio (ER) = Wfpa/Wbkf 2.1
Channel Materials D50 (millimeters) 1.3
Water Surface Slope (S) 0.01
Sinuosity (K) = stream length/valley length <1.2
Adjustments? Sin ↑, ER ↓
STREAM TYPE G4c Left Bank View Right Bank View
0
1
2
3
4
5
6
7
8
9
10
0 5 10 15 20 25 30 35E
levation (
feet)
Width (feet)
2007 2008 2009 2010 2011 2012 2013 2014 2015 2016 2017
CROSS-SECTION 3
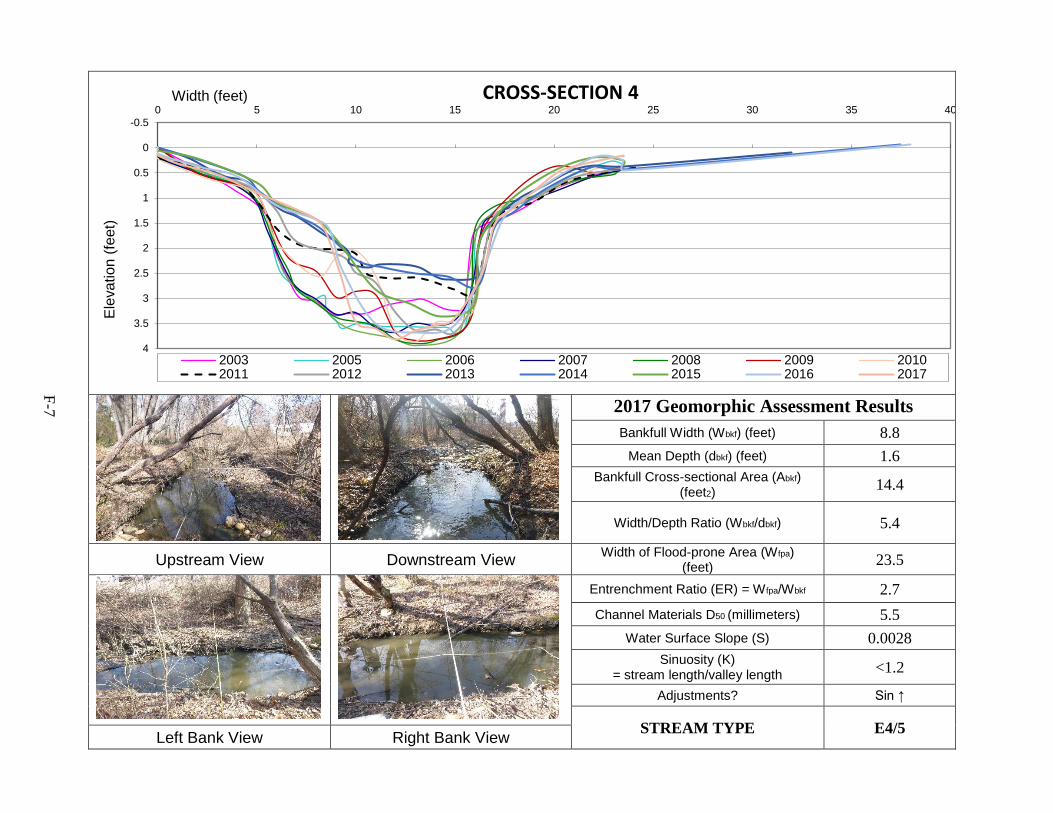
F-7
2017 Geomorphic Assessment Results
Bankfull Width (Wbkf) (feet) 8.8
Mean Depth (dbkf) (feet) 1.6
Bankfull Cross-sectional Area (Abkf) (feet2) 14.4
Width/Depth Ratio (Wbkf/dbkf) 5.4
Upstream View Downstream View Width of Flood-prone Area (Wfpa)
(feet) 23.5
Entrenchment Ratio (ER) = Wfpa/Wbkf 2.7
Channel Materials D50 (millimeters) 5.5
Water Surface Slope (S) 0.0028
Sinuosity (K) = stream length/valley length <1.2
Adjustments? Sin ↑
STREAM TYPE E4/5 Left Bank View Right Bank View
-0.5
0
0.5
1
1.5
2
2.5
3
3.5
4
0 5 10 15 20 25 30 35 40E
leva
tion
(fe
et)
Width (feet)
2003 2005 2006 2007 2008 2009 20102011 2012 2013 2014 2015 2016 2017
CROSS-SECTION 4
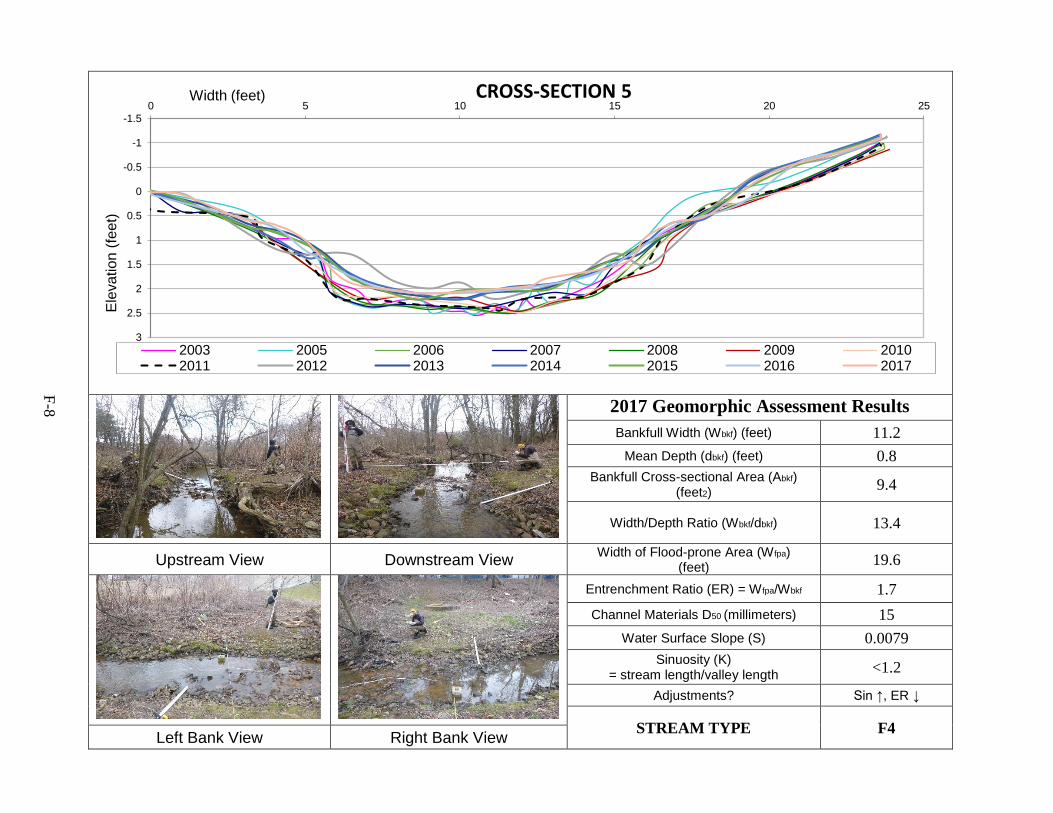
F-8
2017 Geomorphic Assessment Results
Bankfull Width (Wbkf) (feet) 11.2
Mean Depth (dbkf) (feet) 0.8
Bankfull Cross-sectional Area (Abkf) (feet2) 9.4
Width/Depth Ratio (Wbkf/dbkf) 13.4
Upstream View Downstream View Width of Flood-prone Area (Wfpa)
(feet) 19.6
Entrenchment Ratio (ER) = Wfpa/Wbkf 1.7
Channel Materials D50 (millimeters) 15
Water Surface Slope (S) 0.0079
Sinuosity (K) = stream length/valley length <1.2
Adjustments? Sin ↑, ER ↓
STREAM TYPE F4 Left Bank View Right Bank View
-1.5
-1
-0.5
0
0.5
1
1.5
2
2.5
3
0 5 10 15 20 25E
leva
tion
(fe
et)
Width (feet)
2003 2005 2006 2007 2008 2009 20102011 2012 2013 2014 2015 2016 2017
CROSS-SECTION 5
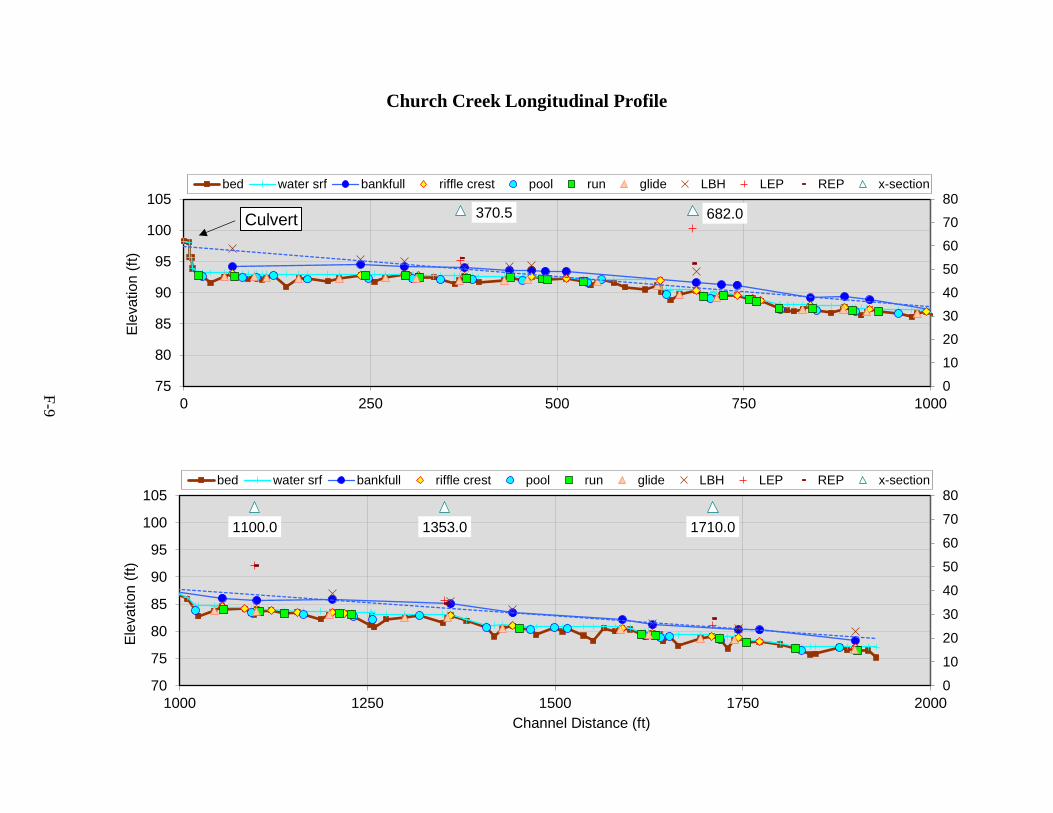
F-9
Church Creek Longitudinal Profile
370.5 682.0
0
10
20
30
40
50
60
70
80
75
80
85
90
95
100
105
0 250 500 750 1000
Ele
va
tion
(ft
)
Channel Distance (ft)
Culvert
bed water srf bankfull riffle crest pool run glide LBH LEP REP x-section
1100.0 1353.0 1710.0
0
10
20
30
40
50
60
70
80
70
75
80
85
90
95
100
105
1000 1250 1500 1750 2000
Ele
va
tion
(ft
)
Channel Distance (ft)
bed water srf bankfull riffle crest pool run glide LBH LEP REP x-section
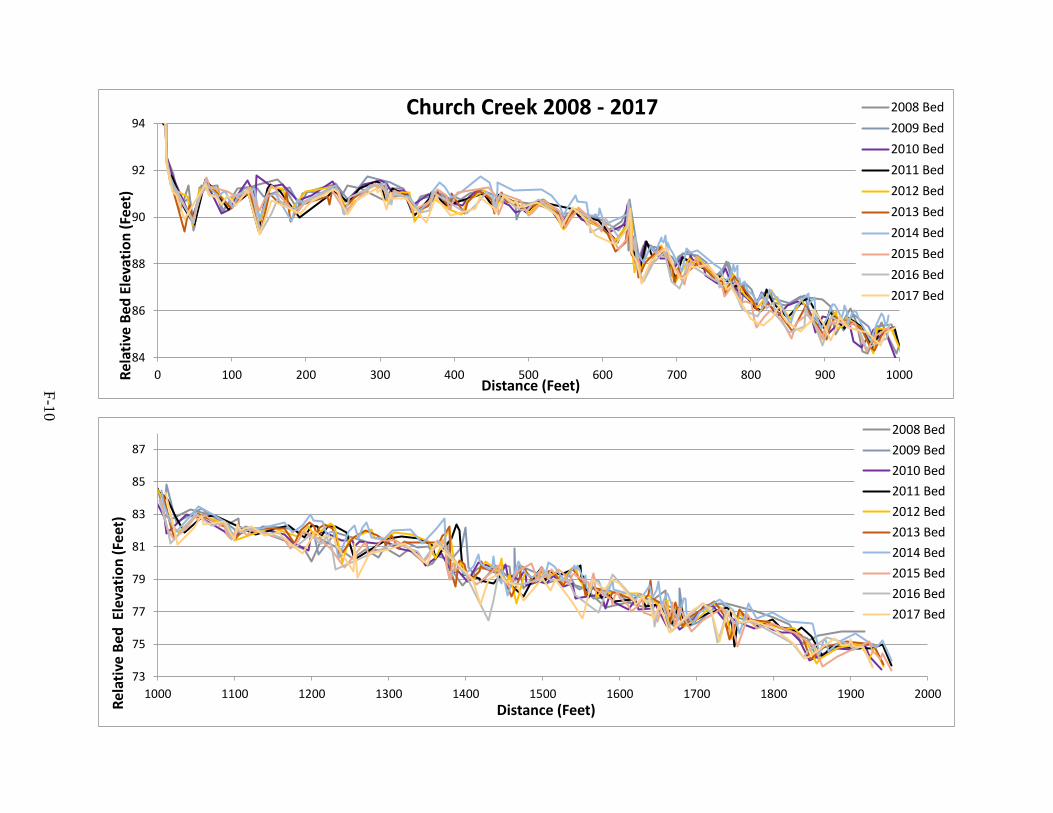
F-1
0
84
86
88
90
92
94
0 100 200 300 400 500 600 700 800 900 1000Rel
ativ
e B
ed E
leva
tio
n (
Feet
)
Distance (Feet)
Church Creek 2008 - 2017 2008 Bed
2009 Bed
2010 Bed
2011 Bed
2012 Bed
2013 Bed
2014 Bed
2015 Bed
2016 Bed
2017 Bed
73
75
77
79
81
83
85
87
1000 1100 1200 1300 1400 1500 1600 1700 1800 1900 2000
Rel
ativ
e B
ed E
leva
tio
n (
Feet
)
Distance (Feet)
2008 Bed
2009 Bed
2010 Bed
2011 Bed
2012 Bed
2013 Bed
2014 Bed
2015 Bed
2016 Bed
2017 Bed
Appendix G
G-1
APPENDIX G
CHEMICAL MONITORING RESULTS

Appendix G
G-2
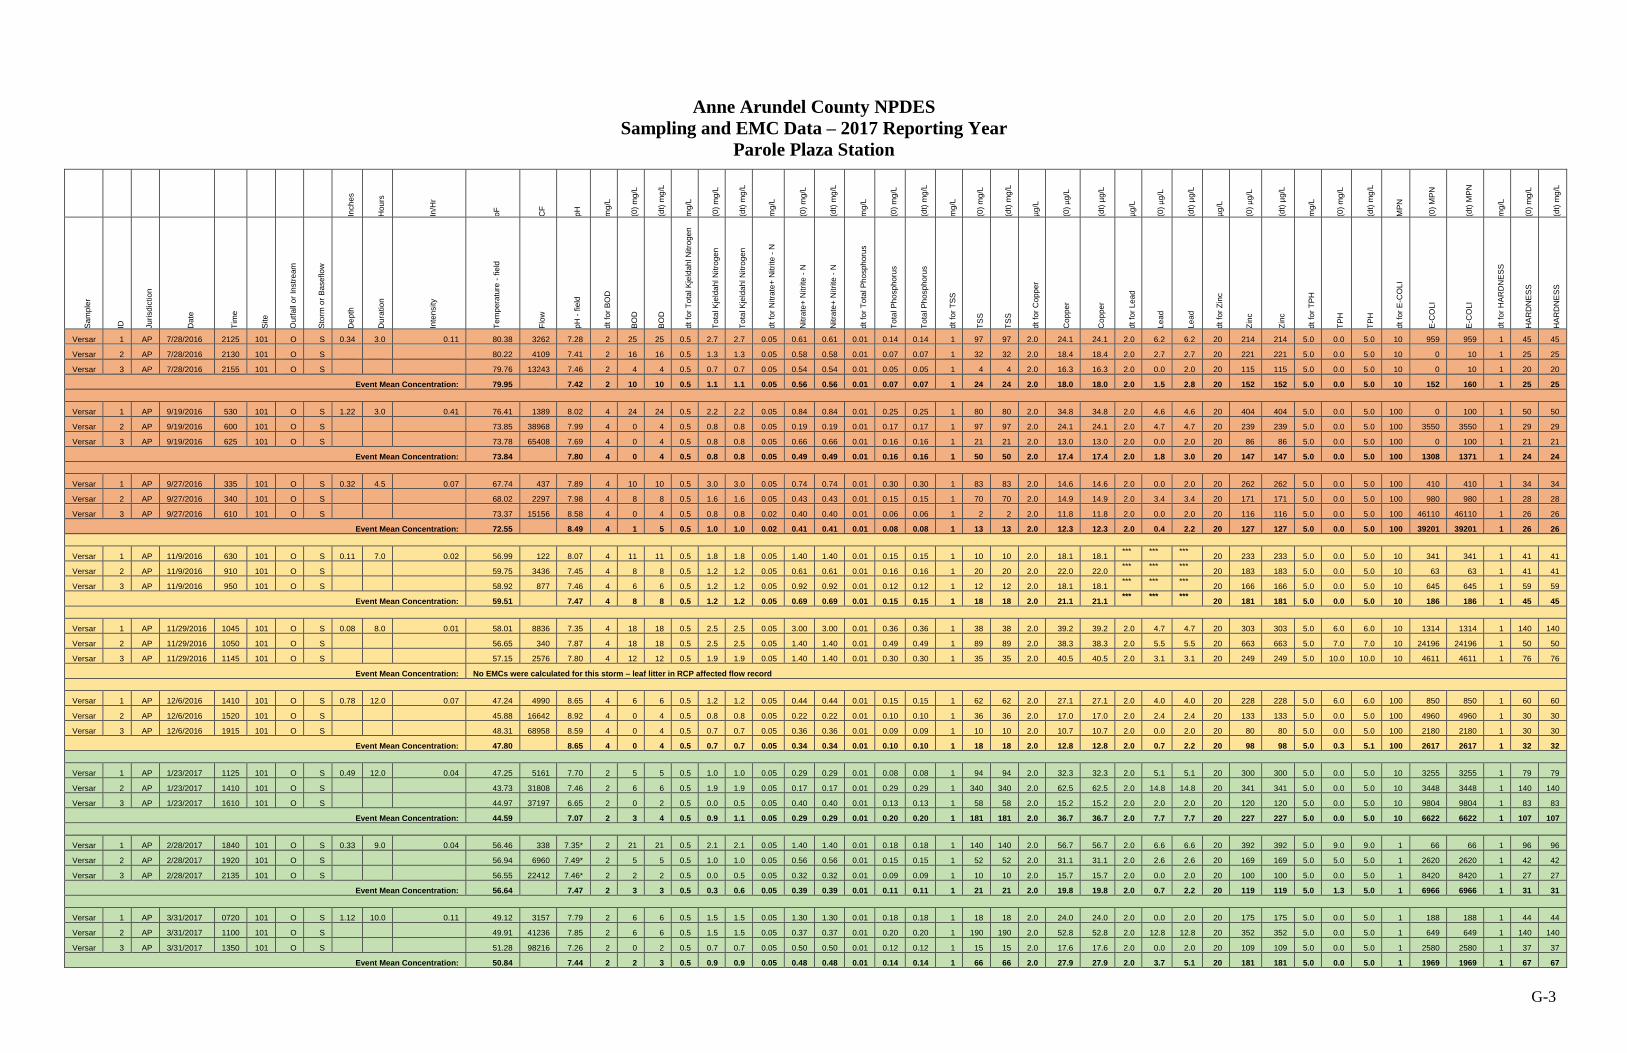
G-3
Anne Arundel County NPDES
Sampling and EMC Data – 2017 Reporting Year
Parole Plaza Station
Inch
es
Hou
rs
In/H
r
oF
CF
pH
mg
/L
(0)
mg
/L
(dt)
mg
/L
mg
/L
(0)
mg
/L
(dt)
mg
/L
mg
/L
(0)
mg
/L
(dt)
mg
/L
mg
/L
(0)
mg
/L
(dt)
mg
/L
mg
/L
(0)
mg
/L
(dt)
mg
/L
µg
/L
(0)
µg
/L
(dt)
µg/L
µg
/L
(0)
µg
/L
(dt)
µg/L
µg
/L
(0)
µg
/L
(dt)
µg/L
mg
/L
(0)
mg
/L
(dt)
mg
/L
MP
N
(0)
MP
N
(dt)
MP
N
mg
/L
(0)
mg
/L
(dt)
mg
/L
Sa
mp
ler
ID
Ju
risdic
tio
n
Date
Tim
e
Site
Ou
tfa
ll o
r In
str
eam
Sto
rm o
r B
aseflo
w
Dep
th
Dura
tio
n
Inte
nsity
Te
mp
era
ture
- f
ield
Flo
w
pH
- f
ield
dt
for
BO
D
BO
D
BO
D
dt
for
To
tal K
jeld
ah
l N
itro
ge
n
To
tal K
jeld
ah
l N
itro
ge
n
To
tal K
jeld
ah
l N
itro
ge
n
dt
for
Nitra
te+
Nitri
te -
N
Nitra
te+
Nitri
te -
N
Nitra
te+
Nitri
te -
N
dt
for
To
tal P
ho
sph
oru
s
To
tal P
ho
sp
ho
rus
To
tal P
ho
sp
ho
rus
dt
for
TS
S
TS
S
TS
S
dt
for
Co
pp
er
Cop
pe
r
Cop
pe
r
dt
for
Le
ad
Le
ad
Le
ad
dt
for
Zin
c
Zin
c
Zin
c
dt
for
TP
H
TP
H
TP
H
dt
for
E-C
OL
I
E-C
OL
I
E-C
OL
I
dt
for
HA
RD
NE
SS
HA
RD
NE
SS
HA
RD
NE
SS
Versar 1 AP 7/28/2016 2125 101 O S 0.34 3.0 0.11 80.38 3262 7.28 2 25 25 0.5 2.7 2.7 0.05 0.61 0.61 0.01 0.14 0.14 1 97 97 2.0 24.1 24.1 2.0 6.2 6.2 20 214 214 5.0 0.0 5.0 10 959 959 1 45 45
Versar 2 AP 7/28/2016 2130 101 O S 80.22 4109 7.41 2 16 16 0.5 1.3 1.3 0.05 0.58 0.58 0.01 0.07 0.07 1 32 32 2.0 18.4 18.4 2.0 2.7 2.7 20 221 221 5.0 0.0 5.0 10 0 10 1 25 25
Versar 3 AP 7/28/2016 2155 101 O S 79.76 13243 7.46 2 4 4 0.5 0.7 0.7 0.05 0.54 0.54 0.01 0.05 0.05 1 4 4 2.0 16.3 16.3 2.0 0.0 2.0 20 115 115 5.0 0.0 5.0 10 0 10 1 20 20
Event Mean Concentration: 79.95 7.42 2 10 10 0.5 1.1 1.1 0.05 0.56 0.56 0.01 0.07 0.07 1 24 24 2.0 18.0 18.0 2.0 1.5 2.8 20 152 152 5.0 0.0 5.0 10 152 160 1 25 25
Versar 1 AP 9/19/2016 530 101 O S 1.22 3.0 0.41 76.41 1389 8.02 4 24 24 0.5 2.2 2.2 0.05 0.84 0.84 0.01 0.25 0.25 1 80 80 2.0 34.8 34.8 2.0 4.6 4.6 20 404 404 5.0 0.0 5.0 100 0 100 1 50 50
Versar 2 AP 9/19/2016 600 101 O S 73.85 38968 7.99 4 0 4 0.5 0.8 0.8 0.05 0.19 0.19 0.01 0.17 0.17 1 97 97 2.0 24.1 24.1 2.0 4.7 4.7 20 239 239 5.0 0.0 5.0 100 3550 3550 1 29 29
Versar 3 AP 9/19/2016 625 101 O S 73.78 65408 7.69 4 0 4 0.5 0.8 0.8 0.05 0.66 0.66 0.01 0.16 0.16 1 21 21 2.0 13.0 13.0 2.0 0.0 2.0 20 86 86 5.0 0.0 5.0 100 0 100 1 21 21
Event Mean Concentration: 73.84 7.80 4 0 4 0.5 0.8 0.8 0.05 0.49 0.49 0.01 0.16 0.16 1 50 50 2.0 17.4 17.4 2.0 1.8 3.0 20 147 147 5.0 0.0 5.0 100 1308 1371 1 24 24
Versar 1 AP 9/27/2016 335 101 O S 0.32 4.5 0.07 67.74 437 7.89 4 10 10 0.5 3.0 3.0 0.05 0.74 0.74 0.01 0.30 0.30 1 83 83 2.0 14.6 14.6 2.0 0.0 2.0 20 262 262 5.0 0.0 5.0 100 410 410 1 34 34
Versar 2 AP 9/27/2016 340 101 O S 68.02 2297 7.98 4 8 8 0.5 1.6 1.6 0.05 0.43 0.43 0.01 0.15 0.15 1 70 70 2.0 14.9 14.9 2.0 3.4 3.4 20 171 171 5.0 0.0 5.0 100 980 980 1 28 28
Versar 3 AP 9/27/2016 610 101 O S 73.37 15156 8.58 4 0 4 0.5 0.8 0.8 0.02 0.40 0.40 0.01 0.06 0.06 1 2 2 2.0 11.8 11.8 2.0 0.0 2.0 20 116 116 5.0 0.0 5.0 100 46110 46110 1 26 26
Event Mean Concentration: 72.55 8.49 4 1 5 0.5 1.0 1.0 0.02 0.41 0.41 0.01 0.08 0.08 1 13 13 2.0 12.3 12.3 2.0 0.4 2.2 20 127 127 5.0 0.0 5.0 100 39201 39201 1 26 26
Versar 1 AP 11/9/2016 630 101 O S 0.11 7.0 0.02 56.99 122 8.07 4 11 11 0.5 1.8 1.8 0.05 1.40 1.40 0.01 0.15 0.15 1 10 10 2.0 18.1 18.1 *** *** ***
20 233 233 5.0 0.0 5.0 10 341 341 1 41 41
Versar 2 AP 11/9/2016 910 101 O S 59.75 3436 7.45 4 8 8 0.5 1.2 1.2 0.05 0.61 0.61 0.01 0.16 0.16 1 20 20 2.0 22.0 22.0 *** *** ***
20 183 183 5.0 0.0 5.0 10 63 63 1 41 41
Versar 3 AP 11/9/2016 950 101 O S 58.92 877 7.46 4 6 6 0.5 1.2 1.2 0.05 0.92 0.92 0.01 0.12 0.12 1 12 12 2.0 18.1 18.1 *** *** ***
20 166 166 5.0 0.0 5.0 10 645 645 1 59 59
Event Mean Concentration: 59.51 7.47 4 8 8 0.5 1.2 1.2 0.05 0.69 0.69 0.01 0.15 0.15 1 18 18 2.0 21.1 21.1 *** *** ***
20 181 181 5.0 0.0 5.0 10 186 186 1 45 45
Versar 1 AP 11/29/2016 1045 101 O S 0.08 8.0 0.01 58.01 8836 7.35 4 18 18 0.5 2.5 2.5 0.05 3.00 3.00 0.01 0.36 0.36 1 38 38 2.0 39.2 39.2 2.0 4.7 4.7 20 303 303 5.0 6.0 6.0 10 1314 1314 1 140 140
Versar 2 AP 11/29/2016 1050 101 O S 56.65 340 7.87 4 18 18 0.5 2.5 2.5 0.05 1.40 1.40 0.01 0.49 0.49 1 89 89 2.0 38.3 38.3 2.0 5.5 5.5 20 663 663 5.0 7.0 7.0 10 24196 24196 1 50 50
Versar 3 AP 11/29/2016 1145 101 O S 57.15 2576 7.80 4 12 12 0.5 1.9 1.9 0.05 1.40 1.40 0.01 0.30 0.30 1 35 35 2.0 40.5 40.5 2.0 3.1 3.1 20 249 249 5.0 10.0 10.0 10 4611 4611 1 76 76
Event Mean Concentration: No EMCs were calculated for this storm – leaf litter in RCP affected flow record
Versar 1 AP 12/6/2016 1410 101 O S 0.78 12.0 0.07 47.24 4990 8.65 4 6 6 0.5 1.2 1.2 0.05 0.44 0.44 0.01 0.15 0.15 1 62 62 2.0 27.1 27.1 2.0 4.0 4.0 20 228 228 5.0 6.0 6.0 100 850 850 1 60 60
Versar 2 AP 12/6/2016 1520 101 O S 45.88 16642 8.92 4 0 4 0.5 0.8 0.8 0.05 0.22 0.22 0.01 0.10 0.10 1 36 36 2.0 17.0 17.0 2.0 2.4 2.4 20 133 133 5.0 0.0 5.0 100 4960 4960 1 30 30
Versar 3 AP 12/6/2016 1915 101 O S 48.31 68958 8.59 4 0 4 0.5 0.7 0.7 0.05 0.36 0.36 0.01 0.09 0.09 1 10 10 2.0 10.7 10.7 2.0 0.0 2.0 20 80 80 5.0 0.0 5.0 100 2180 2180 1 30 30
Event Mean Concentration: 47.80 8.65 4 0 4 0.5 0.7 0.7 0.05 0.34 0.34 0.01 0.10 0.10 1 18 18 2.0 12.8 12.8 2.0 0.7 2.2 20 98 98 5.0 0.3 5.1 100 2617 2617 1 32 32
Versar 1 AP 1/23/2017 1125 101 O S 0.49 12.0 0.04 47.25 5161 7.70 2 5 5 0.5 1.0 1.0 0.05 0.29 0.29 0.01 0.08 0.08 1 94 94 2.0 32.3 32.3 2.0 5.1 5.1 20 300 300 5.0 0.0 5.0 10 3255 3255 1 79 79
Versar 2 AP 1/23/2017 1410 101 O S 43.73 31808 7.46 2 6 6 0.5 1.9 1.9 0.05 0.17 0.17 0.01 0.29 0.29 1 340 340 2.0 62.5 62.5 2.0 14.8 14.8 20 341 341 5.0 0.0 5.0 10 3448 3448 1 140 140
Versar 3 AP 1/23/2017 1610 101 O S 44.97 37197 6.65 2 0 2 0.5 0.0 0.5 0.05 0.40 0.40 0.01 0.13 0.13 1 58 58 2.0 15.2 15.2 2.0 2.0 2.0 20 120 120 5.0 0.0 5.0 10 9804 9804 1 83 83
Event Mean Concentration: 44.59 7.07 2 3 4 0.5 0.9 1.1 0.05 0.29 0.29 0.01 0.20 0.20 1 181 181 2.0 36.7 36.7 2.0 7.7 7.7 20 227 227 5.0 0.0 5.0 10 6622 6622 1 107 107
Versar 1 AP 2/28/2017 1840 101 O S 0.33 9.0 0.04 56.46 338 7.35* 2 21 21 0.5 2.1 2.1 0.05 1.40 1.40 0.01 0.18 0.18 1 140 140 2.0 56.7 56.7 2.0 6.6 6.6 20 392 392 5.0 9.0 9.0 1 66 66 1 96 96
Versar 2 AP 2/28/2017 1920 101 O S 56.94 6960 7.49* 2 5 5 0.5 1.0 1.0 0.05 0.56 0.56 0.01 0.15 0.15 1 52 52 2.0 31.1 31.1 2.0 2.6 2.6 20 169 169 5.0 5.0 5.0 1 2620 2620 1 42 42
Versar 3 AP 2/28/2017 2135 101 O S 56.55 22412 7.46* 2 2 2 0.5 0.0 0.5 0.05 0.32 0.32 0.01 0.09 0.09 1 10 10 2.0 15.7 15.7 2.0 0.0 2.0 20 100 100 5.0 0.0 5.0 1 8420 8420 1 27 27
Event Mean Concentration: 56.64 7.47 2 3 3 0.5 0.3 0.6 0.05 0.39 0.39 0.01 0.11 0.11 1 21 21 2.0 19.8 19.8 2.0 0.7 2.2 20 119 119 5.0 1.3 5.0 1 6966 6966 1 31 31
Versar 1 AP 3/31/2017 0720 101 O S 1.12 10.0 0.11 49.12 3157 7.79 2 6 6 0.5 1.5 1.5 0.05 1.30 1.30 0.01 0.18 0.18 1 18 18 2.0 24.0 24.0 2.0 0.0 2.0 20 175 175 5.0 0.0 5.0 1 188 188 1 44 44
Versar 2 AP 3/31/2017 1100 101 O S 49.91 41236 7.85 2 6 6 0.5 1.5 1.5 0.05 0.37 0.37 0.01 0.20 0.20 1 190 190 2.0 52.8 52.8 2.0 12.8 12.8 20 352 352 5.0 0.0 5.0 1 649 649 1 140 140
Versar 3 AP 3/31/2017 1350 101 O S 51.28 98216 7.26 2 0 2 0.5 0.7 0.7 0.05 0.50 0.50 0.01 0.12 0.12 1 15 15 2.0 17.6 17.6 2.0 0.0 2.0 20 109 109 5.0 0.0 5.0 1 2580 2580 1 37 37
Event Mean Concentration: 50.84 7.44 2 2 3 0.5 0.9 0.9 0.05 0.48 0.48 0.01 0.14 0.14 1 66 66 2.0 27.9 27.9 2.0 3.7 5.1 20 181 181 5.0 0.0 5.0 1 1969 1969 1 67 67
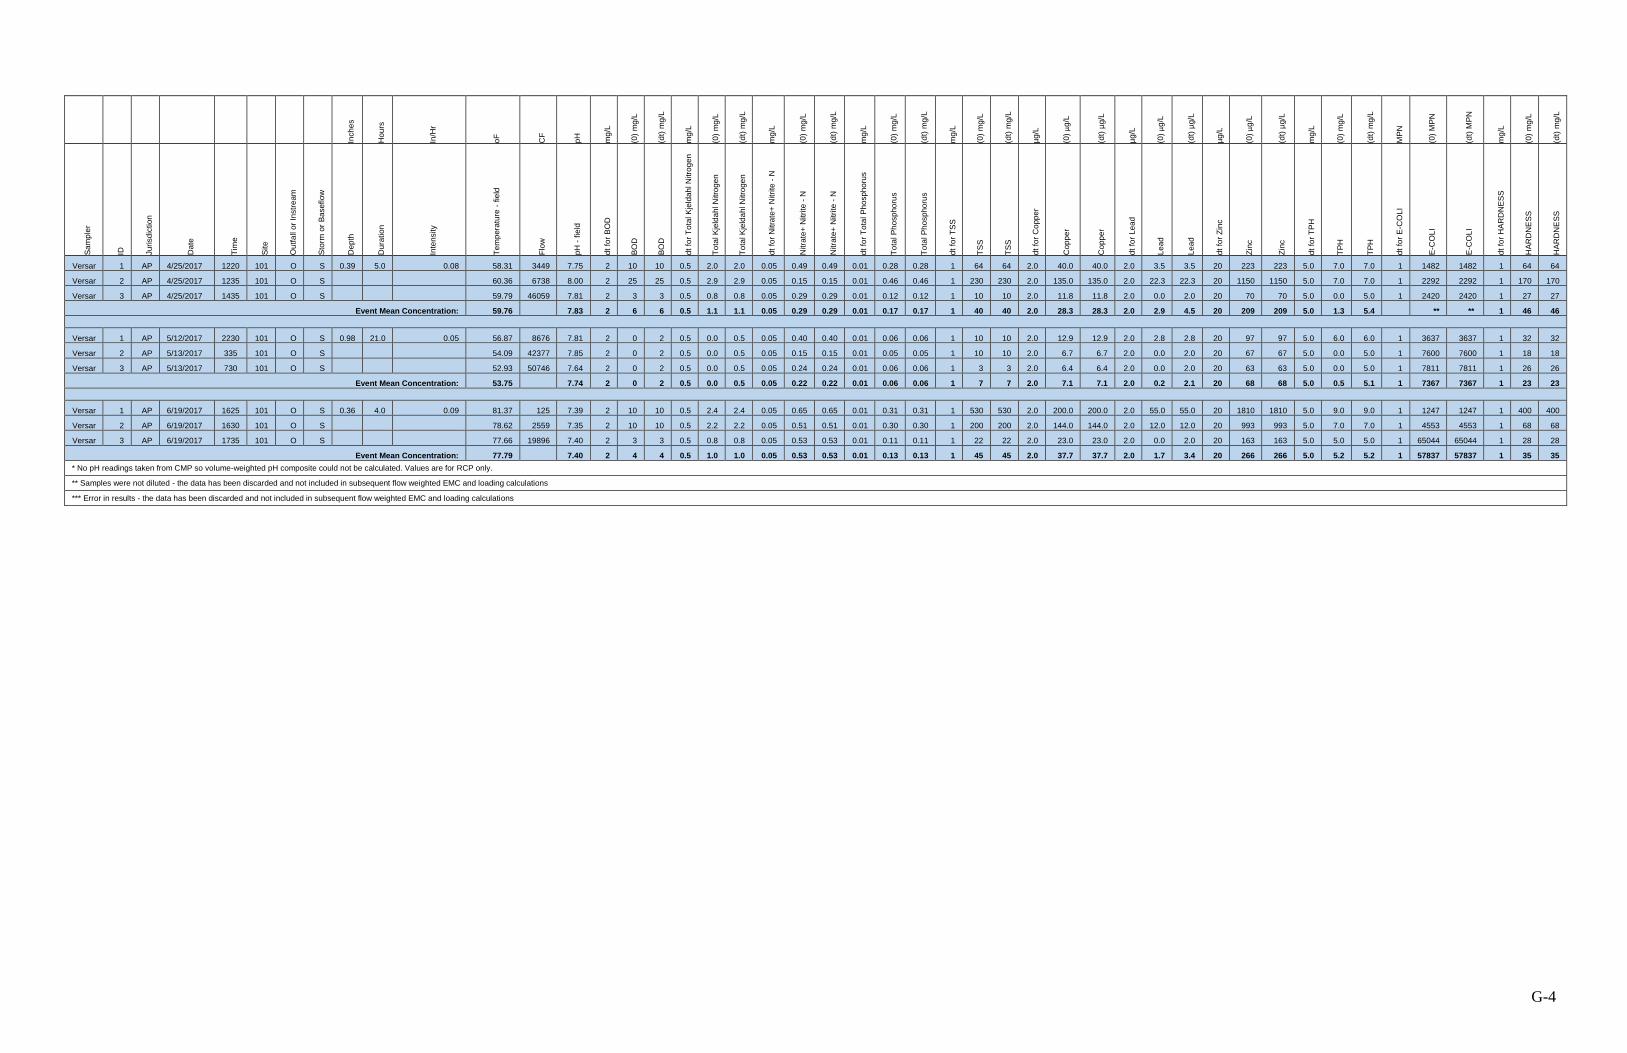
G-4
Inch
es
Hou
rs
In/H
r
oF
CF
pH
mg
/L
(0)
mg
/L
(dt)
mg
/L
mg
/L
(0)
mg
/L
(dt)
mg
/L
mg
/L
(0)
mg
/L
(dt)
mg
/L
mg
/L
(0)
mg
/L
(dt)
mg
/L
mg
/L
(0)
mg
/L
(dt)
mg
/L
µg
/L
(0)
µg
/L
(dt)
µg/L
µg
/L
(0)
µg
/L
(dt)
µg/L
µg
/L
(0)
µg
/L
(dt)
µg/L
mg
/L
(0)
mg
/L
(dt)
mg
/L
MP
N
(0)
MP
N
(dt)
MP
N
mg
/L
(0)
mg
/L
(dt)
mg
/L
Sa
mp
ler
ID
Ju
risdic
tio
n
Date
Tim
e
Site
Ou
tfa
ll o
r In
str
eam
Sto
rm o
r B
aseflo
w
Dep
th
Dura
tio
n
Inte
nsity
Te
mp
era
ture
- f
ield
Flo
w
pH
- f
ield
dt
for
BO
D
BO
D
BO
D
dt
for
To
tal K
jeld
ah
l N
itro
ge
n
To
tal K
jeld
ah
l N
itro
ge
n
To
tal K
jeld
ah
l N
itro
ge
n
dt
for
Nitra
te+
Nitri
te -
N
Nitra
te+
Nitri
te -
N
Nitra
te+
Nitri
te -
N
dt
for
To
tal P
ho
sph
oru
s
To
tal P
ho
sp
ho
rus
To
tal P
ho
sp
ho
rus
dt
for
TS
S
TS
S
TS
S
dt
for
Co
pp
er
Cop
pe
r
Cop
pe
r
dt
for
Le
ad
Le
ad
Le
ad
dt
for
Zin
c
Zin
c
Zin
c
dt
for
TP
H
TP
H
TP
H
dt
for
E-C
OL
I
E-C
OL
I
E-C
OL
I
dt
for
HA
RD
NE
SS
HA
RD
NE
SS
HA
RD
NE
SS
Versar 1 AP 4/25/2017 1220 101 O S 0.39 5.0 0.08 58.31 3449 7.75 2 10 10 0.5 2.0 2.0 0.05 0.49 0.49 0.01 0.28 0.28 1 64 64 2.0 40.0 40.0 2.0 3.5 3.5 20 223 223 5.0 7.0 7.0 1 1482 1482 1 64 64
Versar 2 AP 4/25/2017 1235 101 O S 60.36 6738 8.00 2 25 25 0.5 2.9 2.9 0.05 0.15 0.15 0.01 0.46 0.46 1 230 230 2.0 135.0 135.0 2.0 22.3 22.3 20 1150 1150 5.0 7.0 7.0 1 2292 2292 1 170 170
Versar 3 AP 4/25/2017 1435 101 O S 59.79 46059 7.81 2 3 3 0.5 0.8 0.8 0.05 0.29 0.29 0.01 0.12 0.12 1 10 10 2.0 11.8 11.8 2.0 0.0 2.0 20 70 70 5.0 0.0 5.0 1 2420 2420 1 27 27
Event Mean Concentration: 59.76 7.83 2 6 6 0.5 1.1 1.1 0.05 0.29 0.29 0.01 0.17 0.17 1 40 40 2.0 28.3 28.3 2.0 2.9 4.5 20 209 209 5.0 1.3 5.4 ** ** 1 46 46
Versar 1 AP 5/12/2017 2230 101 O S 0.98 21.0 0.05 56.87 8676 7.81 2 0 2 0.5 0.0 0.5 0.05 0.40 0.40 0.01 0.06 0.06 1 10 10 2.0 12.9 12.9 2.0 2.8 2.8 20 97 97 5.0 6.0 6.0 1 3637 3637 1 32 32
Versar 2 AP 5/13/2017 335 101 O S 54.09 42377 7.85 2 0 2 0.5 0.0 0.5 0.05 0.15 0.15 0.01 0.05 0.05 1 10 10 2.0 6.7 6.7 2.0 0.0 2.0 20 67 67 5.0 0.0 5.0 1 7600 7600 1 18 18
Versar 3 AP 5/13/2017 730 101 O S 52.93 50746 7.64 2 0 2 0.5 0.0 0.5 0.05 0.24 0.24 0.01 0.06 0.06 1 3 3 2.0 6.4 6.4 2.0 0.0 2.0 20 63 63 5.0 0.0 5.0 1 7811 7811 1 26 26
Event Mean Concentration: 53.75 7.74 2 0 2 0.5 0.0 0.5 0.05 0.22 0.22 0.01 0.06 0.06 1 7 7 2.0 7.1 7.1 2.0 0.2 2.1 20 68 68 5.0 0.5 5.1 1 7367 7367 1 23 23
Versar 1 AP 6/19/2017 1625 101 O S 0.36 4.0 0.09 81.37 125 7.39 2 10 10 0.5 2.4 2.4 0.05 0.65 0.65 0.01 0.31 0.31 1 530 530 2.0 200.0 200.0 2.0 55.0 55.0 20 1810 1810 5.0 9.0 9.0 1 1247 1247 1 400 400
Versar 2 AP 6/19/2017 1630 101 O S 78.62 2559 7.35 2 10 10 0.5 2.2 2.2 0.05 0.51 0.51 0.01 0.30 0.30 1 200 200 2.0 144.0 144.0 2.0 12.0 12.0 20 993 993 5.0 7.0 7.0 1 4553 4553 1 68 68
Versar 3 AP 6/19/2017 1735 101 O S 77.66 19896 7.40 2 3 3 0.5 0.8 0.8 0.05 0.53 0.53 0.01 0.11 0.11 1 22 22 2.0 23.0 23.0 2.0 0.0 2.0 20 163 163 5.0 5.0 5.0 1 65044 65044 1 28 28
Event Mean Concentration: 77.79 7.40 2 4 4 0.5 1.0 1.0 0.05 0.53 0.53 0.01 0.13 0.13 1 45 45 2.0 37.7 37.7 2.0 1.7 3.4 20 266 266 5.0 5.2 5.2 1 57837 57837 1 35 35
* No pH readings taken from CMP so volume-weighted pH composite could not be calculated. Values are for RCP only.
** Samples were not diluted - the data has been discarded and not included in subsequent flow weighted EMC and loading calculations
*** Error in results - the data has been discarded and not included in subsequent flow weighted EMC and loading calculations
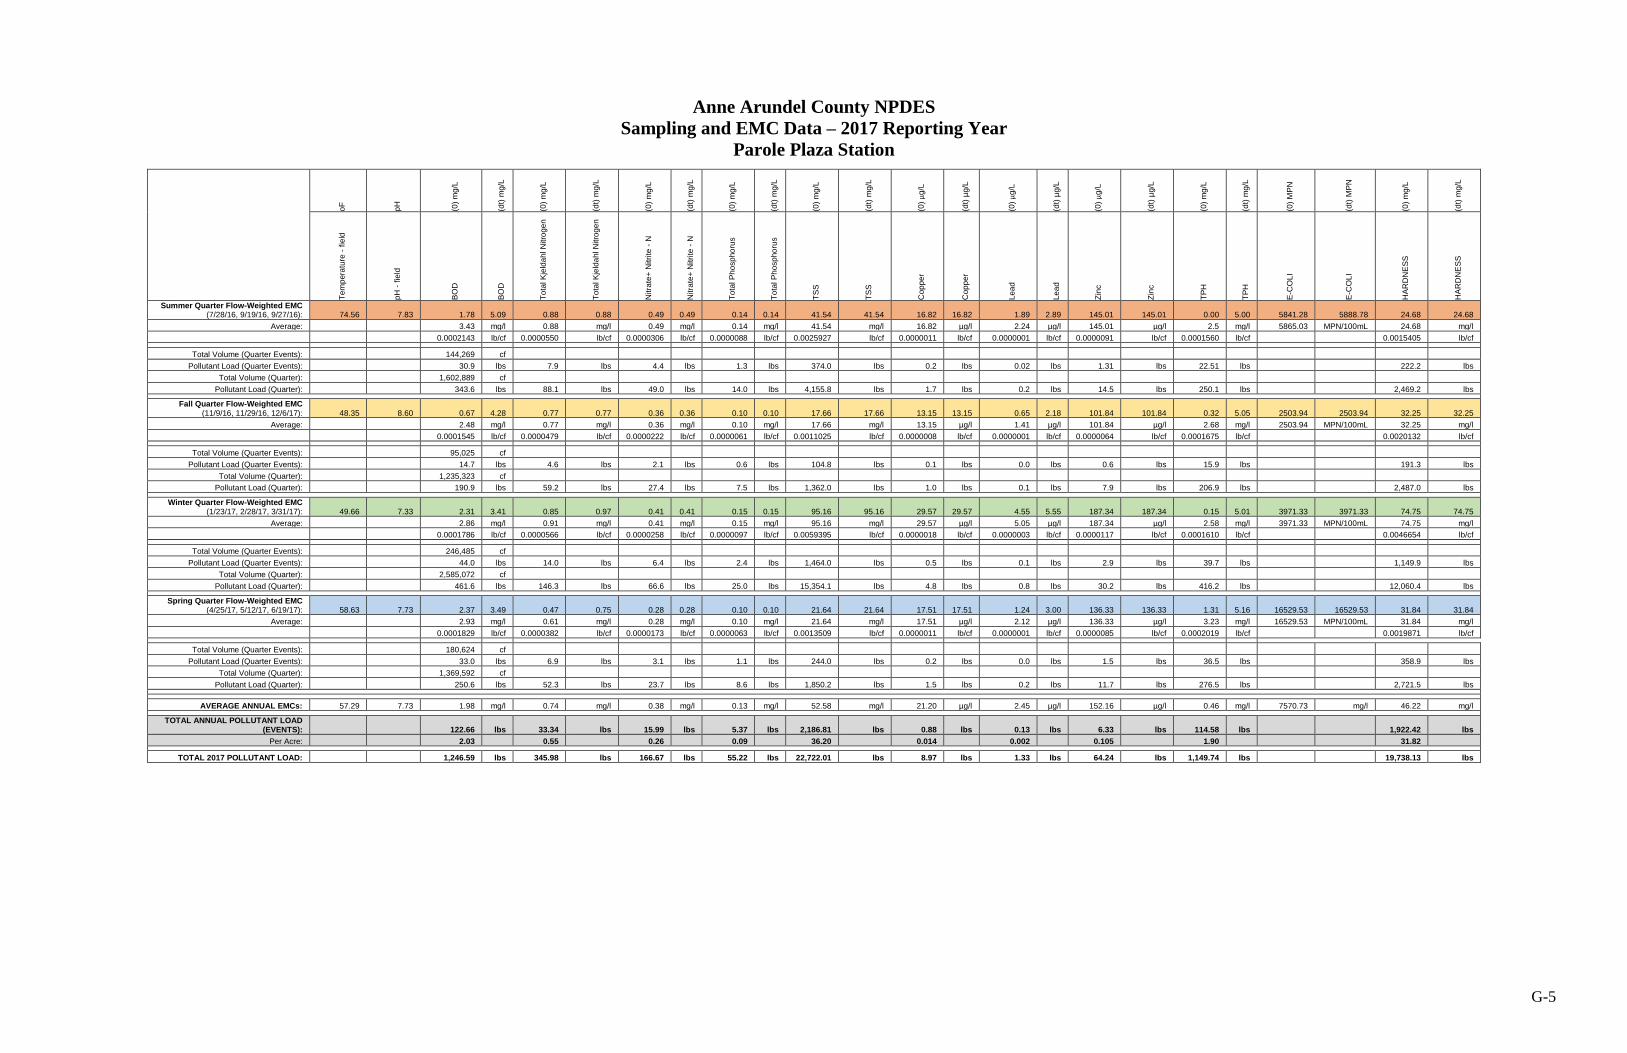
G-5
Anne Arundel County NPDES
Sampling and EMC Data – 2017 Reporting Year
Parole Plaza Station
oF
pH
(0)
mg
/L
(dt)
mg
/L
(0)
mg
/L
(dt)
mg
/L
(0)
mg
/L
(dt)
mg
/L
(0)
mg
/L
(dt)
mg
/L
(0)
mg
/L
(dt)
mg
/L
(0)
µg
/L
(dt)
µg/L
(0)
µg
/L
(dt)
µg/L
(0)
µg
/L
(dt)
µg/L
(0)
mg
/L
(dt)
mg
/L
(0)
MP
N
(dt)
MP
N
(0)
mg
/L
(dt)
mg
/L
Te
mp
era
ture
- f
ield
pH
- f
ield
BO
D
BO
D
To
tal K
jeld
ah
l N
itro
ge
n
To
tal K
jeld
ah
l N
itro
ge
n
Nitra
te+
Nitri
te -
N
Nitra
te+
Nitri
te -
N
To
tal P
ho
sp
ho
rus
To
tal P
ho
sp
ho
rus
TS
S
TS
S
Cop
pe
r
Cop
pe
r
Le
ad
Le
ad
Zin
c
Zin
c
TP
H
TP
H
E-C
OL
I
E-C
OL
I
HA
RD
NE
SS
HA
RD
NE
SS
Summer Quarter Flow-Weighted EMC (7/28/16, 9/19/16, 9/27/16): 74.56 7.83 1.78 5.09 0.88 0.88 0.49 0.49 0.14 0.14 41.54 41.54 16.82 16.82 1.89 2.89 145.01 145.01 0.00 5.00 5841.28 5888.78 24.68 24.68
Average:
3.43 mg/l 0.88 mg/l 0.49 mg/l 0.14 mg/l 41.54 mg/l 16.82 µg/l 2.24 µg/l 145.01 µg/l 2.5 mg/l 5865.03 MPN/100mL 24.68 mg/l
0.0002143 lb/cf 0.0000550 lb/cf 0.0000306 lb/cf 0.0000088 lb/cf 0.0025927 lb/cf 0.0000011 lb/cf 0.0000001 lb/cf 0.0000091 lb/cf 0.0001560 lb/cf
0.0015405 lb/cf
Total Volume (Quarter Events):
144,269 cf Pollutant Load (Quarter Events):
30.9 lbs 7.9 lbs 4.4 lbs 1.3 lbs 374.0 lbs 0.2 lbs 0.02 lbs 1.31 lbs 22.51 lbs
222.2 lbs
Total Volume (Quarter):
1,602,889 cf Pollutant Load (Quarter):
343.6 lbs 88.1 lbs 49.0 lbs 14.0 lbs 4,155.8 lbs 1.7 lbs 0.2 lbs 14.5 lbs 250.1 lbs
2,469.2 lbs
Fall Quarter Flow-Weighted EMC (11/9/16, 11/29/16, 12/6/17): 48.35 8.60 0.67 4.28 0.77 0.77 0.36 0.36 0.10 0.10 17.66 17.66 13.15 13.15 0.65 2.18 101.84 101.84 0.32 5.05 2503.94 2503.94 32.25 32.25
Average:
2.48 mg/l 0.77 mg/l 0.36 mg/l 0.10 mg/l 17.66 mg/l 13.15 µg/l 1.41 µg/l 101.84 µg/l 2.68 mg/l 2503.94 MPN/100mL 32.25 mg/l
0.0001545 lb/cf 0.0000479 lb/cf 0.0000222 lb/cf 0.0000061 lb/cf 0.0011025 lb/cf 0.0000008 lb/cf 0.0000001 lb/cf 0.0000064 lb/cf 0.0001675 lb/cf
0.0020132 lb/cf
Total Volume (Quarter Events):
95,025 cf
Pollutant Load (Quarter Events):
14.7 lbs 4.6 lbs 2.1 lbs 0.6 lbs 104.8 lbs 0.1 lbs 0.0 lbs 0.6 lbs 15.9 lbs
191.3 lbs
Total Volume (Quarter):
1,235,323 cf Pollutant Load (Quarter):
190.9 lbs 59.2 lbs 27.4 lbs 7.5 lbs 1,362.0 lbs 1.0 lbs 0.1 lbs 7.9 lbs 206.9 lbs
2,487.0 lbs
Winter Quarter Flow-Weighted EMC (1/23/17, 2/28/17, 3/31/17): 49.66 7.33 2.31 3.41 0.85 0.97 0.41 0.41 0.15 0.15 95.16 95.16 29.57 29.57 4.55 5.55 187.34 187.34 0.15 5.01 3971.33 3971.33 74.75 74.75
Average:
2.86 mg/l 0.91 mg/l 0.41 mg/l 0.15 mg/l 95.16 mg/l 29.57 µg/l 5.05 µg/l 187.34 µg/l 2.58 mg/l 3971.33 MPN/100mL 74.75 mg/l
0.0001786 lb/cf 0.0000566 lb/cf 0.0000258 lb/cf 0.0000097 lb/cf 0.0059395 lb/cf 0.0000018 lb/cf 0.0000003 lb/cf 0.0000117 lb/cf 0.0001610 lb/cf
0.0046654 lb/cf
Total Volume (Quarter Events):
246,485 cf Pollutant Load (Quarter Events):
44.0 lbs 14.0 lbs 6.4 lbs 2.4 lbs 1,464.0 lbs 0.5 lbs 0.1 lbs 2.9 lbs 39.7 lbs
1,149.9 lbs
Total Volume (Quarter):
2,585,072 cf Pollutant Load (Quarter):
461.6 lbs 146.3 lbs 66.6 lbs 25.0 lbs 15,354.1 lbs 4.8 lbs 0.8 lbs 30.2 lbs 416.2 lbs
12,060.4 lbs
Spring Quarter Flow-Weighted EMC (4/25/17, 5/12/17, 6/19/17): 58.63 7.73 2.37 3.49 0.47 0.75 0.28 0.28 0.10 0.10 21.64 21.64 17.51 17.51 1.24 3.00 136.33 136.33 1.31 5.16 16529.53 16529.53 31.84 31.84
Average:
2.93 mg/l 0.61 mg/l 0.28 mg/l 0.10 mg/l 21.64 mg/l 17.51 µg/l 2.12 µg/l 136.33 µg/l 3.23 mg/l 16529.53 MPN/100mL 31.84 mg/l
0.0001829 lb/cf 0.0000382 lb/cf 0.0000173 lb/cf 0.0000063 lb/cf 0.0013509 lb/cf 0.0000011 lb/cf 0.0000001 lb/cf 0.0000085 lb/cf 0.0002019 lb/cf
0.0019871 lb/cf
Total Volume (Quarter Events):
180,624 cf Pollutant Load (Quarter Events):
33.0 lbs 6.9 lbs 3.1 lbs 1.1 lbs 244.0 lbs 0.2 lbs 0.0 lbs 1.5 lbs 36.5 lbs
358.9 lbs
Total Volume (Quarter):
1,369,592 cf Pollutant Load (Quarter):
250.6 lbs 52.3 lbs 23.7 lbs 8.6 lbs 1,850.2 lbs 1.5 lbs 0.2 lbs 11.7 lbs 276.5 lbs
2,721.5 lbs
AVERAGE ANNUAL EMCs: 57.29 7.73 1.98 mg/l 0.74 mg/l 0.38 mg/l 0.13 mg/l 52.58 mg/l 21.20 µg/l 2.45 µg/l 152.16 µg/l 0.46 mg/l 7570.73 mg/l 46.22 mg/l
TOTAL ANNUAL POLLUTANT LOAD (EVENTS):
122.66 lbs 33.34 lbs 15.99 lbs 5.37 lbs 2,186.81 lbs 0.88 lbs 0.13 lbs 6.33 lbs 114.58 lbs
1,922.42 lbs
Per Acre:
2.03
0.55
0.26
0.09
36.20
0.014
0.002
0.105
1.90
31.82 TOTAL 2017 POLLUTANT LOAD:
1,246.59 lbs 345.98 lbs 166.67 lbs 55.22 lbs 22,722.01 lbs 8.97 lbs 1.33 lbs 64.24 lbs 1,149.74 lbs
19,738.13 lbs
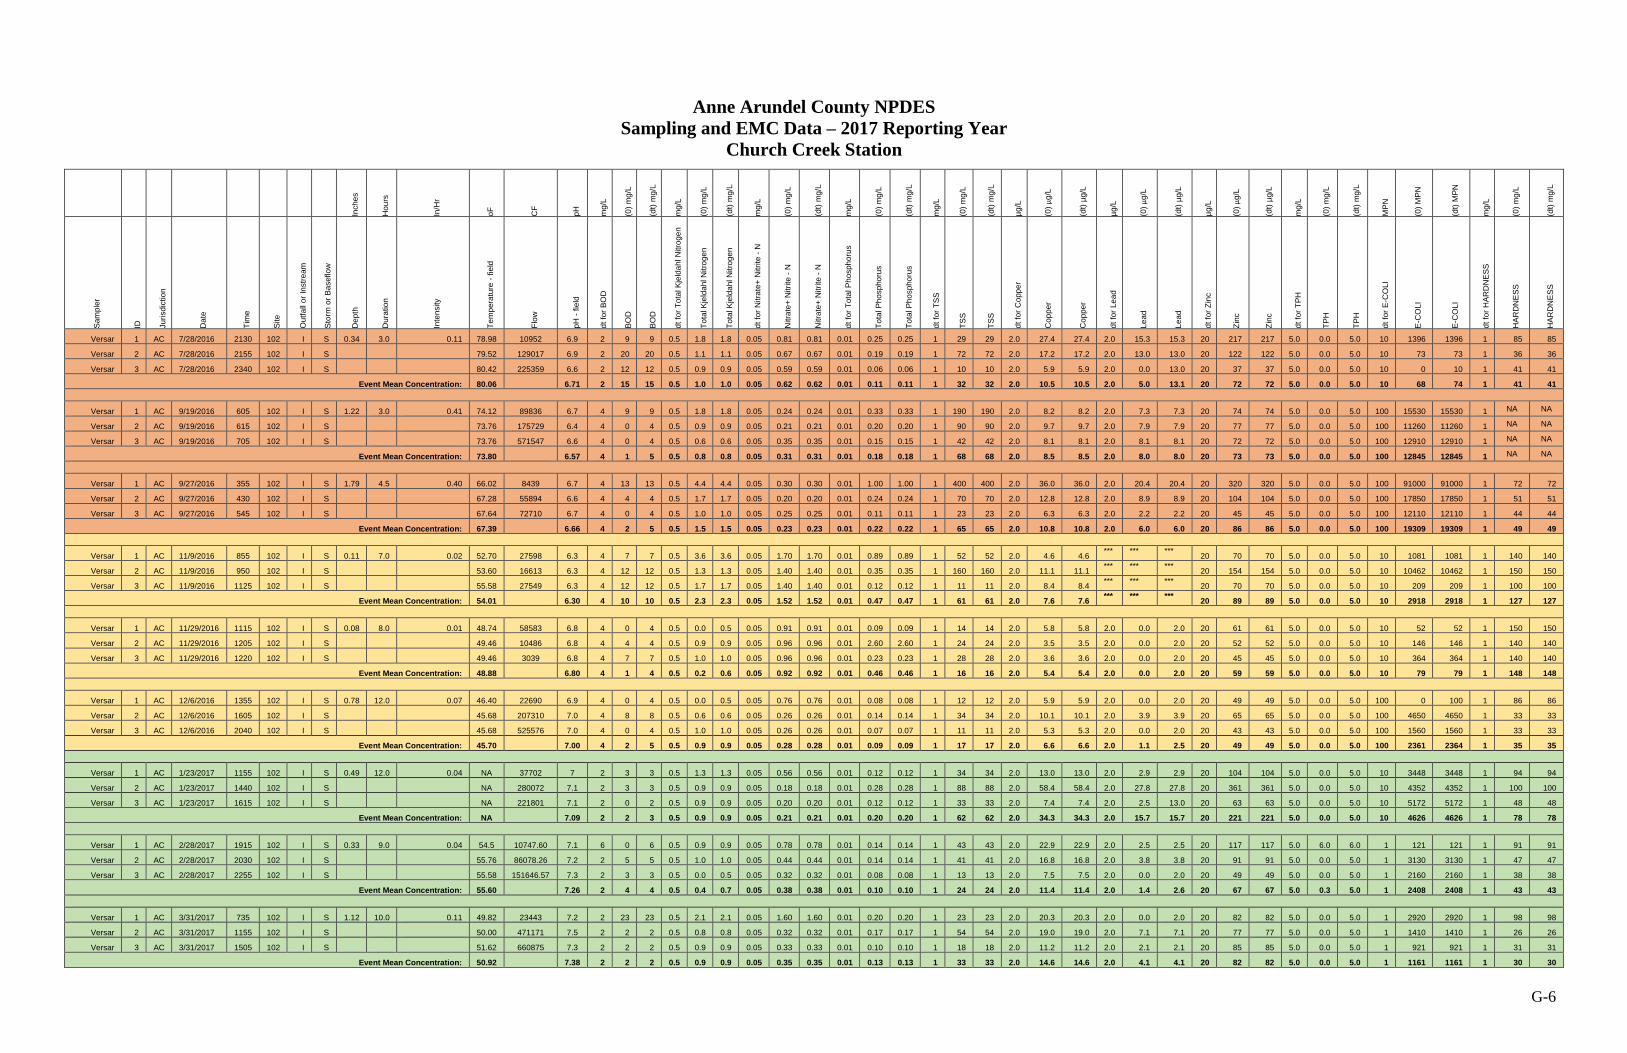
G-6
Anne Arundel County NPDES
Sampling and EMC Data – 2017 Reporting Year
Church Creek Station
Inch
es
Hou
rs
In/H
r
oF
CF
pH
mg
/L
(0)
mg
/L
(dt)
mg
/L
mg
/L
(0)
mg
/L
(dt)
mg
/L
mg
/L
(0)
mg
/L
(dt)
mg
/L
mg
/L
(0)
mg
/L
(dt)
mg
/L
mg
/L
(0)
mg
/L
(dt)
mg
/L
µg
/L
(0)
µg
/L
(dt)
µg/L
µg
/L
(0)
µg
/L
(dt)
µg/L
µg
/L
(0)
µg
/L
(dt)
µg/L
mg
/L
(0)
mg
/L
(dt)
mg
/L
MP
N
(0)
MP
N
(dt)
MP
N
mg
/L
(0)
mg
/L
(dt)
mg
/L
Sa
mp
ler
ID
Ju
risdic
tio
n
Date
Tim
e
Site
Ou
tfa
ll o
r In
str
eam
Sto
rm o
r B
aseflo
w
Dep
th
Dura
tio
n
Inte
nsity
Te
mp
era
ture
- f
ield
Flo
w
pH
- f
ield
dt
for
BO
D
BO
D
BO
D
dt
for
To
tal K
jeld
ah
l N
itro
ge
n
To
tal K
jeld
ah
l N
itro
ge
n
To
tal K
jeld
ah
l N
itro
ge
n
dt
for
Nitra
te+
Nitri
te -
N
Nitra
te+
Nitri
te -
N
Nitra
te+
Nitri
te -
N
dt
for
To
tal P
ho
sph
oru
s
To
tal P
ho
sp
ho
rus
To
tal P
ho
sp
ho
rus
dt
for
TS
S
TS
S
TS
S
dt
for
Co
pp
er
Cop
pe
r
Cop
pe
r
dt
for
Le
ad
Le
ad
Le
ad
dt
for
Zin
c
Zin
c
Zin
c
dt
for
TP
H
TP
H
TP
H
dt
for
E-C
OL
I
E-C
OL
I
E-C
OL
I
dt
for
HA
RD
NE
SS
HA
RD
NE
SS
HA
RD
NE
SS
Versar 1 AC 7/28/2016 2130 102 I S 0.34 3.0 0.11 78.98 10952 6.9 2 9 9 0.5 1.8 1.8 0.05 0.81 0.81 0.01 0.25 0.25 1 29 29 2.0 27.4 27.4 2.0 15.3 15.3 20 217 217 5.0 0.0 5.0 10 1396 1396 1 85 85
Versar 2 AC 7/28/2016 2155 102 I S 79.52 129017 6.9 2 20 20 0.5 1.1 1.1 0.05 0.67 0.67 0.01 0.19 0.19 1 72 72 2.0 17.2 17.2 2.0 13.0 13.0 20 122 122 5.0 0.0 5.0 10 73 73 1 36 36
Versar 3 AC 7/28/2016 2340 102 I S 80.42 225359 6.6 2 12 12 0.5 0.9 0.9 0.05 0.59 0.59 0.01 0.06 0.06 1 10 10 2.0 5.9 5.9 2.0 0.0 13.0 20 37 37 5.0 0.0 5.0 10 0 10 1 41 41
Event Mean Concentration: 80.06 6.71 2 15 15 0.5 1.0 1.0 0.05 0.62 0.62 0.01 0.11 0.11 1 32 32 2.0 10.5 10.5 2.0 5.0 13.1 20 72 72 5.0 0.0 5.0 10 68 74 1 41 41
Versar 1 AC 9/19/2016 605 102 I S 1.22 3.0 0.41 74.12 89836 6.7 4 9 9 0.5 1.8 1.8 0.05 0.24 0.24 0.01 0.33 0.33 1 190 190 2.0 8.2 8.2 2.0 7.3 7.3 20 74 74 5.0 0.0 5.0 100 15530 15530 1 NA NA
Versar 2 AC 9/19/2016 615 102 I S 73.76 175729 6.4 4 0 4 0.5 0.9 0.9 0.05 0.21 0.21 0.01 0.20 0.20 1 90 90 2.0 9.7 9.7 2.0 7.9 7.9 20 77 77 5.0 0.0 5.0 100 11260 11260 1 NA NA
Versar 3 AC 9/19/2016 705 102 I S 73.76 571547 6.6 4 0 4 0.5 0.6 0.6 0.05 0.35 0.35 0.01 0.15 0.15 1 42 42 2.0 8.1 8.1 2.0 8.1 8.1 20 72 72 5.0 0.0 5.0 100 12910 12910 1 NA NA
Event Mean Concentration: 73.80 6.57 4 1 5 0.5 0.8 0.8 0.05 0.31 0.31 0.01 0.18 0.18 1 68 68 2.0 8.5 8.5 2.0 8.0 8.0 20 73 73 5.0 0.0 5.0 100 12845 12845 1 NA NA
Versar 1 AC 9/27/2016 355 102 I S 1.79 4.5 0.40 66.02 8439 6.7 4 13 13 0.5 4.4 4.4 0.05 0.30 0.30 0.01 1.00 1.00 1 400 400 2.0 36.0 36.0 2.0 20.4 20.4 20 320 320 5.0 0.0 5.0 100 91000 91000 1 72 72
Versar 2 AC 9/27/2016 430 102 I S 67.28 55894 6.6 4 4 4 0.5 1.7 1.7 0.05 0.20 0.20 0.01 0.24 0.24 1 70 70 2.0 12.8 12.8 2.0 8.9 8.9 20 104 104 5.0 0.0 5.0 100 17850 17850 1 51 51
Versar 3 AC 9/27/2016 545 102 I S 67.64 72710 6.7 4 0 4 0.5 1.0 1.0 0.05 0.25 0.25 0.01 0.11 0.11 1 23 23 2.0 6.3 6.3 2.0 2.2 2.2 20 45 45 5.0 0.0 5.0 100 12110 12110 1 44 44
Event Mean Concentration: 67.39 6.66 4 2 5 0.5 1.5 1.5 0.05 0.23 0.23 0.01 0.22 0.22 1 65 65 2.0 10.8 10.8 2.0 6.0 6.0 20 86 86 5.0 0.0 5.0 100 19309 19309 1 49 49
Versar 1 AC 11/9/2016 855 102 I S 0.11 7.0 0.02 52.70 27598 6.3 4 7 7 0.5 3.6 3.6 0.05 1.70 1.70 0.01 0.89 0.89 1 52 52 2.0 4.6 4.6 *** *** ***
20 70 70 5.0 0.0 5.0 10 1081 1081 1 140 140
Versar 2 AC 11/9/2016 950 102 I S 53.60 16613 6.3 4 12 12 0.5 1.3 1.3 0.05 1.40 1.40 0.01 0.35 0.35 1 160 160 2.0 11.1 11.1 *** *** ***
20 154 154 5.0 0.0 5.0 10 10462 10462 1 150 150
Versar 3 AC 11/9/2016 1125 102 I S 55.58 27549 6.3 4 12 12 0.5 1.7 1.7 0.05 1.40 1.40 0.01 0.12 0.12 1 11 11 2.0 8.4 8.4 *** *** ***
20 70 70 5.0 0.0 5.0 10 209 209 1 100 100
Event Mean Concentration: 54.01 6.30 4 10 10 0.5 2.3 2.3 0.05 1.52 1.52 0.01 0.47 0.47 1 61 61 2.0 7.6 7.6 *** *** ***
20 89 89 5.0 0.0 5.0 10 2918 2918 1 127 127
Versar 1 AC 11/29/2016 1115 102 I S 0.08 8.0 0.01 48.74 58583 6.8 4 0 4 0.5 0.0 0.5 0.05 0.91 0.91 0.01 0.09 0.09 1 14 14 2.0 5.8 5.8 2.0 0.0 2.0 20 61 61 5.0 0.0 5.0 10 52 52 1 150 150
Versar 2 AC 11/29/2016 1205 102 I S 49.46 10486 6.8 4 4 4 0.5 0.9 0.9 0.05 0.96 0.96 0.01 2.60 2.60 1 24 24 2.0 3.5 3.5 2.0 0.0 2.0 20 52 52 5.0 0.0 5.0 10 146 146 1 140 140
Versar 3 AC 11/29/2016 1220 102 I S 49.46 3039 6.8 4 7 7 0.5 1.0 1.0 0.05 0.96 0.96 0.01 0.23 0.23 1 28 28 2.0 3.6 3.6 2.0 0.0 2.0 20 45 45 5.0 0.0 5.0 10 364 364 1 140 140
Event Mean Concentration: 48.88 6.80 4 1 4 0.5 0.2 0.6 0.05 0.92 0.92 0.01 0.46 0.46 1 16 16 2.0 5.4 5.4 2.0 0.0 2.0 20 59 59 5.0 0.0 5.0 10 79 79 1 148 148
Versar 1 AC 12/6/2016 1355 102 I S 0.78 12.0 0.07 46.40 22690 6.9 4 0 4 0.5 0.0 0.5 0.05 0.76 0.76 0.01 0.08 0.08 1 12 12 2.0 5.9 5.9 2.0 0.0 2.0 20 49 49 5.0 0.0 5.0 100 0 100 1 86 86
Versar 2 AC 12/6/2016 1605 102 I S 45.68 207310 7.0 4 8 8 0.5 0.6 0.6 0.05 0.26 0.26 0.01 0.14 0.14 1 34 34 2.0 10.1 10.1 2.0 3.9 3.9 20 65 65 5.0 0.0 5.0 100 4650 4650 1 33 33
Versar 3 AC 12/6/2016 2040 102 I S 45.68 525576 7.0 4 0 4 0.5 1.0 1.0 0.05 0.26 0.26 0.01 0.07 0.07 1 11 11 2.0 5.3 5.3 2.0 0.0 2.0 20 43 43 5.0 0.0 5.0 100 1560 1560 1 33 33
Event Mean Concentration: 45.70 7.00 4 2 5 0.5 0.9 0.9 0.05 0.28 0.28 0.01 0.09 0.09 1 17 17 2.0 6.6 6.6 2.0 1.1 2.5 20 49 49 5.0 0.0 5.0 100 2361 2364 1 35 35
Versar 1 AC 1/23/2017 1155 102 I S 0.49 12.0 0.04 NA 37702 7 2 3 3 0.5 1.3 1.3 0.05 0.56 0.56 0.01 0.12 0.12 1 34 34 2.0 13.0 13.0 2.0 2.9 2.9 20 104 104 5.0 0.0 5.0 10 3448 3448 1 94 94
Versar 2 AC 1/23/2017 1440 102 I S NA 280072 7.1 2 3 3 0.5 0.9 0.9 0.05 0.18 0.18 0.01 0.28 0.28 1 88 88 2.0 58.4 58.4 2.0 27.8 27.8 20 361 361 5.0 0.0 5.0 10 4352 4352 1 100 100
Versar 3 AC 1/23/2017 1615 102 I S NA 221801 7.1 2 0 2 0.5 0.9 0.9 0.05 0.20 0.20 0.01 0.12 0.12 1 33 33 2.0 7.4 7.4 2.0 2.5 13.0 20 63 63 5.0 0.0 5.0 10 5172 5172 1 48 48
Event Mean Concentration: NA 7.09 2 2 3 0.5 0.9 0.9 0.05 0.21 0.21 0.01 0.20 0.20 1 62 62 2.0 34.3 34.3 2.0 15.7 15.7 20 221 221 5.0 0.0 5.0 10 4626 4626 1 78 78
Versar 1 AC 2/28/2017 1915 102 I S 0.33 9.0 0.04 54.5 10747.60 7.1 6 0 6 0.5 0.9 0.9 0.05 0.78 0.78 0.01 0.14 0.14 1 43 43 2.0 22.9 22.9 2.0 2.5 2.5 20 117 117 5.0 6.0 6.0 1 121 121 1 91 91
Versar 2 AC 2/28/2017 2030 102 I S 55.76 86078.26 7.2 2 5 5 0.5 1.0 1.0 0.05 0.44 0.44 0.01 0.14 0.14 1 41 41 2.0 16.8 16.8 2.0 3.8 3.8 20 91 91 5.0 0.0 5.0 1 3130 3130 1 47 47
Versar 3 AC 2/28/2017 2255 102 I S 55.58 151646.57 7.3 2 3 3 0.5 0.0 0.5 0.05 0.32 0.32 0.01 0.08 0.08 1 13 13 2.0 7.5 7.5 2.0 0.0 2.0 20 49 49 5.0 0.0 5.0 1 2160 2160 1 38 38
Event Mean Concentration: 55.60 7.26 2 4 4 0.5 0.4 0.7 0.05 0.38 0.38 0.01 0.10 0.10 1 24 24 2.0 11.4 11.4 2.0 1.4 2.6 20 67 67 5.0 0.3 5.0 1 2408 2408 1 43 43
Versar 1 AC 3/31/2017 735 102 I S 1.12 10.0 0.11 49.82 23443 7.2 2 23 23 0.5 2.1 2.1 0.05 1.60 1.60 0.01 0.20 0.20 1 23 23 2.0 20.3 20.3 2.0 0.0 2.0 20 82 82 5.0 0.0 5.0 1 2920 2920 1 98 98
Versar 2 AC 3/31/2017 1155 102 I S 50.00 471171 7.5 2 2 2 0.5 0.8 0.8 0.05 0.32 0.32 0.01 0.17 0.17 1 54 54 2.0 19.0 19.0 2.0 7.1 7.1 20 77 77 5.0 0.0 5.0 1 1410 1410 1 26 26
Versar 3 AC 3/31/2017 1505 102 I S 51.62 660875 7.3 2 2 2 0.5 0.9 0.9 0.05 0.33 0.33 0.01 0.10 0.10 1 18 18 2.0 11.2 11.2 2.0 2.1 2.1 20 85 85 5.0 0.0 5.0 1 921 921 1 31 31
Event Mean Concentration: 50.92 7.38 2 2 2 0.5 0.9 0.9 0.05 0.35 0.35 0.01 0.13 0.13 1 33 33 2.0 14.6 14.6 2.0 4.1 4.1 20 82 82 5.0 0.0 5.0 1 1161 1161 1 30 30
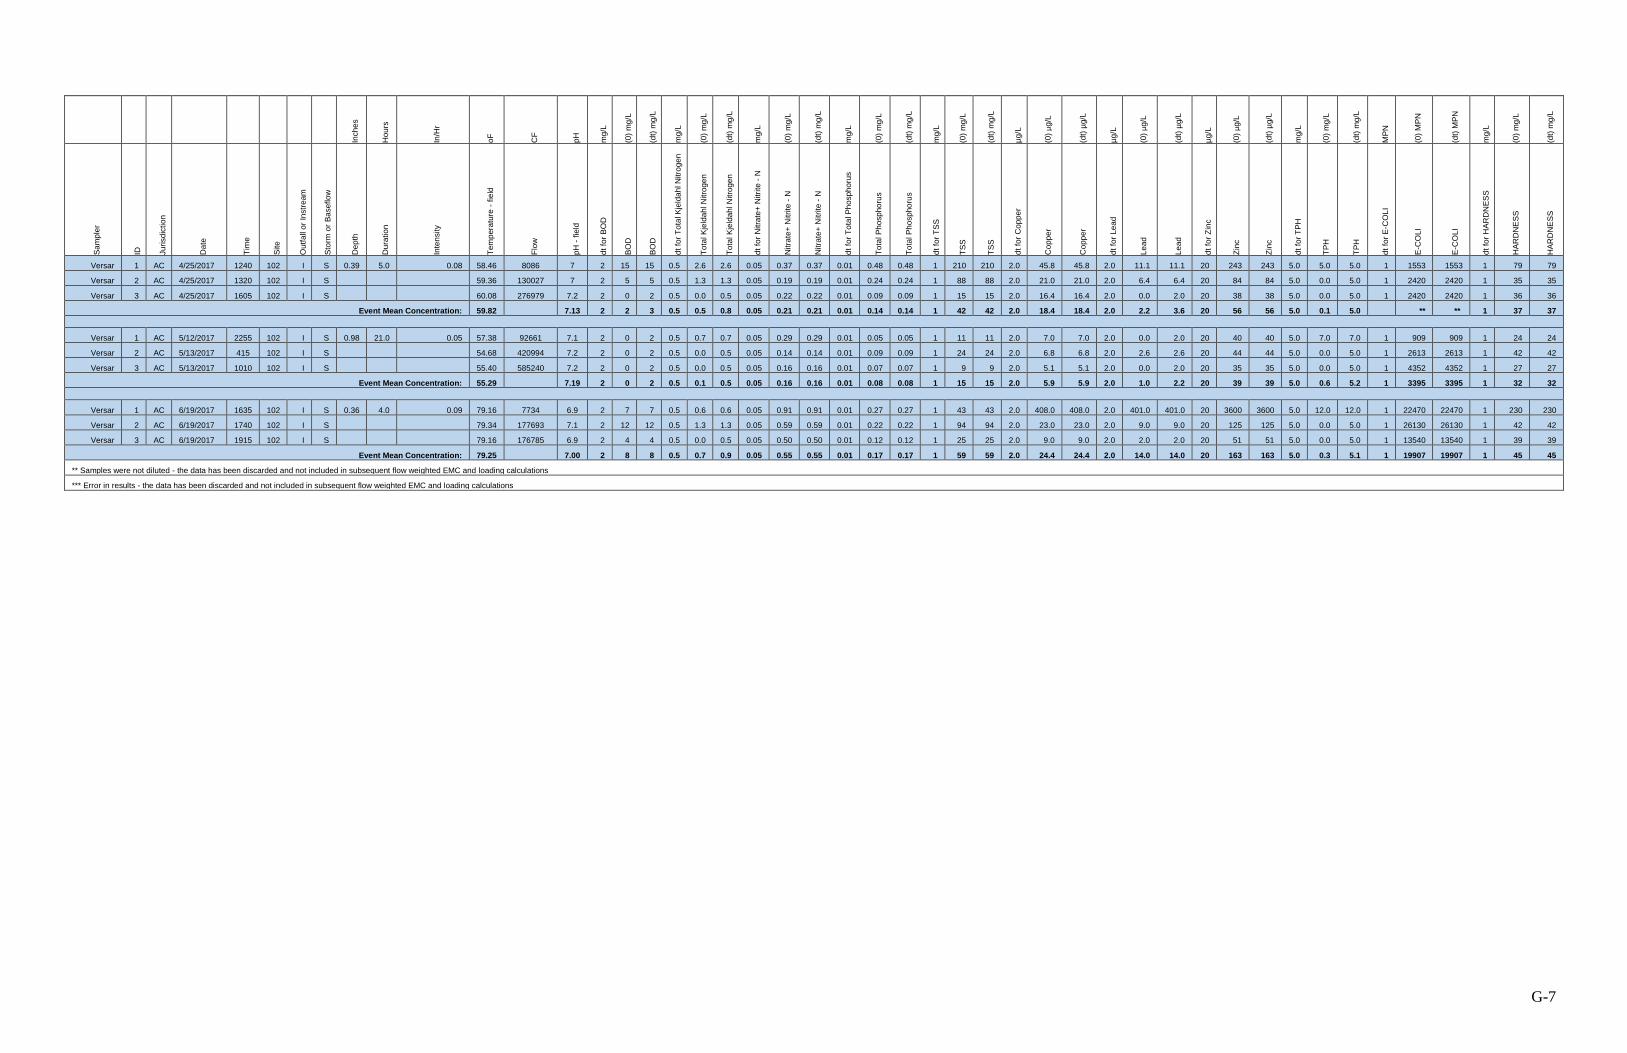
G-7
Inch
es
Hou
rs
In/H
r
oF
CF
pH
mg
/L
(0)
mg
/L
(dt)
mg
/L
mg
/L
(0)
mg
/L
(dt)
mg
/L
mg
/L
(0)
mg
/L
(dt)
mg
/L
mg
/L
(0)
mg
/L
(dt)
mg
/L
mg
/L
(0)
mg
/L
(dt)
mg
/L
µg
/L
(0)
µg
/L
(dt)
µg/L
µg
/L
(0)
µg
/L
(dt)
µg/L
µg
/L
(0)
µg
/L
(dt)
µg/L
mg
/L
(0)
mg
/L
(dt)
mg
/L
MP
N
(0)
MP
N
(dt)
MP
N
mg
/L
(0)
mg
/L
(dt)
mg
/L
Sa
mp
ler
ID
Ju
risdic
tio
n
Date
Tim
e
Site
Ou
tfa
ll o
r In
str
eam
Sto
rm o
r B
aseflo
w
Dep
th
Dura
tio
n
Inte
nsity
Te
mp
era
ture
- f
ield
Flo
w
pH
- f
ield
dt
for
BO
D
BO
D
BO
D
dt
for
To
tal K
jeld
ah
l N
itro
ge
n
To
tal K
jeld
ah
l N
itro
ge
n
To
tal K
jeld
ah
l N
itro
ge
n
dt
for
Nitra
te+
Nitri
te -
N
Nitra
te+
Nitri
te -
N
Nitra
te+
Nitri
te -
N
dt
for
To
tal P
ho
sph
oru
s
To
tal P
ho
sp
ho
rus
To
tal P
ho
sp
ho
rus
dt
for
TS
S
TS
S
TS
S
dt
for
Co
pp
er
Cop
pe
r
Cop
pe
r
dt
for
Le
ad
Le
ad
Le
ad
dt
for
Zin
c
Zin
c
Zin
c
dt
for
TP
H
TP
H
TP
H
dt
for
E-C
OL
I
E-C
OL
I
E-C
OL
I
dt
for
HA
RD
NE
SS
HA
RD
NE
SS
HA
RD
NE
SS
Versar 1 AC 4/25/2017 1240 102 I S 0.39 5.0 0.08 58.46 8086 7 2 15 15 0.5 2.6 2.6 0.05 0.37 0.37 0.01 0.48 0.48 1 210 210 2.0 45.8 45.8 2.0 11.1 11.1 20 243 243 5.0 5.0 5.0 1 1553 1553 1 79 79
Versar 2 AC 4/25/2017 1320 102 I S 59.36 130027 7 2 5 5 0.5 1.3 1.3 0.05 0.19 0.19 0.01 0.24 0.24 1 88 88 2.0 21.0 21.0 2.0 6.4 6.4 20 84 84 5.0 0.0 5.0 1 2420 2420 1 35 35
Versar 3 AC 4/25/2017 1605 102 I S 60.08 276979 7.2 2 0 2 0.5 0.0 0.5 0.05 0.22 0.22 0.01 0.09 0.09 1 15 15 2.0 16.4 16.4 2.0 0.0 2.0 20 38 38 5.0 0.0 5.0 1 2420 2420 1 36 36
Event Mean Concentration: 59.82 7.13 2 2 3 0.5 0.5 0.8 0.05 0.21 0.21 0.01 0.14 0.14 1 42 42 2.0 18.4 18.4 2.0 2.2 3.6 20 56 56 5.0 0.1 5.0 ** ** 1 37 37
Versar 1 AC 5/12/2017 2255 102 I S 0.98 21.0 0.05 57.38 92661 7.1 2 0 2 0.5 0.7 0.7 0.05 0.29 0.29 0.01 0.05 0.05 1 11 11 2.0 7.0 7.0 2.0 0.0 2.0 20 40 40 5.0 7.0 7.0 1 909 909 1 24 24
Versar 2 AC 5/13/2017 415 102 I S 54.68 420994 7.2 2 0 2 0.5 0.0 0.5 0.05 0.14 0.14 0.01 0.09 0.09 1 24 24 2.0 6.8 6.8 2.0 2.6 2.6 20 44 44 5.0 0.0 5.0 1 2613 2613 1 42 42
Versar 3 AC 5/13/2017 1010 102 I S 55.40 585240 7.2 2 0 2 0.5 0.0 0.5 0.05 0.16 0.16 0.01 0.07 0.07 1 9 9 2.0 5.1 5.1 2.0 0.0 2.0 20 35 35 5.0 0.0 5.0 1 4352 4352 1 27 27
Event Mean Concentration: 55.29 7.19 2 0 2 0.5 0.1 0.5 0.05 0.16 0.16 0.01 0.08 0.08 1 15 15 2.0 5.9 5.9 2.0 1.0 2.2 20 39 39 5.0 0.6 5.2 1 3395 3395 1 32 32
Versar 1 AC 6/19/2017 1635 102 I S 0.36 4.0 0.09 79.16 7734 6.9 2 7 7 0.5 0.6 0.6 0.05 0.91 0.91 0.01 0.27 0.27 1 43 43 2.0 408.0 408.0 2.0 401.0 401.0 20 3600 3600 5.0 12.0 12.0 1 22470 22470 1 230 230
Versar 2 AC 6/19/2017 1740 102 I S 79.34 177693 7.1 2 12 12 0.5 1.3 1.3 0.05 0.59 0.59 0.01 0.22 0.22 1 94 94 2.0 23.0 23.0 2.0 9.0 9.0 20 125 125 5.0 0.0 5.0 1 26130 26130 1 42 42
Versar 3 AC 6/19/2017 1915 102 I S 79.16 176785 6.9 2 4 4 0.5 0.0 0.5 0.05 0.50 0.50 0.01 0.12 0.12 1 25 25 2.0 9.0 9.0 2.0 2.0 2.0 20 51 51 5.0 0.0 5.0 1 13540 13540 1 39 39
Event Mean Concentration: 79.25 7.00 2 8 8 0.5 0.7 0.9 0.05 0.55 0.55 0.01 0.17 0.17 1 59 59 2.0 24.4 24.4 2.0 14.0 14.0 20 163 163 5.0 0.3 5.1 1 19907 19907 1 45 45
** Samples were not diluted - the data has been discarded and not included in subsequent flow weighted EMC and loading calculations
*** Error in results - the data has been discarded and not included in subsequent flow weighted EMC and loading calculations
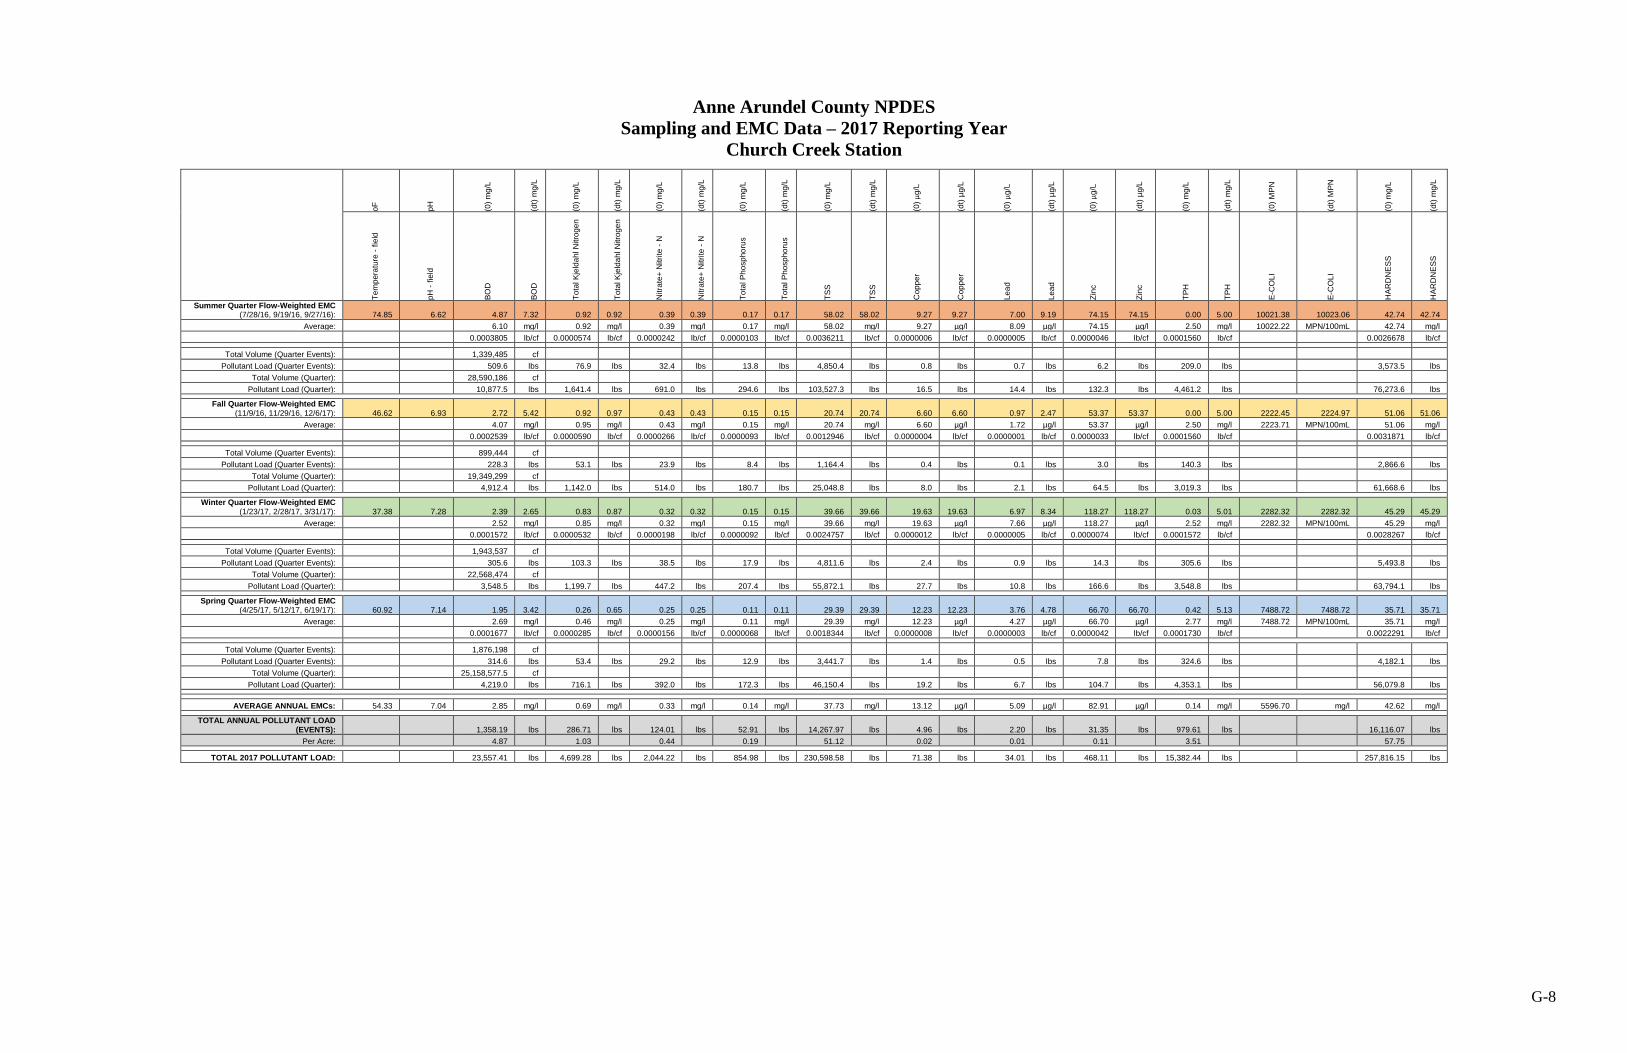
G-8
Anne Arundel County NPDES
Sampling and EMC Data – 2017 Reporting Year
Church Creek Station
oF
pH
(0)
mg
/L
(dt)
mg
/L
(0)
mg
/L
(dt)
mg
/L
(0)
mg
/L
(dt)
mg
/L
(0)
mg
/L
(dt)
mg
/L
(0)
mg
/L
(dt)
mg
/L
(0)
µg
/L
(dt)
µg/L
(0)
µg
/L
(dt)
µg/L
(0)
µg
/L
(dt)
µg/L
(0)
mg
/L
(dt)
mg
/L
(0)
MP
N
(dt)
MP
N
(0)
mg
/L
(dt)
mg
/L
Te
mp
era
ture
- f
ield
pH
- f
ield
BO
D
BO
D
To
tal K
jeld
ah
l N
itro
ge
n
To
tal K
jeld
ah
l N
itro
ge
n
Nitra
te+
Nitri
te -
N
Nitra
te+
Nitri
te -
N
To
tal P
ho
sp
ho
rus
To
tal P
ho
sp
ho
rus
TS
S
TS
S
Cop
pe
r
Cop
pe
r
Le
ad
Le
ad
Zin
c
Zin
c
TP
H
TP
H
E-C
OL
I
E-C
OL
I
HA
RD
NE
SS
HA
RD
NE
SS
Summer Quarter Flow-Weighted EMC (7/28/16, 9/19/16, 9/27/16): 74.85 6.62 4.87 7.32 0.92 0.92 0.39 0.39 0.17 0.17 58.02 58.02 9.27 9.27 7.00 9.19 74.15 74.15 0.00 5.00 10021.38 10023.06 42.74 42.74
Average:
6.10 mg/l 0.92 mg/l 0.39 mg/l 0.17 mg/l 58.02 mg/l 9.27 µg/l 8.09 µg/l 74.15 µg/l 2.50 mg/l 10022.22 MPN/100mL 42.74 mg/l
0.0003805 lb/cf 0.0000574 lb/cf 0.0000242 lb/cf 0.0000103 lb/cf 0.0036211 lb/cf 0.0000006 lb/cf 0.0000005 lb/cf 0.0000046 lb/cf 0.0001560 lb/cf
0.0026678 lb/cf
Total Volume (Quarter Events):
1,339,485 cf Pollutant Load (Quarter Events):
509.6 lbs 76.9 lbs 32.4 lbs 13.8 lbs 4,850.4 lbs 0.8 lbs 0.7 lbs 6.2 lbs 209.0 lbs
3,573.5 lbs
Total Volume (Quarter):
28,590,186 cf Pollutant Load (Quarter):
10,877.5 lbs 1,641.4 lbs 691.0 lbs 294.6 lbs 103,527.3 lbs 16.5 lbs 14.4 lbs 132.3 lbs 4,461.2 lbs
76,273.6 lbs
Fall Quarter Flow-Weighted EMC (11/9/16, 11/29/16, 12/6/17): 46.62 6.93 2.72 5.42 0.92 0.97 0.43 0.43 0.15 0.15 20.74 20.74 6.60 6.60 0.97 2.47 53.37 53.37 0.00 5.00 2222.45 2224.97 51.06 51.06
Average:
4.07 mg/l 0.95 mg/l 0.43 mg/l 0.15 mg/l 20.74 mg/l 6.60 µg/l 1.72 µg/l 53.37 µg/l 2.50 mg/l 2223.71 MPN/100mL 51.06 mg/l
0.0002539 lb/cf 0.0000590 lb/cf 0.0000266 lb/cf 0.0000093 lb/cf 0.0012946 lb/cf 0.0000004 lb/cf 0.0000001 lb/cf 0.0000033 lb/cf 0.0001560 lb/cf
0.0031871 lb/cf
Total Volume (Quarter Events):
899,444 cf
Pollutant Load (Quarter Events):
228.3 lbs 53.1 lbs 23.9 lbs 8.4 lbs 1,164.4 lbs 0.4 lbs 0.1 lbs 3.0 lbs 140.3 lbs
2,866.6 lbs
Total Volume (Quarter):
19,349,299 cf Pollutant Load (Quarter):
4,912.4 lbs 1,142.0 lbs 514.0 lbs 180.7 lbs 25,048.8 lbs 8.0 lbs 2.1 lbs 64.5 lbs 3,019.3 lbs
61,668.6 lbs
Winter Quarter Flow-Weighted EMC (1/23/17, 2/28/17, 3/31/17): 37.38 7.28 2.39 2.65 0.83 0.87 0.32 0.32 0.15 0.15 39.66 39.66 19.63 19.63 6.97 8.34 118.27 118.27 0.03 5.01 2282.32 2282.32 45.29 45.29
Average:
2.52 mg/l 0.85 mg/l 0.32 mg/l 0.15 mg/l 39.66 mg/l 19.63 µg/l 7.66 µg/l 118.27 µg/l 2.52 mg/l 2282.32 MPN/100mL 45.29 mg/l
0.0001572 lb/cf 0.0000532 lb/cf 0.0000198 lb/cf 0.0000092 lb/cf 0.0024757 lb/cf 0.0000012 lb/cf 0.0000005 lb/cf 0.0000074 lb/cf 0.0001572 lb/cf
0.0028267 lb/cf
Total Volume (Quarter Events):
1,943,537 cf Pollutant Load (Quarter Events):
305.6 lbs 103.3 lbs 38.5 lbs 17.9 lbs 4,811.6 lbs 2.4 lbs 0.9 lbs 14.3 lbs 305.6 lbs
5,493.8 lbs
Total Volume (Quarter):
22,568,474 cf Pollutant Load (Quarter):
3,548.5 lbs 1,199.7 lbs 447.2 lbs 207.4 lbs 55,872.1 lbs 27.7 lbs 10.8 lbs 166.6 lbs 3,548.8 lbs
63,794.1 lbs
Spring Quarter Flow-Weighted EMC (4/25/17, 5/12/17, 6/19/17): 60.92 7.14 1.95 3.42 0.26 0.65 0.25 0.25 0.11 0.11 29.39 29.39 12.23 12.23 3.76 4.78 66.70 66.70 0.42 5.13 7488.72 7488.72 35.71 35.71
Average:
2.69 mg/l 0.46 mg/l 0.25 mg/l 0.11 mg/l 29.39 mg/l 12.23 µg/l 4.27 µg/l 66.70 µg/l 2.77 mg/l 7488.72 MPN/100mL 35.71 mg/l
0.0001677 lb/cf 0.0000285 lb/cf 0.0000156 lb/cf 0.0000068 lb/cf 0.0018344 lb/cf 0.0000008 lb/cf 0.0000003 lb/cf 0.0000042 lb/cf 0.0001730 lb/cf
0.0022291 lb/cf
Total Volume (Quarter Events):
1,876,198 cf Pollutant Load (Quarter Events):
314.6 lbs 53.4 lbs 29.2 lbs 12.9 lbs 3,441.7 lbs 1.4 lbs 0.5 lbs 7.8 lbs 324.6 lbs
4,182.1 lbs
Total Volume (Quarter):
25,158,577.5 cf Pollutant Load (Quarter):
4,219.0 lbs 716.1 lbs 392.0 lbs 172.3 lbs 46,150.4 lbs 19.2 lbs 6.7 lbs 104.7 lbs 4,353.1 lbs
56,079.8 lbs
AVERAGE ANNUAL EMCs: 54.33 7.04 2.85 mg/l 0.69 mg/l 0.33 mg/l 0.14 mg/l 37.73 mg/l 13.12 µg/l 5.09 µg/l 82.91 µg/l 0.14 mg/l 5596.70 mg/l 42.62 mg/l
TOTAL ANNUAL POLLUTANT LOAD (EVENTS):
1,358.19 lbs 286.71 lbs 124.01 lbs 52.91 lbs 14,267.97 lbs 4.96 lbs 2.20 lbs 31.35 lbs 979.61 lbs
16,116.07 lbs
Per Acre:
4.87
1.03
0.44
0.19
51.12
0.02
0.01
0.11
3.51
57.75 TOTAL 2017 POLLUTANT LOAD:
23,557.41 lbs 4,699.28 lbs 2,044.22 lbs 854.98 lbs 230,598.58 lbs 71.38 lbs 34.01 lbs 468.11 lbs 15,382.44 lbs
257,816.15 lbs
Appendix H
H-1
APPENDIX H
BMP CODES

Appendix H
H-2
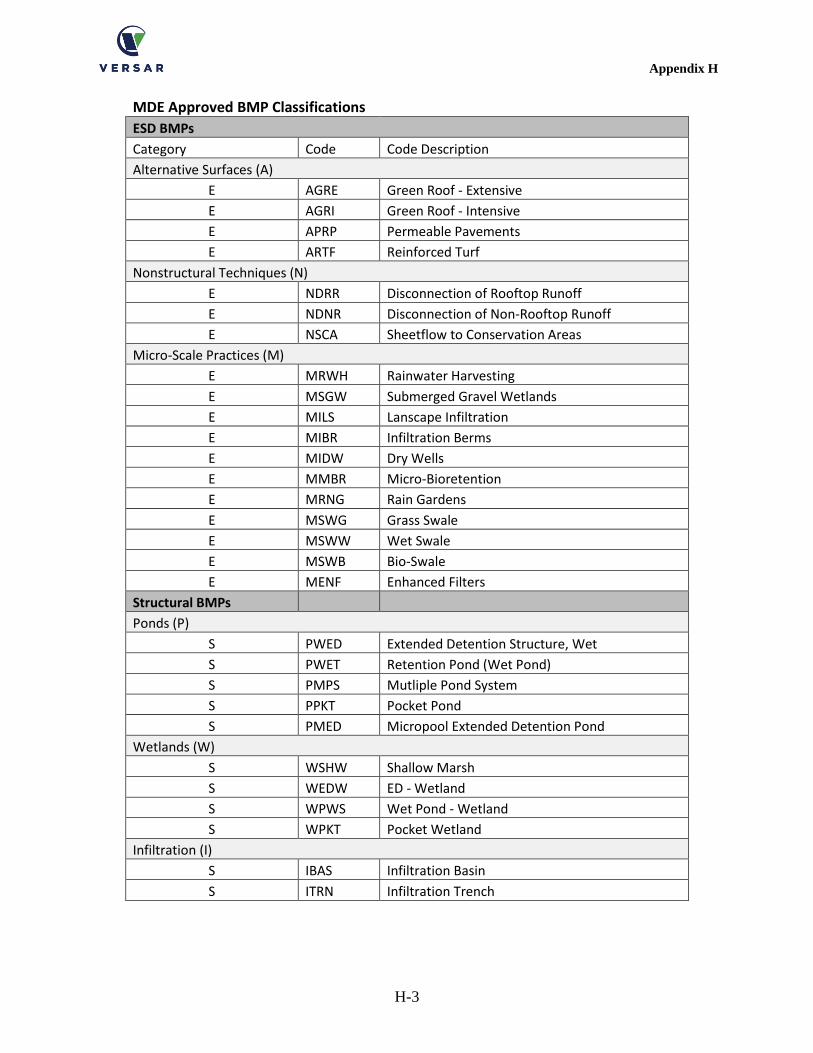
Appendix H
H-3
MDE Approved BMP Classifications ESD BMPs
Category Code Code Description
Alternative Surfaces (A)
E AGRE Green Roof - Extensive
E AGRI Green Roof - Intensive
E APRP Permeable Pavements
E ARTF Reinforced Turf
Nonstructural Techniques (N)
E NDRR Disconnection of Rooftop Runoff
E NDNR Disconnection of Non-Rooftop Runoff
E NSCA Sheetflow to Conservation Areas
Micro-Scale Practices (M)
E MRWH Rainwater Harvesting
E MSGW Submerged Gravel Wetlands
E MILS Lanscape Infiltration
E MIBR Infiltration Berms
E MIDW Dry Wells
E MMBR Micro-Bioretention
E MRNG Rain Gardens
E MSWG Grass Swale
E MSWW Wet Swale
E MSWB Bio-Swale
E MENF Enhanced Filters
Structural BMPs
Ponds (P)
S PWED Extended Detention Structure, Wet
S PWET Retention Pond (Wet Pond)
S PMPS Mutliple Pond System
S PPKT Pocket Pond
S PMED Micropool Extended Detention Pond
Wetlands (W)
S WSHW Shallow Marsh
S WEDW ED - Wetland
S WPWS Wet Pond - Wetland
S WPKT Pocket Wetland
Infiltration (I)
S IBAS Infiltration Basin
S ITRN Infiltration Trench
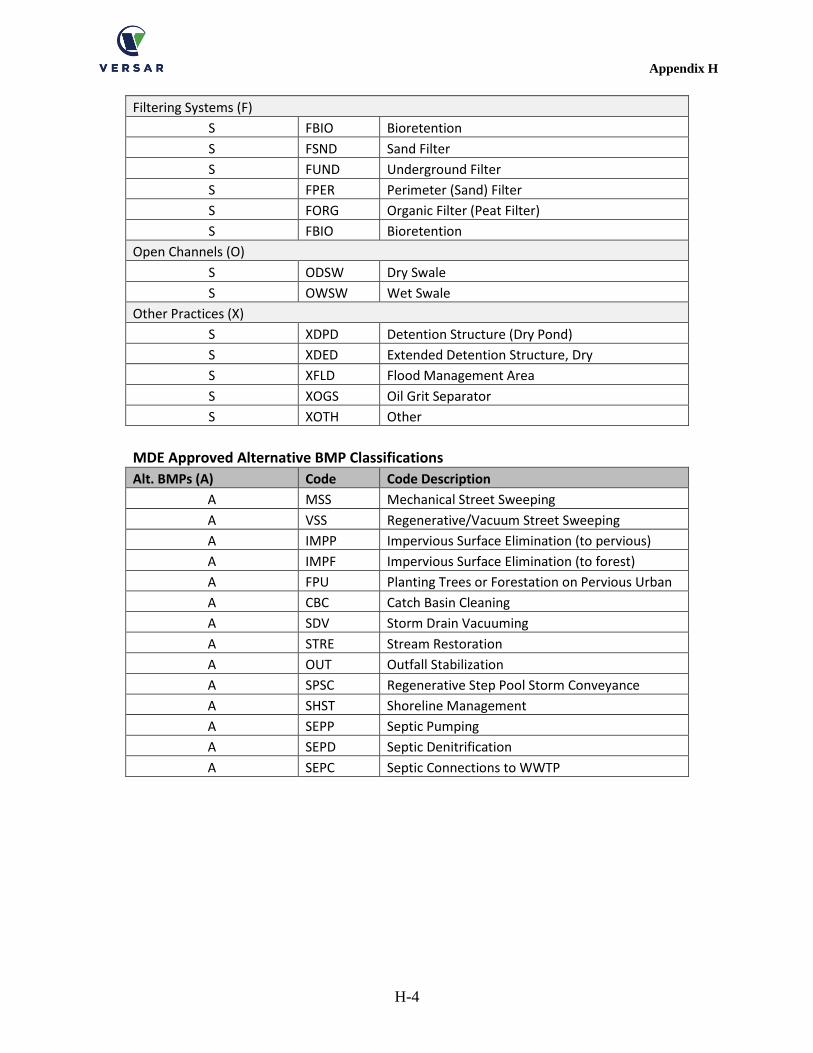
Appendix H
H-4
Filtering Systems (F)
S FBIO Bioretention
S FSND Sand Filter
S FUND Underground Filter
S FPER Perimeter (Sand) Filter
S FORG Organic Filter (Peat Filter)
S FBIO Bioretention
Open Channels (O)
S ODSW Dry Swale
S OWSW Wet Swale
Other Practices (X)
S XDPD Detention Structure (Dry Pond)
S XDED Extended Detention Structure, Dry
S XFLD Flood Management Area
S XOGS Oil Grit Separator
S XOTH Other
MDE Approved Alternative BMP Classifications
Alt. BMPs (A) Code Code Description
A MSS Mechanical Street Sweeping
A VSS Regenerative/Vacuum Street Sweeping
A IMPP Impervious Surface Elimination (to pervious)
A IMPF Impervious Surface Elimination (to forest)
A FPU Planting Trees or Forestation on Pervious Urban
A CBC Catch Basin Cleaning
A SDV Storm Drain Vacuuming
A STRE Stream Restoration
A OUT Outfall Stabilization
A SPSC Regenerative Step Pool Storm Conveyance
A SHST Shoreline Management
A SEPP Septic Pumping
A SEPD Septic Denitrification
A SEPC Septic Connections to WWTP

Appendix I
I-1
APPENDIX I
BMP ACRONYMS

Appendix I
I-2
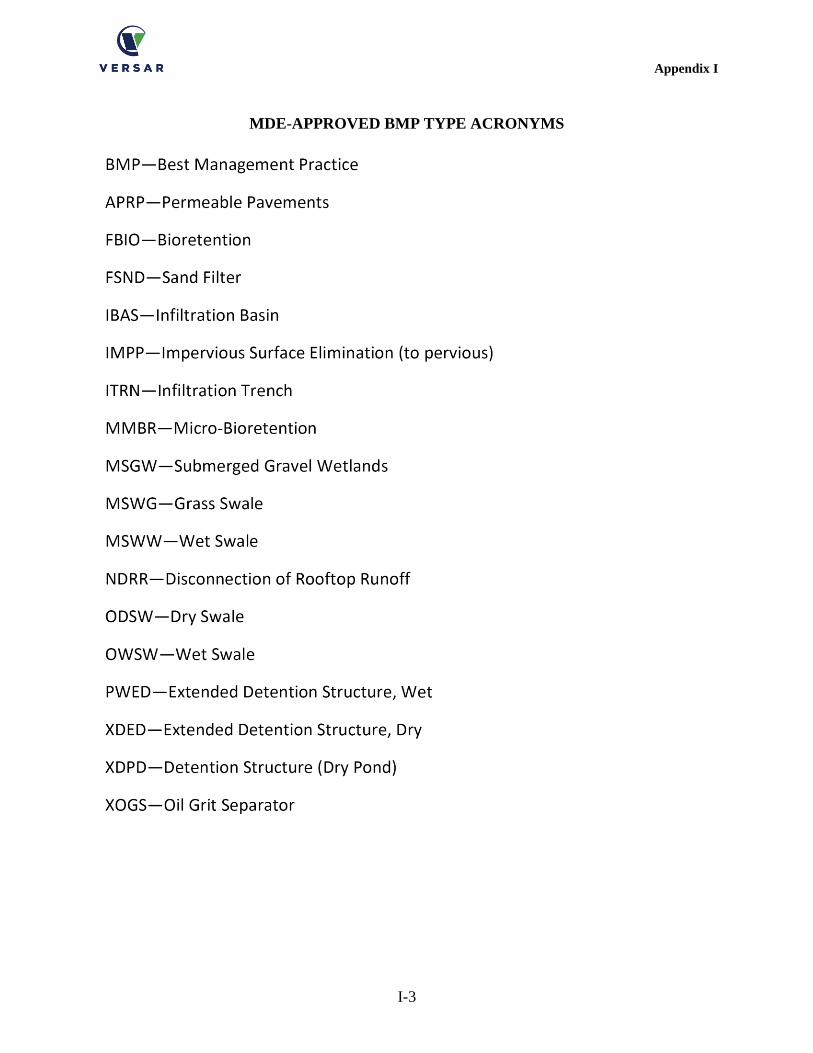
Appendix I
I-3
MDE-APPROVED BMP TYPE ACRONYMS

Appendix I
I-4


