physico-chemical and biological characterization of …
TRANSCRIPT

PHYSICO-CHEMICAL AND BIOLOGICAL CHARACTERIZATION OF SOILS FROM SELECTED FARMLANDS AROUND THREE MINING SITES IN
PHALABORWA, LIMPOPO PROVINCE
by
MASETLE NELSON RAMAHLO
MINI-DISSERTATION
Submitted in partial fulfillment of the requirements for the degree of
MASTER OF SCIENCE
in
AGRICULTURE (SOIL SCIENCE)
in the
FACULTY OF SCIENCE AND AGRICULTURE (School of Agricultural and Environmental Sciences)
at the
UNIVERSITY OF LIMPOPO
SUPERVISOR: PROF. FR KUTU CO-SUPERVISOR: MR. VL MULAUDZI
2013

ii
DEDICATION
I dedicate this mini-dissertation to the following people who at various times had
made meaningful contributions to my life:
• My mother for being a pillar of my strength and support throughout the period of
my study.
• My brother Geoffrey and my sister Jane for their motivational support.
• My high school teacher, Mr PE Ramokgata for the courage, motivation and his
prayers.
• Pastor MJ Makgopa for his spiritual support.
• And above all, to God who gave me life and made all things possible.

iii
DECLARATION
I declare that this research project titled ‘Physico-chemical and biological
characterization of soils from selected farmlands around three mining sites in
Phalaborwa, Limpopo Province’ is my own work and that all the sources that I have
used or quoted have been indicated and acknowledged by means of complete
references and that this work has not been submitted before for any other degree at
any other institution.
______________________ __________________ M. N. RAMAHLO DATE

iv
ACKNOWLEDGEMENTS
I would like to acknowledge with thanks, the following people and organisations for
their contributions to this study:
Prof FR Kutu, my supervisor, for investing tirelessly his time and efforts in my
research work through his commitment, regular availability and accessibility,
motivational and always ready to assist. He is greatly acknowledged for his
remarkable contribution including human and financial resources to support me.
My sincere thanks also go to Mr VL Mulaudzi for the co-supervision role he played
and thus demonstrated his commitment to ensure that the project becomes a
success.
The assistance received from Mr OHJ Owen and his technical team from ARC-Grain
Crops Institute, Potchefstroom for the microbiological data is highly appreciated. I
also acknowledge with thanks, my various financial support sources particularly the
National Research Foundation (NRF) South Africa through Prof Kutu’s research
grant (Grant number 76215) for the support to visit my study sites and also partly
assist with covering the cost for my laboratory analysis. Finally, my sincere
appreciation goes to the management of Leon Tom, Mogoboya, Hans Merensky and
Waterbok Farms used in this study for granting me permission and access to their
facilities.
v
ABSTRACT
The study was conducted to assess the impact of mining activities on selected soil
physical, chemical and microbial properties on farmlands around three selected
mining sites. Nine soil samples were collected from each of the following farms :
Hans Merensky, Mogoboya and Leon Tom, Foskor Mine and JCI mining sites,
respectively. Additional nine soil samples were collected from non-polluted
Waterbok farm that serves as a control for the purpose of comparison. The samples
were taken at 0–15, 15–30, 30–45 cm depths at three sampling points on each farm
for physical, chemical and biological studies. However, soil samples collected for
microbial (fungi, bacteria and actinomycetes) counts were surface (0–15 cm) soil
samples. Soil chemical properties determined include pHw, electrical conductivity
(ECe), exchangeable acidity (EA), organic carbon, available phosphorous,
exchangeable cations as well as heavy metal (i.e. Mn, Zn, Cu, Pb, Cd, As and Sb)
concentrations. The physical parameters determined include texture (sand, silt and
clay) as well as bulk density.
Soil pHw and ECe values decreased with depth; and ranged from 6.94 to 6.50 and
from 12.24 to 10.76 mS cm-1, respectively. Exchangeable acidity showed a gradual
increase with depth and ranged from 0.72 to 0.80 cmol(+)(kg), while percent organic
carbon decreased with depth ranging from 1.41 to 2.19 %. Exchangeable cations,
particularly K and Mg increased with depth while Ca decreased marginally with soil
depth. Available phosphorous content decreased following increases in distance
from the pollution source while heavy met.al contamination decreased with soil depth
but increased further away from the pollution source. Significantly high loads of Pb,
As and Sb were recorded at all depths on the three farms around the mining sites,
which were largely responsible for the pollution but worse on the Leon Tom farm;
with Pb constituting the greatest pollutant. The concentration of extractable heavy
metals in the studied areas was in the order: As >Sb>Pb>Zn>Cu >Mn >Cd.
Cadmium level appeared generally very low in all samples while elevated levels of
Mn, Cu and Zn were detected at all depths in the polluted soils.
Significant differences in microbial levels were detected at the various sampling
points. The highest count of 3.82 and 6.20 CFU g-1 for fungi and actinomycete,
respectively were both from the Leon Tom farm, while 6.46 CFU g-1 counts for

vi
bacteria was obtained from Mogoboya farm. Interestingly, fungal and actinomycetes
activities were more sensitive to heavy metal contamination than bacteria that were
significantly increased following soil pollution.
Keywords: Mining; heavy metals; soil microbes; soil fertility; soil pollution

vii
TABLE OF CONTENTS
Content Page TITLE PAGE I
DEDICATION Ii
DECLARATION Iii
ACKNOWLEDGEMENT Iv
ABSTRACT v
TABLE OF CONTENTS vii
LIST OF FIGURES ix
LIST OF TABLES x
CHAPTER 1: GENERAL INTRODUCTION 1
1.1 Background information to the study 1
1.2 Problem statement 1
1.3 Motivation of the study 2
1.4 Purpose of the study 2
1.4.1 Aim 2
1.4.2 Objectives 2
1.5 Hypotheses 2
CHAPTER 2: LITERATURE REVIEW 3
2.1 Limpopo Province as a mining Province 3
2.2 Impact of mining activities on soil and environment 3
2.3 Effect of mine pollution on agricultural productivity 5
2.4 Spatial distribution of mine pollutants in soil 5
2.5 Relevance of physico-chemical and mineralogical characterization of
soil
6
2.6 Indicators of environmental pollution in the study area 7
CHAPTER 3: RESEARCH METHODOLOGY 9
3.1 Description of study sites 9
3.2 Description of soil sampling procedures 11
3.3 Laboratory determination on soil samples 11
3.3.1 Procedures for physical and chemical analysis 11
3.3.2 Methodology for microbial counts 11
3.4 Data analysis 12
viii
CHAPTER 4: RESULTS AND DISCUSSIONS 14
4.1 Physical properties of the soil samples collected from the different
farms
14
4.2 Chemical properties of the soil samples collected from the different farms
15
4.3 Extractable micronutrients and heavy metal distribution in the samples 19
4.3.1 Concentration of extractable cations 19
4.3.2 Heavy metal distribution in the soil samples 20
4.4 Microbial properties in the soil samples 21
CHAPTER 5: SUMMARY, CONCLUSIONS AND RECOMMENDATIONS 24
LIST OF REFERENCES 25
Appendix 1: Poster of paper presented from the study presented during the
Durban 21-25 January 2013 Combined Congress
30

ix
LIST OF FIGURES Figures Titles Page
1 Selected identified invasive plant species and mine dump due
to mine pollution around Hans Merensky farm
9
2 Map showing study location, Phalaborwa Limpopo Province 10

x
LIST OF TABLES
Tables Titles Page
1 Distribution of alien plant and invasive species across farmlands
and mining areas in the Ba-Phalaborwa Municipality
8
2 Summary of methodology used for the various laboratory
determinations
14
3 Selected physical properties of the soil samples studied 16
4 Mean values of selected soil chemical properties in soil samples
obtained from the different farms
18
5 Selected micronutrients and heavy metals concentration (mg kg-1) of
the soil samples studied
21
6 Mean distribution of microbial count (CFU g-1 soil) within the surface
0-15 cm soil depth at different localities across sampling points
22
7 Effect of sampling points on the distribution of microbial count (CFU
g-1 soil) within the surface 0-15 cm at different localities
23
.
1
CHAPTER 1
INTRODUCTION
1.1 Background information to the study
Limpopo is one of the country’s provinces with enormous mineral reserves that are
currently being heavily mined. Apart from the socioeconomic benefits of mining, the
activity often poses serious threats to natural resources and impact negatively on
human livelihood. The discovery of more mineral reserves in other parts of the
province points to the fact that increased hazardous by-products will continue to be
produced following increase in mining activities. The study is crucial to providing
detailed information on the extent of soil pollution arising from mining activities in the
area so as to provide guidance on possible potential remediation and reclamation
strategies necessary for the revitalization and improvement of agricultural
productivity on such polluted soils. A better understanding of mine polluted soil
through detailed characterization will provide guidance to the development of
appropriate management strategies for sustainable agricultural production. The
findings from this study will thus help land-use planners, farm managers, farmers
and other stakeholders have access to better manage soil resources and reverse the
current trend of increasing the cultivation of marginal lands through the conversion of
unproductive land into potentially suitable agricultural lands. Ultimately, local
availability of diverse foods would be guaranteed in many homes.
1.2 Problem statement
Farming communities across the country are presently experiencing considerable
low crop yields due to among other reasons, a significant loss in soil quality and
productivity arising from pollution (Schlüter, 1993; Yin et al., 1996). Agricultural
activities around mining areas globally, are severely under threat due to pollution of
the environment, which impact negatively on soil, crop and animal health (Chow and
Hong, 2002). Farmlands around the three mining industries in the Phalaborwa
municipality are not shielded from these pollution threat that are often generated
from tailing dams, rock dumps and dusts around mining sites. Thus, the potential
arable lands in such mining communities have decreased at an increasing rate while
the cultivation of marginal lands has also grown steadily (Golder Associates, 2009).
Hence, food production efforts are negatively affected through loss in soil quality and

2
land degradation. Similarly, farmers’ profit margin and other natural resource quality
are negatively affected; and consequently lead to a serious compromise on food
security efforts in many rural mining communities. These could potentially escalate
the social crises that existed in numerous mining towns and villages.
1.3 Motivation of the study
The recent increase in the cultivation of marginal lands in many parts of the country
due to the rising pressure on available land to meet the ever increasing food demand
is responsible for the escalating problem of low productivity on most farmlands. This
has serious negative consequences on the food security situation in the country.
Providing detailed information regarding mining pollution is critical so as to alert
farming communities around the mining sites about the pollution build up in the key
natural resources of agricultural importance such as soil, water and air that have
serious implication on human and animal health.
1.4 Purpose of the study
1.4.1 Aim
The aim of this study is to assess selected physical and chemical characteristics as
well as microbial properties of mine polluted soils around the three Mining sites in
Phalaborwa so as to ascertain the chemical elements responsible for the pollution.
1.4.2 Objectives
The objectives of this study include among others:
i. To quantify the distribution of mine pollutants in the field and at different soil depths
in selected farming communities within the three mining sites in Phalaborwa area
ii. To assess the impact of mining activities on selected soil physical, chemical and
microbial properties at different soil depths
1.5 Hypotheses
The hypotheses for the study include the following:
i. Mine pollutants are uniformly distributed in the field and at different soil depths in
farms around the three mining sites
ii. The different mine pollutants have no effect on any of the soil physical, chemical
and microbial properties in terms of spatial distribution (i.e. horizontal and vertical).

3
CHAPTER 2
LITERATURE REVIEW
2.1 Limpopo Province as a mining Province
Limpopo Province is one of the country’s provinces with a large number of mining
industries due to the presence of numerous minerals. Phalaborwa area is renowned
for its mining activities for such minerals as copper, phosphate, antimony and gold
production among others. Phalaborwa Mining Company, a member of Rio Tinto
Group, quarries copper bearing mineral ore in the area, which is a highly valued
commodity in the metal industries for its wide application. Foskor Company on the
other hand excavates phosphate ore and beneficiates the mineral ore into granular
phosphate based fertilizer while JCI Mining Company mines antimony and gold
bearing ores, which have a long standing application history in the automobile
industries. According to 2008 economic data baseline survey report, the Mining
industries contribute approximately 60% of the Municipal district GDP (Ba-
Phalaborwa Municipality Draft IDP document 2012/17). The figures contained in the
Municipality Annual Report 2009/10 integrated development plan (IDP) showed that
the mining sector alone in the Phalaborwa area employs 5, 949 people (Foskor,
2010).
2.2 Impact of mining activities on soil and the environment
Beside the socioeconomic benefits of mining, the activity poses huge threats to
natural resources such as soil, water, air as well as aquatic and terrestrial animals
including humans. Water and wind seepages from mines and mine tailings pollute
natural resources while damages by mining products such as pyrite (iron sulphite
mineral) occur when it oxidizes through bacterial action upon exposure into sulphuric
acid and leads to the production of acid mine, which constitutes a hazardous product
to the soil and the environment (Pierzynski et al., 2005). The discovery of more
mineral reserves in other parts of the province will lead to an intensification of mining
activities in the near future and result in continuous production of similar or other by-
products that are hazardous to the soil. Most of by-products particularly heavy
metals, are toxic to living organisms primarily due to their protein-binding capacity
and hence ability to inhibit enzymes (Renella et al., 2003). The nature and degree of
inhibition of soil enzymes by metals is strongly related to soil (Perez-de-Mora et al.,

4
20.06). Metals have a varying impact on soil enzyme activity depending not only on
their total concentration in the soil but also on their capacity to interact with enzyme
protein (Schlüter, 1993).
Strip or surface mining of coal can completely eliminate existing vegetation, destroys
genetic soil profile, displaces or destroys wildlife and habitat, degrades air quality,
alters current land uses, and to some extent permanently change the general
topography of the area mined (Rule and Iwashchenko,1998). The community of
microorganisms and nutrient cycling processes are upset by the movement, storage,
and redistribution of soil (Biester et al., 2002). Generally, soil disturbance alters or
destroys many natural soil characteristics, and may reduce its productivity for
agriculture or biodiversity (Schlüter, 1993). Strip mining of coal leads to exposure of
nearby streams to the dangers of acidification with sulfuric acid thereby causing
subsoil infertility and stream pollution, which could lead to the killing of fish, plants
and aquatic animals that are sensitive to drastic pH shifts (Boominathan and Doran,
2003).
Elevated concentrations of mining pollutants of heavy metals in soils have been
reported to produce adverse effects on microorganisms and microbial processes
(Biester et al., 2002). Among soil microorganisms, mycorrhizal fungi are the only
ones providing a direct link between soil and roots, and can therefore be of great
importance in heavy metal availability and toxicity to plants (Schlüter, 1993). An
understanding of the various aspects of interaction between heavy metals and
mycorrhizal fungi is therefore crucial particularly in soils with different kinds and
levels of metal pollution. Such interactions include the effects of heavy metals on the
occurrence of mycorrhizal fungi, heavy metal tolerance of these microorganisms,
and their effect on the metal uptake and transfer of plants (Schlüter, 1993; Leyval et
al., 1997). However, limited study of the mechanisms involved in metal tolerance,
uptake and accumulation by mycorrhizal hyphae and endo- or ecto-mycorrhizae
have been documented (Leyval et al., 1997).
Homeostatic potentialities of microbial communities in soils contaminated with heavy
m.etals have been studied (Alloway, 1995). An estimate of the effect of
contaminants on soil microflora was proposed using indices that characterize
homeostasis of microbial communities. These indices include microorganisms
5
survivability in contaminated soil and the period of restoration of their number as well
as sensitivity to certain contaminants. In a modelled experiment on dark-grey
podzolized soil conducted by Biester et al. (2002), it was reported that contamination
of soil with heavy metals such as Cu2+, Cd2+, Sr2+, Pb2+, Hg2+ in doses of 2 and 4 of
the maximum permissible concentrations provoked a short-term inhibition of
microorganism development after which their number restores. The results further
revealed that the introduction of a mixture of metals in soil evokes more intensive
inhibition and extends the period of microorganisms number restoration as compared
with the effect of certain metals in the same doses.
2.3 Effect of mine pollution on agricultural productivity
Carbon monoxide and sulphur dioxide are presently the most pervasive mine
pollutants affecting agricultural production (Chow and Hong, 2002). They exert major
negative impact on the growth and productivity of sensitive cultivated and native
species of plants as well as crops (Aragon and Rud, 2013) through nutrients and
moisture stress (Barcelo et al., 1990; Arsova; Raychev, 2001; Frietas et al., 2004)
and damaged plant structures (Fernandes and Henriques, 1991; Levesque and
King, 1999). Pollutants also exert serious national problems on humans as labour
sources around urban and rural farming centres where agricultural industry plays a
dominant role in the life of communities (Aragon and Rud, 2013). Major losses of
animal fed on pastures exposed to mine pollutants by livestock farmers have been
reported for decades in the eastern Australia due to high levels of potentially toxic
hazardous heavy metal pollutants such as arsenic (As), lead (Pb), cadmium (Cd)
and mercury (Hg) found in the food chain (Chow and Hong, 2002). Mine pollutants
destroy many natural soil characteristics, and may reduce its agricultural productivity
(Yin et al., 1996; Frietas et al., 2004). A diverse population of small and large forms
of soil lives responsible for decomposition of plant and animal residues and nutrient
cycling processes are upset by high concentration of pollutants (Yin et al., 1996);
and hence impairs natural nutrient cycling processes as well as the yields of
agricultural produce (Loredo et al., 1988).
2.4 Spatial distribution of mine pollutants in soil
Yang and Wang (1998) investigated the origin, distribution and migration of Hg and
other heavy metals contained in ores, waste tailings and slag in three typical soil

6
profiles (far from mine entrance, near mine entrance and profile under slag) in
Chatian mercury mining deposit (CMD), western Hunan Province of China. Their
results revealed that Hg was enriched at the bottom of the soil profile far from mine
entrance but accumulated on the surface of soil profiles near mine entrance under
slag. The soil profiles near mine entrance under slag are both contaminated by Hg
with the latter being most heavily contaminated. Their results revealed 640 µg/g Hg
concentration in the surface soil in profile under slag with an average of 76.74 +
17.71 µg/g concentration in the profile at a leaching depth of more than 100 cm. The
mercury concentration of 6.5 µg/g with an average of 2.74 + 1.90 µg/g concentration
were found in the soil profile at 40 cm near mine entrance. Hence, their study
concluded that soils in the mercury mine area was polluted by Hg, Cd, As, Pb and Zn
with the mobility of heavy metals in soil in the order of Hg > Cd > As > Zn ≈ Pb.
Hence, Alloway (1995) revealed that the leaching depth of heavy metals in soil is
influenced by the total concentration in the surface soil and soil physico-chemical
parameters.
2.5 Relevance of physico-chemical and mineralogical characterization of soil
The relevance of physico-chemical and mineralogical characterization of soils in crop
production includes the development of the concept of soil quality (Loredo et al.,
2004). It explores the use of soil chemical, physical and mineralogical properties as
determinants of agricultural soil quality; presents challenges and opportunities for
soil scientists, agronomists and farmers to play relevant roles in the assessment and
advancement of sustainable crop production through implementation of relevant
s.cientific approaches in a remediation effort (Burger and Kelting, 1998).
The need for assessing soil properties is necessitated by the growing population and
agricultural research communities’ interest in determining the consequences of
management practices on soil as a medium for crop production, sustainability of
agricultural production and food processing industries (Biester et al., 2002). The
concept of physico-chemical and mineralogical characterization of soils includes
assessment of soil properties and processes as they relate to ability of soil to
function effectively and as an important component of a healthy ecosystem (Arshad
and Coen, 1992). Soil physical and chemical characterization entails the
quantification of such factors as organic matter content, nutrient supplying capacity,
7
acidity, bulk density, porosity, available water holding capacity and many others.
However, their distribution often differs significantly across spatial and temporal
scales (Loredo et al., 1988). Any of these soil properties may be simultaneously
relevant to several soil functions and will have varying levels of influence that can be
weighted accordingly in soil quality index models (Letey, 1985).
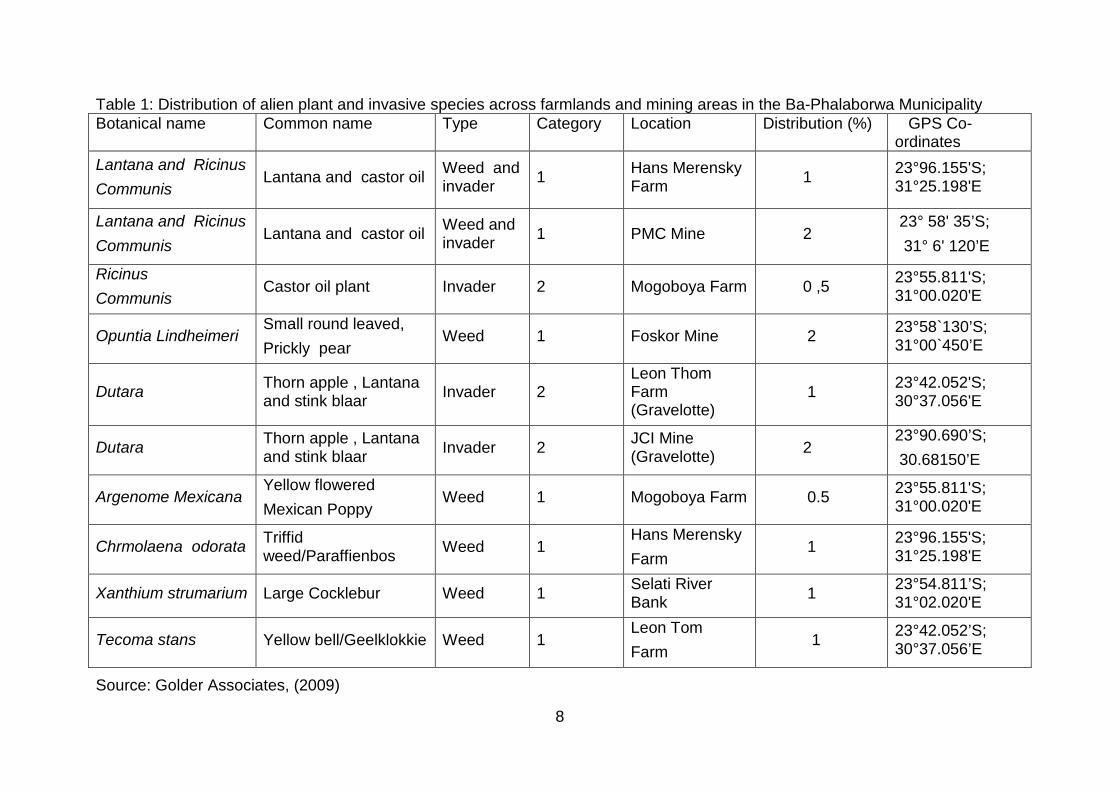
2.6 Indicators of environmental pollution in the study area
Due to mining operations in Phalaborwa areas, huge varieties of invasive weed and
plant species have established themselves around the mining sites as well as on the
farmlands (Table 1; Figure 1). Some of these species include Lantana camara
(Lantana); Tecoma stans (Yellow bell/Geelklokkie); Ricinus communis (Castor oil);
Xanthium strumarium (Large Cocklebur); Chromolaena odorata (Triffid
weed/Paraffienbos) and Opuntia sp. (round leaved-prickly pear). These invasive
weeds and plants are actively controlled by a joint venture of mining companies,
Department of Water and Forestry and Sanparks (Golder Associates, 2009).
Pollution impact is not only around the immediate mining sites, but also further down
in the rivers. A high mortality of catfish, crocodiles and crabs has been recorded in
recent years around the Olifants and Selati Rivers in Kruger National Park (Golder
Associates, 2010). High levels of copper sulphate and other geochemically
associated minerals that are highly toxic to aquatic species and sometimes terrestrial
ecosystem had been recently reported after an environmental impact assessment
(EIA) study (Golder Associates, 2009). Earlier study revealed high concentrations of
dissolved copper sulphate (CuSO4) and other metals in rivers and dams at six water
quality monitoring stations and much higher sulphate values were in Kruger National
Park site (Golder Associates (2009). The study further attributed the most likely
source of the elevated sulphate levels observed at the park to the Selati River and
more specifically, copper and other mining activities at the Phalaborwa Mining
Company (Ltd.) that is just upstream. The study also revealed that the pollution from
the natural water sources exceeded the threshold value of 200 mg/l required for
human consumption as well as the threshold value of 100 mg/l for aquatic
ecosystem health.
8
Table 1: Distribution of alien plant and invasive species across farmlands and mining areas in the Ba-Phalaborwa Municipality Botanical name Common name Type Category Location Distribution (%) GPS Co-
ordinates Lantana and Ricinus Communis
Lantana and castor oil Weed and invader 1 Hans Merensky
Farm 1 23°96.155'S; 31°25.198'E
Lantana and Ricinus Communis
Lantana and castor oil Weed and invader 1 PMC Mine 2
23° 58' 35’S; 31° 6' 120’E
Ricinus Communis
Castor oil plant Invader 2 Mogoboya Farm 0 ,5 23°55.811'S; 31°00.020'E
Opuntia Lindheimeri Small round leaved, Prickly pear
Weed 1 Foskor Mine 2 23°58`130’S; 31°00`450’E
Dutara Thorn apple , Lantana and stink blaar Invader 2
Leon Thom Farm (Gravelotte)
1 23°42.052'S; 30°37.056'E
Dutara Thorn apple , Lantana and stink blaar Invader 2 JCI Mine
(Gravelotte) 2 23°90.690’S; 30.68150’E
Argenome Mexicana Yellow flowered Mexican Poppy
Weed 1 Mogoboya Farm 0.5 23°55.811'S; 31°00.020'E
Chrmolaena odorata Triffid weed/Paraffienbos Weed 1
Hans Merensky Farm
1 23°96.155'S; 31°25.198'E
Xanthium strumarium Large Cocklebur Weed 1 Selati River Bank 1 23°54.811’S;
31°02.020'E
Tecoma stans Yellow bell/Geelklokkie Weed 1 Leon Tom Farm
1 23°42.052’S; 30°37.056’E
Source: Golder Associates, (2009)

9
Figure 1: Selected identified invasive plant species and mine dump due to mine pollution around Leon Tom farm

10
CHAPTER 3 RESEARCH METHODOLOGY
3.1 Description of study sites
The study was conducted on one farmland each around the three mining sites in
Phalaborwa area, Limpopo Province. The farms are Hans Merensky (23°96.155'S,
031°25.198'E), Mogoboya Integrated (23°55.811'S, 031°00.020'E) and Leon Thom
(23°42.052'S, 030°37.056'E) farms. Leon Thom Farm is located about 56 km from
other two farms and about 3 km from the JCI Mining Company in the Gravelotte
farming community. On the other hand, Hans Merensky and Mogoboya Integrated
farms are located at about 2 km from the Phalaborwa Mining Company (PMC) and
Foskor Mining Company, respectively (Figure 2). Phalaborwa Mining Company
(PMC) mines and refines copper as its major product, Foskor Mine beneficiates
phosphate rocks into phosphoric acid and phosphate based granular fertilizers, while
JCI Mine exploits soil mineral resources for gold and antimony.
Figure 2: Map of the trial sites around the three Phalaborwa mining sites (Source:
Golder Associates, 2009)
11
The wind in Phalaborwa is mostly from south-easterly direction for nearly 70 % of
the time and of which over 60 % is between 1.1 and 3.5 m/s with an average rarely
exceeding 8 m/s (Golder Associates 2009). The Hans Merensky and Leon Tom
Farms faced the wind direction from mining sites while Mogoboya Integrated Farm is
lined up along the two mines (Foskor and PMC). The geological formation of the
study area is Phalaborwa Alkaline Igneous Complex while the area is characterized
by a flat to gentle undulating bushveld landscape with mixed vegetation dominated
by Mopani biome on sweet veld with sandy clay soil (Golder Associates, 2010). The
mean annual rainfall in the area is 500 mm with average summer and winter
temperature of 37 0C and 22 0C, respectively (van der Spuy, 1982). Agricultural and
mining as well as tourism industries in the area rely mainly on Selati, Letaba and
Olifants River as well as boreholes as sources of water. The major farming activity in
the area is livestock while crop production is mostly done at subsistence level by
many farmers in the area (Mathivha, 2010).
The farmer at Hans Merensky Farm produces Lucerne, grass and golf course lawn.
The farmer’s fertilization program consists of the use of superphosphate and potash
fertilizers and lime ammonium nitrate (LAN). The farmer at the Mogoboya Integrated
Farm on the other hand extensively produces crops under dryland conditions, which
mostly consists of maize, groundnuts, pumpkins and dry beans with mango trees on
a half hectare land. The farmer has no conventional fertilizer management practices
except for the use of compost as a soil amendment. The farmer on Leon Thom Farm
mainly breeds cattle for dairy industry and grows his own pasture to feed his
animals. The pasture species grown consists mainly of grass and Lucerne using
superphosphates and potash fertilizers.
Additional soil samples that serve as control were similarly collected from unpolluted
Waterbok farm, Seloane (23°55.710' and 031°03.040') for the purpose of
comparison. The 250 ha farmland is located at about 70 km distance further away
from mining sites and situated 30 km North-East of Eiland Resort in Ba-Phalaborwa
Municipality. The farm produces wide varieties of agronomic crops such as tomato,
butternut, green pepper, baby marrow, petty penns, chilli and okra on reddish–brown
loamy sand soil. The area receives an average annual summer rainfall of 550 mm
and average summer and winter temperatures of 36 and 20°C, respectively.
12
3.2 Description of soil sampling procedures
A total of thirty six soil samples representing nine from each farm around the mines
and Waterbok farm were systematically taken at three different points on each farm
using a soil auger at 0–15, 15–30 and 30–45 cm depth. Another three separate
samples were randomly collected from the topsoil (0–15 cm) across each farm,
bulked together and used for microbial analysis. Prior to sampling for microbial
study, the soil auger was sterilized by immersion into 20 % ethanol solution.
Sampling points for the physico-chemical and microbial properties were
systematically selected to cut across each farm, with the first sampling point selected
closer to the direction of the mining site. The remaining sampling points were
selected at a fairly uniform distance away from the first sampling point depending on
the size of the each farm. All soil samples collected except for those to be used for
microbial study were air-dried, sieved through a 2 mm sieve and used for the various
laboratory determinations. Samples for the microbial study upon collection on the
field were kept under freeze conditions and transported in an iced cooler box before
transfer to the laboratory and analysed as fresh material.
3.3 Laboratory determination on soil samples
3.3.1 Procedures for physical and chemical analysis
Soil samples collected were subjected to selected physical, chemical and microbial
determinations following procedures summarized below in Table 2. For the purpose
of comparisons, results for the concentration of the different heavy metals obtained
will be compared with those from unpolluted soil samples obtained from Waterbok
farm as well as the standard permissible pollutant limits values obtained from
literature.
3.3.2 Methodology for microbial counts
Standard microbiological procedures were employed for the isolation and
enumeration of the different microbial groups. Different microbial growth media
designed to be selective for heterotrophic microbes; actinomycete and filamentous
fungi were used in the microbial analyses. These microbial populations were
subjected to the physiological ability of microbes to grow in each of the selected
media. General heterotrophic plate counts were done on nutrient agar (NA), (Biolab,
Midrand, South Africa). Actinomycete was isolated and enumerated on Actinomycete
13
isolation agar (Sigma-Aldrich, South Africa). Obtaining filamentous fungal counts,
malt extract agar (MEA), (Biolab (Merck), South Africa) was used and supplemented
with 30ppm chloramphenicol and 50 ppm streptomycin. These various media were
all sterilized at 121 °C for 15 min and made into pouring plates, each consisting of a
Petri dish (90mm in diameter) containing an isolation medium. A soil dilution series
ranging from 10-1 to 10-5 was prepared in triplicate using 1 g of soil in 9 ml of saline
solution and a 100 µL aliquot of each dilution was spread on the isolation plates.
The various isolation plates were incubated at room temperature and enumerated
after 3 days for the bacteria and 7 days for the actinomycete and fungi. The results
of microbial determinations obtained from polluted soils were compared with those
from the unpolluted Waterbok farm as well as others reported in literature (Hinojosa
et al., 2004).
3.4 Data analysis
All data generated were subjected to simple descriptive statistics such as mean,
standard error and coefficient of variation as well as analysis of variance (ANOVA)
using Statistix 8.1 software. Mean separation was done at 5 % probability level.
Microbiological data were log transformed prior to statistical analyses to fulfil the
conditions of normality. Where significant differences were found, the differences in
means across treatments were further compared using the post-hoc Tukey test.

14
Table 2: Summary of methodology used for the various laboratory determinations
Parameters measured Methodology for determination
Particle size distribution Hydrometer method described by Gee and Bauder (1986)
Bulk density Method described by Tisdall (1951) for disturbed soil.
pH (H2O & KCl) Water (pHw) and KCl extraction and measured in a 1:2.5
suspension using pH meter (Okalebo et al., 2002)
.Electrical conductivity
(ECe)
Saturated paste using water and measured using electrical
conductivity meter (Okalebo et al., 2002)
Exchangeable acidity (EA) Determined by pH change of a buffered solution-soil
suspension (Mehlich, 1976).
Available P content Bray P-1 procedure described by Bray and Kurtz (1945)
Percent organic carbon Walkley-Black wet digestion, oxidation-titration method
(Nelson and Sommer, 1975)
Exchangeable K, Ca, Mg
& Na (TEB)
Ammonium acetate extraction (pH 7.0) method
Effective cation exchange
capacity (ECEC)
Estimated as the sum of exchangeable bases (Ca, Mg, K,
Na) and exchangeable acidity expressed in cmol(+)/kg
Extractable Mn, Zn & Cu;
and heavy metals (Pb, Cd,
As & Sb)
EDTA extraction, Inductively coupled plasma -atomic
emission spectrometry (Herbert et al., 1994)
− Microbial population:
Fungi & bacteria
− Actinomycete
− Agar plate procedure – (Fredrickson and Balkwill, 1998;
Alef and Nannipieri, 1995)
− Dispersion and differential centrifugation procedure
according to Yang and Wang (1998)
15
CHAPTER 4
RESULTS AND DISCUSSIONS
4.1 Physical properties of the soil samples collected from the different farms
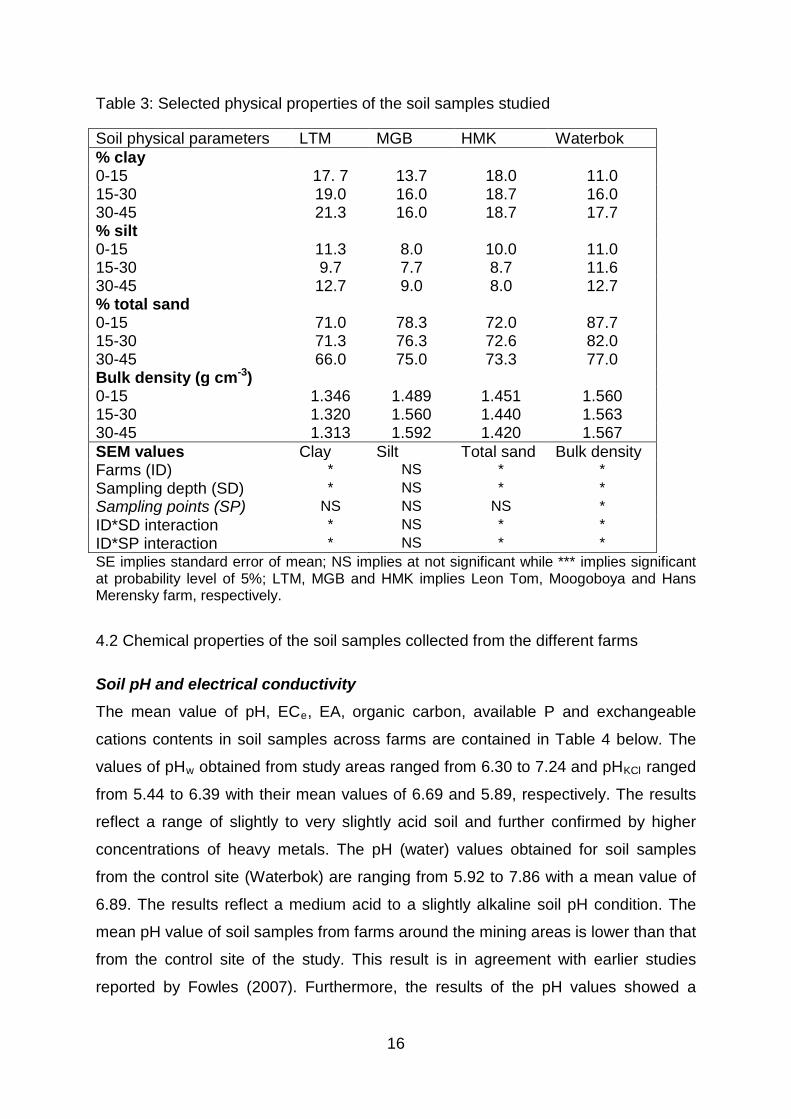
Soil textural characteristics and bulk density Table 3 shows the percent distribution of total sand, silt and clay content as well as
bulk density in the soil samples across the four farms. The clay content ranged from
11.0 to 21.3 % depending on soil depth with the highest percent clay content
obtained in soil samples from the Leon Tom farm. The silt content in the soil samples
varied between 8.0 and 12.7 % across all depths and farms while the total sand
content varied between 66.0 and 87.7 %. The percent total sand content is highest
in soil samples obtained from Waterbok farm while the clay and silt contents showed
a general increase with soil depths across all the farms. The results of statistical
analysis of the distribution of the three primary particles of sand, silt and clay showed
a significant difference in percent soil textural characteristics among all the sources
(farms, sampling depths, sampling points as well as their interactions with farms).
Significant interaction effect of sampling depth (SD) x farms (ID) as well as sampling
points (SP) x farms on percent clay and total sand content were also observed.
The bulk density in the soil samples ranged from 1.31 to 1.59 g cm-3 with soil
samples from Waterbok being the highest and Mogoboya farm the least. Significant
difference in the values of bulk density of soils between different farms, sampling
depths as well as sampling points was observed. The sampling depth x farms as well
as sampling points x farms interaction effect of on bulk density were also significant
(p<0.05). The significant difference in bulk density among these farms may be due to
varying degrees of parent materials (limestone and dolomite rocks) in the
Phalaborwa igneous complex as well as differences in agricultural land use practices
(Chamber of Mines of SA, 2005). The results also revealed that the bulk density of
soil samples from around the mining sites decreased further away from the pollution
sources, possibly attributed to less accumulation of the particles of pollutants from
mining activities and more disturbance of soil. This is in agreement with the work
reported by Ibanga et al. (2005). The bulk density of soil samples from the Waterbok
control farm showed a relatively constant value across the field.
16
Table 3: Selected physical properties of the soil samples studied
Soil physical parameters LTM MGB HMK Waterbok % clay 0-15 17. 7 13.7 18.0 11.0 15-30 19.0 16.0 18.7 16.0 30-45 21.3 16.0 18.7 17.7 % silt 0-15 11.3 8.0 10.0 11.0 15-30 9.7 7.7 8.7 11.6 30-45 12.7 9.0 8.0 12.7 % total sand 0-15 71.0 78.3 72.0 87.7 15-30 71.3 76.3 72.6 82.0 30-45 66.0 75.0 73.3 77.0 Bulk density (g cm-3) 0-15 1.346 1.489 1.451 1.560 15-30 1.320 1.560 1.440 1.563 30-45 1.313 1.592 1.420 1.567 SEM values Clay Silt Total sand Bulk density Farms (ID) * NS * * Sampling depth (SD) * NS * * Sampling points (SP) NS NS NS * ID*SD interaction * NS * * ID*SP interaction * NS * * SE implies standard error of mean; NS implies at not significant while *** implies significant at probability level of 5%; LTM, MGB and HMK implies Leon Tom, Moogoboya and Hans Merensky farm, respectively. 4.2 Chemical properties of the soil samples collected from the different farms
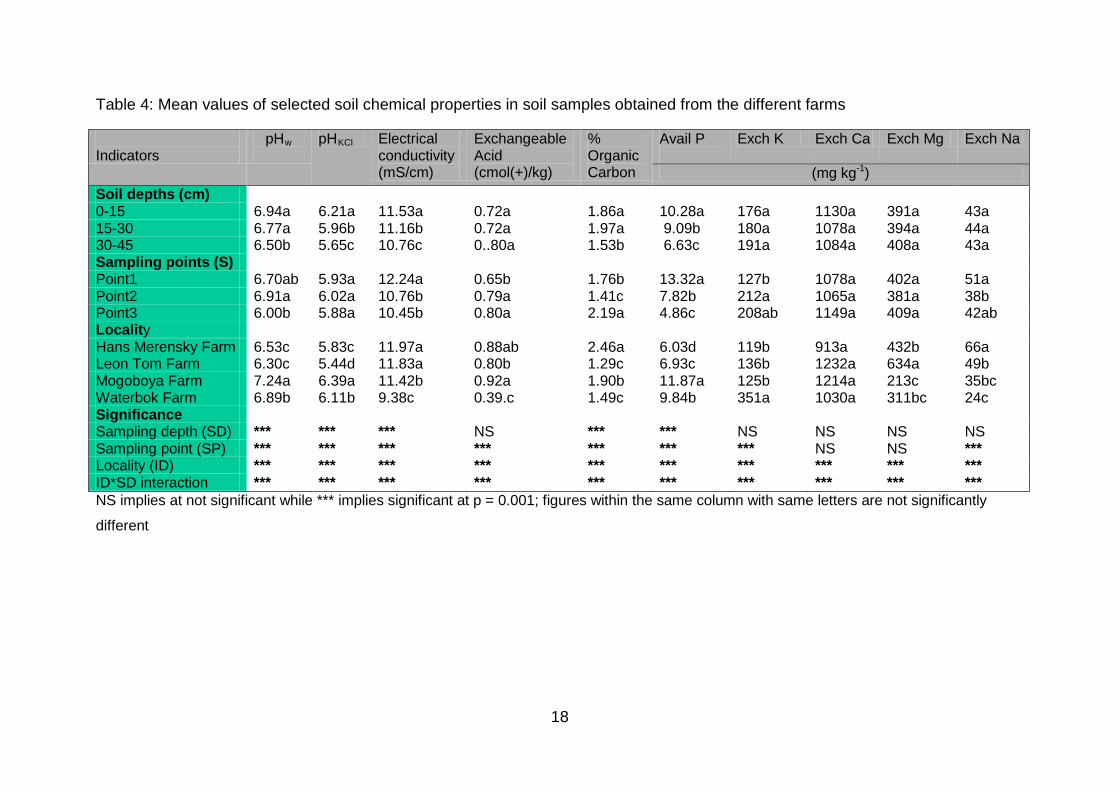
Soil pH and electrical conductivity The mean value of pH, ECe, EA, organic carbon, available P and exchangeable
cations contents in soil samples across farms are contained in Table 4 below. The
values of pHw obtained from study areas ranged from 6.30 to 7.24 and pHKCl ranged
from 5.44 to 6.39 with their mean values of 6.69 and 5.89, respectively. The results
reflect a range of slightly to very slightly acid soil and further confirmed by higher
concentrations of heavy metals. The pH (water) values obtained for soil samples
from the control site (Waterbok) are ranging from 5.92 to 7.86 with a mean value of
6.89. The results reflect a medium acid to a slightly alkaline soil pH condition. The
mean pH value of soil samples from farms around the mining areas is lower than that
from the control site of the study. This result is in agreement with earlier studies
reported by Fowles (2007). Furthermore, the results of the pH values showed a
17
decreasing value with increase in soil depths suggesting that the mine tailings
produced exert acidic effects on the underlying soil (Rosner and Van Schalkwyk,
2000).
The ECe values obtained in soil samples from farms around the mining sites ranged
from 11.42 to 11.97 mS/cm with a mean value of 11.74 mS/cm as compared to the
range of 4.94 to 15.14 mS/cm with a mean value of 9.38 mS/cm in soil samples from
the control farm. The higher mean EC values in mine-polluted soils than those of
unpolluted soils observed in this study may be attributed to the high load of
pollutants from the mines as well as micronutrient-rich fertilizers and pesticides used
by the farmers as previously reported by Fowles (2007). The implication is that the
soils have tendency for salt problem that may impact negatively on water and
nutrient uptake by crops. A significant (p<0.05) sampling depth x and farms as well
as sampling points x farms interaction effect on soil pHw and electrical conductivity
were also obtained.
Organic carbon, exchangeable acidity and phosphorus
Table 4 also contains the distribution of soil exchangeable acidity, percent organic
carbon and available phosphorous. The percent organic carbon content in the soil
samples varied between 1.29 and 2.46 across all depths and the four farms while
available P ranged from 4.86 to 13.32 mg kg-1. Percent organic carbon increases
with an increase in distance away from the mining area due to vegetation and topsoil
removal around the mining area and the immediate surrounding (Agboola, 1982;
Salami et al. 2002). The value of exchangeable acidity in the soil samples varied
between 0.39 and 0.88 cmol(+)/kg across soil depths, sampling points and the four
farms. Values of exchangeable acidity increase with increasing distance from the
pollution source. This observation is in perfect agreement with earlier findings
reported by Wild (1995).
18
Table 4: Mean values of selected soil chemical properties in soil samples obtained from the different farms
Indicators
pHw
pHKCl Electrical conductivity (mS/cm)
Exchangeable Acid (cmol(+)/kg)
% Organic Carbon
Avail P
Exch K Exch Ca Exch Mg Exch Na
(mg kg-1) Soil depths (cm) 0-15 6.94a 6.21a 11.53a 0.72a 1.86a 10.28a 176a 1130a 391a 43a 15-30 6.77a 5.96b 11.16b 0.72a 1.97a 9.09b 180a 1078a 394a 44a 30-45 6.50b 5.65c 10.76c 0..80a 1.53b 6.63c 191a 1084a 408a 43a Sampling points (S) Point1 6.70ab 5.93a 12.24a 0.65b 1.76b 13.32a 127b 1078a 402a 51a Point2 6.91a 6.02a 10.76b 0.79a 1.41c 7.82b 212a 1065a 381a 38b Point3 6.00b 5.88a 10.45b 0.80a 2.19a 4.86c 208ab 1149a 409a 42ab Locality Hans Merensky Farm 6.53c 5.83c 11.97a 0.88ab 2.46a 6.03d 119b 913a 432b 66a Leon Tom Farm 6.30c 5.44d 11.83a 0.80b 1.29c 6.93c 136b 1232a 634a 49b Mogoboya Farm 7.24a 6.39a 11.42b 0.92a 1.90b 11.87a 125b 1214a 213c 35bc Waterbok Farm 6.89b 6.11b 9.38c 0.39.c 1.49c 9.84b 351a 1030a 311bc 24c Significance Sampling depth (SD) *** *** *** NS *** *** NS NS NS NS Sampling point (SP) *** *** *** *** *** *** *** NS NS *** Locality (ID) *** *** *** *** *** *** *** *** *** *** ID*SD interaction *** *** *** *** *** *** *** *** *** *** NS implies at not significant while *** implies significant at p = 0.001; figures within the same column with same letters are not significantly
different
19
The results of available P content showed a decrease further away from the pollution
source while the low available P content in the soil samples may be attributed to
inherent soil characteristics such as high calcium content across the study areas
which could potentially render P unavailable through fixation (Wild, 1995; Dutta and
Agrawal, 2002). The results of statistical analysis showed a significant difference in
organic carbon and exchangeable acidity across sampling depths, sampling points
and the four farms. The interaction effect of sampling depth (SD) and farms (ID) as
well as sampling points (SP) and farms on exchangeable acidity, organic carbon and
available phosphorous content were also significant (p<0.05).
4.3 Extractable cations and heavy metal distribution in the samples
4.3.1 Concentration of extractable cations
The distribution of soil extractable K ranged from 176 to191 mg kg-1, 208 to 212 mg
kg-1 and 119 to 351 mg kg-1, respectively across sampling depths, sampling point and
farms. Calcium content ranged from 1078a to 1130 mg kg-1, 1065 to 1149 mg kg-1
and 913 to 1232 mg kg-1, Mg ranged from 391 to 408 mg kg-1, 381 to 409 mg kg-1
and 213 to 634 mg kg-1, and that of Na ranged from 43 to 44 mg kg-1, 38 to 51 mg
kg-1 and 24 to 66 mg kg-1 across sampling depths, sampling point and farms
respectively. Potassium concentration in soil from Waterbok (control) farm recorded
the highest value as compared to all the farms as shown in Table 4, which could
probably be a reflection of land use rather than of inherent soil characteristics
(Mandiringana et al., 2005). The mean exchangeable K, Ca and Mg concentrations
across the farms for all sampling points and depths varied between 119 and 351 mg
kg-1, 913 and 1214 mg kg-1, and between 213 and 634 mg kg-1, respectively while
the mean Na concentration across the farms ranged from 24 to 66 mg kg-1.
Generally, the extractable K, Ca and Na concentrations showed a marginal increase
further away from the pollution source while K concentration follows no definite
pattern with increasing distance further away from the pollution source. The sampling
depth x farms as well as sampling point x farms interaction effects on K, Ca, Mg and
Na were all significant (p<0.05) suggesting that availability of these nutrient elements
is affected regardless of sampling depth or sampling point in polluted soils. This
confirms the findings of Ratcliffe (1974) who also observed reduced availability of
essential plant nutrients in soil due to pollution arising from mining activities.
20
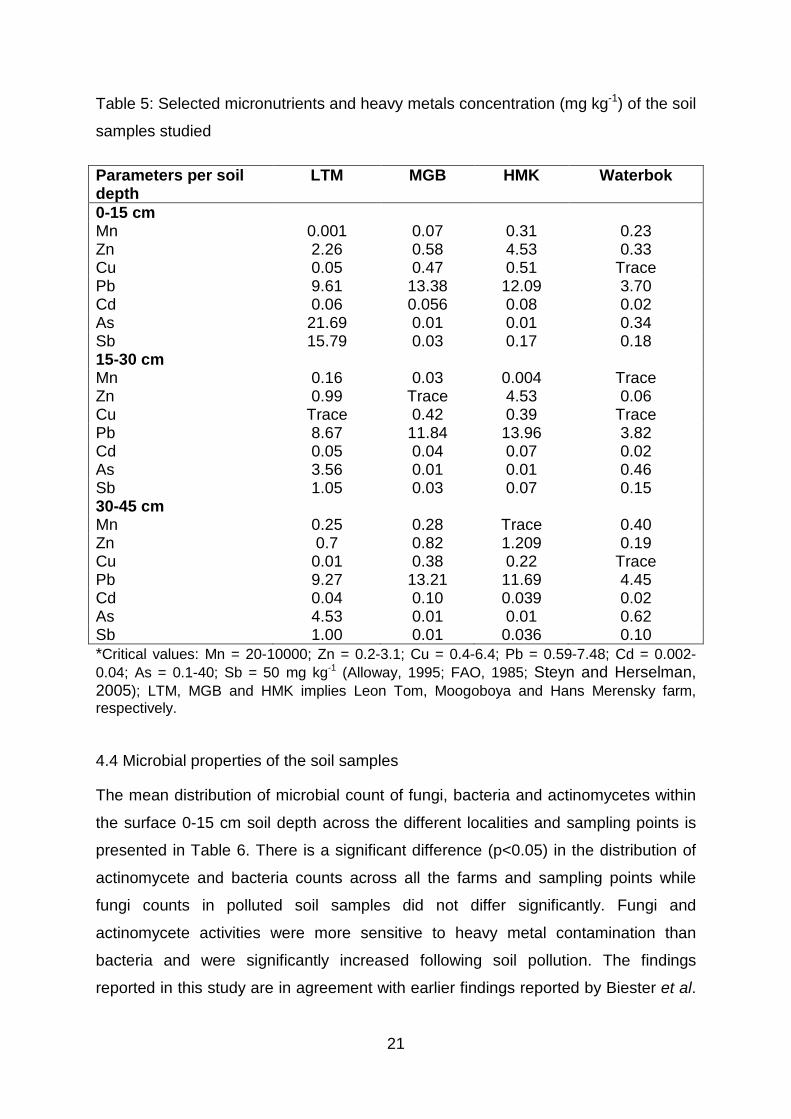
4.3.2 Heavy metal distribution in the soil samples
Table 5 below shows the concentration of heavy metal across the different sampling
depths and farms. Generally, the concentration of heavy metals in soil of the four
farms decreased with increase in soil depth. The level of pollution in the soil of the
farms differs depending on the sources of the pollutants. Lead (Pb) concentration at
the soil surface of farms around the three mining sites ranged from 9.61 to 13.38 mg
kg-1, which is considerably higher than the value of 3.70 mg kg-1 from the surface soil
sample from Waterbok farm used as control to measure the degree of pollution. The
Pb concentrations at the surface (0-15 cm) soils from around the three mining sites
exceed the critical range level of 0.59 to 7.48 mg kg-1 for South African soils reported
by Alloway (1995) and the FAO (1985) threshold level of 5 mg kg-1 for crop
production. Leon Tom Farm recorded the highest level of arsenic and antimony
concentrations of 21.69 and 15.79 mg kg-1, respectively. Comparatively, surface soil
samples from Mogoboya, Hans Merensky and Waterbok Farms contained an
average antimony concentration level of 0.03; 0.17 and 0.18 mg kg-1, respectively.
Soil samples from Waterbok Farm which serves as the control site for this study
contained negligible amount of copper concentration at virtually all sampling depths
clearly suggesting that the elevated copper concentrations detected in soil samples
collected from Hans Merensky, Leon Thom and Mogoboya Farms are as a direct
result of pollution from nearby mining operations. Except for soil samples at Leon
Tom farm, copper concentrations in samples from Hans Merensky and Mogoboya
farms at all depths were generally higher than the critical level of 0.2 mg kg-1
reported by FAO (1985). The high accumulation of these heavy metals at virtually all
the soil depths may be related to the percent clay and organic carbon content. This
is confirmed by earlier findings by Schoer (1985) that heavy metal accumulation in
the primary mineral soil particles is in the order of clay > silt > total sand. Extractable
Mn content ranged from trace amount to 0.4 mg kg-1 depending on soil depth and
sampling point. Generally, the Mn concentration observed in the surface soil
samples from Hans Merensky and Waterbok farms was above the critical level of 0.2
mg kg-1 reported by FAO (1985) probably due to the fertilizer use on those farms.
21
Table 5: Selected micronutrients and heavy metals concentration (mg kg-1) of the soil
samples studied
*Critical values: Mn = 20-10000; Zn = 0.2-3.1; Cu = 0.4-6.4; Pb = 0.59-7.48; Cd = 0.002-0.04; As = 0.1-40; Sb = 50 mg kg-1 (Alloway, 1995; FAO, 1985; Steyn and Herselman, 2005); LTM, MGB and HMK implies Leon Tom, Moogoboya and Hans Merensky farm, respectively. 4.4 Microbial properties of the soil samples
The mean distribution of microbial count of fungi, bacteria and actinomycetes within
the surface 0-15 cm soil depth across the different localities and sampling points is
presented in Table 6. There is a significant difference (p<0.05) in the distribution of
actinomycete and bacteria counts across all the farms and sampling points while
fungi counts in polluted soil samples did not differ significantly. Fungi and
actinomycete activities were more sensitive to heavy metal contamination than
bacteria and were significantly increased following soil pollution. The findings
reported in this study are in agreement with earlier findings reported by Biester et al.
Parameters per soil depth
LTM MGB HMK Waterbok
0-15 cm Mn 0.001 0.07 0.31 0.23 Zn 2.26 0.58 4.53 0.33 Cu 0.05 0.47 0.51 Trace Pb 9.61 13.38 12.09 3.70 Cd 0.06 0.056 0.08 0.02 As 21.69 0.01 0.01 0.34 Sb 15.79 0.03 0.17 0.18 15-30 cm Mn 0.16 0.03 0.004 Trace Zn 0.99 Trace 4.53 0.06 Cu Trace 0.42 0.39 Trace Pb 8.67 11.84 13.96 3.82 Cd 0.05 0.04 0.07 0.02 As 3.56 0.01 0.01 0.46 Sb 1.05 0.03 0.07 0.15 30-45 cm Mn 0.25 0.28 Trace 0.40 Zn 0.7 0.82 1.209 0.19 Cu 0.01 0.38 0.22 Trace Pb 9.27 13.21 11.69 4.45 Cd 0.04 0.10 0.039 0.02 As 4.53 0.01 0.01 0.62 Sb 1.00 0.01 0.036 0.10

22
(2002). The significantly high microbial counts obained in this study is probably
attributed to the long period of pollution particularly for soils around the three mining
sites relative to the soil from the control Waterbok farm. Table 7 contained data on
the mean microbial counts in soil samples taken further away from the pollution
source. The data revealed that fungi, bacteria and actinomycete counts increase with
increase in the distance away from the pollution source. The data on the microbial
counts from polluted soils showed an increase in microbial activity further away from
pollution source. This trend is in agreement with earlier findings reported by
Mikanova et al. (2002) that the values of enzymatic activities were highest in soil
samples further away from the source of contamination but decreased as the source
of contamination is being approached. The results however contradicts findings
reported by Hinojosa et al. (2004) that all enzymes and general microbiological rates
detected in unpolluted soils were more than two times higher than in polluted soils.
Hinojosa et al., (2010) also indicated that the total number of colony forming unit
(CFU) of fungi and actinomycetes was significantly reduced after heavy metal
contamination. Mining also resulted in the clearing of vegetation and thus reduces
the concentration of essential nutrients through reduced soil organic matter level of
the soil and biological activities; and consequently decreases the productivity of the
soil (Pandey and Kamur, 1996).
Table 6: Mean distribution of microbial count (CFU g-1 soil) within the surface 0-15 cm soil depth at different localities across sampling points Locality Fungi Bacteria Actinomycete Leon Tom Farm 3.82a 6.44a 6.20a Mogoboya farm 3.51a 6.46a 5.97a Hans Merensky farm 3.80a 5.91b 5.51b Waterbok farm 2.14b 5.70c 4.90c SEM 0.09 0.03 0.08 ** Values reported in the Table are Log CFU g-1 soil; values within the same column with same letters are not significantly different; SEM implies standard error of mean.

23
Table 7: Effect of sampling points on the distribution of microbial count (CFU g-1 soil) within the surface 0-15 cm at different localities
Locality/sampling points Fungi Bacteria Actinomycetes Leon Tom farm SP1 3.83a 6.53c 6.20bc
SP2 3.62a 5.59e 5.15ef
SP3 4.00a 7.2a 7.25a
Mogoboya farm SP1 3.52a 6.82b 6.38b
SP2 3.23a 6.6c 5.92cd
SP3 3.77a 5.96d 5.62de
Hans Merensky farm
SP1 3.76a 5.55e 5.62de
SP2 3.80a 5.59e 5.34e
SP3 3.84a 5.97d 5.55de
Waterbok farm
SP1 2.31a 5.89d 4.72fg
SP2 2.10a 5.88d 4.51g SP3 2.00a 5.96d 5.47de
SEM 008 0.05 0.11
** Values reported in the Table are Log CFU g-1 soil; SP 1, 2 & 3 connote sampling points on each farm; values within the same column with same letters are not significantly different; SEM implies standard error of mean.

24
CHAPTER 5 SUMMARY, CONCLUSIONS AND RECOMMENDATIONS
The discovery of more mineral reserves in the Limpopo Province, and many parts of
the country poses a threat to the agricultural ecosystem due to hazardous by-
products which will continue to be produced following increased mining activities.
The sources of these pollutants are mine dumps, acid mine drainage and tailings
dams, which exert serious negative consequences on the the environment including
our non-renewable natural resources such as water and soil. Thus the primary goal
of this study was to quantify the impact on mine pollution on soil.
The findings of this study revealed that mining activities constitute sources of
pollutants which impacted negatively on soil physical, chemical and biological
properties. This is further confirmed by the recent incidence of high catfish crocodiles
and crabs mortality in the Olifants and Selati Rivers which were exposed to mine
pollutants as well as the presence of different varieties of invasive weed and plant
species observed during the study on and/or around farmlands located around the
mining sites. The concentration of Pb obtained in soil samples around the mining
sites far exceeds the acceptable limits/threshold level. The concentration of
extractable heavy metals in the studied areas was in the order: As >Sb>Pb>Zn>Cu
>Mn >Cd. The concentrations of Cd appeared very low in all samples while elevated
levels of Mn, Cu and Zn were detected at all depths relative to values from non-
polluted control. Significantly higher Pb, As and Sb concentrations were obtained in
polluted samples than those from the control samples.
The findings further revealed that the activities of microorganisms were less affected
by pollution in fine-textured soils than in sandy loam possibly because of differences
in the sorption capability of soils with different textures as reported by Hinojosa
(2004). Soil microbial levels were significantly higher in mine polluted than non-
polluted soils except in Hans Merensky samples where bacterial and actinomycete
counts were lower. Future studies on soil from affected areas should focus on
assessment interventions to reduce the impact of the pollutants on crop production
so as to improve soil quality and agricultural productivity in these farming areas.
25
LIST OF REFERENCES AGBOOLA, A.A., 1982. Soil fertilizer and fertilizer use in Nigeria. A paper presented
at the First National Seminar in Agricultural Land Resources held at Kaduna, Nigeria.
ALEF, K. & NANNIPIERI, P., 1995. Methods in applied soil microbiology and
biochemistry, Academic Press, New York.
ALLOWAY, B.J., 1995. Soil processes and the behaviour of metals. Pp. 11–37.
Heavy metals in soils. 2nd edition, Blackie Academic and Professional, London.
ARSHAD, M.A. & COEN, G.M., 1992. Characterization of soil quality: physical and
chemical criteria. America Journal Alternative Agriculture, 7: 25–31.
ARAGON, F.M. & RUD. J.P., 2013. Natural resources and local communities
evidence from a Peruvian gold mine, American Economic Journal 5 (2): 1–50.
ARSOVA, A. & RAYCHEV T., 2001. Bio-ecological effect of waste treatment lime
sludge and their effectiveness as agricultural limestone substitutes.Journal of water
pollution control fed, 60(5):674 –680.
BA-PHALABORWA MUNICIPALITY DRAFT IDP DOCUMENT 2012/17. 229pp.
BARCELO, J., POSCHENRIEDER. C., BECH, J., LIUNGAMY. M., TUME. P.,
TOBIAS. FJ., 1990. Arsenic and heavy metals contamination of soil and vegetation
around copper mine in Northern Peru. Sci Total Environment, 203: 83 – 91.
BIESTER, H., MULLER, G. & SCHÖLER, H. F., 2002. Binding and mobility of
mercury in soils contaminated by emissions from chlor-alkali plants. Science of the
Total Environment, 284 (1–3): 191–203.
BOOMINATHAN, R. & DORAN, P.M., 2003. Organic acid complexation, heavy metal
distribution and the effect of ATPase inhibition in hairy roots of hyper-accumulator
plant species. Journal of Biotechnology, 101: 131–146.
BRAY, R.H.L. & KURTZ, L.T., 1945. Determination of total and available forms of P
in soils. Soil Science, 53: 39–45.
BURGER, J.A. & KELTING, D.L., 1998. Soil quality monitoring for assessing
sustainable forest management. Soil Science Society of America, Special
Publication No. 53: 17–52.

26
CHOW, C.K. & HONG. C.B., 2002. Dietary vitamin E and selenium and toxicity of
nitrite and nitrate. Toxicology., 180 (2): 195–207.
DUTTA, R, K. & AGRAWAL, M., 2002. Effect of tree plantations on the soil
characteristics and microbial activity of coal mine spoil land. Tropical ecology, 43 (2):
313 –324.
FAO, 1985. Water quality for irrigation for agriculture. Irrigation and Drainage Paper
number 29, 130pp.
FERNANDES, J.C. & HENRIQUES, F.S., 1991. Biochemical, physiological and
structural effects of excess copper in plants. The Botanical Review, 57 (3): 246-273.
FOSKOR, 2010. Foskor annual report. 142pp.
FOWLES, M., 2007. Black carbon sequenstration as an alternative to bioenergy.
Biomass and Bioenergy, 31: 426 –432.
FREDRICKSON, J.K. & BALKWILL, D.L., 1998. Sampling and remuneration
techniques. p. 239-252. In: Burlage; R.S. (ed.), Techniques in microbial ecology,
Oxford University Press, Inc., New York.
FREITAS, H. & PRASAD, M.N.V., 2004. Feasible biotechnological and
bioremediation strategies for serpentine soils and mine soils. Journal of
Biotechnology 2: 36–50.
GEE, G.W. & BAUDER, J.W., 1986. Physical and mineralogical methods, Soil
Science Society of America, Madison, WI, USA (1986), pp. 383–412.
GOLDER ASSOCIATES. 2009. Environmental impact assessment (EIA) for Foskor’s
pyroxenite expansion project phase 3, Phalaborwa Limpopo Province report
No.12114-9282-3, 156 pp.
GOLDER ASSOCIATES. 2010. Environmental impact assessment (EIA) for Foskor’s
pyroxenite expansion project phase 3, Phalaborwa Limpopo Province report
No.12114-9282-5, 169 pp.
HERBERT, E.A., CHIN, P.H., GEORGE, W.B. & ALAN, R.B., 1994. Metal speciation
and contamination of Soil. 1st edition, Lewis Publishers, London, 285 pp.
27
HINOJOSA, M.B., GARCÍA-RUÍZ, R., VIÑEGLA, B. & CARREIRA, J.A., 2004.
Microbiological rates and enzyme activities as indicators of functionality in soils
affected by the Aznalcóllar toxic spill. Soil Biology Biochemistry, 36: 1637–1644.
HINOJOSA, M.B., GARCIA-RUIZ, R., and CARREIRA, J.A., 2010. Utilizing Microbial
Community Structure and Function to Evaluate the Health of Heavy Metal Polluted
Soils, 185-224. In: I. Sherameti and A. Varma (eds.), Soil Heavy Metals, Soil Biology,
Vol 19, Springer-Verlag Berlin Heidelberg 2010.
IBANGA, I.J., UDOMA, G.H.,EDET, A.B. & AKPAN, F.S. 2005. Physico-chemical
properties of some limestone soils in southeastern Nigeria. Nigerian journal of Soil
Science, 15: 81–86.
LETEY, J., 1985. Relationship between soil physical properties and crop production.
Advances in Soil Science, 1: 227–294.
LEVESQUE, J & KING, D.J., 1999. Airborne Digital Camera Image Semivariance for
evaluation of a forest structural damage at an acid mine site. Remote Sensing of
Environment, 68 (2): 112-124.
LEYVAL, C., TURNAU, K. & HASELWANDTER, K., 1997. Effect of heavy metal
pollution on mycorrhizal colonization and function. Physiological, Ecological and
Applied Aspects, 7 (3): 139-153.
LOREDO, J., FERNÁNDEZ-MARTÍNEZ, R., ORDÓÑEZ, A. & RUCANDIO, M. I.,
2004. Distribution and mobility of mercury in soils from an old mining area in Mieres,
Asturias Spain. Science of the Total Environment, 346 (1–l3): 200– 212.
LOREDO, J., LUQUE, C. & GARCIA IGLESIAS, J., 1988. Conditions of formation of
mercury deposits from the Cantabrian Zone, Spain. Bulletin of Mineralogy, 3: 393-
400.
MANDIRINGANA, O.T., MNKENI, P.N.S., MKILE, Z., VAN AVERBEKE, W. VAN
RANST, E. & VERPLANCKE, H., 2005. Mineralogy and fertility status of selected
soils of the Eastern Cape Province, South Africa. Communications in Soil Science
and Plant Analysis, 36: 2431- 2446.
MATHIVHA, F.K., 2010. Zwavhulimi: An official Newsletter of the Limpopo
Department of agriculture (January–March 2010). 14pp.

28
MEHLICH, A. 1976. New buffer method for rapid estimation of exchangeable acidity
and lime requirement. Commun Soil Sci Plant Anal, 7(7): 637–52.
MIKANOVA, O., KUBAT, J., NOVAKOVA, J., 2002. Some microbial characteristics
and enzymatic activities in soils polluted with heavy metals, 792: 1– 7.
NELSON, D. W. & SOMMER, L E., 1975. A rapid and accurate method for
estimating organic carbon in soil. Proceeding of the Indiana Academy of Science, 84:
456-462
OKALEBO, J.R., GATHUA, K. W. & WOOMER, P.L., 2002. Laboratory methods of
soil and water Analysis: A working manual. Second edition, 236pp.
PANDEY, D.D. & KAMUR, S. 1996. Impact of cement dust pollution on biomass,
chlorophyll, nutrients and grain characteristics of wheat. Environmental Ecology, 14
(4): 872 –875.
PEREZ-DE-MORA, A., BURGOS, P., MADEJON, E., CABRERA, F., JAECKE, P. &
SCHLOTER, M., 2006. Microbial community structure and function in a soil
contaminated by heavy metals: effects of plant growth and different amendments.
Soil Biology Biochemistry, 38: 327–341.
PIERZYNSKI, G.M., SIMS, J.T., VANCE, G.F., 2005. Trace elements. pp. 331–361.
In: Skousen, J. J. and P. F. Zienkiwicz (eds.), Soils and environmental quality, 1st
edition, Taylor and Francis Group, London.
RATCLIFFE, D., 1974. Ecological effect of mineral exploitation in the United
Kingdom and their significance to nature conservation. Royal Security of London
proceedings Series A. 339: 355–372.
RENELLA, G., ORTIGOZA, A.L.R., LANDI, L. & NANNIPIERI, P., 2003. Additive
effects of copper and zinc on cadmium toxicity on phosphatase activities and ATP
content of soil as estimated by the ecological dose (ED50). Soil Biology Biochemistry,
35: 1203–1210.
ROSNER, T. & VAN SCHALKWYK, A., 2000. The environmental impact of gold
mine tailings footprints in the Johannesburg region, South Africa. Bull Engineering
Geological Environment, 59: 137-148.
29
RULE, J, H. & IWASHCHENKO, M. S., 1998. Mercury concentrations in soils
adjacent to a former chlor-alkali plant. Journal of Environmental Quality, 27 (1): 31–
37.
SALAMI, A.T., FAOUNBI, A.I., MOUGHALU, A.J., 2002. Effects of cement
production on vegetablein part of Southwestern Nigeria. Tanzania Journal of Science
28, (2):70–82.
SCHLüTER, K., 1993. The fate of mercury in soil: A review of current knowledge.
Soil and Groundwater Research Report IV, Commission of the European
Communities, Luxembourg, and UK, 75 pp.
SCHOER, J., 1985. Iron-oxo-hydroxides and their significance to the behavior of
heavy metals in estuaries, Environmental Technology Letter, 6 : 189–202.
STEYN, C. E. and HERSELMAN, J. E. 2005. Trace Elements in Developing
Countries Using South Africa as a Case Study. Communications in Soil Science and
Plant Analysis 36 (1): 155 – 168
TISDALL, A.L., 1951, Comparison of methods of determining apparent density of
soils.Australian Journal of Agricultural Research, 2: 349-354.
VAN DER SPUY, R. C. M., 1982. The heavy-minerals plant at Phalaborwa Mining
Company - a Low-grade, high-tonnage gravity concentration. Journal of the Southern
African Institute of Mining and Metallurgy, 26 (3): 3–11.
WILD, A., 1995. Soil and the environment: An introduction .Cambridge University
Press, Great Britain, pp 287.
YANG, L.S & WANG, W.Y., 1998. Spatial distribution and ecological significance of
heavy metals in soils from Chatian mercury mining deposit, western Hunan Province.
Journal of Environmental Quality, 15 (11): 1069–1073.
YIN, Y. H.E., ALLEN, Y., HUANG, C. P. & SANDERS, P. F., 1996. Adsorption of
mercury (II) by soil: effects of pH, chloride, and organic matter. Journal of
Environmental Quality, 25 (4): 837–844.
30
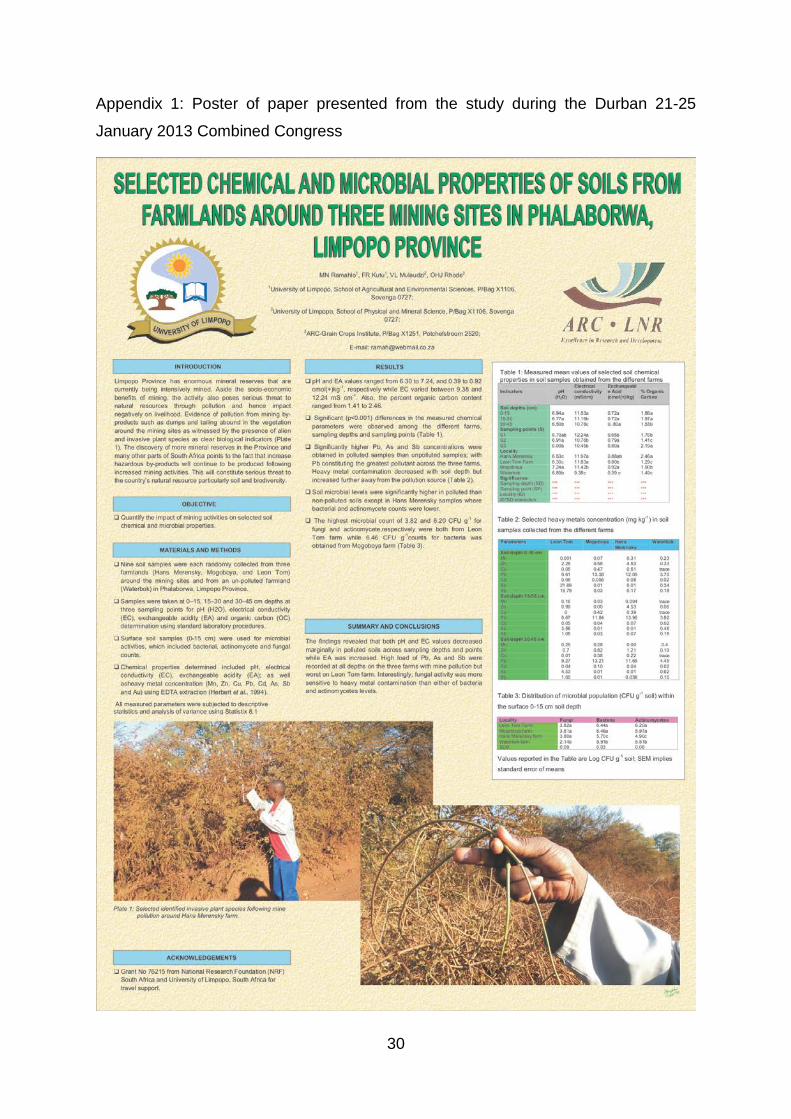
Appendix 1: Poster of paper presented from the study during the Durban 21-25
January 2013 Combined Congress