Download - Ch7: Tables and Graphics

Ch7
1
Constructing Tables and GraphicsConstructing Tables and Graphics
During your study or in your career life, You need to access information related to your specialized field or other fields
Before setting out to the library or opening your favorite Web search engine, know some strategies for planning your search and for getting the most out of your search

Ch7
2
Constructing Tables and GraphicsConstructing Tables and Graphics
2. Graphs: Represent data using lines that creep up and down from left to right. Indicating changes in the data across time
3. Charts: Use bars, pie slices, or other inventive means to enable comparisons of data. The most common types are bar charts and pie charts
4. Photographs: Supply lots of details (in some cases, too much). They are useful for example when you want to show a model of a new product
Ch7
3
Constructing Tables and GraphicsConstructing Tables and Graphics
5. Drawings: Simplified illustrations of objects, people, and places, you see plenty of drawings used in instructions. They strip away extraneous (unrelated) detail and focus on the key objects and actions6. Diagrams: Abstract illustrations of objects. They focus on infrastructural. Diagrams can also be used to illustrate nonphysical things such as concepts. An organizational chart of a company is a typical example. A flowchart of a production process is another.

Ch7
4
Constructing Tables and GraphicsConstructing Tables and Graphics
Rows and columns of data (words or numbers)
Table

Ch7
5
Constructing Tables and GraphicsConstructing Tables and GraphicsConverting text to table and two-column lists
Ch7
6
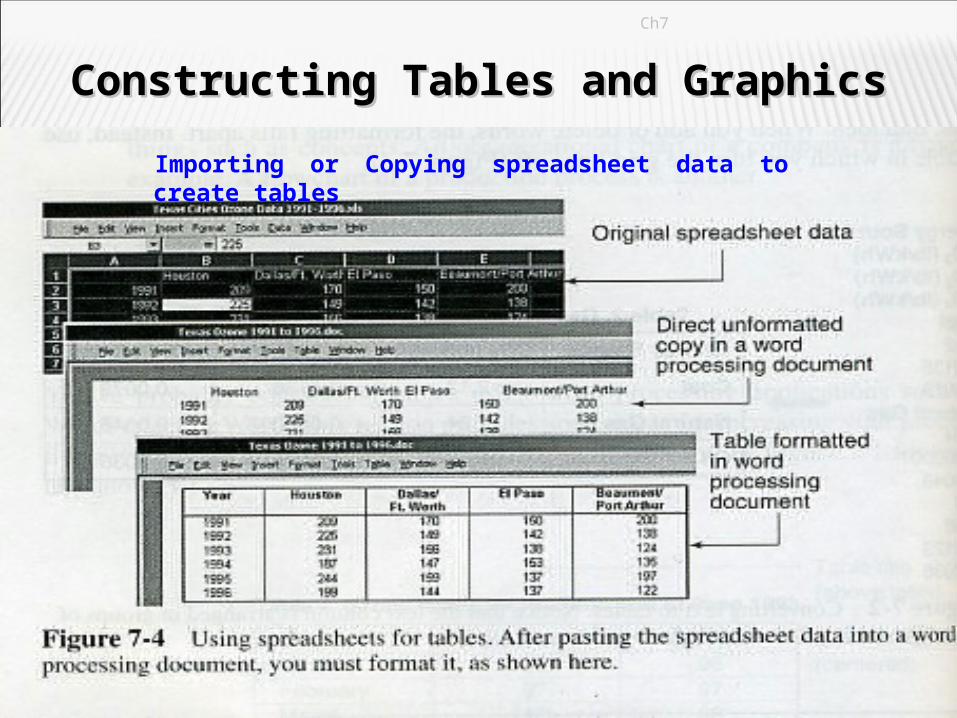
Constructing Tables and GraphicsConstructing Tables and GraphicsConverting text to table and two-column listsImporting or Copying spreadsheet data to create tables
Ch7
7
Constructing Tables and GraphicsConstructing Tables and Graphics
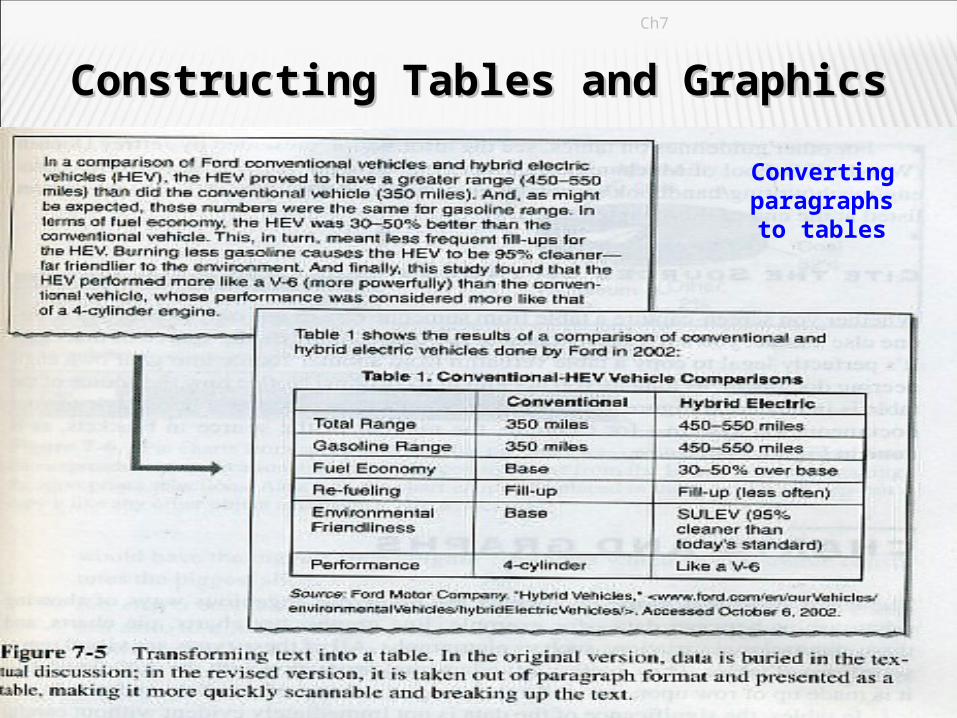
Converting paragraphs to
tables
Ch7
8
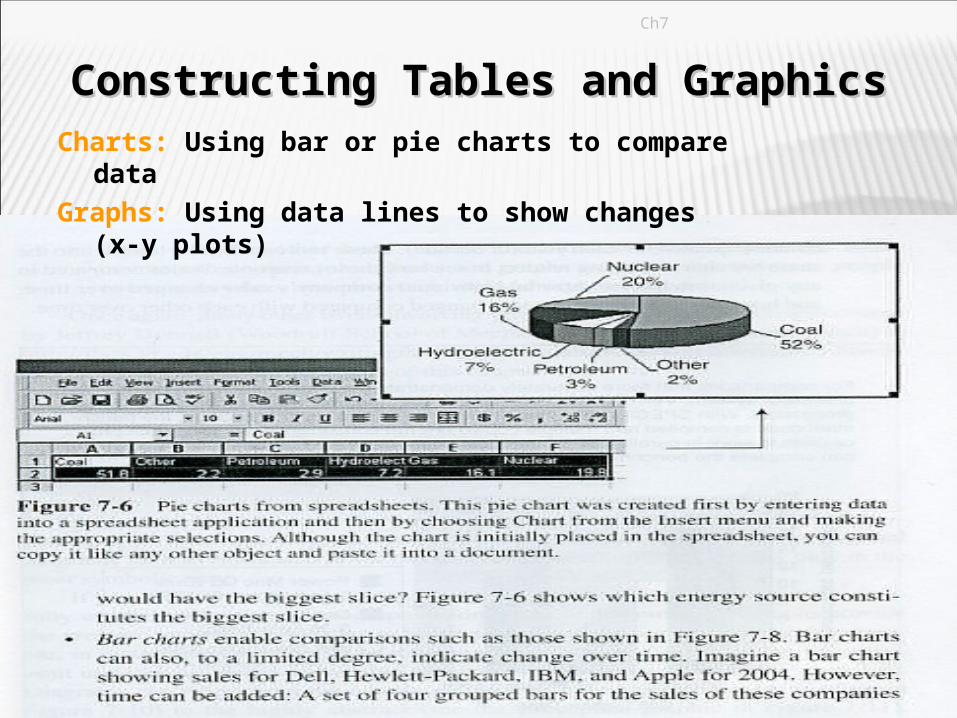
Constructing Tables and GraphicsConstructing Tables and GraphicsCharts: Using bar or pie charts to compare dataGraphs: Using data lines to show changes (x-y plots)

Ch7
9
Constructing Tables and GraphicsConstructing Tables and Graphics
Figure 4.20 Lateral extrusion of gasket vs. inside water pressure at different initial joint gaps after 30 min. elapsed time for picture frame water leakage test using EPDM gasket
0 10 20 30 40 50 60 70 80 90 100 110 120-0.01
0.00
0.01
0.02
0.03
0.04
0.05gap = 0.1597gap = 0.194gap = 0.26gap = 0.225gap =0.275gap = 0.308gap = 0.3223
Elapsed time = 30 minOffset = 0.0 inElapsed time = 30 minOffset = 0.0 in
Inside water pressure, Pi (psi)
Late
ral e
xtru
sion
of g
aske
t (in
)

Ch7
10
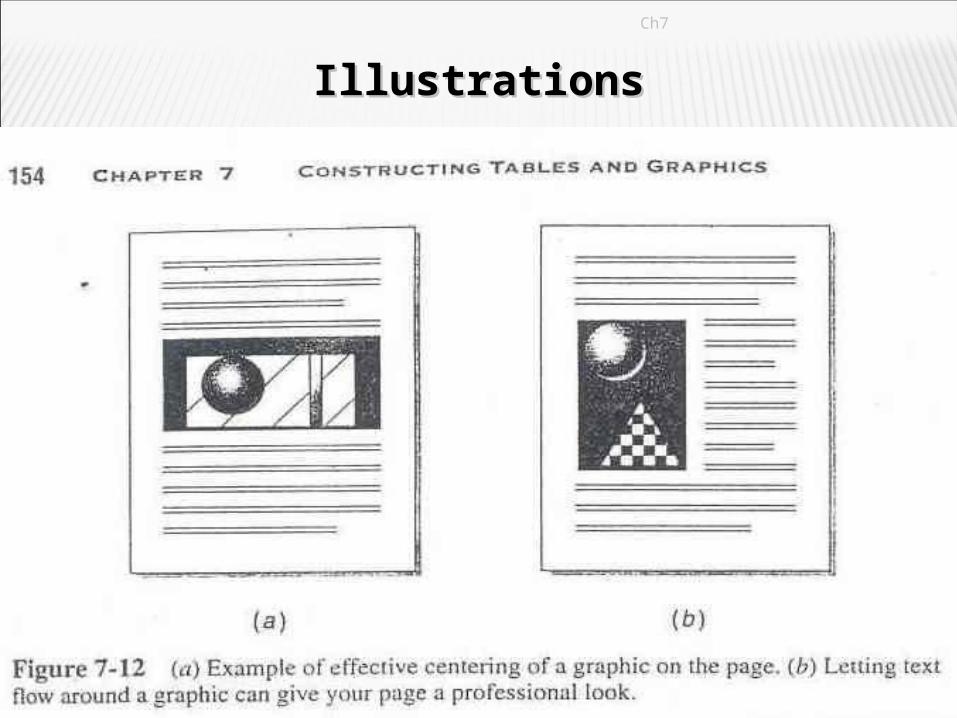
IllustrationsIllustrations
Refers to photographs, drawings, diagrams and flowcharts, and schematics
Sources (cite the source): Internet: download or copy and paste Hardcopy scan: scan the image and import it to your document Graphic professionals: They can do the drawings for you You create your drawing using special software such as CorelDraw, AutoCAD, Visio, Adobe Photoshop, …etc

Ch7 11
IllustrationsIllustrations

Ch7 12
IllustrationsIllustrations

Ch7
13
IllustrationsIllustrationsGraphics and Tables GuidelinesGraphics and Tables Guidelines
When incorporating graphics and tables into an engineering document, pay attention to their standard components, their placement, and cross references to them. The following lists summarizes guidelines stated in this chapter.
Add figure and table tittles Add labels: In illustrations, add words that
identify the parts of the thing being illustrated, and a pointer from each label to the part being illustrated. In charts and graphs, add labels to the axes.

Ch7
14
IllustrationsIllustrationsGraphics and Tables GuidelinesGraphics and Tables Guidelines
Indicate sources of borrowed graphics or tables
Place graphics and tables at the point of first reference
Align and position graphics carefully
Include a legend: if your graphs or charts use different symbols, colors, shadings, or patterns to indicate different elements, include a legend (Figures 7-7 and 7-8).

Ch7
15
IllustrationsIllustrations
Line Graphs

Ch7
16
IllustrationsIllustrations
Bar Charts

Ch7
17
IllustrationsIllustrationsGraphics and Tables GuidelinesGraphics and Tables Guidelines
Provide cross reference to your graphics and tables. Do not just pitch graphics and tables into engineering documents without referring to them and explaining key points, otherwise readers may have a nice picture or a pile of statistics, but no sense of purpose or meaning. Use phrasing like the following As can be seen in Figure 5 The arrangement of the network (Figure 8.2) Averages for the fabric cutting speeds are shown in Table 4 on the next page.
Ch7
18
IllustrationsIllustrations
Bar Charts


