CARDIOVASCULAR RESPONSES TO STRESS: A POTENTIAL PATHWAY LINKING
SLEEP AND CARDIOVASCULAR DISEASE?
by
Elizabeth Jane Mezick
B.A., Loyola College in Maryland, 2003
M.S., University of Pittsburgh, 2008
Submitted to the Graduate Faculty of
the Kenneth P. Dietrich School of Arts and Sciences in partial fulfillment
of the requirements for the degree of
Doctor of Philosophy
University of Pittsburgh
2012

ii
UNIVERSITY OF PITTSBURGH
THE KENNETH P. DIETRICH SCHOOL OF ARTS AND SCIENCES
This dissertation is presented
by
Elizabeth Jane Mezick
It was defended on
April 17, 2012
and approved by
Martica Hall, Ph.D., Associate Professor, Department of Psychiatry and Psychology
J. Richard Jennings, PhD., Professor, Department of Psychiatry and Psychology
Thomas W. Kamarck, Ph.D., Professor, Department of Psychology
Stephen B. Manuck, Ph.D., Professor, Department of Psychology
Dissertation Advisor: Karen A. Matthews, Ph.D., Distinguished Professor of
Psychiatry, Professor of Psychology and Epidemiology

iii
Reports of short sleep are related to incident cardiovascular (CV) disease. Previous data suggest
that changes in basal autonomic activity may be one pathway through which habitually short
sleep increases CV risk. No studies have examined whether chronic, moderate sleep loss is
related to acute, autonomic responses to stressful stimuli in healthy populations. This study
compared CV responses to psychological stressors in a group of undergraduate men reporting
habitual sleep duration of ≤6 hours per night (n = 37) versus those reporting habitual duration of
7-8 hours per night (n = 42). Wrist actigraphy was used to assess total sleep time and sleep
efficiency based on mobility for one week prior to CV stress testing. Laboratory stress tests
included two computer tasks (Stroop color-word interference task and a numeric multisource
interference task) and preparation and delivery of a speech while heart rate (HR) and blood
pressure (BP) were monitored. Reactivity and recovery indices of HR, high-frequency heart rate
variability (HF-HRV), and BP were created by regressing task and post-task values, respectively,
on baseline values. Participants reporting ≤6 hours of sleep per night rated stress tasks as more
arousing, and they had delayed HR recovery, compared to those reporting 7-8 hours of sleep; the
two groups did not differ in any of the other CV parameters. After adjusting for age, race, body
mass index, health behaviors, and psychosocial factors, shorter actigraphy-assessed sleep was
related to greater HF-HRV withdrawal during stress tasks, and delayed HR and diastolic BP
stress recovery. Decreased actigraphy-assessed sleep efficiency was related to greater HF-HRV
CARDIOVASCULAR RESPONSES TO STRESS: A POTENTIAL PATHWAY
LINKING SLEEP AND CARDIOVASCULAR DISEASE?
Elizabeth Jane Mezick, Ph.D.
University of Pittsburgh, 2012
iv
withdrawal during stress and delayed HR recovery. Associations between sleep and HF-HRV
were independent of respiration rate. Links between sleep and delayed HR recovery were no
longer significant after adjusting for actigraphy-assessed daytime naps. In sum, healthy young
men with shorter actigraphy-assessed sleep exhibit less vagal inhibition, and prolonged HR and
diastolic BP recovery, upon encountering stressful stimuli. Such responses may have
pathophysiological CV effects, and, thus, may be one mechanism linking short sleep to CV
outcomes.

v
TABLE OF CONTENTS
TABLE OF CONTENTS ............................................................................................................ V
LIST OF TABLES ...................................................................................................................... IX
LIST OF FIGURES .................................................................................................................... XI
PREFACE .................................................................................................................................. XII
1.0 INTRODUCTION ........................................................................................................ 1
1.1 SLEEP AND CARDIOVASCULAR DISEASE ............................................... 3
1.1.1 Variability in sleep duration ........................................................................ 6
1.2 CARDIOVASCULAR STRESS RESPONSES ................................................. 8
1.3 HOW MIGHT SLEEP RELATE TO CARDIOVASCULAR STRESS
RESPONSES? ..................................................................................................................... 11
1.4 STUDIES OF SLEEP AND CARDIOVASCULAR STRESS RESPONSES16
1.4.1 Sleep and other physiological stress responses ......................................... 19
1.5 POTENTIAL CONFOUNDERS OF THE RELATIONSHIP BETWEEN
SLEEP AND CARDIOVASCULAR STRESS RESPONSES ........................................ 20
1.6 STATEMENT OF PURPOSE .......................................................................... 22
2.0 HYPOTHESES ........................................................................................................... 24
3.0 METHODS ................................................................................................................. 28
3.1 PARTICIPANTS ............................................................................................... 28

vi
3.1.1 Power calculation ........................................................................................ 29
3.2 PROCEDURE .................................................................................................... 30
3.2.1 Laboratory testing session .......................................................................... 30
3.3 MEASURES ....................................................................................................... 32
3.3.1 Physiological data processing .................................................................... 32
3.3.2 Actigraphy ................................................................................................... 33
3.3.3 Sleep diary ................................................................................................... 34
3.3.4 Sleep questionnaires.................................................................................... 34
3.3.5 Psychological attributes .............................................................................. 35
3.4 ANALYTIC PLAN ............................................................................................ 37
4.0 RESULTS ................................................................................................................... 40
4.1 SAMPLE CHARACTERISTICS ..................................................................... 40
4.1.1 Actigraphy ................................................................................................... 46
4.1.2 Cardiovascular stress responses ................................................................ 49
4.1.3 Factor analysis of cardiovascular stress reactivity and recovery ........... 53
4.1.4 Subjective laboratory ratings..................................................................... 55
4.2 HYPOTHESIS ONE .......................................................................................... 56
4.2.1 Cardiovascular stress responses by self-reported sleep duration group 56
4.2.2 Potential mediators of group differences in cardiovascular stress
responses ..................................................................................................................... 62
4.2.3 Naps .............................................................................................................. 62
4.2.4 Continuous measure of self-reported sleep duration ............................... 62
vii
4.2.5 Continuous measure of self-reported sleep duration and cardiovascular
stress responses after adjustment for mediators and naps..................................... 63
4.2.6 Cardiovascular stress responses and actigraphy-measured sleep
duration. ...................................................................................................................... 63
4.2.7 Potential mediators of relationships between actigraphy-measured total
sleep time and cardiovascular stress responses ....................................................... 67
4.2.8 Naps .............................................................................................................. 68
4.3 HYPOTHESIS TWO......................................................................................... 69
4.3.1 Potential mediators of relationships between actigraphy-measured sleep
efficiency and cardiovascular stress responses ........................................................ 72
4.3.2 Naps .............................................................................................................. 73
4.4 HYPOTHESIS THREE .................................................................................... 73
4.5 SUPPLEMENTARY ANALYSES ................................................................... 75
4.5.1 Actigraphy-measured sleep directly prior to the laboratory session ..... 75
4.5.2 Diary-measured sleep quality .................................................................... 75
4.5.3 Weekday versus weekend sleep ................................................................. 76
4.5.4 Moderators of the sleep-cardiovascular stress response relationship .... 76
4.5.5 Sleep as a mediator of psychosocial attributes and cardiovascular stress
responses ..................................................................................................................... 77
5.0 DISCUSSION ............................................................................................................. 78
5.1 CARDIOVASCULAR STRESS RESPONSES BY SELF-REPORTED
SLEEP DURATION GROUP ........................................................................................... 79

viii
5.2 CARDIOVASCULAR STRESS RESPONSES AND ACTIGRAPHY-
ASSESSED SLEEP DURATION ...................................................................................... 83
5.3 CARDIOVASCULAR STRESS RESPONSES: A CLOSER LOOK ........... 85
5.3.1 High-frequency heart rate variability and heart rate ............................. 85
5.3.2 Blood pressure ............................................................................................. 90
5.4 WHAT MAY ACCOUNT FOR THE LINKS BETWEEN ACTIGRAPHY-
ASSESSED SLEEP DURATION AND CARDIOVASCULAR STRESS
RESPONSES? ..................................................................................................................... 92
5.5 CARDIOVASCULAR STRESS RESPONSES AND ACTIGRAPHY-
ASSESSED SLEEP EFFICIENCY................................................................................... 95
5.6 CARDIOVASCULAR STRESS RESPONSES AND WITHIN-PERSON
VARIABILITY IN ACTIGRAPHY-ASSESSED SLEEP DURATION ....................... 96
5.7 CARDIOVASCULAR STRESS RESPONSES AND SLEEP QUALITY .... 98
5.8 LIMITATIONS ................................................................................................ 100
5.9 FUTURE DIRECTIONS................................................................................. 103
5.10 SUMMARY ...................................................................................................... 106
APPENDIX ................................................................................................................................ 109
BIBLIOGRAPHY ..................................................................................................................... 118

ix
LIST OF TABLES
Table 1. Sample characteristics..................................................................................................... 41
Table 2. Sample characteristics by self-reported sleep duration group ........................................ 43
Table 3. Means (SDs) of diary characteristics by self-reported sleep duration group .................. 45
Table 4. Means (SDs) of actigraphy sleep characteristics by self-reported sleep duration group 47
Table 5. Correlations among self-report and actigraphy sleep parameters ................................... 49
Table 6. Means (SDs) of subjective reports throughout laboratory session ................................. 55
Table 7. HR during baseline, reactivity, and recovery by self-reported sleep duration group ..... 56
Table 8. HF-HRV during baseline, reactivity, and recovery by self-reported sleep duration group
....................................................................................................................................................... 58
Table 9. BP during baseline, reactivity, and recovery by self-reported sleep duration group ...... 60
Table 10. Results from linear regression models examining actigraphy total sleep time and CV
stress reactivity.............................................................................................................................. 63
Table 11. Results from linear regression models examining actigraphy total sleep time and CV
stress recovery ............................................................................................................................... 64
Table 12. Results from linear regression models examining actigraphy sleep efficiency and CV
stress recovery ............................................................................................................................... 70

x
Table 13. Results from linear regression models examining actigraphy sleep efficiency and CV
stress recovery ............................................................................................................................... 70
Table 14. Results from linear regression models examining variability in actigraphy total sleep
time and CV stress reactivity ........................................................................................................ 74
Table 15. Results from linear regression models examining variability in actigraphy total sleep
time and CV stress recovery ......................................................................................................... 74
Table 16A. Correlations among HR reactivity values ................................................................ 109
Table 17A. Correlations among HR recovery values ................................................................. 109
Table 18A. Correlations among HF-HRV reactivity values ....................................................... 110
Table 19A. Correlations among HF-HRV recovery values ........................................................ 110
Table 20A. Correlations among BP reactivity values ................................................................. 111
Table 21A. Correlations among BP recovery values .................................................................. 112
Table 22A. Correlations between actigraphy sleep variables and psychosocial and self-reported
sleep ............................................................................................................................................ 113
Table 23A. Correlations between actigraphy sleep variables and diary attributes ..................... 114
Table 24A. Correlations between actigraphy sleep variables and laboratory task ratings ......... 114
Table 25A. Correlations between laboratory task ratings and cardiovascular stress responses . 115

xi
LIST OF FIGURES
Figure 1. Model of sleep and cardiovascular reactivity and recovery ......................................... 12
Figure 2. Laboratory testing protocol .......................................................................................... 31
Figure 3. Actigraphy total sleep time by self-reported sleep duration group .............................. 48
Figure 4. Mean heart rate throughout laboratory session ............................................................ 50
Figure 5. Mean HF-HRV throughout the laboratory session ....................................................... 51
Figure 6. Mean systolic and diastolic BP throughout the laboratory session .............................. 52
Figure 7. HR across laboratory session in sleep duration groups ................................................ 57
Figure 8. HF-HRV across laboratory session in sleep duration groups ....................................... 59
Figure 9. SBP throughout laboratory session in sleep duration groups ....................................... 61
Figure 10. DBP throughout laboratory session in sleep duration groups .................................... 61
Figure 11. HR recovery averaged across task by tertile of time spent asleep .............................. 65
Figure 12. Baseline to task HF-HRV reactivity averaged across task by tertile of time spent
asleep............................................................................................................................................. 65
Figure 13. DBP recovery averaged across task by tertile of time spent asleep ............................ 66
xii
PREFACE
I would like to thank the many people in my life who supported and encouraged me throughout
my years in Pittsburgh. First, I would like to thank my advisor and mentor, Dr. Karen Matthews,
for her guidance in science and in professionalism, her many hours of advice, her enthusiasm for
our work together, and her belief in me. She has brought together the most excellent group of
people in the Cardiovascular Behavioral Medicine laboratory, all of whom provided me with
support, encouragement, and fun throughout the past 6 years. I would also like to thank the
psychology and psychiatry faculty at the University of Pittsburgh - in particular, Dr. Martica
Hall, Dr. Tom Kamarck, Dr. Dick Jennings, Dr. Steve Manuck, and Dr. Jane Owens, each of
whom dedicated their time and expertise to my research projects and went above and beyond in
supporting my graduate career. On a personal level, I would like to thank my family, especially
my mom, dad, and sisters, for their support, encouragement, and frequent visits, for their
willingness to listen, and their ability to make me laugh. Finally, I cannot express enough
gratitude to the lifelong friends that I have made at Pitt. In particular, Catherine Middlebrooks,
Josh Fetterman, Susan Gillo, Kasey Griffin, Luke Hyde, Julie Michael, Karen Munoz, &
Desiree Wilkinson: thank you for making each year better than the last. To my “twin,” office
mate, and friend, Aimee Midei: I can’t imagine the past 6 years without you! And to Josh
Pantesco: thank you for your patience and never-ending belief in me.

1
1.0 INTRODUCTION
A growing epidemiological literature suggests that sleep characteristics predict cardiovascular
outcomes. Self-reported short sleep is related to incident cardiovascular disease, including
coronary heart disease, myocardial infarction, and death from cardiovascular causes (Ayas et al.,
2003; Chen et al., 2008; Ferrie et al., 2006; Ikehara et al., 2009; King et al., 2008; Meisinger
Heier, Lowel, Schneider, & Doring, 2007). Indices of disrupted sleep continuity, such as
increased sleep latency and wake after sleep onset, are also predictors of cardiovascular
morbidity and mortality (Mallon, Broman, & Hetta, 2002; Meisinger, et al., 2007; Nicholson,
Fuhrer, & Marmot, 2005). Additionally, short and fragmented sleep are associated with major
cardiovascular risk factors, including hypertension (Phillips & Mannino, 2007), diabetes
(Mallon, Broman, & Hetta 2005), obesity (Marshall, Glozier, & Grunstein, 2008), and the
metabolic syndrome (Hall et al., 2008).
Changes in autonomic nervous system activity constitute one plausible pathway through
which sleep may increase cardiovascular risk. Cardiovascular activation may be a particularly
relevant mechanism, as the same aspects of cardiovascular activity that are posited to play a
causal role in the development of cardiovascular disease – namely, increases in heart rate and
blood pressure, and decreases in high frequency heart rate variability - are also affected by sleep.
For instance, experimental sleep deprivation leads to increased heart rate and blood pressure, and
reduced heart rate variability, in some but not all studies (Meier-Ewart et al., 2004; Spiegel,
2
Leproult, & Van Cauter, 1999; Zhong et al., 2005), and short and fragmented sleep are related to
subsequent daytime increases in cardiovascular activity (Barnett & Cooper, 2008; Tochikubo,
Ikeda, Miyajima, & Ishii, 1996). In addition to influencing basal autonomic activity, it is also
possible that sleep loss modulates acute autonomic responses to stressful stimuli. The
cardiovascular reactivity hypothesis posits that exaggerated increases of the sympathetic nervous
system in response to stress leads to cardiovascular disease over time (Krantz & Manuck, 1984;
Jennings, Kamarck, Everson-Rose, Kaplan, Manuck, & Salonen, 2004; Matthews, Zhu, Tucker,
& Whooley, 2006; Treiber, Kamarck, Schneiderman, Sheffield, Kapuku, & Taylor, 2003).
Subsequent theories have suggested that in addition to reactivity, prolonged cardiovascular
recovery from stressors also may have pathophysiological effects on the cardiovascular system
(Linden et al., 1997; Schuler & O’Brien, 1997). Thus, if sleep disturbances are related to
exaggerated or prolonged cardiovascular reactions to stress, these responses may represent one
pathway linking sleep to cardiovascular disease.
The purpose of the proposed project is to examine the hypotheses that cardiovascular
reactions to psychological stress are indeed more exaggerated and prolonged in individuals with
short or inefficient sleep. These questions will be examined in two groups of healthy young men
who differ on self-reports of habitual sleep duration, with the expectation that those reporting
short sleep (≤ 6 hours) will have greater cardiovascular responses to stress than those reporting
average sleep (7 – 8 hours). Additionally, participants will wear a wrist actigraph for the seven
nights preceding laboratory stress tasks in order to determine whether cardiovascular stress
responses are influenced by objective assessments of recent sleep patterns. Specifically, it is
hypothesized that those with shorter, less efficient, and more variable sleep will show greater
cardiovascular stress responses.

3
The proposed project has several important implications. Positive findings will support a
potential mechanistic pathway linking sleep disturbance to cardiovascular mortality and
morbidity. Studying sleep and stress responses in healthy individuals, in particular, reduces
some of the potentially confounding factors (i.e., disease status, medication use, obesity) that
may have influenced previous associations between sleep and clinical cardiovascular outcomes.
In addition, identifying the specific aspects of sleep (i.e., short vs. fragmented sleep) most
closely related to cardiovascular reactivity may inform prevention strategies in targeting the most
relevant risk characteristics early in the disease process.
1.1 SLEEP AND CARDIOVASCULAR DISEASE
The current project focuses on short sleep duration and disrupted sleep continuity, as they have
been related to cardiovascular disease in a multitude of studies, and there are several theoretical
pathways that may link these sleep characteristics to cardiovascular stress responses. Although
long sleep (i.e., > 8 hours) has also been related to cardiovascular morbidity and mortality (Chen
et al., 2008), there is less evidence of a causal association, with some suggesting that long sleep
is more likely a marker of unmeasured, confounding factors (i.e., subclinical disease, depression,
socioeconomic status; Knutson & Turek, 2006).
With regard to short sleep, reporting a habitual sleep duration of less than five or six
hours is associated with an elevated risk for hypertension and cardiovascular events in some
(Amagai et al., 2010; Ayas et al., 2003; Chen et al., 2008; Gangwisch et al., 2006; Gottlieb et al.,
2006; Ikehara et al., 2009), but not all, studies (Lopez-Garcia et al., 2009; van den Berg et al.,
2007). Two recent meta-analyses concluded that self-reported short sleepers have an elevated

4
mortality risk compared to those sleeping 7-8 hours per night (Cappuccio, D’Elia, Strazzullo, &
Miller, 2010; Gallicchio & Kalesan, 2009), although the one review that examined
cardiovascular-related death separately found that the effect for short sleep did not reach
statistical significance (Galliccio & Kalesan, 2009). There is some evidence of a decreasing
trend in self-reported sleep over the past 40 years in the United States (Van Cauter, Knutson,
Leproult, & Spiegel, 2005), and 20% of adults currently report sleeping less than six hours on
weeknights (National Sleep Foundation [NSF], 2009). Thus, studying the cardiovascular
consequences of self-reported short sleep may have significant public health implications.
Actigraphy estimates of sleep duration have been used in a smaller number of studies
than self-report measures. At least two studies report inverse associations between actigraphy-
measured sleep duration and blood pressure in mid-life (Knutson et al., 2009) or in adolescents
(Javaheri, Storfer-Isser, Rosen, & Redline, 2008), and actigraphy-assessed short sleep, but not
self-report, was associated with an increase in coronary artery calcification over five years in the
Coronary Artery Risk Development in Young Adults (CARDIA) cohort (King, Knutson,
Rathouz, Sidney, Liu, & Lauderdale, 2008). Short sleep as measured by PSG has also been
associated with factors that increase cardiovascular risk, such as the metabolic syndrome (Hall et
al., in press) and central adiposity (Theorell-Haglöw, Berne, Janson, Sahlin, & Lindberg, 2010).
In sum, short sleep is associated with incident cardiovascular disease and risk markers in
a number of studies, although the data are not entirely consistent. The bulk of the evidence
linking short sleep to cardiovascular disease is based on self-reports of habitual sleep duration,
which may suggest that short sleep (or perceptions of short sleep) over an extended period of
time is associated with the development of disease. Relationships between actigraphy or PSG
estimates of sleep duration and cardiovascular disease have been examined in a smaller number

5
of studies; however, those that have investigated this question report an inverse relationship
between sleep duration and disease outcomes or risk factors. Although it appears that short sleep
is becoming more common in the United States, the reasons for this decline are unclear. A
number of factors may influence sleep duration, including biological sleep need, environmental
influences, and unconsolidated sleep (i.e., difficulty falling or staying asleep). More information
on the reasons for short sleep may be helpful in refining models of sleep and cardiovascular
disease risk (Grandner, Patel, Gehrman, Perlis, & Pack, 2009).
In addition to sleep duration, aspects of sleep continuity, or the ease or difficulty
associated with initiating and maintaining sleep, are also related to incident cardiovascular
disease, including hypertension (Phillips & Mannino, 2007), myocardial infarction (Meisinger et
al., 2007), and death from coronary heart disease (Mallon, Broman, & Hetta, 2002). The vast
majority of studies linking disrupted sleep continuity with hypertension or cardiovascular events
rely on self-reports of difficulty falling or staying asleep. In contrast, very few studies examine
objective measures, such as PSG or actigraphy, of sleep continuity in relation to cardiovascular
disease, and none have combined objective measures with prospective designs. Knutson et al.
(2009) demonstrated that lower sleep maintenance, as measured by actigraphy, was associated
with larger increases in blood pressure over a five-year period; however, actigraphy data were
collected in the middle of the five years, rather than at the start of the protocol. In a study by
Javaheri et al. (2008), adolescents with low weeknight sleep efficiency (defined as ≤85%) as
assessed by actigraphy were 3.5 times more likely to have pre-hypertensive blood pressure
levels. Another recent study reported that PSG sleep efficiency was reduced in those with
resistant hypertension compared to normotensive adults and those with controlled hypertension,
independent of sleep apnea (Friedman, Bradley, Ruttanaumpawan, & Logan, 2010). PSG

6
measures of sleep efficiency or wakefulness after sleep onset have also been related to
cardiovascular risk factors, such as prothrombotic and inflammatory markers (von Kanel et al.,
2006; von Känel, Loredo, Ancoli-Israel, Mills, Natarajan, & Dimsdale, 2007). Data from several
studies show that fragmented sleep may be associated with heightened autonomic activation,
including transitory increases in heart rate and blood pressure (Janackova & Sforza, 2008),
consistent with autonomic activity being one mechanism between poor sleep continuity and
cardiovascular outcomes.
In the aggregate, data show that aspects of sleep continuity are also related to
cardiovascular risk. There are some prospective studies showing that self-reports of difficulty
falling or staying asleep predict the development of cardiovascular disease, while all of the
studies linking actigraphy or PSG estimates of sleep continuity to cardiovascular disease or risk
markers are cross-sectional in nature.
1.1.1 Variability in sleep duration
Traditionally, studies of sleep and cardiovascular disease have focused on mean levels of sleep
duration or continuity over time. However, it is unlikely that sleep disturbances occur on a
consistent and regular basis across nights. For instance, a person with short or fragmented sleep
one night may have longer or more solid sleep the following night due to the homeostatic process
of sleep regulation. Indeed, several studies demonstrate that individuals’ sleep may be
characterized by a high degree of variability, or instability, across nights (Mezick et al., 2009;
Knutson, Rathouz, Yan, Liu, & Lauderdale, 2007), with greater variability in sleep
7
characteristics among those with insomnia (Buysse et al., 2010). Because individuals likely
differ in their biological need for sleep (Tucker, Dinges, Van Dongen, 2007), consistently short
sleep patterns may not always be associated with negative health outcomes. In contrast, a pattern
of highly variable sleep duration across nights may reflect a state of sleep debt and an attempt to
“catch up” to one’s required amount of sleep. Thus, nightly variability in sleep duration may
also be important to consider in relation to cardiovascular disease.
One potential reason that persons with a varied sleep pattern may be at increased risk for
cardiovascular disease is that they may have an inefficient or dysregulated circadian pattern of
endocrine (e.g., cortisol, catecholamine) and autonomic (e.g., blood pressure) activity compared
to those who keep regular sleep schedules. For instance, an early intervention study that altered
sleep-wake schedules of policemen to be more in line with the naturally occurring circadian
rhythm resulted in a decrease in nocturnal catecholamine activity (Orth-Gomer, 1983).
Consistent with this finding is work showing that individuals with a high degree of nightly
variability in their sleep duration and fragmentation (as measured by individual standard
deviations) have elevated nocturnal norepinephrine levels, especially when they also report high
levels of negative affect (Mezick et al., 2009). Few other studies of variability in sleep patterns
in relation to physiological measures or disease outcomes have been conducted. However, a
related literature has shown that rotating shift work confers risk for obesity, diabetes, and heart
disease (DiLorenzo et al., 2003; Fujino, et al., 2006; Kawachi et al., 1995; Sookoian et al., 2007;
Morikawa et al., 2007), with some suggesting that a desynchronization of the sleep-wake
schedule and circadian biological rhythms may be partially responsible.
In sum, self-reports of short and fragmented sleep are associated with cardiovascular
morbidity and mortality in a growing number of studies. Short and fragmented sleep, as

8
measured by actigraphy or PSG, have also been associated with concurrent hypertension and
other cardiovascular risk markers. Finally, although there are few data directly linking variable
sleep patterns to cardiovascular risk, there is some theoretical evidence to support such a
relationship. While data on sleep and cardiovascular disease are increasing, the mechanisms
responsible for this relationship have not yet been delineated. The current project proposes to
examine one plausible physiological pathway that may link sleep characteristics to disease:
cardiovascular responses to psychological stress.
1.2 CARDIOVASCULAR STRESS RESPONSES
Treiber and colleagues (2003) define cardiovascular reactivity as the “magnitude or pattern of an
individual’s hemodynamic responses to behavioral stressors” (p. 46). Such hemodynamic
responses appear to be a relatively stable, or trait-like, individual difference characteristic
(Treiber et al., 2003). For example, a recent study reported that correlations for heart rate and
blood pressure responses to a mental arithmetic task ranged from .60 to .70 over an 18-year
period (Hassellund, Flaa, Sandvik, Kjeldsen, & Rostrup, 2010). Support for associations
between psychological attributes and cardiovascular reactivity partly emerged from studies
showing that individuals with a Type A behavior pattern also showed exaggerated heart rate and
blood pressure increases during mental stress tasks (Krantz & Manuck, 1984). Since that time,
cardiovascular reactivity has often been posited as a pathway linking a variety of psychosocial
characteristics with coronary heart disease and essential hypertension (Chida & Hamer, 2008;
Chida & Steptoe, 2010).

9
Early evidence linking cardiovascular reactivity as a possible etiological factor in disease
came from a series of studies in which cynomolgus monkeys on an atherogenic diet were
challenged with the threat of capture (Clarkson, Kaplan, Adams, & Manuck, 1987). These
experiments showed that monkeys with the greatest heart rate responses to threat of capture also
had the greatest degree of coronary atherosclerosis. Since this seminal work, data supporting the
prognostic value of cardiovascular responses to psychological stress have accumulated in
humans. In their review of the literature, Treiber et al. (2003) describe largely consistent
associations between cardiovascular reactivity to acute stress and incident hypertension,
moderate evidence linking reactivity to subclinical disease states (ventricular remodeling; carotid
atherosclerosis), and less consistent data linking reactivity to clinical disease. However, several
subsequent studies have shown blood pressure reactivity, in particular, to be a predictor of
atherosclerosis in relatively healthy adults (Jennings, Kamarck, Everson-Rose, Kaplan, Manuck,
& Salonen, 2004; Matthews, Zhu, Tucker, & Whooley, 2006). Exaggerated and repeated
cardiovascular reactions are thought to be related to the development of cardiovascular disease
via several pathophysiological mechanisms, including endothelial injury from increased flow
turbulence, and lipid mobilization and platelet aggregation from corresponding sympathetic
activation (Dimsdale & Herd, 1982; Manuck, 1994; Markovitz & Matthews, 1991).
High frequency heart rate variability (HF-HRV) is considered to be an index of
parasympathetic, or vagal, function. Low levels of tonic HRV are predictive of clinical coronary
heart disease and hypertension, as well as risk factors such as diabetes and obesity (Dekker et al.,
2000; Huikuri et al., 1999; Schroeder, Liao, Chambless, Prineas, Evans, & Heiss, 2003; Thayer,
Yamamoto, & Brosschot, 2009). In theory, increased vagal influence in response to stress could
dampen or counteract sympathetically driven increases in heart rate and blood pressure, thus

10
acting as a “buffer” against the consequences of sympathetic stress responses (Jennings, van der
Molen, Somsen, Graham, & Gianaros, 2002). However, few studies have looked at changes in
HRV in response to stress as an index of disease risk. One study by Gianaros and colleagues
(2005) showed that greater reductions in HF-HRV during preparation for a laboratory speech
task were associated with more extensive calcification in the coronary arteries and the aorta,
suggesting that parasympathetic activity during stress may be implicated in the atherosclerotic
process. Matthews, Salomon, Brady, and Allen (2003) also reported that lower mean successive
differences in interbeat intervals during a battery of laboratory stress tasks predicted increases in
diastolic blood pressure over a 3-year period in children and adolescents.
Linden, Earle, Gerin, and Christenfeld (1997) define cardiovascular recovery as the
degree to which elevations in cardiovascular parameters persist following the termination of a
stressor, or the length of time until stress-induced cardiovascular activity returns to baseline
levels. Some have argued that if frequent and intense cardiovascular reactions to stress are
pathogenic, then prolonged elevations should confer greater risk than reactions that are short-
lived (Pieper & Brosschot, 2005; Schwartz et al., 2003). Early studies showing that aerobic
fitness was associated with a quicker recovery to baseline following lab challenges, independent
of reactivity scores, were consistent with the known health-protective effects of exercise
(Jamieson & Lavoie, 1987, as cited by Linden et al., 1997). Family history of cardiovascular
disease (Gerin & Pickering, 1995) and various psychosocial factors, including chronic stress and
trait negative affect, have since been linked to poorer recovery (Chida & Hamer, 2008). There is
some evidence that perseverative cognitive processes such as worry and rumination may play a
particularly important role in sustaining cardiovascular reactions to stress (Brosschot, Pieper, &
Thayer, 2005).
11
Slower heart rate and blood pressure recovery from both physical and psychological stress has
been associated with cardiovascular morbidity and mortality in several samples (Cheng et al.,
2003; Stewart & France, 2001). Some have suggested that the prognostic value of
cardiovascular recovery is confounded with reactivity, as those who have the most exaggerated
increases to stress might also be expected to take the longest time to return to baseline levels;
however, several studies show that recovery predicts disease independent of cardiovascular
reactivity. For instance, slower blood pressure recovery following cognitive stress was related to
increases in blood pressure over a five-year period in young adults with borderline hypertension,
whereas blood pressure reactivity was unrelated (Borghi, Costa, Boschi, Mussi, & Ambrosini,
1986), and similar results were reported more recently in a normotensive, community sample
(Stewart et al., 2006). Other studies have shown that both reactivity and recovery are each
independent indicators of disease risk (Treiber et al., 2001). As similar physiological
mechanisms are thought to link both reactivity and recovery with disease, it is also possible that
these two responses act in a synergistic fashion, with prolonged recovery accelerating the
pathogenic effects of heightened reactivity (Stewart et al., 2006).
1.3 HOW MIGHT SLEEP RELATE TO CARDIOVASCULAR STRESS RESPONSES?
Sleep may be conceptualized as a resource that aids in regulating emotional responses to stress
(Hamilton et al., 2007). Individuals whose sleep is characterized by short duration, poor
efficiency, or high variability across nights may be more likely to show exaggerated

12
cardiovascular reactivity to and recovery from stress through both central and peripheral
pathways.
Figure 1. Model of sleep and cardiovascular reactivity and recovery
Sleep may be conceptualized as a resource for managing stress and regulating emotions.
Individuals whose “resource bank” has been depleted due to short, discontinuous, or variable
sleep may be more likely to show exaggerated cardiovascular reactivity and recovery to stress
through both central and peripheral pathways: A) Short, fragmented, or variable sleep may
influence responses to stress at the level of the central nervous system. Disturbed sleep may
result in stressful stimuli being perceived as more threatening or distressing and, thus,
accompanied by heightened emotional reactivity. Heightened emotional reactivity may result in
greater cardiovascular reactivity and prolonged recovery through corticolimbic influences on
autonomic activating areas. Sleep disturbances may also influence neural processes, particularly
in brain areas that are implicated in regulation of the autonomic stress response (e.g., the
amygdala), independent of subjective reports of distress. B) Sleep is an anabolic and restorative
state, with short sleep duration and decreased sleep efficiency resulting in greater cumulative
A. central
B.
peripheral
Sleep
Duration &
Continuity
-
Average
-
Variability
Affective Stress
Response - Perceptions /
Subjective - Neural /
Objective
exaggerate
d CV reactivity to
and recovery from
stress cumulative
exposure to ↑ SNS activity
and ↓ PNS activity (tonic)

13
exposure to increased sympathetic and decreased parasympathetic activity over a 24-hour period.
A greater physiological stress load may in turn alter one’s ability to respond effectively to stress
at the peripheral level, resulting in exaggerated and prolonged cardiovascular responses to
stressful stimuli.
Regarding the former pathway, Lovallo and colleagues (2005) propose a conceptual
model in which cardiovascular responses to stress result from interactions between cognitive
appraisal processes (at the corticolimbic level), neuromodulatory systems (at the midbrain and
brainstem level), and peripheral target organs. In this model, increased or dysregulated
corticolimbic activation involved in the evaluative appraisal of stressors is thought to result in
exaggerated cardiovascular responses. Although largely preliminary, some evidence suggests
that sleep loss may influence similar corticolimbic processes in response to affective stimuli. For
instance, a recent neuroimaging study shows that total sleep deprivation is linked to increased
reactivity of the amygdala to negative emotional stimuli, as well as greater functional
connectivity between the amygdala and autonomic-activating centers of the brainstem (Yoo,
Gujar, Hu, Jolesz, & Walker, 2007). Sleep-deprived individuals also show increased pupil
dilation in response to negatively valenced pictures, a response which is thought to reflect brain
processes associated with affect regulation and arousal (Franzen, Buysse, Dahl, Thompson, &
Siegle, 2009). Thus, it is possible that neural regions affected by sleep loss (e.g., amygdala)
overlap with those regions believed to play a regulatory role in the autonomic stress response
(Gianaros, Sheu, Matthews, Jennings, Manuck, & Hariri, 2008).
Sleep may influence appraisals of stressful events at the subjective level as well. Short
and poor quality sleep each have been shown to intensify reports of negative emotions in
response to stressful events (Hamilton, Catley, & Karlson, 2007; Kumari et al., 2009; Zohar et

14
al., 2005), and to reduce positive emotional responses to rewarding or goal-enhancing events
(Zohar et al., 2005). In a similar vein, sleep loss may affect the ability to emotionally recover
from stressors. In a sample of women with fibromyalgia, nights characterized by an inadequate
amount of sleep prevented affective “recovery” from stressful events, as demonstrated by reports
of elevated negative affect the next day (Hamilton et al., 2008). If short sleep results in more
intense and negative emotional reactions to taxing experiences, this may constitute an additional
pathway leading to greater cardiovascular reactivity (Feldman et al., 1999) and prolonged
recovery from stress (Pieper & Brosschot, 2005). In other words, short or inefficient sleep may
cause individuals to perceive events as more stressful, thereby amplifying emotional reactions
and altering the neural regions that orchestrate the cardiovascular stress response.
Lovallo and Gerin (2003) posit that in addition to neural influences, alterations in
peripheral mechanisms may influence cardiovascular stress responses. Specifically, they suggest
that individuals with altered adrenoreceptor sensitivity or those developing hypertension may
exhibit greater peripherally-induced physiological responses to stress, independent of central
input. Thus, peripheral pathways may be another mechanism linking sleep to cardiovascular
reactivity/recovery. Sleep is a restorative, anabolic process, typically characterized by decreased
cardiovascular and increased parasympathetic activity. For instance, recordings of heart rate and
blood pressure decline, and HRV increases (during non-rapid eye movement sleep, in particular),
during sleep relative to daytime in most individuals (Burgess, Trinder, Kim, & Luke, 1997;
Otzenberger et al., 1998; Hall et al., 2004; Trinder et al., 2001). Moreover, sleep onset is marked
by a decline in circulating norepinephrine and epinephrine levels, with both endogenous rhythms
and sleep itself believed to play a role in this process (Akerstedt, 1979; Irwin et al., 1999).

15
If sleep is a restorative state of lowered cardiovascular activity, then a loss of sleep
should be accompanied by elevations in cardiovascular parameters. Indeed, short sleep (Barnett
& Cooper, 2008; Friedman et al., 2009), poor sleep continuity (Matthews et al., 2008; Mausbach
et al., 2006), and variable sleep (Mezick et al., 2009) each have been linked to markers of
increased cardiovascular activity, including elevated blood pressure and heart rate, as well as
related increases in sympatho-adrenal medullary activity. Support for a causal role of sleep in
cardiovascular activation comes from sleep restriction experiments resulting in increased heart
rate and blood pressure, and shifts in sympathovagal balance (Meier-Ewart et al., 2004; Spiegel,
Leproult, & Van Cauter, 1999; Zhong et al., 2005), although not all studies have reported
consistent results (Meier-Ewart et al., 2004; Meunter et al., 2000). Short sleep duration in more
naturalistic settings is also associated with increased heart rate (Barnett & Cooper, 2008;
Tochikubo, Ikeda, Miyajima, & Ishii, 1996) and blood pressure the following day (Tochikubo et
al., 1996). Although the mechanisms by which sleep loss may increase heart rate and blood
pressure are unclear, both central and peripheral processes are hypothesized to play a role
(Ogawa et al., 2003; Sauvet et al., 2010). For instance, sleep deprivation results in a blunting of
the arterial baroreflex, as well as increases in markers of vascular dysfunction (microvascular
reactivity and endothelial cell activation), which are in turn associated with increases in heart
rate and blood pressure. Regarding sleep and parasympathetic function, decreased sleep
maintenance is related to reduced heart rate variability (Hall et al., 2004), and Bonnet and Arand
(1998) reported that heart rate variability was decreased in individuals with insomnia compared
to normal sleepers.
Taken together, these data suggest that persons with short, fragmented, and perhaps
variable sleep have greater cumulative exposure to increased cardiovascular activity and

16
decreased parasympathetic influence over a 24-hour period. Such an autonomic balance may
gradually lead to alterations in peripheral tissue function reflected by exaggerated cardiovascular
responses to stressful stimuli. As an example, sleep loss may be associated with pre-clinical
alterations in vascular resistance, which would in turn cause heightened and prolonged increases
in blood pressure reactivity. In this case, exaggerated cardiovascular responses may serve as a
marker of developing disease rather than a causal factor (Lovallo & Gerin, 2003).
1.4 STUDIES OF SLEEP AND CARDIOVASCULAR STRESS RESPONSES
As noted above, sleep loss is often conceptualized as a physical stressor that results in elevated
cardiovascular activity. In addition to lack of sleep being a stressor in and of itself (i.e., leading
to changes in basal cardiovascular activity), a handful of studies have examined the hypothesis
that sleep may be related to cardiovascular reactions to or recovery from stressful stimuli. For
instance, two previous studies in clinical adult samples provide data linking objective measures
of sleep and cardiovascular responses during stressful tasks (Palesh et al., 2008; Stepanski et al.,
1994). In the Stepanski et al. (1994) study, adults with insomnia slept for a shorter duration, had
more wake after sleep onset, and had less Stage 3-4 sleep during an overnight PSG study, and
they also showed greater increases in heart rate during a morning psychomotor task, than
individuals without insomnia. In a study of women with metastatic breast cancer, poorer
actigraphy-measured sleep continuity over three nights was associated with lower area under the
curve measures of respiratory sinus arrhythmia during the Trier Social Stress task (Palesh et al.,

17
2008). Regarding non-clinical populations, an increase in self-reports of typical sleep duration
over a 10-month period was associated with less vagal withdrawal during speech and mental
arithmetic tasks in 108 healthy adults (Uchino et al 2005). Thus, in the aggregate, these results
suggest that short or fragmented sleep may be associated with a cardiovascular stress response
marked by increased heart rate and reduced parasympathetic activity.
Regarding sleep deprivation, Zhong et al. (2005) reported that sleep-deprived adults who
underwent cognitive testing had more consistent increases in low frequency HRV and decreases
in HF-HRV and baroreflex sensitivity compared to adults who were sleep-deprived but did not
undergo cognitive testing, and those who performed cognitive tasks but were not sleep-deprived.
In other words, the combination of sleep deprivation and cognitive stress appeared to cause a
particularly pronounced sympathovagal shift. However, another study showed that one night of
sleep deprivation did not influence heart rate or blood pressure responses to a range of stressful
stimuli (mental arithmetic, hand grip, cold pressor, maximal forearm ischemic response), despite
overall elevations in blood pressure (Kato et al., 2000).
Other studies have failed to show an association between sleep deprivation and
physiological responses to physical challenges (i.e., exercise). Specifically, periods of sleep
deprivation ranging from 24-60 hours were not related to the magnitude of heart rate responses
to aerobic tasks in at least four studies (Martin & Chen, 1984; Martin, Bender, & Chen, 1986;
McMurray & Brown, 1984; Symons, VanHelder. & Myles, 1988). Meerlo, Sgoifo, and Suchecki
(2008) note that although sleep loss does not appear to affect acute physiological responses to
physical stressors, sleep may still influence responses to emotional stressors, as these challenges
may activate different brain regions. For instance, they argue that responses to emotional and

18
psychological challenges may be more susceptible to corticolimbic input, while physical stress
may directly activate neuroendocrine control centers (Meerlo, Sgoifo, & Suchecki, 2008).
El-Sheikh and Buckhalt (2005) examined the association between sleep and vagal
regulation during a reaction time task in school-aged children. In this sample, lower vagal
suppression (indicative of less vagal withdrawal) to the task was associated with increased
activity during the night and reduced sleep length across four nights as measured by actigraphy,
as well as children’s reports of sleep disruptions. More recently, Raikkonen et al. (2010) reported
that 8-year-old children with low actigraphy-assesed sleep efficiency (≤ 77.4%) showed greater
baseline α-amylase levels (a marker of sympatho-adrenal-medullary activity), as well as greater
peak levels of α-amylase, after a psychosocial stress test than children with higher sleep
efficiency. While the Raikkonen study noted that the sleep and stress test were measured within
one day of each other in over 90% of the sample, the study by El-Sheikh and Buckhalt does not
specify the time course of measurements. Thus, the two studies that examined physiological
responses to stressful stimuli in children are somewhat inconsistent, although the use of different
autonomic markers and stress tasks makes direct comparison of results difficult.
Finally, there is evidence that sleep loss may be associated with altered stress responses
in animals. For instance, rats that have been sleep deprived for 48 hours not only show increases
in overall heart rate and reductions in heart rate variability, but they also exhibit altered
cardiovascular responses to an acute, novel stressor (Sgoifo, Buwalda, Roos, Costoli, Merati, &
Meerlo, 2006). Specifically, rats in the sleep loss condition show a blunted parasympathetic
antagonism, or larger vagal withdrawal, following sympathetic activation in response to restraint
stress, which is in turn associated with increased susceptibility to cardiac arrhythmias. The

19
authors conclude that sleep loss may influence phasic responses to stressful stimuli, in addition
to altering basal levels of cardiovascular activity (Sgoifo et al., 2006).
1.4.1 Sleep and other physiological stress responses
In addition to cardiovascular reactivity, a small number of studies have examined sleep in
relation to other physiological stress responses. Most of these reports focus on activity of the
hypothalamic pituitary adrenocortical axis. For example, more actigraphy-measured wake after
sleep onset predicted blunted cortisol reactivity to the Stroop task the next day in a sample of
over 50 young-to-middle aged, healthy women (Wright, Valdimarsdottir, Erblich, & Bovbjerg,
2007). Similarly, Capaldi, Handwerger, Richardson, and Stroud (2005) demonstrated a blunted
cortisol response to psychological stress tasks among adolescents reporting more sleep-wake
behavior problems on a modified version of the Sleep Habits Survey (Carskadon, Seifer, &
Acebo, 1991). Sleep restriction and deprivation have also been shown to result in an attenuation
of adrenocorticotropic hormone release without changes in corticosterone levels, potentially
suggesting an increased adrenal sensitivity to stress (Meerlo et al., 2002; Sgoifio et al., 2006).
In sum, there is preliminary evidence to suggest that short and fragmented sleep, as
assessed by both self-report and objective measures, may be related to altered physiological
reactions to laboratory-induced cognitive and emotional stress. Most of the work in this area,
however, has been in studies of clinical populations (i.e., insomnia, cancer patients), or has
focused on experimental sleep deprivation. While it is theoretically plausible that more
normative variation in sleep may be associated with cardiovascular reactivity to stress, this
relationship has received little attention in healthy, adult populations, and virtually no studies

20
have investigated whether sleep is associated with cardiovascular recovery from stress.
Moreover, cardiovascular stress responses have not been examined in individuals reporting
habitually short sleep, despite the fact that this group shows elevated rates of incident
cardiovascular disease in a number of studies (Amagai et al., 2010; Ayas et al., 2003; Chen et al.,
2008; Gangwisch et al., 2006; Gottlieb et al., 2006; Ikehara et al., 2009).
1.5 POTENTIAL CONFOUNDERS OF THE RELATIONSHIP BETWEEN SLEEP
AND CARDIOVASCULAR STRESS RESPONSES
A number of factors are related to both sleep and cardiovascular stress responses, and, thus, may
confound observed relationships between these variables. Some of the most relevant potential
third factors include psychological attributes, chronic stress, obesity, and health behaviors.
Sleep and psychological attributes are closely related. Decreased sleep duration,
continuity, and quality are associated with depression, anxiety, and hostility, and greater nightly
variability in sleep patterns is related to negative affect in both adolescents (Fuligni & Hardway,
2006) and adults (Mezick et al., 2009). Those with short or fragmented sleep also score lower on
measures of psychological well-being, including purpose in life, self-acceptance, and positive
affect, independent of negative attributes (Hamilton et al., 2006; Ryff, Singer, & Love, 2004;
Steptoe, O’Donnell, Marmot, & Wardle, 2008). Additionally, reports of life stressors are
associated with sleep characteristics, including changes in sleep duration and consolidation, and
increased variability across nights (Akerstedt, 2006; Dahlgren, Kecklund, Akerstedt, 2006;
Mezick et al., 2009; Sadeh, Keinan, & Daon, 2004; von Kanel et al., 2006). Many of the same
21
psychosocial factors, including trait negative affect and chronic stress, are related to
cardiovascular reactivity to and recovery from stress, although relationships may differ by task
type and the cardiovascular parameter in question (Chida & Hamer, 2008).
Short and fragmented sleep are related to concurrent obesity, and growing data support a
causal role of sleep disturbance in weight gain (Marshall, Glozier, & Grunstein, 2008; Pearson et
al., 2006). Obesity may also be associated with cardiovascular stress responses; however,
previously reported relationships are not entirely consistent. For instance, a recent study
demonstrated an inverse link between obesity and heart rate reactivity (Phillips, 2010), while
other studies have failed to find any association (Steptoe & Wardle, 2005).
A number of health behaviors, including excessive alcohol use, smoking, low physical
activity, and caffeine intake are more common among those with short and fragmented sleep,
most likely in a bi-directional manner (Boutou et al., 2008; Htoo et al., 2004; Krueger &
Friedman, 2009; Santos et al, 2007; Zhang et al, 2006). Similarly, each of these behaviors has
been linked to alterations in cardiovascular responses to psychological stress (Crews & Landers,
1987; Lane & Williams, 1985; Straneva, Hinderliter, Wells, Lenahan, & Girdler, 2000; Zeichner,
Edwards, & Cohen, 1985).
In sum, a number of factors may confound relationships between sleep and
cardiovascular responses to stress, including psychological attributes, chronic stress, obesity, and
health behaviors. It is important for cross-sectional studies to measure and adjust for potential
third factors, in order to determine whether associations between sleep and cardiovascular
reactivity and recovery are independent of, or partly due to, their influence.

22
1.6 STATEMENT OF PURPOSE
Although sleep is associated with the development of cardiovascular disease, the mechanisms
responsible for this relationship are unclear. The proposed project investigates the hypotheses
that disturbances in sleep duration and continuity (defined below) are associated with
exaggerated and prolonged cardiovascular responses to stressful stimuli. Evidence for this
hypothesis comes from previous research showing that sleep influences reports of distress in
response to daily challenges, as well as brain areas involved in the modulation of autonomic
stress responses. Moreover, sleep loss and fragmentation are related to elevations in
cardiovascular activity. If sustained over extended lengths of time, such sleep patterns could
theoretically affect peripheral tissue function and contribute to pre-clinical disease. Thus, sleep
may be associated with increased cardiovascular responses to stress through both central and
peripheral mechanisms, as outlined in Figure 1.
The proposed project has several important implications. Positive findings will be
consistent with a model in which short or fragmented sleep leads to increased cardiovascular
responses to stress, and, thus, may improve our understanding of how sleep may be related to
cardiovascular disease risk. Although this project cannot rule out reverse causation or control for
all relevant confounding variables, results may provide a foundation for future studies to
investigate causal pathways between sleep loss and cardiovascular stress responses using
experimental (sleep deprivation or extension) paradigms. Moreover, examining naturalistic sleep
patterns may offer an advantage, as there are relatively few studies devoted to studying
psychophysiological correlates of short sleepers (Grandner, et al., 2009), and it is unknown how
the effects of experimental sleep deprivation generalize to the impact of less severe but more
habitual sleep loss. Indeed, some have argued that the physiological effects of sleep disturbances

23
may only accumulate over time via gradual changes to stress response systems (Meerlo, Sgoifo,
& Suchecki, 2008). Another important aspect of the current study is the ability to study
reactivity and recovery (whether they serve as markers or mechanisms) in a relatively healthy
sample, thus reducing the number of potentially confounding variables. For instance, it is
possible that physiological changes associated with the disease process lead to disturbances in
sleep, or that both sleep and cardiovascular risk are influenced by co-morbid conditions. Finally,
identifying the specific sleep characteristics most closely related to cardiovascular responses may
inform prevention strategies in effectively targeting the most important sleep risk factors.

24
2.0 HYPOTHESES
Hypothesis One: Individuals with short sleep (as assessed by self-report and actigraphy) will
have greater and more prolonged cardiovascular responses to stress than those with longer sleep.
In many epidemiological studies, individuals reporting habitually short sleep are at
elevated risk for cardiovascular morbidity and mortality (Eguchi et al., 2008; Gangwisch et al.,
2009; Shankar et al., 2008). While such data cannot speak to causality, experimental studies in
humans and animals suggest that sleep loss may lead to overall increases in cardiovascular
activity, as well as heightened acute cardiovascular reactivity to novel stressors (Franzen et al.,
2011; Sgoifo, et al., 2006). Moreover, at least one study has demonstrated that decreases in self-
reported sleep duration over a 10-month period predict greater vagal withdrawal during
laboratory stress tasks (Uchino et al., 2005). Thus, the main hypothesis of the proposed study is
that short sleep will be related to a cardiovascular stress response characterized by greater
reactivity and more prolonged recovery.
Sleep duration will be measured in two ways. First, two groups of participants will be
recruited based on self-reports of habitual sleep duration: 1) short sleepers (defined as ≤ 6
hours/night) and 2) average sleepers (defined as 7-8 hours/night). It is hypothesized that those
reporting habitually short sleep will show greater and more prolonged cardiovascular stress
responses than those reporting average sleep.

25
Second, participants’ sleep will be measured with actigraphy for the week preceding
laboratory stress tasks. It is important to examine actigraphy estimates of sleep directly prior to
the assessment of cardiovascular stress responses for several reasons. For one, actigraphy
provides a more behavioral, objective estimate of actual sleep time than self-reports, which may
reflect time in bed rather than sleep time (Grandner et al., 2010) and vary systematically with
other cardiovascular risk factors, such as sociodemographics, negative affect, and subjective
sleep quality (Lauderdale, Knutson, Yan, Liu, & Rathouz, 2008; Owens et al., under review;
Rotenberg, Indursky, Kayumov, Sirota, Melamed, 2000). In addition, short sleep on a given
night has been shown to amplify emotional reactivity to stressful events on subsequent days,
suggesting that sleep may directly influence stress appraisals (Hamilton et al., 2007; Kumari et
al., 2009; Zohar et al., 2005), and both normative and experimental sleep loss lead to immediate,
next-day increases in overall cardiovascular activity in several studies (Barnett & Cooper, 2008;
Spiegel et al., 1999; Tochikubo et al., 1996). Thus, it is hypothesized that actigraphy-measured
sleep duration averaged across the week preceding laboratory stress tasks will be inversely
related to cardiovascular reactivity and recovery from stress tasks in a linear fashion (i.e., shorter
sleep will be related to greater reactivity and slower recovery). In theory, persons describing
themselves as short sleepers should have lower actigraphy estimates of sleep than those reporting
average sleep duration. Therefore, differences in cardiovascular responses to stress between self-
reported sleep groups (i.e., short versus average) should be at least partially attenuated in
statistical models that adjust for actigraphy-measured sleep duration across the week.

26
Hypothesis Two: Lower sleep efficiency, as assessed by actigraphy during the week
preceding laboratory tasks, will be related to greater and more prolonged cardiovascular
responses to stress.
Decreased sleep efficiency, as measured by actigraphy, has also been associated with
increased blood pressure and cardiovascular risk markers in a small number of studies (Javaheri
et al., 2008; Knutson et al., 2009; von Kanel et al., 2010). As described above, sleep duration
preceding psychological stressors may have an impact on both how stressors are appraised and
overall cardiovascular activation. This rationale may not only apply to sleep duration, but sleep
continuity, as well. Indeed, both of the two studies that have examined normative variation in
sleep directly prior to laboratory challenges report that poor sleep continuity, in particular,
predicts altered stress reactivity (Palesh et al., 2008; Wright et al., 2007). Thus, it is
hypothesized that in addition to short sleep, inefficient sleep during the period preceding a
stressor will also be related to greater and more prolonged cardiovascular stress responses. Short
sleep and low efficiency will first be tested in separate analytical models due to their potentially
high correlation. However, both predictors can then be included in the same model in order to
determine whether duration and efficiency are independently related to stress responses. For
instance, it is plausible that individuals whose sleep is short due to difficulty falling or staying
asleep (i.e., unconsolidated sleep) are at particularly high risk for cardiovascular disease
(Chandola, Ferrie, Perski, Akbaraly, & Marmot, in press). Measuring sleep efficiency and
adjusting estimates of sleep duration accordingly can help elucidate whether sleep duration
confers cardiovascular risk independent of, or partly due to, poor efficiency.

27
Hypothesis Three: Greater variability in sleep duration, as assessed by actigraphy during
the week preceding laboratory tasks, will be associated with greater and more prolonged
cardiovascular responses to stress.
Individuals’ sleep may be characterized by a high degree of variability across nights
(Buysse et al., 2010; Mezick et al., 2009; Knutson et al., 2007), and collapsing data across
multiple nights may not accurately reflect sleep patterns. As individuals appear to differ in their
biological need for sleep (Tucker et al., 2007), it is possible that a stable pattern of short sleep
(i.e., 6 hours) may be physiologically sufficient for a subset of individuals, and, thus, not
associated with physical health consequences. In contrast, a pattern of highly variable sleep
duration across nights may reflect a state of sleep debt and may be associated with a dysregulated
circadian pattern of physiological activity (Mezick et al., 2009). Therefore, it is hypothesized
that greater variability in sleep duration, as assessed by actigraphy during the week preceding
laboratory tasks, will be associated with greater and more prolonged cardiovascular responses to
stress. The relationships between variability in sleep duration and cardiovascular stress
responses are expected to be independent of mean sleep duration across the seven nights
preceding the laboratory stressors.

28
3.0 METHODS
3.1 PARTICIPANTS
Undergraduate men between the ages of 18-30 were recruited from a university to participate in
a study of “Stress and Sleep.” The study aimed to include a group of short sleepers, defined as
self-reporting a habitual nocturnal sleep duration of ≤ 6 hours, and a comparison group of
individuals self-reporting a habitual sleep duration of 7 or 8 hours. These values were based
upon epidemiological studies linking self-reports of ≤ 6 hours of habitual sleep duration to an
increased risk of cardiovascular morbidity and mortality (Amagai et al., 2010; Ayas et al., 2006;
Gottlieb et al., 2006). Reference groups in such studies are most commonly composed of those
reporting 7-8 hours of habitual sleep. Only men were included, as analyses in a previous sample
showed that sleep parameters were more closely related to perceptions of stress, negative affect,
and norepinephrine activity in men than in women (Mezick et al., 2009) and to eliminate sex-
specific effects on cardiovascular responses to stress. Participants were recruited through the
undergraduate subject pool at the University of Pittsburgh, in which students receive course
credit for participating in research studies, or through advertisements on campus. Participants
underwent telephone screening to determine eligibility and sleep duration group status (short
versus average sleep duration) before beginning the protocol. Exclusion criteria included

29
engaging in overnight or shift work, a diagnosed sleep disorder, regular medication use for sleep
(defined as typically taking sleep medication on ≥ 3 nights/week), binge drinking (≥ 5 drinks at a
time in the past month), self-reporting a body mass index (BMI) consistent with obesity (BMI >
30), anti-hypertensive or cardiac medication use, and likelihood of depression as reflected by
endorsement of one of two critical depression diagnostic criteria (“decreased interest or pleasure”
or “feeling down, depressed, or hopeless” for more than half of the time over the past two weeks;
Spitzer, Kroenke, & Williams, 1999) or antidepressant use. All participants completed informed
consent and received either $50 or four hours of research credit for study completion.
3.1.1 Power calculation
There are no previously reported effect sizes for the association between normative sleep and
cardiovascular reactivity or recovery. Therefore, two related data sets were used to generate an
anticipated effect size for the proposed study. First, the group difference in absolute heart rate
between chronically poor sleepers and good sleepers during a reaction time task was calculated
from the Stepanski et al. (1994) study. Second, the within-person difference in absolute systolic
blood pressure during a speech stressor following sleep deprivation versus a normal sleep night
was calculated from a pilot study by Franzen and colleagues (2011). The two resulting effect
sizes were averaged and reduced by 30% in order to provide a more conservative sample size
estimate, based on the rationale that both of the previous studies examined more severe sleep
disturbance conditions (i.e., total sleep deprivation and chronic insomnia) than those proposed in
the current study. Based on this adjusted effect size, α = .05, and power = .80, a power analysis
generated a recommended sample size of 80 participants to detect an effect.

30
3.2 PROCEDURE
3.2.1 Laboratory testing session
The start of the laboratory testing session ranged from 8:30 am – 3:00 pm, dependent upon
participant availability. Eighty percent of participants started the session before 1:30 pm.
Participants were asked to abstain from caffeinated beverages, tobacco products, and exercise for
three hours before testing and to avoid alcohol for 12 hours (night before) before testing. After
arriving at the laboratory, participants confirmed that they had followed these instructions. They
were then seated in a comfortable chair and instrumented for physiological recording. This
included electrocardiogram (EKG) recordings using a modified lead II configuration to measure
heart rate and HF-HRV, a standard blood pressure cuff with an automated monitor, and a
respiratory belt. The blood pressure cuff was placed over the brachial artery on the nondominant
arm, and the automated monitor was placed in the control room so that readings could not be
observed by the participant. As described by Egizio, Eddy, Robinson, and Jennings (2012), a
respiratory belt measuring pressure changes corresponding to thoracic expansion and contraction
was placed on the chest between the fifth and eighth ribs. The band was wrapped tightly enough
to allow only the experimenter's index and middle fingers to fit underneath, and the pressure of
the belt was adjusted to approximately 100 kPa using an air bladder.
Participants sat quietly and watched a nature video for a 10-minute rest period. Baseline
blood pressure readings were taken at Minutes 4, 6, and 8 of the baseline period, while heart rate
and respiration were monitored continuously. After the baseline period, participants completed
the Positive and Negative Affect Schedule (PANAS; Watson, Clark, Tellegen, 1988) to assess
mood states. Participants then completed two blocks of tasks. The first block included two

31
computer tasks: the Stroop color-word interference task (4 minutes) and the multisource
interference task (4 minutes), both of which were performance-titrated at a 60% accuracy level in
order to minimize individual differences in task performance, which may be related to sleep
(Durmer & Dinges, 2005). The second block included a speech task in which participants
wereinstructed to defend themselves from a traffic violation in front of a video camera (4
minutes of speech preparation + 4 minutes of speech delivery). Participants were told that the
speech would be recorded and later evaluated for clarity, persuasiveness, and style, and they
were instructed to continue talking for the entire 4-minute period. The two computer tasks
always occurred first, in a counter-balanced order, followed by the speech task. Each of the
computer tasks was followed by a 5-minute recovery period, and the speech task was followed
by a 15-minute recovery period in order to allow extended time for heart rate and blood pressure
to return to baseline. During each of the three recovery periods, participants appraised the
previous task on three dimensions (valence, arousal, and control). Blood pressure readings were
taken at 2-minute intervals during both task and recovery periods. The final 15-minute recovery
period included an additional three readings at Minutes 9, 12, and 15, which were taken only if
blood pressure and heart rate had not yet returned to baseline levels. After the final recovery
period, participants completed the PANAS once more to assess changes in mood.
TASK: _ _ Baseline___ _ Stroop _ __Recovery 1_ ___MSIT___
TIME: -----10 mins----- ---4 mins--- ----5 mins---- ---4 mins---
BP: 4 6 8 1 3 1 3 5 1 3
TASK: __Recovery 2__ __Speech__ __ Recovery 3____
TIME: ----5 mins---- ----8 mins--- --------15 mins------
BP: 1 3 5 1 3 5 7 1 3 5 7…{9, 12,15}
Figure 2. Laboratory testing protocol

32
3.3 MEASURES
3.3.1 Physiological data processing
The ECG signal was digitized (12 bit), sampled (with Vernier software at 500 Hz), and stored for
off-line processing. QRS waves were identified using PhysioScripts, a collection of publically
available scripts used for processing physiological data (Christie & Gianaros, under review),
implemented in the R computer environment (Ihaka & Gentleman, 1996; R Development Core
Team, 2010). The QRS detection algorithm in PhysioScripts uses the amplitude of the digitally
filtered ECG waveform as well as its first derivative. Estimates of HF-HRV were derived using
the band-limited variance method, with HF band cut-offs of 0.15 to 0.40 Hz (Allen, Chambers, &
Towers, 2007). The ECG signal was assessed for artifacts by visual inspection and an artifact
detection algorithm. Epochs with greater than or equal to 20% artifact were excluded (1% of all
1-minute epochs). HF-HRV values were natural log transformed before use in analysis.
Respiration was processed using a custom algorithm. Briefly, the respiratory waveform was
bandpass filtered (.05 - .5 Hz, 10 sec Hamming window) and local maxima (inspirations) and
minima (expirations) were identified within a specified time window based on the shortest
expected respiratory period (2 sec or .5 Hz). Unbalanced inspirations and expirations (e.g., two
inspirations with no intervening expiration) were then corrected by removing the member of the
paired values with the lesser absolute magnitude (i.e., the smaller inspiration or the larger
expiration). The respiratory variable used as a covariate in analyses of HF-HRV was mean
respiratory rate, defined as the inverse of the mean of all periods between inspiratory peaks
(analyses run with peak respiratory frequency as an alternative covariate produced identical
results). Mean respiratory rate was averaged across reactivity periods and across recovery

33
periods separately; analyses examining HF-HRV reactivity were adjusted for the former, and
analyses examining HF-HRV recovery were adjusted for the latter.
3.3.2 Actigraphy
An Actiwatch-16 (Philips Respironics, Inc.) was worn on the non-dominant wrist continuously
for 7 days and nights to measure sleep parameters as inferred from movement and acceleration
patterns. A period of seven nights was chosen based on reliability analyses in a previous sample
showing that a minimum of six nights of actigraphy measurement was necessary to obtain
adequately reliable estimates of duration. Data were stored in 1-minute epochs. Major rest
intervals were determined by the “tried to go to sleep” and “finally woke” times recorded in
participant diaries. Validated software algorithms were then used to estimate sleep parameters
within the designated rest intervals. The medium threshold was used to detect sleep. The main
sleep parameters hypothesized to be related to cardiovascular responses to stress were total sleep
time and sleep efficiency, averaged across the 7 nights preceding laboratory testing. Total sleep
time is the actual time scored as sleep within the rest interval, excluding periods of wakefulness
after sleep onset. Sleep efficiency, or the percentage of time in bed that is spent sleeping, was
calculated as: (time spent asleep/time in bed × 100). Exploratory analyses examining the
association between variability in sleep and cardiovascular responses to stress were based upon
the within-person standard deviation (SD) in total sleep time across 7 nights. Actigraphy-
assessed daytime naps were detected using a software algorithm that ‘automatically’ creates
minor rest intervals based on when the participant appears to be napping (i.e., participants’
reports were not used to set rest interval parameters). A rest interval duration minimum of 15

34
minutes was used to auto-detect naps (i.e., the scoring program searched for sleep only within
minor rest intervals greater than or equal to 15 minutes).
3.3.3 Sleep diary
In evening sleep diaries, participants reported daily levels of exercise (length and intensity), daily
nap minutes, alcohol use, nicotine use, medication use, mood, and perceptions of daytime and
pre-bedtime stress. Morning sleep diaries inquired about sleep parameters from the prior night
(time participant tried to fall asleep, latency, wake after sleep onset, time of final morning wake-
up), and subjective sleep quality upon waking. Morning diaries also inquired about reasons for
sleep amount and subjective sleep sufficiency in order to learn more about the potential factors
that may differentiate short and average sleepers. See Appendix for a sample sleep diary.
Participants chose between completing paper diaries versus completing the diary on a secure
internet website. Seventy-six participants chose to complete the web-based diaries. The web-
based diary provided time-stamped entries; entries were “flagged” if they were completed more
than 3 hours before or after the reported bed or wake time, in order to assess participant
compliance. Less than 6% of all entries were flagged.
3.3.4 Sleep questionnaires
Global sleep quality was measured with the Pittsburgh Sleep Quality Index (PSQI; Buysse,
Reynolds, Monk, Berman, & Kupfer, 1989). Eighteen individual items on the PSQI are grouped

35
to create seven component scores (e.g., subjective sleep quality, sleep latency, sleep duration,
etc.). These component scores are summed to generate a global score between 0 and 21, with
higher scores indicating worse sleep quality over the past month. The Epworth Sleepiness Scale
(ESS; Johns, 1991) is an 8-item questionnaire designed to assess daytime sleepiness by
determining the propensity of dozing or falling asleep during daytime activities, with responses
ranging from “never” to “highly likely.” Items were summed to compute a final score ranging
between 0 and 24, with scores above 10 indicative of significant daytime sleepiness. The
Fatigue Severity Scale (FSS; Krupp, LaRocca, Muir-Nash, & Steinberg, 1989) is a 9-item
questionnaire measuring the behavioral consequences of fatigue. Participants are asked to
consider the extent to which fatigue has had an impact on several areas of functioning over the
past week, with responses indicated on a 1-7 Likert type scale. The FSS has been shown to
distinguish individuals with disorders characterized by fatigue (i.e., chronic fatigue syndrome)
from those with primary depression. The multivariable apnea index (MAP; Maislin et al., 1995)
was used to screen for sleep apnea. The MAP inquires about various symptoms of sleep apnea,
including snoring, difficulty sleeping, and daytime sleepiness, as well as age, body mass index,
and gender in order to generate the probability of having an apnea-hypopnea index >= 10
episode per hour.
3.3.5 Psychological attributes
The Center for Epidemiological Studies Depression Scale (CES-D; Radloff, 1977), the
Spielberger Trait Anxiety Inventory (STAI; Spielberger, Gorsuch, & Lushene, 1970), and the
Cook-Medley Hostility Scale (Ho; Cook & Medley, 1954) were used to measure depressive

36
symptoms, anxiety, and hostility, respectively. Life stress over the previous six months was
measured using an original questionnaire created for this study. The questionnaire was based on
previous life events and stress questionnaires created for use in university populations (Crandall,
Preisler, & Aussprung, 1992; Kohn, Lafreniere, Gurevich, 1990). The questionnaire contained
29 items, each of which identified a potentially distressing life event (e.g., death of a friend,
conflict with a roommate, financial difficulty). Participants were asked to mark a) if they
experienced the event within the past 6 months, b) how upsetting or stressful the event was from
0 (not at all stressful or upsetting) to 3 (extremely stressful or upsetting) and c) whether or not
the event was currently still upsetting. Participants could also enter up to three additional,
personal life stressors that had not been listed on the questionnaire. This measure was used to
calculate two life stress scores: the first was a sum of distressing events over the past 6 months
(points on each item were summed for a grand total), and the second was a count of events that
were endorsed as “still upsetting.” Sense of life purpose was assessed with the Life Engagement
Test (Scheier et al., 2006), a scale measuring the extent to which one engages in activities that
are personally valued. Optimism was assessed using the Revised Life Orientation Test (Scheier,
Carver, & Bridges, 1994).

37
3.4 ANALYTIC PLAN
Hypothesis One: Individuals with short sleep (as assessed by self-report and actigraphy) will
have greater and more prolonged cardiovascular responses to stress than those with longer sleep.
Reactivity scores were calculated for heart rate, HF-HRV, and blood pressure by
averaging values within each task and within each baseline period. Mean task values for heart
rate, HF-HRV, systolic, and diastolic blood pressure were regressed on the corresponding mean
baseline value and then standardized. Standardized residuals were aggregated across the three
tasks to produce four composite indices of reactivity (one each for heart rate, HF-HRV, systolic,
and diastolic blood pressure). Similarly, a mean recovery score was calculated for each of the
three tasks by averaging the three recovery values following each task. This average value was
regressed on the mean baseline level and the mean task level in order to create a residualized
recovery score. This score was standardized and aggregated across the three tasks to produce
four indices of recovery (one each for heart rate, HF-HRV, systolic, and diastolic blood
pressure).
Short (≤ 6 hours) versus average (7 – 8 hours) sleep groups were based on self-reports of
habitual duration as reported on the PSQI. Analysis of covariance was used to examine
differences in each index of reactivity between self-reported sleep groups. Covariates included
age, race, and body mass index. Analyses of HF-HRV included mean respiration rate as an
additional covariate, as interbeat interval waveforms that aggregate within the high frequency
band are linked to respiration. There were four participants with a measured BMI above 30
(BMI = 31 for all four). Analyses were repeated after excluding these participants to examine if
obesity was responsible for any significant relationships observed.

38
Secondary analyses adjusted for factors within the following three clusters to determine
whether group differences were independent of these variables: diary characteristics,
psychosocial attributes, and laboratory variables. A variable was considered as a potential
mediator if 1) it was associated with the sleep parameter under study and 2) inclusion of the
variable led to a reduction in the association between the independent and dependent variables.
Once a potential mediator was identified, nonparametric bootstrapping analyses were used to test
a mediation pathway (i.e., the pathway linking the sleep characteristic to the cardiovascular stress
response via the potential mediator), as is recommended for small samples (Preacher & Hayes,
2004; Preacher, Rucker, & Hayes, 2007). In these analyses, mediation is significant if the 95%
Bias Corrected and accelerated confidence intervals for the indirect effect do not include 0
(Preacher & Hayes, 2004; Preacher et al., 2007). Finally, analyses examining whether or not
associations between sleep parameters and cardiovascular stress responses were independent of
daytime sleep were conducted. Both actigraphy-assessed and self-reported naps were considered
as covariates, calculated in average daily nap minutes (i.e., nap minutes per day/study days).
In order to examine differences in recovery between self-reported sleep groups, a process
identical to the one described above was used, with recovery indices replacing reactivity indices
as the outcome variable. Potential mediating variables were analyzed as described above.
The second part of this hypothesis examined actigraphy-measured total sleep time
(measured continuously) during the week preceding laboratory tasks as a predictor of
cardiovascular stress reactivity and recovery. This association was examined in linear regression
models adjusted for age, race, and body mass index, with additional models adjusting for
potential mediators as described above.
39
Hypothesis Two: Lower sleep efficiency, as assessed by actigraphy during the week
preceding laboratory tasks, will be related to greater and more prolonged cardiovascular
responses to stress.
Associations between actigraphy-measured sleep efficiency and cardiovascular
responses to stress were examined in an identical process to the one described above for
actigraphy-assessed total sleep time, using efficiency as the independent variable.
Hypothesis Three: Greater variability in sleep duration, as assessed by actigraphy during
the week preceding laboratory tasks, will be associated with greater and more prolonged
cardiovascular responses to stress. This association will be independent of average actigraphy-
measured sleep duration.
Linear regression models were used to examine the association between within-
person variability in actigraphy-measured total sleep time and cardiovascular responses to stress.
Variability was calculated as an individual’s standard deviation in total sleep time across the
seven nights of the study. Models were adjusted for covariates (age, race, BMI) and mean total
sleep time before entering within-person standard deviations in total sleep time as a predictor
variable. Thus, these analyses examined the association between variable sleep duration and
cardiovascular responses to stress, independent of mean levels of actual sleep.

40
4.0 RESULTS
4.1 SAMPLE CHARACTERISTICS
Eighty male undergraduates completed the protocol. Demographic, physical, and sleep
characteristics are displayed in Table 1.

41
Table 1. Sample characteristics
Variable Mean Range N %
Age 19.4 18 - 29
Body Mass Index 24.0 18.2 – 31.9
Resting Systolic Blood Pressure (Visit 1) 120.4 104.3 – 141.3
Resting Diastolic Blood Pressure (Visit 1) 67.2 55.3 – 84.7
Race
White/Caucasian 63 (81.0)
Asian/Pacific Islander 9 (11.4)
Black/African American 7 (8.9)
Ethnicity
Non-Hispanic / non-Latino 77 (97.5)
Hispanic / Latino (White) 2 (2.5)
Self-Reported Habitual Sleep Duration^
≤ 6 hours/night 37 (46.8)
4 hours/night 2 (2.5)
5 hours/night 10 (12.7)
6 hours/night 25 (31.6)
> 6 hours/night 42 (53.2)

42
7 hours/night 26 (32.9)
8 hours/night 16 (20.3)
^as defined by Question 4 on the PSQI
The average age of participants was 19.4 years and 80% identified their race as “White or
Caucasian.” Thirty-eight (47.5%) participants reported habitual sleep duration of 6 or fewer
hours on the PSQI at Visit 1 and, thus, were classified as short sleepers. Forty-two (52.5%)
participants reported habitual sleep duration of 7 – 8 hours and were classified as average length
sleepers. One participant reporting short sleep was excluded from the main analyses examining
cardiovascular responses and related laboratory data due to a reported history of heart murmur
and inability to detect R waves on his ECG. Thus, the final sample for these analyses included
79 participants (37 short sleepers and 42 average sleepers). Seventy-eight of the 79 participants
had resting blood pressure values below the cut-off for hypertension, and one participant met
hypertensive criteria (SBP = 141, DBP = 67).
Sample characteristics by sleep duration group are shown in Table 2.

43
Table 2. Sample characteristics by self-reported sleep duration group
Variable
≤ 6 hours/night
(n=37)
7-8 hours /night
(n = 42) p
Age 19.32 (1.45) 19.36 (2.41) .93
BMI 24.26 (2.75) 23.75 (3.58) .48
Resting Systolic BP (Visit 1) 122.14 (8.33) 122.43 (8.44) .88
Resting Diastolic BP (Visit 1) 67.27 (7.11) 70.00 (8.08) .12
CES-D total 13.76 (7.82) 10.52 (6.90) .05
STAI total 11.42 (5.00) 10.38 (4.61) .34
LOT total 15.18 (3.81) 15.74 (3.81) .52
LES total 34.95 (2.98) 35.51 (3.06) .41
Hostility total 13.13 (4.29) 12.64 (4.38) .62
No. of Current, Upsetting Life Events 3.87 (2.95) 3.45 (2.83) .52
PSQI total 7.16 (2.24) 5.14 (1.84) <.001
FSS total 31.74 (8.87) 26.86 (8.51) .01
LR MAP relative risk .182 (.135) .140 (.091) .11
Epworth Total 8.71 (3.62) 7.55 (3.91) .17
Participants reporting 6 or fewer hours of sleep per night did not differ from those reporting
longer sleep in age, BMI, or resting BP measured at baseline (Visit 1). Sleep groups did not
differ by race/ethnicity (2 = .05, p = .82). Generally, the two sleep duration groups did not
differ on psychosocial attributes. The one exception was depressive symptoms; short sleepers

44
had higher CES-D scores compared to average sleepers. This difference was attenuated when
Item #11 (“my sleep was restless”) was removed from the overall CES-D score (short sleepers
mean = 12.63 (SD = 7.54), average sleepers mean = 10.07 (SD = 6.78), p = .10). With regard to
subjective sleep quality and daytime energy, short sleepers had elevated PSQI and FSS scores
relative to average sleepers. Sleep groups did not differ in reports of daytime sleep propensity as
measured by the ESS or in likelihood of sleep apnea as calculated by the MAP.
Daily diary variables, including reports of mood and health behaviors, are shown in Table
3.

45
Table 3. Means (SDs) of diary characteristics by self-reported sleep duration group
Variable
≤ 6 hours/night
(n=37)
7-8 hours /night
(n = 42)
p
% Smokers 21.1 14.3 .43
Avg Daily Caffeinated Beverages 1.00 (.93) 1.46 (1.40) .09
Avg Daily Alcohol .54 (.88) .32 (.60) .20
Avg Daily Exercise Minutes 51.00 (27.34) 56.44 (28.74) .39
Avg Daily Stress Ratings (1-4) 1.90 (.47) 1.71 (.48) .08
Avg Pre-Bedtime Stress Ratings (1-4) 1.58 (.47) 1.47 (.47) .31
Avg Daily Positive Mood (1-5) 3.23 (.51) 3.31 (.49) .47
Avg Daily Negative Mood (1-5) 1.61 (.36) 1.52 (.42) .33
Total # of Naps Reported During Study 1.84 (1.82) 1.57 (1.77) .50
Avg Daily Self-Reported Nap Minutes 28.77 (41.86) 14.07 (19.81) .06
Avg Daily Response to “How much
longer would you have liked to sleep?”
(Minutes)
91.36 (39.70) 56.73 (45.70) .001
Although both sleep duration groups reported napping just under two times throughout the 7-day
study, short sleepers reported nearly twice as many average daily minutes of napping than 7-8
hour sleepers. Short sleepers reported that they wanted to sleep for an additional 90 minutes upon

46
waking in the morning, whereas average sleepers desired an additional 56 minutes of sleep.
Short sleepers also tended to report less caffeine use and more daily stress than average sleepers,
although these differences were not statistically significant. The two groups did not differ in
alcohol use, exercise amount or intensity, daily mood ratings, or pre-bedtime stress ratings.
Seventeen percent of the sample reported smoking at least one cigarette over the course of the
study period; however, average number of daily cigarettes smoked was low, at 2.85 per day (SD
= 4.11, range = .14 – 11.6). Sleep duration groups did not differ in percentage of smokers or
number of cigarettes smoked (p = .97).
4.1.1 Actigraphy
Mean actigraphy-assessed sleep duration was 7.05 hours (SD = .84) across the entire sample, and
mean total sleep time was 6.08 hours (SD = .80). Mean within-person variability in total sleep
time across the study was about 1.3 hours (SD = .56). Mean sleep efficiency was 81.81% (SD =
4.68). Actigraphy sleep characteristics by self-reported sleep group are shown in Table 4.

47
Table 4. Means (SDs) of actigraphy sleep characteristics by self-reported sleep duration group
Variable ≤ 6 hours/night 7-8 hours /night t p
Mean Duration 369.17 (50.66) 428.66 (40.67) 5.82 <.001
Mean Time Spent Asleep 318.23 (46.47) 372.11 (37.30) 5.74 <.001
Mean Efficiency 76.71 (8.01) 80.22 (5.17) 2.36 .02
SD Actual Sleep 77.13 (35.57) 64.92 (29.75) -1.67 .10
Naps (>15 minutes)
Mean # of Naps Across Study 2.92 (2.78) 2.64 (2.41) -.48 .63
Mean Minutes per Nap 30.91 (33.27) 22.59 (18.69) -1.38 .18
Mean Bedtime 1:54 AM 1:49 AM -.48 .64
24-Hour Sleep
(Night Actual Sleep + Nap Minutes)
348.69 (43.00) 394.70 (38.81) 5.00 <.001
Mean Weeknight Time Spent Asleep 310.76 (53.24) 367.73 (41.91) 5.34 <.001
Mean Weekend Time Spent Asleep 358.98 (77.87) 384.29 (62.22) 1.61 .11
Actigraphy measures of duration and total sleep time were, on average, about one hour longer in
those reporting 7-8 hours of sleep compared to short sleepers. The two groups differed in
weeknight, but not weekend, mean sleep time. Using a cut-off of ≥ 2 hours discrepancy between
weekend – weeknight total sleep time, 19% of short sleepers (n = 7) were considered to be in
“sleep debt,” compared to 5% of those reporting 7-8 hours of sleep per night (n = 2). This was a
statistically significant difference (2 = 3.91, p = .05). Sleep efficiency was nearly 4% higher in
average sleepers relative to short sleepers. Average sleepers had marginally less within-person

48
nightly variability in their actual sleep time across the study. Actigraphy-assessed total sleep
time by self-reported sleep duration group is displayed in Figure 3.
Figure 3. Actigraphy total sleep time by self-reported sleep duration group
Actigraphy sleep parameters did not correlate with start time of the laboratory testing session
(total sleep time: r = .09, p = .42; sleep efficiency: r = -.14, p = .21; SD in total sleep time: r =
.002, p = .98). Correlations among self-report and actigraphy sleep parameters are displayed in
Table 5.
<4.5 <5 <5.5 <6 <6.5 <7 <7.5
#
of
Par
tici
pan
ts
Actigraphy Time Spent Asleep

49
Table 5. Correlations among self-report and actigraphy sleep parameters
Habitual
Sleep
Duration^
Actigraphy
Time Spent
Asleep
Diary Time
Spent
Asleep
Avg Diary
Nap
Minutes
Avg
Actigraphy
Nap
Minutes
Actigraphy
Sleep
Efficiency
Habitual Sleep
Duration^ -- .54** .54** -.26* -.26* .30**
Actigraphy Time
Spent Asleep
-- .73** -.54** -.39** .62**
Diary Time Spent
Asleep
-- -.32* -.17 .07
Avg Diary Nap
Minutes
-- .61** -.34*
Avg Actigraphy
Nap Minutes
-- -.25*
Actigraphy Sleep
Efficiency
--
4.1.2 Cardiovascular stress responses
Heart rate, HF-HRV, and BP values throughout the laboratory testing session and across both
sleep groups are shown in Figures 4-6.

50
Asterisks indicate significant change from baseline; *p < .05, **p < .01.
Figure 4. Mean heart rate throughout laboratory session
H
eart
Rat
e (b
pm
)

51
Asterisks indicate significant change from baseline; #p<.10; **p < .01.
Figure 5. Mean HF-HRV throughout the laboratory session
H
F-H
RV
(ln
)

52
Asterisks indicate significant change from baseline; *p < .05, **p < .01
Figure 6. Mean systolic and diastolic BP throughout the laboratory session
Mean HR across the 7-minute baseline was 69.49 (SD = 10.09) beats per minute (bpm) and mean
HF-HRV was 6.33 (SD = .91) ln units. Mean baseline SBP was 113.62 (SD = 8.07) mmHg and
mean baseline DBP was 62.72 (SD = 5.04) mmHg. Mean change from baseline to stress task was
7.48 (SD = 5.38) bpm for heart rate, -.27 (SD = .52) ln units for HF-HRV, 12.14 (SD = 6.63)
mmHg for SBP, and 9.54 (SD = 4.38) mmHg for DBP. Nearly all reactivity values for HR, HF-
HRV, and BP represented significant changes from baseline; one exception was that HF-HRV
S
BP
(mm
Hg)
D
BP
(mm
Hg)

53
did not decrease significantly during the speech preparation period relative to baseline (t (78) =
1.64, p = .10). The speech elicited the greatest changes in HR and BP, followed by speech
preparation, the Stroop task, and finally the MSIT. HF-HRV decreased more during cognitive
computer tasks (mean = .32, SD = .53 ln units) than during the speech preparation and delivery
tasks (mean = .23, SD = .54 ln units) (t (78) = 3.58, p =.001).
Regarding recovery, HR averaged across all three recovery periods was 2.81 (SD = 3.18)
bpm higher than baseline HR; HR did not return to baseline during any recovery period. HF-
HRV across all three recovery periods was reduced by .03 (SD = .41) ln units; HF-HRV returned
to baseline levels during each of the three recovery periods. SBP recovery values were higher
than baseline by 3.08 (SD = 4.14) mmHg on average; only the speech recovery SBP did not
return to baseline level. DBP recovery values were higher than baseline by 1.66 (SD = 2.87)
mmHg on average; DBP during both the MSIT and speech recovery remained elevated relative
to baseline. None of the reactivity or recovery indices correlated with laboratory session start
time (ps > .10).
4.1.3 Factor analysis of cardiovascular stress reactivity and recovery
Correlations among reactivity values are displayed in Appendix A. Because reactivity values
were correlated across tasks for each outcome parameter examined (HR, HF-HRV, and BP), the
factorability of these values was examined using exploratory factor analysis. Principle
components analysis was performed separately for HR, HF-HRV, and BP. The Kaiser-Meyer-
Olkin measure of sampling adequacy was above the recommended value of .6, and Bartlett’s test
of sphericity was significant (p < .05) in all cases. For HR, all four task reactivity values loaded
onto one factor at .78 or higher with an eigen value of 3.46; this factor explained 86% of the

54
variance. For HF-HRV, all four reactivity values loaded onto one factor at .87 or higher with an
eigen value of 3.44; this factor explained 86% of the variance. For SBP, all four reactivity
values loaded onto one factor at .75 or higher with an eigen value of 2.43, explaining 61% of the
variance. For DBP, all four reactivity values loaded onto one factor at .72 or higher with an
eigen value of 2.36, explaining 59% of the variance. Thus, reactivity values were residualized on
baseline values and then averaged across all four conditions to create a composite reactivity
variable; this process was performed separately for HR, HF-HRV, SBP, and DBP.
Correlations among recovery values are displayed in Appendix A. The factorability of
these values was examined in a similar matter to reactivity values, as described above. The
Kaiser-Meyer-Olkin measure of sampling adequacy was above the recommended value of .6,
and Bartlett’s test of sphericity was significant (p < .05) in all cases. For HR, all four task
recovery values loaded onto one factor at .98 or higher with an eigen value of 2.91; this factor
explained 97% of the variance. For HF-HRV, all four recovery values loaded onto one factor at
.97 or higher with an eigen value of 2.83; this factor explained 94% of the variance. For SBP, all
four recovery values loaded onto one factor at .79 or higher with an eigen value of 2.01,
explaining 67% of the variance. For DBP, all four recovery values loaded onto one factor at .73
or higher with an eigen value of 1.85, explaining 59% of the variance. Thus, recovery values
were residualized on baseline and task reactivity values, and then averaged across all four
conditions to create a composite recovery variable; this process was performed separately for
HR, HF-HRV, SBP, and DBP.

55
4.1.4 Subjective laboratory ratings
Paired t-tests showed that participants rated all three tasks similar on valence (ps > .2). Both
cognitive tasks were rated as less arousing than the speech (MSIT vs speech: t = -4.94, p < .001;
Stroop vs. speech: t = -3.04, p =.003), but also less controllable than the speech (MSIT vs.
speech: t = -3.35, p = .001; Stroop vs. speech: t = -4.94, p < .001). With regard to differences in
self-reported sleep duration groups, short sleepers reported more arousal following stress tasks
than average sleepers; this difference was due to short sleepers reporting increased arousal
following cognitive computer tasks (t (78) = 2.37, p = .02) rather than the speech task (t (78) =
.75, p = .45) relative to average sleepers (see Table 6). There were no group differences in
ratings of task valence or task control.
Table 6. Means (SDs) of subjective reports throughout laboratory session
Variable ≤ 6 hours/night 7-8 hours /night t p
Task Valence 5.05 (1.46) 5.07 (1.19) .08 .94
Task Arousal 5.66 (1.37) 4.96 (1.53) 2.16 .03
Task Control 4.52 (1.28) 4.56 (1.52) .11 .92
PANAS
Change in Negative Affect .22 (.31) .08 (.21) 2.24 .03
Change in Positive Affect .10 (.52) -.11 (.50) 1.82 .07
Short sleepers reported greater increases in negative affect as measured by the PANAS
across the laboratory testing session. Short sleepers also reported marginally greater increases in

56
positive affect, whereas average sleepers reported a slight decrease in positive affect across the
laboratory session. Follow-up analyses revealed that the difference between groups in change in
positive affect was due to greater increases in alertness (t (78) = 1.92, p = .06) and excitement (t
(78) = 2.12, p = .04) among short sleepers relative to average sleepers. Correlations among task
ratings, changes in mood, and cardiovascular responses to stress are shown in Table 25A.
4.2 HYPOTHESIS ONE
4.2.1 Cardiovascular stress responses by self-reported sleep duration group
Heart rate reactivity and recovery values by sleep duration group are displayed in Table 7.
Table 7. HR during baseline, reactivity, and recovery by self-reported sleep duration group
Variable ≤ 6 hours/night 7-8 hours /night F* p
Baseline HR 70.74 (11.08) 68.39 (9.13) 1.42 .23
Task HR Reactivity +7.08 (5.52) +7.95 (5.26) .75 .39
Task HR Recovery +3.58 (2.81) +2.14 (3.36) 7.44 .008
* Outcomes are residualized change scores, adjusted for age, race, and BMI
After adjusting for age, race, and BMI, the two sleep duration groups did not differ in HR
reactivity to laboratory stress tasks. There was a difference in HR recovery between groups, with
short sleepers showing elevated HR following stress tasks. Short sleepers had higher HR during

57
both cognitive (F (78) = 5.39, p = .02) and speech recovery periods (F (77) = 7.09, p = .01)
compared to average length sleepers. HR is plotted for each sleep duration group in Figure 7.
Figure 7. HR across laboratory session in sleep duration groups
Follow-up analyses showed that the difference between sleep groups in HR recovery was
stronger during the first two minutes of the recovery period (F (78) = 7.67, p = .007) than the
final two minutes of the recovery period (F (78) = 3.39, p = .07), suggesting delayed HR
recovery rather than anticipatory arousal. The difference in HR recovery between sleep duration
groups remained after removing the four participants with BMI > 30.
HF-HRV reactivity and recovery values by sleep duration group are displayed in Table 8.
Base MSIT Rec Stroop Rec Prep Speech Rec
c
H
eart
Rat
e (b
pm
)

58
Table 8. HF-HRV during baseline, reactivity, and recovery by self-reported sleep duration group
Variable ≤ 6 hours/night 7-8 hours /night F* p
Baseline HF-HRV 6.33 (.90) 6.34 (.92) .001 .98
HF-HRV Reactivity - .377 (.540) - .211 (.478) 2.78 .10
HF-HRV Recovery - .106 (.343) + .005 (.396) .54 .47
* adjusted for age, BMI, race, and respiration rate
After adjusting for age, race, BMI, and respiration rate, there were no differences between sleep
groups in HF-HRV reactivity during stress tasks or HF-HRV recovery following stress tasks.
Follow-up analyses examining tasks separately showed that short sleepers had marginally lower
HF-HRV during the speech preparation and delivery periods compared to average sleepers (F
(77) = 3.12, p = .08). There was no difference between groups in HF-HRV during cognitive
tasks (F (78) = 1.55, p = .22).

59
Figure 8. HF-HRV across laboratory session in sleep duration groups
H
F-H
RV
(ln
)
Base MSIT Rec Stroop Rec Prep Speech Rec

60
BP reactivity and recovery values by sleep duration group are displayed in Table 9.
Table 9. BP during baseline, reactivity, and recovery by self-reported sleep duration group
Variable Systolic Blood Pressure Diastolic Blood Pressure
≤ 6
hours/night
7-8 hours
/night
F* p ≤ 6
hours/night
7-8 hours
/night
F* p
Baseline 113.93 (8.25) 113.33 (8.01) .10 .75 61.81 (5.01) 63.54 (5.00) 2.38 .13
Task
Reactivity
10.98 (5.98) 13.22 (7.09) 2.34 .13 9.50 (4.65) 9.58 (4.16) .09 .76
Task
Recovery
2.44 (3.17) 3.67 (4.85) .76 .39 1.38 (2.90) 1.96 (2.84) .18 .67
*analyses use residualized change scores as outcomes; adjusted for age, race, and BMI.
After adjusting for age, race, and BMI, there were no differences between sleep groups in
SBP or DBP reactivity during stress tasks. Sleep duration groups were also similar in their SBP
and DBP recovery following stress tasks.

61
Figure 9. SBP throughout laboratory session in sleep duration groups
Figure 10. DBP throughout laboratory session in sleep duration groups
Syst
oli
c B
lood P
ress
ure
(m
mH
g)
Base MSIT Rec Stroop Rec Prep Speech Rec
Dia
stoli
c B
lood P
ress
ure
(m
mH
g)
Base MSIT Rec Stroop Rec Prep Speech Rec

62
4.2.2 Potential mediators of group differences in cardiovascular stress responses
Short sleepers continued to show higher HR recovery after adjusting for daily stress ratings (F
(78) = 7.46, p = .008) or caffeine use (F (78) = 8.35, p = .005). Short sleepers continued to show
higher HR during recovery periods after adjusting for depression (F (78) = 6.08, p =.02) or
stressful life events (F (78) = 6.08, p =.02). Adjustment for task arousal ratings or change in
affect on the PANAS did not alter the difference in HR recovery between sleep groups (ps =
.01).
4.2.3 Naps
Adjustment for actigraphy-detected daytime naps did not alter the difference in HR recovery
between self-reported sleep groups (F (78) = 6.73, p = .01), nor did adjustment for self-reported
naps (F (78) = 6.74, p = .01).
4.2.4 Continuous measure of self-reported sleep duration
Self-reported habitual sleep duration was examined as a continuous predictor of cardiovascular
stress responses. Shorter self-reported sleep duration was associated with higher HR recovery (
= -.28, p = .02) after adjusting for age, race, and BMI, and with lower HF-HRV during stress
tasks after adjusting for age, race, BMI, and respiration rate ( = .23, p = .05). Self-reported
sleep duration was not associated with HR reactivity ( = -.13, p = .28), SBP reactivity ( = .04,
p = .74) or recovery ( = .04, p = .75), or DBP reactivity ( = -.03, p = .84) or recovery ( = .02,
p = .86).

63
4.2.5 Continuous measure of self-reported sleep duration and cardiovascular stress
responses after adjustment for mediators and naps
Self-reported sleep duration was no longer associated with HR recovery after adjusting for
actigraphy-detected nap minutes ( = -.15, p = .22). The association between shorter self-
reported sleep duration and lower HF-HRV during stress tasks remained after adjusting for all
candidate mediators. The self-reported sleep duration and HF-HRV link was also independent of
actigraphy-detected or self-reported nap minutes.
4.2.6 Cardiovascular stress responses and actigraphy-measured sleep duration
Results from linear regression models examining the association between actigraphy-assessed
time spent asleep and cardiovascular reactivity and recovery are displayed in Tables 10 and 11.
Table 10. Results from linear regression models examining actigraphy total sleep time and CV stress reactivity
HR Reactivity HF-HRV
Reactivity
Systolic BP
Reactivity
Diastolic BP
Reactivity
B p B p B p B p
Average Time Spent
Asleep -.09 .49 .29 .02 .10 .42 -.01 .99
*adjusted for age, race (Asian/Pacific Islander, Black, White), BMI; HF-HRV analyses are also adjusted
for respiration rate.
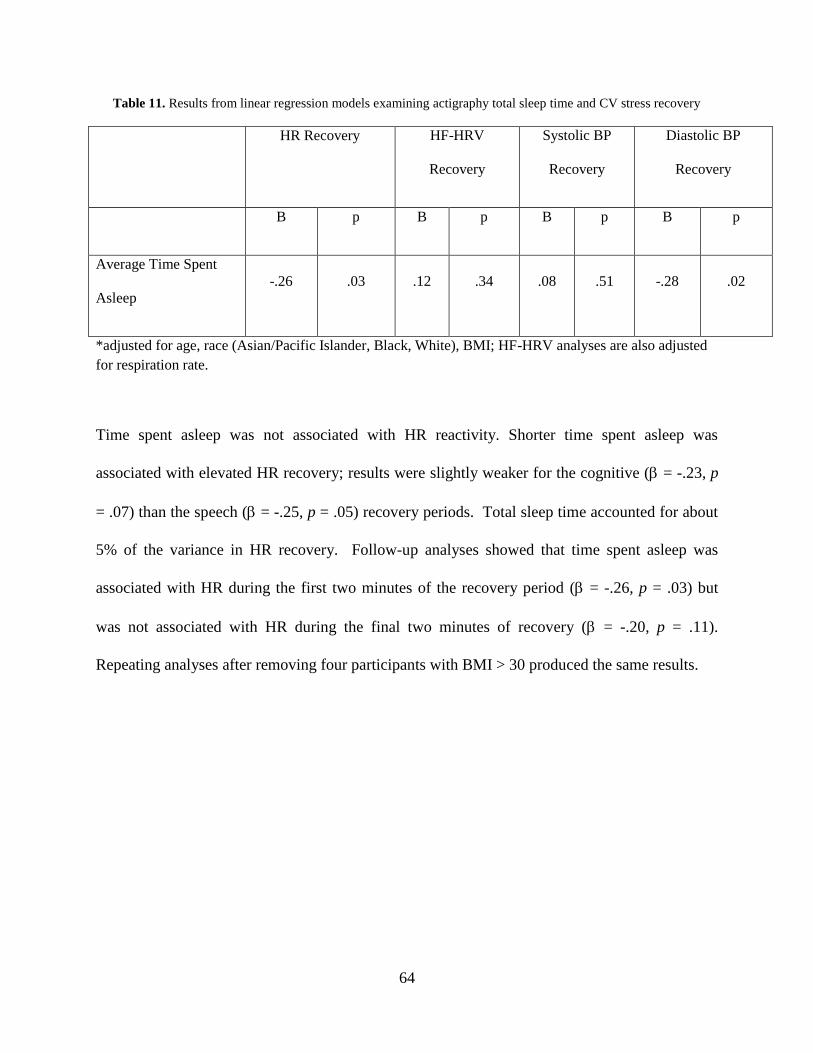
64
Table 11. Results from linear regression models examining actigraphy total sleep time and CV stress recovery
HR Recovery HF-HRV
Recovery
Systolic BP
Recovery
Diastolic BP
Recovery
B p B p B p B p
Average Time Spent
Asleep
-.26 .03 .12 .34 .08 .51 -.28 .02
*adjusted for age, race (Asian/Pacific Islander, Black, White), BMI; HF-HRV analyses are also adjusted
for respiration rate.
Time spent asleep was not associated with HR reactivity. Shorter time spent asleep was
associated with elevated HR recovery; results were slightly weaker for the cognitive ( = -.23, p
= .07) than the speech ( = -.25, p = .05) recovery periods. Total sleep time accounted for about
5% of the variance in HR recovery. Follow-up analyses showed that time spent asleep was
associated with HR during the first two minutes of the recovery period ( = -.26, p = .03) but
was not associated with HR during the final two minutes of recovery ( = -.20, p = .11).
Repeating analyses after removing four participants with BMI > 30 produced the same results.

65
Figure 11. HR recovery averaged across task by tertile of time spent asleep
Figure 12. Baseline to task HF-HRV reactivity averaged across task by tertile of time spent asleep
HR
Chan
ge
from
Bas
elin
e (b
pm
)
Actigraphy-Assessed Time Spent Asleep
Actigraphy-Assessed Time Spent Asleep
HF
-HR
V C
han
ge
from
Bas
elin
e (l
n)

66
Shorter actigraphy time spent asleep was related to a greater decline in HF-HRV during stress
tasks; total sleep time accounted for approximately 7% of the variance in HF-HRV. Follow-up
analyses showed that shorter time asleep was associated with a greater reduction in HF-HRV
during cognitive tasks ( = .33, p = .005) but was not related to change in HF-HRV during the
speech preparation and delivery tasks ( = .18, p = .15). Repeating analyses after removing four
participants with BMI > 30 produced the same results. Time spent asleep was not related to HF-
HRV during recovery periods.
Actigraphy time spent asleep was not associated with systolic or diastolic BP reactivity,
nor was it associated with SBP recovery. Shorter time spent asleep was associated with elevated
DBP recovery, accounting for approximately 6% of the variance. The association remained after
removing four participants with BMI > 30. Shorter time spent asleep was associated with higher
DBP after cognitive tasks ( = -.29, p = .01) but not after the speech task ( = -.16, p = .20).
Figure 13. DBP recovery averaged across task by tertile of time spent asleep
DB
P C
han
ge
from
Bas
elin
e (m
mH
g)
Actigraphy-Assessed Time Spent Asleep

67
4.2.7 Potential mediators of relationships between actigraphy-measured total sleep time
and cardiovascular stress responses
The associations between shorter actigraphy-measured sleep and greater HF-HRV withdrawal
during stress tasks, higher HR recovery, and higher diastolic BP recovery remained after
adjusting for daily stress ratings (HF-HRV: = .25, p = .05; HR: = -.26 p = .03; diastolic BP:
= -.28, p = .02). Shorter actigraphy time spent asleep was marginally associated with higher daily
diary ratings of negative mood (see table 23A in Appendix 1), and adjusting for diary negative
mood reduced the association between time spent asleep and stressor-evoked HF-HRV by 18%
and to marginal significance ( = .22, p = .07); thus, diary negative mood was tested as a
mediator in bootstrapping analyses. There was a marginally significant direct path from time
spent asleep to diary negative mood (B = -.002, SE = .0009, p = .08) and a significant direct path
from diary negative mood to HF-HRV during stress tasks (B = -.45, SE = .22, p = .04). However,
the bootstrapped confidence interval for the estimate of the indirect effect from time spent asleep
to HF-HRV through diary reports of negative mood contained 0, indicating that mediation was
nonsignificant (95% CI = .00 - .03). Adjusting for diary reports of negative mood did not alter
any of the other relationships reported above.
Those with shorter total sleep time continued to show lower HF-HRV during stress tasks,
and elevated HR and diastolic BP recovery following stress tasks, after adjustment for depression
(HF-HRV: = .25, p = .05; HR: = -.25 p = .05; diastolic BP: = -.27, p = .03) or ongoing,
stressful life events (HF-HRV: = .24, p = .05; HR: = -.28 p = .03; diastolic BP: = -.25, p =
.04).

68
Adjustment for task arousal ratings or change in negative affect as reported on the
PANAS did not alter links between total sleep time and HF-HRV reactivity, HR recovery, or
diastolic BP recovery (ps < .05). Adjustment for change in positive affect resulted in a slight
decrease in the strength of the association between total sleep time and HR recovery (12%
reduction; = -.23 p = .07). Change in positive affect was tested as a mediator in bootstrapping
analyses. The direct path from total sleep time to change in positive affect was not significant (B
= -13.1, SE = 10.5, p = .22), nor was the direct path from positive affect to HR recovery
significant (B = -.003, SE = .002, p = .09) ; therefore, a mediating pathway through positive
affect was not supported.
4.2.8 Naps
Adjustment for actigraphy-detected daily nap minutes reduced the association between
actigraphy-assessed total sleep time and HR recovery to non-significance ( = -.22, p = .10).
This could either suggest that naps acted as a “buffer,” negating the effects of shorter nocturnal
sleep, or that naps and nocturnal sleep account for common variance in HR recovery (actigraphy
total sleep time and actigraphy-detected naps were correlated at r = -.4, p < .001). Thus, the
relationship between actigraphy-detected naps and HR recovery was examined in linear
regression models. Longer daily actigraphy-detected naps were associated with higher HR
recovery before adjusting for actigraphy nocturnal total sleep time ( = .23, p = .05). In the
model that included both daytime naps and nocturnal sleep, naps were no longer associated with
HR recovery ( = .16, p = .20). Adjusting for self-reported nap minutes did not change the
association between actigraphy total sleep time and HR recovery ( = -.36, p = .01).

69
The associations of actigraphy-assessed total sleep time with HF-HRV reactivity and
DBP recovery remained after adjusting for actigraphy-detected nap minutes (HF-HRV: = .29,
p = .03; DBP: = -.26, p = .05) or self-reported nap minutes (HF-HRV: = .28, p = .05; HR:
= -.32 p = .02; diastolic BP: = -.27, p = .05).
4.3 HYPOTHESIS TWO
Results from linear regression models examining the links between sleep efficiency and
cardiovascular reactivity and recovery are displayed in tables 12 and 13.

70
Table 12. Results from linear regression models examining actigraphy sleep efficiency and CV stress recovery
HR Reactivity HF-HRV
Reactivity
Systolic BP
Reactivity
Diastolic BP
Reactivity
B p B p B p B p
Sleep Efficiency -.15 .22 .27 .03 -.11 .37 -.10 .44
*adjusted for age, race (Asian/Pacific Islander, Black, White), BMI; HF-HRV analyses are also adjusted
for respiration rate.
Table 13. Results from linear regression models examining actigraphy sleep efficiency and CV stress recovery
HR Recovery HF-HRV
Recovery
Systolic BP
Recovery
Diastolic BP
Recovery
B p B p B p B p
Sleep Efficiency -.30 .01 .29 .13 -.13 .28 -.17 .16
*adjusted for age, race (Asian/Pacific Islander, Black, White), BMI; HF-HRV analyses are also adjusted
for respiration rate.

71
Sleep efficiency was unrelated to HR reactivity averaged across all tasks, but examination of
separate tasks revealed an association between decreased sleep efficiency and higher HR
reactivity during cognitive stressors ( = -.26, p = .03). There was no association between sleep
efficiency and HR reactivity during speech preparation and delivery ( = -.08, p = .54). Sleep
efficiency was related inversely to HR recovery; in follow-up analyses, decreased efficiency was
related to higher HR during the speech recovery period ( = -.32, p = .01) but not during the
cognitive task recovery period ( = -.20 p = .11). When sleep efficiency and total sleep time
were included in the same model as predictors of HR recovery, both sleep parameters were
reduced to non-significance (sleep efficiency: = -.22, p = .15; total sleep time: = -.15, p =
.30).
Decreased sleep efficiency was associated with greater withdrawal in cardiac
parasympathetic activity as characterized by a greater decrease in HF-HRV during stress tasks.
Sleep efficiency accounted for approximately 7% of the variance in HF-HRV during stress tasks.
Follow-up analyses showed that the link between sleep efficiency and lower HF-HRV was due to
reactivity during cognitive tasks ( = .32, p = .009) rather than during speech preparation and
delivery ( = .18, p = .18). When both sleep efficiency and total sleep time were included in the
same model as predictors of cognitive task HF-HRV, both parameters were reduced to non-
significance (sleep efficiency: = .18, p = .20; total sleep time: = .22, p = .11). Sleep
efficiency was not related to HF-HRV during recovery periods.
Sleep efficiency was not associated with SBP or DBP reactivity or recovery averaged
across cognitive and speech tasks. When tasks were examined separately, one association
approached significance: decreased sleep efficiency was marginally related to higher SBP

72
reactivity to cognitive tasks ( = -.29, p = .06 after adjusting for covariates and total sleep time).
All of the above results were identical after removing four participants with BMI > 30.
4.3.1 Potential mediators of relationships between actigraphy-measured sleep efficiency
and cardiovascular stress responses
The associations between decreased actigraphy-measured sleep efficiency and greater HF-HRV
withdrawal during stress tasks and higher HR during recovery remained after adjusting for daily
stress ratings (HF-HRV: = .31, p = .01; HR: = -.26, p = .03). Decreased sleep efficiency was
related to higher daily ratings of negative mood in the diary (see Table 17A in Appendix 1), and
adjusting for negative mood reduced the association between sleep efficiency and stressor-
evoked HF-HRV by 21% and to marginal significance ( = .23, p = .06); thus, negative mood
was tested as a mediator in bootstrapping analyses. There was a marginally significant direct
path from sleep efficiency to diary negative mood (B = -.01, SE = .007, p = .07) and a significant
direct path from diary negative mood to HF-HRV during stress tasks (B = -.46, SE = .22, p =
.04). However, the bootstrapped confidence interval for the estimate of the indirect effect from
sleep efficiency to HF-HRV through diary negative mood contained 0, indicating
nonsignificance (95% CI = .00 - .02). Adjustment for diary reports of negative mood did not
affect the link between sleep efficiency and HR recovery ( = -.29, p = .02).
Less efficient sleepers continued to show greater HF-HRV withdrawal during cognitive
tasks and higher HR during recovery from tasks after adjustment for depressive symptoms (HF-
HRV: = .33, p = .01; HR: -.28, p = .03) or ongoing, upsetting stressful life events (HF-HRV:

73
= .36, p = .006; HR: = -.32, p = .02). Decreased sleep efficiency was also associated with
higher Cook Medley Hostility scores, but adjusting for hostility did not alter any of the
relationships reported above.
Adjustment for task arousal ratings or changes in affect (negative or positive valence) as
reported on the PANAS did not alter links between sleep efficiency and HF-HRV reactivity or
HR recovery (ps > .05).
4.3.2 Naps
The association between sleep efficiency and HR recovery was slightly attenuated after
adjustment for actigraphy-detected naps ( = -.24, p = .06), but not after adjustment for self-
reported naps ( = -.29, p = .03). Sleep efficiency and HF-HRV reactivity remained associated
after adjustment for actigraphy-detected ( = .29, p = .03) or self-reported naps ( = .31, p = .02).
4.4 HYPOTHESIS THREE
Results from linear regression models examining the link between within-person variability and
cardiovascular responses to stress are displayed in Tables 14-15. None of the hypothesized
associations were supported. The only relationship observed was that between greater variability
in actigraphy-assessed total sleep time and lower diastolic BP during recovery periods. (Mean
actigraphy total sleep time remained associated with higher diastolic BP during recovery after

74
adjustment for variability in total sleep time, = -.36, p = .003). The association between
variability in sleep and diastolic BP was independent of diary characteristics, including daily
stress, daily negative mood, and self-reported nap minutes; psychosocial attributes, including
depressive symptoms and stressful life events; laboratory variables, including task appraisals and
PANAS ratings; and naps. Removing four participants with BMI > 30 did not alter the results.
Table 14. Results from linear regression models examining variability in actigraphy total sleep time and CV stress
reactivity
HR Reactivity HF-HRV
Reactivity
Systolic BP
Reactivity
Diastolic BP
Reactivity
B p B p B p B p
Within-Person Variability
in Total Sleep Time .09 .47 -.16 .16 .17 .16 .15 .23
*adjusted for age, race (Asian/Pacific Islander, Black, White), BMI, and mean total sleep time; HF-HRV
analyses are also adjusted for respiration rate.
Table 15. Results from linear regression models examining variability in actigraphy total sleep time and CV stress
recovery
HR Recovery HF- HRV
Recovery
Systolic BP
Recovery
Diastolic BP
Recovery
B p B p B p B p
Within-Person Variability
in Total Sleep Time -.17 .15
-.02
.88
-.13
.28
-.27
.02
*adjusted for age, race (Asian/Pacific Islander, Black, White), BMI, and mean total sleep time; HF-HRV
analyses are also adjusted for respiration rate.

75
4.5 SUPPLEMENTARY ANALYSES
4.5.1 Actigraphy-measured sleep directly prior to the laboratory session
Total sleep time as assessed by actigraphy on the night before the laboratory session was not
associated with any of the cardiovascular stress reactivity (HR: = .08, p = .64; SBP: = -.15, p
= .40; DBP: = -.09, p = .64; HF-HRV: = -.02, p = .90) or recovery parameters (HR: =
.02, p = .92; SBP: = -.01, p = .97; DBP: = .18, p = .28; HF-HRV: = .03, p = .86).
4.5.2 Diary-measured sleep quality
Poorer sleep quality as reported in the morning diary during the week before the laboratory
session was related to lower HF-HRV during stress tasks ( = .23, p = .05), as well as lower HF-
HRV during recovery from stress tasks ( = .24, p = .04). These effects were independent of
total sleep time and sleep efficiency as assessed by actigraphy. These effects were also
independent of diary characteristics, psychological attributes, laboratory variables, and naps.
Diary-reported sleep quality was unrelated to HR reactivity ( = -.09, p = .46), HR recovery ( =
-.18, p = .13), BP reactivity (SBP: = -.04, p = .75; DBP: = .07, p = .57), or BP recovery
(SBP: = -.18, p = .11; DBP: = -.02, p = .89).

76
4.5.3 Weekday versus weekend sleep
All of the associations between actigraphy-assessed total sleep and cardiovascular stress
responses were significant when average sleep time was calculated using weeknight sleep only.
There were no associations between weekend sleep time and cardiovascular stress responses.
4.5.4 Moderators of the sleep-cardiovascular stress response relationship
Sleep efficiency was tested as a moderator of the associations between actigraphy-assessed total
sleep time and cardiovascular stress responses. The only evidence of moderation was for HF-
HRV recovery (total sleep time X efficiency, = 3.43, p = .03). Plotting the simple slopes at
one standard deviation above and below the mean of sleep efficiency revealed that the
relationship between total sleep time and recovery HF-HRV tended to be positive at high levels
of sleep efficiency and negative at low levels of sleep efficiency; however, the simple slopes
were not significant (total sleep time and HF-HRV at high levels of sleep efficiency: = .23, p =
.20; total sleep time and HF-HRV at low levels of sleep efficiency: = -.20, p = .26).
Several other variables were tested as potential moderators of the associations
between actigraphy-assessed total sleep time and cardiovascular stress responses, including
daytime sleepiness as measured by the Epworth Sleepiness Scale, within-person variability in
actigraphy total sleep time, negative affect (composite score of depressive symptoms, anxiety,
and hostility questionnaires), stressful life events, sleep quality, task arousal, and naps. None of
the interaction terms were related to cardiovascular stress outcomes.

77
4.5.5 Sleep as a mediator of psychosocial attributes and cardiovascular stress responses
There was some evidence that actigraphy-assessed time spent asleep mediated links between
reports of psychological stress and HF-HRV withdrawal during stress. Results based on 5000
bootstrapped samples indicated that there were significant direct effects of ongoing, stressful life
events on actigraphy-assessed time spent asleep (B = -3.74, SE = 1.90, p = .05) and of time spent
asleep on HF-HRV during stress tasks (B = .004, SE = .002, p = .04). While the total effect of
stressful life events on HF-HRV was significant (B = -.06, SE = .03, p = .05), the direct effect
was not (B = -.05, SE = .03, p = .13). The bootstrapped confidence interval for the estimate of
the indirect effect of stressful life events on HF-HRV through time spent asleep did not contain
0, indicating significant mediation (95% CI = -.04 - -.002).
Similarly, there were marginally significant direct effects of daily diary stress reports on
actigraphy-assessed time spent asleep (B = -19.8, SE = 11.5, p = .09), and there was a significant
direct effect of time spent asleep on HF-HRV during stress tasks (B = .004, SE = .002, p = .03).
While the total effect of daily diary stress on HF-HRV was significant (B = -.37, SE = .19, p =
.05), the direct effect was not (B = -.29, SE = .19, p = .12). The bootstrapped confidence interval
for the estimate of the indirect effect of daily diary reports on HF-HRV through time spent asleep
did not contain 0, indicating significant mediation (95% CI = -.25 - -.007).

78
5.0 DISCUSSION
This study examined the associations between sleep and cardiovascular stress responses in 79
healthy, undergraduate men. The primary hypothesis was that men reporting a typical sleep
duration of 6 or less hours over the past month would have more dramatic and prolonged HR,
HF-HRV, and BP responses to stressful laboratory tasks than men reporting 7-8 hours of sleep
per night. Those reporting fewer than 6 hours of sleep per night, referred to here as short
sleepers, had higher recovery HR following stress tasks than those reporting longer sleep. There
were no group differences in HR reactivity to stressful tasks, nor were there any group
differences in HF-HRV or BP reactivity or recovery to stressful tasks. Thus, the primary
hypothesis of this project was largely unsupported, with self-reported sleep duration groups
showing mostly similar cardiovascular responses to stress.
In addition to self-reports of typical sleep, estimates of total sleep time and sleep
efficiency during the week preceding the laboratory testing session were obtained with
actigraphy. Shorter actigraphy-assessed total sleep time over the week was associated with
greater reductions in HF-HRV during stress tasks, and with elevated DBP following stress tasks.
Associations were independent of age, race, BMI, respiration, and a variety of health behaviors
and psychosocial attributes. Shorter actigraphy total sleep also was related to heightened HR
following stress; however, this association was no longer significant after adjusting for daytime
naps detected by the actigraph. Actigraphy-assessed total sleep was not related to HR reactivity

79
or BP reactivity, nor was it related to HF-HRV recovery after tasks. With regard to actigraphy-
assessed sleep efficiency, less efficient sleep was related to greater reductions in HF-HRV during
stress, as well as higher HR recovery following stress. Adjustment for actigraphy naps led to an
attenuation of the relation between sleep efficiency and HR recovery. Decreased efficiency was
also related to increased HR reactivity to cognitive tasks only. Unlike total sleep time, sleep
efficiency was not associated with DBP recovery.
Thus, hypothesized relationships among shorter, less efficient actigraphy-assessed sleep
and exaggerated cardiovascular stress responses were partially supported by the data. Overall,
the most consistent relationships were between actigraphy-assessed sleep parameters and
attenuated HF-HRV during stress tasks, and higher HR after stress tasks. The strength of several
of these relationships was reduced after adjusting for actigraphy-assessed daytime naps.
A secondary aim of this study was to determine if within-person variability in actigraphy
total sleep time co-varied with cardiovascular stress responses. This hypothesis was not
supported, as estimates of individual variability in sleep were unrelated to nearly all of the
cardiovascular stress responses examined. The one exception was an inverse relationship
between within-person variability in total sleep time and DBP following stress tasks.
5.1 CARDIOVASCULAR STRESS RESPONSES BY SELF-REPORTED SLEEP
DURATION GROUP
Cut-offs used to determine the sleep groups in this sample were based on epidemiological data
showing an increased risk of cardiovascular morbidity and mortality among individuals reporting
80
habitually short sleep duration, typically less than 5 or 6 hours per night (Cappuccio, Cooper,
D’Elia, Strazzullo, & Miller, 2011). It was expected that short sleepers would show more
exaggerated cardiovascular responses upon encountering a stressor, and that these responses may
constitute one physiological pathway by which short sleep increases cardiovascular risk.
However, self-reported sleep groups in the current study did not differ in most of the
cardiovascular stress responses examined. One exception was that short sleepers had elevated
HR during the recovery periods following stress tasks compared to the 7-8 hour sleepers. This
finding may suggest that either the process by which HR is restored after a challenge is
decelerated among individuals reporting short sleep, or that these individuals have higher levels
of anticipatory arousal preceding a challenging task. Follow-up analyses supported the former,
as the difference in HR between sleep groups was stronger during the two minutes following task
completion than during the two minutes before an upcoming task. Furthermore, sleep groups did
not differ in their HR reactivity during the speech preparation period, a time likely characterized
by anticipatory arousal.
The bulk of the literature linking delayed HR recovery to cardiovascular outcomes is
based on studies of aerobic stress; slower HR decline following exercise tolerance tests predicts
coronary events (Pitsavos et al., 2004), coronary artery disease (Lipinski, Vetrovec, &
Froelicher, 2004), and mortality (Cole, Blackstone, Pashkow, Snader, & Lauer, 1999) in
longitudinal studies. Fewer studies have examined the cardiovascular consequences of delayed
HR recovery following psychological stress. A meta-analysis by Chida and Steptoe (2010)
based on a small number of studies reported that prolonged HR recovery following mental stress
predicts subsequent cardiovascular risk status, with outcomes consisting of higher IMT
(Heponiemi et al., 2004) and higher BP (Steptoe et al., 2005; Stewart et al., 2006) across 2-3 year

81
follow-ups. Therefore, it is plausible that prolonged HR recovery following psychological stress
is among the pathways linking self-reported short sleep to cardiovascular morbidity.
It was expected that self-reported short sleepers would perceive challenging tasks as more
negative or more arousing, and that this appraisal may have a top-down influence on autonomic
activity. Results showed that short sleepers rated cognitive tasks, but not the speech, as more
arousing than did average length sleepers, and they also reported larger increases in negative
mood across the laboratory session, than average length sleepers. Interestingly, shorter sleepers
also reported greater increases in positive, activated mood states, such as feeling alert and
excited, across the stress session. Reports of decreased mood and higher arousal did not mediate
HR recovery differences between the self-reported sleep groups (although ratings of arousal, in
particular, co-varied with many of the cardiovascular reactivity indices; see Table 25A).
Nevertheless, these data complement a larger literature linking sleep disturbances or deficits with
heightened emotional reactivity (Hamilton, Catley, & Karlson, 2007; Kumari et al., 2009; Morin,
Rodrigue, & Ivers, 2003; Zohar et al., 2005). Prior work in this area has focused on populations
with abnormal sleep, such as medical residents or persons with insomnia, or has acknowledged
the challenge of capturing “objective” stressors independent of subjective appraisal or recall bias.
Thus, the current results add to the literature by demonstrating a relationship between normative
variation in subjective sleep duration and emotional reactivity to a controlled set of stressful
stimuli in healthy young adults.
Sleep duration groups did not differ in HF-HRV reactivity or recovery, perhaps
suggesting that changes in vagal cardiac influence may not be a relevant mechanism linking self-
reported short sleep to cardiovascular outcomes. On the other hand, when self-reported sleep
duration was examined as a continuous predictor, shorter sleep duration was related to lower HF-

82
HRV during stress tasks, suggesting that dichotomization of groups may have resulted in loss of
information about individual differences and decreased power (MacCallum, Zhang, Preacher, &
Rucker, 2002). This explanation may be likely given that shorter actigraphy-assessed total sleep
time was similarly associated with lower HF-HRV during stress.
Self-reported sleep duration groups did not differ in BP reactivity or recovery, nor was
there a relation between continuously measured self-reported sleep duration and BP stress
responses. These results suggest that pressor changes in response to stress are not among the
mechanisms linking reports of short sleep to cardiovascular outcomes. Another possibility is
that BP responses to stress may be a relevant pathway only after short sleep occurs consistently
over extended periods of time, or in those who sleep less during specific periods of the lifespan.
For instance, the bulk of the literature reporting elevated cardiovascular risk among self-reported
short sleepers is based upon samples of middle-aged to older adults. All of the participants in this
study were in college, a period characterized by dramatic shifts in sleep timing (Carskadon &
Davis, 1989). Thus, reported sleep duration may reflect a relatively recent change in behavior,
with adult sleep patterns not stabilizing for several more years. On the other hand, Mezick et al.
(2012) reported a link between shorter actigraphy-assessed sleep and higher BP in a sample of
high school students, and Franzen et al. (2011) demonstrated that sleep deprivation in healthy
young adults (mean age = 23 yrs) results in increased SBP reactivity, suggesting that the
cardiovascular correlates of sleep restriction may indeed be present earlier in the lifespan.
Longitudinal studies examining sleep duration and BP reactivity over time will be critical in
determining whether changes in the pressor response system gradually accumulate as a result of
short sleep.

83
5.2 CARDIOVASCULAR STRESS RESPONSES AND ACTIGRAPHY-ASSESSED
SLEEP DURATION
Shorter actigraphy total sleep time during the week preceding the laboratory testing session was
related to greater HF-HRV withdrawal during stress tasks, as well as higher HR and diastolic BP
during task recovery. There may be several reasons why actigraphy total sleep time was related
to DBP recovery, but self-reported sleep duration was not. Self-reports do not correlate perfectly
with objective assessments of sleep duration, and individuals typically overestimate their
habitual sleep length relative to total sleep time as quantified by actigraphy (Lauderdale,
Knuston, Yan, Liu, & Rathouz, 2008). Researchers have suggested several explanations for this
discrepancy, positing that overestimates may be due to variability in sleep duration over time or
to the misperception of sleep onset and nighttime awakenings. Others have suggested that
factors other than actual sleep time, such as sleep quality, daytime fatigue, or psychological
attributes, may influence subjective reports (Knutson & Turek, 2006; van den Berg et al., 2008).
In the current study, habitual sleep duration reported on the PSQI correlated with
actigraphy total sleep time at r = .54. Similar to previous reports, more than 80% of participants
over-estimated their habitual sleep duration relative to actigraphy sleep time across one week;
the mean over-estimation was by 47 minutes. These data suggest that self-reported and
actigraphy-assessed sleep duration are related but not synonymous constructs, and it is possible
that the aspects of sleep duration captured by actigraphy (i.e., movement throughout the night)
are more closely associated with BP regulation than perceptions of duration.
Additionally, although the two self-reported sleep groups in this study differed by 54
minutes in actigraphy sleep over one week, visual inspection of the data revealed substantial
overlap in total sleep time between the two groups (see Figure 3). Indeed, about 10% of

84
participants would have been classified in a different sleep group if actigraphy total sleep time
was used to create groups instead of self-report (i.e., four participants reporting a habitual sleep
duration of fewer than 6 hours got more than 6 hours of sleep as assessed by actigraphy, and five
participants reporting a habitual sleep duration of 7-8 hours got less than 5.5 hours of sleep as
assessed by actigraphy). Thus, the two groups in this study may not have been disparate enough
in their actual sleep to observe a difference in BP stress responses. Another possibility is that the
week of sleep assessment for this study was not representative of usual patterns as reported on
the PSQI. If so, this would suggest that acute changes in sleep during the week preceding the
laboratory tasks were more influential on BP responses to stress than habitual sleep. Although
this explanation may be less likely given that sleep on the night before the laboratory testing
session was not related to cardiovascular reactivity or recovery, it cannot be ruled out based on
the current data.
Several previous studies examining variation in sleep in relation to physiological stress
responses, including cardiovascular and neurohormonal activity, observed associations with
actigraphy-assessed sleep continuity but not with self-reported sleep duration (Palesh et al.,
2008; Wright et al., 2007). Others have detected associations between sleep parameters and
physiological stress responses in studies where only self-report sleep measures were used
(Capaldi et al., 2005; Uchino et al., 2005). With regard to the larger literature on sleep and CVD,
relatively few studies have examined actigraphy-assessed sleep in relation to cardiovascular
morbidity, and even fewer have compared self-reports and actigraphy estimates within the same
study. An exception is King et al.’s 2008 study demonstrating that actigraphy-assessed short
sleep, but not self-report, was associated with an increase in coronary artery calcification over
five years in CARDIA. Matthews et al. (2011) reported that PSG-assessed sleep duration, but

85
not self-reported sleep duration, was associated with higher blood pressure in a cross-sectional
study of 224 black and white adults. Additionally, a small but growing literature has linked
actigraphy-assessed total sleep time with other cardiovascular risk factors, such as elevated BP
and obesity (Javaheri et al., 2008; Mezick et al., 2012; Patel et al., 2008). Inclusion and
comparison of multiple methods of sleep assessment for their associations with cardiovascular
risk will be helpful in elucidating the mechanisms responsible for the short sleep-CVD link.
5.3 CARDIOVASCULAR STRESS RESPONSES: A CLOSER LOOK
5.3.1 High-frequency heart rate variability and heart rate
Shorter actigraphy total sleep time and shorter self-reported sleep duration (when measured
continuously) were associated with greater reductions in HF-HRV during stress tasks. This
finding is largely consistent with the few prior studies on sleep and vagal stress responses that
have been conducted. In Uchino et al.’s 2005 study, increases in self-reported sleep over a 7-to-
16 month span were related to less vagal withdrawal during laboratory stressors (mental
arithmetic and speech tasks). The age range of that sample was 30 to 70 years old, and sleep
duration was defined as self-reported hours typically obtained in a week. In a sample of women
with breast cancer, decreased sleep continuity assessed by actigraphy over three nights was
related to lower overall HF-HRV during the Trier Social Stress Test. Studies in humans and
animals also have shown that experimental sleep deprivation leads to reductions in resting vagal

86
activity, as well as reduced vagal antagonism in response to stress (Zhong et al., 2005; Sgoifo et
al., 2005).
One study reported contradictory results, such that actigraphy-assessed shorter sleep and
increased sleep fragmentation were associated with less vagal withdrawal during a reaction time
task in 6-to-12-year-olds (El-Sheikh & Buckhalt, 2005). The authors argue that higher levels of
vagal withdrawal during a challenging situation reflect a heightened, or more efficient, capacity
to formulate an organized and appropriate physiological response. This explanation is in line
with Porges’ polyvagal theory, which posits that increased cardiac vagal control in times of rest
(vagal tone) and decreased vagal control in times of stress or challenge (vagal reactivity) is due
to a more flexible and efficient disengagement and reengagement of the vagal brake (Porges
2003, Porges, Doussard-Roosevelt & Maiti, 1994). Thus, greater vagal suppression is argued to
be adaptive in some situations and related to increased emotion regulatory capacity. The
polyvagal theory has been examined and supported primarily in infants and children; it has not
been studied as frequently in adults. For instance, the literature on vagal reactivity to laboratory
tasks and psychosocial functioning in adults is small and equivocal, with one study reporting a
link between increased task vagal suppression and depressive symptoms (Rottenberg, Clift,
Bolden, & Salomon, 2007), and another reporting that less vagal withdrawal during
psychological challenge correlates with more positive social functioning (Egizio, Jennings,
Christie, Sheu, Matthews, & Gianaros, 2008).
With regard to cardiovascular risk, diminished HF-HRV at rest or during clinic visits is
associated with the progression of coronary artery calcification, and an increased risk for cardiac
events and all-cause mortality (Tsuji et al., 1994; Tsuji et al., 1996; Rodrigues, Ehrlich, Hunter,
Kinney, Rewers, Snell-Bergeon, 2010); however, the cardiovascular implications of vagal

87
withdrawal during stress are less clear. Gianaros et al. (2005) reported that a greater reduction in
HF-HRV during preparation for a speech task was related to more extensive coronary artery and
aortic calcification, and Matthews et al. (2003) reported that lower mean successive differences
in interbeat intervals during a battery of laboratory stress tasks predicted increases in diastolic BP
over 3 years in children and adolescents. Steptoe and Marmot (2005) also demonstrated that
lower HRV (as assessed by the root mean square of successive difference in R-R intervals)
during stress tasks predicted increases in DBP over 3 years in 209 middle-aged men and women
free from CVD and hypertension. In contrast, Heponiemi et al. (2007) observed a link between
greater stressor-evoked RSA reactivity and lower IMT 2 years later. Thus, further study of the
associations between sleep and task-induced fluctuations in vagal control in the context of
cardiovascular risk versus emotion regulation may be warranted.
The fact that actigraphy-assessed sleep parameters were related to a greater reduction in
HF-HRV during tasks but with attenuated HR recovery after tasks is somewhat surprising, given
that HF-HRV and HR might be expected to co-vary in an inverse manner. Examination of HR
and HF-HRV values throughout the protocol showed that reactivity change scores for these two
parameters correlated from -.3 to -.5, and recovery change score correlations ranged from -.2 to -
.4. Thus, while HR and HF-HRV moved in a related and inverse fashion, the correlations suggest
some degree of dissociation, which may relate to differences in autonomic origins. While HF-
HRV is believed to primarily reflect vagal efferent activity to the heart, increases in HR may be a
function of increased sympathetic activity, decreased parasympathetic activity, or combinations
of activation and/or inhibition of both branches (Bernston, Cacioppo, Quigley, & Fabro, 1994).
Studies of HR decline after moderate exercise have shown that there is an initial, rapid
decrease in HR upon stopping exercise that is entirely due to a fast-acting increase in cardiac

88
vagal activity, which is followed by a slower and more gradual decline in HR resulting from a
combination of increasing vagal activation and decreasing sympathoadrenal activity (Imai, Sato,
Hori, et al., 1994; Rosenwinkel, Bloomfield, Arwady et al., 2001; Savin, Davidson, & Harkell,
1982). At least one study has suggested that a similar recovery process, (i.e., a rapid increase in
parasympathetic activity which serves to decelerate HR) may occur following psychological and
cold pressor challenge (Mezzacappa, Kelsey, Katkin, & Sloan, 2001). Evidence suggests that the
typical time frame for vagal reactivation is 30 – 60 seconds post-challenge (Imai et al., 1994;
Mezzacappa et al., 2001). Using an autonomic blockade design, Imai et al. (1994) showed that
at two minutes post-exercise, there are both parasympathetic and sympathetic contributions to
HR. Thus, the fact that self-reported and actigraphy sleep were associated with HR recovery at
two minutes post-stress, but not with HF-HRV recovery, may suggest that sleep duration is more
closely linked to a dysregulation of sympathetic recovery. However, this conclusion remains
speculative, as the study was limited in its ability to assess the degree of sympathetic versus
parasympathetic influence on the heart. Moreover, additional work is needed to understand
whether the mechanisms that restore HR following aerobic exercise are similar to the restorative
mechanisms following mental or emotional stress.
Finally, the relationship between actigraphy-assessed total sleep time and HR recovery
was reduced to non-significance after adjusting for average actigraphy-detected, but not self-
reported, daily nap minutes across the study period. Similarly, self-reports of sleep duration no
longer predicted HR recovery after inclusion of actigraphy nap minutes in linear models.
Nocturnal sleep and daytime naps were inversely correlated, and attenuation was likely due to
the fact that the two variables accounted for overlapping variance in HR recovery. Longer naps
may disrupt nighttime sleep, and shorter nighttime sleep may lead to increased daytime napping

89
(Owens et al., 2010). Thus, the co-occurrence of shorter nocturnal sleep and increased daytime
naps may reflect a dysregulated sleep cycle. The literature on napping and cardiovascular risk
has been mixed, with some studies reporting a protective effect (Kalandidi et al., 1992; Naska et
al., 2007) and others reporting elevated risk associated with naps (Stone et al., 2009; Tanabe et
al., 2010). In experimental studies, Vgontzas et al. (2007) showed that a midafternoon nap
reversed the effects of one night of sleep deprivation on cortisol and interleukin-6 secretion in
healthy 18-30 year-olds, and Brindle and Conklin (2011) demonstrated that a longer daytime nap
was associated with accelerated BP recovery following mental stress, relative to a shorter nap.
Thus, one possibility is that an isolated nap leads to acute physiological benefits, whereas a
chronic pattern of napping leads to disrupted nighttime sleep and subsequent negative effects on
health. Disentangling the potential negative and positive effects of napping on the
cardiovascular system, especially in the context of inadequate sleep, warrants further
investigation.
The fact that associations between nocturnal sleep and HR recovery were attenuated after
actigraphy-assessed naps, but not after self-reported naps, may be important. The actigraph
software algorithm automatically detects naps, or minor rest intervals, on the basis of immobility.
A recent study showed that an actigraph (of the same brand and using a scoring algorithm similar
to the one in the current study) detected naps with relatively high sensitivity but less specificity
compared to PSG sleep (Kanady, Drummond, & Mednick, 2011). In other words, periods of
quiescence may be misidentified as sleep when using actigraphy alone. Thus, the nap periods
detected in the current study could possibly reflect either daytime sleep or rest/immobility.

90
5.3.2 Blood pressure
Total sleep time as assessed by actigraphy was not related to systolic BP responses to stress.
These findings are in contrast to results recently reported by Franzen and colleagues (2011); in
that study, one night of experimental sleep deprivation resulted in increased systolic BP
reactivity to a laboratory speech task in healthy young adults. Different results may be due to the
fact that Franzen et al.’s study demonstrated an effect of acute, extreme sleep loss, while the
present study examined naturally occurring variation in sleep duration that presumably reflects a
more chronic pattern of behavior. Although neither self-reported nor actigraphy-assessed sleep
duration was associated with systolic BP responses to stress in the current study, shorter
actigraphy sleep time was associated with delayed diastolic BP recovery. The finding that sleep
duration may be associated with BP recovery is somewhat consistent with the aforementioned
study by Brindle and Conklin (2011). In that study, healthy young adults who obtained at least
45 minutes of sleep during a daytime nap in the laboratory had lower mean arterial pressure
following mental stress tasks than those who slept for a shorter duration. Taken together, these
results offer preliminary evidence that longer sleep may buffer cardiovascular risk through
accelerating BP recovery rather than by attenuating BP reactivity.
It should be noted that the literature linking delayed BP recovery to future CVD
outcomes is stronger and more consistent for systolic, rather than diastolic, recovery. The meta-
analysis by Chida and Steptoe (2010), for example, reported that delayed SBP recovery
following stress, defined as sustained BP activation above baseline during post-task recovery
periods, predicted poor cardiovascular risk status, while delayed DBP stress recovery was only a
marginal predictor of subsequent risk status. Thus, while it is theoretically plausible that delayed

91
BP recovery contributes to the development or progression of cardiovascular disease, the degree
of this contribution, and of diastolic recovery in particular, is unclear.
Much of the literature examining the contribution of clinic or resting BP to
cardiovascular disease risk similarly suggests that systolic BP may have more prognostic value
than resting diastolic BP (Black, 2004; Lloyd-Jones, Evans, Larson, O’Donnell, & Levy, 1999).
On the other hand, some have suggested that systolic pressure is primarily relevant for those over
the age of 50, and that both systolic and diastolic clinic BP predict risk in younger populations
(Franklin et al., 2001; Khattar, Swales, Dore, Senior, & Lahiri , 2001; Neaton et al., 1995). For
example, Franklin et al. (2001) reported that diastolic BP was the strongest predictor of coronary
heart disease risk in those under the age of 50, and Khattar et al. (2001) reported that ambulatory
DBP was the strongest predictor of cardiovascular events in those under 60 years of age in a
sample of 546 men and women. Others have shown that DBP is the only hemodynamic correlate
of arterial stiffness in young, healthy males (Nürnberger, Dammer, Saez, Philip, & Schäfers,
2003). It has been proposed that the superior accuracy of DBP versus SBP in the young may be
due to timing of the reflected pulse wave, which changes with age. In the young, pulse wave
augmentation in the aorta occurs during diastole due to high aortic distensibility and low pulse
wave velocity, which cause the reflected wave to travel more slowly. In contrast, in the
periphery, where there is a short distance between measurement and reflection sites, pulse wave
augmentation occurs during systole. Thus, peripheral diastolic pressure correlates well with
central values, whereas peripheral pressures may overestimate central systolic pressure
(Vlachopoulos & O’Rourke, 2000). As the current study included healthy young men only, it is
possible that the delayed DBP recovery observed among this sample may have more prognostic
value than SBP.

92
Finally, prolonged BP recovery may reflect elevations in either cardiac output or total
peripheral resistance, and a more complete evaluation of these factors would require direct
assessment of cardiac versus vascular influences. The relationship between sleep duration and
stressor-evoked hemodynamic changes has not been examined in prior work; however, acute,
experimental sleep loss has been shown to lead to increased overall vascular resistance in a
sample of healthy undergraduates (James & Gregg, 2004; however, not all studies find an effect,
e.g., Kato, Phillips, Sigurdsson, Narkiewicz, Pesek, & Somers, 2000). Therefore, the association
between sleep and stress-induced changes in the overall hemodynamic profile, particularly total
peripheral resistance, may warrant further attention.
5.4 WHAT MAY ACCOUNT FOR THE LINKS BETWEEN ACTIGRAPHY-
ASSESSED SLEEP DURATION AND CARDIOVASCULAR STRESS
RESPONSES?
It was theorized that individuals getting less sleep might perceive laboratory tasks as more
challenging due to diminished resources to cope with stressful stimuli. Actigraphy-assessed
sleep time, however, was not related to task ratings of arousal, valence, or control in this study,
nor was actigraphy sleep time related to change in negative mood across the laboratory testing
session. Shorter actigraphy sleep was marginally associated with increases in positive mood
across the testing session, due to reports of increased activation. Adjusting for positive mood led
to only a slight reduction in the link between sleep time and HR recovery. Thus, the hypothesis
that elevated perceptions of stress might lead to heightened cardiovascular responses was largely
unsupported.

93
Previous work shows that correlations between cognitive task appraisals and HR and
BP reactivity are weak to moderate (Feldman et al., 1999; Franzen et al., 2011; Gianaros et al.,
2009; Maier, Waldstein, & Synowski, 2003), suggesting that factors other than subjective
distress influence stressor-evoked responses. For instance, resting regional cerebral blood flow
in corticolimbic areas (the cingulate, medial prefrontal, and insular cortices) has been associated
with BP reactivity, independent of subjective reports of stress (Gianaros, Sheu, Remo, Christie,
Critchley, & Wang, 2009). Previous work has also shown that acute sleep deprivation leads to
increased reactivity of the amygdala to negative emotional stimuli, as well as increased
functional connectivity between the amygdala and autonomic-activating centers of the brainstem
(Yoo et al., 2007). Thus, the possibility that shorter actigraphy-assessed sleep leads to
heightened cardiovascular stress responses by influencing neural processes at the corticolimbic
level, independent of perceptions of stress, cannot be ruled out based on the current data.
Several factors other than task-related distress were tested as potential mediators of the
relationship between actigraphy total sleep time and cardiovascular stress responses. There was
some evidence that daily experiences of negative affect may mediate the relationship between
actigraphy-assessed sleep parameters and vagal withdrawal during stress. Specifically, adjusting
for daily diary ratings of negative mood led to a reduction in the links between shorter actigraphy
total sleep time and poorer actigraphy sleep efficiency, on the one hand, and lower HF-HRV
during stress tasks on the other, suggesting that recurrent experiences of negative mood may be
more relevant than acute, task-related changes in mood. It should be noted, however, that more
formal statistical tests did not support diary-reported negative mood as a mediating pathway.
With regard to other possible mediators, such as trait negative affect, stressful life events, and

94
daytime napping, statistical adjustment for these variables did not reduce associations between
actigraphy-asssessed sleep and cardiovascular stress responses.
One or more underlying factors common to both short, inefficient sleep and
cardiovascular stress responses may account for the relationships observed in this study.
Overlapping heritability, for example, may play a role. Studies report moderate heritability
estimates for sleep duration (Landolt, 2008) and for cardiovascular responses to stress, including
HR, BP, and HF-HRV reactivity and BP recovery (Roy-Gagnon et al., 2008; Wu, Snieder, &
Geus, 2009). Interestingly, one study observed a combination of delayed HR and diastolic BP
recovery – the same pattern observed in the current study - following a serial-subtraction math
task in young, healthy males with a positive family history of hypertension versus those without
a family history (Schneider, Jacobs, Gevirtz, & O’Connor, 2003). Group differences in BP
reactivity were not found, leading the authors to speculate that impairments in HR and diastolic
BP recovery may be early precursors to, or markers of, development of essential hypertension. It
is possible that common variations in genes implicated in both sleep regulation and
cardiovascular stress responses account for the observed relationships. Disruptions of the core
clock genes that regulate endogenous circadian rhythmicity have been linked to vascular function
(Prasai, George, & Scott, 2008), and a functional genetic variant in the linked polymorphic
region of the serotonin transporter gene has been implicated in both sleep-wake regulation and
cardiovascular stress reactions (Landolt, 2008; Wu et al., 2009). Animal models may be
particularly helpful in further uncovering molecular mechanisms underlying cardiometabolic
disease and circadian disruption (Arble, Ramsey, Bass, & Turek, 2010).

95
5.5 CARDIOVASCULAR STRESS RESPONSES AND ACTIGRAPHY-ASSESSED
SLEEP EFFICIENCY
Lower actigraphy-assessed sleep efficiency was associated with increased HF-HRV withdrawal
during stress and elevated HR during recovery periods. The potential interaction between
actigraphy total sleep time and sleep efficiency was also explored; however, there was little
evidence that disrupted continuity moderated links between sleep time and stress responses.
About half of the small literature that has examined sleep and physiological stress responses
reports that sleep continuity, rather than duration, may be the more critical component (Palesh et
al., 2008; Stepanski et al., 1994; Wright et al., 2007). Decreased sleep continuity has been
associated with elevations in nocturnal sympatho-adrenal medullary activity and sympathovagal
balance in previous studies (Mezick et al., 2008; Hall et al., 2004). Thus, sleep characterized by
repeated waking or heightened activity may result in greater cumulative exposure to increased
sympathetic and/or decreased parasympathetic cardiovascular influence over time, which may
“prime” the system to exhibit exaggerated sympathetic activity or exaggerated parasympathetic
withdrawal when faced with challenge.
Decreased sleep efficiency was associated with reports of increased depression, hostility,
and daily negative affect recorded in diaries, as well as increases in negative mood across the
laboratory session, raising the possibility that emotional reactivity might mediate links between
sleep efficiency and cardiovascular stress responses. However, bootstrapping analyses did not
support this model. Another possibility is that underlying autonomic dysregulation leads to
disrupted sleep continuity, as well as increased and prolonged stress responses. Studies
examining whether experimentally manipulating sleep continuity affects autonomic activity will
help elucidate a causal effect versus an association due to residual confounding.

96
Actigraphy assessments of sleep duration and sleep efficiency often correlate in a positive
manner. In the present study, there was considerable overlap between actigraphy assessments of
total sleep time and efficiency (r = .62). In models where both variables were entered as
simultaneous predictors, neither was associated with stress responses, likely due to
multicollinearity. Despite their correlation, total sleep time and sleep efficiency likely have
different origins in different individuals. For example, it is possible that short sleep may result
from voluntary sleep curtailment, a decreased need for sleep, or an inability to fall and/or stay
asleep. Decreased sleep efficiency is likely caused by either difficulty initiating and maintaining
sleep, or it may result from an individual attempting to sleep for a longer duration than
physiologically necessary. As deficits in sleep duration and efficiency may have different
physiological correlates and consequences, it is important for future studies to examine both
variables for their independent links with health. Determining whether sleep duration, sleep
efficiency, or both, are related to cardiovascular risk may inform behavioral sleep interventions
that aim to reduce cardiovascular risk.
5.6 CARDIOVASCULAR STRESS RESPONSES AND WITHIN-PERSON
VARIABILITY IN ACTIGRAPHY-ASSESSED SLEEP DURATION
Within-person variability in actigraphy-assessed total sleep time was not related to HR or HF-
HRV responses to stress. Greater within-person variability was associated with lower diastolic
BP recovery, in contrast to the hypothesized relationship. Such results were not expected, based
on the rationale that those who are more reactive to stress may also show a more “reactive” sleep

97
pattern as characterized by greater night-to-night variability. Prior work, for example, has shown
that the degree of variability in sleep correlates with reports of life stressors and negative affect
in both adolescents (Fuligni & Hardway, 2006) and adults (Mezick et al., 2009), with one
potential explanation being that a chaotic, stressful environment, along with heightened
emotional reactions to stressors, disrupts the regularity of sleep timing and/or duration. In the
current sample, variability in sleep duration was not associated with reports of current life stress,
nor was it associated with daily diary reports of stress or negative mood (see tables A7 and A8).
Thus, nightly variability in sleep among college–aged men may result from factors other than
emotional reactivity to stress. Several studies also have shown that greater within-person
variability in sleep duration is related to poorer self-reported sleep quality in university student
populations (Brown, Buboltz, & Soper, 2002; Kang & Chen, 2009; Manber, Bootzin, Acebo, &
Carskadon, 1996). However, this link was not replicated in the current sample. Instead, shorter
actigraphy-assessed mean sleep duration was associated with poorer sleep quality.
Unfortunately, the mean or range of within-person variability among college students in
this study cannot be directly compared to prior work in samples of a similar age due to different
metrics and definitions of variability. However, the amount of nightly variability observed in the
current study was similar to, or slightly greater than, values observed in older samples (Knutson
et al., 2007; Mezick et al., 2009), which is not surprising given the relative flexibility of college
students’ schedules. Thus, it is unlikely that this sample did not display enough variability in
sleep to allow detection of a relationship with stress responses. It may be that increased nightly
variability was more common among the current sample compared to previous samples and,
therefore, did not correlate with other variables in the expected manner due to a restricted range.

98
Another possible explanation for the lack of a relationship between within-person
variability in sleep and stress responses may be that highly variable sleep duration is related to
physiological dysregulation at the circadian level rather than a physiological response measured
on one isolated (and diurnal) occasion. For instance, repetitive, abrupt shifts in the sleep-wake
schedule, as would occur in an individual with high nightly variability in sleep duration, may
lead to a dissociation of autonomic and endocrine 24-hour rhythms. Such an explanation is
consistent with previous findings of dysregulated nocturnal autonomic activity and altered 24-
hour blood pressure patterns in those with more nightly variability in sleep parameters (Mezick
et al., 2009; Mezick et al., 2011).
Results from this study suggesting that more variable actigraphy-assessed total sleep time
may provide a protective cardiovascular effect via quicker recovery of DBP following stress is
intriguing but should be interpreted with caution, given that no other studies have observed
decreased markers of cardiovascular risk among more variable sleepers (Mezick et al., 2009;
Okun et al., 2010). Indeed, within-person variability in sleep duration has only recently begun to
receive attention for its potential links with health, and more work is needed to understand
whether regularity of sleep contributes to disease risk, over and above mean sleep duration.
5.7 CARDIOVASCULAR STRESS RESPONSES AND SLEEP QUALITY
Poorer sleep quality, as reported over the week in the morning diary, was associated with lower
HF-HRV during stress tasks, as well as lower HF-HRV during stress recovery. Interestingly,
this effect was independent of actigraphy-assessed total sleep time and actigraphy-assessed sleep
efficiency. The association was also independent of depressive symptoms and reports of

99
negative affect, decreasing the likelihood that underlying mood disruption or biased reporting
style was responsible. These results suggest that aspects of sleep other than duration and
restlessness co-vary with changes in parasympathetic activity during stress. Prior studies have
not identified consistent PSG or actigraphy correlates of self-reported sleep quality. While some
show that poor sleep quality is related to PSG-assessed sleep continuity or sleep architecture
(Akerstedt, Hume, Minors, & Waterhouse, 1994; Argyropoulos et al., 2003), others fail to
observe correlations between subjective and objective indices (Buysse et al., 2008). It is possible
that poor sleep quality reflects less commonly studied aspects of the polysomnogram, such as
indices obtained using spectral EEG analysis (i.e., beta power, which has been found to be
elevated in those with subjective sleep complaints; Hall et al., 2007; Krystal, Edinger,
Wohlgemuth, & March, 2002). It is also likely that the factors that contribute to poor sleep
quality differ between individuals. Poor sleep quality and subjective sleep complaints have been
linked to a variety of health outcomes, including the metabolic syndrome, hypertension, coronary
artery disease, and cardiac events (Grandner, Jackson, Pak, & Gehrman, 2011; Jennings,
Muldoon, Hall, Buysse, & Manuck, 2007; Nicholson, Fuhrer, & Marmot, 2005; Phillips &
Mannino, 2007). Results from the current study suggest that the parasympathetic stress response
should be studied as a potential pathway linking sleep quality to cardiometabolic outcomes.

100
5.8 LIMITATIONS
The current study has several limitations. First, there was some overlap in actigraphy-assessed
total sleep time between those endorsing ≤ 6 hours of sleep per night and those endorsing 7-8
hours. Thus, the two groups were not as different in their sleep duration as was intended in the
original study design. The method of assessing sleep duration was chosen in part to reflect the
questionnaires used in epidemiological studies linking sleep duration to CVD. However, an
extreme groups approach to selecting participants, as was used in the current study, has several
statistical limitations. Preacher, MacCallum, Rucker, & Nicewander (2005) point out that
selecting individuals based on extreme scores may result in inflated effect sizes and model
misspecification. Thus, future work on self-reported sleep duration would benefit from using a
thorough and comprehensive assessment of sleep patterns and including participants with a wide
range of sleep duration values. A detailed interview regarding sleep and wake behaviors on
weekends versus weekdays may lead to greater accuracy in estimates of sleep duration.
There were strengths and drawbacks to studying only college students. College students
tend to have relatively flexible, self-determined schedules, characterized by daytime naps and
irregular sleep patterns (Kloss, Nash, Horsey, & Taylor, 2010). On the one hand, this may have
allowed for more naturally occurring variation in sleep between individuals and an opportunity
to study the effects of naps; on the other, it is possible that participants were able to sleep in later
and minimize sleep debt. Examining a sample that is more likely to be mildly sleep deprived due
to environmental demands (i.e., working adults) might reveal stronger associations between sleep
duration and cardiovascular stress responses. The fact that all of the study participants were

101
young and free from cardiovascular disease, and nearly all were free from hypertension,
decreased the potential of underlying disease influencing cardiovascular stress responses.
As only undergraduate men participated in this study, results may not generalize to
women, individuals of different age groups and those of diverse socioeconomic backgrounds.
Gender differences in sleep exist, such that women report poorer sleep quality than men but have
longer sleep and increased sleep continuity as assessed by actigraphy and PSG (Collop, Adkins,
& Phillips, 2004; Goel, Kim, & Lao, 2005; Lauderdale et al., 2006). Moreover, there are mixed
data on whether the links between sleep characteristics and cardiovascular outcomes differ by
gender, with some studies reporting stronger effects in men (Mallon, Broman, & Hetta, 2002;
Rod et al., 2011) and others reporting stronger effects in women (Cappuccio et al., 2007;
Meisinger et al., 2007). Thus, it will be important for future studies to examine whether
relationships between multi-method assessments of short sleep and stressor-evoked
cardiovascular responses also exist in women.
The study was cross-sectional, preventing claims about the causality of the observed
relationships. The data are consistent with a model in which chronic sleep deprivation influences
cardiovascular responses to stress, and there is some evidence that experimentally manipulating
sleep influences stressor-evoked cardiovascular responses (Brindle & Conklin, 2011; Franzen et
al., 2011). It is also theoretically possible, however, that heightened cardiovascular stress
reactivity results in short, inefficient sleep. Similarly, it is unknown what proportion of
participants sleeping for shorter durations in this study were “natural” short sleepers versus
physiologically sleep deprived. There is evidence that individuals vary in their biological sleep
need (Aeschbach et al., 2003; Tucker, Dinges, & Van Dongen, 2007; Van Dongen, Baynard,
Maislin, & Dinges, 2004), and 6 hours of sleep may be sufficient for some. Thus, the current

102
results may have different implications for an individual who needs 8 hours but is sleeping for 6
hours, than for an individual with a biological sleep need of 6 hours. Participants reporting 6 or
fewer hours of sleep per night in this study reported that they wanted to continue sleeping for a
significantly longer amount of time in morning diary reports than the average length sleepers.
Self-reported short sleepers were also more likely to show a sleep pattern consistent with sleep
debt, such that their weekend sleep duration was two or more hours longer than their weeknight
sleep duration. Therefore, while the data suggest that the shorter sleepers were indeed
experiencing a greater degree of sleep debt, neither subjective nor physiological sleep need was
comprehensively assessed in this study.
Another limitation of the current study was the inability to fully delineate autonomic
processes underlying cardiovascular stress responses. Although HF-HRV is believed to reflect
vagal influence on the heart, sympathetic modulation of cardiovascular responses to stress could
not be determined. Therefore, the autonomic mechanisms accounting for delayed HR recovery
among short sleepers are unknown.
With regard to the laboratory session, each stress task was rated on valence, arousal, and
control; however, baseline ratings of these factors were not obtained, preventing analysis of task-
related changes in these dimensions. The overall laboratory session led to increases in negative
mood, and, thus, was successful in evoking changes in emotion. However, it cannot be assumed
that the tasks themselves led to acute increases in negative emotion. The computer tasks used in
this study are considered cognitive interference tests of executive attention, while the speech task
included a social-evaluative component but focused on a relatively impersonal topic. More
emotionally laden tasks - for example, those aimed at provoking interpersonal conflict or
requiring recall of highly personal, emotional material - may be differentially affected by sleep.

103
Finally, obstructive sleep apnea was not measured in this study. Obstructive sleep apnea
is an established risk factor for hypertension and cardiovascular disease (Malhotra & Loscalzo,
2009), and it is possible that sleep apnea contributed to short sleep or decreased sleep efficiency
in this sample. This study attempted to limit and account for the effects of sleep apnea by
including a self-report questionnaire of apnea risk (the MAP) and measuring BMI, which
correlates with the apnea-hypopnea index (Lam et al., 2006). Statistical adjustment for BMI or
MAP scores did not alter the associations between sleep parameters and cardiovascular stress
responses. Moreover, all associations between sleep and cardiovascular stress responses were
similar after excluding four participants who fell above the obesity cut-off. Such data decrease
the likelihood that apnea was a substantive confounder of the observed relationships.
5.9 FUTURE DIRECTIONS
Continuing work on how self-report, behavioral, and physiological assessments of sleep
differentially relate to cardiovascular risk factors will improve our understanding of how
disrupted sleep is related to cardiovascular morbidity and mortality. Future work should
combine experimental sleep manipulation, including both sleep extension and partial sleep
restriction, with more comprehensive measures of cardiovascular reactivity and recovery (i.e,
pre-ejection period as a measure of sympathetic cardiac influence; cardiac output and total
peripheral resistance as measures of myocardial versus vascular activation). Such work will help
to clarify whether sleep is causally related to stressor-evoked cardiovascular responses, as well as
104
elucidate the autonomic origins of the responses. Researchers have only recently begun to
examine how sleep restriction may influence the central pathways that regulate the stress
response (Meerlo, Sgoifo, & Suchecki, 2008; Yoo et al., 2007). Additional work focusing on
whether chronic sleep loss is related to functioning of the neural areas implicated in
cardiovascular control will provide important data regarding a potential pathway between sleep
and CVD. Studies in both animals and humans, and utilization of imaging techniques, will be
helpful in this regard.
In addition, it may be interesting to extend this work on sleep and cardiovascular
responses to other physiological stress responses. Given the observation from the current study
that sleep co-varies with vagal activity during stress, stress-induced inflammatory activity may
be a pathway of particular interest. Indeed, a recent study reported that poor sleep quality, as
assessed by the PSQI, was associated with increased interleukin-6 responses to cognitive stress
in older adults after adjustment for age, BMI, and a variety of psychosocial attributes (Heffner et
al., 2012). Thus, future work may wish to examine if links between actigraphy-assessed sleep
and inflammatory stress responses exist in younger populations.
As argued by van Dongen, Vitellaro, & Dinges (2005), there may be wide variability in
what is considered “normal” for a number of sleep parameters, including sleep duration. Thus, it
is possible that some individuals are more vulnerable to the cardiovascular consequences of short
sleep than others. Going forward, it will be important to assess aspects of sleep debt in addition
to duration alone. More complex questions include examining whether cardiovascular stress
responses following sleep deprivation differ between groups with varying physiological sleep
requirements, using markers that have been proposed in previous work (e.g., indices of sleep
pressure, sleepiness, or cognitive impairment following sleep deprivation, polymorphisms in

105
genes associated with sleep homeostasis; Vandewalle et al., 2009; Van Dongen, Vitellaro, &
Dinges, 2005). Those individuals who are more physiologically reactive following sleep
deprivation may also be more likely to develop cardiovascular morbidity associated with short
sleep duration.
Future work should also consider chronobiological factors when studying sleep and
cardiovascular stress responses. For one, individuals’ circadian preference, or morningness
versus eveningness, may affect both sleep duration as well as cardiovascular responses to stress,
with some recent evidence suggesting evening types may be more reactive (Roeser et al., 2012)
(i.e., in the current study, it is possible that participants characterized as Evening types had
shorter sleep and showed more cardiovascular reactivity than Morning type participants). At the
least, a measure such as the Morning-Eveningness Questionnaire (Horne & Ostberg, 1976) could
be included as a statistical covariate in future work. More extensive possibilities include using
an experimental design to investigate the relationship between sleep characteristics and
cardiovascular stress responses at different points in the circadian period. For instance, a
plausible hypothesis is that those who are more reactive in the evening than in the morning also
will have the shortest sleep duration.
It is critical to determine whether links between sleep and cardiovascular stress responses
are similar in other populations. As previously mentioned, sleep duration and continuity differ
between sociodemographic groups. Men have shorter, more fragmented sleep than women, and
African Americans have shorter, more fragmented sleep than Caucasians (Lauderdale et al.,
2006; Mezick et al., 2007). Intriguing questions for the future include whether or not sleep
duration is more or less strongly associated with health outcomes in different sociodemographic
groups, and whether sleep may partially mediate health disparities that exist between these

106
groups. Finally, there was some evidence that shorter actigraphy-assessed sleep mediates the
associations between indices of stress and HF-HRV levels during laboratory stressors. Future
work may want to investigate disrupted sleep as a pathway linking increased chronic stress to
cardiovascular and metabolic outcomes.
5.10 SUMMARY
Prior data has demonstrated that sleep deprivation has an activating effect on the body’s
autonomic stress system, as characterized by overall elevations in heart rate and blood pressure,
and decreases in parasympathetic tone. However, fewer studies have considered how sleep loss
relates to the dynamic response of the autonomic system when faced with a threat or challenge.
Given the literature linking short or disrupted sleep to increased perceptions of stress, emotional
reactivity, and altered brain activity (Hamilton et al., 2007; Kumari et al., 2009; Morin et al,
2003; Zohar et al., 2005), a cycle in which short sleep leads to heightened stress and heightened
cardiovascular reactivity, and increased stress reactivity disrupts ensuing sleep, is not difficult to
imagine. Indeed, two previous studies have demonstrated that disrupted sleep is related to an
exaggerated cardiovascular stress response in clinical populations (Palesh et al., 2008; Stepanski
et al., 1994). The current study sought to determine whether naturally occurring variation in
sleep duration and continuity were similarly related to exaggerated and prolonged cardiovascular
stress responses in a healthy, young sample.

107
Results from this study showed that undergraduate men who reported typically sleeping less
than 6 hours over the past month had higher HR following mental stress than those who reported
sleeping 7-8 hours. Other indices of cardiovascular stress reactivity and recovery did not differ
between self-reported sleep duration groups. When self-reported sleep duration was examined as
a continuous variable, however, shorter sleep was also related to decreased parasympathetic
cardiac influence during stress, as assessed by high-frequency heart rate variability. In terms of
objectively assessed sleep, shorter actigraphy-assessed total sleep time over the week preceding
stress tasks was associated with exaggerated reductions in HF-HRV during psychological stress,
along with higher HR and diastolic BP during stress recovery. Most relationships were
independent of age, race, body mass index, and respiration rate, as well as a number of
psychosocial attributes and health behaviors. The link between actigraphy-assessed total sleep
time and HR recovery, however, was no longer significant after actigraphy-assessed naps were
included as a covariate. Similar associations were observed between actigraphy-assessed sleep
efficiency and cardiovascular reactions to stress: decreased efficiency was related to exaggerated
HF-HRV reactivity and elevated HR recovery. Participants were by and large in good
cardiovascular health, had no diagnosed sleep disorders, and were not using cardiovascular or
sleep medications.
Overall, these results are consistent with a model in which short, inefficient sleep interacts
with psychological stress to affect cardiovascular activity, particularly HF-HRV and HR. Taken
together with experimental work in animals and humans showing that sleep deprivation
influences the cardiovascular stress response (Franzen et al., 2011; Sgoifo et al., 2006), the data
provide initial support for the hypothesis that daily stress responses may constitute one pathway
linking short, inefficient, or poor quality sleep to cardiovascular disease. Given that the specific

108
cardiovascular indices related to sleep vary between studies, additional research will be needed
to identify the most consistent autonomic correlates of disrupted sleep. Moreover, associations
between sleep and cardiovascular stress responses, as well as cardiovascular outcomes, vary
depending on the manner in which sleep is assessed. Therefore, it is important for future work to
incorporate multiple methods of sleep assessment, including subjective and objective measures,
when possible.
Chronically restricted sleep is an increasingly common occurrence, with 14% of the
population reporting that they typically sleep less than 6 hours on weeknights and about two-
thirds of the population (63%) reporting that they need more sleep overall (NSF, 2011).
Moreover, 43% of adults state that they “never” or “rarely” have good sleep on weeknights
(NSF, 2011). Thus, the question of how sleep loss and disrupted sleep quality affect physiology
may have wide-reaching implications. Associations between short or fragmented sleep and
cardiovascular outcomes have been supported in multiple studies (Cappuccio et al., 2011;
Knutson, 2010). Thus, the next steps for researchers include identifying the mechanisms
accounting for this relationship and investigating moderators of these links. Ultimately, it is
essential to determine whether or not sleep disruption is causally related to cardiovascular
disease, as this information may lead to more efficacious treatment and preventative strategies
for heart disease and related disorders.
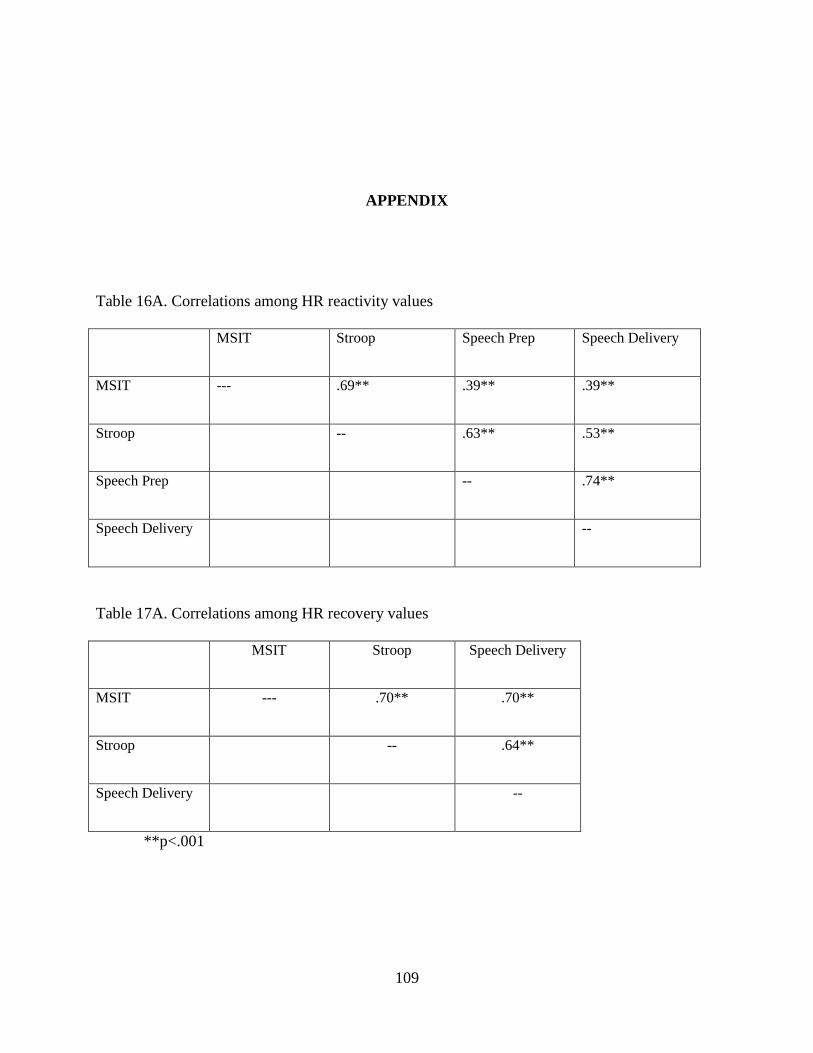
109
APPENDIX
Table 16A. Correlations among HR reactivity values
MSIT Stroop Speech Prep Speech Delivery
MSIT --- .69** .39** .39**
Stroop -- .63** .53**
Speech Prep -- .74**
Speech Delivery --
Table 17A. Correlations among HR recovery values
MSIT Stroop Speech Delivery
MSIT --- .70** .70**
Stroop -- .64**
Speech Delivery --
**p<.001

110
Table 18A. Correlations among HF-HRV reactivity values
MSIT Stroop Speech Prep Speech Delivery
MSIT --- .90** .67** .69**
Stroop -- .71** .76**
Speech Prep -- .81**
Speech Delivery --
Table 19A. Correlations among HF-HRV recovery values
MSIT Stroop Speech Delivery
MSIT --- .92** .92**
Stroop -- .89**
Speech Delivery --
**p<.001

111
Table 20A. Correlations among BP reactivity values
MSIT
SBP
Stroop
SBP
Prep
SBP
Speech
SBP
MSIT
DBP
Stroop
DBP
Prep
DBP
Speech
DBP
MSIT SBP --- .56** .41** .40** .60** .31* .27* .22‡
Stroop SBP -- .44** .46** .32* .51** .34* .20‡
Prep SBP -- .59** .19‡ .30* .42** .30*
Speech SBP -- .38** .38** .49** .67**
MSIT DBP -- .50** .44** .48**
Stroop DBP -- .38** .35*
Prep DBP -- .57**
Speech DBP --
**p≤ .001, *p ≤ .05, ‡ p ≤ .10

112
Table 21A. Correlations among BP recovery values
MSIT
SBP
Stroop
SBP
Speech
SBP
MSIT
DBP
Stroop
DBP
Speech
DBP
MSIT SBP --- .57** .51** .35* .09 .21‡
Stroop SBP -- .44** .18‡ .14 .13
Speech SBP -- .23* .09 .38**
MSIT DBP -- .53** .48**
Stroop DBP -- .28*
Speech DBP --
**p≤ .001, *p ≤ .05, ‡ p ≤ .10

113
Table 22A. Correlations between actigraphy sleep variables and psychosocial and self-reported
sleep
‡ p < .10, *p ≤ .05, ** p ≤ .01
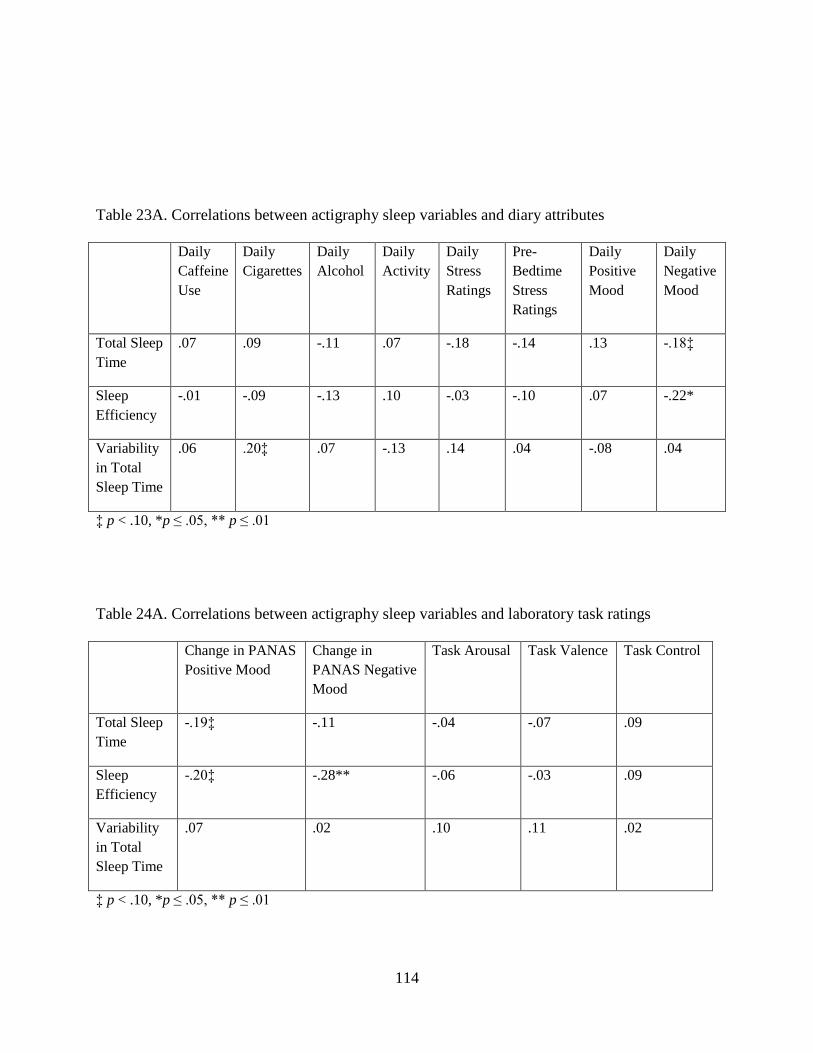
114
Table 23A. Correlations between actigraphy sleep variables and diary attributes
Daily
Caffeine
Use
Daily
Cigarettes
Daily
Alcohol
Daily
Activity
Daily
Stress
Ratings
Pre-
Bedtime
Stress
Ratings
Daily
Positive
Mood
Daily
Negative
Mood
Total Sleep
Time
.07 .09 -.11 .07 -.18 -.14 .13 -.18‡
Sleep
Efficiency
-.01 -.09 -.13 .10 -.03 -.10 .07 -.22*
Variability
in Total
Sleep Time
.06 .20‡ .07 -.13 .14 .04 -.08 .04
‡ p < .10, *p ≤ .05, ** p ≤ .01
Table 24A. Correlations between actigraphy sleep variables and laboratory task ratings
Change in PANAS
Positive Mood
Change in
PANAS Negative
Mood
Task Arousal Task Valence Task Control
Total Sleep
Time
-.19‡ -.11 -.04 -.07 .09
Sleep
Efficiency
-.20‡ -.28** -.06 -.03 .09
Variability
in Total
Sleep Time
.07 .02 .10 .11 .02
‡ p < .10, *p ≤ .05, ** p ≤ .01

115
Table 25A. Correlations between laboratory task ratings and cardiovascular stress responses
Change in
PANAS
Positive Mood
Change in
PANAS
Negative Mood
Task Arousal Task
Valence
Task Control
HR Reactivity .13 .07 .33** -.07 -.08
HR Recovery .24* .18 .04 .04 .15
HF-HRV Reactivity -.16 -.08 -.21‡ -.14 -.18
HF-HRV Recovery -.17 .16 -.04 -.28** -.08
SBP Reactivity -.02 .04 .23* -.07 -.10
SBP Recovery -.05 -.02 -.05 -.12 -.10
DBP Reactivity .15 .20‡ .26* .004 -.06
DBP Recovery .20 -.15 .25* -.08 -.07
‡ p < .10, *p ≤ .05, ** p ≤ .01

116
Sample Sleep Diary: Evening
Please complete this page immediately before going to bed.
Day of the week: _____________________________
Date: _______________________________________
Today I had:
# in the morning (first ~4 hrs of my day)
# in the afternoon (middle of my day)
# in the evening (last 4 hrs before bed)
Caffeinated drinks _______ _______ _______
Alcoholic drinks _______ _______ _______
Cigarettes or other tobacco products _______ _______ _______
How long (in mins) did you nap? _______ mins
_______ mins
_______ mins
_______ mins
_______ mins
_______ mins
I took the following medications: _____________________ Amt. of Dose: ______
_____________________ Amt. of Dose: ______
The most vigorous physical activity that I did today was: None Light Medium Heavy
Altogether, this activity lasted approximately ________ minutes.
Please use the following scale to rate your mood since you woke up this morning. Think about
your general mood throughout the day. Since waking this morning, I have felt:
happy/cheerful 1 = not at all 2 = a little 3 = moderately 4 = a lot 5 = extremely
energetic/lively 1 = not at all 2 = a little 3 = moderately 4 = a lot 5 = extremely
calm/at ease 1 = not at all 2 = a little 3 = moderately 4 = a lot 5 = extremely
angry/resentful 1 = not at all 2 = a little 3 = moderately 4 = a lot 5 = extremely
depressed/sad 1 = not at all 2 = a little 3 = moderately 4 = a lot 5 = extremely
tense/nervous 1 = not at all 2 = a little 3 = moderately 4 = a lot 5 = extremely
Overall, today was:
not at all stressful a little stressful moderately stressful extremely stressful
Right now, I feel
not at all stressed a little stressed moderately stressed extremely stressed
Did you take off the actiwatch today? Yes No
If Yes, please record any times you took off the actiwatch below:
OFF: _______ AM/PM ON: _______ AM/PM OFF: ______ AM/PM ON: _______AM/PM

117
Sample Sleep Diary: Morning
Please complete this page immediately upon waking.
Day of the week: _____________________________
Date: _______________________________________
Last night I got into bed at: _____:_____ PM / AM (i.e., reading, watching TV)
I first tried to fall asleep at: _____:_____ PM / AM
I finally fell asleep at: _____:_____ PM / AM
After I first fell asleep, I woke up __________ times
Altogether, these awakenings lasted __________ minutes
This morning, I finally woke at: __________ AM / PM
I actually got out of bed to start my day at: __________ AM / PM
Ideally, I would have liked to sleep for ______ more hours than I did.
The main reason I slept less than I would have liked is (circle one):
school/work demands social activity (spending time with friends) worry/anxiety
partner’s sleep schedule couldn’t fall/stay asleep Other: ____________
The quality of my sleep last night was:
very bad somewhat bad average somewhat good very good

118
BIBLIOGRAPHY
Aeschbach, D., Sher, L., Postolache, T. T., Matthews, J. R., Jackson, M. A., & Wehr, T. A.
(2003). A longer biological night in long sleepers than in short sleepers. The Journal of
Clinical Endocrinology and Metabolism, 88(1), 26-30.
Akerstedt, T. (1979). Altered sleep/wake patterns and circadian rhythms. laboratory and field
studies of sympathoadrenomedullary and related variables. Acta Physiologica
Scandinavica.Supplementum, 469, 1-48.
Akerstedt, T., Hume, K., Minors, D., & Waterhouse, J. (1994). The meaning of good sleep: A
longitudinal study of polysomnography and subjective sleep quality. Journal of Sleep
Research, 3(3), 152-158.
Arble, D. M., Ramsey, K. M., Bass, J., & Turek, F. W. (2010). Circadian disruption and
metabolic disease: Findings from animal models. Best Practice & Research.Clinical
Endocrinology & Metabolism, 24(5), 785-800. doi:10.1016/j.beem.2010.08.003
Argyropoulos, S. V., Hicks, J. A., Nash, J. R., Bell, C. J., Rich, A. S., Nutt, D. J., & Wilson, S. J.
(2003). Correlation of subjective and objective sleep measurements at different stages of the
treatment of depression. Psychiatry Research, 120(2), 179-190.
Ayas, N. T., White, D. P., Manson, J. E., Stampfer, M. J., Speizer, F. E., Malhotra, A., & Hu, F.
B. (2003). A prospective study of sleep duration and coronary heart disease in women.
Archives of Internal Medicine, 163(2), 205-209.
Barnett, K. J., & Cooper, N. J. (2008). The effects of a poor night sleep on mood, cognitive,
autonomic and electrophysiological measures. Journal of Integrative Neuroscience, 7(3),
405-420.
Bernston, G. G., Cacioppo, J. T., Quigley, K. S., & Fabro, V. T. (1994). Autonomic space and
psychophysiological response. Psychophysiology, 31(1), 44-61.
Black, H. R. (2004). The paradigm has shifted to systolic blood pressure. Journal of Human
Hypertension, 18 Suppl 2, S3-7. doi:10.1038/sj.jhh.1001795
Bonnet, M. H., & Arand, D. L. (1998). Heart rate variability in insomniacs and matched normal
sleepers. Psychosomatic Medicine, 60(5), 610-615.

119
Borghi, C., Costa, F. V., Boschi, S., Mussi, A., & Ambrosioni, E. (1986). Predictors of stable
hypertension in young borderline subjects: A five-year follow-up study. Journal of
Cardiovascular Pharmacology, 8 Suppl 5, S138-41.
Brindle, R. C. & Conklin, S. M. (2012). Daytime sleep accelerates cardiovascular recovery after
psychological stress. International Journal of Behavioral Medicine, 19(1), 111-114.
Brosschot, J. F., Pieper, S., & Thayer, J. F. (2005). Expanding stress theory: Prolonged activation
and perseverative cognition. Psychoneuroendocrinology, 30(10), 1043-1049. doi:10.1016/
j.psyneuen.2005.04.008
Brosschot, J. F., Van Dijk, E., & Thayer, J. F. (2007). Daily worry is related to low heart rate
variability during waking and the subsequent nocturnal sleep period. International Journal
of Psychophysiology : Official Journal of the International Organization of
Psychophysiology, 63(1), 39-47. doi:10.1016/j.ijpsycho.2006.07.016
Brown, F. C., Buboltz, W. C.,Jr, & Soper, B. (2002). Relationship of sleep hygiene awareness,
sleep hygiene practices, and sleep quality in university students. Behavioral Medicine
(Washington, D.C.), 28(1), 33-38. doi:10.1080/08964280209596396
Burgess, H. J., Trinder, J., Kim, Y., & Luke, D. (1997). Sleep and circadian influences on
cardiac autonomic nervous system activity. The American Journal of Physiology, 273(4 Pt
2), H1761-8.
Buysse, D. J., Cheng, Y., Germain, A., Moul, D. E., Franzen, P. L., Fletcher, M., & Monk, T. H.
(2010). Night-to-night sleep variability in older adults with and without chronic insomnia.
Sleep Medicine, 11(1), 56-64. doi:10.1016/j.sleep.2009.02.010
Buysse, D. J., Hall, M. L., Strollo, P. J., Kamarck, T. W., Owens, J., Lee, L., . . . Matthews, K.
A. (2008). Relationships between the Pittsburgh Sleep Quality Index (PSQI), Epworth
Sleepiness Scale (ESS), and clinical/polysomnographic measures in a community sample.
Journal of Clinical Sleep Medicine : JCSM : Official Publication of the American Academy
of Sleep Medicine, 4(6), 563-571.
Buysse, D. J., Reynolds, C. F.,3rd, Monk, T. H., Berman, S. R., & Kupfer, D. J. (1989). The
Pittsburgh Sleep Quality Index: A new instrument for psychiatric practice and research.
Psychiatry Research, 28(2), 193-213.
Cappuccio, F. P., Cooper, D., D'Elia, L., Strazzullo, P., & Miller, M. A. (2011). Sleep duration
predicts cardiovascular outcomes: A systematic review and meta-analysis of prospective
studies. European Heart Journal, 32(12), 1484-1492. doi:10.1093/eurheartj/ehr007
Carroll, D., Phillips, A. C., Hunt, K., & Der, G. (2007). Symptoms of depression and
cardiovascular reactions to acute psychological stress: Evidence from a population study.
Biological Psychology, 75(1), 68-74. doi:10.1016/j.biopsycho.2006.12.002

120
Carskadon, M. A., & Davis, S. S. (1989). Sleep–wake patterns in the high-school-to-college
transition:Preliminary data. Sleep Research, 18, 113.
Carter, N. L., Hunyor, S. N., Crawford, G., Kelly, D., & Smith, A. J. (1994). Environmental
noise and sleep--a study of arousals, cardiac arrhythmia and urinary catecholamines. Sleep,
17(4), 298-307.
Chen, J. C., Brunner, R. L., Ren, H., Wassertheil-Smoller, S., Larson, J. C., Levine, D. W., . . .
Stefanick, M. L. (2008). Sleep duration and risk of ischemic stroke in postmenopausal
women. Stroke; a Journal of Cerebral Circulation, 39(12), 3185-3192. doi:10.1161/
STROKEAHA.108.521773
Cheng, Y. J., Lauer, M. S., Earnest, C. P., Church, T. S., Kampert, J. B., Gibbons, L. W., &
Blair, S. N. (2003). Heart rate recovery following maximal exercise testing as a predictor of
cardiovascular disease and all-cause mortality in men with diabetes. Diabetes Care, 26(7),
2052-2057.
Chida, Y., & Hamer, M. (2008). Chronic psychosocial factors and acute physiological responses
to laboratory-induced stress in healthy populations: A quantitative review of 30 years of
investigations. Psychological Bulletin, 134(6), 829-885. doi:10.1037/a0013342
Chida, Y., & Steptoe, A. (2010). Greater cardiovascular responses to laboratory mental stress are
associated with poor subsequent cardiovascular risk status: A meta-analysis of prospective
evidence. Hypertension, 55(4), 1026-1032. doi:10.1161/HYPERTENSIONAHA.109.
146621
Chida, Y., & Steptoe, A. (2010). Stress reactivity and its association with increased
cardiovascular risk: A role for the sympathetic nervous system? Hypertension,
doi:10.1161/HYPERTENSIONAHA.110.154104
Clarkson, T. B., Kaplan, J. R., Adams, M. R., & Manuck, S. B. (1987). Psychosocial influences
on the pathogenesis of atherosclerosis among nonhuman primates. Circulation, 76(1 Pt 2),
I29-40.
Cole, C. R., Blackstone, E. H., Pashkow, F. J., Snader, C. E., & Lauer, M. S. (1999). Heart-rate
recovery immediately after exercise as a predictor of mortality. The New England Journal of
Medicine, 341(18), 1351-1357. doi:10.1056/NEJM199910283411804
Cook, W. W. & Medley, D. M. (1954). Proposed hostility an pharisaic-virtue scales for
the MMPI. Journal of Applied Psychology, 38, 414-418.
Dekker, J. M., Crow, R. S., Folsom, A. R., Hannan, P. J., Liao, D., Swenne, C. A., & Schouten,
E. G. (2000). Low heart rate variability in a 2-minute rhythm strip predicts risk of coronary
heart disease and mortality from several causes: The ARIC study. atherosclerosis risk in
communities. Circulation, 102(11), 1239-1244.

121
DiLorenzo, L., De Pergola, G., Zocchetti, C., L’Abbate, N., Basso, A., Pannacciulli, N., et al.
(2003). Effect of shift work on body mass index: results of a study performed in 319
glucose-tolerant men working in a Southern Italian industry. International Journal of
Obesity, 27, 1353-1358.
Dimsdale, J. E., & Herd, J. A. (1982). Variability of plasma lipids in response to emotional
arousal. Psychosomatic Medicine, 44(5), 413-430.
Egizio, V. B., Jennings, J. R., Christie, I. C., Sheu, L. K., Matthews, K. A., & Gianaros, P. J.
(2008). Cardiac vagal activity during psychological stress varies with social functioning in
older women. Psychophysiology, 45(6), 1046-1054. doi:10.1111/j.1469-8986.2008.00698.x
El-Sheikh, M., & Buckhalt, J. A. (2005). Vagal regulation and emotional intensity predict
children's sleep problems. Developmental Psychobiology, 46(4), 307-317. doi:10.1002/
dev.20066
Fang, S. C., Huang, C. J., Yang, T. T., & Tsai, P. S. (2008). Heart rate variability and daytime
functioning in insomniacs and normal sleepers: Preliminary results. Journal of
Psychosomatic Research, 65(1), 23-30. doi:10.1016/j.jpsychores.2008.02.003
Ferrie, J. E., Shipley, M. J., Cappuccio, F. P., Brunner, E., Miller, M. A., Kumari, M., &
Marmot, M. G. (2007). A prospective study of change in sleep duration: associations with
mortality in the Whitehall II cohort. Sleep, 30(12), 1659-1666.
Feldman, P. J., Cohen, S., Lepore, S. J., Matthews, K. A., Kamarck, T. W., & Marsland, A. L.
(1999). Negative emotions and acute physiological responses to stress. Annals of Behavioral
Medicine : A Publication of the Society of Behavioral Medicine, 21(3), 216-22; discussion
223-6.
Franklin, S. S., Larson, M. G., Khan, S. A., Wong, N. D., Leip, E. P., Kannel, W. B., & Levy, D.
(2001). Does the relation of blood pressure to coronary heart disease risk change with
aging? the framingham heart study. Circulation, 103(9), 1245-1249.
Franzen, P. L., Buysse, D. J., Dahl, R. E., Thompson, W., & Siegle, G. J. (2009). Sleep
deprivation alters pupillary reactivity to emotional stimuli in healthy young adults.
Biological Psychology, 80(3), 300-305. doi:10.1016/j.biopsycho.2008.10.010
Franzen, P. L., Gianaros, P. J., Marsland, A. L., Hall, M. H., Siegle, G. J., Dahl, R. E., & Buysse,
D. J. (2011). Cardiovascular reactivity to acute psychological stress following sleep
deprivation. Psychosomatic Medicine, 73(8), 679-682. doi:10.1097/PSY.0b013e31822ff440
Friedman, E. M., Hayney, M. S., Love, G. D., Urry, H. L., Rosenkranz, M. A., Davidson, R. J., .
. . Ryff, C. D. (2005). Social relationships, sleep quality, and interleukin-6 in aging women.
Proceedings of the National Academy of Sciences of the United States of America, 102(51),
18757-18762. doi:10.1073/pnas.0509281102

122
Friedman, O., Bradley, T. D., Ruttanaumpawan, P., & Logan, A. G. (2010). Independent
association of drug-resistant hypertension to reduced sleep duration and efficiency.
American Journal of Hypertension, 23(2), 174-179. doi:10.1038/ajh.2009.220
Friedman, O., Shukla, Y., & Logan, A. G. (2009). Relationship between self-reported sleep
duration and changes in circadian blood pressure. American Journal of Hypertension,
22(11), 1205-1211. doi:10.1038/ajh.2009.165
Fujino, Y., Iso, H., Tamakoshi, A., Inaba, Y., Koizumi, A., Kubo, T., . . . Japanese Collaborative
Cohort Study Group. (2006). A prospective cohort study of shift work and risk of ischemic
heart disease in japanese male workers. American Journal of Epidemiology, 164(2), 128-
135. doi:10.1093/aje/kwj185
Fuligni, A.J. & Hardway, C. (2006). Daily variation in adolescents’ sleep, activities, and
psychological well-being. Journal of Research on Adolescence, 16(3), 353-378.
Gallicchio, L., & Kalesan, B. (2009). Sleep duration and mortality: A systematic review and
meta-analysis. Journal of Sleep Research, 18(2), 148-158. doi:10.1111/j.1365-2869.
2008.00732.x
Gangwisch, J. E., Heymsfield, S. B., Boden-Albala, B., Buijs, R. M., Kreier, F., Pickering, T. G.,
. . . Malaspina, D. (2006). Short sleep duration as a risk factor for hypertension: Analyses of
the first national health and nutrition examination survey. Hypertension, 47(5), 833-839.
doi:10.1161/01.HYP.0000217362.34748.e0
Gangwisch, J. E., Malaspina, D., Posner, K., Babiss, L. A., Heymsfield, S. B., Turner, J. B., . . .
Pickering, T. G. (2010). Insomnia and sleep duration as mediators of the relationship
between depression and hypertension incidence. American Journal of Hypertension, 23(1),
62-69. doi:10.1038/ajh.2009.202
Gerin, W., & Pickering, T. G. (1995). Association between delayed recovery of blood pressure
after acute mental stress and parental history of hypertension. Journal of Hypertension,
13(6), 603-610.
Gianaros, P. J., Salomon, K., Zhou, F., Owens, J. F., Edmundowicz, D., Kuller, L. H., &
Matthews, K. A. (2005). A greater reduction in high-frequency heart rate variability to a
psychological stressor is associated with subclinical coronary and aortic calcification in
postmenopausal women. Psychosomatic Medicine, 67(4), 553-560. doi:10.1097/01.psy.
0000170335.92770.7a
Gianaros, P. J., Sheu, L. K., Matthews, K. A., Jennings, J. R., Manuck, S. B., & Hariri, A. R.
(2008). Individual differences in stressor-evoked blood pressure reactivity vary with
activation, volume, and functional connectivity of the amygdala. The Journal of
Neuroscience : The Official Journal of the Society for Neuroscience, 28(4), 990-999.
doi:10.1523/JNEUROSCI.3606-07.2008

123
Gianaros, P. J., Sheu, L. K., Remo, A. M., Christie, I. C., Crtichley, H. D., & Wang, J. (2009).
Heightened resting neural activity predicts exaggerated stressor-evoked blood pressure
reactivity. Hypertension, 53(5), 819-825. doi:10.1161/HYPERTENSIONAHA.108.126227
Goel, N., Kim, H., & Lao, R. P. (2005). Gender differences in polysomnographic sleep in young
healthy sleepers. Chronobiology International, 22(5), 905-915. doi:10.1080/
07420520500263235
Grandner, M. A., Jackson, N. J., Pak, V. M., & Gehrman, P. R. (2011). Sleep disturbance is
associated with cardiovascular and metabolic disorders. Journal of Sleep Research,
doi:10.1111/j.1365-2869.2011.00990.x; 10.1111/j.1365-2869.2011.00990.x
Hall, M., Baum, A., Buysse, D. J., Prigerson, H. G., Kupfer, D. J., & Reynolds, C. F.,3rd. (1998).
Sleep as a mediator of the stress-immune relationship. Psychosomatic Medicine, 60(1), 48-
51.
Hall, M., Buysse, D. J., Nofzinger, E. A., Reynolds, C. F.,3rd, Thompson, W., Mazumdar, S., &
Monk, T. H. (2008). Financial strain is a significant correlate of sleep continuity
disturbances in late-life. Biological Psychology, 77(2), 217-222. doi:10.1016/j.biopsycho.
2007.10.012
Hall, M., Thayer, J. F., Germain, A., Moul, D., Vasko, R., Puhl, M., . . . Buysse, D. J. (2007).
Psychological stress is associated with heightened physiological arousal during NREM sleep
in primary insomnia. Behavioral Sleep Medicine, 5(3), 178-193. doi:10.1080/
15402000701263221
Hall, M., Vasko, R., Buysse, D., Ombao, H., Chen, Q., Cashmere, J. D., . . . Thayer, J. F. (2004).
Acute stress affects heart rate variability during sleep. Psychosomatic Medicine, 66(1), 56-
62.
Hall, M. H., Muldoon, M. F., Jennings, J. R., Buysse, D. J., Flory, J. D., & Manuck, S. B. (2008).
Self-reported sleep duration is associated with the metabolic syndrome in midlife adults.
Sleep, 31(5), 635-643.
Hamilton, N. A., Affleck, G., Tennen, H., Karlson, C., Luxton, D., Preacher, K. J., & Templin, J.
L. (2008). Fibromyalgia: The role of sleep in affect and in negative event reactivity and
recovery. Health Psychology : Official Journal of the Division of Health Psychology,
American Psychological Association, 27(4), 490-497. doi:10.1037/0278-6133.27.4.490
Hamilton, N. A., Catley, D., & Karlson, C. (2007). Sleep and the affective response to stress and
pain. Health Psychology : Official Journal of the Division of Health Psychology, American
Psychological Association, 26(3), 288-295. doi:10.1037/0278-6133.26.3.288
Hamilton, N. A., Catley, D., & Karlson, C. (2007). Sleep and the affective response to stress and
pain. Health Psychology : Official Journal of the Division of Health Psychology, American
Psychological Association, 26(3), 288-295. doi:10.1037/0278-6133.26.3.288

124
Hassellund, S. S., Flaa, A., Sandvik, L., Kjeldsen, S. E., & Rostrup, M. (2010). Long-term
stability of cardiovascular and catecholamine responses to stress tests: An 18-year follow-up
study. Hypertension, 55(1), 131-136. doi:10.1161/HYPERTENSIONAHA.109.143164
Heffner, K. L., Ng, H. M., Suhr, J. A., France, C. R., Marshall, G. D., Pigeon, W. R., &
Moynihan, J. A. (2012). Sleep disturbance and older adults' inflammatory responses to acute
stress. The American Journal of Geriatric Psychiatry : Official Journal of the American
Association for Geriatric Psychiatry, doi:10.1097/JGP.0b013e31824361de
Heponiemi, T., Elovainio, M., Pulkki, L., Puttonen, S., Raitakari, O., & Keltikangas-Jarvinen, L.
(2007). Cardiac autonomic reactivity and recovery in predicting carotid atherosclerosis: The
cardiovascular risk in young finns study. Health Psychology : Official Journal of the
Division of Health Psychology, American Psychological Association, 26(1), 13-21.
doi:10.1037/0278-6133.26.1.13
Horne, J. A., & Ostberg, O. (1976). A self-assessment questionnaire to determine morningness-
eveningness in human circadian rhythms. International Journal of Chronobiology, 4(2), 97-
110.
Htoo, A., Talwar, A., Feinsilver, S. H., & Greenberg, H. (2004). Smoking and sleep disorders.
The Medical Clinics of North America, 88(6), 1575-91, xii. doi:10.1016/j.mcna.2004.07.003
Huikuri, H. V., Jokinen, V., Syvanne, M., Nieminen, M. S., Airaksinen, K. E., Ikaheimo, M. J., .
. . Frick, M. H. (1999). Heart rate variability and progression of coronary atherosclerosis.
Arteriosclerosis, Thrombosis, and Vascular Biology, 19(8), 1979-1985.
Ikehara, S., Iso, H., Date, C., Kikuchi, S., Watanabe, Y., Wada, Y., . . . JACC Study Group.
(2009). Association of sleep duration with mortality from cardiovascular disease and other
causes for japanese men and women: The JACC study. Sleep, 32(3), 295-301.
Imai, K., Sato, H., Hori, M., Kusuoka, H., Ozaki, H., Yokoyama, H., . . . Kamada, T. (1994).
Vagally mediated heart rate recovery after exercise is accelerated in athletes but blunted in
patients with chronic heart failure. Journal of the American College of Cardiology, 24(6),
1529-1535.
Irwin, M., Thompson, J., Miller, C., Gillin, J. C., & Ziegler, M. (1999). Effects of sleep and sleep
deprivation on catecholamine and interleukin-2 levels in humans: Clinical implications. The
Journal of Clinical Endocrinology and Metabolism, 84(6), 1979-1985.
James, J. E., & Gregg, M. E. (2004). Hemodynamic effects of dietary caffeine, sleep restriction,
and laboratory stress. Psychophysiology, 41(6), 914-923. doi:10.1111/j.1469-
8986.2004.00248.x
Jamieson, J. L., & Lavoie, N. F. (1987). Type A behavior, aerobic power, and cardiovascular
recovery from a psychosocial stressor. Health Psychology : Official Journal of the Division
of Health Psychology, American Psychological Association, 6(4), 361-371.

125
Javaheri, S., Storfer-Isser, A., Rosen, C. L., & Redline, S. (2008). Sleep quality and elevated
blood pressure in adolescents. Circulation, 118(10), 1034-1040. doi:10.1161/
CIRCULATIONAHA.108.766410
Jennings, J. R., Kamarck, T. W., Everson-Rose, S. A., Kaplan, G. A., Manuck, S. B., & Salonen,
J. T. (2004). Exaggerated blood pressure responses during mental stress are prospectively
related to enhanced carotid atherosclerosis in middle-aged finnish men. Circulation,
110(15), 2198-2203. doi:10.1161/01.CIR.0000143840.77061.E9
Johns, M. W. (1991). A new method for measuring daytime sleepiness: The epworth sleepiness
scale. Sleep, 14(6), 540-545.
Kang, J. H., & Chen, S. C. (2009). Effects of an irregular bedtime schedule on sleep quality,
daytime sleepiness, and fatigue among university students in taiwan. BMC Public Health, 9,
248. doi:10.1186/1471-2458-9-248
Kato, M., Phillips, B. G., Sigurdsson, G., Narkiewicz, K., Pesek, C. A., & Somers, V. K. (2000).
Effects of sleep deprivation on neural circulatory control. Hypertension, 35(5), 1173-1175.
Kawabe, H., & Saito, I. (2008). Does short sleep duration in daily life affect morning home
blood pressure? evaluation in japanese people. Clinical and Experimental Hypertension
(New York, N.Y.: 1993), 30(3), 183-190. doi:10.1080/10641960802064575
Kawachi, I., Colditz, G. A., Stampfer, M. J., Willett, W. C., Manson, J. E., Speizer, F. E., &
Hennekens, C. H. (1995). Prospective study of shift work and risk of coronary heart disease
in women. Circulation, 92(11), 3178-3182.
Khattar, R. S., Swales, J. D., Dore, C., Senior, R., & Lahiri, A. (2001). Effect of aging on the
prognostic significance of ambulatory systolic, diastolic, and pulse pressure in essential
hypertension. Circulation, 104(7), 783-789.
King, C. R., Knutson, K. L., Rathouz, P. J., Sidney, S., Liu, K., & Lauderdale, D. S. (2008).
Short sleep duration and incident coronary artery calcification. JAMA : The Journal of the
American Medical Association, 300(24), 2859-2866. doi:10.1001/jama.2008.867
Kloss, J. D., Nash, C. O., Horsey, S. E., & Taylor, D. J. (2011). The delivery of behavioral sleep
medicine to college students. The Journal of Adolescent Health : Official Publication of the
Society for Adolescent Medicine, 48(6), 553-561. doi:10.1016/j.jadohealth.2010.09.023
Knutson, K. L., Rathouz, P. J., Yan, L. L., Liu, K., & Lauderdale, D. S. (2007). Intra-individual
daily and yearly variability in actigraphically recorded sleep measures: The CARDIA study.
Sleep, 30(6), 793-796.
Knutson, K. L., & Turek, F. W. (2006). The U-shaped association between sleep and health: The
2 peaks do not mean the same thing. Sleep, 29(7), 878-879.
Knutson, K. L., Van Cauter, E., Rathouz, P. J., Yan, L. L., Hulley, S. B., Liu, K., & Lauderdale,
D. S. (2009). Association between sleep and blood pressure in midlife: The CARDIA sleep

126
study. Archives of Internal Medicine, 169(11), 1055-1061. doi:10.1001/archinternmed.
2009.119
Krantz, D. S., & Manuck, S. B. (1984). Acute psychophysiologic reactivity and risk of
cardiovascular disease: A review and methodologic critique. Psychological Bulletin, 96(3),
435-464.
Krupp, L. B., LaRocca, N. G., Muir-Nash, J., & Steinberg, A. D. (1989). The fatigue severity
scale. application to patients with multiple sclerosis and systemic lupus erythematosus.
Archives of Neurology, 46(10), 1121-1123.
Krystal, A. D., Edinger, J. D., Wohlgemuth, W. K., & Marsh, G. R. (2002). NREM sleep EEG
frequency spectral correlates of sleep complaints in primary insomnia subtypes. Sleep,
25(6), 630-640.
Kumari M, Badrick E, Ferrie J, Perski A, Marmot M, Chandola T. (2009). Self-reported sleep
duration and sleep disturbance are independently associated with cortisol secretion in the
Whitehall II study. The Journal of Clinical Endocrinology and Metabolism, 94(12), 4801-
4809.
Lam, Y. Y., Chan, E. Y., Ng, D. K., Chan, C. H., Cheung, J. M., Leung, S. Y., . . . Kwok, K. L.
(2006). The correlation among obesity, apnea-hypopnea index, and tonsil size in children.
Chest, 130(6), 1751-1756. doi:10.1378/chest.130.6.1751
Landolt, H. P. (2008). Genotype-dependent differences in sleep, vigilance, and response to
stimulants. Current Pharmaceutical Design, 14(32), 3396-3407.
Linden, W., Earle, T. L., Gerin, W., & Christenfeld, N. (1997). Physiological stress reactivity
and recovery: Conceptual siblings separated at birth? Journal of Psychosomatic Research,
42(2), 117-135.
Lipinski, M. J., Vetrovec, G. W., & Froelicher, V. F. (2004). Importance of the first two minutes
of heart rate recovery after exercise treadmill testing in predicting mortality and the presence
of coronary artery disease in men. The American Journal of Cardiology, 93(4), 445-449.
doi:10.1016/j.amjcard.2003.10.039
Lloyd-Jones, D. M., Evans, J. C., Larson, M. G., O'Donnell, C. J., & Levy, D. (1999).
Differential impact of systolic and diastolic blood pressure level on JNC-VI staging. joint
national committee on prevention, detection, evaluation, and treatment of high blood
pressure. Hypertension, 34(3), 381-385.
127
Lovallo, W. R. (2005). Cardiovascular reactivity: Mechanisms and pathways to cardiovascular
disease. International Journal of Psychophysiology : Official Journal of the International
Organization of Psychophysiology, 58(2-3), 119-132. doi:10.1016/j.ijpsycho.2004.11.007
Lovallo, W. R., & Gerin, W. (2003). Psychophysiological reactivity: Mechanisms and pathways
to cardiovascular disease. Psychosomatic Medicine, 65(1), 36-45.
Low, C. A., Salomon, K., & Matthews, K. A. (2009). Chronic life stress, cardiovascular
reactivity, and subclinical cardiovascular disease in adolescents. Psychosomatic Medicine,
71(9), 927-931. doi:10.1097/PSY.0b013e3181ba18ed
MacCallum, R. C., Zhang, S., Preacher, K. J., & Rucker, D. D. (2002). On the practice of
dichotomization of quantitative variables. Psychological Methods, 7(1), 19-40.
Maier, K. J., Waldstein, S. R., & Synowski, S. J. (2003). Relation of cognitive appraisal to
cardiovascular reactivity, affect, and task engagement. Annals of Behavioral Medicine : A
Publication of the Society of Behavioral Medicine, 26(1), 32-41.
Malhotra, A., & Loscalzo, J. (2009). Sleep and cardiovascular disease: An overview. Progress in
Cardiovascular Diseases, 51(4), 279-284. doi:10.1016/j.pcad.2008.10.004
Mallon, L., Broman, J. E., & Hetta, J. (2005). High incidence of diabetes in men with sleep
complaints or short sleep duration: A 12-year follow-up study of a middle-aged population.
Diabetes Care, 28(11), 2762-2767.
Manber, R., Bootzin, R. R., Acebo, C., & Carskadon, M. A. (1996). The effects of regularizing
sleep-wake schedules on daytime sleepiness. Sleep, 19(5), 432-441.
Manuck, S. B. (1994). Cardiovascular reactivity in cardiovascular disease: "once more unto the
breach". International Journal of Behavioral Medicine, 1(1), 4-31. doi:10.1207/
s15327558ijbm0101_2
Markovitz, J. H., & Matthews, K. A. (1991). Platelets and coronary heart disease: Potential
psychophysiologic mechanisms. Psychosomatic Medicine, 53(6), 643-668.
Marshall, N. S., Glozier, N., & Grunstein, R. R. (2008). Is sleep duration related to obesity? A
critical review of the epidemiological evidence. Sleep Medicine Reviews, 12(4), 289-298.
doi:10.1016/j.smrv.2008.03.001
Martin, B. J., Bender, P. R., & Chen, H. (1986). Stress hormonal response to exercise after sleep
loss. European Journal of Applied Physiology and Occupational Physiology, 55(2), 210-
214.
Martin, B. J., & Chen, H. I. (1984). Sleep loss and the sympathoadrenal response to exercise.
Medicine and Science in Sports and Exercise, 16(1), 56-59.
Matthews, K. A., Kamarck, T. W., H Hall, M., Strollo, P. J., Owens, J. F., Buysse, D. J., . . .
Reis, S. E. (2008). Blood pressure dipping and sleep disturbance in african-american and

128
caucasian men and women. American Journal of Hypertension, 21(7), 826-831.
doi:10.1038/ajh.2008.183
Matthews, K. A., Strollo, P. J.,Jr, Hall, M., Mezick, E. J., Kamarck, T. W., Owens, J. F., . . .
Reis, S. E. (2011). Associations of framingham risk score profile and coronary artery
calcification with sleep characteristics in middle-aged men and women: Pittsburgh
SleepSCORE study. Sleep, 34(6), 711-716. doi:10.5665/SLEEP.1032
Matthews, K. A., Zhu, S., Tucker, D. C., & Whooley, M. A. (2006). Blood pressure reactivity to
psychological stress and coronary calcification in the coronary artery risk development in
young adults study. Hypertension, 47(3), 391-395. doi:10.1161/01.HYP.0000200713.
44895.38
Mausbach, B. T., Ancoli-Israel, S., von Kanel, R., Patterson, T. L., Aschbacher, K., Mills, P. J., .
. . Grant, I. (2006). Sleep disturbance, norepinephrine, and D-dimer are all related in elderly
caregivers of people with alzheimer disease. Sleep, 29(10), 1347-1352.
McMurray, R. G., & Brown, C. F. (1984). The effect of sleep loss on high intensity exercise and
recovery. Aviation, Space, and Environmental Medicine, 55(11), 1031-1035.
Meerlo, P., Sgoifo, A., & Suchecki, D. (2008). Restricted and disrupted sleep: Effects on
autonomic function, neuroendocrine stress systems and stress responsivity. Sleep Medicine
Reviews, 12(3), 197-210. doi:10.1016/j.smrv.2007.07.007
Meier-Ewert, H. K., Ridker, P. M., Rifai, N., Regan, M. M., Price, N. J., Dinges, D. F. et al.
(2004). Effect of sleep loss on C-reactive protein, an inflammatory marker of
cardiovascular risk. Journal of the American College of Cardiology, 43, 678–683.
Meisinger, C., Heier, M., Lowel, H., Schneider, A., & Doring, A. (2007). Sleep duration and
sleep complaints and risk of myocardial infarction in middle-aged men and women from the
general population: The MONICA/KORA augsburg cohort study. Sleep, 30(9), 1121-1127.
Mezick, E. J., Hall, M., & Matthews, K. A. (2012). Sleep duration and ambulatory blood
pressure in black and white adolescents. Hypertension, 59(3), 747-752. doi:10.1161/
HYPERTENSIONAHA.111.184770
Mezick, E. J., Matthews, K. A., Hall, M., Kamarck, T. W., Buysse, D. J., Owens, J. F., & Reis,
S. E. (2009). Intra-individual variability in sleep duration and fragmentation: Associations
with stress. Psychoneuroendocrinology, 34(9), 1346-1354. doi:10.1016/j.psyneuen.2009.
04.005
Mezzacappa, E. S., Kelsey, R. M., Katkin, E. S., & Sloan, R. P. (2001). Vagal rebound and
recovery from psychological stress. Psychosomatic Medicine, 63(4), 650-657.
Monk, T. H. (1989). A visual analogue scale technique to measure global vigor and affect.
Psychiatry Research, 27(1), 89-99.

129
Morikawa, Y., Nakagawa, H., Miura, K., Soyama, Y., Ishizaki, M., Kido, T., . . . Nogawa, K.
(2007). Effect of shift work on body mass index and metabolic parameters. Scandinavian
Journal of Work, Environment & Health, 33(1), 45-50.
Moseley, J. V., & Linden, W. (2006). Predicting blood pressure and heart rate change with
cardiovascular reactivity and recovery: Results from 3-year and 10-year follow up.
Psychosomatic Medicine, 68(6), 833-843. doi:10.1097/01.psy.0000238453.11324.d5
Muenter, N. K., Watenpaugh, D. E., Wasmund, W. L., Wasmund, S. L., Maxwell, S. A., &
Smith, M. L. (2000). Effect of sleep restriction on orthostatic cardiovascular control in
humans. Journal of Applied Physiology (Bethesda, Md.: 1985), 88(3), 966-972.
National Sleep Foundation. 2009 Sleep in America poll: summary of findings. Washington
D.C.: National Sleep Foundation, 2009.
National Sleep Foundation. 2011 Sleep in America poll: summary of findings. Washington
D.C.: National Sleep Foundation, 2011.
Netzer, N. C., Stoohs, R. A., Netzer, C. M., Clark, K., & Strohl, K. P. (1999). Using the berlin
questionnaire to identify patients at risk for the sleep apnea syndrome. Annals of Internal
Medicine, 131(7), 485-491.
Nicholson, A., Fuhrer, R., & Marmot, M. (2005). Psychological distress as a predictor of CHD
events in men: The effect of persistence and components of risk. Psychosomatic Medicine,
67(4), 522-530. doi:10.1097/01.psy.0000171159.86446.9e
Nurnberger, J., Keflioglu-Scheiber, A., Opazo Saez, A. M., Wenzel, R. R., Philipp, T., &
Schafers, R. F. (2002). Augmentation index is associated with cardiovascular risk. Journal
of Hypertension, 20(12), 2407-2414. doi:10.1097/01.hjh.0000045501.82010.fa
Ogawa, Y., Kanbayashi, T., Saito, Y., Takahashi, Y., Kitajima, T., Takahashi, K., . . . Shimizu,
T. (2003). Total sleep deprivation elevates blood pressure through arterial baroreflex
resetting: A study with microneurographic technique. Sleep, 26(8), 986-989.
Okun, M. L., Reynolds, C. F.,3rd, Buysse, D. J., Monk, T. H., Mazumdar, S., Begley, A., & Hall,
M. (2011). Sleep variability, health-related practices, and inflammatory markers in a
community dwelling sample of older adults. Psychosomatic Medicine, 73(2), 142-150.
doi:10.1097/PSY.0b013e3182020d08
Orth-Gomer, K. (1983). Intervention on coronary risk factors by adapting a shift work schedule
to biologic rhythmicity. Psychosomatic Medicine, 45(5), 407-415.
Otzenberger, H., Gronfier, C., Simon, C., Charloux, A., Ehrhart, J., Piquard, F., &
Brandenberger, G. (1998). Dynamic heart rate variability: A tool for exploring
sympathovagal balance continuously during sleep in men. The American Journal of
Physiology, 275(3 Pt 2), H946-50.

130
Palesh, O., Zeitzer, J. M., Conrad, A., Giese-Davis, J., Mustian, K. M., Popek, V., . . . Spiegel,
D. (2008). Vagal regulation, cortisol, and sleep disruption in women with metastatic breast
cancer. Journal of Clinical Sleep Medicine : JCSM : Official Publication of the American
Academy of Sleep Medicine, 4(5), 441-449.
Patel, S. R., Blackwell, T., Redline, S., Ancoli-Israel, S., Cauley, J. A., Hillier, T. A., . . . Study
of Osteoporotic Fractures Research Group. (2008). The association between sleep duration
and obesity in older adults. International Journal of Obesity (2005), 32(12), 1825-1834.
doi:10.1038/ijo.2008.198
Paudel, M. L., Taylor, B. C., Diem, S. J., Stone, K. L., Ancoli-Israel, S., Redline, S., . . .
Osteoporotic Fractures in Men Study Group. (2008). Association between depressive
symptoms and sleep disturbances in community-dwelling older men. Journal of the
American Geriatrics Society, 56(7), 1228-1235. doi:10.1111/j.1532-5415.2008.01753.x
Phillips, B., & Mannino, D. M. (2007). Do insomnia complaints cause hypertension or
cardiovascular disease? Journal of Clinical Sleep Medicine : JCSM : Official Publication of
the American Academy of Sleep Medicine, 3(5), 489-494.
Pieper, S., & Brosschot, J. F. (2005). Prolonged stress-related cardiovascular activation: Is there
any? Annals of Behavioral Medicine : A Publication of the Society of Behavioral Medicine,
30(2), 91-103. doi:10.1207/s15324796abm3002_1
Pitsavos, C. H., Chrysohoou, C., Panagiotakos, D. B., Kokkinos, P., Skoumas, J., Papaioannou,
I., . . . Stefanadis, C. I. (2004). Exercise capacity and heart rate recovery as predictors of
coronary heart disease events, in patients with heterozygous familial hypercholesterolemia.
Atherosclerosis, 173(2), 347-352. doi:10.1016/j.atherosclerosis.2003.12.027
Porges, S. W. (2003). The polyvagal theory: Phylogenetic contributions to social behavior.
Physiology & Behavior, 79(3), 503-513.
Porges, S. W., Doussard-Roosevelt, J. A., & Maiti, A. K. (1994). Vagal tone and the
physiological regulation of emotion. Monographs of the Society for Research in Child
Development, 59(2-3), 167-186.
Prasai, M. J., George, J. T., & Scott, E. M. (2008). Molecular clocks, type 2 diabetes and
cardiovascular disease. Diabetes & Vascular Disease Research : Official Journal of the
International Society of Diabetes and Vascular Disease, 5(2), 89-95.
doi:10.3132/dvdr.2008.015
Preacher, K. J., & Hayes, A. F. (2004). SPSS and SAS procedures for estimating indirect effects
in simple mediation models. Behavior Research Methods, Instruments, & Computers : A
Journal of the Psychonomic Society, Inc, 36(4), 717-731.
Raikkonen, K., Matthews, K. A., Pesonen, A. K., Pyhala, R., Paavonen, E. J., Feldt, K., . . .
Kajantie, E. (2010). Poor sleep and altered hypothalamic-pituitary-adrenocortical and
sympatho-adrenal-medullary system activity in children. The Journal of Clinical
Endocrinology and Metabolism, doi:10.1210/jc.2009-0943

131
Rod, N. H., Vahtera, J., Westerlund, H., Kivimaki, M., Zins, M., Goldberg, M., & Lange, T.
(2011). Sleep disturbances and cause-specific mortality: Results from the GAZEL cohort
study. American Journal of Epidemiology, 173(3), 300-309. doi:10.1093/aje/kwq371
Rodrigues, T. C., Ehrlich, J., Hunter, C. M., Kinney, G. L., Rewers, M., & Snell-Bergeon, J. K.
(2010). Reduced heart rate variability predicts progression of coronary artery calcification in
adults with type 1 diabetes and controls without diabetes. Diabetes Technology &
Therapeutics, 12(12), 963-969. doi:10.1089/dia.2010.0070
Roeser, K., Obergfell, F., Meule, A., Vogele, C., Schlarb, A. A., & Kubler, A. (2012). Of larks
and hearts - morningness/eveningness, heart rate variability and cardiovascular stress
response at different times of day. Physiology & Behavior, 106(2), 151-157.
doi:10.1016/j.physbeh.2012.01.023
Rosenwinkel, E. T., Bloomfield, D. M., Arwady, M. A., & Goldsmith, R. L. (2001). Exercise
and autonomic function in health and cardiovascular disease. Cardiology Clinics, 19(3),
369-387.
Rottenberg, J., Clift, A., Bolden, S., & Salomon, K. (2007). RSA fluctuation in major depressive
disorder. Psychophysiology, 44(3), 450-458. doi:10.1111/j.1469-8986.2007.00509.x
Roy-Gagnon, M. H., Weir, M. R., Sorkin, J. D., Ryan, K. A., Sack, P. A., Hines, S., . . . Douglas,
J. A. (2008). Genetic influences on blood pressure response to the cold pressor test: Results
from the heredity and phenotype intervention heart study. Journal of Hypertension, 26(4),
729-736. doi:10.1097/HJH.0b013e3282f524b4
Ryff, C. D., Singer, B. H., & Dienberg Love, G. (2004). Positive health: Connecting well-being
with biology. Philosophical Transactions of the Royal Society of London.Series B,
Biological Sciences, 359(1449), 1383-1394. doi:10.1098/rstb.2004.1521
Sauvet, F., Leftheriotis, G., Gomez-Merino, D., Langrume, C., Drogou, C., Van Beers, P., . . .
Chennaoui, M. (2010). Effect of acute sleep deprivation on vascular function in healthy
subjects. Journal of Applied Physiology (Bethesda, Md.: 1985), 108(1), 68-75.
doi:10.1152/japplphysiol.00851.2009
Savin, W. M., Davidson, D. M., & Haskell, W. L. (1982). Autonomic contribution to heart rate
recovery from exercise in humans. Journal of Applied Physiology: Respiratory,
Environmental and Exercise Physiology, 53(6), 1572-1575.
Scheier, M. F., Carver, C. S., & Bridges, M. W. (1994). Distinguishing optimism from
neuroticism (and trait anxiety, self-mastery, and self-esteem): A reevaluation of the life
orientation test. Journal of Personality and Social Psychology, 67(6), 1063-1078.
Scheier, M. F., Wrosch, C., Baum, A., Cohen, S., Martire, L. M., Matthews, K. A., . . . Zdaniuk,
B. (2006). The life engagement test: Assessing purpose in life. Journal of Behavioral
Medicine, 29(3), 291-298. doi:10.1007/s10865-005-9044-1

132
Schneider, G. M., Jacobs, D. W., Gevirtz, R. N., & O'Connor, D. T. (2003). Cardiovascular
haemodynamic response to repeated mental stress in normotensive subjects at genetic risk of
hypertension: Evidence of enhanced reactivity, blunted adaptation, and delayed recovery.
Journal of Human Hypertension, 17(12), 829-840. doi:10.1038/sj.jhh.1001624
Schroeder, E. B., Liao, D., Chambless, L. E., Prineas, R. J., Evans, G. W., & Heiss, G. (2003).
Hypertension, blood pressure, and heart rate variability: The atherosclerosis risk in
communities (ARIC) study. Hypertension, 42(6), 1106-1111. doi:10.1161/01.HYP.
0000100444.71069.73
Schuler, J. L., & O'Brien, W. H. (1997). Cardiovascular recovery from stress and hypertension
risk factors: A meta-analytic review. Psychophysiology, 34(6), 649-659.
Schwartz, A. R., Gerin, W., Davidson, K. W., Pickering, T. G., Brosschot, J. F., Thayer, J. F., . . .
Linden, W. (2003). Toward a causal model of cardiovascular responses to stress and the
development of cardiovascular disease. Psychosomatic Medicine, 65(1), 22-35.
Sgoifo, A., Buwalda, B., Roos, M., Costoli, T., Merati, G., & Meerlo, P. (2006). Effects of sleep
deprivation on cardiac autonomic and pituitary-adrenocortical stress reactivity in rats.
Psychoneuroendocrinology, 31(2), 197-208. doi:10.1016/j.psyneuen.2005.06.009
Sookoian, S., Gemma, C., Fernandez Gianotti, T., Burgueno, A., Alvarez, A., Gonzalez, C. D., &
Pirola, C. J. (2007). Effects of rotating shift work on biomarkers of metabolic syndrome and
inflammation. Journal of Internal Medicine, 261(3), 285-292. doi:10.1111/j.1365-
2796.2007.01766.x
Spiegel, K., Knutson, K., Leproult, R., Tasali, E., & Van Cauter, E. (2005). Sleep loss: A novel
risk factor for insulin resistance and type 2 diabetes. Journal of Applied Physiology
(Bethesda, Md.: 1985), 99(5), 2008-2019. doi:10.1152/japplphysiol.00660.2005
Spiegel, K., Leproult, R., & Van Cauter, E. (1999). Impact of sleep debt on metabolic and
endocrine function. Lancet, 354(9188), 1435-1439. doi:10.1016/S0140-6736(99)01376-8
Steptoe, A., & Marmot, M. (2005). Impaired cardiovascular recovery following stress predicts 3-
year increases in blood pressure. Journal of Hypertension, 23(3), 529-536.
Steptoe, A., O'Donnell, K., Marmot, M., & Wardle, J. (2008). Positive affect, psychological
well-being, and good sleep. Journal of Psychosomatic Research, 64(4), 409-415.
doi:10.1016/j.jpsychores.2007.11.008
Stewart, J. C., & France, C. R. (2001). Cardiovascular recovery from stress predicts longitudinal
changes in blood pressure. Biological Psychology, 58(2), 105-120.
Stewart, J. C., Janicki, D. L., & Kamarck, T. W. (2006). Cardiovascular reactivity to and
recovery from psychological challenge as predictors of 3-year change in blood pressure.
Health Psychology : Official Journal of the Division of Health Psychology, American
Psychological Association, 25(1), 111-118. doi:10.1037/0278-6133.25.1.111

133
Symons, J. D., VanHelder, T., & Myles, W. S. (1988). Physical performance and physiological
responses following 60 hours of sleep deprivation. Medicine and Science in Sports and
Exercise, 20(4), 374-380.
Tochikubo, O., Ikeda, A., Miyajima, E., & Ishii, M. (1996). Effects of insufficient sleep on blood
pressure monitored by a new multibiomedical recorder. Hypertension, 27(6), 1318-1324.
Treiber, F. A., Kamarck, T., Schneiderman, N., Sheffield, D., Kapuku, G., & Taylor, T. (2003).
Cardiovascular reactivity and development of preclinical and clinical disease states.
Psychosomatic Medicine, 65(1), 46-62.
Treiber, F. A., Musante, L., Kapuku, G., Davis, C., Litaker, M., & Davis, H. (2001).
Cardiovascular (CV) responsivity and recovery to acute stress and future CV functioning in
youth with family histories of CV disease: A 4-year longitudinal study. International
Journal of Psychophysiology : Official Journal of the International Organization of
Psychophysiology, 41(1), 65-74.
Trinder, J., Kleiman, J., Carrington, M., Smith, S., Breen, S., Tan, N., & Kim, Y. (2001).
Autonomic activity during human sleep as a function of time and sleep stage. Journal of
Sleep Research, 10(4), 253-264.
Tsuji, H., Larson, M. G., Venditti, F. J.,Jr, Manders, E. S., Evans, J. C., Feldman, C. L., & Levy,
D. (1996). Impact of reduced heart rate variability on risk for cardiac events. the
framingham heart study. Circulation, 94(11), 2850-2855.
Tucker, A. M., Dinges, D. F., & Van Dongen, H. P. (2007). Trait interindividual differences in
the sleep physiology of healthy young adults. Journal of Sleep Research, 16(2), 170-180.
doi:10.1111/j.1365-2869.2007.00594.x
Uchino, B. N., Holt-Lunstad, J., Bloor, L. E., & Campo, R. A. (2005). Aging and cardiovascular
reactivity to stress: Longitudinal evidence for changes in stress reactivity. Psychology and
Aging, 20(1), 134-143. doi:10.1037/0882-7974.20.1.134
Van Den Berg, J. F., Van Rooij, F. J., Vos, H., Tulen, J. H., Hofman, A., Miedema, H. M., . . .
Tiemeier, H. (2008). Disagreement between subjective and actigraphic measures of sleep
duration in a population-based study of elderly persons. Journal of Sleep Research, 17(3),
295-302. doi:10.1111/j.1365-2869.2008.00638.x
Van Dongen, H. P., Baynard, M. D., Maislin, G., & Dinges, D. F. (2004). Systematic
interindividual differences in neurobehavioral impairment from sleep loss: Evidence of trait-
like differential vulnerability. Sleep, 27(3), 423-433.
Van Dongen, H. P., Vitellaro, K. M., & Dinges, D. F. (2005). Individual differences in adult
human sleep and wakefulness: Leitmotif for a research agenda. Sleep, 28(4), 479-496.
Vandewalle, G., Archer, S. N., Wuillaume, C., Balteau, E., Degueldre, C., Luxen, A., . . . Dijk,
D. J. (2009). Functional magnetic resonance imaging-assessed brain responses during an
executive task depend on interaction of sleep homeostasis, circadian phase, and PER3

134
genotype. The Journal of Neuroscience : The Official Journal of the Society for
Neuroscience, 29(25), 7948-7956. doi:10.1523/JNEUROSCI.0229-09.2009
Vlachopoulos, C., & O'Rourke, M. (2000). Diastolic pressure, systolic pressure, or pulse
pressure? Current Hypertension Reports, 2(3), 271-279.
von Kanel, R., Dimsdale, J. E., Ancoli-Israel, S., Mills, P. J., Patterson, T. L., McKibbin, C. L., .
. . Grant, I. (2006). Poor sleep is associated with higher plasma proinflammatory cytokine
interleukin-6 and procoagulant marker fibrin D-dimer in older caregivers of people with
alzheimer's disease. Journal of the American Geriatrics Society, 54(3), 431-437.
doi:10.1111/j.1532-5415.2005.00642.x
von Kanel, R., Loredo, J. S., Ancoli-Israel, S., Mills, P. J., Natarajan, L., & Dimsdale, J. E.
(2007). Association between polysomnographic measures of disrupted sleep and
prothrombotic factors. Chest, 131(3), 733-739. doi:10.1378/chest.06-2006
Wright, C. E., Erblich, J., Valdimarsdottir, H. B., & Bovbjerg, D. H. (2007). Poor sleep the night
before an experimental stressor predicts reduced NK cell mobilization and slowed recovery
in healthy women. Brain, Behavior, and Immunity, 21(3), 358-363. doi:10.1016/
j.bbi.2006.08.007
Wright, C. E., Valdimarsdottir, H. B., Erblich, J., & Bovbjerg, D. H. (2007). Poor sleep the night
before an experimental stress task is associated with reduced cortisol reactivity in healthy
women. Biological Psychology, 74(3), 319-327. doi:10.1016/j.biopsycho.2006.08.003
Wrosch, C., Miller, G. E., Lupien, S., & Pruessner, J. C. (2008). Diurnal cortisol secretion and 2-
year changes in older adults' physical symptoms: The moderating roles of negative affect
and sleep. Health Psychology : Official Journal of the Division of Health Psychology,
American Psychological Association, 27(6), 685-693. doi:10.1037/0278-6133.27.6.685
Wu, T., Snieder, H., & de Geus, E. (2010). Genetic influences on cardiovascular stress reactivity.
Neuroscience and Biobehavioral Reviews, 35(1), 58-68. doi:10.1016/j.neubiorev.
2009.12.001
Yoo, S. S., Gujar, N., Hu, P., Jolesz, F. A., & Walker, M. P. (2007). The human emotional brain
without sleep--a prefrontal amygdala disconnect. Current Biology : CB, 17(20), R877-8.
doi:10.1016/j.cub.2007.08.007
Zhong, X., Hilton, H. J., Gates, G. J., Jelic, S., Stern, Y., Bartels, M. N., . . . Basner, R. C.
(2005). Increased sympathetic and decreased parasympathetic cardiovascular modulation in
normal humans with acute sleep deprivation. Journal of Applied Physiology (Bethesda, Md.:
1985), 98(6), 2024-2032. doi:10.1152/japplphysiol.00620.2004
Zohar, D., Tzischinsky, O., Epstein, R., & Lavie, P. (2005). The effects of sleep loss on medical
residents' emotional reactions to work events: A cognitive-energy model. Sleep, 28(1), 47-
54.


