CARBON-NEUTRAL EUROPEAN ELECTRICITY SECTOR BY 2050
- The Vision of the Power Industry -
Hélène Lavray, Adviser Environment and Sustainable Development Policy
EURELECTRIC
European Electricity Sector CEOsDeclaration 18 March 2009
• ACHIEVE a carbon-neutral power supply in Europe by 2050
• DELIVER power cost-efficiently and reliably through an integrated electricity market
• PROMOTE energy efficiency and electricity use as solutions to mitigate climate change
European Electricity Sector CEOsDeclaration 18 March 2009
• 61 power companies • 27 countries • Joint production of 2500 TWh
electricity per year• Over 70% of total European power
generation
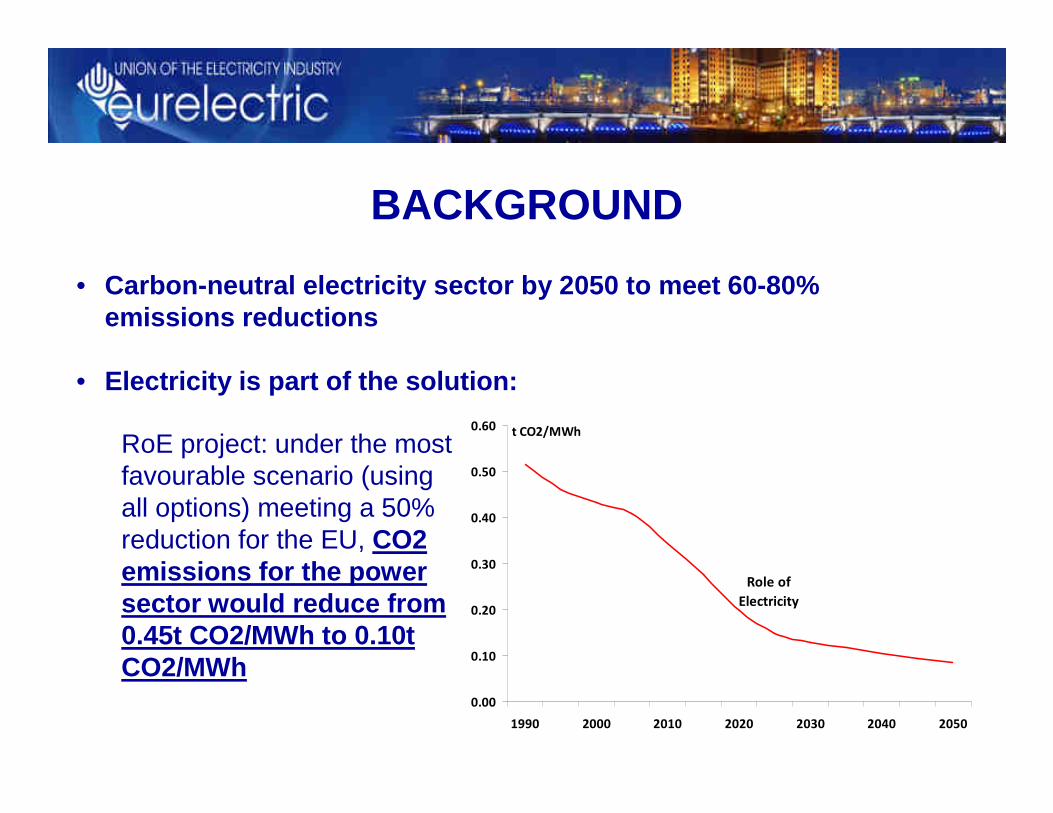
BACKGROUND
RoE project: under the most favourable scenario (using all options) meeting a 50% reduction for the EU, CO2 emissions for the power sector would reduce from 0.45t CO2/MWh to 0.10t CO2/MWh
t CO2/MWh
Role of
Electricity
0.00
0.10
0.20
0.30
0.40
0.50
0.60
1990 2000 2010 2020 2030 2040 2050
• Carbon-neutral electricity sector by 2050 to meet 6 0-80% emissions reductions
• Electricity is part of the solution:
→ To investigate the technological development, costs and regulatory framework needed to enable the power sec tor to become carbon-neutral by 2050
→ To build an investment roadmap, decade by decade up to 2050
Objective of the study
Work organisation• Study funded by EURELECTRIC and carried out
in cooperation with Professor Pantelis Caprosand his team of the Athens Technical University
• VGB PowerTech associated in the study
• Peer review by outside experts and stakeholders
• PRIMES model: basic modelling tool
Methodology & Project Assumptions (1)
• One central scenario - “Role of Electricity 2050”: all supply options, strong development in demand-side (PHEVs, HPs etc.)
• Definition of “milestones”i.e. sensitivities around availability and cost of various technologies
• Concept of “carbon-neutral”: some quantities of CO2 offset by activities such as forestation, JI/CDM projects, firing of biomass
• Assumption that there will be a robust international carbon market by 2050
• Timeline & costs of technology development including improved efficiency in electricity generation, transmission & distribution
• Timing for delivery of new generation capacity (retirement dates for the existing generation park)
• CO2 price evolution• Infrastructure development
including decentralised power generation & smart grids / metering
• Measures to increase energy efficiency & reduce energy consumption
• Assuming an integrated European power market
Methodology & Project assumptions (2)
Assumptions for the Main Scenario
1. World fossil fuel price trajectory
2. Macroeconomic assumptions for the European Econom y
3. Power plants under construction
4. EU Interconnections and EU Internal Market
5. Nuclear policy
6. GHG Emission reduction
7. Renewables Policy and Targets
8. Carbon Capture and Storage
9. Energy Efficiency in Demand sectors
10. Smart grids and intelligent metering
11. Hydrogen
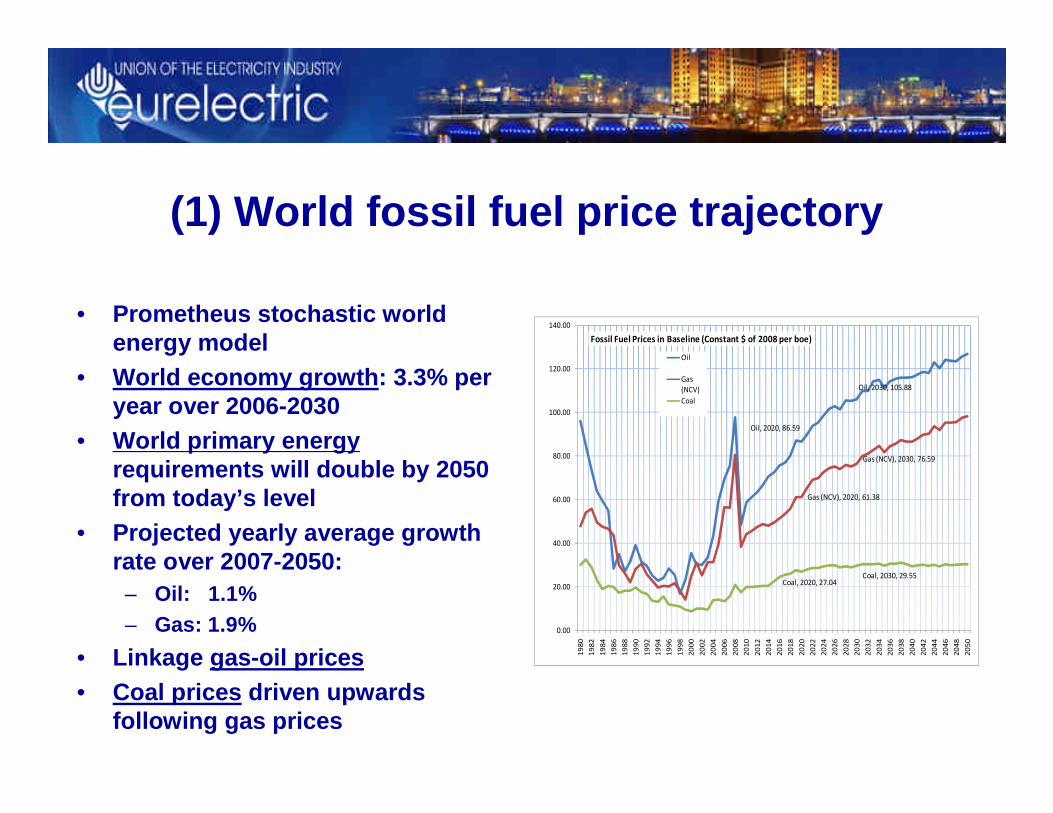
(1) World fossil fuel price trajectory
• Prometheus stochastic world energy model
• World economy growth : 3.3% per year over 2006-2030
• World primary energyrequirements will double by 2050 from today’s level
• Projected yearly average growth rate over 2007-2050:
– Oil: 1.1% – Gas: 1.9%
• Linkage gas-oil prices• Coal prices driven upwards
following gas prices
Oil, 2020, 86.59
Oil, 2030, 105.88
Gas (NCV), 2020, 61.38
Gas (NCV), 2030, 76.59
Coal, 2020, 27.04Coal, 2030, 29.55
0.00
20.00
40.00
60.00
80.00
100.00
120.00
140.00
19
80
19
82
19
84
19
86
19
88
19
90
19
92
19
94
19
96
19
98
20
00
20
02
20
04
20
06
20
08
20
10
20
12
20
14
20
16
20
18
20
20
20
22
20
24
20
26
20
28
20
30
20
32
20
34
20
36
20
38
20
40
20
42
20
44
20
46
20
48
20
50
Fossil Fuel Prices in Baseline (Constant $ of 2008 per boe)
Oil
Gas
(NCV)
Coal
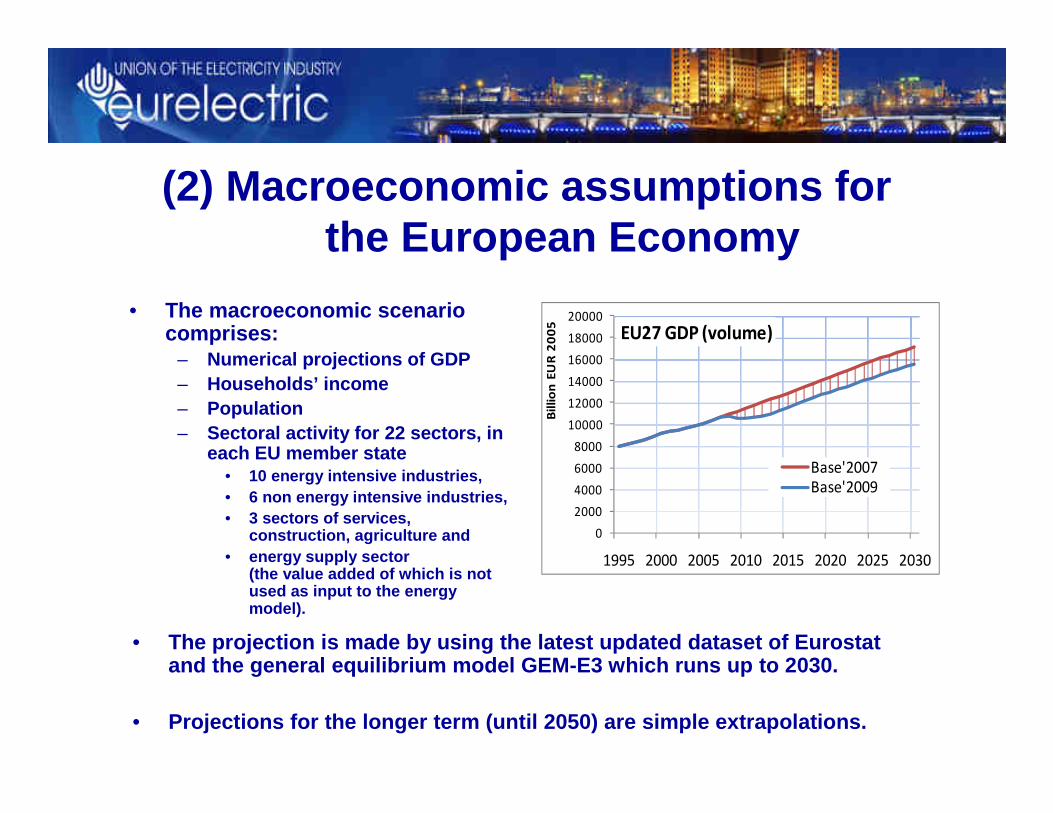
(2) Macroeconomic assumptions for the European Economy
• The macroeconomic scenario comprises:
– Numerical projections of GDP – Households’ income– Population – Sectoral activity for 22 sectors, in
each EU member state • 10 energy intensive industries, • 6 non energy intensive industries, • 3 sectors of services,
construction, agriculture and • energy supply sector
(the value added of which is not used as input to the energy model).
0
2000
4000
6000
8000
10000
12000
14000
16000
18000
20000
1995 2000 2005 2010 2015 2020 2025 2030B
illi
on
EU
R 2
00
5
EU27 GDP (volume)
Base'2007
Base'2009
• The projection is made by using the latest updated dataset of Eurostatand the general equilibrium model GEM-E3 which runs up to 2030.
• Projections for the longer term (until 2050) are si mple extrapolations.
(3) Power plants under construction
• The model includes a detailed inventory of
existing power plants per country.
• The energy projection considers as exogenous
the power plants:
– known to be under construction or
– for which a firm decision exist about their construction.
• The updated list is still under preparation
(4) EU Interconnections and EU Internal Market
• Electricity and gas interconnections develop and materialize according to the recently published priority community projects .
• The internal market progresses towards common balancing mechanisms and hubs, both for electricity and gas.
• A well functioning EU market will limit price consequences to consumers, avoiding non-cost based tariff increases.
(5) Nuclear policy
• The model projection assumes first whether nuclear is among the possible options for power generation in a certain country.
• If strongly regulated , exogenous information will be:– the future anticipated nuclear capacities for new b uildings – the dates of nuclear decommissioning
• If driven by market forces , exogenous assumption will be: – the potential of new nuclear sites
• expansion of existing sites • development of new sites
– nuclear decommissioning, based on:• information about licenses • technical possibility about lifetime extension
(6) GHG Emission reduction
• GHG emissions domestically in the EU:– 2020: - 30% from 1990– 2050: - 80% from 1990
• Further emission reduction may be justified by usin g carbon credits through the CDM mechanism .
• The EU ETS market with full auctioning will apply over the whole projection period and will include all sectors of the EU economy .
• The rest of World does not participate in the EU ET S
• EU companies cannot participate in foreign ETS mark ets.
(7) Renewables Policy and Targets
• EU countries fulfil their RES obligations by 2020
• From 2020 onwards the carbon price will determine the cost optimal level of
deployment
• Large-scale infrastructure (DC rings) will facilitate deployment of offshore w ind
• Grid reinforcements to allow large share of intermittent resources
• End-use applications of RES will be greatly promoted
• Biomass supply through measures in the agricultural sector facilit ating
industrialization of energy crops
• New biomass for combustion will develop in a sustainable way : no reduction in
forests, no development detrimental to food, no ene rgy-intensive cultivation
• Biofuels production will rely on lignocelluloses treatment, mature arou nd 2020
• The model will provide allocation between sectors and by type of RES source
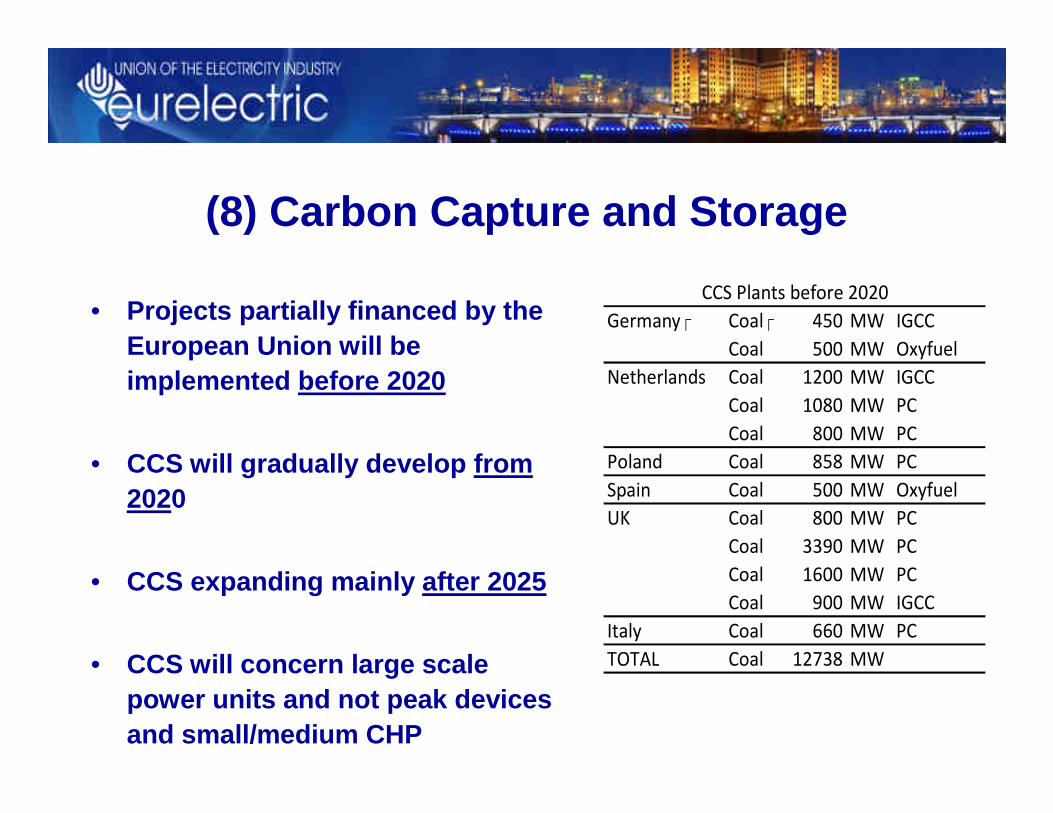
(8) Carbon Capture and Storage
• Projects partially financed by the European Union will be implemented before 2020
• CCS will gradually develop from 2020
• CCS expanding mainly after 2025
• CCS will concern large scale power units and not peak devices and small/medium CHP
�Germany �Coal 450 MW IGCC
Coal 500 MW Oxyfuel
Netherlands Coal 1200 MW IGCC
Coal 1080 MW PC
Coal 800 MW PC
Poland Coal 858 MW PC
Spain Coal 500 MW Oxyfuel
UK Coal 800 MW PC
Coal 3390 MW PC
Coal 1600 MW PC
Coal 900 MW IGCC
Italy Coal 660 MW PC
TOTAL Coal 12738 MW
CCS Plants before 2020
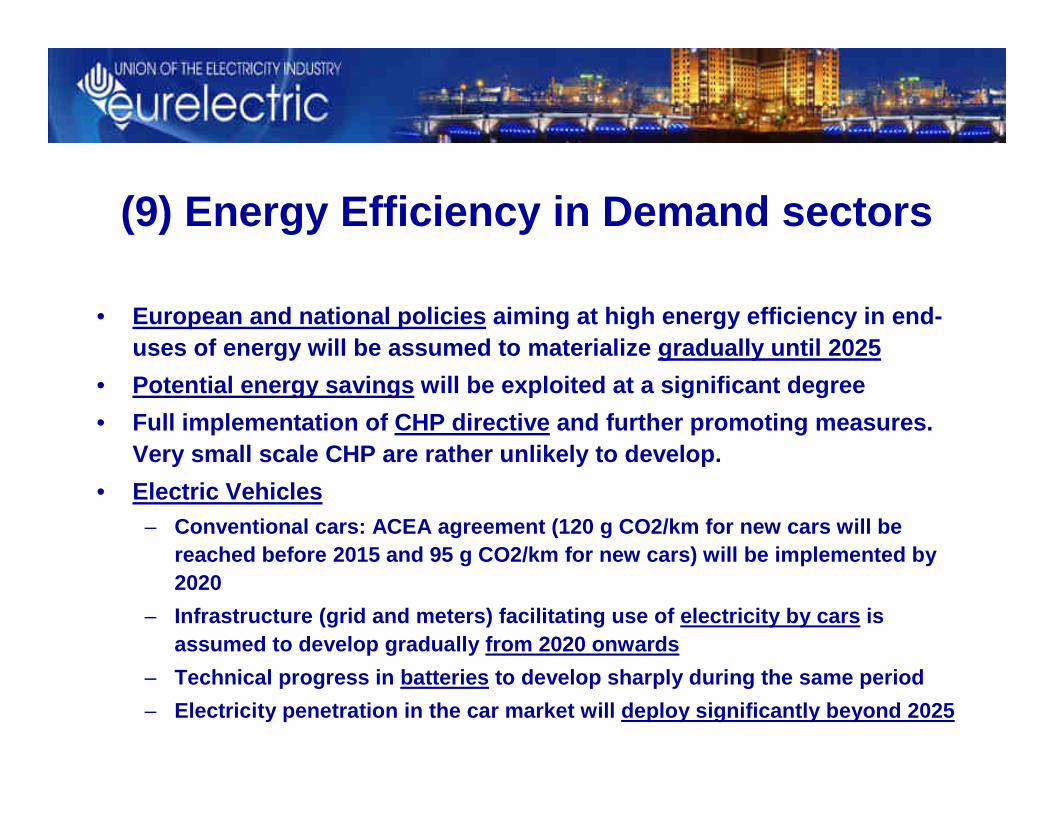
(9) Energy Efficiency in Demand sectors
• European and national policies aiming at high energy efficiency in end-uses of energy will be assumed to materialize gradu ally until 2025
• Potential energy savings will be exploited at a significant degree
• Full implementation of CHP directive and further promoting measures. Very small scale CHP are rather unlikely to develop .
• Electric Vehicles– Conventional cars: ACEA agreement (120 g CO2/km for new cars will be
reached before 2015 and 95 g CO2/km for new cars) w ill be implemented by 2020
– Infrastructure (grid and meters) facilitating use o f electricity by cars is assumed to develop gradually from 2020 onwards
– Technical progress in batteries to develop sharply during the same period
– Electricity penetration in the car market will depl oy significantly beyond 2025

(10) Smart grids and intelligent metering
• Smart grids and intelligent metering facilitate:
– peak-load pricing
– energy efficiency (driven by prices and CHP)
– deployment of very small scale renewables
• Conservative view about visions describing very lar ge scale decentralized power systems , which may involve few centralized power production
• Smart grids will play an important role to facilita te deployment of small scale RES , Energy Efficiency and small CHP
• Smart grids will develop gradually beyond 2030
(11) Hydrogen
• Fuel cells would have to cost (full system includin g stack) not more than 50 dollars per kW installed (f or mobile applications) in order to become competitive
• The main market for hydrogen is limited to the transportation sector
• Very conservative view about hydrogen deployment in the Main Scenario – modelling beyond 2030
• Modest progress in fuel cell technology – possibilit y of niche markets
Work program
• Preliminary results:15 June (EURELECTRIC Annual Convention-Bucharest)
• Final results: end of October