
1
CAN FDI FOSTER INCLUSIVE INNOVATION AND TECHNOLOGY
DEVELOPMENT IN AFRICA?
By
Oluyomi A. OLA-DAVID1
Oyebanji OYELARAN-OYEYINKA2
Prepared for the African Economic Conference on ‘Fostering Inclusive and Sustainable
Development in Africa in an Age of Global Economic Uncertainty’, Kigali, Rwanda, 30th
October- 2nd November, 2012
Abstract
Does the presence of foreign owned firms assure the economy of new production techniques and
greater investment in domestic innovation? With the use of innovation indicators for firms
provided in the World Bank Enterprise Surveys, we examined the innovative activity of firms in
the manufacturing sectors of Kenya and Nigeria. A binary logistic regression model was
formulated to assess the likely influence of several firm-specific characteristics on firm’s
engagement in product and process innovation. The estimation results indicated that an
improvement in domestic firm products and processes owing to the presence of foreign-owned or
operated firms in the sector is not automatic. For both Kenya and Nigeria, process innovation is
mostly influenced by the intensity of foreign competition, possession of internationally
recognized quality certifications, ICT usage as well as the ownership status of the firm. We
conclude that it is via the learning experiences provided by supply linkages and technology
licensing that domestic firms take on advanced techniques and management practices employed
by foreign-owned and foreign-operated firms.
Keywords: FDI, Product Innovation, Process innovation, Manufacturing
JEL Codes: F21, F23, O19, O31, O33
1All correspondence to [email protected]; Department of Economics & Development Studies Covenant University, Ogun State, Nigeria 2 Monitoring and Research Division, UN-Habitat, Nairobi, Kenya

2
Introduction
Globally, foreign direct investment (FDI) is sought for the potentials it holds in facilitating
technology transfers, increasing domestic production, providing employment opportunities and
international market networks amongst other things. There has been a steady rise in FDI with
increased integration across countries of the world in the last twenty years driven by the dynamic
and speedy advances in technological change. According to the 2011 World Investment Report,
global FDI flows have been rising even though not at the same rate as the pre-global crisis
periods. Specifically, it rose to $1.24 trillion in 2010 about 15 per cent below the pre-crisis
average. On the other hand, global industrial output and trade has resumed to the pre-crisis
levels. While FDI inflows to developed countries continue to nosedive phenomenally,
developing and transition economies together attracted more than half of global FDI flows; with
their outward FDI (mostly directed towards other countries in the south) also rising to heights.
(Gachino, 2007; UNCTAD, 2011)
Some of the poorest regions of the world continued to experience declines in FDI flows. On the
average, while flows to Africa, least developed countries, landlocked developing countries,
Small Island developing States and South Asia fell, East Asia, South-East Asia and Latin
America experienced strong growth in FDI inflows. The operations of MNCs worldwide
generated value added of approximately $16trillion in 2010; accounting for one-quarter of global
GDP. The foreign affiliates of MNCs accounted for over 10 per cent of global GDP and one-
third of global exports. FDI flows to Africa fell by 9 per cent in 2010. At $55 billon, the share of
Africa in total global FDI inflows was 4.4 per cent in 2010, down from 5.1 per cent in 2009.
Notably however, FDI to the primary sector, especially in the oil industry, continues to dominate
FDI flows to the continent. This accounted for the rise of Ghana as a major host country and for
the declines of inflows to Angola and Nigeria. The political uprisings in northern Africa (Arab
springs) and the uncertainties in Nigeria on the petroleum industry bill and political crisis in the
Niger Delta served as inhibitions to foreign investors. On the relationship within countries in
Africa, there is some evidence of how regional FDI is generating positive developments to the
host countries. For instance, foreign investments in agriculture are serving to regenerate the state
of agriculture in Zambia. Other countries provide incentives in order to attract such regional

3
foreign investment in agriculture, services, as well as the banking and finance industry.
(UNCTAD, 2011)
Generally, the low technological capacity of most developing countries causes them to have a
low potential for innovation and development compared to the rest of the world. Hence, since
foreign owned firms are presumably the most equipped technologically, most studies are
optimistic on the potential spillover effects associated with the presence of FDI in the long term
and short term. With the increased globalization of trade and investment, FDI is believed to
bring positive spillovers to domestic firms in the recipient country. The thinking back of this is
that since most of these transnational corporations (TNCs) possess skills and knowhow and
operate at the highest technological levels, their presence may facilitate the transmission of
technological knowledge, managerial skills, competences and business know-how. Such transfer
of technical knowledge and business skills may lead to ripples of productivity gains in the
operations and output of domestic firms. (Marcin, 2008; Romer, 1993; Bloomstrom and Kokko,
1998; Jensen, 2004).
The crucial role of innovation in development is evident in the experiences of the South East
Asian and emerging economies which demonstrate the advantage of combining small business
growth with innovation in production systems; these present lessons for developing countries. In
essence, the presence of foreign-owned firms (TNCs), which are sources of new technology and
intangible assets (such as technological know-how, managerial and marketing skills, export
contacts, long standing reputation), impacts domestic firms by causing a change in their
productivity levels, leading to technology spillovers. For instance, during its early stages of
industrial development, Singapore, following the transformation of industrial policies around
1985-1990, experienced significant increase in the TFP growth rates. The technology
infrastructure which supports innovation and an institutional framework that encouraged
cooperation among government, labour and business were employed as key strategies of growth
in Singapore. Singapore also highly attracted foreign skills and promoted the internationalisation
of her local companies through domestic and foreign investment. Consequently, the country as
with other Asian Tigers laid the foundation for technological progress by using FDI to stimulate
long term industrialization. (Akkemik, 2009; Marcin, 2008; Todaro and Smith, 2003)

4
According to Griffith, Waithe and Craigwell (2008) the endogenous growth model proposes the
FDI-led growth situation; noting that within a conducive environment, FDI in conjunction with
other factors such as human capital, exports, technology transfer and domestic capital can
facilitate economic growth. The experiences of East Asian economies and emerging developing
countries (BRICS) provide a strong indication that FDI is a crucial element for constricting
narrowing resource gap and accelerating economic growth. This informs the growing scramble
for pro-FDI policies across countries, including transition and developing countries.
The recently published 3World Bank enterprise survey establishment-level data on countries in
Africa has scarcely been used to empirically examine the industry-level effect of FDI in Africa.
The World Bank enterprise surveys are comparable across world economies as they are
conducted with the use of standardized survey instruments and a uniform sampling methodology
and minimal measurement errors. The Enterprise surveys on other countries in Asia and Latin
Americas have been used by researchers to study how changes in the business environment
impacts on firm-level productivity. (Hale and Long, 2006; Sun, 2011 amongst others). In this
present study we focus on examining whether the presence of foreign firms influences innovative
activities in domestic firms.
Given theoretical models that describe the effect of FDI on the host economy, technology
spillover to domestic firms is assumed to be automatic. Consequently, little attention is paid to
the relationship that subsists potentially and actively between foreign direct investment entities
and domestic ventures. On Africa, relatively little has been done on the impact of FDI on the
local firms although several studies have examined the macroeconomic determinants of FDI and
the potential effects to the economy. With the use of the World Bank Enterprise Survey Data on
Nigeria and Kenya, this present study examines the impact of foreign firm presence on
innovation of domestic firms. Our access to this firm-level data on non-oil sectors of the African
countries enables us examine how the industry innovation in each country is affected by foreign
presence. It is expected that the findings of the paper will provide direction for policy makers in
the areas of investment, technology and innovation policy in Africa.
3 Available at www.enterprisesurveys.org

5
This study aims to microeconometrically examine the effects of FDI on the innovation activities
of firms in the manufacturing sector, measured by the introduction of product innovation and
process innovation. For this purpose, capacity and innovation variables and a host of other firm
level characteristic data are extracted from the World Bank enterprise survey published in 2007
on Kenya and Nigeria. The rest of the paper is structured as follows. In section 2 a brief
discussion of the FDI and innovation policy environments of Kenya and Nigeria is presented.
Section 3 presents a brief review of existing empirical studies and future directions. In section 4
we discuss the data sources and measurements. The microeconometric model and estimation
results are presented in section 5. Section 6 concludes the paper and provides some policy
implications.
2. FDI and Innovation Policy in Kenya and Nigeria
Most developing African countries are dependent on foreign direct investment as a source of
foreign capital for development and employment. For an instance, the government of Kenya
works hard to make the environment conducive for direct foreign investment by providing a
growing infrastructural base, facilitating development of human capital, openness to trade and
other forms of regional cooperation, providing a viable financial infrastructure and a liberalized
economy without exchange or price controls. According to the 2007 ranking of competitiveness
Kenya was placed 10th over 29 African countries. Even though the country is still characterised
“as a factor-driven economy, with high dependence on commodity prices and world economic
cycles it is fast being transformed into an innovation-driven economy. In Kenya, skilled labour is
playing a greater role in the economy than in time past. The financial sector is also becoming
more and more innovative. It is worthy of note that Kenya’s skill mix and human resource base
makes Kenya a repository necessary for the achievement of its development agenda. Kenya’s
private sector “has increased its ability to harness existing technologies required for its transition
to being an innovation-driven economy. Business sophistication, increase goods and labour
market efficiency which is Kenya’s experience is been driven by its increased financial sector
sophistication. African Development Bank (2008)
Amongst the thrusts of Kenya’s vision 2030 is the macroeconomic stability continued
governance reforms, enhanced equity and wealth creation, expansion of economic infrastructure,

6
science technology and innovation, land reforms and security and public sector reforms. “With
over 20 public and private universities, offering both technical and professional education,
Kenya has a strong human resource base. It also has a number of other institutions providing
specialised training in management, science and technology. In combination with the large
number of multinational companies and international banks basing their regional headquarters in
Nairobi, this has led to the growth of a strong managerial cadre. Tapping the potential of this
existing human capital to move the economy from factor driven to increasingly service driven
(with greater efficiency and innovation) is an opportunity that needs to be exploited.” (African
Development Bank, 2008: pp12)
In its Vision 2030 blueprint diversification of foreign direct investment of Kenya towards a
globally competitive and prosperous Kenya is being considered. Recognizing the informal
economy as a widespread source of income for the urban and rural, the government proposes to
boost innovation in Kenya’s informal economy. On the science, technology and innovation
platforms Kenya’s Vision 2030 recognized essence of science, technology and innovation to
productivity and efficiency. In the broad framework it also clearly recognizes the critical role
played by research and development in accelerating economic development in the emerging
developing countries and takes a cue on this. The government of Kenya is thus geared towards
engaging resources to promote activities and institutions that will promote scientific research and
technical capabilities in the workplace among the working populations as well as among youths.
More so Kenya’s goal for 2012 amongst other things centres on creating an interconnected,
technologically advanced society with modern information and communication systems driving
innovation, growth and social progress having recognized that innovation is the key to
international competitiveness
Nigeria’s Vision 20:2020 documents the essence of raising the productivity of the manufacturing
industry by encouraging increased involvement of foreign and domestic investment in the
economy. “An analysis of the Nigerian manufacturing industry indicates that large firms are
responsible for the bulk of non-oil, value added exports. However, small and medium firms
make up the bulk of the manufacturing and processing firms. Most of these firms are so small
that they are unable to significantly participate in foreign markets. Increasing the volume of

7
value-added exports can only be achieved by targeting investment in key sub-sectors and
creating large firms focused solely on value-added exports. In the light of this, actions will be
taken to increase the number of large manufacturing firms in the industry. This will be achieved
by creating an enabling environment so that small/medium firms can grow and prosper through
increasing direct investment – both domestic and FDI - in the manufacturing industry.”-
(National Planning Commission, NPC, 2009)
The fundamental objectives of the Nigerian economic transformation agenda include the
achievement of economic diversification, transformation of the structure of exports from primary
commodities to processed and manufactured goods and the attainment of high levels of
efficiency and productivity, in order to be globally competitive. Process innovation in the
manufacturing industries may be labour-saving and job-displacing based on the complexity of
the relationship. In a drive to build capacity and innovation, the Nigerian economic
transformation blueprint recognizes that capacity building needs to be based on clear and
dynamic strategies and policy measures that would foster innovation and entrepreneurship,
facilitate the diffusion of Information and Communication Technology (ICT), foster the
development of Research and Development and promote worker education and training inter
alia. The promotion of business and technology innovation is been driven through the
development of incubators. Also, effective linkages formed with local universities and research
institutions is been forged to encourage innovation and promote indigenous research and
development.
To ascertain a favourable policy environment the Nigerian Investment Promotion Commission
(NIPC) serves in removing unnecessary controls and creating an atmosphere of trust and
transparency to encourage innovation and entrepreneurship of our businessmen, industrialists
and traders; all of which should facilitate the development of Nigeria as a global hub for
manufacturing, trading and services. The Commission seeks out and nurture special focus areas
which would generate additional employment opportunities. In addition, promoting sustainable
development and application of acceptable and profitable technologies through strategic
investments in biotechnology research and development to support innovation and economic
development is one of the motivations of the NIPC.

8
In its incentive policy for investment, the NIPC4 seek to promote MSMEs5 utilization of modern
and appropriate technology and innovations from research and development institutions. This
would increase the capacity and diversity of the private sector by providing opportunities for
international and local investors and contractors in public infrastructure, encouraging efficiency,
innovation, and flexibility at minimum cost. An impact evaluation of such programmes engaged
by the government to drive these policies will enable NIPC through investment promotion create
more jobs in the economy. The timing of this study is thereby apt as it will in a substantial
measure provide a basis for evaluating the performance of the existing policies on innovation in
Kenya and Nigeria and the effectiveness of the frameworks for achieving their current national
plans.
3. Brief Literature Review
Technology is transmitted across country borders through international trade, foreign private
investments, research and development efforts and so forth. Foreign trade, for instance, has a
potential to carry knowledge; in this case imports are crucial in the introduction of foreign
technology to domestic production and could also spur on factor productivity. Hence, the degree
of openness of a particular country will determine the benefits it can glean from foreign research
and development. With the importation of technology, the human capital component aids the
adoption of foreign technology and the creation of appropriate domestic technology. There are
studies that show empirically that countries tend to record rapid total factor productivity growth
the more they import from leading world technology countries. (Coe et al, 1997; Coe and
Helpman, 1995; Keller, 1998)
The firm-specific advantages that may spur FDI as proposed by Hymer include: access to raw
materials; economies of scale; intangible assets such as trade names, patents, superior
management skills; reduced transaction costs when replacing an arm's length transaction (a
transaction in which the buyers and sellers of a product act independently and have no
relationship to each other; each party acts independently in their own self-interest with no
pressure from the other party) in the market by an internal firm transaction. Firms will therefore
4 See NIPC (2012) for details on policy incentives for investment in Nigeria 5 Micro, Small and Medium Scale Enterprises

9
only venture into FDI if the benefits of exploiting firm-specific advantages outweigh the relative
costs of their operations abroad. In sum therefore venturing into FDI is a firm-level strategy
decision rather than a capital-market financial decision. Dunning recognized the importance of
the internalization theory in his eclectic paradigm but asserts that it only provides a partial
explanation for FDI flows.
It is widely acknowledged that foreign direct investment (FDI) has played an important role in
the economic development of host countries. FDI inflows contribute to physical capital
accumulation, help to boost domestic employment, and may increase domestic competition,
particularly in the short run. In addition, it is argued that FDI can positively affect domestic
industries and firms, where positive spillovers can exist. Thus, testing the technology spillover of
FDI empirically has attracted some attention. Foreign firms often have some advantages (usually
technological superiority) to offset their disadvantages compared with local firms. These
advantages inevitably benefit their local counterparts, either through backward and forward
linkage, labour mobility, or a demonstration effect (Blomstrӧm and Kokko, 1998).
The empirical findings on the nature of spillovers from foreign direct investment are mixed with
some studies noting negative spillovers while others find positive spillovers. Branstetter, 2005;
Caves, 1974; Chuang and Lin, 1999; Globerman, 1979; Sinani and Meyer, 2004 find positive
technology spillovers from FDI in Australia, Canada, Taiwan, Estonia, and the United States,
respectively. Barrios and Strobl, 2002; Barrios, Dimelis, Louri, and Strobl, 2004; Dimelis and
Louri, 2004 also found positive spillovers in Spain, Greece, and Ireland, with the scale of
spillovers depending on firm-specific characteristics. In contrast, Aitken and Harrison (1999)
and Sadik and Bolbol (2001) find negative spillovers from FDI in Venezuela and six Arab
countries, respectively. Braconier, Ekholm, and Knarvik (2001) find no evidence of FDI-related
research and development (R&D) spillovers in Sweden. Girma, Greenaway, and Wakelin (2001)
find no aggregate intra-industry spillovers from FDI in the United Kingdom. In fact, the findings
are so mixed that the study by Görg and Strobl (2001) focused on exploring reasons that can be
adduced for the mixed results.

10
In examining the determinants of technology spillovers to host countries, most studies do not
extensively examine other determinants of the magnitude of the spillovers such as host country
innovation and imitation activities. However, Elmawazini (2010) conducted an investigation on
host country innovation and imitation activities, measured by R&D spending as a percentage of
GDP, as a main determinant of FDI technology spillovers using U.S. multinational enterprises
(MNEs) data from the Bureau of Economic Analysis (BEA). The study thus extracts the
technology diffusion effect from other productivity effects of FDI. The results of the panel data
regressions indicate that host country spending on R&D has a positive and significant impact on
the magnitude of technology spillovers from FDI in 38 developed and developing countries over
the period 1966–2000. The study also indicates that government policies encouraging R&D
activities may significantly increase the magnitude of technology spillovers from FDI.
Most countries in Europe and other developed countries develop community innovation surveys
(CIS) which facilitate the analysis of innovation activities amongst firms. Using published CIS
data Castellani and Zanfei (2003) showed for the Italian case that exist significant differences in
the productivity and innovation behaviours of manufacturing firms, and noted the role affiliation
to MNCs plays in the disparities that exist. Foreign affiliated domestic firms and fully owned
foreign firms were more productive, seek technological linkages and collaborations and more
likely to invest in product innovation and R&D than non-affiliated domestic counterparts. Even
though most activities of affiliated firms relating the product innovation, R&D and technological
collaborations are engineered mostly from their headquarter country base and diffused to the
affiliates.
There are emerging studies of the empirics of FDI technology spillovers on India, Joseph (2007)
and Sasidharan (2007) are two of such studies. Using panel data for the period 1989-2004 Joseph
(2007) examined the effects of spillovers from FDI on the productivity performance of Indian
manufacturing firms as well as the role of the absorptive capacity of domestic firms in utilizing
such spillovers. The study results indicate the presence of positive spillover effects from foreign
firms’ market presence on increases the productivity of domestic firms. It was observed that
there is both a competition effect from the presence of foreign firms and a complementary effect
due to backward linkages between domestic firms and foreign firms, where local firms act as
11
suppliers of raw materials to the foreign firms. The observed vertical effects were the key
facilitators of positive spillovers from FDI. The empirical analysis also suggests that greater
productivity benefits from both horizontal and backward linkages are associated with high R&D
intensity of domestic firms.
Managi and Bwalya (2010) analyzed the nature and occurrence of technology spillovers from
foreign to local firms in the manufacturing sectors of Kenya, Tanzania and Zimbabwe. Using
similar data based on the World Bank RPED surveys for the period 1993-1995, the authors
examined horizontal, vertical and regional technology spillovers in these three countries. In the
model developed three productivity spillover variables (horizontal spillover, vertical spillovers
and agglomeration spillovers) were included in the conventional Cobb-Douglas production
function to study their effects on productivity. A system generalized method of moments (GMM)
was employed and the estimator was found to be consistent and efficient. The spillover effects
were found to vary across the three countries; however, evidence of intra-industry and inter-
industry productivity spillovers were established for Kenya and Zimbabwe. Only the regional
spillover variable was found to be positive and significant for Tanzania.
Using a comprehensive firm-level panel data (containing firm-level and labour force
information) from the manufacturing sector over the period 1992-1998, Waldkirch and Ofosu
(2010) examined the effect of foreign presence in manufacturing in Ghana on productivity and
wages as well as possible occurrence of spillovers to domestic firms. Employing a recent
methodology of the OLS and the system GMM, after controlling for observed and unobserved
heterogeneity, the study results indicated that foreign firms in a given sector have a negative
effect of the productivity of domestically owned firms, but a positive effect on most foreign-
owned firms.
To our knowledge existing literature on the nature of FDI on the Nigerian economy focus mostly
on the analysis of macroeconomic determinants of FDI as well as its impact on economic
growth. Ayanwale (2009), Okodua (2009), Nwankwo (2006) and Ogunkola and Jerome (2006)
are few examples of such studies. For an instance, Nwankwo (2006) carried out an analysis of
data over the period 1962-2003 identified the main determinants of FDI inflows to Nigeria; the
12
study identified presence of natural resources as well as political and economic instability as
major determinants of inward FDI to Nigeria. The study by Ogunkola and Jerome (2006) is a
comprehensive review of the magnitude, direction and prospects of foreign direct investment in
Nigeria.
A few conceptual and policy oriented studies could also be identified in the literature on the
technology externalities of FDI for the Nigerian context. Uwaifo and Uddin (2009) merely
examined the level of Nigeria’s technology dependence, highlighting the causes of technological
backwardness and presenting suggestions for developing technological productivity. A policy
framework was put forward in Dutse, Okwoli and Kurfi (2011), based on the literature indication
that significant technology spillover may occur amongst technologically active subsidiary firms
and indigenous firms with high absorptive capabilities. The authors posited that policies in
favour of improved technical education, promoting certain and institutional support for enhanced
technological capable constitute a formidable and favourable environment for knowledge
exchanges.
In an empirical study Yauri (2006) used data from World Bank Manufacturing Survey on
Nigeria 2001, to investigate whether or not manufacturing firms benefit from FDI. Out of the
total number of firms involved in the Survey, 232 manufacturing firms were covered. Due to
nature of the data from the Survey a probit regression was employed. The probit regression
model estimated consists of binary outcome variables that captured firm’s use of technology,
age, size and regional location. The analysis tested the hypothesis that FDI-invested firms do not
employ more technology than non-FDI firms in the Survey. Findings revealed that FDI-invested
firms employ more technology than non-FDI invested firms. The study however did not test for
the presence of inter-industry spillovers of technology. The nature of the research instrument and
data used for the investigation apparently placed a limit on the extent of analysis that could be
carried out by the author. Similarly a survey sample of 200 small and medium food companies
this was carried out in cities in south-western Nigeria to test the absorptive capacity hypothesis
(Abereijo and Ilori, 2012). The study provides evidence that supports the notion that the presence
of MNCs alone does not guarantee the occurrence of spillovers but more important was the level
of absorptive capacity exercised by the domestic local firms.

13
Based on the foregoing, the importance of favourable institutional frameworks, industrial policy,
technology policy and political will on the industrial development of a country has been
highlighted from the experience of developed and emerging economies. Also, the role of human
resource development in the making of a strong and highly competitive industrial sector is
mirrored by the East Asian economic development experience. It is also recognized that there are
advantages that accrue to latecomer countries in development and challenges to keep up with the
trends of the global market (Oyelaran-Oyeyinka and Sampath, 2010). The emphasis of
innovation in industrial development has not come at a better time than this for developing
countries to study how to harness the forces of globalization to their advantage; noting that
building a strong industrial economy is tantamount to remaining on the competitive edge of the
industry. The literature is vast on the economies of South East Asia, new industrializing
economies, the industrial countries of Europe and the Americas and relatively few emerging
studies on Africa in the last decade. However, literature on the systematic study of the effect of
FDI on innovation and technology development in the Nigerian economy has received least
concentrated attention as this study proposes to highlight.
4. Data
Data used in the empirical analysis is the 2007 Productivity and Investment Climate Data
(otherwise known as the World Bank Enterprise Survey) conducted by the World Bank. The
survey consisted of a series of structured, face-to-face interviews with key senior
managers/owners of a sample of establishments. The survey methodology followed a stratified
random sampling. Based on the ISIC (revision 3.1) classification, the following industries were
targeted: all manufacturing sectors, construction, retail and wholesale services, hotels and
restaurants, transport, storage, and communications, and computer and related activities. The
firms surveyed were categorized into private domestic and foreign firms, excluding the state-
owned enterprises which were not covered in the survey. The survey instrument constitutes
information on: sales and export, supplies and imports, capacity and innovation, investment
climate constraints, infrastructure and services, conflict resolution and legal environment,
business-government relations, labour relations, finance and productivity.

14
The cross-section data used is drawn from a survey of firms in the Kenyan and Nigerian
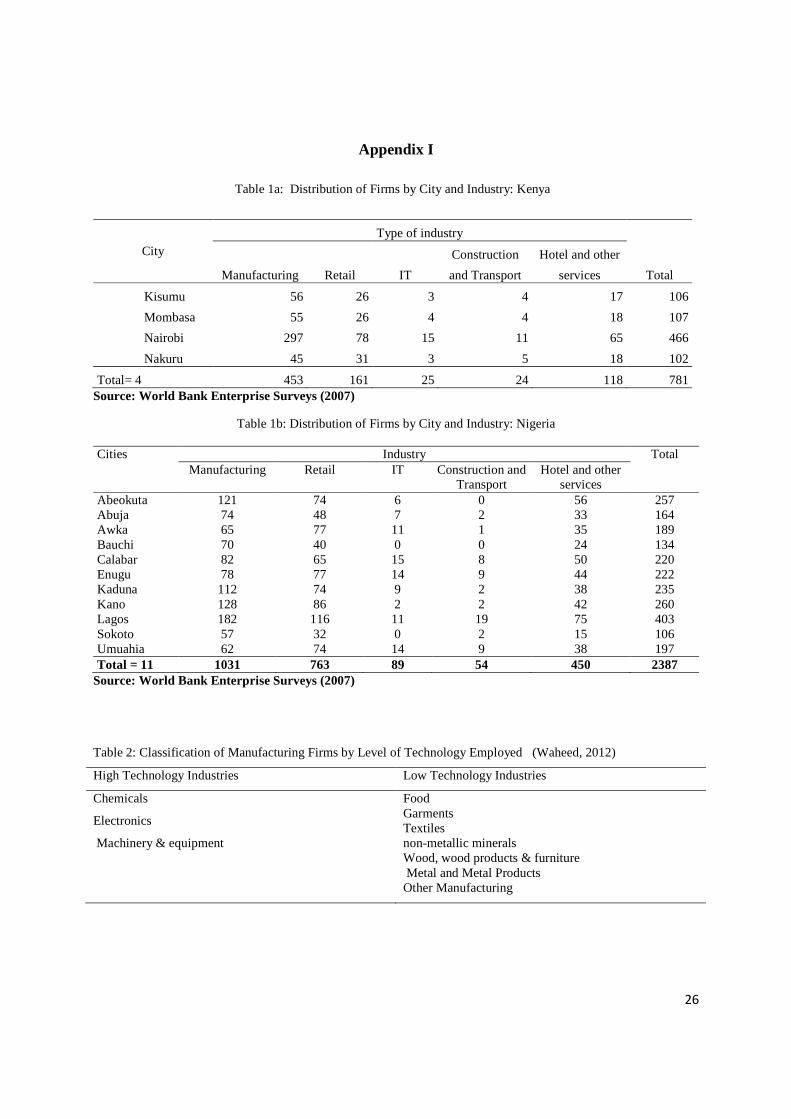
economy. Four cities of Kenya were covered in the survey- Nairobi, Kisumu, Mombasa and
Nakuru with a total of 435 manufacturing firms covered. A total of eleven (11) cities (Abeokuta,
Abuja, Awka, Bauchi, Calabar, Enugu, Kaduna, Kano, Lagos, Sokoto and Umuahia), were
covered in the survey of industries in Nigeria. For Nigeria a total of 1031 manufacturing
establishments were surveyed. In the appendix we show the distribution of the firms by industry
and city for both Kenya and Nigeria respectively. For this present study information on firms in
the manufacturing sectors alone were extracted. Other information drawn from the survey
questionnaires with respect to age, ownership structure, external trade relationships amongst
other things were used to define the variables used in the analysis.
5. Empirical Model and Results Discussion
Based on existing literature on factors affecting innovation and information drawn from the
World Bank Enterprise Survey (2007) we formulate hypotheses to test the interrelationship
between innovation and firm-specific characteristics. The dependent variable captures the
tendency of firms to engage in product innovation and process innovation, each of this is
captured in the binary form (0, 1) where 1 represents engagement in product innovation (or
process innovation) and zero otherwise. Amongst other things we test the hypothesis that FDI-
invested firms engage in more product innovation or process innovation than non-FDI invested
firms.
A logistic regression analysis was therefore expressed as:
0 1 1 2 2 ...1
ji j j n nj j
j
pINN LN X X X
pδ δ δ δ ε= = + + + + +
− (1)
where INNi (i=1,2) is the log of odds ratio of either engaging in product innovation (i=1) or of
engaging in process innovation (i=2); while the X’s are the various explanatory variables. �� is
the intercept while other �� are the multiple regression coefficient (i.e., the expected change in
INN per unit change in X assuming that all other Xs are held constant. In this context, the logistic
regression model, INN is the conditional probability of the form 1
pP INN
p
= −
that shows the
innovation activity as predicted by combinations of values of predictor variables. The analysis of

15
data was carried out with the Statistical Package for Social Sciences (SPSS) software. The
hypothesis formulated tested the interrelationship between firm characteristics and the innovation
activities engaged in. The dependent variable is measured as a dichotomous metric variable. In
eliciting all these, questions related to innovation activities of firms were analysed. The
predictors constitute selected control information and firm level characteristics.
Firm level control characteristics examined in the analysis include: age of firm, whether FDI-
invested or not, technology level of the firm (low tech and high tech), supplies of intermediate
product, ICT usage, engagement in training, firm’s exporting activity, possession of
internationally recognized quality certifications. Others include usage of technology licensed
from a foreign company, location of firm, level of competition reported in the market and
membership of a global production network. Based on the forgoing discussion, the following
regression model is specified for the empirical analysis:
0 1 2 3 4 5 6 7 8 9 10 i i i i i i i i i i i iINN A E ICT TL L SUB HT Q PB FCδ δ δ δ δ δ δ δ δ δ δ µ= + + + + + + + + + + +(2)
where INN constitutes PD (a dummy that measures whether the firm introduced new or
significantly improved products in the last three years) and PC (a measure of whether the firm
introduced new or significantly improved production processes within the last three years of
operation.
A is a numeric variable showing the age of the firm as at 2007.
E is a binary variable (1, 0) measuring the direct exporting activity of the firm.
The binary ICT (1, 0) captures the usage of information communication technologies in the
course of business operations.
TL (1, 0) measures the possession of technology licensed from foreign company.
L whether the firm is located in an industrial zone or export processing zone.
SUB is a binary variable (1, 0) that describes whether the firms is part of a multinational firm; a
subsidiary of a foreign company or a jointly-owned enterprise.
HT (1, 0) measures whether the firm is in a high technology utilizing manufacturing sector or not
Q measures (1, 0) whether or not firm possess of internationally recognized quality certification.
In order to capture learning via supply linkages PB (1, 0) indicates whether or not the firm’s

16
principal customer is a foreign subsidiary related to the principal customer of the firm’s goods is
asked Principal buyer is a multinational firm.
FC (1, 0) measures whether firm’s innovation activity is provoked by the intensity of foreign
competition.
The descriptive statistics for the firm-specific variables used in the analysis is presented in the
appendix. The impact of foreign competition and domestic competition on product or service
innovation is also captured in the data. To capture learning via supply linkages questions related
to the principal customer of the firm’s goods is analysed. A firm whose principal buyer is a large
multinational firm with more than 100 employees is more likely to seek improvement in product
or service delivery than those with lower cadre of customers. Whether or not manufacturing
firms are partly owned by foreigners is also captured in the analysis.
Table 1 shows the logistic regression result for the interrelationship between process innovation
activity of Nigerian manufacturing firms and selected firm-level characteristics. The coefficient
of each of the predictor variables shows the influence of each variable on the probability of
engaging in process innovation (or product innovation). On the whole the model explained of the
variance in the probability of engaging in innovation and correctly specified 62.6% of the cases.
Table 1: Logistic Regression Illustrating the Interrelationship between Process Innovation Activity and Selected Firm Characteristics
Firm characteristics B S.E. Wald df Sig. Exp(B)
Age 0.012 0.009 1.639 1 0.200 1.012 Foreign competition 0.601 0.214 7.868 1 0.005 1.825 Q, International Quality -1.326 0.397 11.167 1 0.001 .266 TL, licensed -0.312 0.302 1.066 1 0.302 .732 Exports -0.460 0.630 0.535 1 0.465 .631 Hightech 0.210 0.334 0.396 1 0.529 1.234 L, location -0.471 0.239 3.893 1 0.048 .624 ICT use -0.452 0.175 6.670 1 0.010 .637 Subsidiary -1.073 0.269 15.907 1 0.000 .342 Principal buyer 0.829 0.625 1.758 1 0.185 2.291 Constant 2.046 0.903 5.130 1 0.024 7.735 Overall percentage = 62.6% -2Log likelihood = 1331.571 Cox & Snell R Square = 0.089 Nagelkerke R Square = 0.118
The regression results show that age of the firm, intensity of foreign competition, firms in high
technology manufacturing sectors, status of firm’s principal buyer are positively related to the

17
occurrence of process innovation. When process innovation is observed the firm has introduced a
new or significantly improved production process including methods of supplying services and
ways of delivering products within the last years from the reference year. Possession of
international quality standards, technology licensed from foreign firms, use of ICT are negatively
related to occurrence of process innovations. Further, firms whose principal customers are large
firms are 2.291 times more likely to engage in process innovations than firms serving lower
cadre of customers. Firms in the high technology industries are 1.234 times more likely to
engage in process innovations than other firms in low technology manufacturing sectors. The
reality of foreign competition propels firms to improve their production processes hence the
quality of their output. Possession of internationally recognized quality certifications, intensity of
foreign competition, nature of the firm (whether it is a subsidiary of a multinational or not) are
significant factors in determining the extent of process innovation among Nigerian
manufacturing firms.
Table 2 shows the logistic regression result of the interrelationship between product innovation
activity of Nigerian manufacturing firms and selected firm-level characteristics. Introduction of
new or significantly improved products in Nigeria’s manufacturing sector is positively related
with the age of the firm, foreign competition, the status of the principal buyer of the firm’s
output, Export orientation of the firms, level of technology employed by firm. (see table 2)
Table 2: Logistic Regression Illustrating the Interrelationship between Product Innovation Activity and Selected Firm Characteristics
Firm characteristics B S.E. Wald df Sig. Exp(B)
Age 0.014 0.009 2.228 1 0.136 1.014 Foreign competition 0.411 0.214 3.697 1 0.055 1.508 Q, International Quality -0.805 0.402 4.006 1 0.045 0.447 TL, licensed -0.839 0.321 6.848 1 0.009 0.432 Exports 0.068 0.608 0.013 1 0.91 1.071 Hightech 0.008 0.348 0.000 1 0.983 1.008 L, location -0.821 0.252 10.591 1 0.001 0.44 ICT use -0.802 0.18 19.854 1 0.000 0.449 Subsidiary -0.912 0.269 11.495 1 0.001 0.402 Principal buyer 0.986 0.62 2.533 1 0.111 2.681 Constant 2.2 0.891 6.103 1 0.013 9.027 Overall percentage = 64.2% -2Log likelihood = 1310.936 Cox & Snell R Square = 0.107 Nagelkerke R Square = 0.143

18
Nigerian manufacturing firms whose principal buyer is a large firm are 2.681 times more likely
to engage in product innovation. It would suffice to state here based on the logistic regression
result in Table that firm’s age, intensity of foreign competition, international quality
certifications, export activity of firm, level of technology employed and the status of the
principal customer of the firm are all positively related to the occurrence of product innovation
of the firms in the manufacturing sector in the last three years. The more intense the foreign
competition the more likely it will be for the Nigerian manufacturing firm to produce new and
improved products.
Table 3 presents the logistic regression result of the interrelationship between process innovation
activity of Kenyan manufacturing firms and selected firm-level characteristics. It is observed that
possession of internationally recognized quality certifications, technology licensed from foreign
company, export activity, technology level of the firm, location of the firm in an industrial zone,
use of ICT and the status of the principal buyer of the company’s product are positively linked
with the occurrence of process innovation activity (see table 3). it thus evident that firms with
international quality certifications will be 7.338 times more likely to improve their production
processes than other firms. In a similar vein, firms whose principal customers are large firms and
who engage ICT are 2.124 and 4.047 times respectively more likely to process innovate than
other firms. However, subsidiaries of foreign firms are less likely to introduce new or improved
production processes than counterpart firms.
Table 3: Logistic Regression Illustrating the Interrelationship between Process Innovation Activity and Selected
Firm Characteristics of Kenya Manufacturing Firm characteristics
B S.E. Wald df Sig. Exp(B) Age -0.012 0.008 2.484 1 0.115 0.988 Q, International Quality 1.993 0.498 15.993 1 0.000 7.338 TL, licensed 0.217 0.388 0.312 1 0.576 1.242 Exports 0.079 0.275 0.083 1 0.774 1.082 Hightech 0.361 0.466 0.6 1 0.438 1.435 L, location 0.137 0.242 0.32 1 0.572 1.147 ICT use 1.398 0.257 29.61 1 0.000 4.047 Subsidiary -0.221 0.348 0.404 1 0.525 0.802 Principal buyer 0.753 0.331 5.176 1 0.023 2.124 Constant -0.72 0.206 12.169 1 0.000 0.487 Overall percentage = 71.7% -2Log likelihood = 511.350 Cox & Snell R Square = 0.21 Nagelkerke R Square = 0.282

19
Table 4 presents the logistic regression result of the interrelationship between product innovation
activity of Kenyan manufacturing firms and selected firm-level characteristics. The foreign
competition indicator was excluded from the variables of interest in the Kenya analysis text
above. Furthermore, Kenyan manufacturing firms with internationally recognized quality
certifications are 4.294 times more likely to introduce new products (See table 4). Firms who
make use of information communication technologies such as email and firm website can reach
out to more customers for feedback and inputs into new customer requirements and therefore
bring about innovations in products. In any case firms who use ICT and whose principal buyer is
a large firm are 3.526 and 3.436 times respectively more likely to generate product innovations
than other firms.
Table 4: Logistic Regression Illustrating the Interrelationship between Product Innovation Activity and Selected Firm Characteristics of Kenyan Manufacturing
Firm characteristics B S.E. Wald df Sig. Exp(B)
Age -0.012 0.008 2.633 1 0.105 0.988 Q, International Quality 1.457 0.443 10.803 1 0.001 4.294 TL, licensed -0.243 0.379 0.41 1 0.522 0.784 Exports 0.272 0.281 0.938 1 0.333 1.312 Hightech 0.134 0.465 0.083 1 0.773 1.144 L, location 0.259 0.243 1.13 1 0.288 1.295 ICT use 1.26 0.255 24.465 1 0.000 3.526 Subsidiary -0.478 0.347 1.899 1 0.168 0.62 Principal buyer 1.234 0.363 11.577 1 0.001 3.436 Constant -0.494 0.201 6.017 1 0.014 0.61 Overall percentage = 70.2% -2Log likelihood = 512.658 Cox & Snell R Square = 0.188 Nagelkerke R Square = 0.255
Overall, the model summary indicates accuracy level of 70.2 percent. However, the association
between the dependent variable and the predictor variables is indicated by Cox & Snell R Square
of 0.188 and Nagelkerke R Square of 0.255. Additional information provided in the Kenyan
survey indicate that being part of a global network of production, access to information on new
technological improvements as well as acquisition of technology innovation are key
determinants of process innovation and product innovation in Kenyan manufacturing firms.
7. Concluding Comments and Policy Implications
It is widely acknowledged based on the experience of developed and emerging developing
countries that the extent of innovativeness could increase the productivity of domestic firms and
lengthen their survival rate in the competitive business environment. Also, paradigm shifts from
20
producer innovation to inclusive innovation and user innovation, hold that in the ultimate
development itself must become more inclusive. Actions have proceeded from developing
countries in response to the dire inadequacies in the availability of infrastructure, knowledge
skills and development resources. This is seen in the equivocations for foreign direct investment
promotion policies in conjunction with other domestic resource mobilization efforts. How
necessary is foreign direct investment in ensuring inclusive development which would involve
inputs from domestic firms to generate more output solutions and technological development in
the economy? With the use of innovation indicators for firms provided in the World Bank
Enterprise Surveys, we examined the innovative activity of firms in the manufacturing sectors of
Kenya and Nigeria.
This study examined the key firm level characteristics that influence innovative activities of
manufacturing firms of Nigeria and Kenya. Concomitant to existing literature, firms who relate
with multinationals and foreign-owned companies via supply linkages tend to enjoy some
knowledge spillover effects. This is owing to the high quality requirements such multinational
corporations place on supplier firms. This in turn could influence the firm’s impetus to introduce
new and improved means of production. With the widespread use of information and
communication technologies, firms can also get feedback from their customers irrespective of
their geographical location. An effective feedback system would engender more inclusive
product innovations that will suit customer requirements and anticipated wants.
We conclude from our estimation results that subsidiaries of multinational firms more likely
engage in product innovation in the Nigerian manufacturing sector. Also, engaging ICT (for
example use of email and website) to either showcase products, services or to receive feedback
from a wide range of customers is crucial for product innovation. Location of firms in industrial
zones is also important for product innovation and this can be explained by the contagion effect
of the industrial environment, economies of clustering and the infrastructural facilities that
accrue to industrial residents of such zones. Technology licensing, a means of technology
transfer, was also observed to be a crucial determinant of product innovation in manufacturing
firms in the Nigerian cities covered in the survey. ICT usage, the status of the principal customer
of the firm’s output and possession of internationally recognized quality certifications were the

21
more crucial factors for product innovation in the Kenyan cities used for the survey. For both
Kenya and Nigeria, process innovation is mostly influenced by the intensity of foreign
competition, international quality certification, ICT usage as well as the ownership status of the
firm (whether or not it is a part of a multinational firm).
The export behaviour of firms in both Kenya and Nigeria had no significant effects on their
likelihood to engage in product or process innovation. This implies that most local
manufacturing firms produce goods with a focus on meeting domestic market demands rather
than seeking to expand export markets. However, studies such as Rettab, Rao and Charif (2009)
recognized with substantive evidence that a firm’s openness to the external economy does
influence innovation intensity. This can be explained by the fact that expanding capacity to
produce for the external context keeps the firm abreast of the latest developments, current
production trends, greater capacity to meet growing customer requirements as well as
maintaining the competitive edge in the sector.
As we approach the lapse period for the millennium development goals, the new focus is on
innovation and inclusive development. Thus, only diagnostic and innovative thinking will be the
key to driving development agenda in the world and especially for developing countries. The
emerging performances recorded by emerging developing countries (EDCs) of which the BRICS
presents lessons for other developing countries in Africa. Therefore, even though creating
incentives to attraction of foreign direct investment to the continent is important. Greater
emphasis should be placed on promoting firm level practices that will aid spillovers of
knowledge, technology and managerial skills to local firms from the MNCs in the domestic
economy. It is via such learning experiences that domestic firms can take on advanced
techniques and management practices employed by foreign-owned and operated firms.
In conclusion, does the presence of foreign owned firms assure the economy of new production
techniques, greater investment in domestic innovation, research and development activities;
skills and training in entrepreneurship, management and marketing? The estimation results of
this study indicated that an improvement in domestic firm product and processes owing to the
presence of foreign firms in the sector within which it operates is not automatic. Thus, bringing

22
to fore the importance of the interactions with foreign firms in the form of supply linkages, use
of ICT, adopting technology licensed from foreign companies which would attract opportunities
for formal staff training in current technology trends. This is crucial as improved skills and
competence building systems are of utmost relevance to ensuring a more inclusive global
economy. To monitor the impact evaluation of such FDI promoting policies in the domestic
economy, therefore, governments of developing countries are encouraged to engage in collecting
periodical community innovation surveys (CIS). The availability of such community innovation
surveys will provide the efficient evaluation of national systems of innovation and their attendant
impact of firm-level productivity can be observed. CIS are already been utilized by developed
countries as a veritable tool for policy analysis and formulation.
References
Abereijo, I. O., & Ilori, M. O. (2012). Technological Spillovers from Multinational Companies to Small and Medium Food Companies in Nigeria. In H. Y. Sun, Management of Technological Innovation in Developing and Developed Countries (pp. 183-214). Shanghai: InTech.
African Development Bank. (2008). Kenya: 2008-2012 Country Strategy Paper . African Development Bank.
Aitken, B. J., & Harrison, A. E. (1999). Do Domestic Firms Benefit from Direct Foreign Investment? Evidence from Venezuela. American Economic Review , 89, 605-618.
Akkemik, A. A. (2008). Industrial Development in East Asia: A Comparative Look at Japan, Korea, Taiwan and Singapore. (Vol. Series on Economic Development and Growth Vol 3). Singapore: World Scientific Publishing Company.
Ayanwale, A. B. (2007). FDI and Economic Growth: Evidence from Nigeria. AERC Research Paper 165. Nairobi: African Economic Research Consortium.
Barrios, S., & Strobl, E. (2002). Foreign Direct Investment and Productivity Spillovers: Evidence from Spanish Experience. Review of World Economics/Weltwirtschaftliches Archiv , 138 (3), 459-481.
Barrios, S., Dimelis, S., Louri, H., & Strobl, E. (2004). Efficiency Spillovers from Foreign Direct Investment in the EU Periphery: A Comparative Study of Greece, Ireland and Spain. Review of World Economics , 140 (4), 688-705.

23
Blind, K., & Jungmittag, A. (2004). Foreign Direct Investment, Imports and Innovations in the Service Industry. Journal of Industrial Organization , 25, 205-227.
Blomstrom, & Kokko, A. (1998). Multinationational Corporations and Spillovers. Journal of Economic Surveys , 2, 247-277.
Braconier, H., Ekholm, K., & Knarvik, M. (2001). Does FDI Work as a Channel for R&D Spillovers? Evidence Based on Swedish Data. Research Institute of Industrial Economics Working Papers 553 , Research Institute of Industrial Economics (IFN).
Branstetter, L. (2005). Is Foreign Direct Investment a Channel of Knowledge Spillovers? Evidence from Japan's FDI in the United States. Journal of International Economics , 68 (2), 325-344.
Castellani, D., & Zanfei, A. (2003). Innovation, Foreign Ownership and Multinationality. An Empirical Analysis on Italian Firms. Mimeo, University of Urbino .
Caves, R. E. (1974). Multinational Firms, Competition and Productivity in Host-Country Markets. Economica , 41, 176-193.
Chuang, Y.-C., & Lin, C.-M. (1999). Foreign Direct Investment, R&D and Spillover Efficiency: Evidence from Taiwan's Manufacturing Sector. Journal of Development Studies , 35 (4), 117-137.
Dimelis, S. P., & Louri, H. (2004). Foreign Direct Investment and Technology Spillovers. Which Firms Really Benefit. Review of World Economics , 120 (2), 230-253.
Dutse, A. Y., A, O. A., & Kurfi, A. K. (2011). Promoting FDI-related Technology Spillover in Nigeria’s Manufacturing Sector: Active-firms Targeted Policy Approach. 2011 International Conference on Sociality and Economics Development. IPEDR , 10.
Etude Economique Conseil. (2010). Enterprise Survey (Productivity and Investment Climate Survey) in Nigeria 2009: Sample Survey Methodology Design. EEC .
Gachino, G. (2007). Technology Spillovers from Multinational Presence: Towards a Conceptual Framework. UNU-MERIT Working Paper No. 017 .
Girma, S., Greenaway, D., & Wakelin, K. (2001). Who Benefits from Foreign Direct Investment in the UK? Scottish Journal of Political Economy , 48 (2), 119-133.
Globerman, S. (1979). Foreign Direct Investment and Spillover Efficiency Benefits in Canadian Manufacturing Industries. Canadian Journal of Economics , 12 (1), 42-56.

24
Görg, H., & Strobl, E. (2001). Multinational Companies, Technology Spillovers and Plant Survival: Evidence for Irish Manufacturing. European Economy Group Working Papers 8. European Economy Group.
Griffith, R., Waithe, K., & Craigwell, R. (2008). The Significance of Foreign Direct Investment to Caribbean Development. Mimeo, Ministry of Finance, Economic Affairs and Energy and University of the West Indies .
Hale, G., & Long, C. (2011). Are there Productivity Spillovers from Foreign Direct Investment in China? Pacific Economic Review , 16 (2), 135-153.
Jensen, C. (2004). Localized Spillovers in the Polish Food Industry: The Role of FDI in the Development Process? Regional Studies , 38 (5), 535-550.
Lewis, W. A. (1954). Economic Development with Unlimited Supplies of Labour. The Manchester School , 22, 139-191.
Marcin, K. (2008). How Does FDI Inflow Affect Productivity of Domestic Firms? The Role of Horizontal and Vertical Spillovers. The Journal of International Trade and Economic Development , 17 (1), 155-173.
Nwankwo, A. (2006). The Determinants of Foreign Direct Investment Inflows in Nigeria. Being Paper Presented at the 6th Global Conference on Business and Economics October 15-17, 2006 Gutman Conference Center, USA .
Ogunkola, E. O., & Jerome, A. (2006). Foreign Direct Investment in Nigeria: Magnitude, Direction and Prospects. In S. Ibi Ajayi, Foreign Direct Investment in Africa: Origin, Targets, Impact and Potential (pp. 144-176). Nairobi: African Economic Research Consortium.
Okodua, H. (2009). Foreign Direct Investment and Economic Growth: Co-integration and Causality Analysis of Nigeria. The African Finance Journal , 11 (1), 54-73.
Oyelaran-Oyeyinka, B. (2010). Building Africa’s Innovation Capacity. Mimeo Research and Monitoring Division UN-HABITAT and UNU-MERIT .
Oyelaran-Oyeyinka, B. (2007). ICTs and Industrial Development: Transformation and Employment Generation. A Framework Paper Submitted to African Economic Research Consortium (AERC) .
Oyelaran-Oyeyinka, B., & Sampath, P. G. (2010). Latecomer Development: Innovation and Knowledge for Economic Growth. London: Routledge.
Rettab, B., Rao, A., & Charif, H. (2009). Why do Firms Venture in External Markets? The Case of Dubai. International Research Journal of Finance and Economics , 29, 146-159.

25
Romer, P. M. (1993). Idea Gaps and Object Gaps in Economic Development. Journal of Monetary Economics , 323, 543-573.
Sadik, A. T., & Bobol, A. A. (2001). Capital Flows, FDI, and Technology Spillovers: Evidence from Arab Countries. World Development , 89 (12).
Sun, S. (2011). Foreign Direct Investment and Technology Spillovers in China's Manufacturing Sector. The Chinese Economy , 44 (2), 25-42.
Todaro, M. P., & Smith, S. C. (2003). Economic Development (8th Edition ed.). Delhi: Pearson Education.
UNCTAD. (2005). Economic Development in Africa: Rethinking the Role of Foreign Direct Investment. Geneva: United Nations.
UNCTAD. (1999). Foreign Direct Investment and the Challenge of Development. World Investment Report 1999. New York & Geneva: United Nations.
UNCTAD. (2007). Globalization and Inclusive Development. Note by the UNCTAD Secretariat TD/B/54/7; Trade and Development Board Fifty-fourth Session Geneva, 1–11 October 2007 .
UNCTAD. (2009). Investment Policy Review: Nigeria. Switzerland: United Nations.
UNCTAD. (2011). World Investment Report: Non-Equity Modes of International Production and Development. Geneva: United Nations.
Uwaifo, V. O., & Uddin, P. S. (2009). Technology and Development in Nigeria: The Missing Link. Journal of Human Ecology , 28 (2), 107-111.
Waheed, A. (2012). Employment Effect of Innovation: Microdata Evidence from Bangladesh and Pakistan. UNU-MERIT Working Paper Series No. 2012-024 .
Waldkirch, A., & Ofosu, A. (2010). Foreign Presence, Spillovers and Productivity: Evidence from Ghana. World Development , 38 (8), 1114-1126.
Yauri, N. M. (2006). Foreign Direct Investment and Technology Transfer to Nigerian Manufacturing Firms: Evidence from Empirical Data. Central Bank of Nigeria Economic and Financial Review , 44 (2), 18-38.
26
Appendix I
Table 1a: Distribution of Firms by City and Industry: Kenya
City
Type of industry
Total Manufacturing Retail IT
Construction
and Transport
Hotel and other
services
Kisumu 56 26 3 4 17 106
Mombasa 55 26 4 4 18 107
Nairobi 297 78 15 11 65 466
Nakuru 45 31 3 5 18 102
Total= 4 453 161 25 24 118 781 Source: World Bank Enterprise Surveys (2007)
Table 1b: Distribution of Firms by City and Industry: Nigeria
Cities Industry Total Manufacturing Retail IT Construction and
Transport Hotel and other
services Abeokuta 121 74 6 0 56 257 Abuja 74 48 7 2 33 164 Awka 65 77 11 1 35 189 Bauchi 70 40 0 0 24 134 Calabar 82 65 15 8 50 220 Enugu 78 77 14 9 44 222 Kaduna 112 74 9 2 38 235 Kano 128 86 2 2 42 260 Lagos 182 116 11 19 75 403 Sokoto 57 32 0 2 15 106 Umuahia 62 74 14 9 38 197 Total = 11 1031 763 89 54 450 2387
Source: World Bank Enterprise Surveys (2007)
Table 2: Classification of Manufacturing Firms by Level of Technology Employed (Waheed, 2012)
High Technology Industries Low Technology Industries
Chemicals
Electronics
Machinery & equipment
Food Garments Textiles non-metallic minerals Wood, wood products & furniture Metal and Metal Products Other Manufacturing

27
Appendix II
Descriptive Statistics on Variables: Nigeria
Variables Minimum Maximum Mean
Std. Deviation
Process innovation PC 0 1 0.489 0.500
Produc Innovation PD 0 1 0.498 0.500
Firm's age in 2007, A 0 59 10.277 7.446
Subsidary, SUB 0 1 0.093 0.291
Principal customer is large firm,PB
0 1 0.031 0.247
ict usage, ICT 0 1 0.210 0.407
Location in Izone, L 0 1 0.111 0.314
High tech, HT 0 1 0.053 0.225
Direct Exports E 0 1 0.019 0.138
Technology Licensed TL 0 1 0.087 0.282
Quality Certification Q 0 1 0.075 0.263
Foreign Competition FC 0 1 0.485 1.306
Descriptive Statistics on Variables: Kenya
Variables Minimum Maximum Mean
Std. Deviation
Process innovation PC 0 1 0.574 0.495
Produc Innovation PD 0 1 0.607 0.489
Firm's age in 2007, A 1 87 21.033 15.553
Subsidary, SUB 0 1 0.139 0.346
Principal customer is large firm,PB
0 1 0.358 0.767
ict usage, ICT 0 1 0.631 0.483
Location in Izone, L 0 1 0.422 0.494
High tech, HT 0 1 0.082 0.274
Direct Exports E 0 1 0.322 0.468
Technology Licensed TL 0 1 0.126 0.332
Quality Certification Q 0 1 0.148 0.355


