
The Economic Impact of Tourism in Buncombe County, North Carolina
2014 Analysis
June 2015

2
Introduction and definitions
This study measures the economic
impact of tourism in Asheville,
Buncombe County.
Visitors included those who stayed in
overnight accommodations or
travelers who came from a distance
greater than 50 miles.
The impact of tourism includes direct
spending, the indirect (supply-chain)
effects, and induced (income) effects.
Impacts were measured in terms of
employment, income, business sales,
and tax revenues.

Headline Results

4
Headline results
Tourism is an integral part of the
Asheville regional economy, and the
industry is making significant
contributions to economic growth,
generating business sales,
employment, and tax revenues.
Visitors to Asheville spent $1.7
billion in 2014, which generated $2.6
billion in total business sales,
including indirect and induced
impacts.
Tourism in Asheville generated $287
million in tax revenues in 2014,
including $144 million in state and
local revenues.

5
Headline results
Including direct, indirect, and
induced impacts, 24,856 jobs
were sustained by visitors to
Asheville in 2014 with total
income of $714 million.
Approximately 14.8% (1 in 7) of
all jobs in Buncombe County
were sustained by tourism.
An estimated 25% of tourism-
supported jobs were in the food
and beverage industry, 18% in
lodging, 13% were in retail, and
12% in recreation.

Key Trends in 2014

7
Key themes for 2014
Visitor volume and spending
in the Asheville region grew in
2014, driven by job and
income growth in the broader
North Carolina and regional
economy.
An estimated 9.8 million
visitors (including day and
overnight) spent a total of $1.7
billion in 2014, increases of
3.9% and 4.6%, respectively,
from 2013.
1.2
1.3
1.4
1.5
1.6
1.7
1.8
7.5
8.0
8.5
9.0
9.5
10.0
10.5
09 10 11 12 13 14
Visitor volume, mil (L)
Visitor spending, $bils (R)
Visitor Volume and Spending
Sources: Longwoods International, Tourism Economics
Buncombe County

8
Key themes for 2014
Asheville’s lodging fundamentals
continued to tighten in 2014.
Room demand rose 3.1%,
compared with a 0.8% decrease
in room-supply, versus 2013.
Strong demand growth boosted
occupancy to 69.3%, up from
66.6% in 2013.
Rising occupancy drove room
rates higher by 5.6% from 2013.
Strong demand and rising prices
boosted room revenues 9.0%
versus 2013.
-8
-6
-4
-2
0
2
4
6
8
09 10 11 12 13 14
Change in occupancy, ppt
Average daily rate, % ch
Tightening Occupancy Boosted PricesAsheville market
Source: Smith Travel Research
0
50
100
150
200
250
300
1.0
1.2
1.4
1.6
1.8
2.0
2.2
09 10 11 12 13 14
Room Demand, mils of room nights (L)
Room revenues, $ mils (R)
Lodging Demand Is Rising
Source: Smith Travel Research

9
Key themes for 2014
Within the County, tourism
employment is expanding
faster than overall job growth.
Industry employment is 12.6%
higher than in 2009, versus
8.7% for the County overall.
Tourism has added nearly 400
jobs per year since 2009,
average annual growth of
2.4%.
In 2014, the unemployment
rate in the county was 4.6%.
Without tourism it would have
been 15.9%.
92
94
96
98
100
102
104
106
108
110
112
114
05 06 07 08 09 10 11 12 13 14
USNorth CarolinaBuncombe CountyBuncombe Tourism
Tourism Jobs Outpace the Broader Recovery
Sources: BEA, BLS, Tourism Economics
Employment indexes, 2009=100

Visitors and Spending

11
Visitor details in 2014
Asheville hosted a total of 9.8
million visitors in 2014.
Most visitors were day visitors
(65.9%) and most came for
leisure (86.7%).
International visitors
accounted for 0.9% of total
visitor volume.
The average visitor spending
was $104 per person per day,
0.4% higher than in 2013. The
average party spending was
$381 per trip.
0%
10%
20%
30%
40%
50%
60%
70%
80%
90%
100%
Day/Overnight Domestic/Int'l Liesure/Business
Visitor Characteristics2014
Sources: DKS, Tourism EconomicsNote: Overnight/Day and Bus./Leisure segments are domestic only
Overnight(34.1%)
Day(65.9%)
Int'l(0.9%)
Domestic(99.1%)
Bus.(13.3%)
Leis. (86.7%)

12
Composition of tourism spending
Food and beverage accounted for most visitor spending with $449
million, followed by retail at $399 million, $329 million in lodging
spending, and $237 million in local transportation in 2014.
About half of visitor spending was on food and beverage and retail
combined, and lodging accounted for 20% of visitor spending.
449.0
398.9
328.7
236.5 234.6
0
100
200
300
400
500
Food Retail Lodging Rec Trans
2013
2014
Visitor Spending by Category$ million
Source: Tourism Economics
Food27.2%
Retail24.2%
Lodging19.9%
Rec14.4%
Trans14.2%
Visitor Spending Profile for 2014Avg per person per
day = $104
Source: Tourism Economics

13
Lower fuel prices free up resources
Fuel prices have been on a
two-year slide, freeing up
resources to spend in other
categories.
Low gas prices also boost
consumer confidence,
encouraging more trips and
visitor spending that otherwise
might not occur.
Oxford Economics forecasts
oil prices to remain under $80
per barrel through 2018,
implying an average price in
Asheville under $3.00 per
gallon for an extended period.
1.0
1.5
2.0
2.5
3.0
3.5
4.0
4.5
06 07 08 09 10 11 12 13 14 15
South Atlantic Region
12-mo MA
Fuel Prices Are On a Two-Year Decline
Source: Energy Information Administration
South Atlantic Region average gasoline price, dollars per gallon

14
Visitor spending trends
Visitor spending increased 4.6% in 2014, with the lodging and food
and beverage industries leading. Lodging spending grew 9.0% as
both prices and room-night demand increased.
Visitor spending on food and beverage and recreation increased 6.8%
and 4.4%, respectively, changes that were similar to those of one year
ago, maintaining momentum.
2010 2011 2012 2013 20142013-14
% ch
Food and beverage 349.9 370.9 394.3 420.6 449.0 6.8%
Retail 338.9 351.3 370.8 395.1 398.9 1.0%
Lodging 232.5 247.7 268.5 301.7 328.7 9.0%
Recreation 211.1 209.7 215.1 226.6 236.5 4.4%
Transportation (local) 191.5 224.9 228.8 232.8 234.6 0.8%
Second homes value 46.1 45.1 49.5 55.8 59.1 6.0%
Air 3.6 3.5 3.1 3.2 3.4 4.1%
Total 1,373.5 1,453.0 1,530.1 1,635.9 1,710.4
% change 5.4% 5.8% 5.3% 6.9% 4.6%
Visitor Spending By Category
(US$ Million)

Economic Impacts

16
How visitor spending generates impact
Lastly, the induced impact is
generated when employees
whose incomes are
generated either directly or
indirectly by tourism, spend
those incomes in the
Buncombe County economy.
• Travelers create direct economic value within a discreet group of sectors (e.g. recreation,
transportation). This supports a relative proportion of jobs, wages, taxes, and GDP within
each sector.
• Each directly affected sector also purchases goods and services as inputs (e.g. food
wholesalers, utilities) into production. These impacts are called indirect impacts.

17
Tourism sales
Including indirect and induced business sales, tourism generated
more than $2.6 billion in revenue in 2014.
Direct Indirect Induced Total
Agriculture, Fishing, Mining - 0.2 0.2 0.4
Construction and Utilities - 39.6 13.2 52.8
Manufacturing - 14.3 6.3 20.6
Wholesale Trade - 8.5 15.0 23.6
Air Transport 3.4 2.2 3.6 9.2
Other Transport 72.5 21.0 7.5 101.0
Retail Trade 398.9 4.2 39.7 442.8
Gasoline Stations 136.5 0.3 3.4 140.1
Communications - 32.7 14.7 47.4
Finance, Insurance and Real Estate 84.8 116.2 129.4 330.4
Business Services - 121.3 33.3 154.6
Education and Health Care - 1.5 93.5 95.0
Recreation and Entertainment 198.9 9.1 6.8 214.7
Lodging 328.7 0.7 0.4 329.9
Food & Beverage 449.0 20.4 32.5 501.9
Personal Services 37.7 15.3 20.8 73.7
Government - 16.9 7.0 23.9
TOTAL 1,710.4 424.6 427.2 2,562.1
* Direct sales include cost of goods sold for retail sectors
Tourism Sales
(US$ Million)

18
0
100
200
300
400
500
600
F&
B
Reta
il T
rade
FIR
E
Lodgin
g
Re
cre
atio
n
Bu
s. S
erv
ice
s
Ga
s
Oth
er
Tra
nsp
Education
Pers
onal
Serv
.
Constr
uction
Com
m.
Induced
Indirect
Direct
Tourism Sales by Industry$ million
F&B: Food and BeverageFIRE: Finance, Insurance, Real EstateBus. Services: Business ServicesGas: Gasoline StationsOther Transp: Other TransportationManu.: ManufacturingPersonal Serv.: Personal ServicesComm: Communication
Tourism sales
* Direct sales include retail cost of goods sold
Significant indirect
benefits

19
Tourism share of key industry employment
Tourism is a significant part of several industries – tourism directly
supports nearly all of lodging employment, 46% of recreation, and
more than 40% of food and beverage employment.
14.8%
16.7%
48.0%
51.4%
99.7%
0% 20% 40% 60% 80% 100%
TotalEconomy
Retail
Food & bev.
Recreation
Lodging
Direct
Indirect and induced
Tourism Employment Intensity by Industry
Source: Tourism Economics
Share of industry employment

20
Tourism employment details
The tourism industry supported 24,856 jobs or 14.8% of employment
(1-in-7 jobs) in Buncombe County in 2014, including indirect and
induced impacts.
Direct Indirect Induced Total
Agriculture, Fishing, Mining - 3 3 6
Construction and Utilities - 235 54 289
Manufacturing - 50 11 61
Wholesale Trade - 55 97 152
Air Transport 11 7 12 30
Other Transport 877 194 67 1,138
Retail Trade 2,557 65 599 3,220
Gasoline Stations 196 3 34 232
Communications - 135 46 181
Finance, Insurance and Real Estate 131 694 402 1,228
Business Services - 1,612 445 2,058
Education and Health Care - 29 1,018 1,047
Recreation and Entertainment 2,699 189 114 3,001
Lodging 4,492 7 4 4,502
Food & Beverage 5,375 349 573 6,297
Personal Services 646 251 322 1,219
Government - 149 47 196
TOTAL 16,983 4,026 3,848 24,856
Tourism Employment

21
Tourism employment summary
As a labor intensive
collection of services,
tourism-related industries
are significant Asheville
area employers.
The nearly 25,000 jobs
supported by Asheville
area tourism span every
sector of the economy,
either directly or
indirectly.
The most significant
indirect impacts are in
business services and
finance, real estate and
insurance.
F&B: Food and Beverage
FIRE: Finance, Insurance, Real Estate
Bus. Services: Business Services
Gas: Gasoline Stations
Other Transp.: Other Transportation
Personal Serv.: Personal Services
Wholesale Tr.: Wholesale Trade
0
1,000
2,000
3,000
4,000
5,000
6,000
F&
B
Lo
dgin
g
Re
tail
Tra
de
Re
cre
atio
n
Bu
s.
Serv
ice
s
FIR
E
Pe
rso
nal S
erv
.
Oth
er
Tra
nsp
Ed
uca
tio
n
Co
nstr
uctio
n
Ga
s
Go
v.
Induced
Indirect
Direct
Tourism Employment by Industry

22
Tourism personal income
Employees in the Asheville area earned $714 million as a
result of visitor activity in 2014.
Direct Indirect Induced Total
Agriculture, Fishing, Mining - 0.1 0.1 0.1
Construction and Utilities - 10.4 2.8 13.1
Manufacturing - 2.5 0.5 3.0
Wholesale Trade - 3.0 5.3 8.4
Air Transport 0.7 0.5 0.7 1.8
Other Transport 37.7 8.3 2.9 48.9
Retail Trade 60.9 1.8 17.2 79.9
Gasoline Stations 6.9 0.1 1.2 8.2
Communications - 7.3 2.6 9.8
Finance, Insurance and Real Estate 7.2 14.2 10.5 31.9
Business Services - 49.2 14.0 63.1
Education and Health Care - 0.6 49.2 49.8
Recreation and Entertainment 62.8 2.4 2.3 67.5
Lodging 95.9 0.2 0.1 96.2
Food & Beverage 155.3 7.6 12.9 175.8
Personal Services 22.7 8.9 11.1 42.7
Government - 10.5 3.0 13.5
TOTAL 450.1 127.4 136.4 713.9
Tourism Labor Income (Compensation)
(US$ Million)

23
Tourism tax generation
Tourism generated $287
million in taxes in 2014.
Tourism-driven state and
local tax proceeds
amounted to $144 million.
Excluding Occupancy tax
revenues, tourism helped
to offset the average
household tax burden by
$1,232 per household.
Local taxes generated
included property and
sales tax revenues, and
amounted to $67 million in
2014.
Amount
Federal 143.3
Personal Income 33.6
Corporate 20.7
Indirect business 16.9
Social Security 72.1
State 76.8
Personal Income 14.2
Corporate 2.5
Sales 47.5
Social Security 0.7
Other Taxes and Fees 11.8
Local 66.8
Sales 11.8
Occupancy tax 9.4
Property 43.0
Other Taxes and Fees 2.6
TOTAL 286.8
2014, Millions
Tourism-Generated Tax
Revenues
24
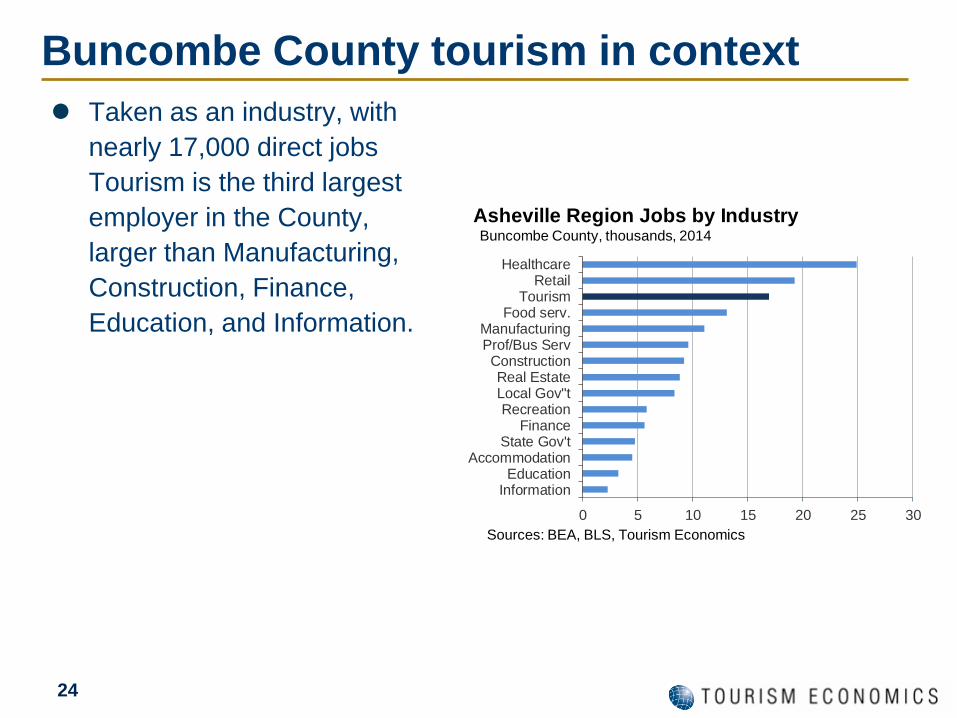
Buncombe County tourism in context
Taken as an industry, with
nearly 17,000 direct jobs
Tourism is the third largest
employer in the County,
larger than Manufacturing,
Construction, Finance,
Education, and Information.
0 5 10 15 20 25 30
InformationEducation
AccommodationState Gov't
FinanceRecreation
Local Gov''tReal Estate
ConstructionProf/Bus ServManufacturing
Food serv.Tourism
RetailHealthcare
Asheville Region Jobs by IndustryBuncombe County, thousands, 2014
Sources: BEA, BLS, Tourism Economics

Methodology and Background

26
By monitoring tourism’s economic impact, policy makers
can make informed decisions regarding the funding and
prioritization of tourism development.
It can also carefully monitor its successes and future
needs.
In order to do this, tourism must be measured in the
same categories as other economic sectors – i.e. tax
generation, employment, wages, and gross domestic
product.
Why quantify the tourism economy?

27
Why is this a challenge?
Most economic sectors such as financial services,
insurance, or construction are easily defined within a
region’s economic statistics.
Tourism is not so easily measured because it is not a
single industry. It is a demand-side activity which affects
multiple sectors to various degrees.
Tourism spans nearly a dozen sectors including lodging,
recreation, retail, real estate, air passenger transport, food
& beverage, car rental, taxi services, travel agents,
museums, and theme parks.

28
• Estimates of visitor expenditures in Buncombe County were based on several sources:
• Smith Travel Research (STR) data on hotel room demand, supply, and revenues.
• County and City level tax data on sales and hotel occupancy receipts.
• Visitor profile and volume, and spending estimates from D.K. Shiffllet & Associates,
a national tourism research firm.
• Industry data on employment, wages and sales from the U.S. Census, the Bureau
of Economic Analysis, and the Bureau of Labor Statistics.
• An IMPLAN input-output model was constructed for Buncombe County. The model
traces the flow of visitor-related expenditures through the local economy and their
effects on employment, wages, and taxes. IMPLAN also quantifies the indirect (supplier)
and induced (income) impacts of tourism. Tourism Economics then cross-checked these
findings with employment and wage data for each sector to ensure the findings are
within reasonable ranges.
• The primary source of the employment and wage data is the Regional Economic
Information System (REIS), Bureau of Economic Analysis. This is more comprehensive
than Bureau of Labor Statistics (ES202/QCEW) data because sole-proprietors do not
require unemployment insurance and are not counted in the ES202 data.
• Gasoline price data were obtained from the U.S. Energy Information Administration.
Methods and data sources

29
Description of spending categories
Spend Category Description
Lodging Includes visitor spending in the accommodation sub-sector. This includes
food and other services provided by hotels and similar establishments.
Recreation Includes visitors spending within the arts, entertainment and recreation sub-
sector.
Local transport
Includes visitor spending on local transport services such as taxis, limos,
trains, rental cars, and buses.
Shopping
Includes visitor spending in all retail sub-sectors within the Buncombe
County economy.
Service stations
Visitor spending on gasoline. Only the margin counts as local economic
impact.
Second homes
Where applicable, spending associated with the upkeep of seasonal second
homes for recreational use as defined by the Census Bureau.
Food and beverage Includes all visitor spending at restaurants and bars.

30
About Tourism Economics
Tourism Economics, headquartered in Philadelphia, is an Oxford Economics
company dedicated to providing high value, robust, and relevant analyses of
the tourism sector that reflects the dynamics of regional and global economies.
By combining quantitative methods with industry knowledge, Tourism
Economics designs custom market strategies, project feasibility analysis,
tourism forecasting models, tourism policy analysis, and economic impact
studies.
Our staff have worked with over 100 destinations to quantify the economic
value of tourism, forecast demand, guide strategy, or evaluate tourism policies.
Oxford Economics is one of the world’s leading providers of economic analysis,
forecasts and consulting advice. Founded in 1981 as a joint venture with Oxford
University’s business college, Oxford Economics is founded on a reputation for
high quality, quantitative analysis and evidence-based advice. For this, it draws
on its own staff of 70 highly-experienced professional economists; a dedicated
data analysis team; global modeling tools; close links with Oxford University,
and a range of partner institutions in Europe, the US and in the United Nations
Project Link.


