
briefing27 October 2017
C
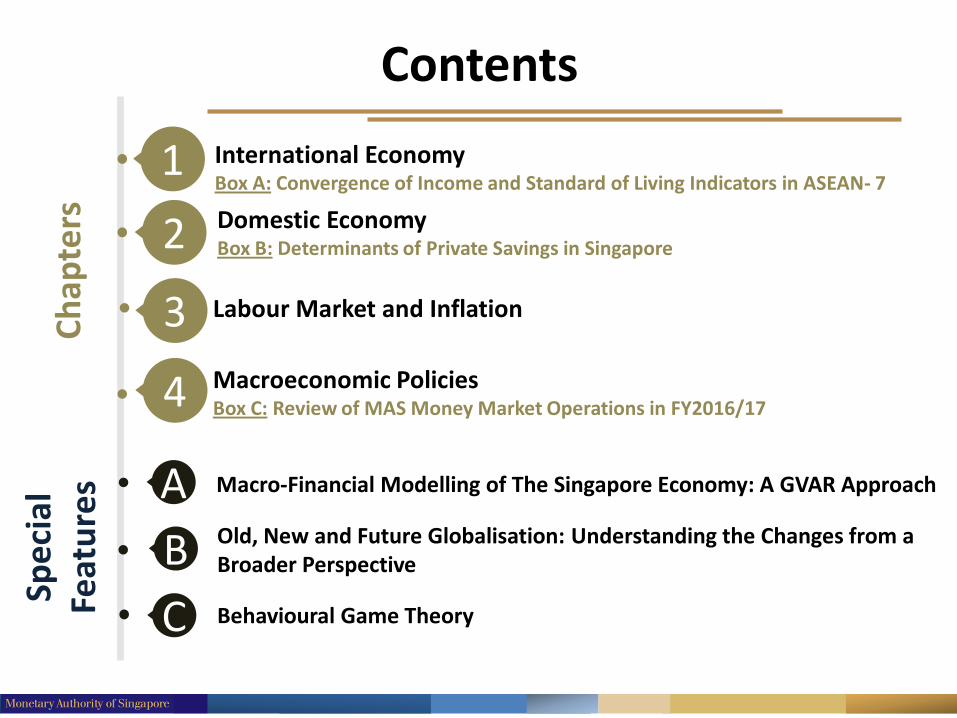
Contents
Domestic EconomyBox B: Determinants of Private Savings in Singapore
Labour Market and Inflation
International EconomyBox A: Convergence of Income and Standard of Living Indicators in ASEAN- 7
Macroeconomic PoliciesBox C: Review of MAS Money Market Operations in FY2016/17
B
Ch
apte
rs
1
2
Macro-Financial Modelling of The Singapore Economy: A GVAR ApproachAOld, New and Future Globalisation: Understanding the Changes from a Broader Perspective
Behavioural Game Theory
Spe
cial
Feat
ure
s
3
4
RESTRICTED
International Economy
Global Activity Gathers Pace Amid Low Inflation
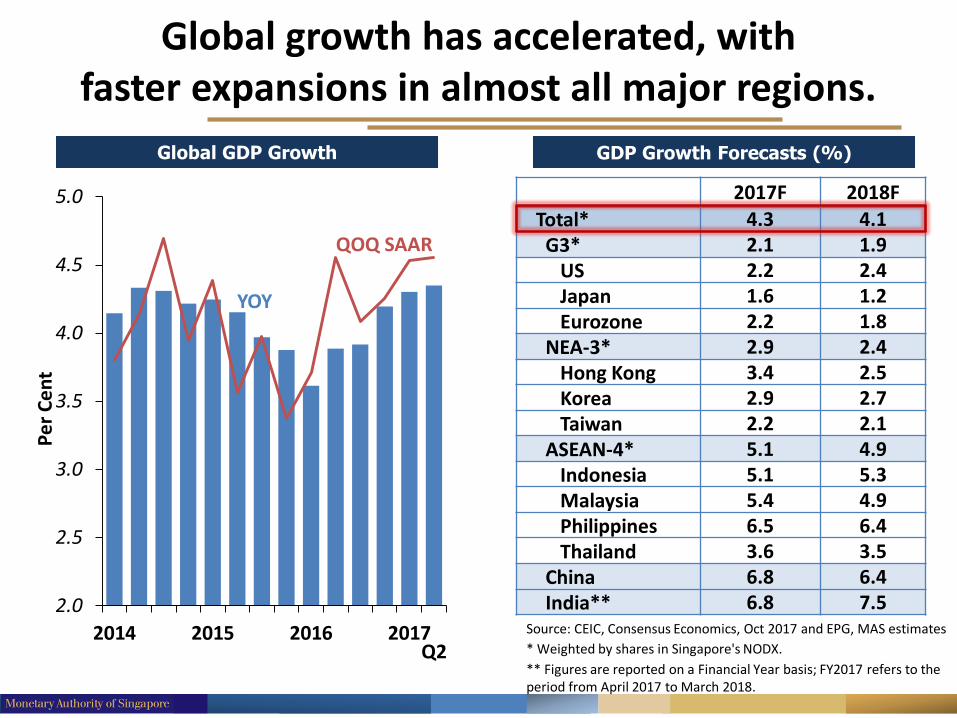
Global GDP Growth
2017F 2018F
Total* 4.3 4.1G3* 2.1 1.9
US 2.2 2.4Japan 1.6 1.2Eurozone 2.2 1.8
NEA-3* 2.9 2.4Hong Kong 3.4 2.5Korea 2.9 2.7Taiwan 2.2 2.1
ASEAN-4* 5.1 4.9Indonesia 5.1 5.3Malaysia 5.4 4.9Philippines 6.5 6.4Thailand 3.6 3.5
China 6.8 6.4India** 6.8 7.5
GDP Growth Forecasts (%)
Global growth has accelerated, with faster expansions in almost all major regions.
Source: CEIC, Consensus Economics, Oct 2017 and EPG, MAS estimates
* Weighted by shares in Singapore's NODX.
** Figures are reported on a Financial Year basis; FY2017 refers to the period from April 2017 to March 2018.
2.0
2.5
3.0
3.5
4.0
4.5
5.0
2014 2015 2016 2017
Pe
r C
en
t
YOY
QOQ SAAR
Q2
2008 2010 2012 2014 2016
-1.5
-1.0
-0.5
0.0
0.5
1.0
% P
oin
t C
on
trib
uti
on
to
YO
Y G
row
th
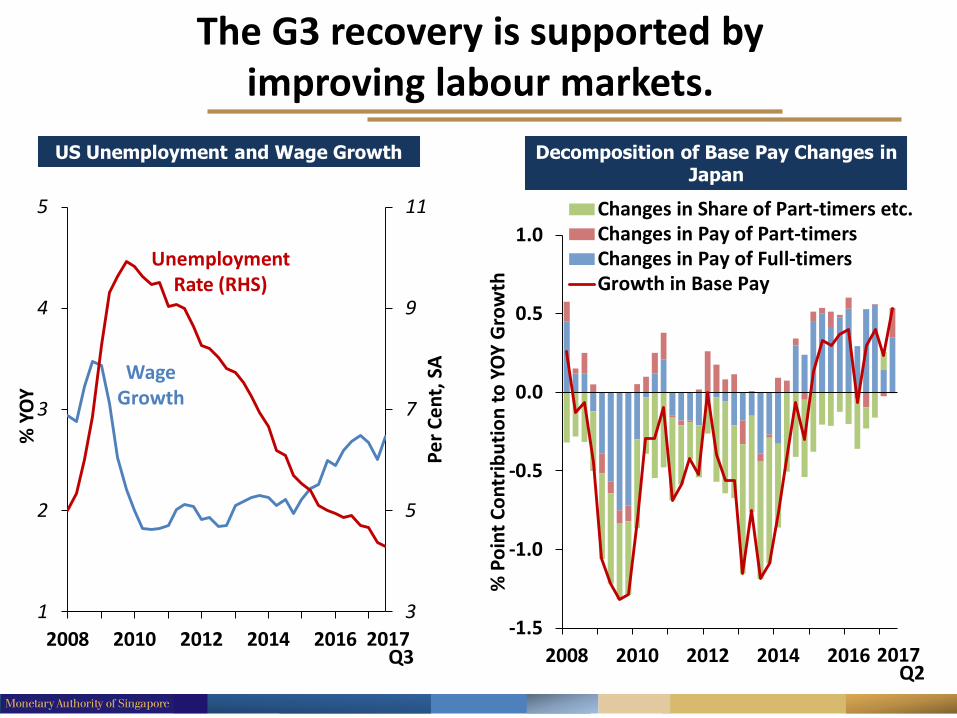
Changes in Share of Part-timers etc.Changes in Pay of Part-timersChanges in Pay of Full-timersGrowth in Base Pay
The G3 recovery is supported by improving labour markets.
Decomposition of Base Pay Changes in Japan
US Unemployment and Wage Growth
3
5
7
9
11
1
2
3
4
5
2008 2010 2012 2014 2016
Pe
r C
en
t, S
A
% Y
OY
2017Q3
Wage Growth
UnemploymentRate (RHS)
2017Q2
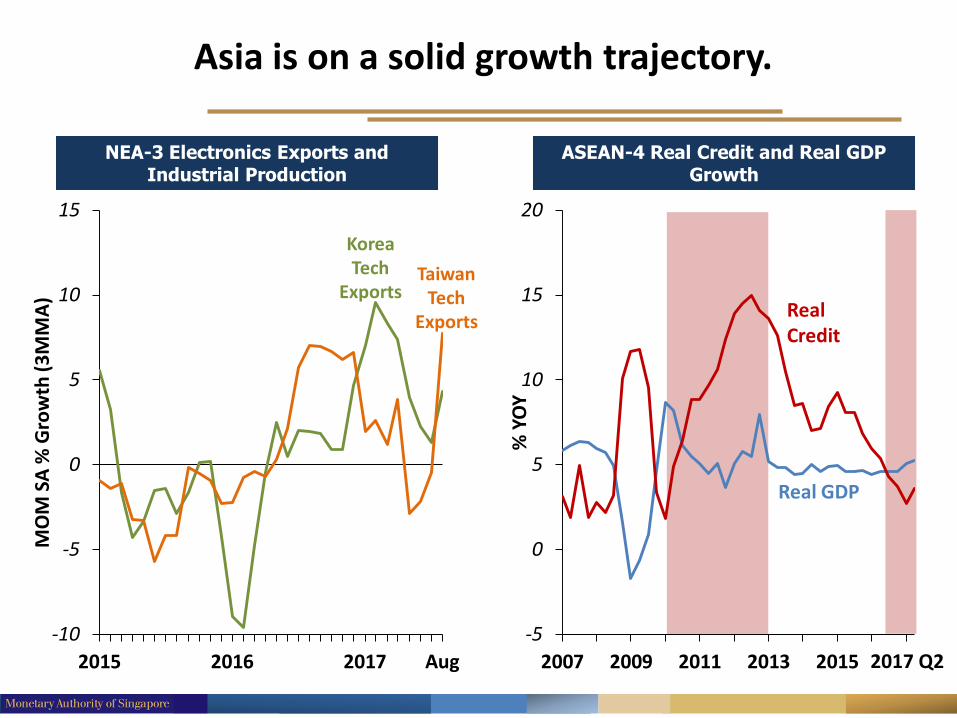
Asia is on a solid growth trajectory.
ASEAN-4 Real Credit and Real GDP Growth
NEA-3 Electronics Exports and Industrial Production
2015 2016 2017 Aug
-10
-5
0
5
10
15
MO
M S
A %
Gro
wth
(3
MM
A)
-5
0
5
10
15
20
2007 2009 2011 2013 2015 2017
% Y
OY
2017 Q2
KoreaTech
ExportsTaiwan
Tech Exports
Real Credit
Real GDP
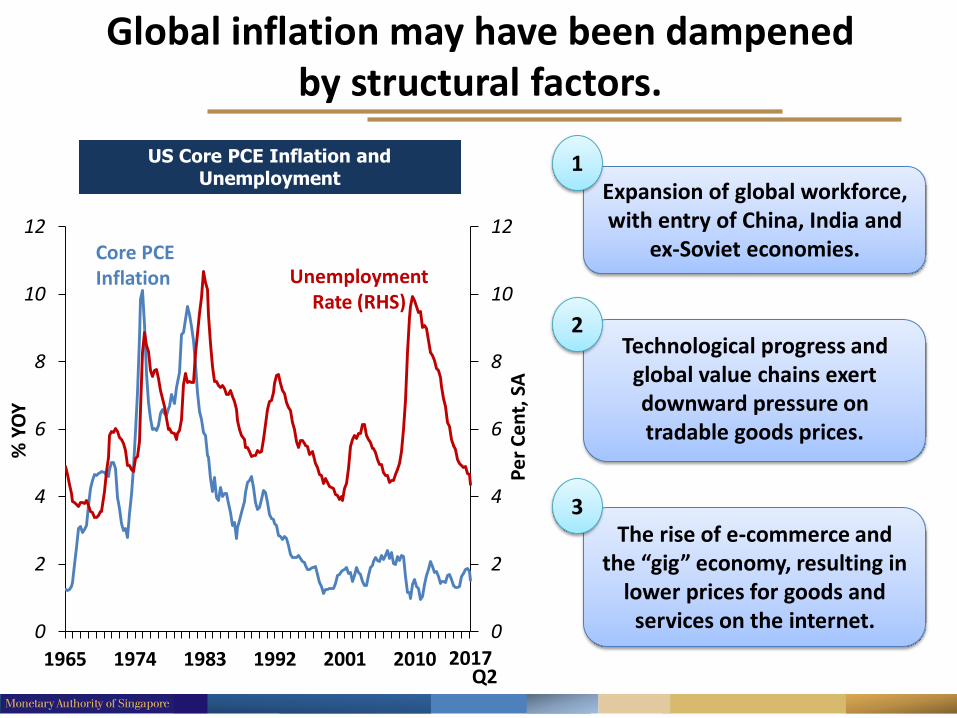
Global inflation may have been dampened by structural factors.
US Core PCE Inflation and Unemployment
0
2
4
6
8
10
12
0
2
4
6
8
10
12
1965 1974 1983 1992 2001 2010
Pe
r C
en
t, S
A
% Y
OY
2017Q2
Core PCE Inflation Unemployment
Rate (RHS)
Expansion of global workforce, with entry of China, India and
ex-Soviet economies.
1
Technological progress and global value chains exert downward pressure on tradable goods prices.
2
The rise of e-commerce and the “gig” economy, resulting in
lower prices for goods and services on the internet.
3
RESTRICTED
Domestic Economy
Some Upsides to Growth
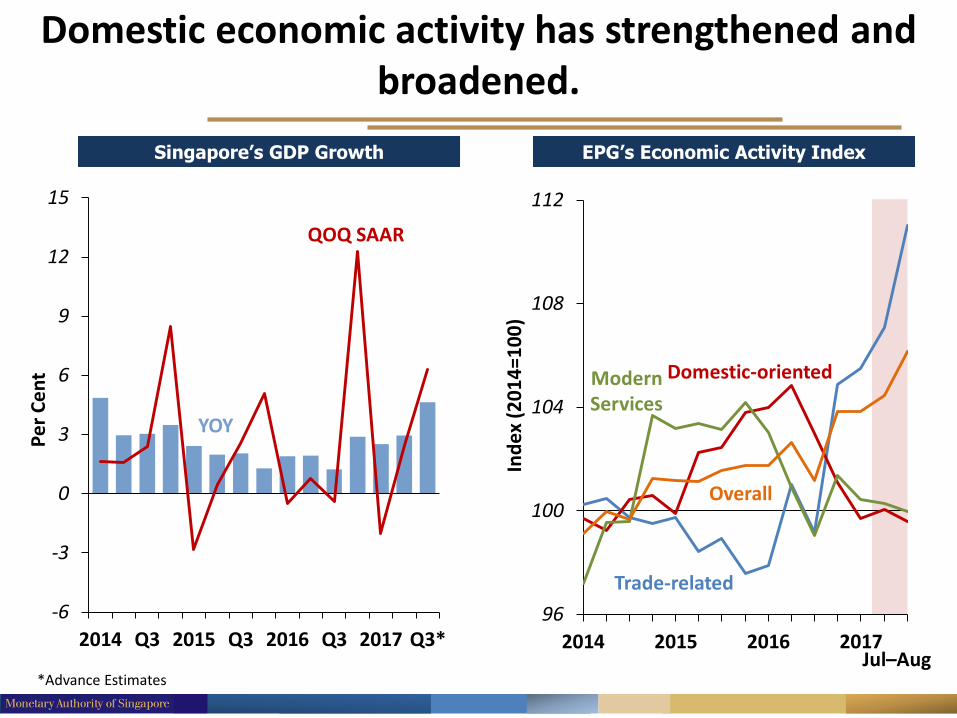
Domestic economic activity has strengthened and broadened.
2014 Q3 2015 Q3 2016 Q3 2017 Q3*
-6
-3
0
3
6
9
12
15
Pe
r C
en
t
Singapore’s GDP Growth
YOY
QOQ SAAR
*Advance Estimates
EPG’s Economic Activity Index
2014 2015 2016 2017
96
100
104
108
112
Ind
ex (
20
14
=10
0)
Jul–Aug
Trade-related
Domestic-oriented
Overall
ModernServices
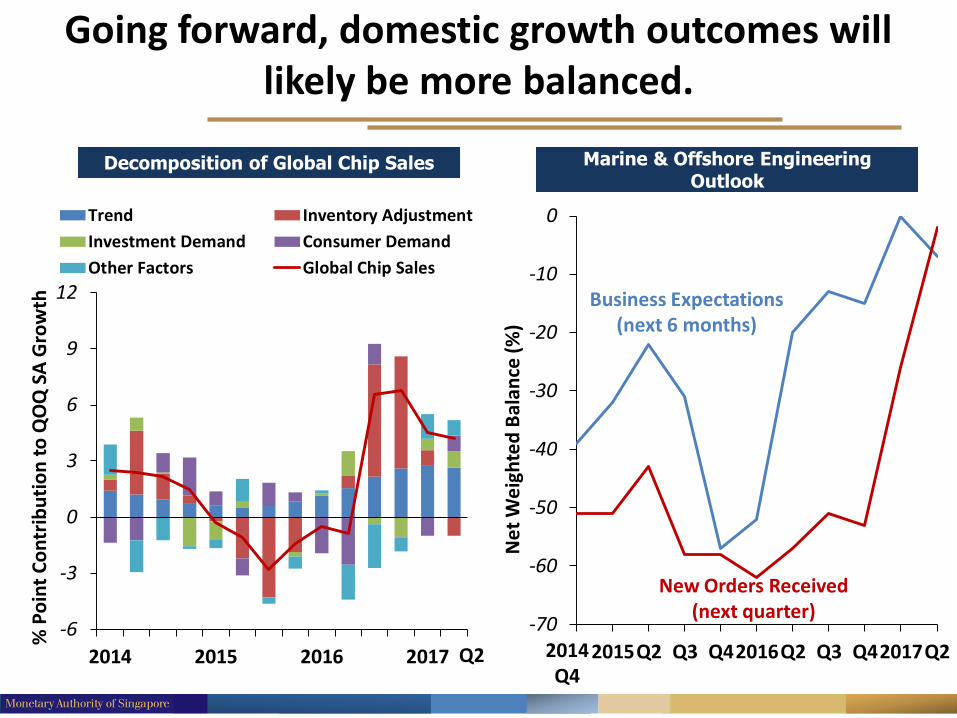
Going forward, domestic growth outcomes will likely be more balanced.
Decomposition of Global Chip Sales
2014 2015 2016 2017
-6
-3
0
3
6
9
12
% P
oin
t C
on
trib
uti
on
to
QO
Q S
A G
row
th
Trend Inventory Adjustment
Investment Demand Consumer Demand
Other Factors Global Chip Sales
Q2
-70
-60
-50
-40
-30
-20
-10
0
2015Q2 Q3 Q42016Q2 Q3 Q42017Q2
Ne
t W
eig
hte
d B
alan
ce (
%)
Business Expectations(next 6 months)
2014Q4
Marine & Offshore Engineering Outlook
New Orders Received(next quarter)
RESTRICTED
Labour Market and Inflation
Inflation is Contained and Stable
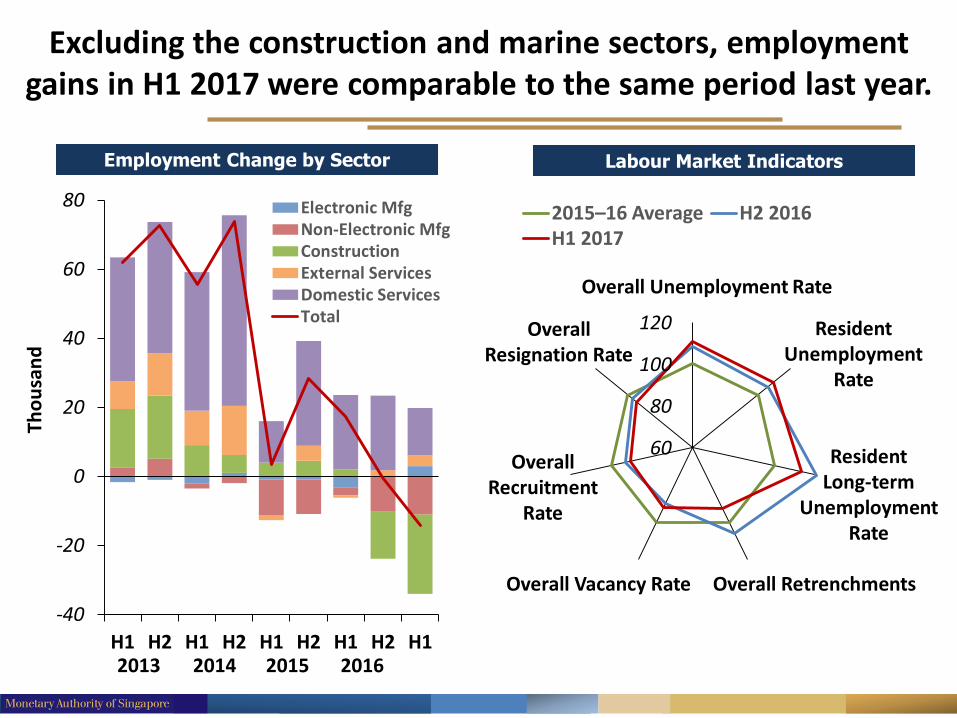
Excluding the construction and marine sectors, employment gains in H1 2017 were comparable to the same period last year.
Employment Change by Sector
H1 H2 H1 H2 H1 H2 H1 H2 H1
-40
-20
0
20
40
60
80
Tho
usa
nd
Electronic MfgNon-Electronic MfgConstructionExternal ServicesDomestic ServicesTotal
2013 2014 2015 2016
Labour Market Indicators
60
80
100
120
2015–16 Average H2 2016H1 2017
Overall Retrenchments
Overall Unemployment Rate
Resident Unemployment
Rate
Resident Long-term
Unemployment Rate
Overall Vacancy Rate
Overall Resignation Rate
Overall Recruitment
Rate
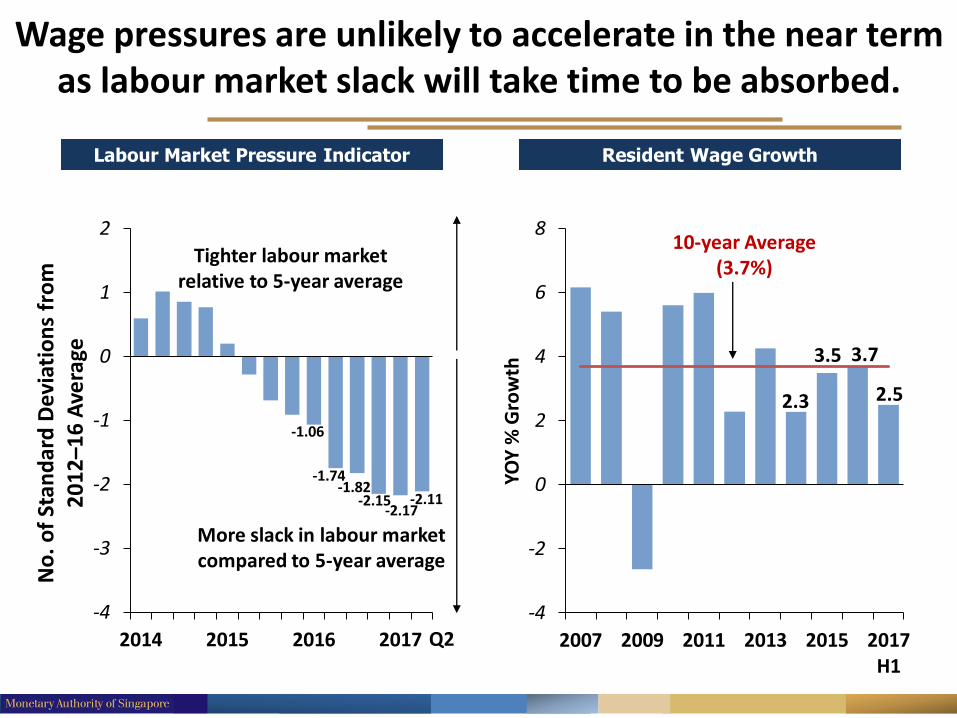
Wage pressures are unlikely to accelerate in the near term as labour market slack will take time to be absorbed.
Resident Wage Growth
2007 2009 2011 2013 2015 2017H1
-4
-2
0
2
4
6
8
YOY
% G
row
th
10-year Average(3.7%)
2.3
3.5 3.7
2.5
Labour Market Pressure Indicator
2014 2015 2016 2017
-4
-3
-2
-1
0
1
2
No
. o
f St
and
ard
De
viat
ion
s fr
om
2
01
2–1
6 A
vera
ge
Tighter labour market relative to 5-year average
More slack in labour market compared to 5-year average
-1.06
-1.74
-2.17-2.11
-1.82-2.15
Q2
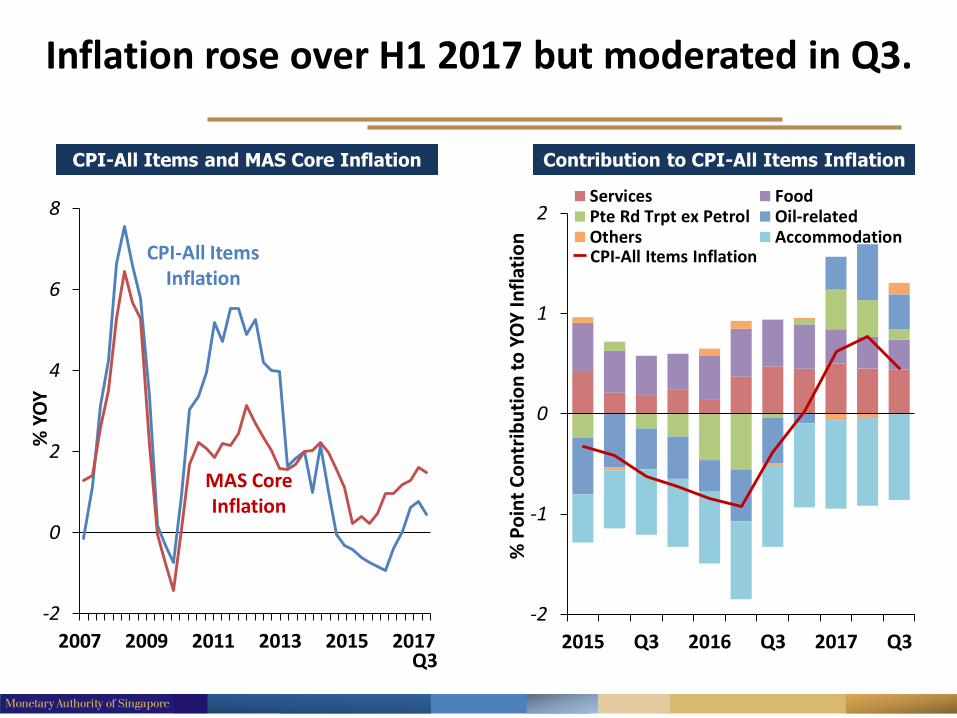
Inflation rose over H1 2017 but moderated in Q3.
Contribution to CPI-All Items Inflation
2015 Q3 2016 Q3 2017 Q3
-2
-1
0
1
2
% P
oin
t C
on
trib
uti
on
to
YO
Y In
flat
ion
Services FoodPte Rd Trpt ex Petrol Oil-relatedOthers AccommodationCPI-All Items Inflation
CPI-All Items and MAS Core Inflation
2007 2009 2011 2013 2015 2017
-2
0
2
4
6
8
% Y
OY
CPI-All Items Inflation
MAS Core Inflation
Q3
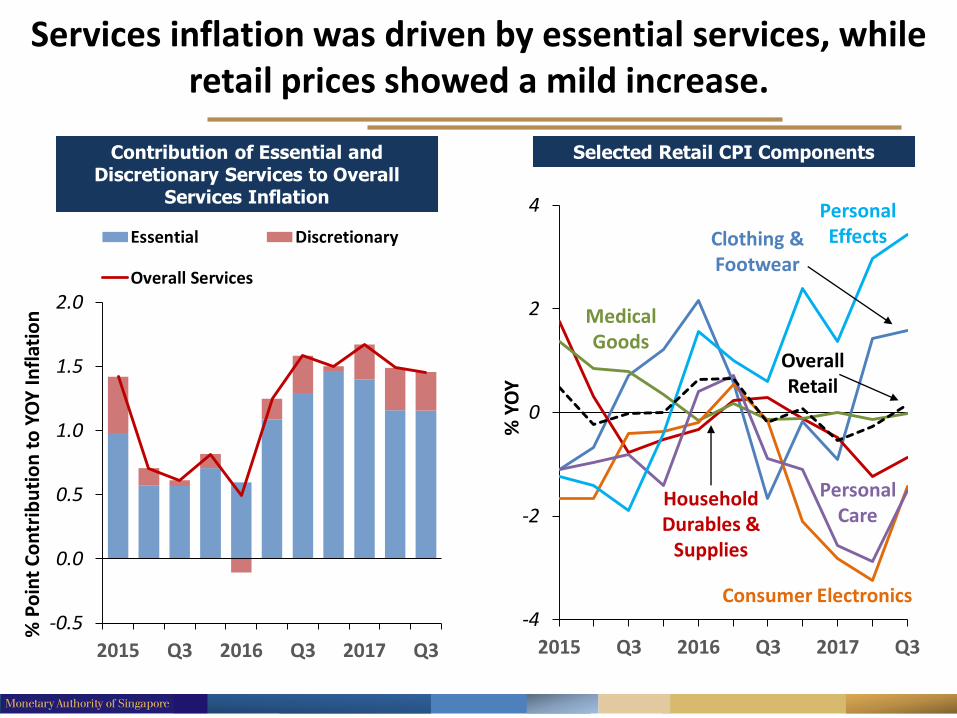
Services inflation was driven by essential services, while retail prices showed a mild increase.
Contribution of Essential and Discretionary Services to Overall
Services Inflation
2015 Q3 2016 Q3 2017 Q3
-0.5
0.0
0.5
1.0
1.5
2.0
Essential Discretionary
Overall Services
% P
oin
t C
on
trib
uti
on
to
YO
Y I
nfl
atio
n
Selected Retail CPI Components
2015 Q3 2016 Q3 2017 Q3
-4
-2
0
2
4
% Y
OY
Clothing & Footwear
Household Durables &
Supplies
Medical Goods
Consumer Electronics
Personal Care
Personal Effects
Overall Retail
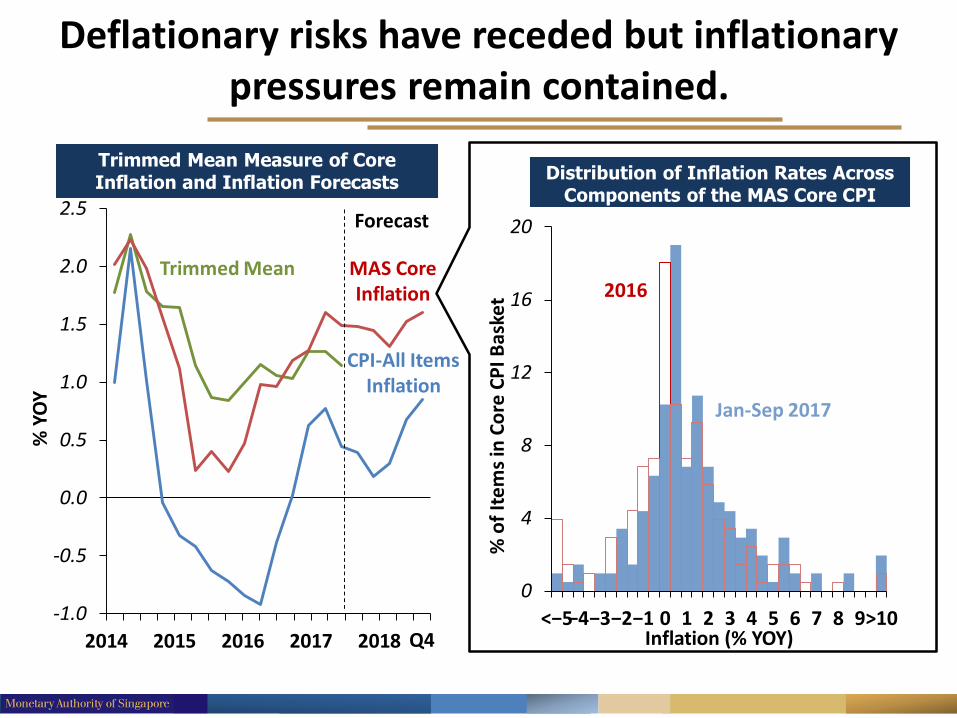
Distribution of Inflation Rates Across Components of the MAS Core CPI
Basket
0
4
8
12
16
20
<−5−4−3−2−1 0 1 2 3 4 5 6 7 8 9>10
% o
f It
em
s in
Co
re C
PI B
aske
t
Inflation (% YOY)
2016
Jan-Sep 2017
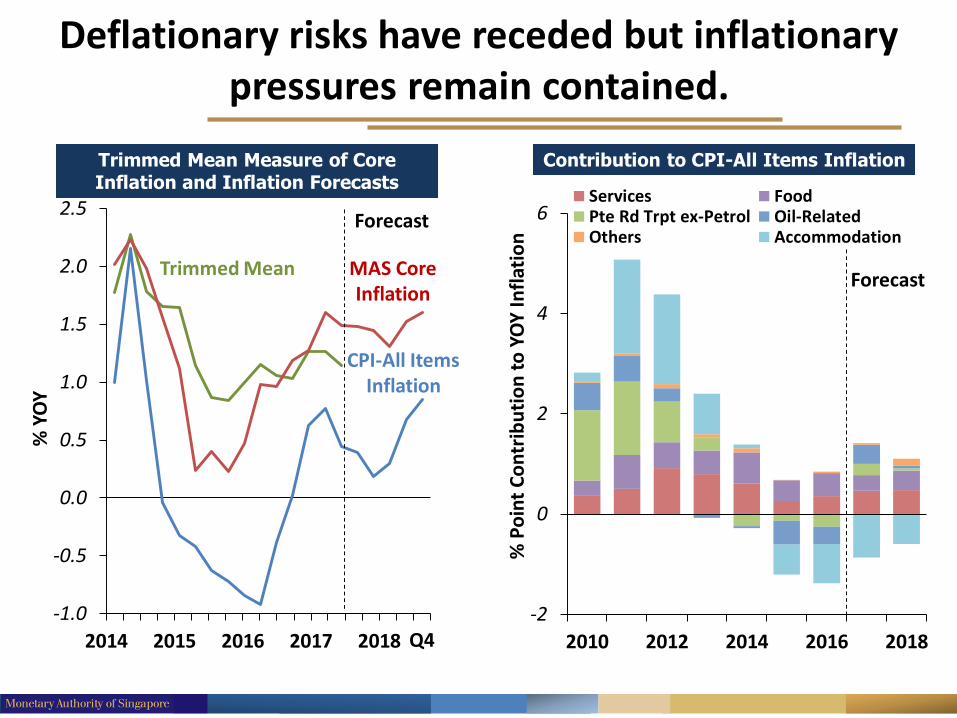
Deflationary risks have receded but inflationary pressures remain contained.
2014 2015 2016 2017 2018
-1.0
-0.5
0.0
0.5
1.0
1.5
2.0
2.5
% Y
OY
CPI-All Items Inflation
MAS Core Inflation
Q4
Trimmed Mean
Trimmed Mean Measure of Core Inflation and Inflation Forecasts
Forecast
Deflationary risks have receded but inflationary pressures remain contained.
2014 2015 2016 2017 2018
-1.0
-0.5
0.0
0.5
1.0
1.5
2.0
2.5
% Y
OY
CPI-All Items Inflation
MAS Core Inflation
Q4
Trimmed Mean
Trimmed Mean Measure of Core Inflation and Inflation Forecasts
Forecast
Contribution to CPI-All Items Inflation
2010 2012 2014 2016 2018
-2
0
2
4
6
% P
oin
t C
on
trib
uti
on
to
YO
Y In
flat
ion
Services FoodPte Rd Trpt ex-Petrol Oil-RelatedOthers Accommodation
Forecast

RESTRICTED
Macroeconomic Policy
Maintaining Price Stability As Growth Picks Up
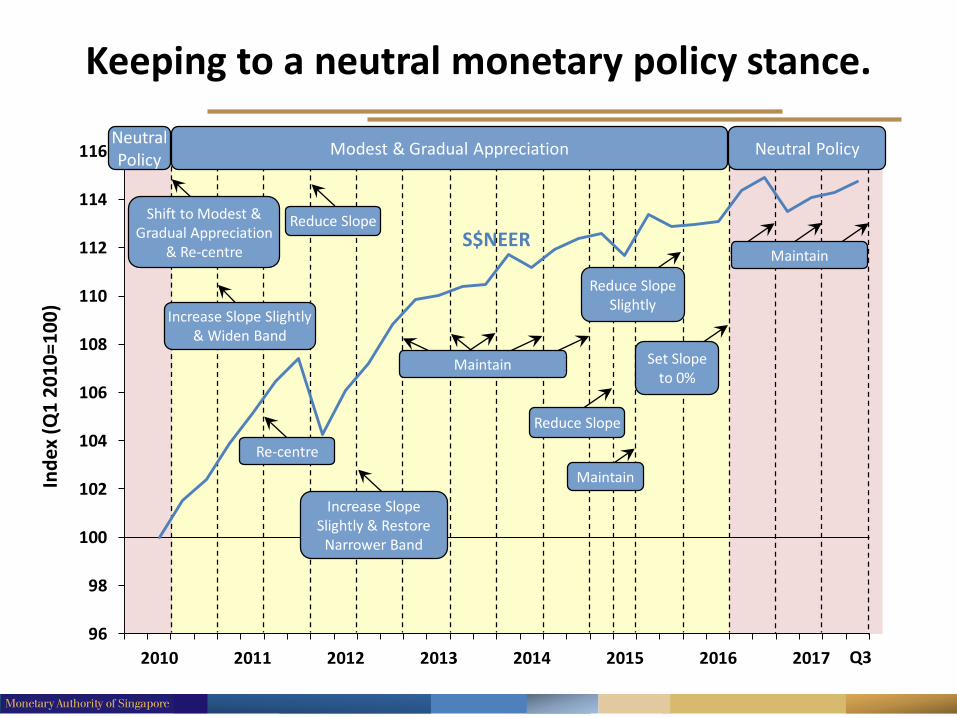
Keeping to a neutral monetary policy stance.
2010 2011 2012 2013 2014 2015 2016 2017
96
98
100
102
104
106
108
110
112
114
116
Ind
ex (
Q1
20
10
=10
0)
Q3
S$NEER
Neutral Policy
Shift to Modest & Gradual Appreciation
& Re-centre
Reduce Slope
Modest & Gradual Appreciation
Reduce Slope Slightly
Neutral Policy
Maintain
Increase Slope Slightly & Widen Band
Re-centre
Increase Slope Slightly & Restore
Narrower Band
Maintain
Reduce Slope
Maintain
Set Slope to 0%
Q&A
27 October 2017


