Bajaj FinServ Limited

Bajaj Allianz General Insurance
Bajaj Allianz Life Insurance
Bajaj FinServ
Protection
Bajaj Auto
Corporate Structure
* Asset Management
Wealth Management
* Asset Management
Wealth Management
Under
formation
Lending
2
Status
Bajaj Auto Finance
Wealth Management
Asset Management
*Application with SEBI
Existing
Status
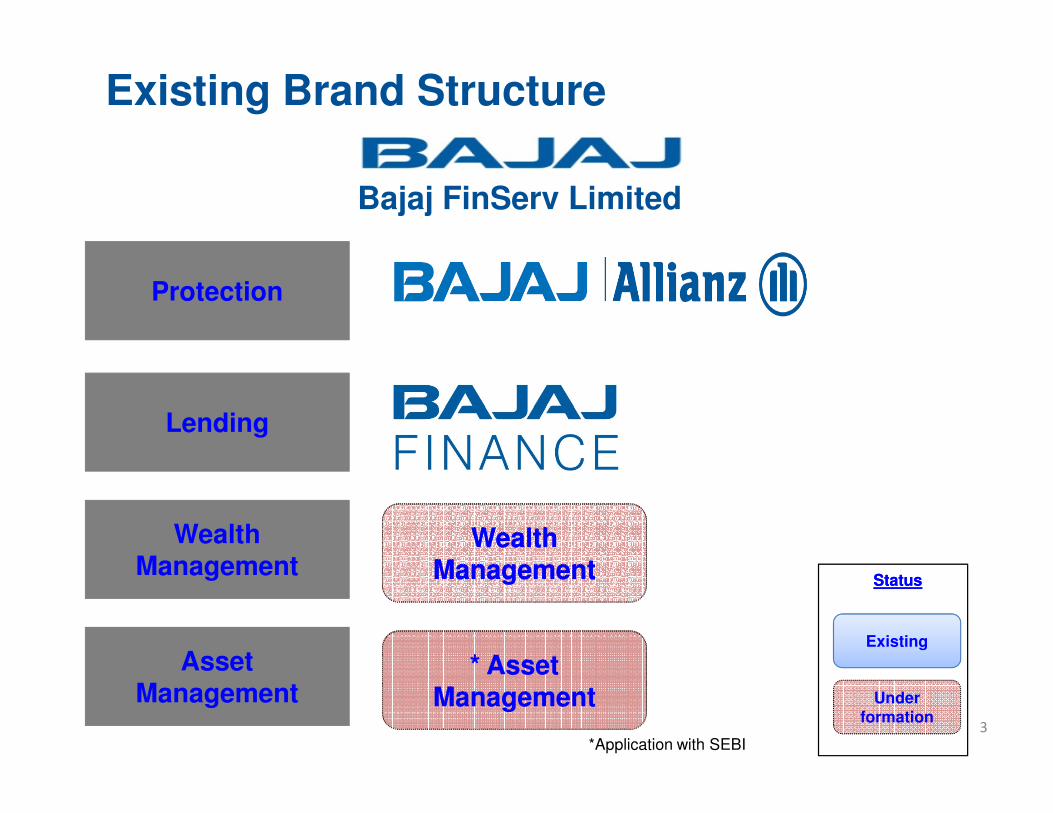
Existing Brand Structure
Bajaj FinServ Limited
Protection
* Asset Management
Wealth Management
* Asset Management
Wealth Management
Under
formation
Lending
3
Status
Wealth Management
Asset Management
*Application with SEBI
Existing
Status
BAJAJ FINSERV IDENTITY
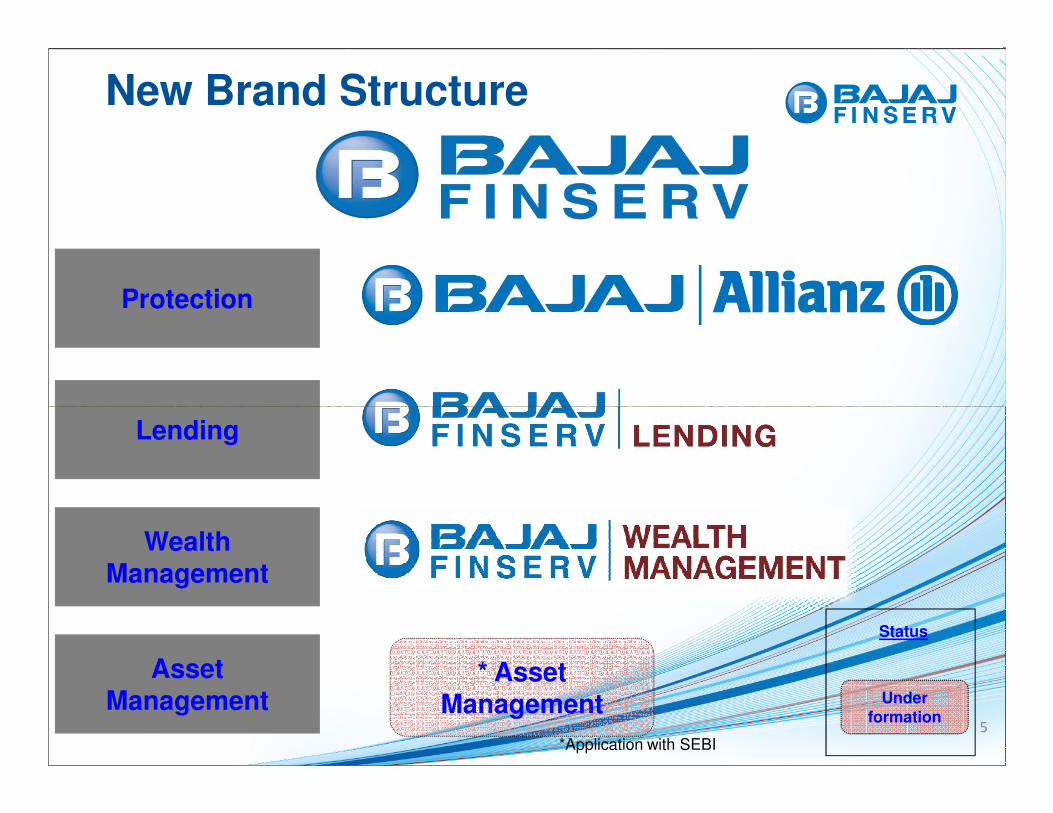
Protection
New Brand Structure
Lending
5
Status
Wealth Management
Asset Management
* Asset Management
*Application with SEBI
Under
formation
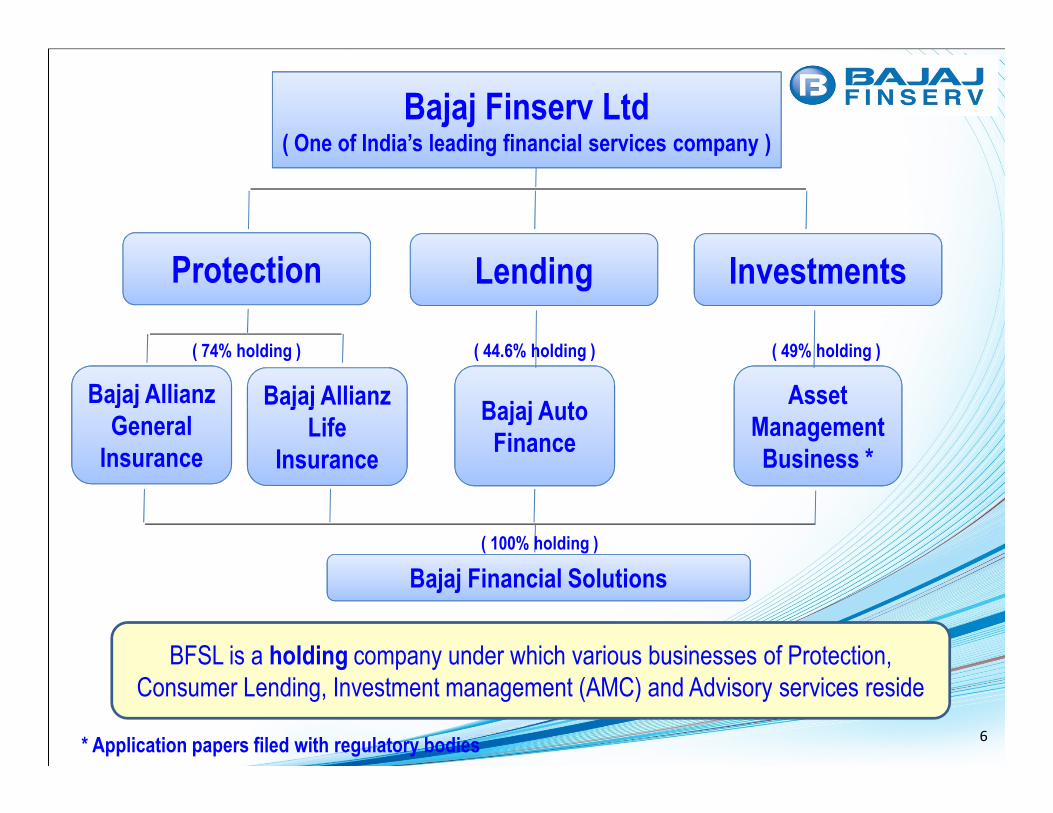
Protection Lending Investments
Bajaj Allianz Bajaj Allianz Bajaj Allianz Bajaj Auto
Asset
( 74% holding ) ( 44.6% holding ) ( 49% holding )
Bajaj Finserv Ltd( One of India’s leading financial services company )
Bajaj Allianz
General
Insurance
Bajaj Allianz Bajaj Allianz
Life
Insurance
Bajaj Auto
Finance
Asset
Management
Business *
Bajaj Financial Solutions
* Application papers filed with regulatory bodies
( 100% holding )
BFSL is a holding company under which various businesses of Protection,
Consumer Lending, Investment management (AMC) and Advisory services reside
6
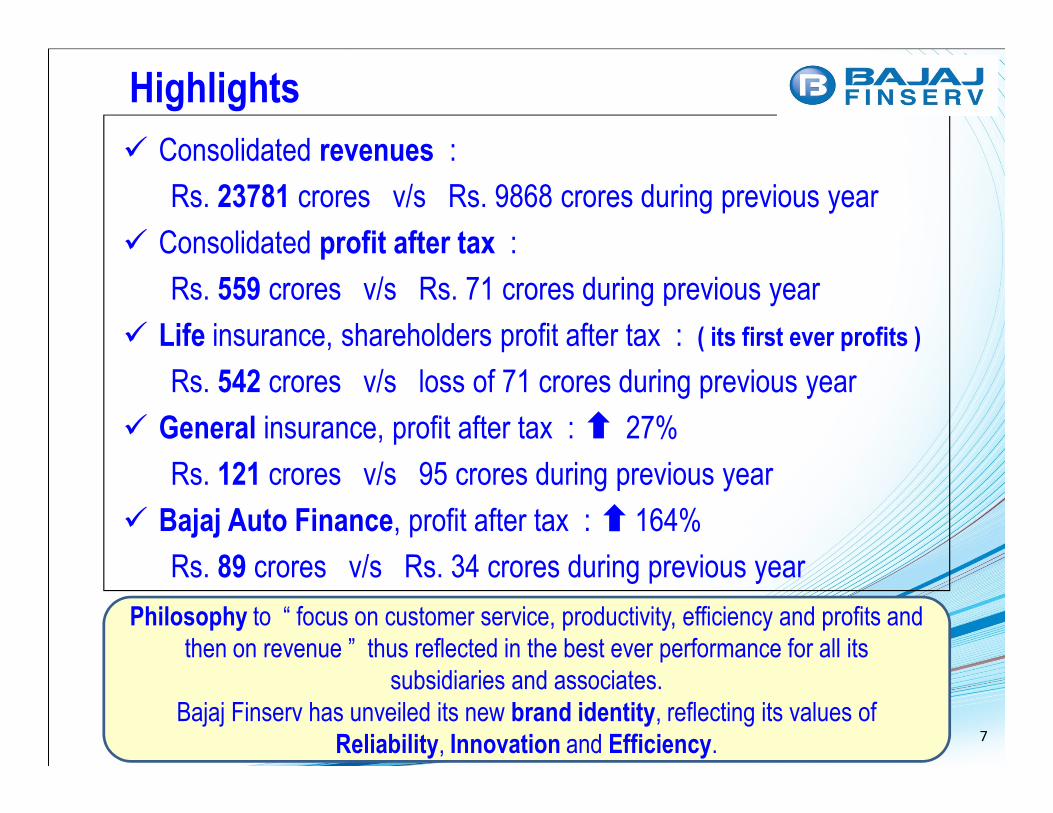
� Consolidated revenues :
Rs. 23781 crores v/s Rs. 9868 crores during previous year
� Consolidated profit after tax :
Rs. 559 crores v/s Rs. 71 crores during previous year
� Life insurance, shareholders profit after tax : ( its first ever profits )
Rs. 542 crores v/s loss of 71 crores during previous year
Highlights
� General insurance, profit after tax : 27%
Rs. 121 crores v/s 95 crores during previous year
� Bajaj Auto Finance, profit after tax : 164%
Rs. 89 crores v/s Rs. 34 crores during previous year
Philosophy to “ focus on customer service, productivity, efficiency and profits and
then on revenue ” thus reflected in the best ever performance for all its
subsidiaries and associates.
Bajaj Finserv has unveiled its new brand identity, reflecting its values of
Reliability, Innovation and Efficiency. 7
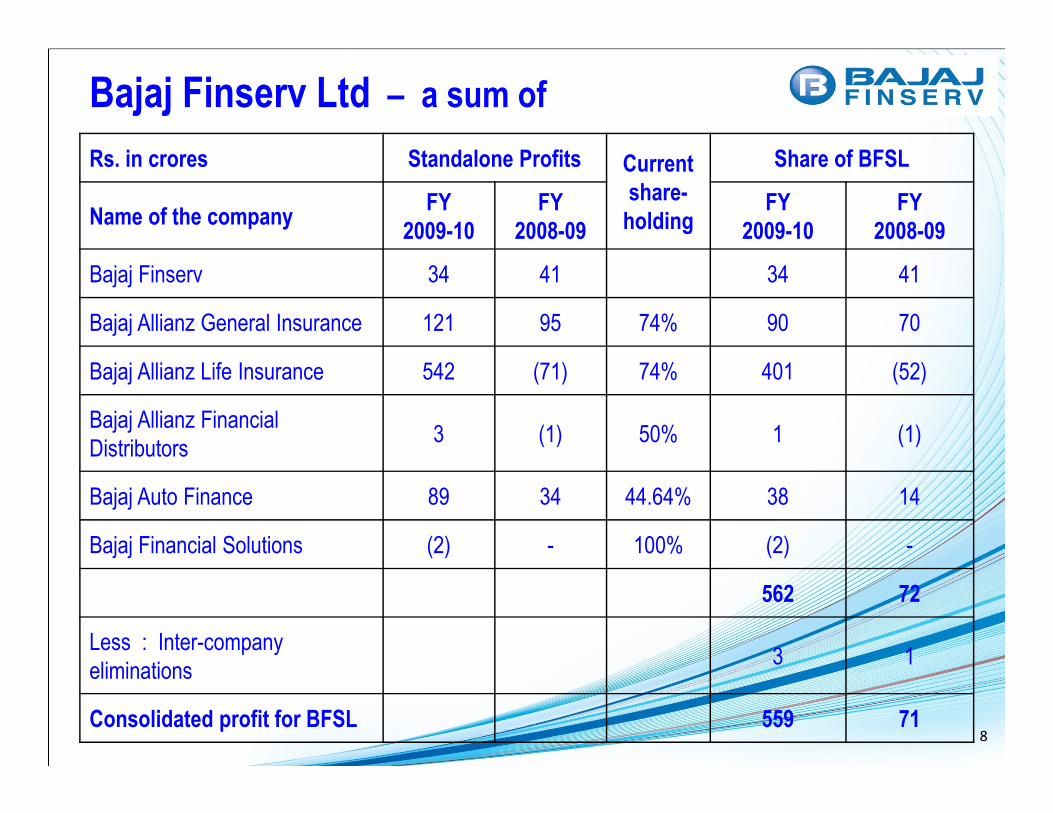
Bajaj Finserv Ltd – a sum of
Rs. in crores Standalone Profits Current
share-
holding
Share of BFSL
Name of the companyFY
2009-10
FY
2008-09
FY
2009-10
FY
2008-09
Bajaj Finserv 34 41 34 41
Bajaj Allianz General Insurance 121 95 74% 90 70
Bajaj Allianz Life Insurance 542 (71) 74% 401 (52)
Bajaj Allianz Financial Bajaj Allianz Financial
Distributors3 (1) 50% 1 (1)
Bajaj Auto Finance 89 34 44.64% 38 14
Bajaj Financial Solutions (2) - 100% (2) -
562 72
Less : Inter-company
eliminations3 1
Consolidated profit for BFSL 559 718
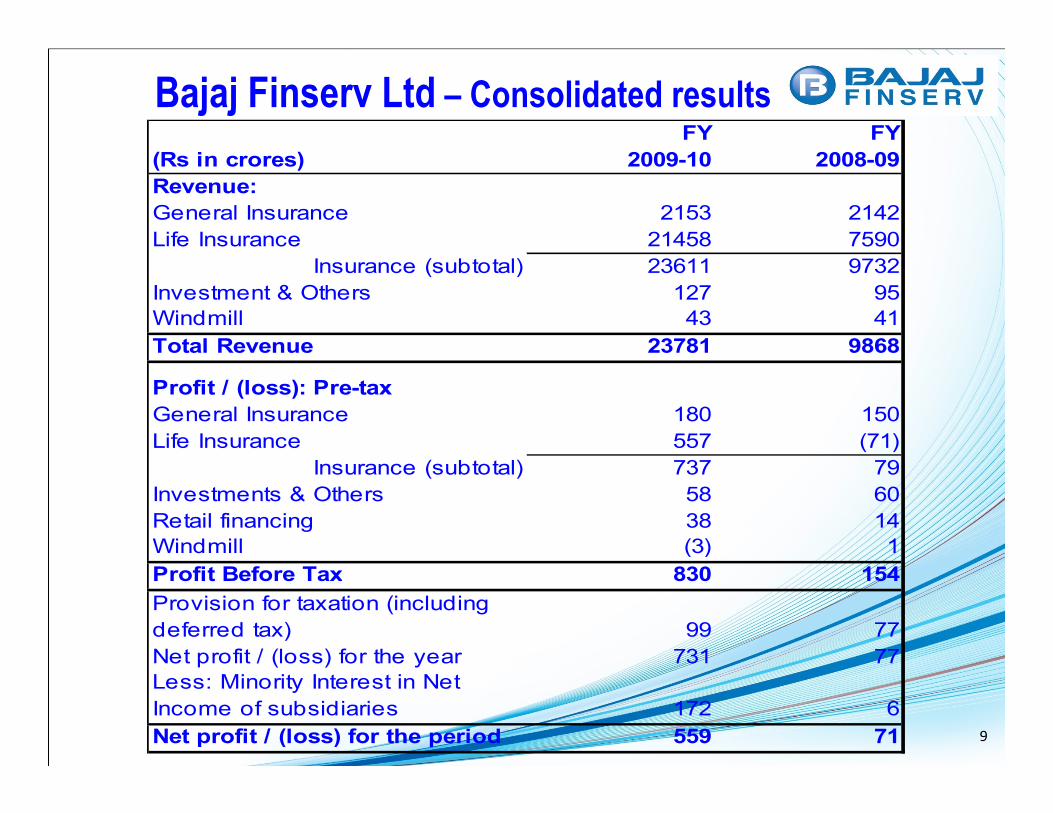
Bajaj Finserv Ltd – Consolidated resultsFY FY
(Rs in crores) 2009-10 2008-09
Revenue:
General Insurance 2153 2142
Life Insurance 21458 7590
Insurance (subtotal) 23611 9732
Investment & Others 127 95
Windmill 43 41
Total Revenue 23781 9868
Profit / (loss): Pre-tax
General Insurance 180 150 General Insurance 180 150
Life Insurance 557 (71)
Insurance (subtotal) 737 79
Investments & Others 58 60
Retail financing 38 14
Windmill (3) 1
Profit Before Tax 830 154
Provision for taxation (including
deferred tax) 99 77
Net profit / (loss) for the year 731 77
Less: Minority Interest in Net
Income of subsidiaries 172 6
Net profit / (loss) for the period 559 71 9
Bajaj Allianz
Life Insurance Co.Life Insurance Co.
10

Our New Brand Identity
11
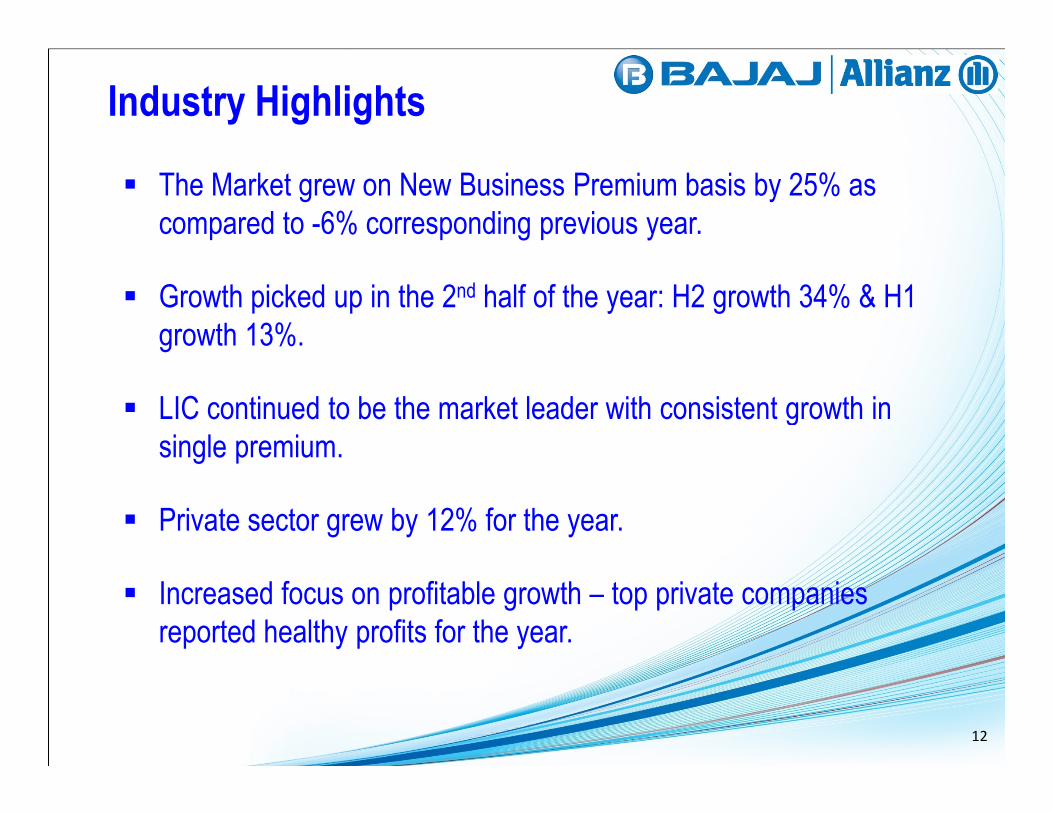
� The Market grew on New Business Premium basis by 25% as
compared to -6% corresponding previous year.
� Growth picked up in the 2nd half of the year: H2 growth 34% & H1
growth 13%.
� LIC continued to be the market leader with consistent growth in
Industry Highlights
� LIC continued to be the market leader with consistent growth in
single premium.
� Private sector grew by 12% for the year.
� Increased focus on profitable growth – top private companies
reported healthy profits for the year.
12
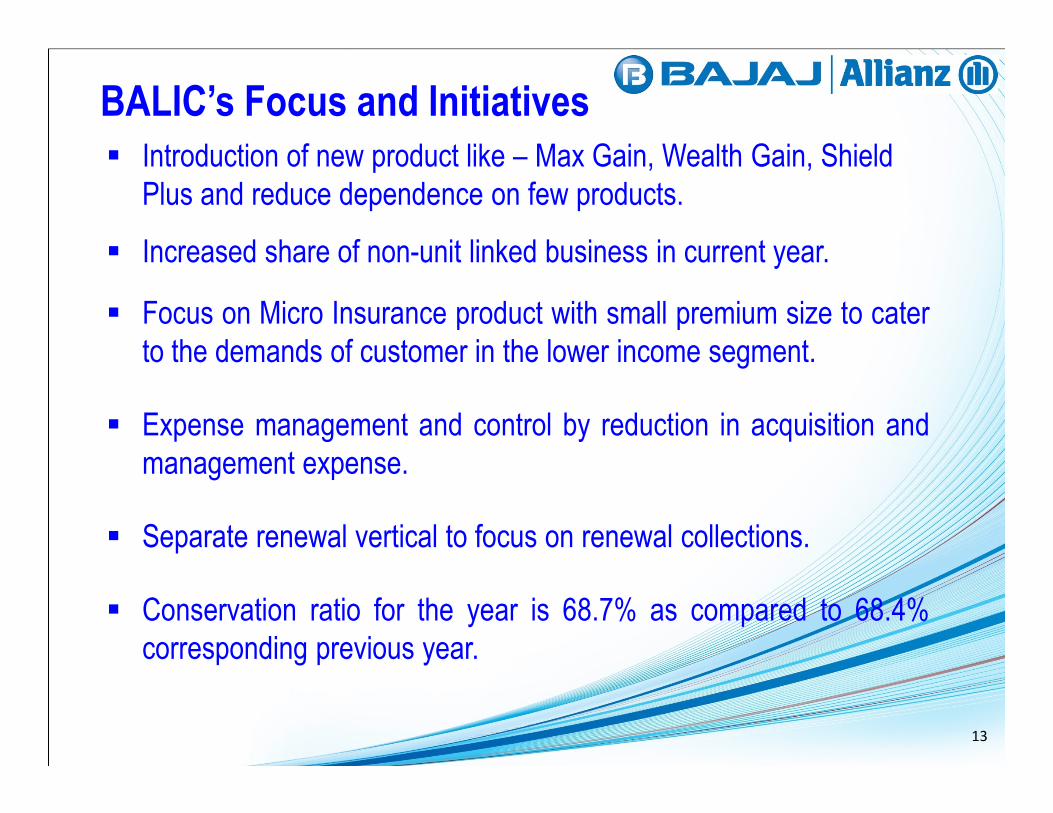
� Introduction of new product like – Max Gain, Wealth Gain, Shield
Plus and reduce dependence on few products.
� Increased share of non-unit linked business in current year.
� Focus on Micro Insurance product with small premium size to cater
to the demands of customer in the lower income segment.
� Expense management and control by reduction in acquisition and
BALIC’s Focus and Initiatives
� Expense management and control by reduction in acquisition and
management expense.
� Separate renewal vertical to focus on renewal collections.
� Conservation ratio for the year is 68.7% as compared to 68.4%
corresponding previous year.
13
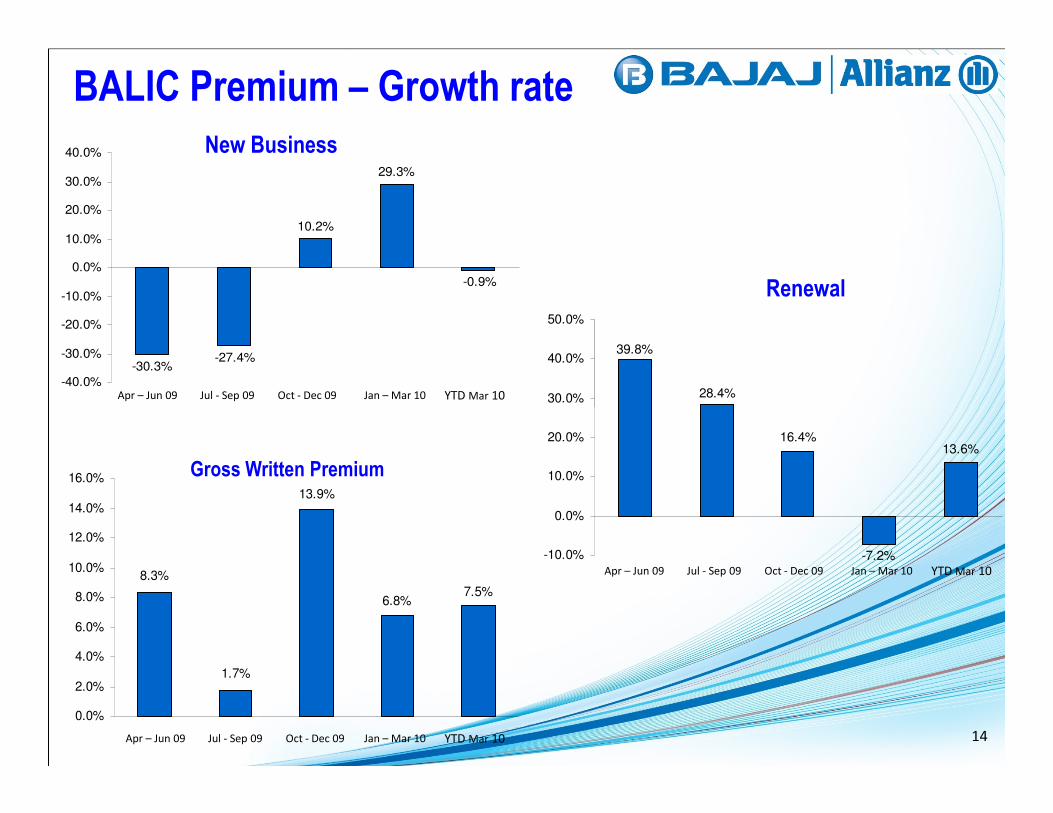
BALIC Premium – Growth rate
Apr – Jun 09 Jul - Sep 09 Oct - Dec 09 YTD Mar 10Jan – Mar 10
New Business
Renewal
39.8%
28.4%30.0%
40.0%
50.0%
-30.3%-27.4%
-0.9%
29.3%
10.2%
-40.0%
-30.0%
-20.0%
-10.0%
0.0%
10.0%
20.0%
30.0%
40.0%
Apr – Jun 09 Jul - Sep 09 Oct - Dec 09 YTD Mar 10Jan – Mar 10
Apr – Jun 09 Jul - Sep 09 Oct - Dec 09 YTD Mar 10Jan – Mar 10
Gross Written Premium
8.3%
1.7%
7.5%6.8%
13.9%
0.0%
2.0%
4.0%
6.0%
8.0%
10.0%
12.0%
14.0%
16.0%
13.6%
-7.2%
16.4%
-10.0%
0.0%
10.0%
20.0%
14
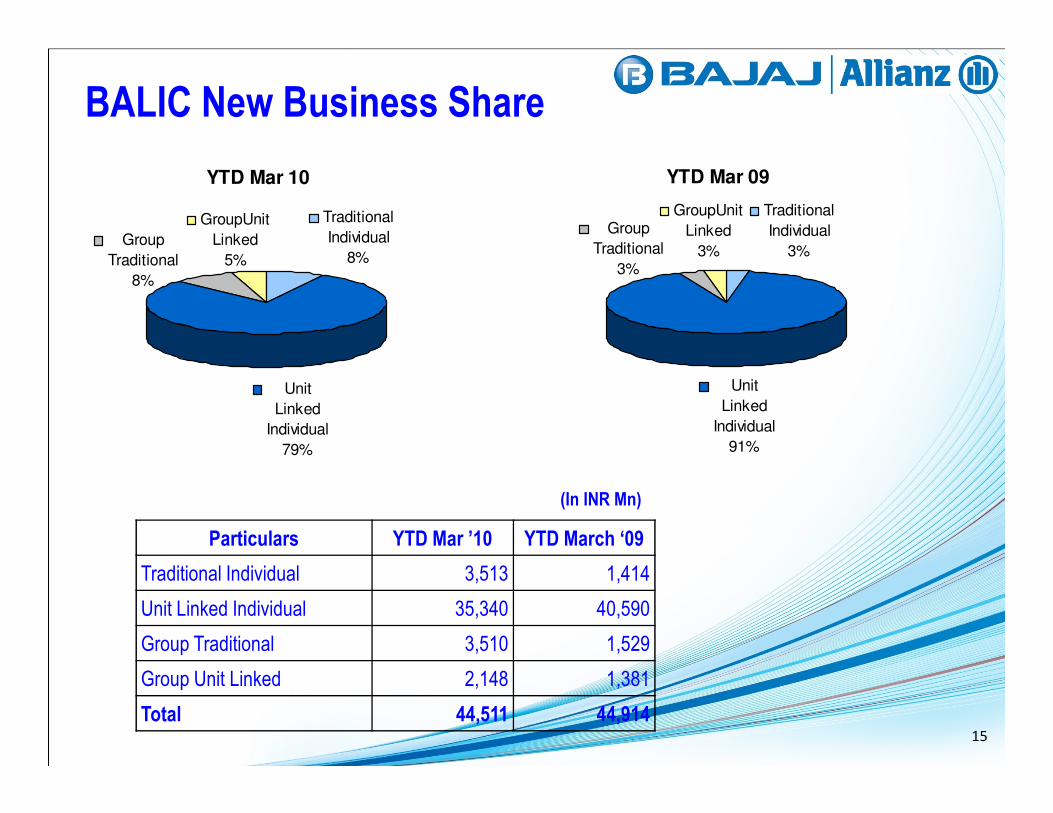
BALIC New Business Share
YTD Mar 10
GroupUnit
Linked
5%
Unit
Linked
Group
Traditional
8%
Traditional
Individual
8%
YTD Mar 09
GroupUnit
Linked
3%
Unit
Linked
Group
Traditional
3%
Traditional
Individual
3%
Particulars YTD Mar ’10 YTD March ‘09
Traditional Individual 3,513 1,414
Unit Linked Individual 35,340 40,590
Group Traditional 3,510 1,529
Group Unit Linked 2,148 1,381
Total 44,511 44,914
(In INR Mn)
Linked
Individual
79%
Linked
Individual
91%
15
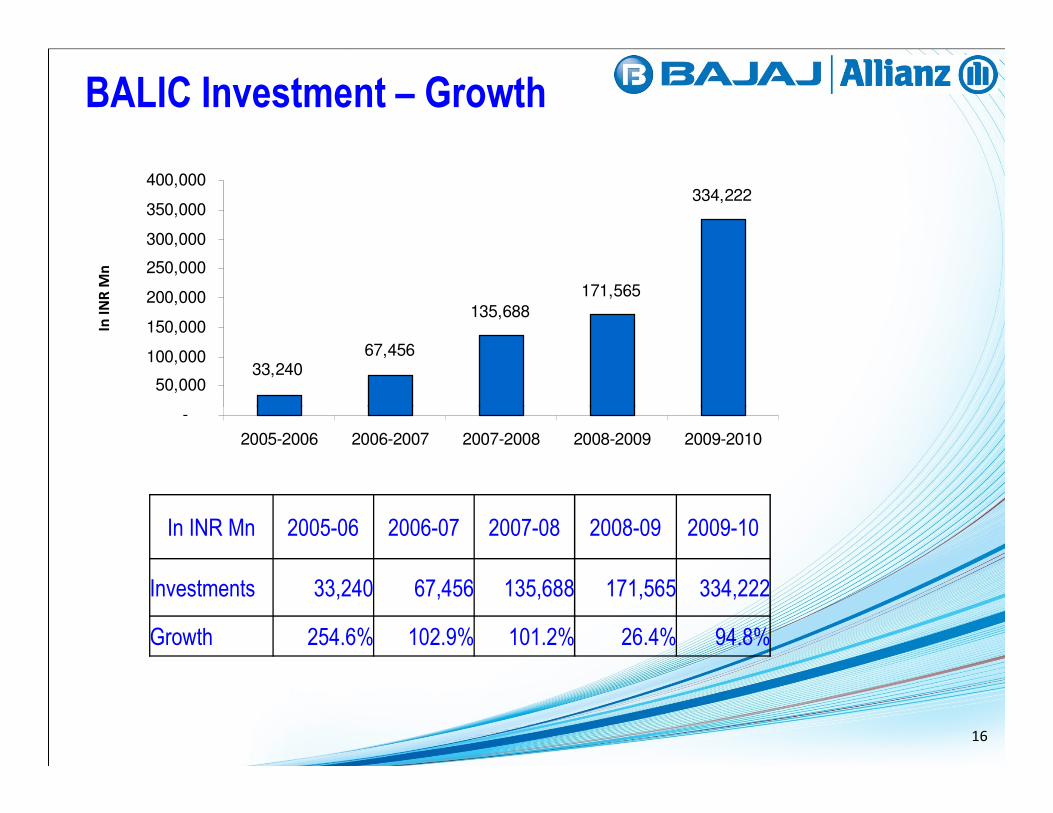
BALIC Investment – GrowthIn
IN
R M
n
334,222
171,565
135,688
67,45633,240
-
50,000
100,000
150,000
200,000
250,000
300,000
350,000
400,000
In INR Mn 2005-06 2006-07 2007-08 2008-09 2009-10
Investments 33,240 67,456 135,688 171,565 334,222
Growth 254.6% 102.9% 101.2% 26.4% 94.8%
-
2005-2006 2006-2007 2007-2008 2008-2009 2009-2010
16
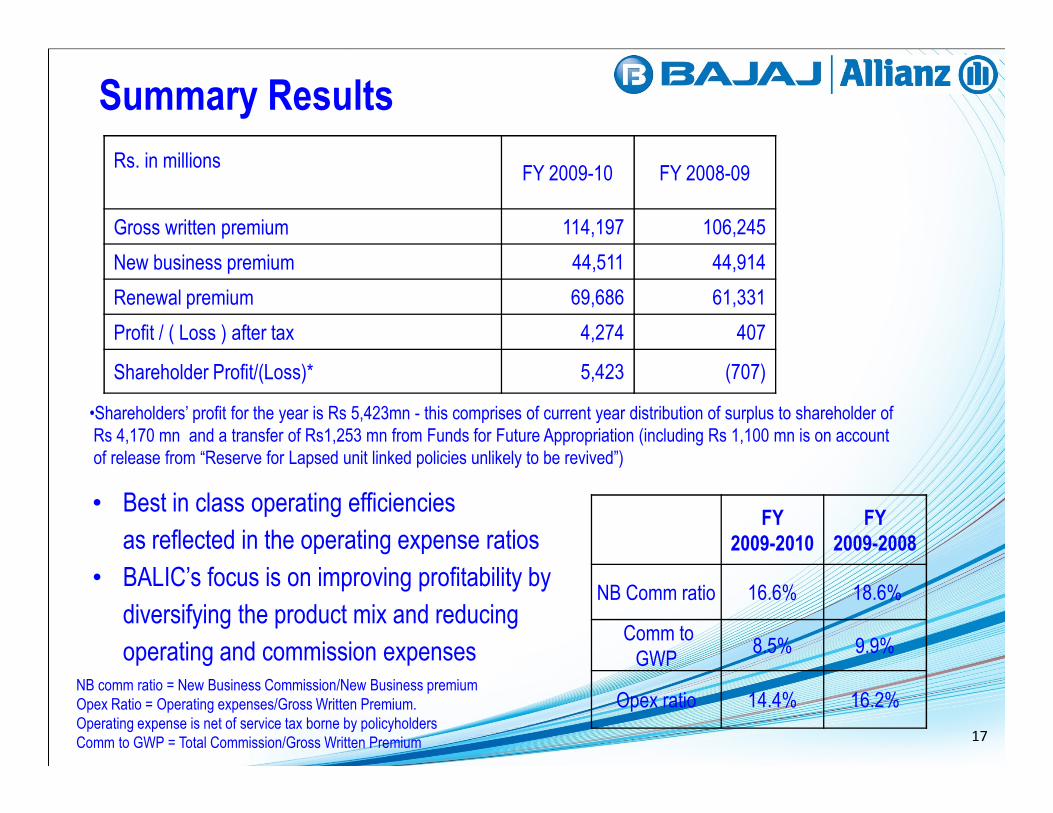
Rs. in millionsFY 2009-10 FY 2008-09
Gross written premium 114,197 106,245
New business premium 44,511 44,914
Renewal premium 69,686 61,331
Profit / ( Loss ) after tax 4,274 407
Shareholder Profit/(Loss)* 5,423 (707)
Summary Results
•Shareholders’ profit for the year is Rs 5,423mn - this comprises of current year distribution of surplus to shareholder of•Shareholders’ profit for the year is Rs 5,423mn - this comprises of current year distribution of surplus to shareholder of
Rs 4,170 mn and a transfer of Rs1,253 mn from Funds for Future Appropriation (including Rs 1,100 mn is on account
of release from “Reserve for Lapsed unit linked policies unlikely to be revived”)
• Best in class operating efficiencies
as reflected in the operating expense ratios
• BALIC’s focus is on improving profitability by
diversifying the product mix and reducing
operating and commission expenses
FY
2009-2010
FY
2009-2008
NB Comm ratio 16.6% 18.6%
Comm to
GWP8.5% 9.9%
Opex ratio 14.4% 16.2%NB comm ratio = New Business Commission/New Business premium
Opex Ratio = Operating expenses/Gross Written Premium.
Operating expense is net of service tax borne by policyholders
Comm to GWP = Total Commission/Gross Written Premium 17
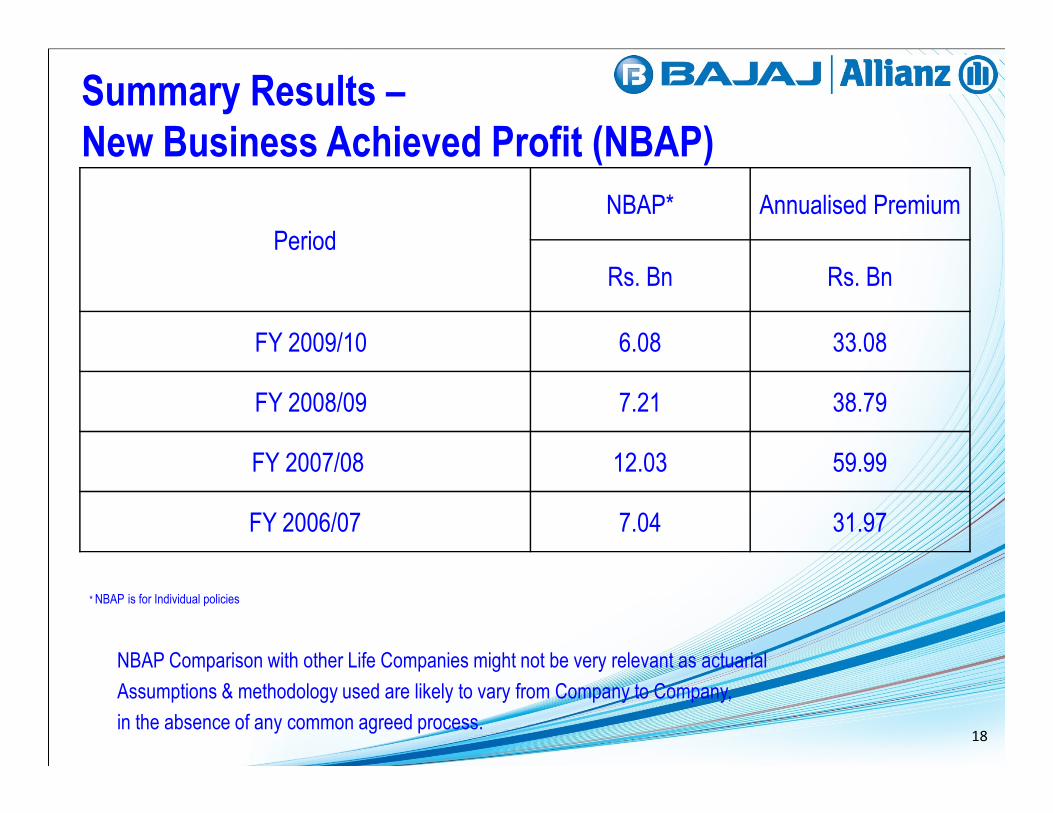
Summary Results –
New Business Achieved Profit (NBAP)
Period
NBAP* Annualised Premium
Rs. Bn Rs. Bn
FY 2009/10 6.08 33.08
FY 2008/09 7.21 38.79FY 2008/09 7.21 38.79
FY 2007/08 12.03 59.99
FY 2006/07 7.04 31.97
NBAP Comparison with other Life Companies might not be very relevant as actuarial
Assumptions & methodology used are likely to vary from Company to Company,
in the absence of any common agreed process.
* NBAP is for Individual policies
18
� Regulatory challenges
� Improving persistency ratio
� Improving agent productivity
Challenges
� Improving agent productivity
� Control on acquisition and operating expenses
� Withdrawals after 3 years.
19
Bajaj Allianz
General Insurance Co.General Insurance Co.
20
Our New Brand Identity
21
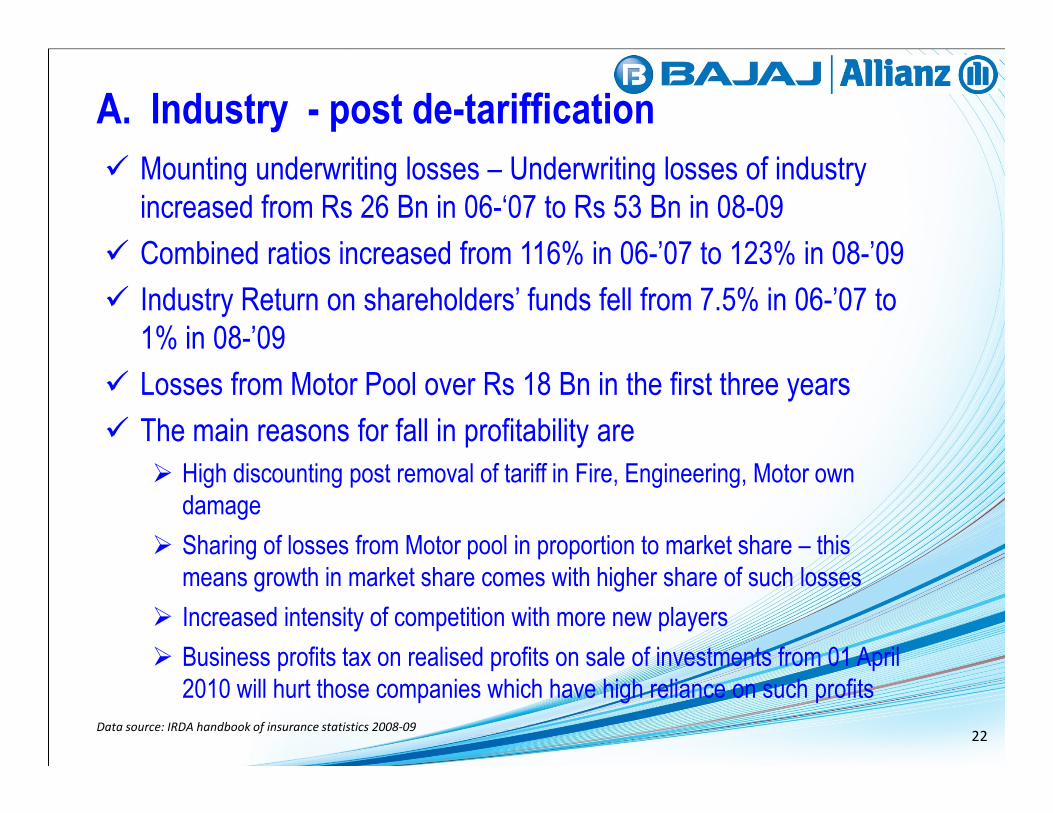
A. Industry - post de-tariffication
� Mounting underwriting losses – Underwriting losses of industry
increased from Rs 26 Bn in 06-‘07 to Rs 53 Bn in 08-09
� Combined ratios increased from 116% in 06-’07 to 123% in 08-’09
� Industry Return on shareholders’ funds fell from 7.5% in 06-’07 to
1% in 08-’09
� Losses from Motor Pool over Rs 18 Bn in the first three years
� The main reasons for fall in profitability are
� High discounting post removal of tariff in Fire, Engineering, Motor own
damage
� Sharing of losses from Motor pool in proportion to market share – this
means growth in market share comes with higher share of such losses
� Increased intensity of competition with more new players
� Business profits tax on realised profits on sale of investments from 01 April
2010 will hurt those companies which have high reliance on such profits
Data source: IRDA handbook of insurance statistics 2008-0922
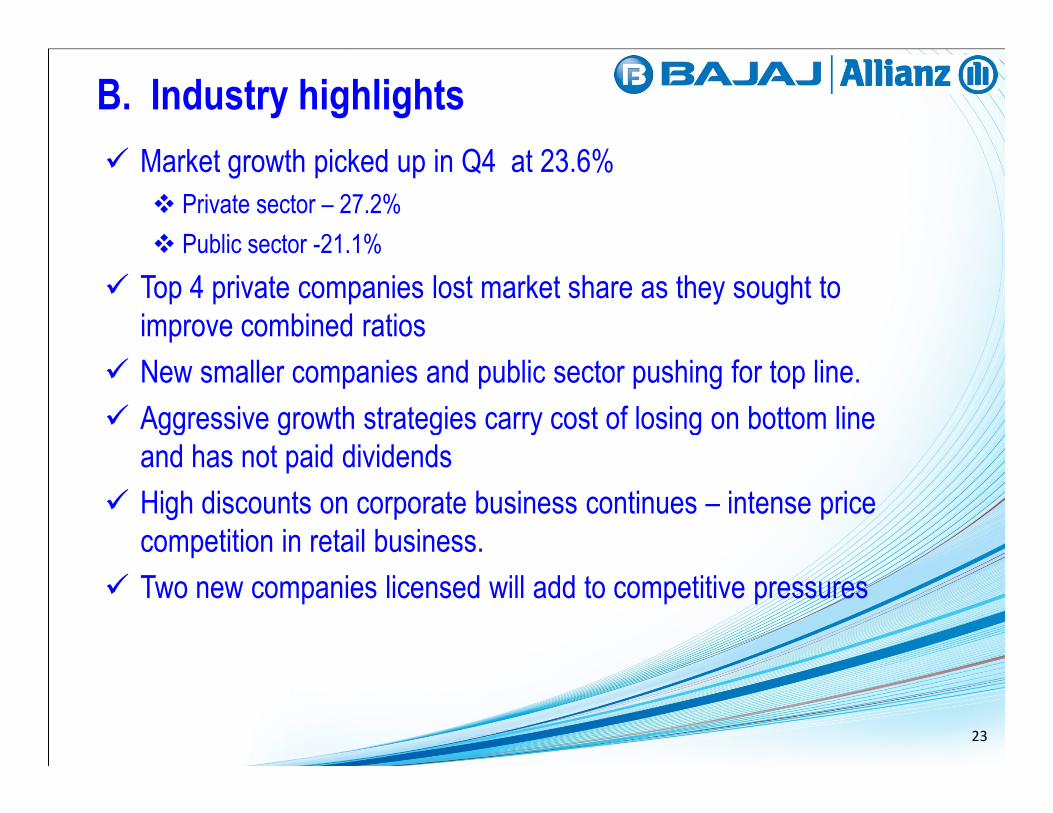
B. Industry highlights
� Market growth picked up in Q4 at 23.6%
� Private sector – 27.2%
� Public sector -21.1%
� Top 4 private companies lost market share as they sought to
improve combined ratios
� New smaller companies and public sector pushing for top line.
� Aggressive growth strategies carry cost of losing on bottom line � Aggressive growth strategies carry cost of losing on bottom line
and has not paid dividends
� High discounts on corporate business continues – intense price
competition in retail business.
� Two new companies licensed will add to competitive pressures
23
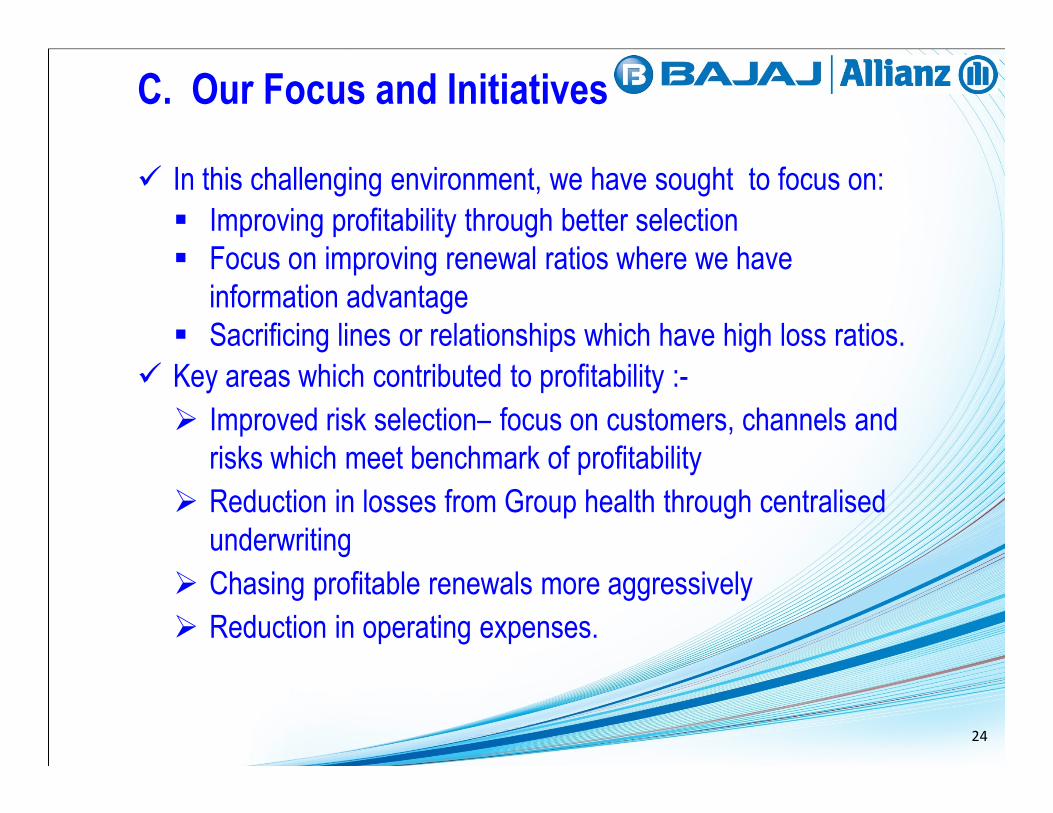
� In this challenging environment, we have sought to focus on:
� Improving profitability through better selection
� Focus on improving renewal ratios where we have
information advantage
� Sacrificing lines or relationships which have high loss ratios.
� Key areas which contributed to profitability :-
� Improved risk selection– focus on customers, channels and
C. Our Focus and Initiatives
� Improved risk selection– focus on customers, channels and
risks which meet benchmark of profitability
� Reduction in losses from Group health through centralised
underwriting
� Chasing profitable renewals more aggressively
� Reduction in operating expenses.
24
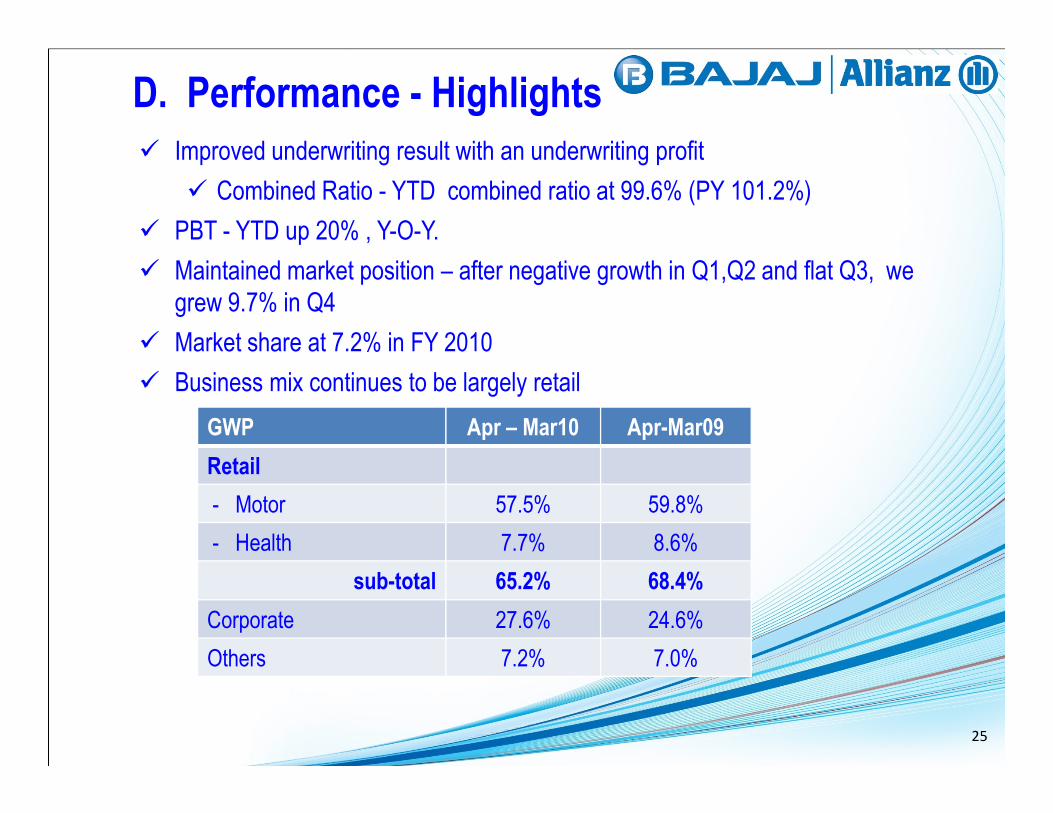
D. Performance - Highlights
� Improved underwriting result with an underwriting profit
� Combined Ratio - YTD combined ratio at 99.6% (PY 101.2%)
� PBT - YTD up 20% , Y-O-Y.
� Maintained market position – after negative growth in Q1,Q2 and flat Q3, we
grew 9.7% in Q4
� Market share at 7.2% in FY 2010
� Business mix continues to be largely retail
GWP Apr – Mar10 Apr-Mar09
Retail
- Motor 57.5% 59.8%
- Health 7.7% 8.6%
sub-total 65.2% 68.4%
Corporate 27.6% 24.6%
Others 7.2% 7.0%
25
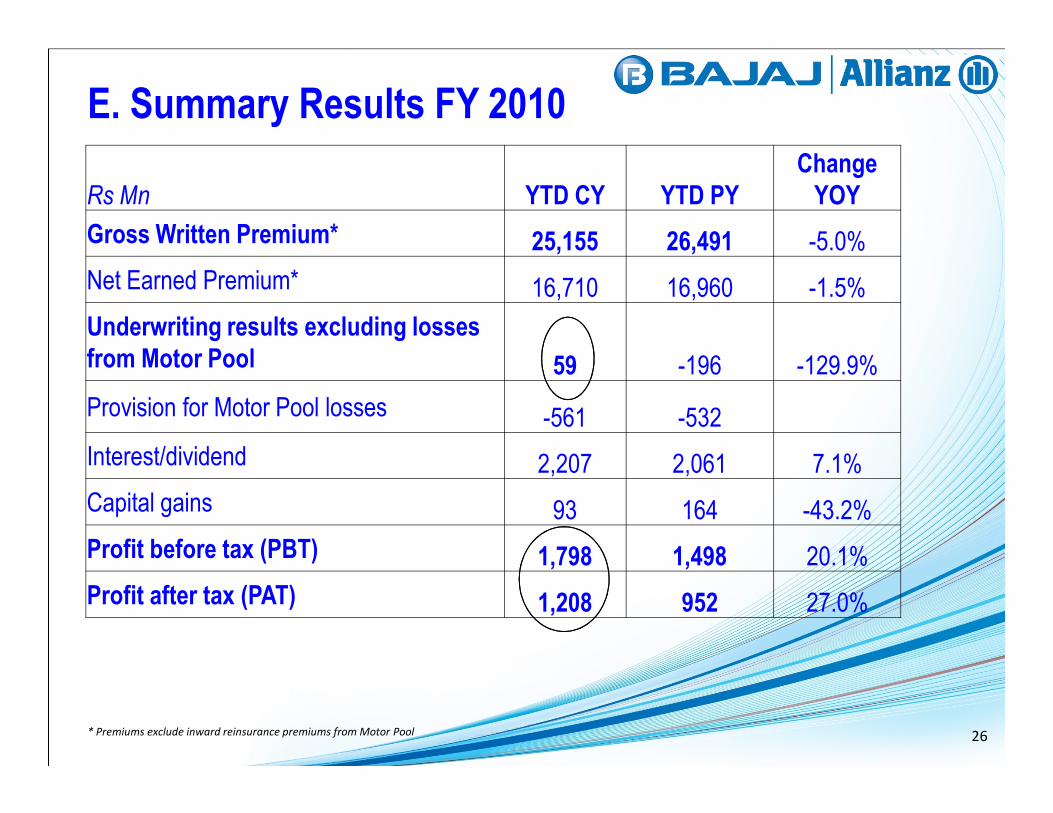
E. Summary Results FY 2010
Rs Mn YTD CY YTD PY
Change
YOY
Gross Written Premium* 25,155 26,491 -5.0%
Net Earned Premium* 16,710 16,960 -1.5%
Underwriting results excluding losses
from Motor Pool 59 -196 -129.9%
Provision for Motor Pool losses -561 -532Provision for Motor Pool losses -561 -532
Interest/dividend 2,207 2,061 7.1%
Capital gains 93 164 -43.2%
Profit before tax (PBT) 1,798 1,498 20.1%
Profit after tax (PAT) 1,208 952 27.0%
* Premiums exclude inward reinsurance premiums from Motor Pool 26
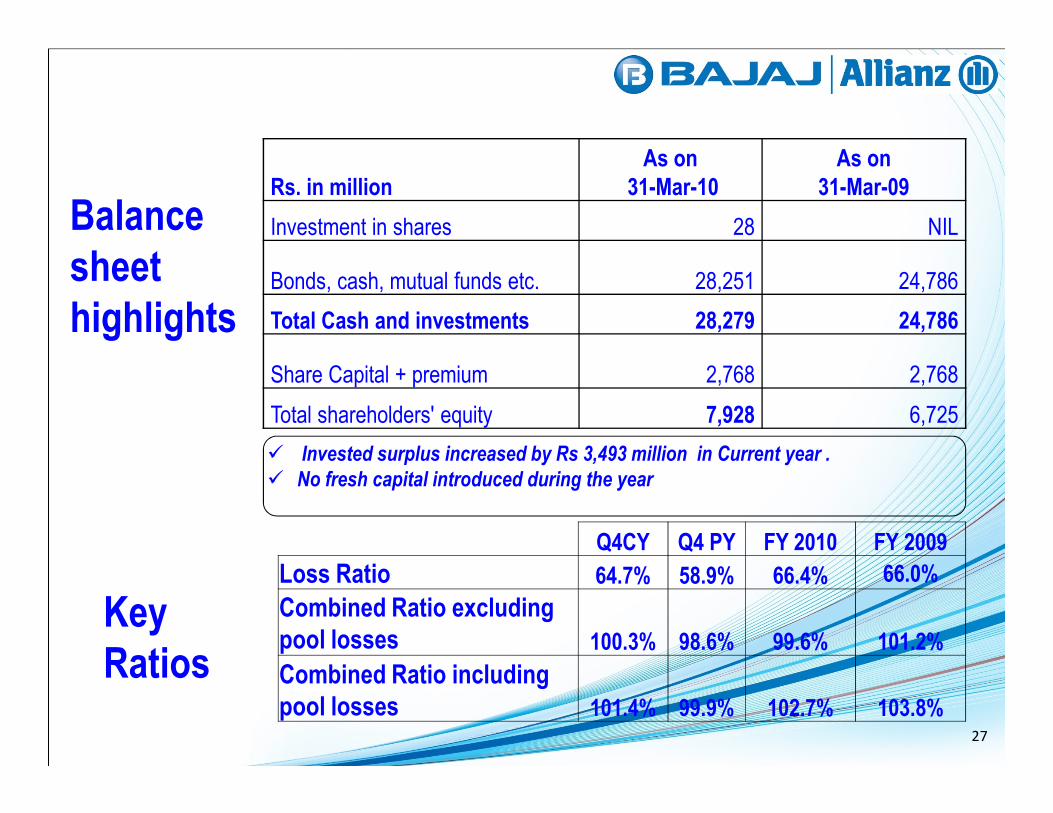
Balance
sheet
highlights
Rs. in million
As on
31-Mar-10
As on
31-Mar-09
Investment in shares 28 NIL
Bonds, cash, mutual funds etc. 28,251 24,786
Total Cash and investments 28,279 24,786
Share Capital + premium 2,768 2,768
Total shareholders' equity 7,928 6,725
Key
Ratios
Total shareholders' equity 7,928 6,725
� Invested surplus increased by Rs 3,493 million in Current year .
� No fresh capital introduced during the year
Q4CY Q4 PY FY 2010 FY 2009
Loss Ratio 64.7% 58.9% 66.4% 66.0%
Combined Ratio excluding
pool losses 100.3% 98.6% 99.6% 101.2%
Combined Ratio including
pool losses 101.4% 99.9% 102.7% 103.8%27

Market Share
YTD (Apr-Mar 10) YTD (Apr-Mar 09)
• Top 4 private companies have lost 3.8% market share
• Smaller private companies and PSUs have gained market share
Based on GWP excluding specialised companies28

� Competitive pressures likely to continue as smaller companies,
new companies and public sector push for top line
� Growth environment improved but prudent selection and
economic pricing will continue to drive our strategy.
G. Challenges and way forward
� We will continue our focus on
� Maximizing net realization after acquisition costs
� Retaining and growing profitable relationships on the retail segment
� Maintaining strong profitability bias in underwriting and selection
29

Bajaj
Auto Finance
30

Our New Brand Identity
31

Q4’10 Overview
• Excellent quarter for the company. Q4 PAT growth of 67% to 25.18 Crores.
• Full year PAT growth of 213% to 106.34 Crs. if adjusted for one time provisioning
impact of 25.67 Crs.
• Continued strong momentum in consumer businesses viz. Two-wheeler financing &
Durables financing. Strong recovery in small businesses viz. Personal & small
business loan and Loans against property.business loan and Loans against property.
• Launched Construction equipment financing and Retail loans against shares on April
01’ 2010.
• Cost of funds continue to remain benign. Have strengthened ALM in FY09.
• Improvement in portfolio metrics across businesses. New vintages performing
superior.
• Holding credit ratings at FAA+, P1+ and FAAA.32

Summary Annual Income Statement
(Rs Crores , except EPS) FY 10 FY 09 %▲
Income from operations 809.7 509.559%
Other operating income 106.5 89.9 18%
Total Income 916.2 599.4 53%
Interest & other finance charges 201.6 164.4 22%
Net interest income 714.6 435.0 64%
Operating expenses 263.6 174.1Operating expenses 263.6 174.1 51%
Recovery commission 56.1 46.3 21%
Provision for doubtful debts & bad debts 260.6 163.6 59%
Provision for doubtful debts + Recovery commission 316.7 209.9 51%
Profit from ordinary activities before tax 134.3 51.0 163%
Tax Expenses (including Deferred Taxes & FBT) 44.9 17.1 163%
Net Profit/(loss) from ordinary activities after tax 89.4 33.9 164%
Paid up Equity Share Capital 36.60 36.60
EPS before and after Extraordinary item
a)Basic(Rs) b)Diluted(Rs) 24.43 9.27 164%
Operating expenses(including recovery commission) as a % of NII 45% 51%33

Summary Income Statement Q4’10
(Rs Crores , except EPS) Q4’ 10 Q4’09 %▲
Income from operations 224.5 158.0 42%
Other operating income 32.4 17.8 82%
Total Income 256.9 175.8 46%
Interest & other finance charges 58.7 36.2 62%
Net interest income 198.2 139.6 42%
Operating expenses 61 52 17%Operating expenses 61 52 17%
Recovery commission 13.2 12.8 3%
Provision for doubtful debts & bad debts 88.6 51.7 71%
Provision for doubtful debts + Recovery commission 101.9 64.5 58%
Profit from ordinary activities before tax 35.3 23.1 53%
Tax Expenses (including Deferred Taxes & FBT) 10.1 8.0 26%
Net Profit/(loss) from ordinary activities after tax 25.2 15.1 67%
Paid up Equity Share Capital 36.6 36.6
EPS before and after Extraordinary item
a)Basic(Rs) b)Diluted(Rs)6.88 4.12
67%
Operating expenses(including recovery commission) as a % of NII 38% 46% 34

Snapshot – Q4’10
Revenues 47% QoQ 53% YoYDisbursements 103% QoQ 87% YoY
6521046 1003 1210 1326
4585
2451
Q4'09 Q1'10 Q2'10 Q3'10 Q4'10 FY-10 FY-09
Disbursements(Rs Crores)
Disbursements (Rs Crores)
2 per. Mov. Avg. (Disbursements (Rs Crores))
175 190 220 250 257
916
599
Q4'09 Q1'10 Q2'10 Q3'10 Q4'10 FY-10 FY-09Revenues(Rs Crores)
Revenues (Rs Crores)
2 per. Mov. Avg. (Revenues (Rs Crores))
NII 42% QoQ 64% YoY Operating Expenses % of NII
Quarter Quarter
139 148 174 194 198
715
435
Q4'09 Q1'10 Q2'10 Q3'10 Q4'10 FY-10 FY-09
NII(Rs Crores)
Quarter
NII (Rs Crores) 2 per. Mov. Avg. (NII (Rs Crores))
46% 44%48% 47%
38%45%
51%
Q4'09 Q1'10 Q2'10 Q3'10 Q4'10 FY-10 FY-09
Operating Expenses as a % of NII
Quarter
Operating Expenses as a % of NII
2 per. Mov. Avg. (Operating Expenses as a % of NII)
35

Snapshot – Q4’10
Pre-tax profit 54% QoQ 163% YoYLoss provision 74% QoQ 60% YoY
51 53 59 6089
261
163
Q4'09 Q1'10 Q2'10 Q3'10 Q4'10 FY-10 FY-09
Loss provision(Rs.Crores) Loss provision (Rs Crores)
2 per. Mov. Avg. (Loss provision (Rs Crores))
23 2332
43 35
134
51
Q4'09 Q1'10 Q2'10 Q3'10 Q4'10 FY-10 FY-09
Pre-tax profit( Rs Crores) Pre-tax profit (Rs Crores)
2 per. Mov. Avg. (Pre-tax profit (Rs Crores))
Net NPA Reducing NPA ROTA(%) Stable & Growing ROTA
Q4'09 Q1'10 Q2'10 Q3'10 Q4'10 FY-10 FY-09
Quarter Quarter
2.32.0
2.6
3.02.7 2.8
1.3
Q4'09 Q1'10 Q2'10 Q3'10 Q4'10 FY-10 FY-09
ROTA(%)
Quarter
ROTA (%) 2 per. Mov. Avg. (ROTA (%))
6.25.5
4.5
3.32.5 2.2 2.2
5.5
Q3'09 Q4'09 Q1'10 Q2'10 Q3'10 Q4'10 FY-10 FY-09
Net NPA(%)
Quarter
Net NPA (%) 2 per. Mov. Avg. (Net NPA (%))
36

Snapshot – Q4’10
Capital adequacy increasing leverage Book Size increasing book size
38.435.0
31.7 30.626.0 26.0
38.4
Q4'09 Q1'10 Q2'10 Q3'10 Q4'10 FY-10 FY-09
Capital Adequacy Ratio
Capital Adequacy Ratio
2 per. Mov. Avg. (Capital Adequacy Ratio)
25393114
3450 37004026
Q4'09 Q1'10 Q2'10 Q3'10 Q4'10
Book Size (Rs Crores)
2 per. Mov. Avg. (Book Size (Rs Crores))
Portfolio Mix Earnings per share 67 % QoQ 164 % YoY
4.12 4.165.93 7.46 6.88
24.43
9.27
Q4'09 Q1'10 Q2'10 Q3'10 Q4'10 FY-10 FY-09
Earnings per Share(Rs)
Quarter
Earnings per Share(Rs)
2 per. Mov. Avg. (Earnings per Share(Rs))
35%
41%
24%
AF Sec CF Unsec CF
Q4'09 Q1'10 Q2'10 Q3'10 Q4'10 FY-10 FY-09
Quarter
Q4'09 Q1'10 Q2'10 Q3'10 Q4'10
Quarter
37

Thank you
38
No part of this presentation is to be circulated, quoted, or reproduced for any distribution without priorwritten approval from Bajaj FinServ Limited, Mumbai-Pune Road, Akurdi, Pune-411 035, India.
Certain part of this presentation describing estimates, objectives and projections may be a “forward lookingstatement” within the meaning of applicable laws and regulations. Actual results might differ materially fromthose either expressed or implied. Undue reliance should not be placed on such statements & values becauseby their nature, they are subject to known and unknown risks and uncertainties and can be affected bynumerous factors that could cause actual results to differ materially. This material was used by Bajaj FinServLimited during an oral presentation; it is not a complete record of the discussion.


