Appendix A
AASHTO RAC Survey on STIP Procedures Wisconsin DOT – Bureau of Planning and Economic Development
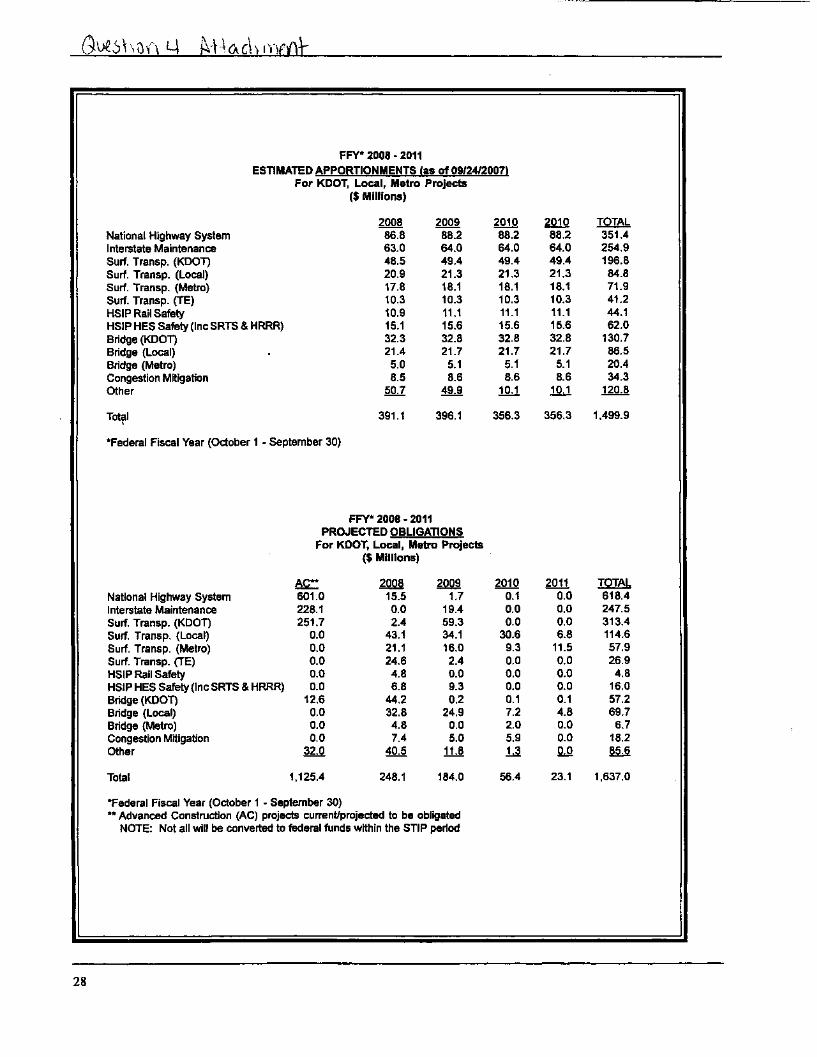
July 2008 Delaware • Revised STIP page Illinois • District 3 STIP Amendment • DRAFT – STIP • STIP Amendment Example Kansas • Question two – Amendments • Question four - Funding Maryland • 2008 STIP • Fiscal Constraints Worksheets SHAMTA • RAC Survey Response Missouri • June 2008 STIP Amendments Montana • 2007-2009 STIP Fiscal Constraint – Amendment #9 • 2007 Amendment #9 Recap • 2007 Amendment #9 New Jersey • TPA Package Pennsylvania • Sample e-STIP • Sample Fiscal Constraint Chart • Sample TIP Virginia • UPC 61407 Amendment #11 • UPC 86499 Amendment #11
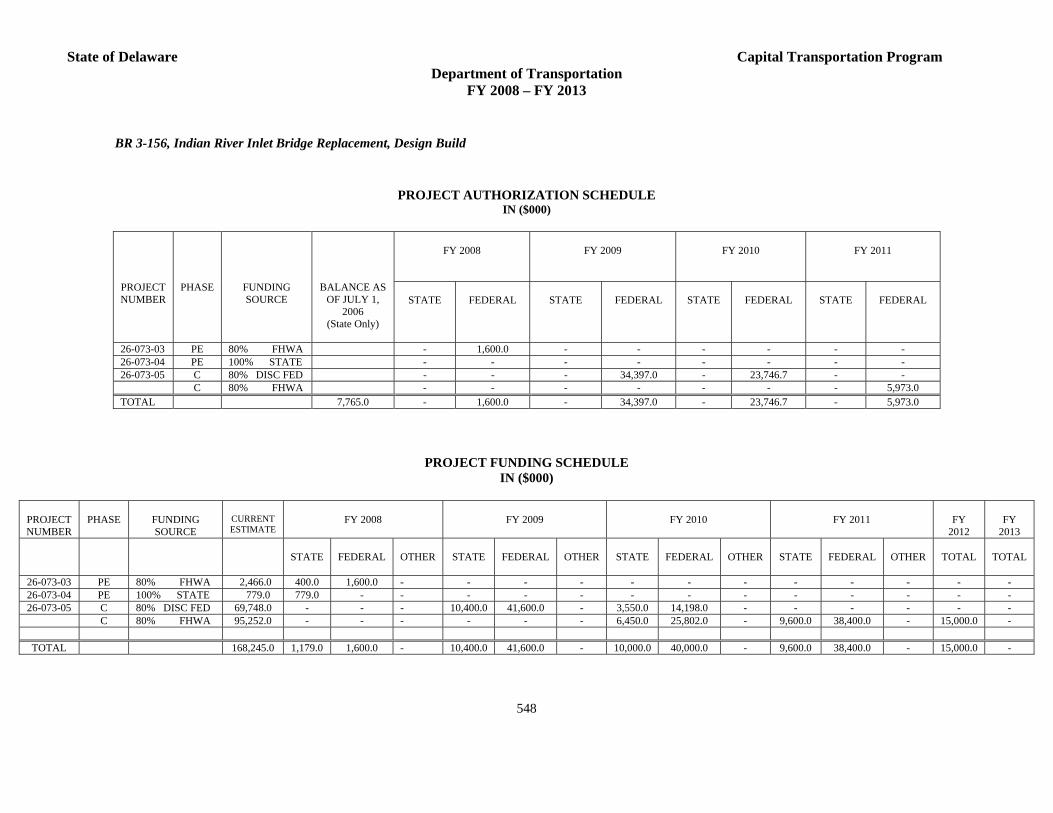
State of Delaware Capital Transportation Program Department of Transportation
FY 2008 – FY 2013
BR 3-156, Indian River Inlet Bridge Replacement, Design Build
PROJECT AUTHORIZATION SCHEDULE IN ($000)
FY 2008
FY 2009
FY 2010
FY 2011
PROJECT NUMBER
PHASE
FUNDING SOURCE
BALANCE AS OF JULY 1,
2006 (State Only)
STATE
FEDERAL
STATE
FEDERAL
STATE
FEDERAL
STATE
FEDERAL
26-073-03 PE 80% FHWA - 1,600.0 - - - - - - 26-073-04 PE 100% STATE - - - - - - - - 26-073-05 C 80% DISC FED - - - 34,397.0 - 23,746.7 - - C 80% FHWA - - - - - - - 5,973.0 TOTAL 7,765.0 - 1,600.0 - 34,397.0 - 23,746.7 - 5,973.0
PROJECT FUNDING SCHEDULE IN ($000)
PROJECT NUMBER
PHASE
FUNDING SOURCE
CURRENT ESTIMATE
FY 2008
FY 2009
FY 2010
FY 2011
FY
2012
FY
2013
STATE
FEDERAL
OTHER
STATE
FEDERAL
OTHER
STATE
FEDERAL
OTHER
STATE
FEDERAL
OTHER
TOTAL
TOTAL
26-073-03 PE 80% FHWA 2,466.0 400.0 1,600.0 - - - - - - - - - - - - 26-073-04 PE 100% STATE 779.0 779.0 - - - - - - - - - - - - - 26-073-05 C 80% DISC FED 69,748.0 - - - 10,400.0 41,600.0 - 3,550.0 14,198.0 - - - - - -
C 80% FHWA 95,252.0 - - - - - - 6,450.0 25,802.0 - 9,600.0 38,400.0 - 15,000.0 -
TOTAL 168,245.0 1,179.0 1,600.0 - 10,400.0 41,600.0 - 10,000.0 40,000.0 - 9,600.0 38,400.0 - 15,000.0 -
548
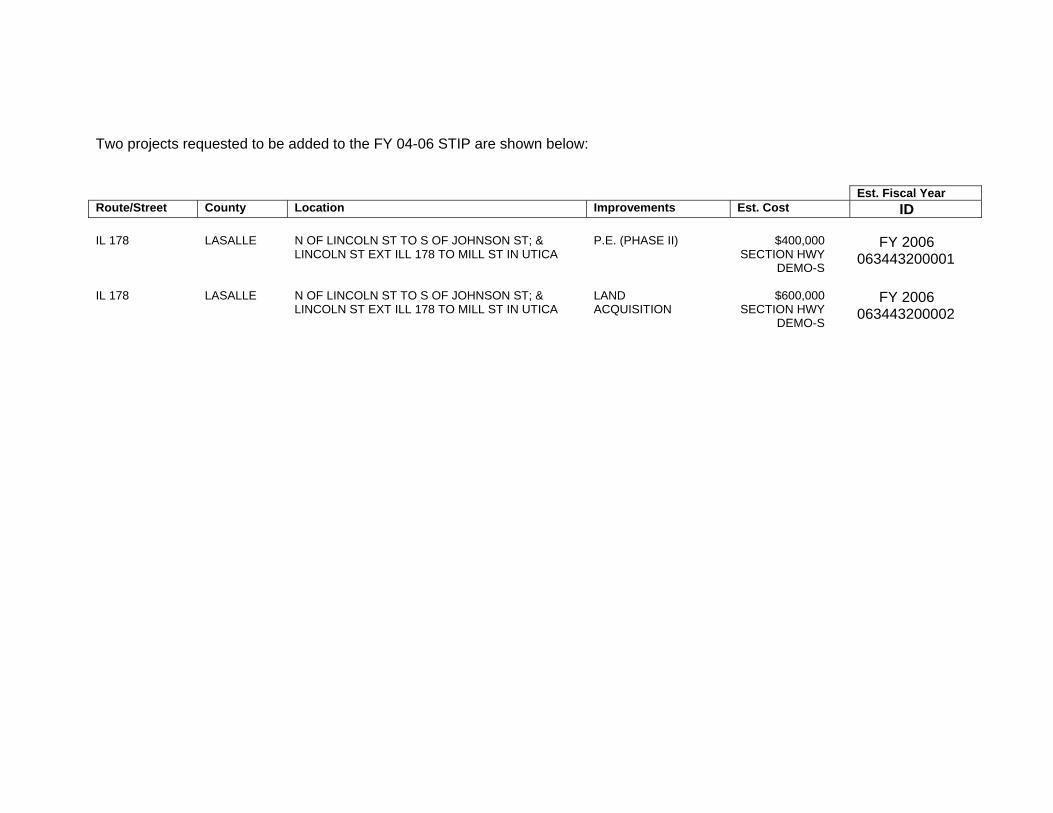
Two projects requested to be added to the FY 04-06 STIP are shown below: Est. Fiscal Year Route/Street County Location Improvements Est. Cost ID IL 178 LASALLE N OF LINCOLN ST TO S OF JOHNSON ST; &
LINCOLN ST EXT ILL 178 TO MILL ST IN UTICA P.E. (PHASE II) $400,000
SECTION HWY DEMO-S
FY 2006 063443200001
IL 178 LASALLE N OF LINCOLN ST TO S OF JOHNSON ST; & LINCOLN ST EXT ILL 178 TO MILL ST IN UTICA
LAND ACQUISITION
$600,000 SECTION HWY
DEMO-S
FY 2006 063443200002
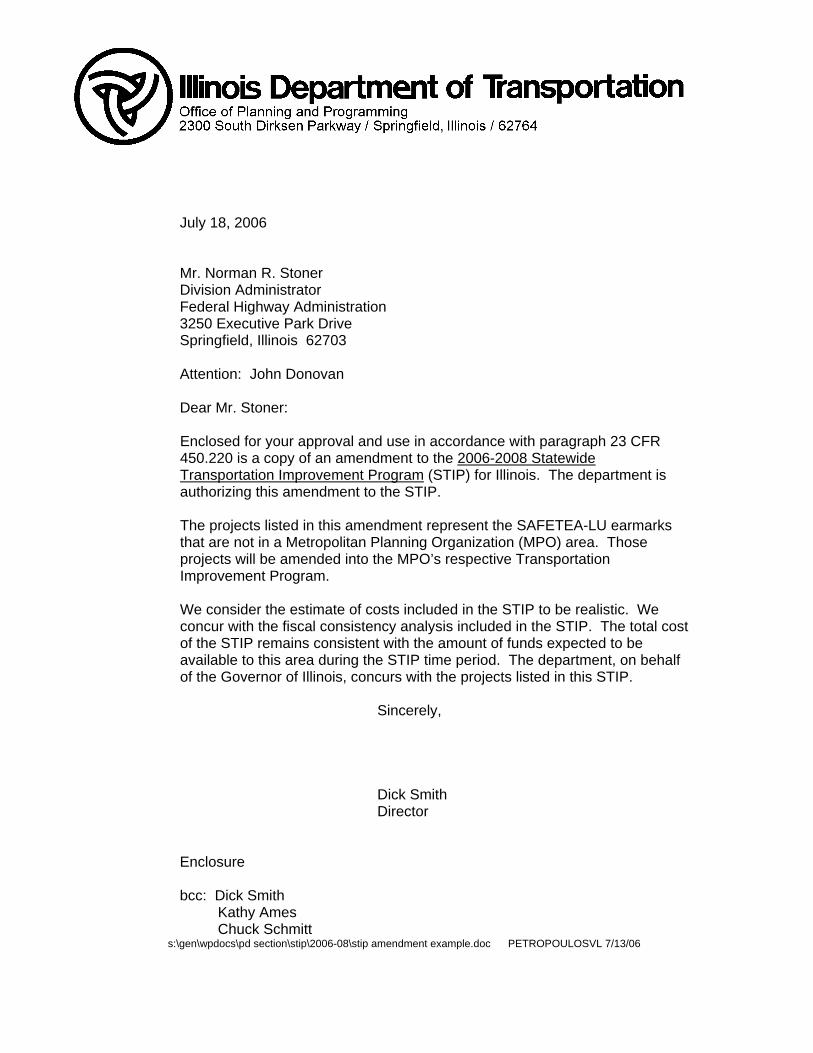
July 18, 2006 Mr. Norman R. Stoner Division Administrator Federal Highway Administration 3250 Executive Park Drive Springfield, Illinois 62703 Attention: John Donovan Dear Mr. Stoner: Enclosed for your approval and use in accordance with paragraph 23 CFR 450.220 is a copy of an amendment to the 2006-2008 Statewide Transportation Improvement Program (STIP) for Illinois. The department is authorizing this amendment to the STIP. The projects listed in this amendment represent the SAFETEA-LU earmarks that are not in a Metropolitan Planning Organization (MPO) area. Those projects will be amended into the MPO’s respective Transportation Improvement Program. We consider the estimate of costs included in the STIP to be realistic. We concur with the fiscal consistency analysis included in the STIP. The total cost of the STIP remains consistent with the amount of funds expected to be available to this area during the STIP time period. The department, on behalf of the Governor of Illinois, concurs with the projects listed in this STIP.
Sincerely, Dick Smith Director
Enclosure bcc: Dick Smith Kathy Ames Chuck Schmitt
s:\gen\wpdocs\pd section\stip\2006-08\stip amendment example.doc PETROPOULOSVL 7/13/06
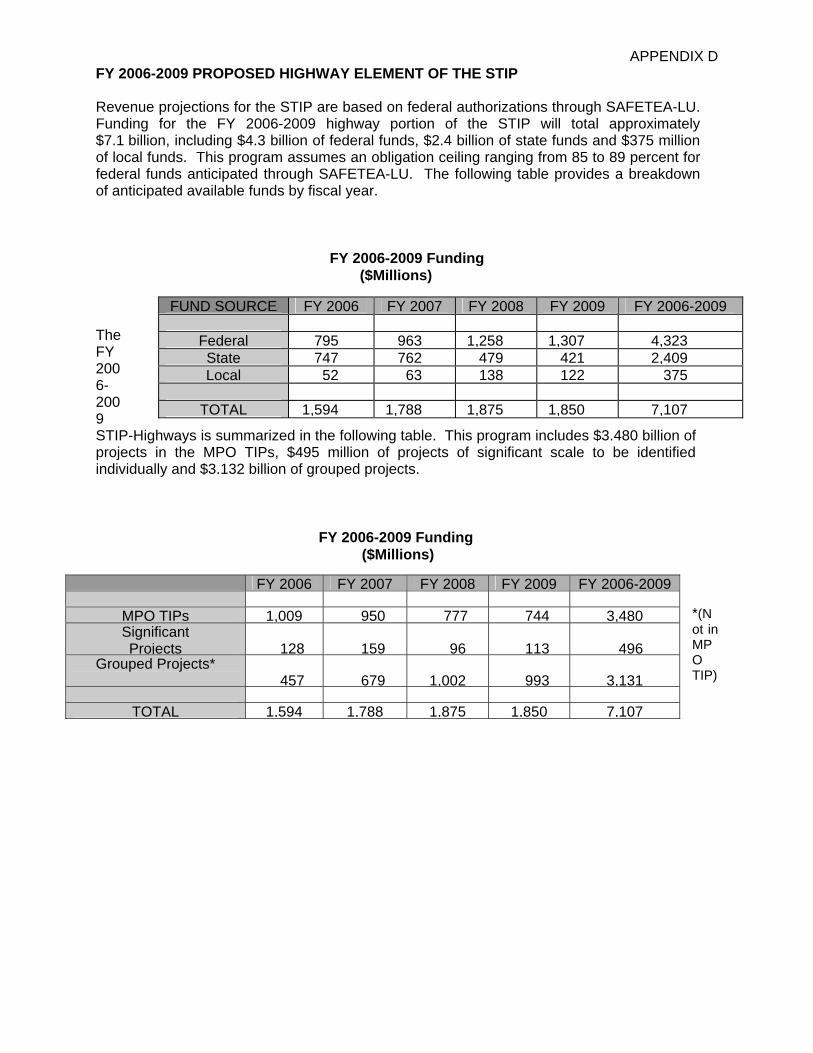
APPENDIX D FY 2006-2009 PROPOSED HIGHWAY ELEMENT OF THE STIP Revenue projections for the STIP are based on federal authorizations through SAFETEA-LU. Funding for the FY 2006-2009 highway portion of the STIP will total approximately $7.1 billion, including $4.3 billion of federal funds, $2.4 billion of state funds and $375 million of local funds. This program assumes an obligation ceiling ranging from 85 to 89 percent for federal funds anticipated through SAFETEA-LU. The following table provides a breakdown of anticipated available funds by fiscal year.
FY 2006-2009 Funding ($Millions)
The FY 2006-2009 STIP-Highways is summarized in the following table. This program includes $3.480 billion of projects in the MPO TIPs, $495 million of projects of significant scale to be identified individually and $3.132 billion of grouped projects.
FUND SOURCE FY 2006 FY 2007 FY 2008 FY 2009 FY 2006-2009
Federal 795 963 1,258 1,307 4,323State 747 762 479 421 2,409Local 52 63 138 122 375
TOTAL 1,594 1,788 1,875 1,850 7,107
FY 2006-2009 Funding ($Millions)
*(Not in MPO TIP)
FY 2006 FY 2007 FY 2008 FY 2009 FY 2006-2009
MPO TIPs 1,009 950 777 744 3,480 Significant Projects
128
159
96
113
496
Grouped Projects* 457
679
1,002
993
3,131
TOTAL 1,594 1,788 1,875 1,850 7,107
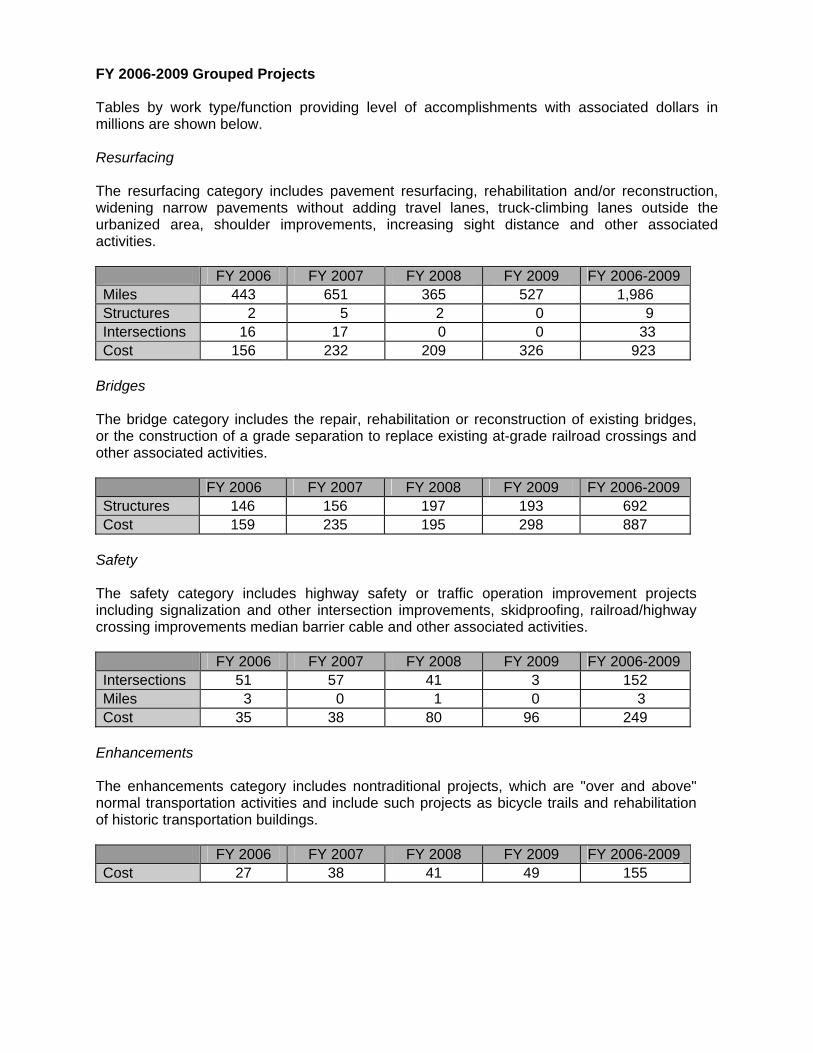
FY 2006-2009 Grouped Projects Tables by work type/function providing level of accomplishments with associated dollars in millions are shown below. Resurfacing The resurfacing category includes pavement resurfacing, rehabilitation and/or reconstruction, widening narrow pavements without adding travel lanes, truck-climbing lanes outside the urbanized area, shoulder improvements, increasing sight distance and other associated activities. FY 2006 FY 2007 FY 2008 FY 2009 FY 2006-2009 Miles 443 651 365 527 1,986 Structures 2 5 2 0 9 Intersections 16 17 0 0 33 Cost 156 232 209 326 923
Bridges The bridge category includes the repair, rehabilitation or reconstruction of existing bridges, or the construction of a grade separation to replace existing at-grade railroad crossings and other associated activities. FY 2006 FY 2007 FY 2008 FY 2009 FY 2006-2009 Structures 146 156 197 193 692 Cost 159 235 195 298 887
Safety The safety category includes highway safety or traffic operation improvement projects including signalization and other intersection improvements, skidproofing, railroad/highway crossing improvements median barrier cable and other associated activities. FY 2006 FY 2007 FY 2008 FY 2009 FY 2006-2009 Intersections 51 57 41 3 152 Miles 3 0 1 0 3 Cost 35 38 80 96 249
Enhancements The enhancements category includes nontraditional projects, which are "over and above" normal transportation activities and include such projects as bicycle trails and rehabilitation of historic transportation buildings. FY 2006 FY 2007 FY 2008 FY 2009 FY 2006-2009Cost 27 38 41 49 155
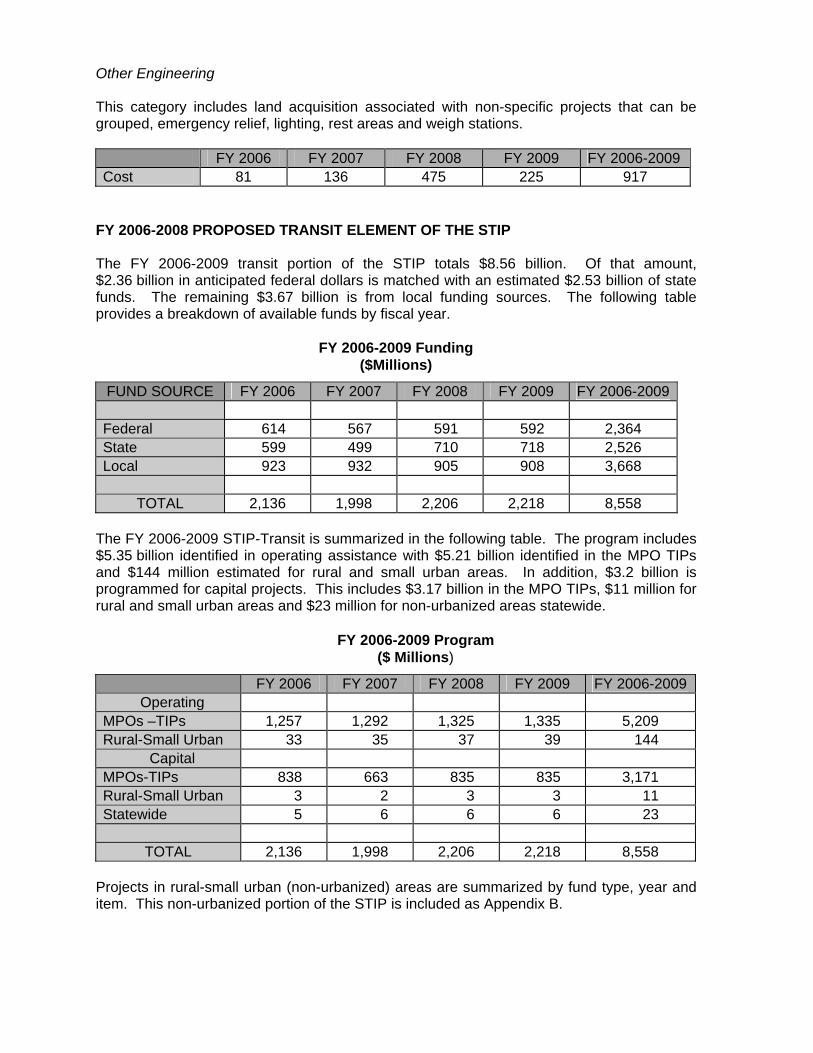
Other Engineering This category includes land acquisition associated with non-specific projects that can be grouped, emergency relief, lighting, rest areas and weigh stations. FY 2006 FY 2007 FY 2008 FY 2009 FY 2006-2009 Cost 81 136 475 225 917
FY 2006-2008 PROPOSED TRANSIT ELEMENT OF THE STIP
The FY 2006-2009 transit portion of the STIP totals $8.56 billion. Of that amount, $2.36 billion in anticipated federal dollars is matched with an estimated $2.53 billion of state funds. The remaining $3.67 billion is from local funding sources. The following table provides a breakdown of available funds by fiscal year.
FY 2006-2009 Funding ($Millions)
FUND SOURCE FY 2006 FY 2007 FY 2008 FY 2009 FY 2006-2009
Federal 614 567 591 592 2,364 State 599 499 710 718 2,526 Local 923 932 905 908 3,668
TOTAL 2,136 1,998 2,206 2,218 8,558
The FY 2006-2009 STIP-Transit is summarized in the following table. The program includes $5.35 billion identified in operating assistance with $5.21 billion identified in the MPO TIPs and $144 million estimated for rural and small urban areas. In addition, $3.2 billion is programmed for capital projects. This includes $3.17 billion in the MPO TIPs, $11 million for rural and small urban areas and $23 million for non-urbanized areas statewide.
FY 2006-2009 Program ($ Millions)
FY 2006 FY 2007 FY 2008 FY 2009 FY 2006-2009 Operating
MPOs –TIPs 1,257 1,292 1,325 1,335 5,209 Rural-Small Urban 33 35 37 39 144
Capital MPOs-TIPs 838 663 835 835 3,171 Rural-Small Urban 3 2 3 3 11 Statewide 5 6 6 6 23
TOTAL 2,136 1,998 2,206 2,218 8,558
Projects in rural-small urban (non-urbanized) areas are summarized by fund type, year and item. This non-urbanized portion of the STIP is included as Appendix B.
MARYLAND
STATEWIDE TRANSPORTATION IMPROVEMENT PROGRAM
FY 2008-2012
Prepared by the Maryland Department of Transportation
and the Metropolitan Planning Organizations for the Baltimore, Cumberland, Hagerstown, Salisbury,
Washington and Wilmington Regions
for approval by the Federal Highway Administration and the Federal Transit Administration
Part 1: Policy Documentation
Part 2: Program Documentation
FY 2007-2012 Maryland Consolidated Transportation Program
Part 3: Metropolitan Transportation Improvement Programs

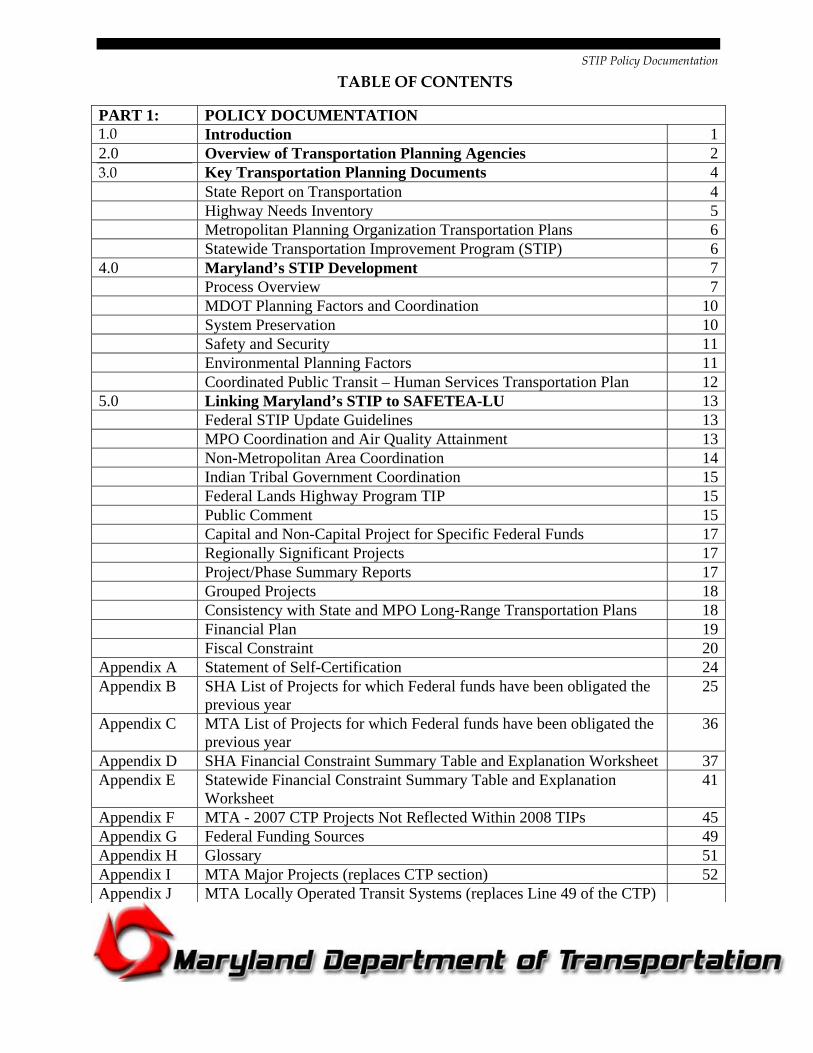
STIP Policy Documentation
TABLE OF CONTENTS
PART 1: POLICY DOCUMENTATION 1.0 Introduction 12.0 Overview of Transportation Planning Agencies 23.0 Key Transportation Planning Documents 4 State Report on Transportation 4 Highway Needs Inventory 5 Metropolitan Planning Organization Transportation Plans 6 Statewide Transportation Improvement Program (STIP) 64.0 Maryland’s STIP Development 7 Process Overview 7 MDOT Planning Factors and Coordination 10 System Preservation 10 Safety and Security 11 Environmental Planning Factors 11 Coordinated Public Transit – Human Services Transportation Plan 125.0 Linking Maryland’s STIP to SAFETEA-LU 13 Federal STIP Update Guidelines 13 MPO Coordination and Air Quality Attainment 13 Non-Metropolitan Area Coordination 14 Indian Tribal Government Coordination 15 Federal Lands Highway Program TIP 15 Public Comment 15 Capital and Non-Capital Project for Specific Federal Funds 17 Regionally Significant Projects 17 Project/Phase Summary Reports 17 Grouped Projects 18 Consistency with State and MPO Long-Range Transportation Plans 18 Financial Plan 19 Fiscal Constraint 20Appendix A Statement of Self-Certification 24Appendix B SHA List of Projects for which Federal funds have been obligated the
previous year 25
Appendix C MTA List of Projects for which Federal funds have been obligated the previous year
36
Appendix D SHA Financial Constraint Summary Table and Explanation Worksheet 37Appendix E Statewide Financial Constraint Summary Table and Explanation
Worksheet 41
Appendix F MTA - 2007 CTP Projects Not Reflected Within 2008 TIPs 45Appendix G Federal Funding Sources 49Appendix H Glossary 51Appendix I MTA Major Projects (replaces CTP section) 52Appendix J MTA Locally Operated Transit Systems (replaces Line 49 of the CTP)
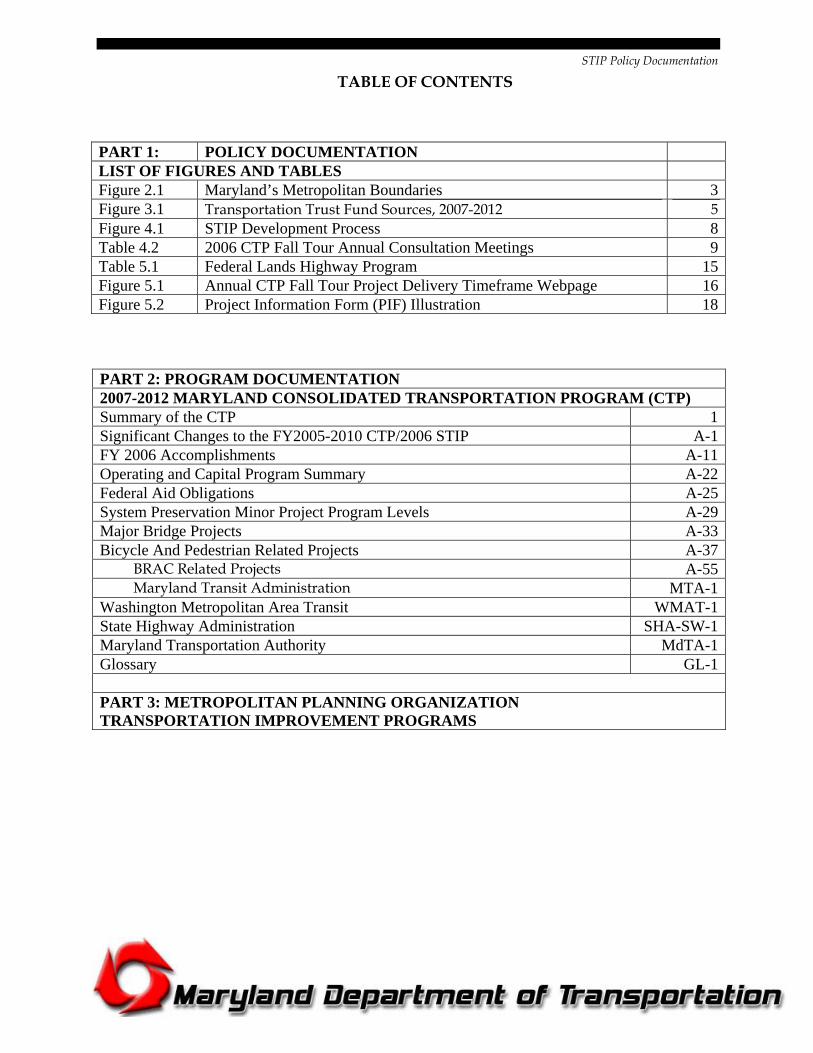
STIP Policy Documentation
TABLE OF CONTENTS
PART 1: POLICY DOCUMENTATION LIST OF FIGURES AND TABLES Figure 2.1 Maryland’s Metropolitan Boundaries 3Figure 3.1 Transportation Trust Fund Sources, 2007-2012 5 Figure 4.1 STIP Development Process 8Table 4.2 2006 CTP Fall Tour Annual Consultation Meetings 9Table 5.1 Federal Lands Highway Program 15Figure 5.1 Annual CTP Fall Tour Project Delivery Timeframe Webpage 16Figure 5.2 Project Information Form (PIF) Illustration 18
PART 2: PROGRAM DOCUMENTATION 2007-2012 MARYLAND CONSOLIDATED TRANSPORTATION PROGRAM (CTP) Summary of the CTP 1Significant Changes to the FY2005-2010 CTP/2006 STIP A-1FY 2006 Accomplishments A-11Operating and Capital Program Summary A-22Federal Aid Obligations A-25System Preservation Minor Project Program Levels A-29Major Bridge Projects A-33Bicycle And Pedestrian Related Projects A-37
BRAC Related Projects A-55Maryland Transit Administration MTA-1
Washington Metropolitan Area Transit WMAT-1State Highway Administration SHA-SW-1Maryland Transportation Authority MdTA-1Glossary GL-1 PART 3: METROPOLITAN PLANNING ORGANIZATION TRANSPORTATION IMPROVEMENT PROGRAMS
STIP Policy Documentation
Maryland Department of Transportation 1
Maryland Statewide Transportation Improvement Program: Policy Documentation
1.0 Introduction
The Fiscal Year 2008 – 2012 Maryland Statewide Transportation Improvement Program (STIP) is a five-year, fiscally constrained, and prioritized set of transportation projects, compiled from statewide, local, and regional plans. The STIP is guided by the Maryland Transportation Plan (MTP), which establishes a long-term vision for Maryland’s transportation network. The STIP contains Federally funded projects plus regionally significant State and local projects. All projects were identified as “high priority” through Maryland’s planning process and qualify to receive available transportation funding.
This STIP is prepared by the Maryland Department of Transportation (MDOT) in accordance with 23 CFR § 450.216 of the Safe, Accountable, Flexible, Efficient Transportation Equity Act: A Legacy for Users (SAFETEA-LU). MDOT submitted a “Gap Analysis” to FHWA and FTA during the summer of 2007 to clearly identify steps necessary to ensure the updated MTP and STIP will be SAFTEA-LU compliant. MDOT received written support from FHWA on August 23, 2007, which stated that MDOT is “demonstrating a good faith effort and would be in compliance with SAFETEA-LU regulations as long as it accomplishes activities identified in the Gap Analysis.” The activities highlighted in the Gap Analysis are covered in this STIP policy documentation.
Maryland’s STIP is developed through a collaborative effort between MDOT’s five Modal Administrations, the Maryland Transportation Authority (MdTA), the Washington Metropolitan Area Transit Authority (WMATA), the State’s six Metropolitan Planning Organizations (MPOs), metropolitan and non-metropolitan local officials, and the general public. A key component of the STIP process is the Annual Consultation Process, known as the Fall Tour, which is a process stipulated by State law requiring the Secretary of Transportation to visit with, and present to each of the State’s county jurisdictions and City of Baltimore, the annual draft of Maryland’s six-year capital investment program known as the Consolidated Transportation Program (CTP). The CTP/STIP Fall Tour provides the opportunity for the coordination, cooperation, and consultation between all affected stakeholders, and effectively fulfils the intent of SAFETEA-LU legislation.
Maryland’s 2008 – 2012 STIP contains three parts:
1. Policy Documentation – This section contains an overview of the STIP development process, demonstrates compliance with Federal and State law, and illustrates the vital role of public outreach and participation.
STIP Policy Documentation
2. Program Documentation – This section contains the Fiscal Year 2007 – 2012 Maryland Consolidated Transportation Program, Maryland’s six-year capital program for transportation projects. The STIP references the CTP information from the years 2008-2012.
3. Metropolitan Planning Organization Transportation Improvement Programs (TIPs) - This section presents each of the six MPOs TIPs without change as required by SAFETEA-LU.
2.0 Overview of Transportation Planning Agencies
Maryland offers its citizens a range of modal choices, with MDOT retaining responsibility for capital investments as well as operating and planning activities that reach across all modes of transportation. The Transportation Secretary’s Office (TSO) establishes transportation policy and oversees five Modal Administrations: the Maryland Aviation Administration (MAA), the Maryland Port Administration (MPA), the Maryland Transit Administration (MTA), the Motor Vehicle Administration (MVA), and State Highway Administration (SHA). To ensure close coordination of State transportation policy, the Secretary of Transportation also serves as Chairman of the Maryland Transportation Authority, an independent State agency responsible for Maryland’s seven toll facilities and for financing new revenue producing projects.
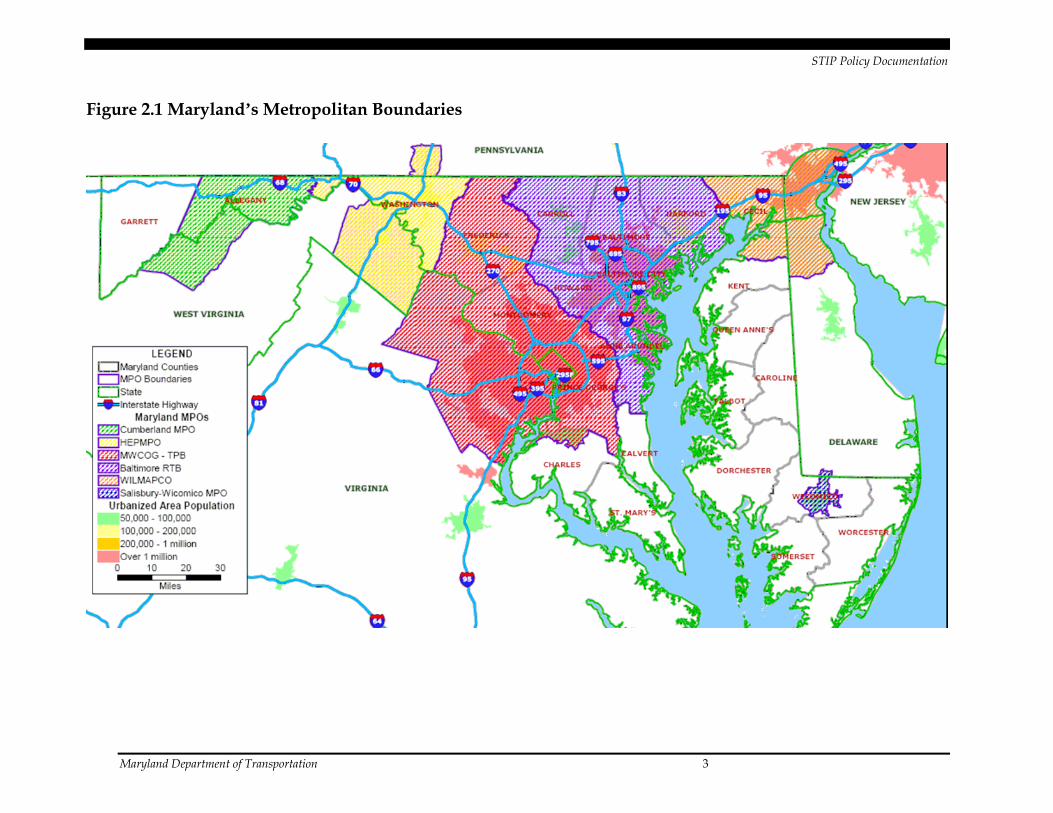
Federal highway and transit statutes require, as a condition for spending Federal highway or transit funds in urbanized areas, the designation of MPOs. MPOs are responsible for planning, programming, and coordinating Federal highway and transit investments. The MPO decision-makers include local elected officials, state DOTs, and Federal Highway Administration (FHWA)/Federal Transit Administration (FTA). Maryland’s metropolitan areas are divided into the following six MPOs, with some boundaries extending into neighboring states including Pennsylvania, Delaware, Virginia, and West Virginia:
• Baltimore Regional Transportation Board (BRTB);
• Cumberland MPO;
• Hagerstown-Eastern Panhandle MPO (HEPMPO);
• National Capital Region Transportation Planning Board (TPB);
• Salisbury/Wicomico Area MPO; and
• Wilmington Metropolitan Planning and Coordinating Council (WILMAPCO).
Figure 2.1 illustrates the jurisdictions of Maryland’s MPOs. BRTB is the only MPO with boundaries entirely within the State of Maryland.
Maryland Department of Transportation 2
STIP Policy Documentation
Maryland Department of Transportation 3
Figure 2.1 Maryland’s Metropolitan Boundaries
STIP Policy Documentation
Maryland Department of Transportation 4
3.0 Key Transportation Planning Documents
State Report on Transportation
Every year, as part of the Statewide multimodal transportation planning process, MDOT prepares and distributes the State Report on Transportation (SRT) to the Maryland General Assembly, local elected officials, and interested citizens. The SRT consists of three components: the Maryland Transportation Plan, the Consolidated Transportation Program, and the Annual Attainment Report on Transportation System Performance.
The 2004 Maryland Transportation Plan (MTP): A Blue Print for Maryland’s Transportation Future is MDOT’s current 20-year vision for transportation and helps to guide Statewide improvements across all means of transportation, including highways, roads, tunnels, bridges, rail, buses, water ports, airports, bike paths, and sidewalks. The MTP provides policy direction through Statewide multimodal goals and objectives. The MTP is the basis for developing strategic transportation plans, programs, policies, and projects across the State. MDOT updates the Statewide transportation plan every five years to address current and future transportation challenges, needs, and conditions. Currently, MDOT is updating its MTP and is conducting extensive public outreach to engage citizens, agencies, and interested organizations to help revise the Statewide transportation system’s long-range vision, goals, and objectives.
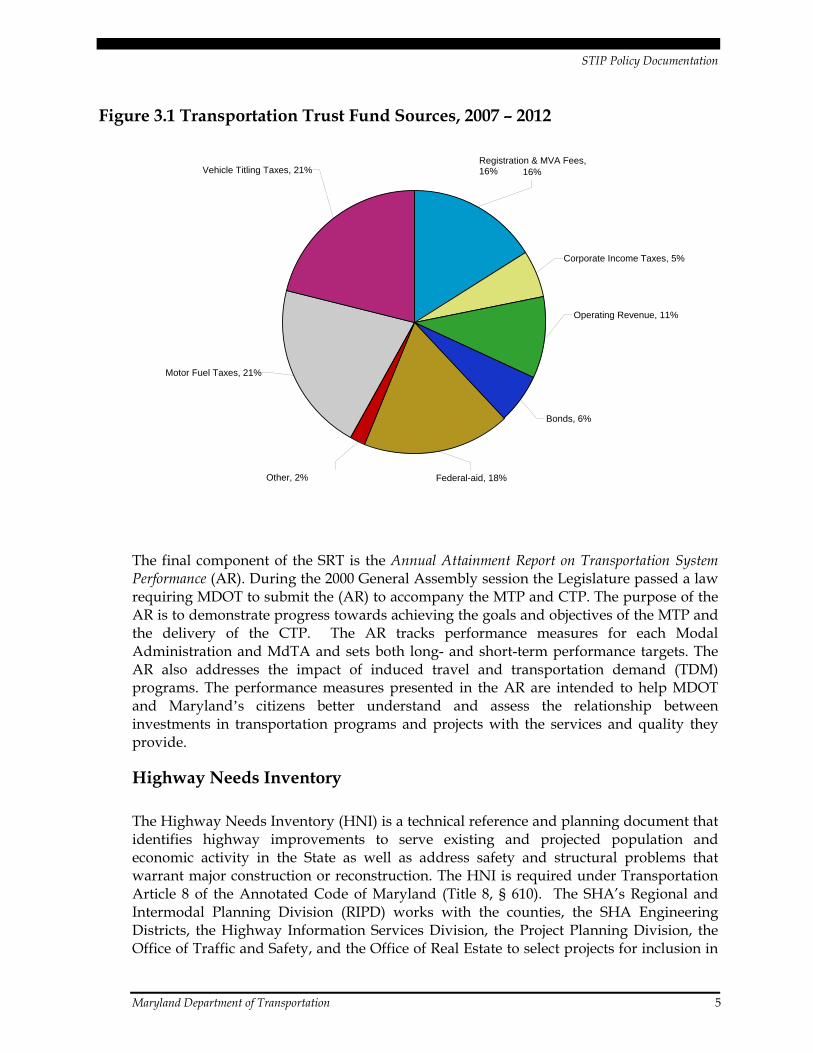
The MTP guides the development of the second component of the SRT, the Consolidated Transportation Program (CTP), Maryland’s six-year constrained capital program. The CTP contains all capital projects funded with the Maryland Transportation Trust Fund (TTF). Figure 3.1 illustrates the TTF funding sources (also found on page 7 of the CTP). Projects from all Modal Administrations and MdTA are listed in the CTP. For major projects, the CTP contains a detailed description and an illustrative Project Information Form (PIF). The primary difference between the CTP and the STIP is that the CTP also includes projects that are not Federally funded.
STIP Policy Documentation
Figure 3.1 Transportation Trust Fund Sources, 2007 – 2012
Motor Fuel Taxes, 21%
Vehicle Titling Taxes, 21%Registration & MVA Fees,16% 16%
Corporate Income Taxes, 5%
Operating Revenue, 11%
Bonds, 6%
Other, 2% Federal-aid, 18%
The final component of the SRT is the Annual Attainment Report on Transportation System Performance (AR). During the 2000 General Assembly session the Legislature passed a law requiring MDOT to submit the (AR) to accompany the MTP and CTP. The purpose of the AR is to demonstrate progress towards achieving the goals and objectives of the MTP and the delivery of the CTP. The AR tracks performance measures for each Modal Administration and MdTA and sets both long- and short-term performance targets. The AR also addresses the impact of induced travel and transportation demand (TDM) programs. The performance measures presented in the AR are intended to help MDOT and Maryland’s citizens better understand and assess the relationship between investments in transportation programs and projects with the services and quality they provide.
Highway Needs Inventory
The Highway Needs Inventory (HNI) is a technical reference and planning document that identifies highway improvements to serve existing and projected population and economic activity in the State as well as address safety and structural problems that warrant major construction or reconstruction. The HNI is required under Transportation Article 8 of the Annotated Code of Maryland (Title 8, § 610). The SHA’s Regional and Intermodal Planning Division (RIPD) works with the counties, the SHA Engineering Districts, the Highway Information Services Division, the Project Planning Division, the Office of Traffic and Safety, and the Office of Real Estate to select projects for inclusion in
Maryland Department of Transportation 5
STIP Policy Documentation
Maryland Department of Transportation 6
the HNI and develops project information for the HNI. The projects identified in the HNI represent only an acknowledgment of need based on technical analysis and adopted local and regional transportation plans. The HNI is not a construction program and the inclusion of a project does not represent a commitment to implementation. The HNI is not financially constrained nor is it based on revenue forecasts. The HNI serves as the source document for SHA’s portion of the CTP.
Metropolitan Planning Organization Transportation Plans
Maryland’s six MPOs are charged with developing a 20-year Long-Range Transportation Plan (LRTP) and a short-term (usually 2 to 6 years) program called the Transportation Improvement Program (TIP). LRTPs help MPOs review how their region is changing and growing in order to determine future transportation needs and act as a tool to channel transportation investments where they can be most effective to meet the region’s transportation needs. TIPs allow MPOs to review and approve all plans and programs of regional significance that involve Federal funds. TIPs generally reflect local needs, priorities, and available funding in coordination with local transit providers, land use, and other local government officials, citizens and other stakeholders. For example, the TIP must also show year of expenditure and what types of funding will be used and each project must be described in detail, including project cost. The Federal requirement is to update TIPs every four years; however, in Maryland MPOs update their TIPs annually to ensure that the cost and project information is as up-to-date as possible and fiscally constrained.
LRTPs and TIPs cannot lead to further degradation in the region’s air quality. To ensure that air quality standards are met and maintained, the Environmental Protection Agency (EPA) has outlined regulations that require MPOs and state DOTs to provide state air agencies, local air quality agencies, and transportation agencies the opportunity for consultation regarding the development of the state implementation plan (SIP), the TIP, and associated conformity determinations. 1 MDOT maintains proactive relationships between the agencies responsible for conformity ensuring a successful conformity process.
Each MPO has an approved, documented, and SAFETEA-LU required public involvement process that is used in support of developing their respective LRTPs and TIPs.
Statewide Transportation Improvement Program
In order to receive federal funds, Federal legislation mandates that states adopt a specific process for selecting projects for implementation known as the STIP. The Maryland Statewide Transportation Improvement Program is a five-year, fiscally constrained, and prioritized set of transportation projects that is compiled from local and regional plans. STIP projects are selected through an annual development process. The Maryland STIP is financially constrained by the revenues reasonably expected to be available through the STIP’s five-year funding period using year of expenditure dollars. In Maryland, all five
1 Hhttp://www.fhwa.dot.gov/environment/conformity/ref_guid/chap2.htmH
STIP Policy Documentation
years of the STIP list projects and appropriate project groupings with specific funds identified for each fiscal year. Projects (or phases of projects) are listed only if full funding is anticipated to be available for the project (or appropriate project phase) within the time period established for its completion. All projects and funding details in the STIP have been scrutinized and approved by the Maryland General Assembly and by the Governor through the State’s annual budget process. The STIP is comprised of three parts: the STIP Policy Documentation, the CTP, and the six TIPs. Maryland updates its STIP every year even though the Federal requirement is to update it every four years.
4.0 Maryland’s STIP Development
Process Overview
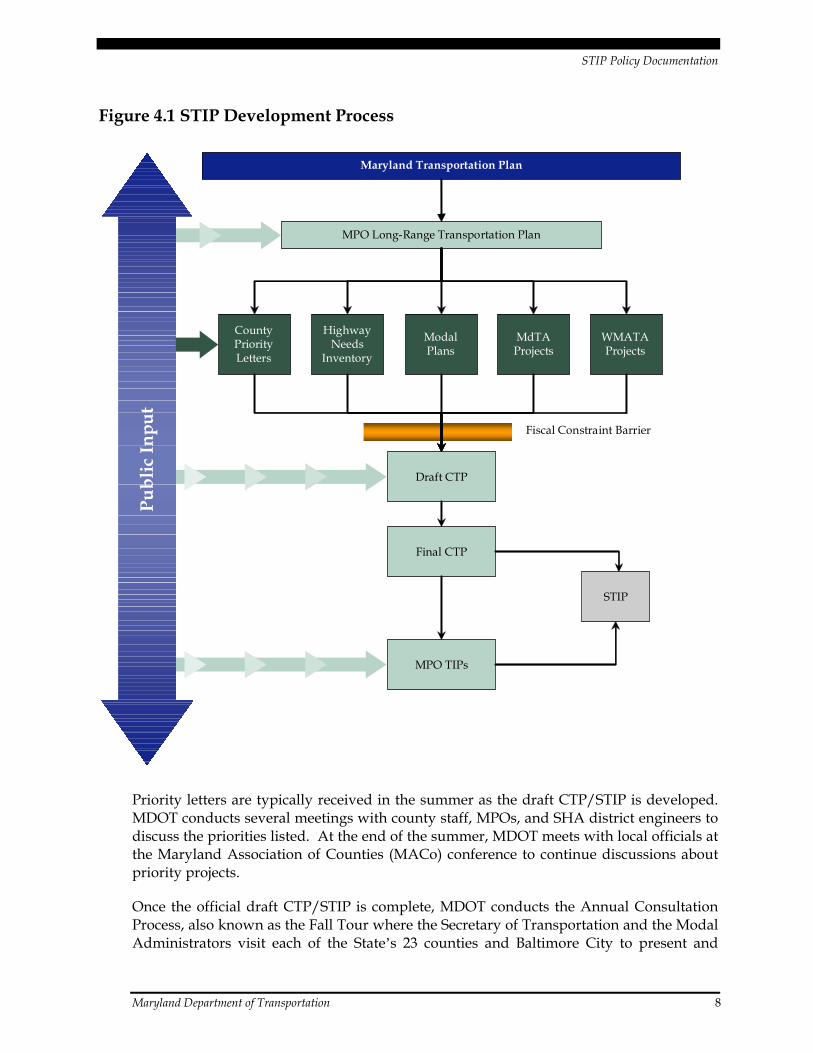
The STIP development process begins with the MTP and MPO LRTPs (see Figure 4.1). These long- range plans are the foundation for transportation planning in Maryland. The STIP components are identified through a cooperative process between MDOT, the Modal Administrations, SHA District Engineers, and county staff. MPOs conduct regular meetings to coordinate transportation planning efforts. Highway Needs Inventory and Priority Letters contain specific project lists. The Annotated Code of Maryland Title 8, section 612(c) states:
“the local governing body and a majority of the local legislative delegation shall establish a list of priorities from among those secondary system projects listed in the needs inventory and the Administration shall engage in initial project planning upon the request of the local governing body and a majority of the local legislative delegation in the order established in the list of priorities.”
In other words, the Priority Letter represents each county’s own internal ranking of projects deemed most important based on local need and local input. This is an effective way for counties to convey to MDOT the need for specific transportation projects and investments. Priority Letters involve requests for a wide variety of project funding – from transit improvements, highway reconstruction, and sidewalk construction to bridge improvements, bike path development, and highway safety projects. In some cases, counties reserve portions of their own funds in order to accelerate project implementation, conduct feasibility and planning studies, ensure that projects are kept on-track, and provide a funding match as required for certain types of projects. The modal share (highway, transit, etc.) of the projects listed in Priority Letters ranges from county to county. In more heavily populated and densely developed counties, there is a stronger focus on public transportation and improving access to public transportation from roadway networks. Counties with smaller populations and lower densities tend to focus on highway and arterial improvements, although most counties request some element of transit funding.
Maryland Department of Transportation 7
STIP Policy Documentation
Figure 4.1 STIP Development Process
County Priority Letters
Highway Needs
Inventory
ModalPlans
MdTAProjects
WMATAProjects
Maryland Transportation Plan
MPO Long-Range Transportation Plan
Draft CTP
Final CTP
MPO TIPs
STIP
Fiscal Constraint Barrier
Publ
ic In
put
Priority letters are typically received in the summer as the draft CTP/STIP is developed. MDOT conducts several meetings with county staff, MPOs, and SHA district engineers to discuss the priorities listed. At the end of the summer, MDOT meets with local officials at the Maryland Association of Counties (MACo) conference to continue discussions about priority projects.
Once the official draft CTP/STIP is complete, MDOT conducts the Annual Consultation Process, also known as the Fall Tour where the Secretary of Transportation and the Modal Administrators visit each of the State’s 23 counties and Baltimore City to present and
Maryland Department of Transportation 8
STIP Policy Documentation
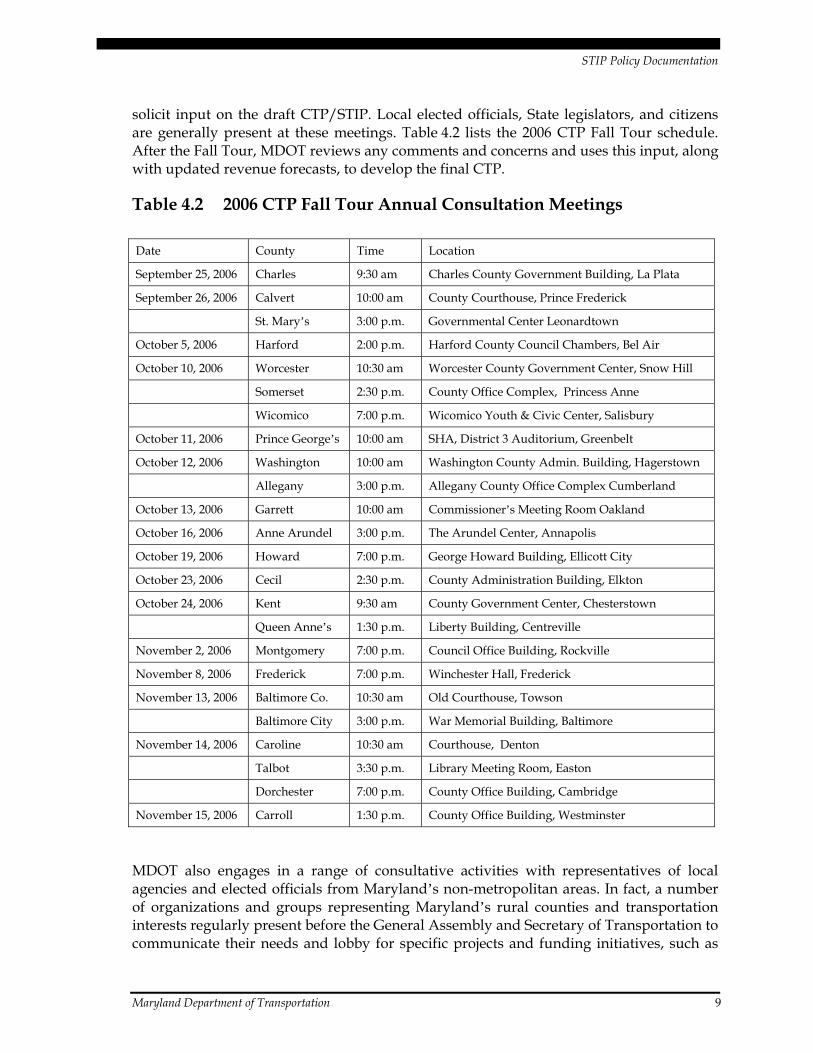
solicit input on the draft CTP/STIP. Local elected officials, State legislators, and citizens are generally present at these meetings. Table 4.2 lists the 2006 CTP Fall Tour schedule. After the Fall Tour, MDOT reviews any comments and concerns and uses this input, along with updated revenue forecasts, to develop the final CTP.
Table 4.2 2006 CTP Fall Tour Annual Consultation Meetings
Date County Time Location
September 25, 2006 Charles 9:30 am Charles County Government Building, La Plata
September 26, 2006 Calvert 10:00 am County Courthouse, Prince Frederick
St. Mary’s 3:00 p.m. Governmental Center Leonardtown
October 5, 2006 Harford 2:00 p.m. Harford County Council Chambers, Bel Air
October 10, 2006 Worcester 10:30 am Worcester County Government Center, Snow Hill
Somerset 2:30 p.m. County Office Complex, Princess Anne
Wicomico 7:00 p.m. Wicomico Youth & Civic Center, Salisbury
October 11, 2006 Prince George’s 10:00 am SHA, District 3 Auditorium, Greenbelt
October 12, 2006 Washington 10:00 am Washington County Admin. Building, Hagerstown
Allegany 3:00 p.m. Allegany County Office Complex Cumberland
October 13, 2006 Garrett 10:00 am Commissioner’s Meeting Room Oakland
October 16, 2006 Anne Arundel 3:00 p.m. The Arundel Center, Annapolis
October 19, 2006 Howard 7:00 p.m. George Howard Building, Ellicott City
October 23, 2006 Cecil 2:30 p.m. County Administration Building, Elkton
October 24, 2006 Kent 9:30 am County Government Center, Chesterstown
Queen Anne’s 1:30 p.m. Liberty Building, Centreville
November 2, 2006 Montgomery 7:00 p.m. Council Office Building, Rockville
November 8, 2006 Frederick 7:00 p.m. Winchester Hall, Frederick
November 13, 2006 Baltimore Co. 10:30 am Old Courthouse, Towson
Baltimore City 3:00 p.m. War Memorial Building, Baltimore
November 14, 2006 Caroline 10:30 am Courthouse, Denton
Talbot 3:30 p.m. Library Meeting Room, Easton
Dorchester 7:00 p.m. County Office Building, Cambridge
November 15, 2006 Carroll 1:30 p.m. County Office Building, Westminster
MDOT also engages in a range of consultative activities with representatives of local agencies and elected officials from Maryland’s non-metropolitan areas. In fact, a number of organizations and groups representing Maryland’s rural counties and transportation interests regularly present before the General Assembly and Secretary of Transportation to communicate their needs and lobby for specific projects and funding initiatives, such as
Maryland Department of Transportation 9
STIP Policy Documentation
the Transportation Association of Maryland (TAM) – a Statewide advocate of public, private, and non-profit transit agencies. Other activities include SHA District Offices, where continuous relationships with local agencies and officials help to identify highway, transit, and other transportation capital needs for inclusion in the STIP and CTP. MDOT also attends Maryland Municipal League meetings as another way to foster transportation planning coordination.
Once the final CTP has been developed, it is submitted to the General Assembly for its approval. The final CTP is also provided to the MPOs for use in creating their TIPs. Once the final CTP and each TIP has been approved, they are brought together unaltered into the current STIP. It should also be noted that the STIP also includes projects and plans of two independent agencies – MdTA and WMATA. Each of these authorities is eligible for Federal funding under Title 23 USC and Title 49 USC Chapter 53.
To further make the transportation planning process accessible to the public, MDOT makes the Maryland Transportation Plan, the CTP, and the STIP available online for the public’s information and use at http://www.mdot.state.md.us. All MPOs also post their TIP online with other appropriate reports, studies, surveys, press releases, and pamphlets.
MDOT Planning Factors and Coordination
In 23 CFR § 450.206 (a) federal guidelines require that each state carry out a continual, cooperative, and comprehensive statewide transportation planning process that provides for the consideration and implementation of projects, strategies, and services. Some examples of how MDOT has implemented these guidelines are detailed below.
System Preservation
Keeping Maryland’s transportation system safe and in good condition are top priorities of MDOT. For example, roads must be re-paved, safety improvements implemented, aging bridges rehabilitated, and buses and trains repaired and replaced. In the face of growing travel demand, increasing construction and equipment costs, limited resources, and ever-present needs for system expansion, MDOT must make the most efficient use of its existing system. To ensure the most productive use of the State’s transportation system, asset maintenance and preservation are prioritized to extend the useful life of existing facilities and equipment in a fiscally responsible manner. MDOT seeks to maximize the value and performance of current resources in order to capture all of the benefits from the existing system before making new investments. Currently, system preservation accounts for 47% of MDOT’s capital expenditures.
Safety and Security
Ensuring the safety and security of Maryland residents and others who travel through the State’s airports, seaports and on buses, highways and trains is vitally important. MDOT is committed to providing safe travel to all its customers and to protecting the safety of MDOT’s workforce and contractors. Safety considerations are integral to all MDOT design and operational activities. In addition, threats to the security of travelers and to
Maryland Department of Transportation 10
STIP Policy Documentation
Maryland Department of Transportation 11
transportation assets have received heightened attention and MDOT is committed to taking advantage of new technologies and cost effective counter-measures to reduce transportation system vulnerabilities. Each Modal Administration institutes both safety and security measures, with MDOT continuing to support these actions and strategies across the State transportation system.
The Maryland Strategic Highway Safety Plan (SHSP) is a statewide, coordinated, and comprehensive, traffic safety plan that provides the framework for reducing highway fatalities and serious injuries on all public streets and highways. It establishes overall goals and objectives as well as objectives and strategies within seven key emphasis areas. The SHSP is a working document designed to cover the years 2006 through 2010.
When the American Association of State Highway Transportation Officials (AASHTO) led the development of a strategic highway safety plan in 1997, Maryland was one of the few states in the country to rise to the challenge and develop their own multi-agency statewide plan in 2003. The passage of the Safe, Accountable, Flexible, and Efficient Transportation Act: A Legacy for Users (SAFETEA-LU) provides states with an opportunity to improve their strategic highway safety plans (SHSP) through a data-driven, comprehensive approach for all public roads with the buy-in and support of a wide variety of stakeholders.
The SHSP provides the framework for Maryland to apply the best solutions to solve its most critical highway safety problems. The continued active involvement of two committees (the Executive Committee and the Steering Committee), along with the unwavering focus on the measurable objectives set forth in the SHSP, ensures top-down support throughout the five-year life of the plan, promises effective implementation of the plan, and supplies guidance to reach the ultimate goal of saving lives. 2
Environmental Planning Factors
Even though not Federally required at the project level, MDOT has made an effort to document environmental mitigation activities and provide information regarding environmental impacts at the project level. For example:
• SHA actively tracks the amount of wetlands and streams that are restored during and following each project where applicable;
• each PIF in the CTP contains a section addressing the impact of the project in relation to Maryland’s Smart Growth guidelines; and
• the AR contains a discussion about MDOT’s environmental mitigation strategies and efforts.
Since 2000, MDOT has partnered with the Department of Natural Resources (DNR), the Maryland Department of the Environment (MDE), and the Maryland Department of Planning (MDP) in order to minimize the negative effects of transportation on restoration
2 Hhttp://www.marylandroads.com/safety/oots/strategichwyplan.aspH
STIP Policy Documentation
Maryland Department of Transportation 12
efforts of the Chesapeake Bay. The goals of the “Chesapeake 2000 – The renewed Bay Agreement” listed on the DNR website include:
• coordinating its transportation policies and programs to reduce the dependence on automobiles by incorporating travel alternatives such as telework, pedestrian, bicycle, and transit options, as appropriate, in the design of projects so as to increase the availability of alternative modes of travel as measured by increased use of those alternatives;
• considering the provisions of the Federal transportation statutes for opportunities to purchase easements to preserve resource lands adjacent to rights-of-way and special efforts for stormwater management on both new and rehabilitation projects; and
• establishing policies and incentives which encourage the use of clean vehicle and other transportation technologies that reduce emissions.
Coordinated Public Transit - Human Services Transportation Plan
SAFETEA-LU requires that projects funded through FTA’s Section 5310 (Elderly Individuals and Individuals with Disabilities), Section 5316 (Job Access and Reverse Commute – JARC), and Section 5317 (New Freedom) Programs “must be derived from a locally developed, coordinated public transit-human services transportation plan.” This provision is aimed at improving transportation services for persons with disabilities, older adults and individuals with lower incomes, and ensuring that communities are coordinating transportation resources provided through multiple Federal programs.
To respond to the new federal requirements, the Maryland Transit Administration (MTA) is leading the development of a statewide plan and six regional Coordinated Transportation Plans. “These planning efforts will not only cover Section 5310, JARC, and New Freedom Programs, but will also include the wide spectrum of services offered by Maryland’s locally operated transit systems and local human service providers. The Coordinated Transportation Plans will assess the transportation needs of older adults, people with disabilities and low income workers, develop strategies for addressing identified gaps and approving efficiencies of services, and prioritize specific strategies for implementation. In addition, these plans will identify potential organizations or structures to implement coordinated activities and potential new coordinated services.”3
5.0 Linking Maryland’s STIP to SAFETEA-LU
This section contains additional information about the development and content of Maryland’s STIP in order to demonstrate compliance with SAFETEA-LU. The following information is organized according to 23 CFR § 450.216 subsections (a) – (m).
3 Hhttp://www.kfhgroup.com/Background.htmH
STIP Policy Documentation
(a) Federal STIP Update Guidelines: MDOT updates its STIP on an annual basis as requested by the Governor. Given that SAFETEA-LU only requires an update every four years, MDOT’s annual update is well within this boundary.
(b) MPO Coordination and Air Quality Attainment: Each MPO creates a metropolitan TIP that reflects local needs, priorities, and available funding in coordination with local transit providers, local government officials, citizens, users, and other stakeholders. Each of these agencies has a documented and approved public involvement process that is used in support of developing their plans and TIPs. Once each TIP is approved by the MPO, it is inserted into the STIP without modification.
The Clean Air Act Amendments of 1990 stipulate that projects listed in a TIP cannot lead to any further degradation in a regions’ air quality, but instead should begin to improve the air quality and contribute to the attainment of a region’s emission budget. The Environmental Protection Agency (EPA) has developed three categories regarding the status air quality: Non-Attainment, Maintenance, and Early Action Compact. Definitions for each of these categories and the jurisdiction within Maryland that these fall under are listed below:
1. Non-Attainment: Represents a locality where air pollution levels exceed National Ambient Air Quality Standards.
a. Ozone – Frederick, Montgomery, Prince George’s, Charles, Calvert, Anne Arundel, Howard, Carroll, Baltimore, Harford, Cecil, Kent, and Queen Anne’s Counties as well as Baltimore City.
b. Particulate Matter (PM) 2.5 – Washington, Frederick, Montgomery, Prince George’s, Charles, Anne Arundel, Howard, Carroll, Baltimore, and Harford Counties as well as Baltimore City.
2. Maintenance: This is a locality where an approved air quality improvement plan has been implemented with the goal of re-designating it as an attainment area.
a. Carbon Monoxide – portions of Montgomery and Prince George’s Counties as well as portions of Baltimore City.
3. Early Action Compact (EAC): These localities will take immediate action to begin reducing air pollution one to two years earlier than required by the Clean Air Act.
a. Ozone – Washington County submitted its Early Action Compact (EAC) to the EPA on March 25, 2004 and the plan was approved for implementation on April 15, 2004. Washington County met all of the required EAC milestones and submitted an attainment demonstration (based on 2005, 2006 and 2007 air quality data) before the December 31, 2007 deadline. The attainment demonstration was accepted by the EPA. The EPA issued a final rule, published in the Federal Register on March 27, 2008, designating Washington County as attainment of the 8-hour ozone standard, effective April 15, 2008. The EAC plan
Maryland Department of Transportation 13
STIP Policy Documentation
was successfully implemented due to cooperation between Washington County, MDE and MDOT.
Air quality conformity tests and Federal conformity findings are conducted for the Baltimore and Washington metropolitan TIPs for both ozone and PM 2.5. Additionally, all MPO TIPs have been properly certified regarding air quality conformity in order to permit projects to be included in the STIP. This certification is included within each MPO TIP, in this report as Appendix A, and can also be found on the following websites:
National Capitol Region Transportation Planning Board (TPB):
http://www.mwcog.org/transportation/activities/quality/draft_conformity.asp
Baltimore Regional Transportation Board (BRTB):
http://www.baltometro.org/content/view/873/550
Cumberland MPO: http://gov.allconet.org/mpo
Hagerstown-Eastern Panhandle MPO (HEPMPO):
http://www.hepmpo.net/air_quality/index.html
Salisbury/Wicomico Area MPO: No Website
Wilmington Metropolitan Planning and Coordinating Council (WILMAPCO):
http://www.wilmapco.org/aq
Areas outside of an MPO are also required to properly certify air quality conformity before including projects in the STIP. In areas that are not represented by an MPO, the certification process is coordinated between the county, MDOT, and MDE. Currently only Queen Anne’s and Kent Counties reside outside of an MPO and are categorized as maintenance areas for eight-hour ozone. Both have been tested for conformity by MDOT and approval was given by FHWA on April 11, 2007.
(c) Non-Metropolitan Area Coordination: Development of the STIP is not complete until the needs and priorities of non-metropolitan areas are included. MDOT has developed the “Non-metropolitan Area Consultative Process” in order to comply with Federal transportation planning requirements. This policy provides a process for non- metropolitan areas and non-metropolitan elected officials to be involved in Statewide transportation planning that spans across all modes. Section 4.0 also described the annual CTP/STIP Fall Tour, a key component of Maryland’s outreach to non-metropolitan areas and other coordination efforts with non-metropolitan areas pursued by MDOT. Process details can be found on MDOT”s website, www.wmdot.state.md.us, under Planning, CTP, Rural Consultation Process. In 2006, the Maryland legislature reintroduced and passed legislation (Senate Bill 281) to establish a Commission to study Southern Maryland Transportation Needs. MDOT is currently supporting this study and coordinating with
Maryland Department of Transportation 14
STIP Policy Documentation
the Tri-County Council that represents the tri-county region of Charles, Calvert, and St. Mary’s Counties.
(d) Indian Tribal Government Coordination: There are no Indian Tribal governments in the State of Maryland.
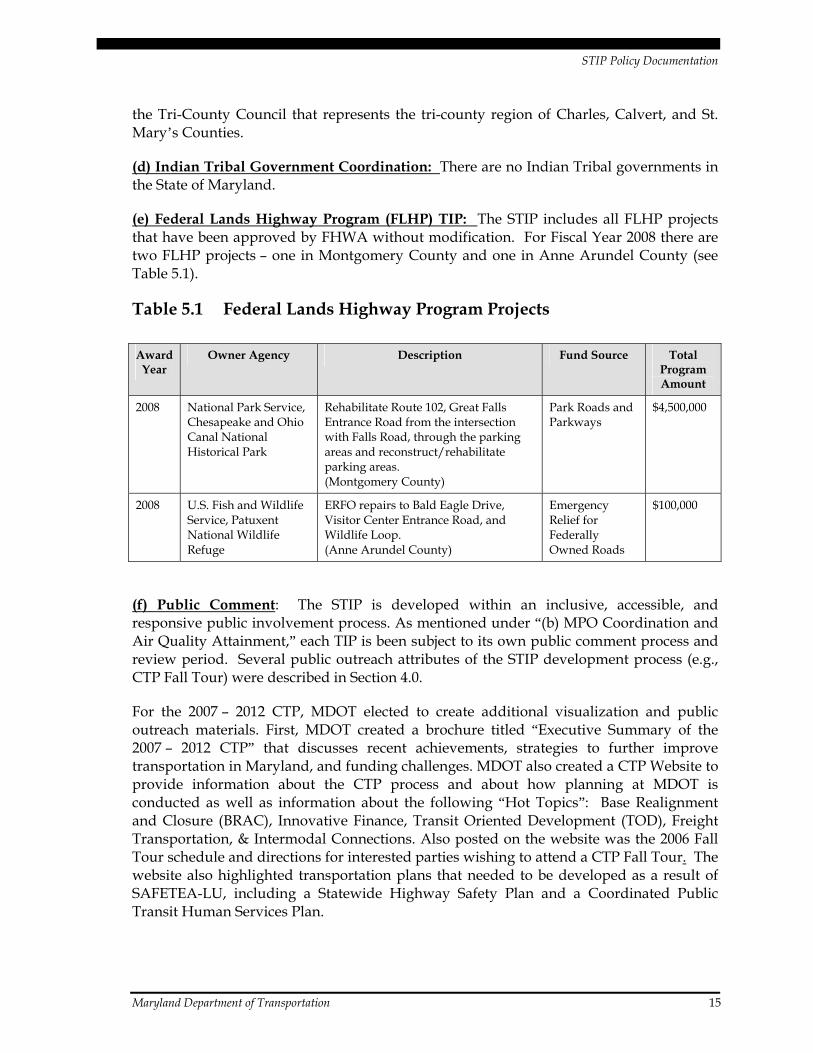
(e) Federal Lands Highway Program (FLHP) TIP: The STIP includes all FLHP projects that have been approved by FHWA without modification. For Fiscal Year 2008 there are two FLHP projects – one in Montgomery County and one in Anne Arundel County (see Table 5.1).
Table 5.1 Federal Lands Highway Program Projects
Award Year
Owner Agency Description Fund Source Total Program Amount
2008 National Park Service, Chesapeake and Ohio Canal National Historical Park
Rehabilitate Route 102, Great Falls Entrance Road from the intersection with Falls Road, through the parking areas and reconstruct/rehabilitate parking areas. (Montgomery County)
Park Roads and Parkways
$4,500,000
2008 U.S. Fish and Wildlife Service, Patuxent National Wildlife Refuge
ERFO repairs to Bald Eagle Drive, Visitor Center Entrance Road, and Wildlife Loop. (Anne Arundel County)
Emergency Relief for Federally Owned Roads
$100,000
(f) Public Comment: The STIP is developed within an inclusive, accessible, and responsive public involvement process. As mentioned under “(b) MPO Coordination and Air Quality Attainment,” each TIP is been subject to its own public comment process and review period. Several public outreach attributes of the STIP development process (e.g., CTP Fall Tour) were described in Section 4.0.
For the 2007 – 2012 CTP, MDOT elected to create additional visualization and public outreach materials. First, MDOT created a brochure titled “Executive Summary of the 2007 – 2012 CTP” that discusses recent achievements, strategies to further improve transportation in Maryland, and funding challenges. MDOT also created a CTP Website to provide information about the CTP process and about how planning at MDOT is conducted as well as information about the following “Hot Topics”: Base Realignment and Closure (BRAC), Innovative Finance, Transit Oriented Development (TOD), Freight Transportation, & Intermodal Connections. Also posted on the website was the 2006 Fall Tour schedule and directions for interested parties wishing to attend a CTP Fall Tour. The website also highlighted transportation plans that needed to be developed as a result of SAFETEA-LU, including a Statewide Highway Safety Plan and a Coordinated Public Transit Human Services Plan.
Maryland Department of Transportation 15
STIP Policy Documentation
Maryland Department of Transportation 16
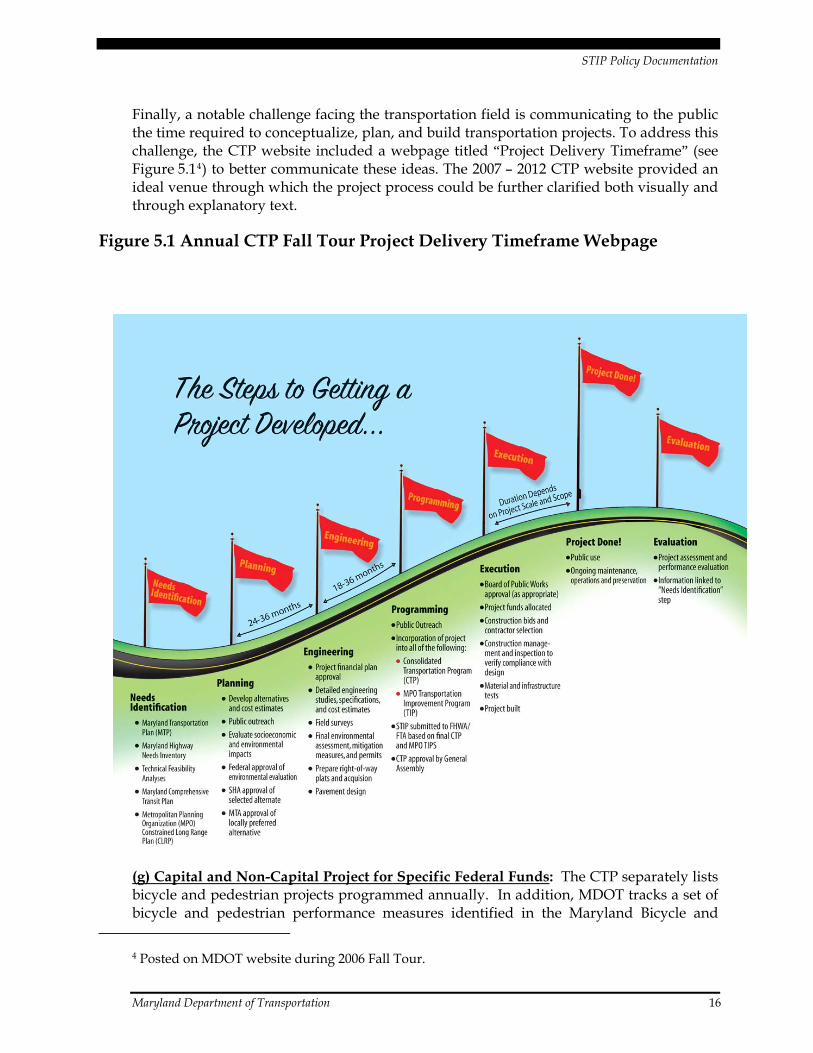
Finally, a notable challenge facing the transportation field is communicating to the public the time required to conceptualize, plan, and build transportation projects. To address this challenge, the CTP website included a webpage titled “Project Delivery Timeframe” (see Figure 5.14) to better communicate these ideas. The 2007 – 2012 CTP website provided an ideal venue through which the project process could be further clarified both visually and through explanatory text.
Figure 5.1 Annual CTP Fall Tour Project Delivery Timeframe Webpage
(g) Capital and Non-Capital Project for Specific Federal Funds: The CTP separately lists bicycle and pedestrian projects programmed annually. In addition, MDOT tracks a set of bicycle and pedestrian performance measures identified in the Maryland Bicycle and
4 Posted on MDOT website during 2006 Fall Tour.
STIP Policy Documentation
Maryland Department of Transportation 17
Pedestrian Master Plan and will continue to document progress in the AR. Appendix B contains an annual list of projects for which funds have been obligated in the previous year.
(h) Regionally Significant Projects: The 2008 – 2012 STIP includes projects of regional
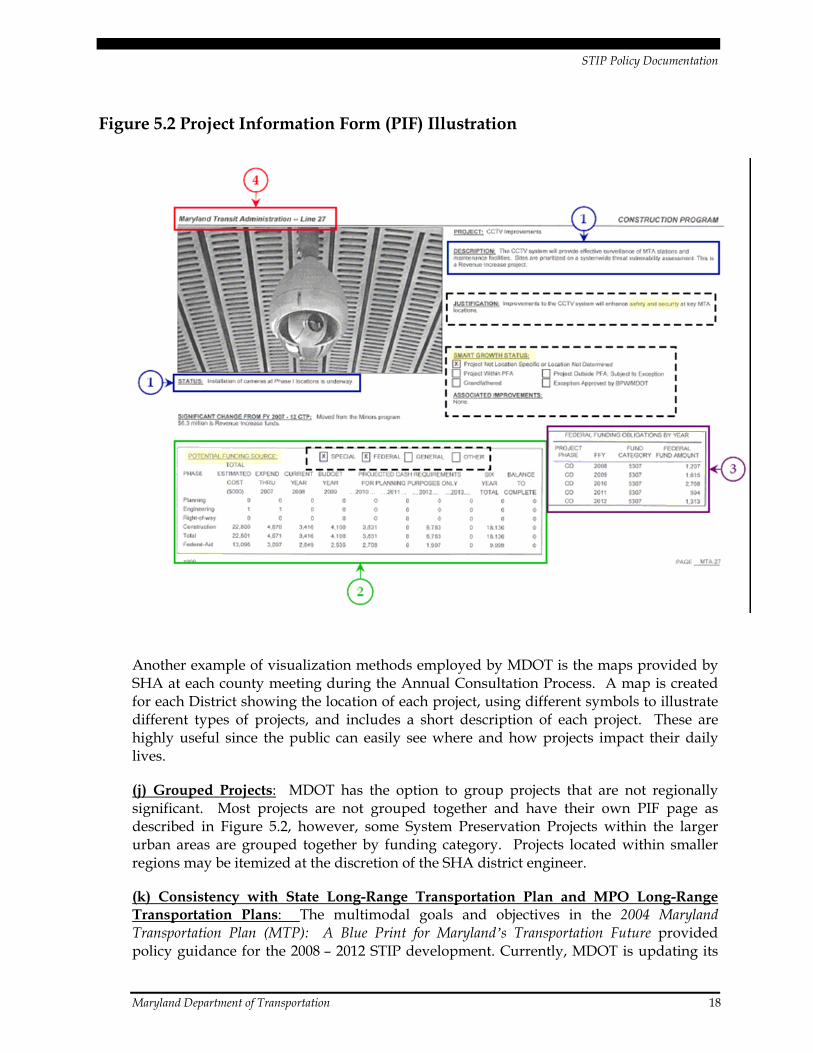
(i) Project / Phase Summary Reports
significance. For example, the CTP includes a section on transportation improvements related to the U.S. Department of Defense’s BRAC process.
: For each project to be included in the STIP, MDOT
1) Description of the work, project length, and phase (if applicable);
extend beyond the
ars obligated over the years needed to implement the project;
e of the agency or agencies responsible for project or phase implementation.
ation
Of particular importance to federal regulators are the major phases in which federal funds
• Planning – once a proposal is funded for project planning, detailed studies and
nding is approved at different points during the project to
the designed
creates a summary Project Information Form (PIF), which is a summary of information for each project (see illustration below):
2) Estimated total project cost or cost range (some projects maytimeframe of the STIP);
3) Amount of Federal dolland
4) Nam
Other important data may be included on the PIF, such as a map illustrating the locand size of a project, an image illustrating the type of project, project justification, other non-Federal funding sources, and Smart Growth Status (see Figure 5.2).
are spent. The four phases included in the PIF are:
analyses are conducted to evaluate the need for the project and to establish the scope and location of proposed transportation facilities and obtain environmental approvals.
• Engineering – these projects undergo additional environmental studies, preliminary, and final design. These projects, having been more thoroughly evaluated than those in Planning, are candidates for future addition to the Construction Program and are more likely to be built.
• Right-of-Way – this fuprovide the necessary land for the project corridors for future projects.
• Construction – this last stage includes the costs of actually buildingfacility. Construction does not begin until a project receives the necessary environmental permits, the State of Maryland meets air quality requirements, and contracts are bid. Once a project is fully funded for construction, it is moved from the Development and Evaluation section of the CTP to the Construction section of the CTP.
STIP Policy Documentation
Figure 5.2 Project Information Form (PIF) Illustration
Another example of visualization methods employed by MDOT is the maps provided by SHA at each county meeting during the Annual Consultation Process. A map is created for each District showing the location of each project, using different symbols to illustrate different types of projects, and includes a short description of each project. These are highly useful since the public can easily see where and how projects impact their daily lives.
(j) Grouped Projects: MDOT has the option to group projects that are not regionally significant. Most projects are not grouped together and have their own PIF page as described in Figure 5.2, however, some System Preservation Projects within the larger urban areas are grouped together by funding category. Projects located within smaller regions may be itemized at the discretion of the SHA district engineer.
(k) Consistency with State Long-Range Transportation Plan and MPO Long-Range Transportation Plans: The multimodal goals and objectives in the 2004 Maryland Transportation Plan (MTP): A Blue Print for Maryland’s Transportation Future provided policy guidance for the 2008 – 2012 STIP development. Currently, MDOT is updating its
Maryland Department of Transportation 18
STIP Policy Documentation
MTP and is conducting extensive public outreach to engage citizens, agencies, and interested organizations to help revise the Statewide transportation system’s long-range vision, goals, and objectives. The MTP in turn provides overall policy direction for Maryland’s six MPO LRTPs which in turn provide overall policy direction for development of the TIPs. MDOT has been working with MPOs to update their LRTPs to ensure their conformity with SAFETEA-LU.
(l) Financial Plan: In addition to project specific funding information, MDOT includes two financial sections in its CTP. The first section titled “Where the Money Comes From” (page 7 of the CTP) details the various inputs to the Transportation Trust Fund (TTF), which is Maryland’s dedicated transportation revenue source. As Figure 3.1 illustrates, the TTF is supported by Federal aid, operating revenues, user fees, vehicle titling taxes, registration fees, motor fuel taxes, and bond proceeds. This source of funding is available to pay for operating, maintenance, and capital costs (including system preservation) associated with highways, transit, aviation, motor vehicle administration, and the Port of Baltimore.
The CTP contains all capital projects funded with the Maryland Transportation Trust Fund (TTF). The TTF assures there are no administrative barriers to combining or flexing State or Federal transportation funds to pay for the needs of a given project, within the constraints of statutory authority. Additionally, because transportation needs are not paid for using the State’s general fund, transportation does not have to compete with other State programs and expenditures for funding.
The total projected Trust Fund revenues amount to $18.1 billion for the six-year period covered by the FY 2008 – 2012 STIP/CTP. The TTF supports operation and maintenance of State transportation systems, MDOT administration, debt service, and capital projects. In addition, 30 percent of the Highway User Revenues credited to the TTF are shared with Maryland’s counties and Baltimore City to support their transportation needs.
The Department maintains a six-year Financial Plan that is updated semi-annually. This plan forecasts revenues and expenditures using the latest economic estimates from two national forecasting companies. The revenue projections used in the latest update of the Trust Fund forecast are, in the short-term, based on a continuation of moderate growth in the national economy; and, in the long-term, expected to follow a normal cyclical pattern around an overall upward trend. User revenues are payments made by our customers for transportation infrastructure and services; and as such, their long-term growth follows the trend in state population.
MdTA is independently funded through tolls, concessions, investment income, revenue bonds, and miscellaneous sources, thus its funding sources are separate from both the TTF and the State’s General Fund.
The CTP’s second section titled “Where the Money Goes” (page 7 of the CTP) describes how the TTF supports the operation, maintenance, and preservation of State transportation systems as well as MDOT administration, debt service, and capital projects. As a dedicated funding source, the TTF provides maximum flexibility in financing transportation throughout the State to foster intermodal solutions. Additionally, because
Maryland Department of Transportation 19
STIP Policy Documentation
transportation needs are not paid for using the State’s General Fund, transportation need not compete with other State programs and expenditures for funding.
The revenue and cost estimates for the CTP/STIP use an inflation rate to reflect “year of expenditure dollars” based on reasonable financial principles and information developed cooperatively by the State, MPOs, and public transportation operators. The CTP describes the economic trends and assumptions that were used to estimate MDOT’s revenue and operating cost projections. The CTP also describes the assumptions used to estimate Federal-aid for highways, transit, WMATA and aviation (see CTP pages 10 – 12).
(m) Fiscal Constraint: Fiscal constraint is a requirement that dates back to the Intermodal Surface Transportation Efficiency Act of 1991. The purpose of fiscal constraint is to ensure that states have adequate funding available to implement projects identified in the STIP while also providing for the operation and maintenance of the existing transportation system. The 2008 – 2012 STIP is financially constrained by revenues that are reasonably expected to be available through the five-year funding period of the STIP or project completion using year of expenditure dollars. The revenue and expenditure projections use the latest available economic estimates from two national forecasting companies.
Several specific requirements apply to the federal definition of fiscal constraint. They include:
• A STIP must be financially constrained by year and funding category.
• The STIP must clearly identify projects to be funded using current revenues and which projects are to be funded using proposed revenue sources.
• Proposed funding sources and strategies ensuring their availability shall be identified.
• Operation and maintenance funding must be programmed into the STIP.
• The State must have a process for estimating expected revenue from all funding sources over the time period of the STIP and furnish this information to MPOs for the development of their TIPs.
The 2008 – 2012 STIP demonstrates fiscal constraint in the following ways. The CTP specifies funding sources (Federal, special, general, other) to be used for projects broken down by year and project phase (planning, engineering, right-of-way, and construction). Projects (or phases of projects) are listed only if full funding is anticipated to be available for the project (or appropriate project phase) within the time period established for its completion. All project and funding details in the STIP has been scrutinized and approved by the Maryland General Assembly and Governor through the annual budget process.
SHA uses Advance Construction (AC) procedures to manage its capital program. In general, all projects are placed in AC when advertised for construction. Conversion to regular federal funding occurs consistent with the cash flow required during each fiscal year. The cash flows used are the same as those carried in the Department’s six-year CTP. Federally funded projects are added to the program only when there is sufficient obligation authority (OA) remaining after providing for projects already underway. For
Maryland Department of Transportation 20
STIP Policy Documentation
planning purposes, the OA is calculated at a rate of 87% of authorized appropriations. A detailed analysis of the use of OA is prepared for the draft and final CTP each year.
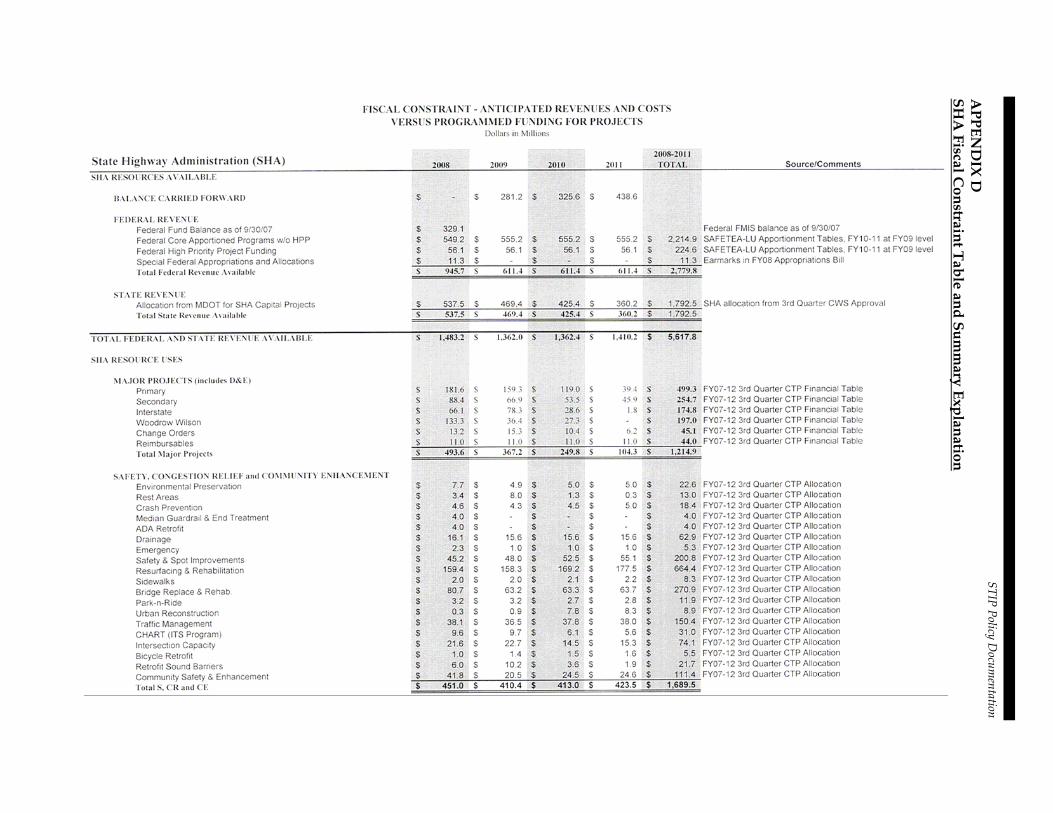
The STIP also includes fiscal constraint summary tables and explanation worksheets for SHA and for Statewide projects (see Appendix D and Appendix E) and for the Locally Operated Transit Systems (LOTS) Program (see Appendix G).
At the Federal Transit Administration’s request, we have developed a spreadsheet which identifies all transit projects that are not found in a Metropolitan TIP. This can be found in Appendix G.
Lastly, the STIP Appendices include a complete reprint of the whole MTA section from the CTP. The Major Projects, Line Items 1-42, are included in Appendix J. The Locally Operated Transit Systems Minor Projects information, Line Item 49, is included in Appendix K.
Maryland Department of Transportation 21
STIP Policy Documentation
Maryland Department of Transportation 22
Appendix A
Statement of Self-Certification
Appendix B
SHA List of Projects for which Federal funds have been obligated the previous year
Appendix C
MTA List of Projects for which Federal funds have been obligated the previous year
Appendix D
SHA Financial Constraint Summary Table and Explanation Worksheet
Appendix E
Statewide Financial Constraint Summary Table and Explanation Worksheet
Appendix F
MTA - 2007 CTP Projects Not Reflected Within 2008 TIPs
Appendix G
Federal Funding Sources
Appendix H
Glossary
STIP Policy Documentation
Appendix I
MTA Major Projects. Please disregard the MTA section of the CTP, Line Items 1 through 42, and replace with this section. For your information: Line Items 43 through 48 in the CTP are correct and are not replaced with an Appendix.
Appendix J
MTA Locally Operated Transit Systems, Line 49. Please disregard the MTA section of the CTP, and replace with this Appendix. For your information: Line Items 43 through 48 in the CTP are correct and are not replaced with an Appendix.
Maryland Department of Transportation 23
STIP Policy Docum
entation A
PPEND
IX D
SHA
Fiscal Constraint Table and Sum
mary Explanation
STIP Policy Docum
entation A
PPEND
IX D
SHA
Fiscal Constraint Table and Sum
mary Explanation
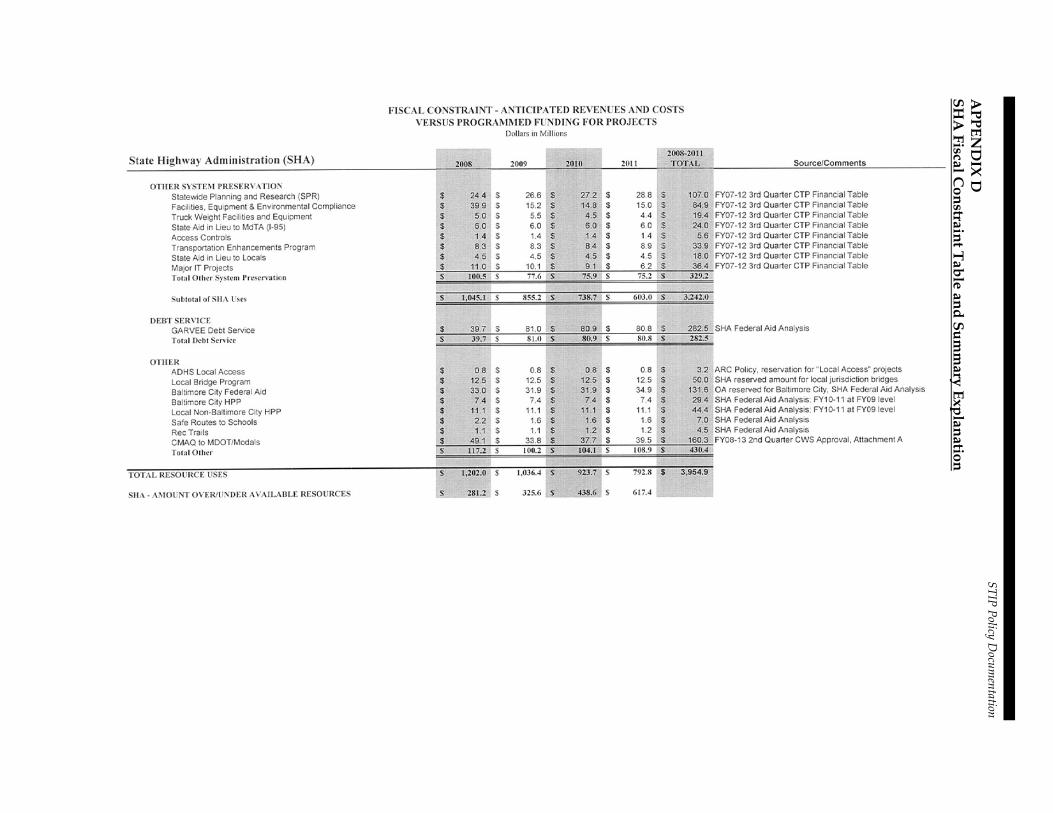
STIP Policy Documentation APPENDIX D SHA Fiscal Constraint Table and Summary Explanation
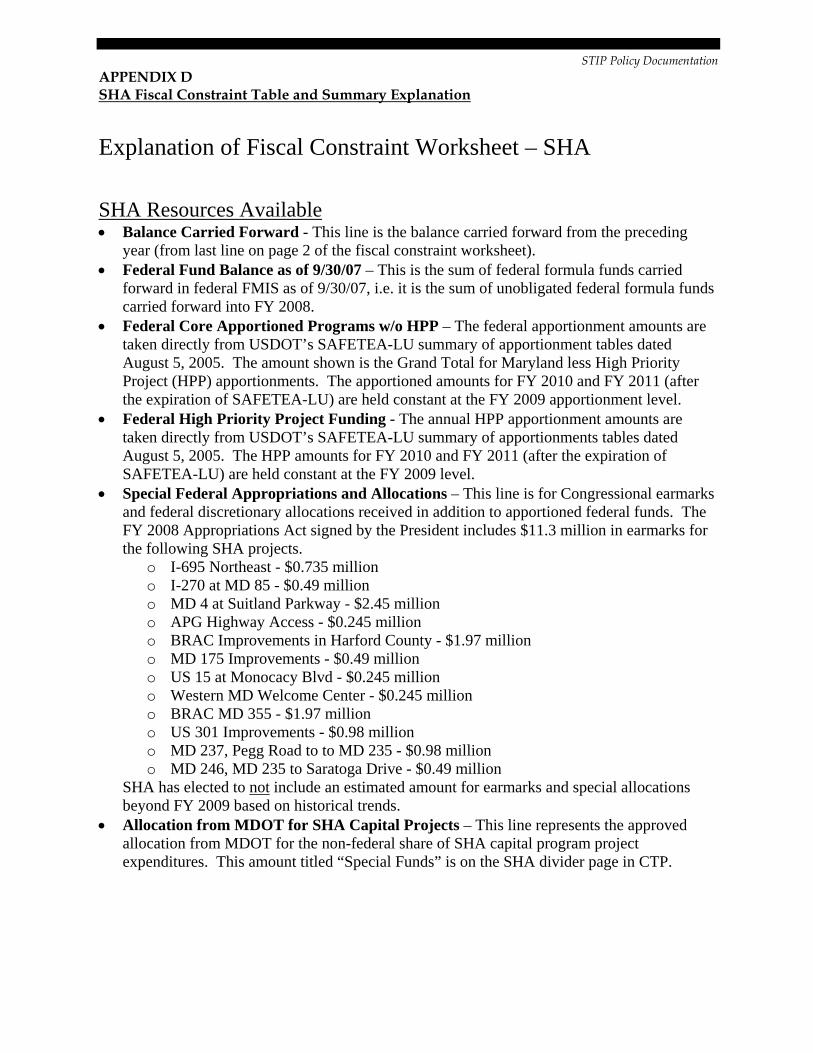
Explanation of Fiscal Constraint Worksheet – SHA SHA Resources Available • Balance Carried Forward - This line is the balance carried forward from the preceding
year (from last line on page 2 of the fiscal constraint worksheet). • Federal Fund Balance as of 9/30/07 – This is the sum of federal formula funds carried
forward in federal FMIS as of 9/30/07, i.e. it is the sum of unobligated federal formula funds carried forward into FY 2008.
• Federal Core Apportioned Programs w/o HPP – The federal apportionment amounts are taken directly from USDOT’s SAFETEA-LU summary of apportionment tables dated August 5, 2005. The amount shown is the Grand Total for Maryland less High Priority Project (HPP) apportionments. The apportioned amounts for FY 2010 and FY 2011 (after the expiration of SAFETEA-LU) are held constant at the FY 2009 apportionment level.
• Federal High Priority Project Funding - The annual HPP apportionment amounts are taken directly from USDOT’s SAFETEA-LU summary of apportionments tables dated August 5, 2005. The HPP amounts for FY 2010 and FY 2011 (after the expiration of SAFETEA-LU) are held constant at the FY 2009 level.
• Special Federal Appropriations and Allocations – This line is for Congressional earmarks and federal discretionary allocations received in addition to apportioned federal funds. The FY 2008 Appropriations Act signed by the President includes $11.3 million in earmarks for the following SHA projects.
o I-695 Northeast - $0.735 million o I-270 at MD 85 - $0.49 million o MD 4 at Suitland Parkway - $2.45 million o APG Highway Access - $0.245 million o BRAC Improvements in Harford County - $1.97 million o MD 175 Improvements - $0.49 million o US 15 at Monocacy Blvd - $0.245 million o Western MD Welcome Center - $0.245 million o BRAC MD 355 - $1.97 million o US 301 Improvements - $0.98 million o MD 237, Pegg Road to to MD 235 - $0.98 million o MD 246, MD 235 to Saratoga Drive - $0.49 million
SHA has elected to not include an estimated amount for earmarks and special allocations beyond FY 2009 based on historical trends.
• Allocation from MDOT for SHA Capital Projects – This line represents the approved allocation from MDOT for the non-federal share of SHA capital program project expenditures. This amount titled “Special Funds” is on the SHA divider page in CTP.
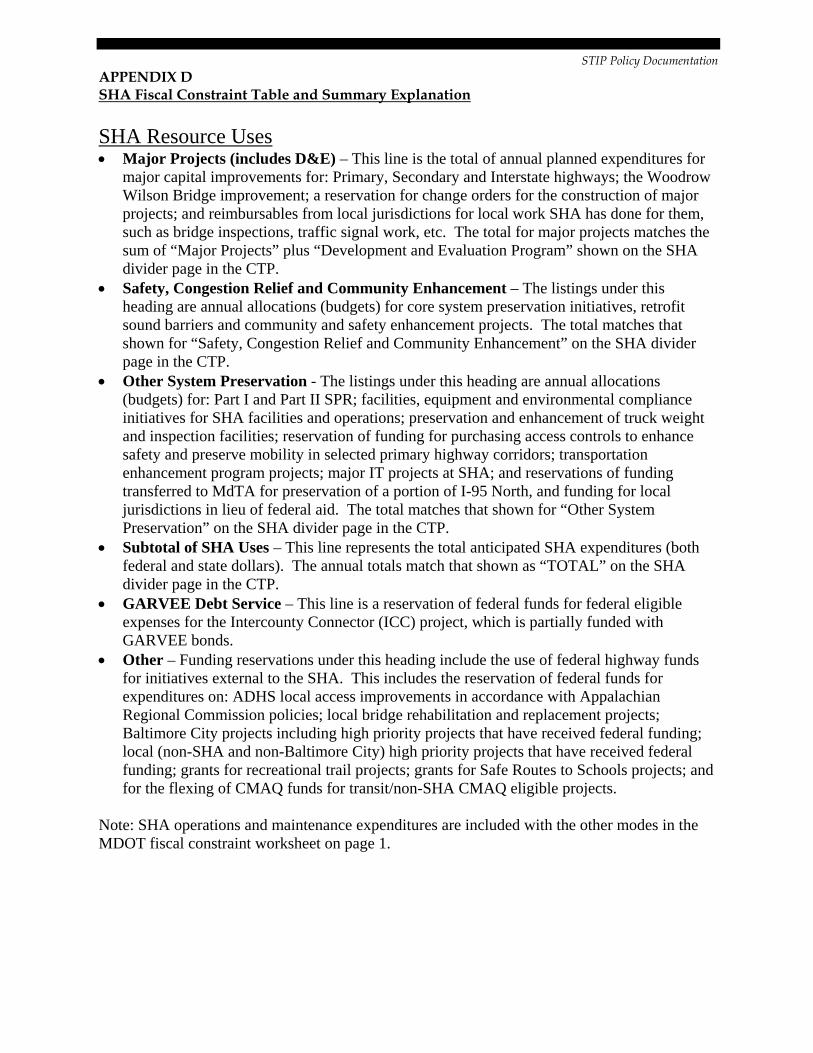
STIP Policy Documentation APPENDIX D SHA Fiscal Constraint Table and Summary Explanation SHA Resource Uses • Major Projects (includes D&E) – This line is the total of annual planned expenditures for
major capital improvements for: Primary, Secondary and Interstate highways; the Woodrow Wilson Bridge improvement; a reservation for change orders for the construction of major projects; and reimbursables from local jurisdictions for local work SHA has done for them, such as bridge inspections, traffic signal work, etc. The total for major projects matches the sum of “Major Projects” plus “Development and Evaluation Program” shown on the SHA divider page in the CTP.
• Safety, Congestion Relief and Community Enhancement – The listings under this heading are annual allocations (budgets) for core system preservation initiatives, retrofit sound barriers and community and safety enhancement projects. The total matches that shown for “Safety, Congestion Relief and Community Enhancement” on the SHA divider page in the CTP.
• Other System Preservation - The listings under this heading are annual allocations (budgets) for: Part I and Part II SPR; facilities, equipment and environmental compliance initiatives for SHA facilities and operations; preservation and enhancement of truck weight and inspection facilities; reservation of funding for purchasing access controls to enhance safety and preserve mobility in selected primary highway corridors; transportation enhancement program projects; major IT projects at SHA; and reservations of funding transferred to MdTA for preservation of a portion of I-95 North, and funding for local jurisdictions in lieu of federal aid. The total matches that shown for “Other System Preservation” on the SHA divider page in the CTP.
• Subtotal of SHA Uses – This line represents the total anticipated SHA expenditures (both federal and state dollars). The annual totals match that shown as “TOTAL” on the SHA divider page in the CTP.
• GARVEE Debt Service – This line is a reservation of federal funds for federal eligible expenses for the Intercounty Connector (ICC) project, which is partially funded with GARVEE bonds.
• Other – Funding reservations under this heading include the use of federal highway funds for initiatives external to the SHA. This includes the reservation of federal funds for expenditures on: ADHS local access improvements in accordance with Appalachian Regional Commission policies; local bridge rehabilitation and replacement projects; Baltimore City projects including high priority projects that have received federal funding; local (non-SHA and non-Baltimore City) high priority projects that have received federal funding; grants for recreational trail projects; grants for Safe Routes to Schools projects; and for the flexing of CMAQ funds for transit/non-SHA CMAQ eligible projects.
Note: SHA operations and maintenance expenditures are included with the other modes in the MDOT fiscal constraint worksheet on page 1.
STIP Policy Documentation
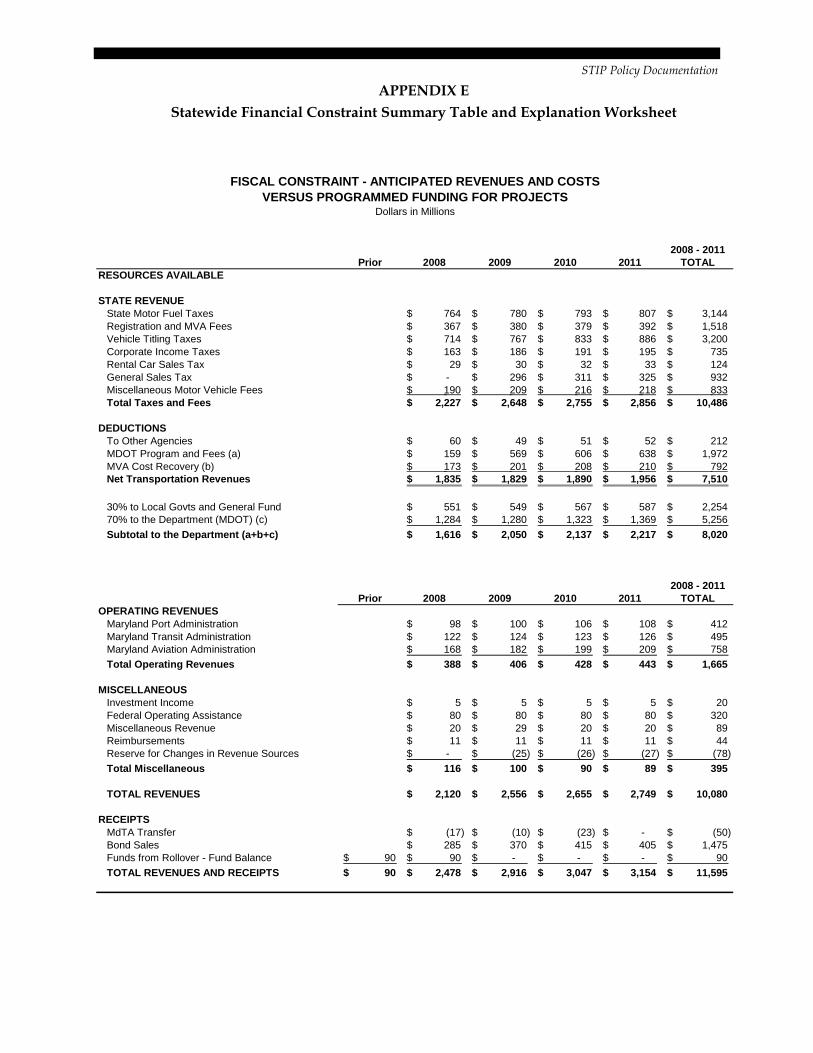
APPENDIX E Statewide Financial Constraint Summary Table and Explanation Worksheet
2008 - 2011Prior 2008 2009 2010 2011 TOTAL
RESOURCES AVAILABLE
STATE REVENUEState Motor Fuel Taxes 764$ 780$ 793$ 807$ 3,144$ Registration and MVA Fees 367$ 380$ 379$ 392$ 1,518$ Vehicle Titling Taxes 714$ 767$ 833$ 886$ 3,200$ Corporate Income Taxes 163$ 186$ 191$ 195$ 735$ Rental Car Sales Tax 29$ 30$ 32$ 33$ 124$ General Sales Tax -$ 296$ 311$ 325$ 932$ Miscellaneous Motor Vehicle Fees 190$ 209$ 216$ 218$ 833$ Total Taxes and Fees 2,227$ 2,648$ 2,755$ 2,856$ 10,486$
DEDUCTIONSTo Other Agencies 60$ 49$ 51$ 52$ 212$ MDOT Program and Fees (a) 159$ 569$ 606$ 638$ 1,972$ MVA Cost Recovery (b) 173$ 201$ 208$ 210$ 792$ Net Transportation Revenues 1,835$ 1,829$ 1,890$ 1,956$ 7,510$
30% to Local Govts and General Fund 551$ 549$ 567$ 587$ 2,254$ 70% to the Department (MDOT) (c) 1,284$ 1,280$ 1,323$ 1,369$ 5,256$ Subtotal to the Department (a+b+c) 1,616$ 2,050$ 2,137$ 2,217$ 8,020$
2008 - 2011Prior 2008 2009 2010 2011 TOTAL
OPERATING REVENUESMaryland Port Administration 98$ 100$ 106$ 108$ 412$ Maryland Transit Administration 122$ 124$ 123$ 126$ 495$ Maryland Aviation Administration 168$ 182$ 199$ 209$ 758$ Total Operating Revenues 388$ 406$ 428$ 443$ 1,665$
MISCELLANEOUSInvestment Income 5$ 5$ 5$ 5$ 20$ Federal Operating Assistance 80$ 80$ 80$ 80$ 320$ Miscellaneous Revenue 20$ 29$ 20$ 20$ 89$ Reimbursements 11$ 11$ 11$ 11$ 44$ Reserve for Changes in Revenue Sources -$ (25)$ (26)$ (27)$ (78)$ Total Miscellaneous 116$ 100$ 90$ 89$ 395$
TOTAL REVENUES 2,120$ 2,556$ 2,655$ 2,749$ 10,080$
RECEIPTSMdTA Transfer (17)$ (10)$ (23)$ -$ (50)$ Bond Sales 285$ 370$ 415$ 405$ 1,475$ Funds from Rollover - Fund Balance 90$ 90$ -$ -$ -$ 90$ TOTAL REVENUES AND RECEIPTS 90$ 2,478$ 2,916$ 3,047$ 3,154$ 11,595$
Dollars in Millions
FISCAL CONSTRAINT - ANTICIPATED REVENUES AND COSTSVERSUS PROGRAMMED FUNDING FOR PROJECTS
STIP Policy Documentation
APPENDIX E Statewide Financial Constraint Summary Table and Explanation Worksheet
2008 - 2011Prior 2008 2009 2010 2011 TOTAL
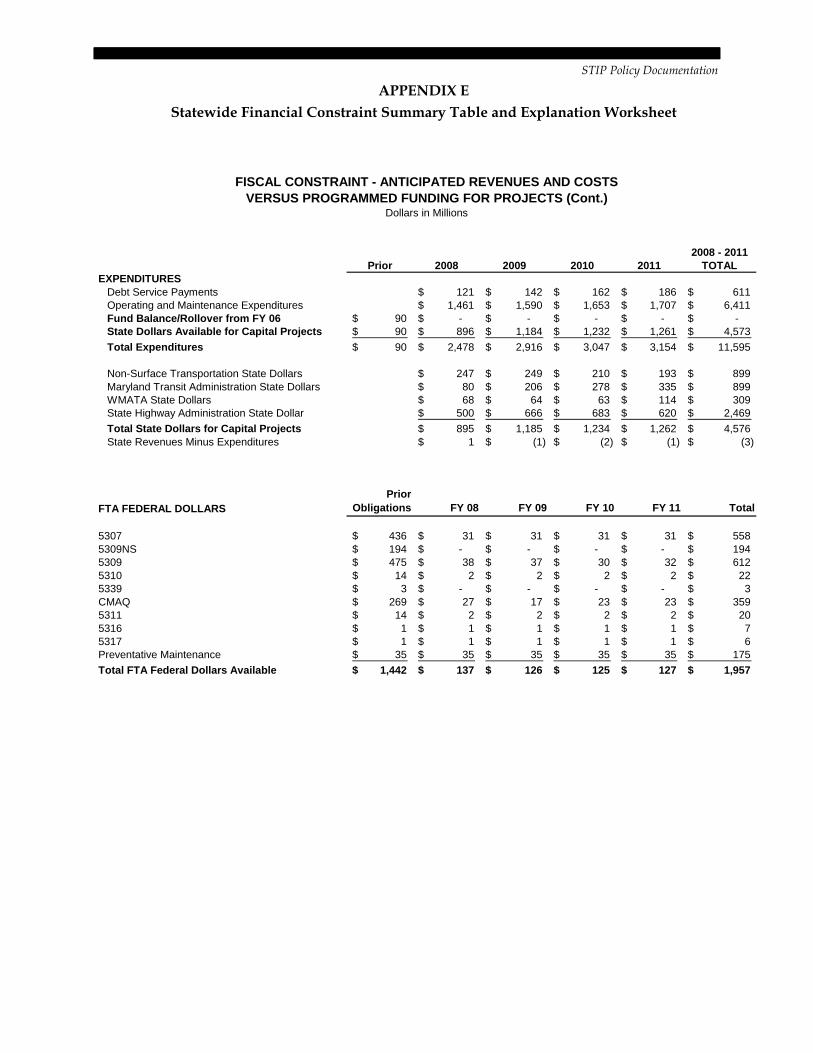
EXPENDITURESDebt Service Payments 121$ 142$ 162$ 186$ 611$ Operating and Maintenance Expenditures 1,461$ 1,590$ 1,653$ 1,707$ 6,411$ Fund Balance/Rollover from FY 06 90$ -$ -$ -$ -$ -$ State Dollars Available for Capital Projects 90$ 896$ 1,184$ 1,232$ 1,261$ 4,573$ Total Expenditures 90$ 2,478$ 2,916$ 3,047$ 3,154$ 11,595$
Non-Surface Transportation State Dollars 247$ 249$ 210$ 193$ 899$ Maryland Transit Administration State Dollars 80$ 206$ 278$ 335$ 899$ WMATA State Dollars 68$ 64$ 63$ 114$ 309$ State Highway Administration State Dollar 500$ 666$ 683$ 620$ 2,469$ Total State Dollars for Capital Projects 895$ 1,185$ 1,234$ 1,262$ 4,576$ State Revenues Minus Expenditures 1$ (1)$ (2)$ (1)$ (3)$
FTA FEDERAL DOLLARSPrior
Obligations FY 08 FY 09 FY 10 FY 11 Total
5307 436$ 31$ 31$ 31$ 31$ 558$ 5309NS 194$ -$ -$ -$ -$ 194$ 5309 475$ 38$ 37$ 30$ 32$ 612$ 5310 14$ 2$ 2$ 2$ 2$ 22$ 5339 3$ -$ -$ -$ -$ 3$ CMAQ 269$ 27$ 17$ 23$ 23$ 359$ 5311 14$ 2$ 2$ 2$ 2$ 20$ 5316 1$ 1$ 1$ 1$ 1$ 7$
FISCAL CONSTRAINT - ANTICIPATED REVENUES AND COSTSVERSUS PROGRAMMED FUNDING FOR PROJECTS (Cont.)
Dollars in Millions
5317 1$ 1$ 1$ 1$ 1$ 6$ Preventative Maintenance 35$ 35$ 35$ 35$ 35$ 175$ Total FTA Federal Dollars Available 1,442$ 137$ 126$ 125$ 127$ 1,957$
STIP Policy Documentation
APPENDIX E Statewide Financial Constraint Summary Table and Explanation Worksheet
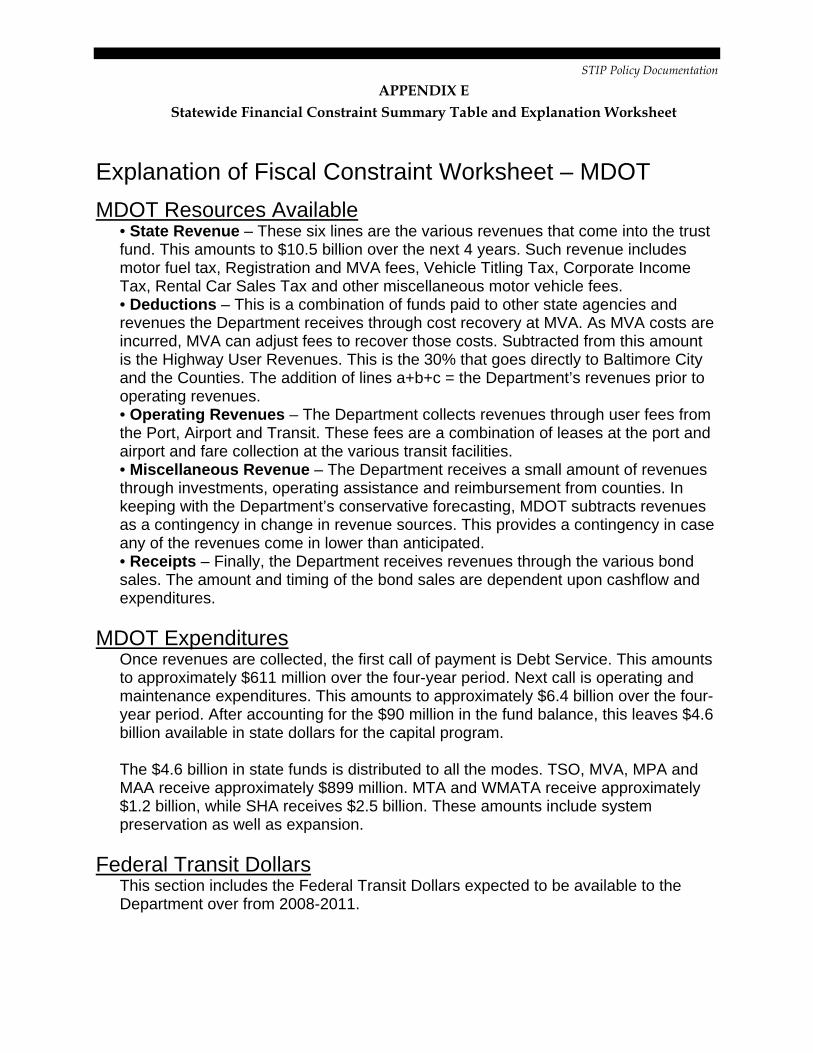
Explanation of Fiscal Constraint Worksheet – MDOT MDOT Resources Available • State Revenue – These six lines are the various revenues that come into the trust
fund. This amounts to $10.5 billion over the next 4 years. Such revenue includes motor fuel tax, Registration and MVA fees, Vehicle Titling Tax, Corporate Income Tax, Rental Car Sales Tax and other miscellaneous motor vehicle fees.
• Deductions – This is a combination of funds paid to other state agencies and revenues the Department receives through cost recovery at MVA. As MVA costs are incurred, MVA can adjust fees to recover those costs. Subtracted from this amount is the Highway User Revenues. This is the 30% that goes directly to Baltimore City and the Counties. The addition of lines a+b+c = the Department’s revenues prior to operating revenues.
• Operating Revenues – The Department collects revenues through user fees from the Port, Airport and Transit. These fees are a combination of leases at the port and airport and fare collection at the various transit facilities.
• Miscellaneous Revenue – The Department receives a small amount of revenues through investments, operating assistance and reimbursement from counties. In keeping with the Department’s conservative forecasting, MDOT subtracts revenues as a contingency in change in revenue sources. This provides a contingency in case any of the revenues come in lower than anticipated.
• Receipts – Finally, the Department receives revenues through the various bond sales. The amount and timing of the bond sales are dependent upon cashflow and expenditures.
MDOT Expenditures Once revenues are collected, the first call of payment is Debt Service. This amounts
to approximately $611 million over the four-year period. Next call is operating and maintenance expenditures. This amounts to approximately $6.4 billion over the four-year period. After accounting for the $90 million in the fund balance, this leaves $4.6 billion available in state dollars for the capital program.
The $4.6 billion in state funds is distributed to all the modes. TSO, MVA, MPA and MAA receive approximately $899 million. MTA and WMATA receive approximately $1.2 billion, while SHA receives $2.5 billion. These amounts include system preservation as well as expansion.
Federal Transit Dollars
This section includes the Federal Transit Dollars expected to be available to the Department over from 2008-2011.
STIP Policy Documentation
APPENDIX E Statewide Financial Constraint Summary Table and Explanation Worksheet
Federal Highway Dollars Funds available for State Highway through the Federal Highway Administration are shown on a separate Chart.
SHA Resource Uses • Major Projects (includes D&E) – This line is the total of annual planned
ate
luation Program shown on the SHA divider page in the CTP.
ment projects. The total
and operations; preservation r
corridors; transportation enhancement program projects; major IT cts at SHA; and reservations of funding transferred to MdTA for preservation of
d funding for local jurisdictions in lieu of federal aid. The
de the use of federal
hat (non-SHA and non-Baltimore City) high priority
ederal funding; grants for recreational trail projects;
Note: SHA operations and maintenance expenditures are included with the other modes in the MDOT fiscal constraint worksheet on page 1
expenditures for major capital improvements for: Primary, Secondary and Intersthighways; the Woodrow Wilson Bridge improvement; a reservation for change orders for the construction of major projects; and reimbursables from local jurisdictions for local work SHA has done for them, such as bridge inspections, trafficsignal work, etc. The total for major projects matches the sum of Major Projects plusDevelopment and Eva
• Safety, Congestion Relief and Community Enhancement – The listings under this heading are annual allocations (budgets) for core system preservation initiatives,retrofit sound barriers and community and safety enhancematches that shown for Safety, Congestion Relief and Community Enhancement on the SHA divider page in the CTP.
• Other System Preservation - The listings under this heading are annual allocations (budgets) for: Part I and Part II SPR; facilities, equipment and environmental compliance initiatives for SHA facilities and enhancement of truck weight and inspection facilities; reservation of funding fopurchasing access controls to enhance safety and preserve mobility in selected primary highwayprojea portion of I-95 North, antotal matches that shown for Other System Preservation on the SHA divider page in the CTP.
• GARVEE Debt Service – This line is a reservation of federal funds for federal eligible expenses for the Intercounty Connector (ICC) project, which is partially funded with GARVEE bonds.
her – Funding reservations under this heading inclu • Othighway funds for initiatives external to the SHA. This includes the reservation of federal funds for expenditures on: ADHS local access improvements in accordance with Appalachian Regional Commission policies; local bridge rehabilitation and replacement projects; Baltimore City projects including high priority projects thave received federal funding; local projects that have received fgrants for Safe Routes to Schools projects; and for the flexing of CMAQ funds for transit/non-SHA CMAQ eligible projects.
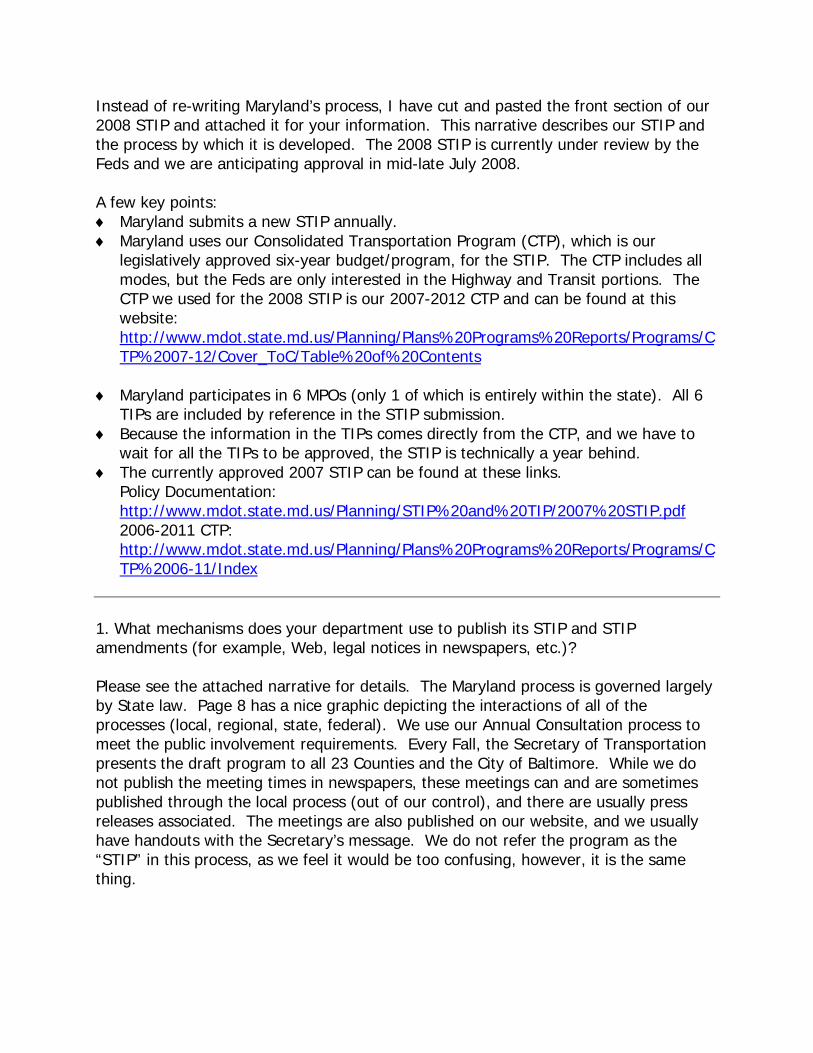
Instead of re-writing Maryland’s process, I have cut and pasted the front section of our 2008 STIP and attached it for your information. This narrative describes our STIP and the process by which it is developed. The 2008 STIP is currently under review by the Feds and we are anticipating approval in mid-late July 2008. A few key points: ♦ Maryland submits a new STIP annually. ♦ Maryland uses our Consolidated Transportation Program (CTP), which is our
legislatively approved six-year budget/program, for the STIP. The CTP includes all modes, but the Feds are only interested in the Highway and Transit portions. The CTP we used for the 2008 STIP is our 2007-2012 CTP and can be found at this website: http://www.mdot.state.md.us/Planning/Plans%20Programs%20Reports/Programs/CTP%2007-12/Cover_ToC/Table%20of%20Contents
♦ Maryland participates in 6 MPOs (only 1 of which is entirely within the state). All 6
TIPs are included by reference in the STIP submission. ♦ Because the information in the TIPs comes directly from the CTP, and we have to
wait for all the TIPs to be approved, the STIP is technically a year behind. ♦ The currently approved 2007 STIP can be found at these links.
Policy Documentation: http://www.mdot.state.md.us/Planning/STIP%20and%20TIP/2007%20STIP.pdf 2006-2011 CTP: http://www.mdot.state.md.us/Planning/Plans%20Programs%20Reports/Programs/CTP%2006-11/Index
1. What mechanisms does your department use to publish its STIP and STIP amendments (for example, Web, legal notices in newspapers, etc.)? Please see the attached narrative for details. The Maryland process is governed largely by State law. Page 8 has a nice graphic depicting the interactions of all of the processes (local, regional, state, federal). We use our Annual Consultation process to meet the public involvement requirements. Every Fall, the Secretary of Transportation presents the draft program to all 23 Counties and the City of Baltimore. While we do not publish the meeting times in newspapers, these meetings can and are sometimes published through the local process (out of our control), and there are usually press releases associated. The meetings are also published on our website, and we usually have handouts with the Secretary’s message. We do not refer the program as the “STIP” in this process, as we feel it would be too confusing, however, it is the same thing.
We also do not publish STIP Amendments. Depending on the complexity of the Amendment, the TIP process may require public input. We do not do many STIP amendments throughout the year. 2. What information do you include in your STIP amendments - how detailed is the information? (If possible, please attach one or two representative pages.) I will send a copy of two STIP Amendments next week (one will be rural, one will be urban). Our FHWA representative helped us develop a detailed spreadsheet which easily demonstrates the changes we are them asking to approve. We also include the TIP Amendment details and MPO Resolution, since most of our state is in an urban area. 3. How frequently do you demonstrate the fiscal constraint of your STIP to FHWA? We demonstrate fiscal constraint annually, with every STIP submission. 4. Do you demonstrate fiscal constraint at the program level, the project level or somewhere in between? (If possible, please attach one or two representative pages.) While we have pressure from FHWA staff to demonstrate at the project level (like a checkbook), FHWA management tolerates something in between. We fill out the attached FHWA/FTA worksheets to help them track our spending. We also have a summary page in the CTP that shows the totals that they are looking to analyze. 5. Do you redemonstrate fiscal constraint with every STIP amendment? No, we do not redemonstrate fiscal constraint each time (see letters). 6. Do you have dual management programs related to highway projects - one to manage the highway program internally and the other to manage the multi-modal program to meet federal STIP requirements? (Note: Wisconsin DOT has both an internal Six-Year Highway Program and the Four-Year STIP.) No. We have a six-year CTP that serves as a Five-Year STIP. It is a 5-year STIP because we lose a year to get the 6 TIPs approved first, and we take great pains to make sure the numbers in the CTP are the same as the numbers in the TIP, so when the feds review the TIPs and the CTP, they match, as they should.
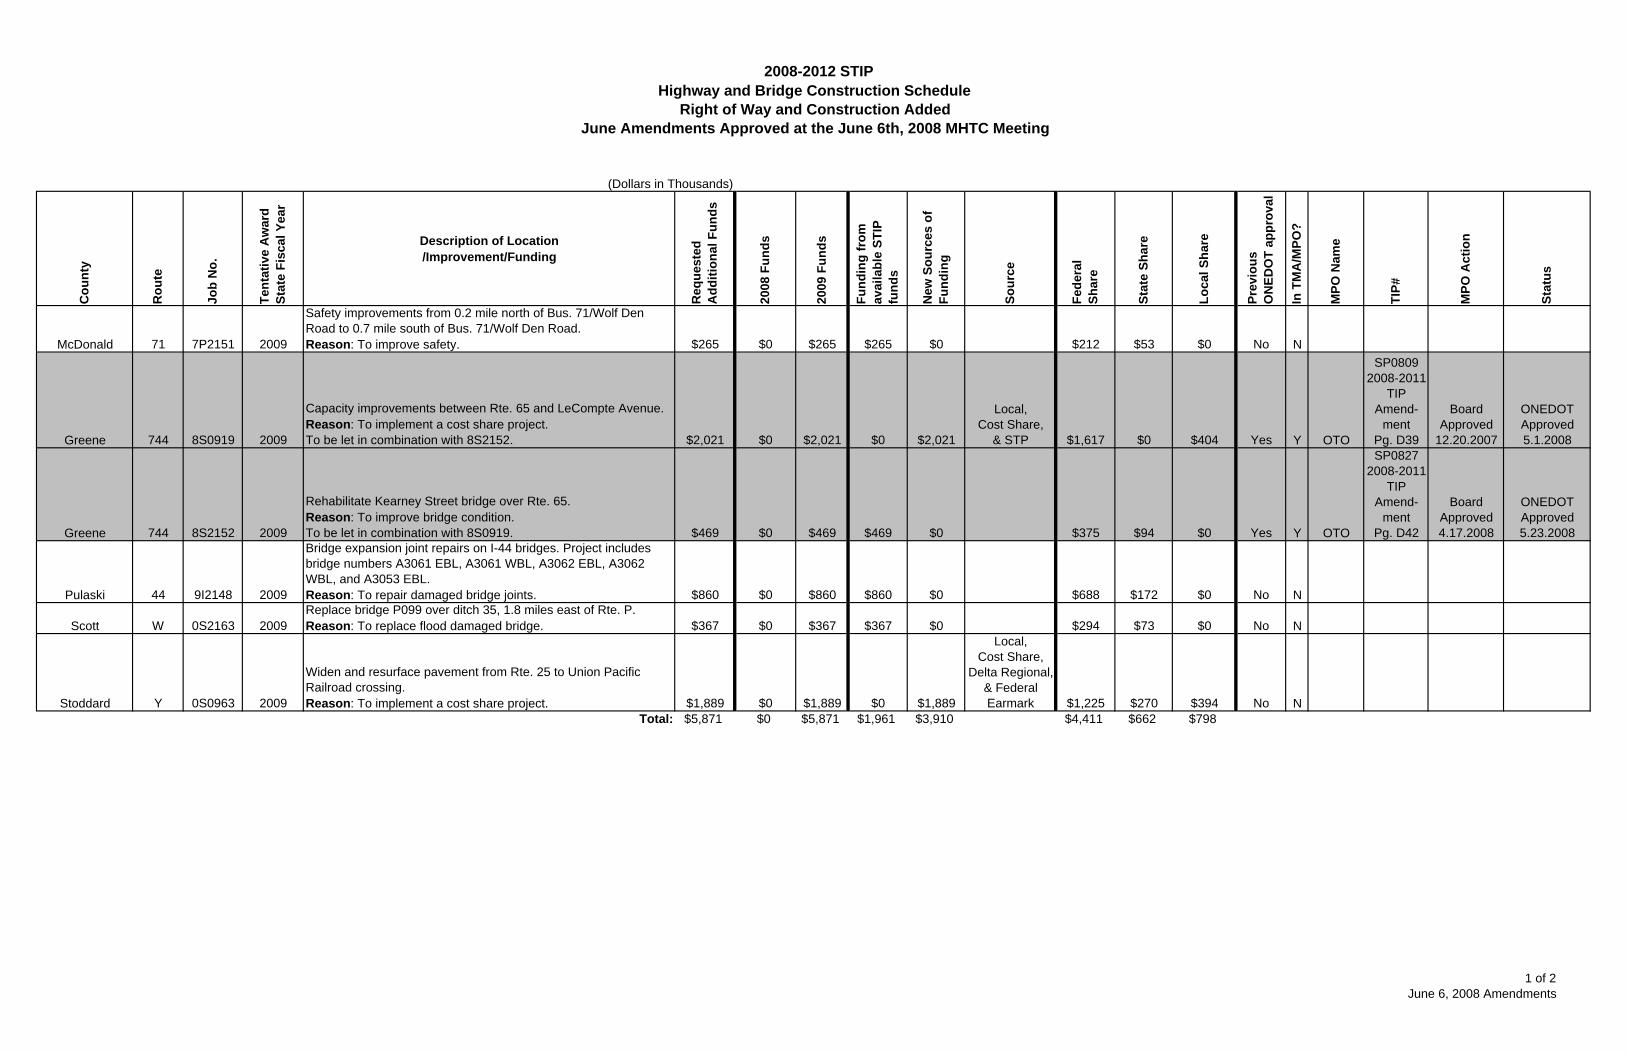
2008-2012 STIPHighway and Bridge Construction Schedule
Right of Way and Construction AddedJune Amendments Approved at the June 6th, 2008 MHTC Meeting
(Dollars in Thousands)
Cou
nty
Rou
te
Job
No.
Tent
ativ
e A
war
d St
ate
Fisc
al Y
ear
Description of Location/Improvement/Funding
Req
uest
edA
dditi
onal
Fun
ds
2008
Fun
ds
2009
Fun
ds
Fund
ing
from
avai
labl
e ST
IP
fund
s
New
Sou
rces
of
Fund
ing
Sour
ce
Fede
ral
Shar
e
Stat
e Sh
are
Loca
l Sha
re
Prev
ious
ON
EDO
T ap
prov
al
In T
MA
/MPO
?
MPO
Nam
e
TIP#
MPO
Act
ion
Stat
us
McDonald 71 7P2151 2009
Safety improvements from 0.2 mile north of Bus. 71/Wolf Den Road to 0.7 mile south of Bus. 71/Wolf Den Road.Reason: To improve safety. $265 $0 $265 $265 $0 $212 $53 $0 No N
Greene 744 8S0919 2009
Capacity improvements between Rte. 65 and LeCompte Avenue.Reason: To implement a cost share project.To be let in combination with 8S2152. $2,021 $0 $2,021 $0 $2,021
Local,Cost Share,
& STP $1,617 $0 $404 Yes Y OTO
SP08092008-2011
TIP Amend-
mentPg. D39
BoardApproved
12.20.2007
ONEDOTApproved5.1.2008
Greene 744 8S2152 2009
Rehabilitate Kearney Street bridge over Rte. 65.Reason: To improve bridge condition.To be let in combination with 8S0919. $469 $0 $469 $469 $0 $375 $94 $0 Yes Y OTO
SP08272008-2011
TIP Amend-
mentPg. D42
BoardApproved4.17.2008
ONEDOTApproved5.23.2008
Pulaski 44 9I2148 2009
Bridge expansion joint repairs on I-44 bridges. Project includes bridge numbers A3061 EBL, A3061 WBL, A3062 EBL, A3062 WBL, and A3053 EBL.Reason: To repair damaged bridge joints. $860 $0 $860 $860 $0 $688 $172 $0 No N
Scott W 0S2163 2009Replace bridge P099 over ditch 35, 1.8 miles east of Rte. P.Reason: To replace flood damaged bridge. $367 $0 $367 $367 $0 $294 $73 $0 No N
Stoddard Y 0S0963 2009
Widen and resurface pavement from Rte. 25 to Union Pacific Railroad crossing.Reason: To implement a cost share project. $1,889 $0 $1,889 $0 $1,889
Local,Cost Share,
Delta Regional,& Federal Earmark $1,225 $270 $394 No N
Total: $5,871 $0 $5,871 $1,961 $3,910 $4,411 $662 $798
1 of 2June 6, 2008 Amendments
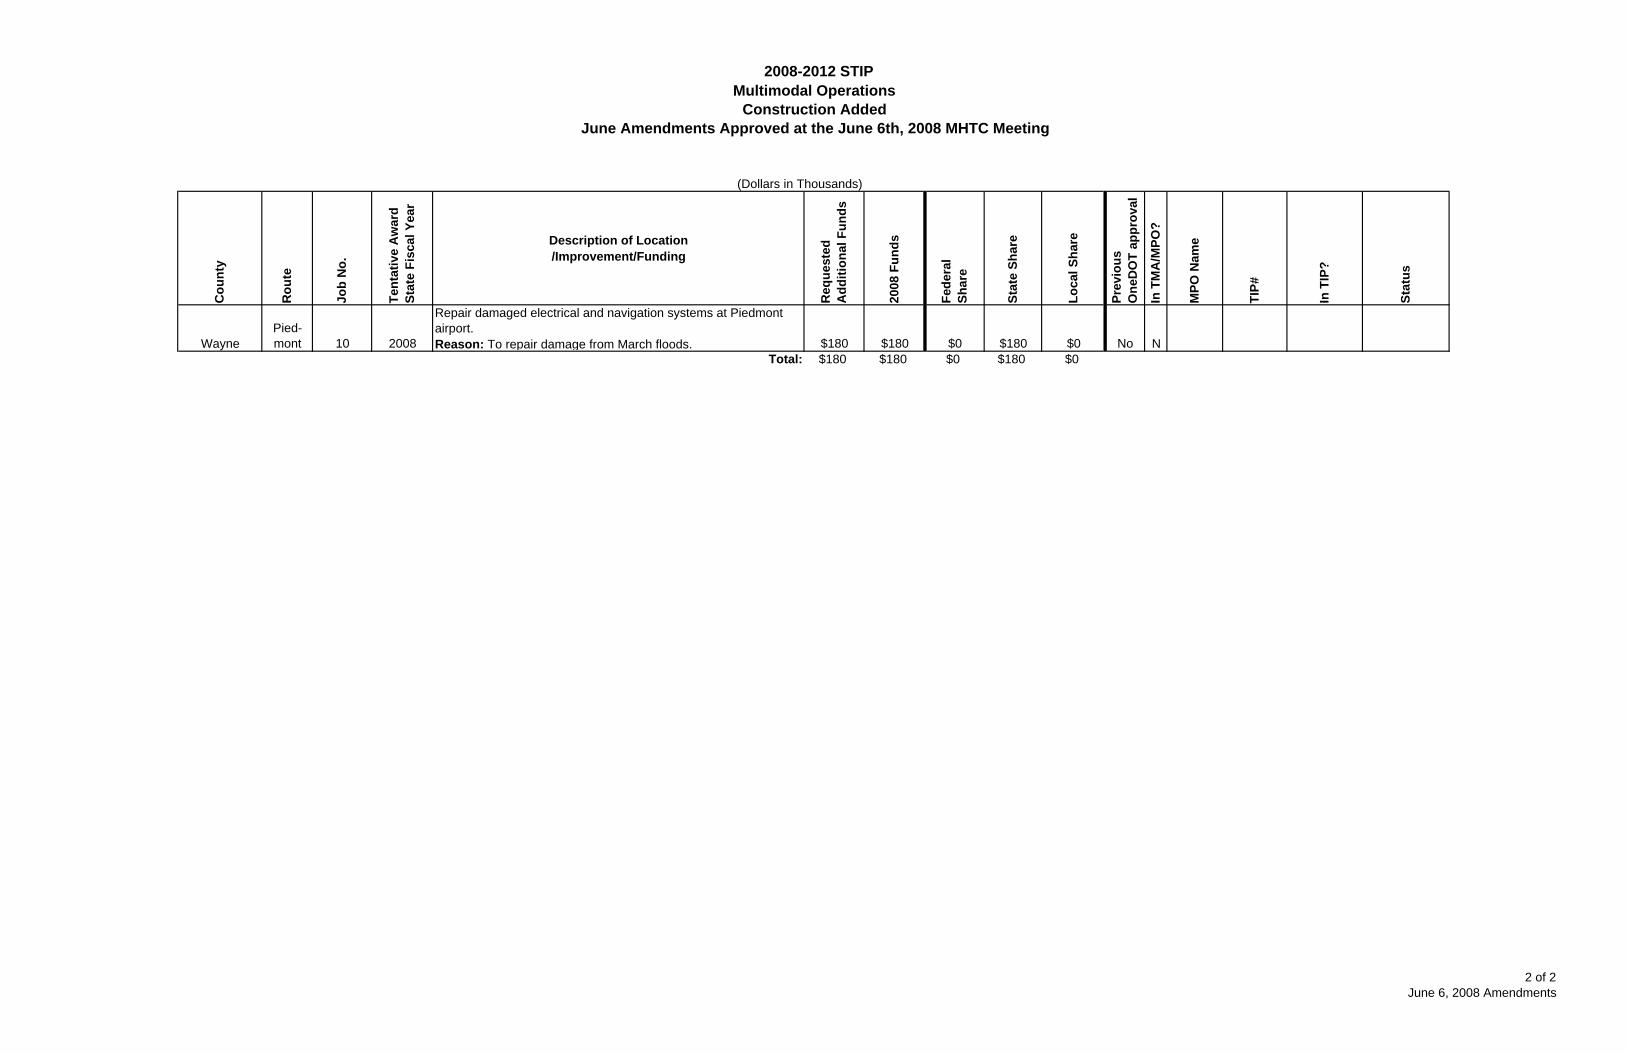
2008-2012 STIPMultimodal Operations
Construction AddedJune Amendments Approved at the June 6th, 2008 MHTC Meeting
(Dollars in Thousands)
Cou
nty
Rou
te
Job
No.
Tent
ativ
e A
war
d St
ate
Fisc
al Y
ear
Description of Location/Improvement/Funding
Req
uest
edA
dditi
onal
Fun
ds
2008
Fun
ds
Fede
ral
Shar
e
Stat
e Sh
are
Loca
l Sha
re
Prev
ious
One
DO
T ap
prov
al
In T
MA
/MPO
?
MPO
Nam
e
TIP#
In T
IP?
Stat
us
WaynePied-mont 10 2008
Repair damaged electrical and navigation systems at Piedmont airport.Reason: To repair damage from March floods. $180 $180 $0 $180 $0 No N
Total: $180 $180 $0 $180 $0
2 of 2June 6, 2008 Amendments
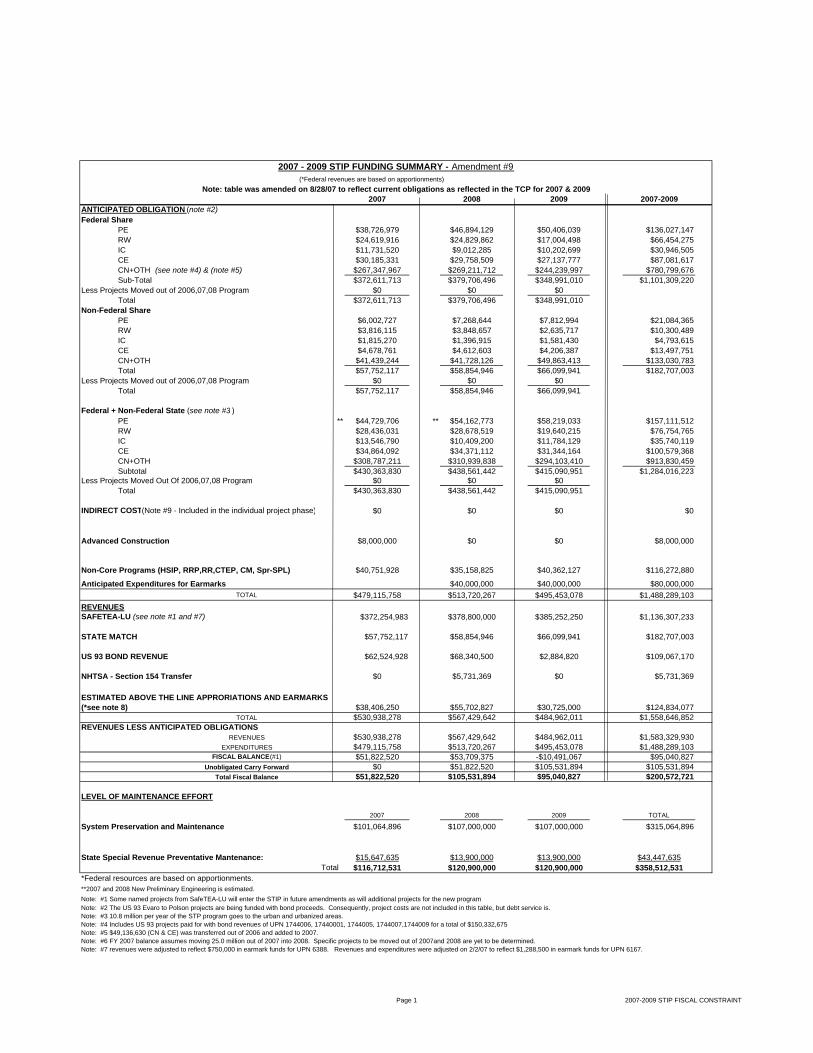
2007 2008 2009 2007-2009ANTICIPATED OBLIGATION (note #2)Federal Share
PE $38,726,979 $46,894,129 $50,406,039 $136,027,147RW $24,619,916 $24,829,862 $17,004,498 $66,454,275IC $11,731,520 $9,012,285 $10,202,699 $30,946,505CE $30,185,331 $29,758,509 $27,137,777 $87,081,617CN+OTH (see note #4) & (note #5) $267,347,967 $269,211,712 $244,239,997 $780,799,676Sub-Total $372,611,713 $379,706,496 $348,991,010 $1,101,309,220
Less Projects Moved out of 2006,07,08 Program $0 $0 $0Total $372,611,713 $379,706,496 $348,991,010
Non-Federal SharePE $6,002,727 $7,268,644 $7,812,994 $21,084,365RW $3,816,115 $3,848,657 $2,635,717 $10,300,489IC $1,815,270 $1,396,915 $1,581,430 $4,793,615CE $4,678,761 $4,612,603 $4,206,387 $13,497,751CN+OTH $41,439,244 $41,728,126 $49,863,413 $133,030,783Total $57,752,117 $58,854,946 $66,099,941 $182,707,003
Less Projects Moved out of 2006,07,08 Program $0 $0 $0Total $57,752,117 $58,854,946 $66,099,941
Federal + Non-Federal State (see note #3 )PE ** $44,729,706 ** $54,162,773 $58,219,033 $157,111,512RW $28,436,031 $28,678,519 $19,640,215 $76,754,765IC $13,546,790 $10,409,200 $11,784,129 $35,740,119CE $34,864,092 $34,371,112 $31,344,164 $100,579,368CN+OTH $308,787,211 $310,939,838 $294,103,410 $913,830,459Subtotal $430,363,830 $438,561,442 $415,090,951 $1,284,016,223
Less Projects Moved Out Of 2006,07,08 Program $0 $0 $0Total $430,363,830 $438,561,442 $415,090,951
INDIRECT COST(Note #9 - Included in the individual project phase) $0 $0 $0 $0
Advanced Construction $8,000,000 $0 $0 $8,000,000
$40,751,928 $35,158,825 $40,362,127 $116,272,880
Anticipated Expenditures for Earmarks $40,000,000 $40,000,000 $80,000,000TOTAL $479,115,758 $513,720,267 $495,453,078 $1,488,289,103
REVENUESSAFETEA-LU (see note #1 and #7) $372,254,983 $378,800,000 $385,252,250 $1,136,307,233
STATE MATCH $57,752,117 $58,854,946 $66,099,941 $182,707,003
US 93 BOND REVENUE $62,524,928 $68,340,500 $2,884,820 $109,067,170
$0 $5,731,369 $0 $5,731,369
$38,406,250 $55,702,827 $30,725,000 $124,834,077TOTAL $530,938,278 $567,429,642 $484,962,011 $1,558,646,852
REVENUES LESS ANTICIPATED OBLIGATIONSREVENUES $530,938,278 $567,429,642 $484,962,011 $1,583,329,930
EXPENDITURES $479,115,758 $513,720,267 $495,453,078 $1,488,289,103FISCAL BALANCE (#1) $51,822,520 $53,709,375 -$10,491,067 $95,040,827
Unobligated Carry Forward $0 $51,822,520 $105,531,894 $105,531,894Total Fiscal Balance $51,822,520 $105,531,894 $95,040,827 $200,572,721
LEVEL OF MAINTENANCE EFFORT
2007 2008 2009 TOTAL
$101,064,896 $107,000,000 $107,000,000 $315,064,896
$15,647,635 $13,900,000 $13,900,000 $43,447,635Total $116,712,531 $120,900,000 $120,900,000 $358,512,531
*Federal resources are based on apportionments.**2007 and 2008 New Preliminary Engineering is estimated.Note: #1 Some named projects from SafeTEA-LU will enter the STIP in future amendments as will additional projects for the new programNote: #2 The US 93 Evaro to Polson projects are being funded with bond proceeds. Consequently, project costs are not included in this table, but debt service is. Note: #3 10.8 million per year of the STP program goes to the urban and urbanized areas.Note: #4 Includes US 93 projects paid for with bond revenues of UPN 1744006, 17440001, 1744005, 1744007,1744009 for a total of $150,332,675Note: #5 $49,136,630 (CN & CE) was transferred out of 2006 and added to 2007.Note: #6 FY 2007 balance assumes moving 25.0 million out of 2007 into 2008. Specific projects to be moved out of 2007and 2008 are yet to be determined.Note: #7 revenues were adjusted to reflect $750,000 in earmark funds for UPN 6388. Revenues and expenditures were adjusted on 2/2/07 to reflect $1,288,500 in earmark funds for UPN 6167.
System Preservation and Maintenance
State Special Revenue Preventative Mantenance:
2007 - 2009 STIP FUNDING SUMMARY - Amendment #9
Non-Core Programs (HSIP, RRP,RR,CTEP, CM, Spr-SPL)
NHTSA - Section 154 Transfer
ESTIMATED ABOVE THE LINE APPRORIATIONS AND EARMARKS (*see note 8)
Note: table was amended on 8/28/07 to reflect current obligations as reflected in the TCP for 2007 & 2009(*Federal revenues are based on apportionments)
Page 1 2007-2009 STIP FISCAL CONSTRAINT

3/6/07 revenues and expenditures were adjusted to reflect $4,775,997 earmark funds for UPN 4138 007.4/19/07 revenues and expenditures were adjusted to reflect $10,734,773 earmark funds for UPN 4666 and 5588.
Note: #8 Above the line Section 1934 Earmark Apportionment was adjusted on 5/2/07 to reflect current levels.Note:#9 Indirect Cost is included in the individual project cost by phase.
Page 2 2007-2009 STIP FISCAL CONSTRAINT
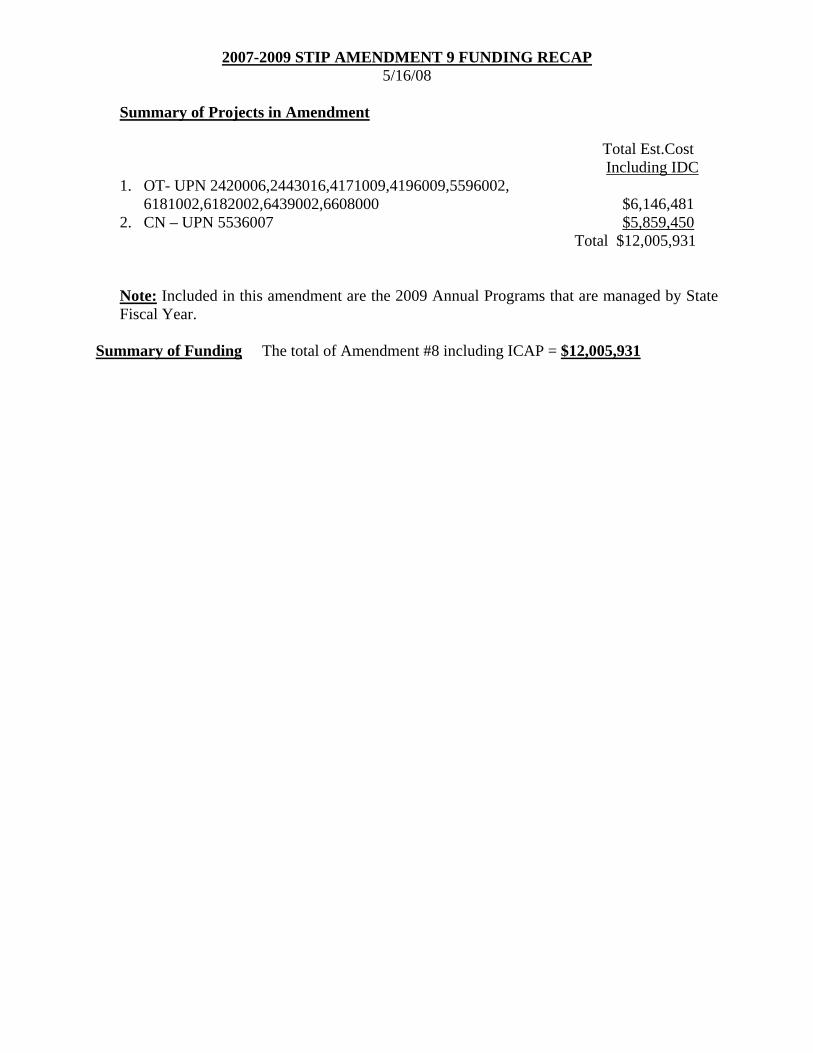
2007-2009 STIP AMENDMENT 9 FUNDING RECAP 5/16/08
Summary of Projects in Amendment
Total Est.Cost
Including IDC 1. OT- UPN 2420006,2443016,4171009,4196009,5596002, 6181002,6182002,6439002,6608000 $6,146,481 2. CN – UPN 5536007 $5,859,450 Total $12,005,931
Note: Included in this amendment are the 2009 Annual Programs that are managed by State Fiscal Year.
Summary of Funding The total of Amendment #8 including ICAP = $12,005,931

Filter: PORTFOLIO ID = '2007 STIP' AND STIP AMENDMENT = '9'Sort: UPN Ascending
PR-011
24202443
4171
41965536
5596
6181
6182
64396608
UPN
006016
009
009007
002
002
002
002000
UNIT COUNTY
2009 TRAINING PROGRAMLOCAL TECH ASSISTPROGRAMSFY 2009 MAINTENANCEPROGRAM2009-FUEL TAX EVASIONDURABLE PAVEMENTMARKINGS2009 VEGETATIONMANGMNT PRGRMSAFE ROUTES TO SCHOOLPROGRAMSAFE RTE TO SCHOOLCOORDINATORSTI 2009MT CRASH NOTIFICATIONRESRCH
PROJECT NAME
MISCELLANEOUSMISCELLANEOUS
MISCELLANEOUS
MISCELLANEOUSDURABLE PAVEMENT MAR
LANDSCAPING
BIKE/PED FACILITIES
BIKE/PED FACILITIES
MISCELLANEOUSMISCELLANEOUS
PROJECT SCOPEPROJECT NUMBER PHASE
TOTALEST
COST
$946,267 $320,000
$2,617,014
$134,700 $5,859,450
$673,500
$297,000
$125,000
$43,000 $990,000
ESTCOST
W/O IDC
$843,000 $295,995
$2,331,416
$120,000 $5,220,000
$600,000
$264,588
$111,359
$38,307 $881,960
OTOT
OT
OTCN
OT
OT
OT
OTOT
AMENDMENT 9SUBMITTED 5/16/08
State of Montana Department of Transportation 29-MAY-20081Page:MONTANA DEPARTMENT OF TRANSPORTATION
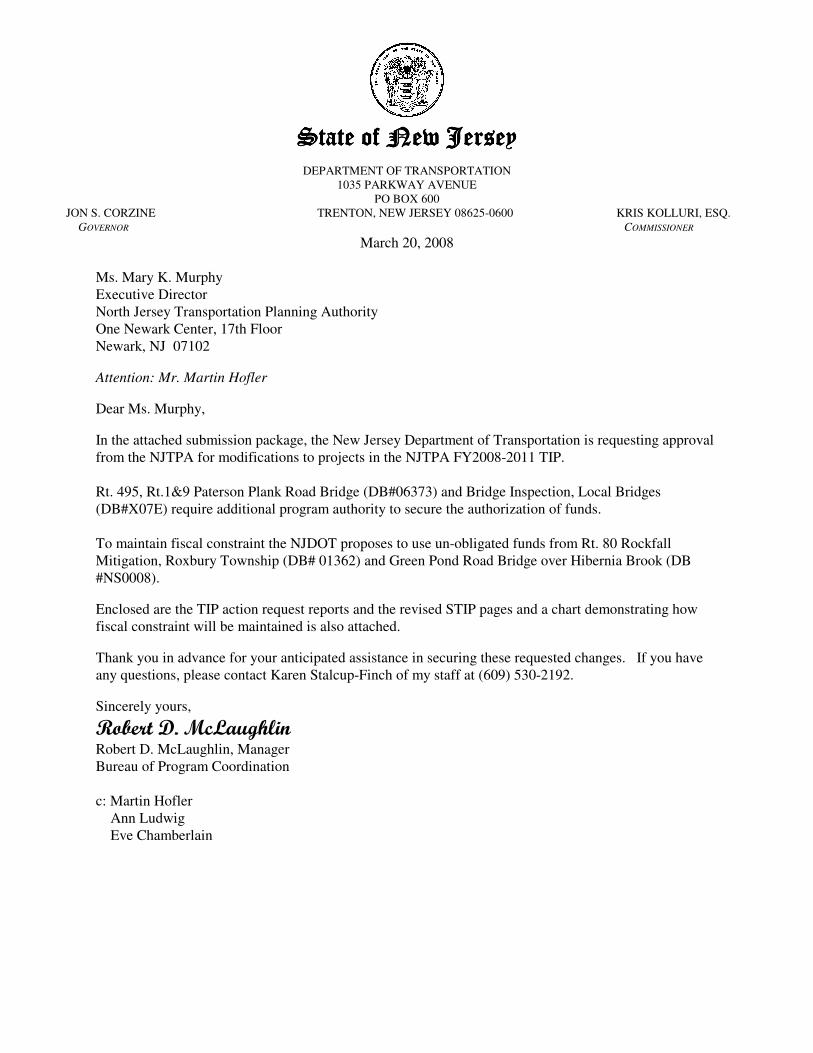
State of New JerseyState of New JerseyState of New JerseyState of New Jersey
DEPARTMENT OF TRANSPORTATION
1035 PARKWAY AVENUE
PO BOX 600
JON S. CORZINE TRENTON, NEW JERSEY 08625-0600 KRIS KOLLURI, ESQ.
GOVERNOR COMMISSIONER
March 20, 2008
Ms. Mary K. Murphy
Executive Director
North Jersey Transportation Planning Authority
One Newark Center, 17th Floor
Newark, NJ 07102
Attention: Mr. Martin Hofler
Dear Ms. Murphy,
In the attached submission package, the New Jersey Department of Transportation is requesting approval
from the NJTPA for modifications to projects in the NJTPA FY2008-2011 TIP.
Rt. 495, Rt.1&9 Paterson Plank Road Bridge (DB#06373) and Bridge Inspection, Local Bridges
(DB#X07E) require additional program authority to secure the authorization of funds.
To maintain fiscal constraint the NJDOT proposes to use un-obligated funds from Rt. 80 Rockfall
Mitigation, Roxbury Township (DB# 01362) and Green Pond Road Bridge over Hibernia Brook (DB
#NS0008). Enclosed are the TIP action request reports and the revised STIP pages and a chart demonstrating how
fiscal constraint will be maintained is also attached.
Thank you in advance for your anticipated assistance in securing these requested changes. If you have
any questions, please contact Karen Stalcup-Finch of my staff at (609) 530-2192.
Sincerely yours,
Robert D. McLaughlin Robert D. McLaughlin, Manager
Bureau of Program Coordination
c: Martin Hofler
Ann Ludwig
Eve Chamberlain
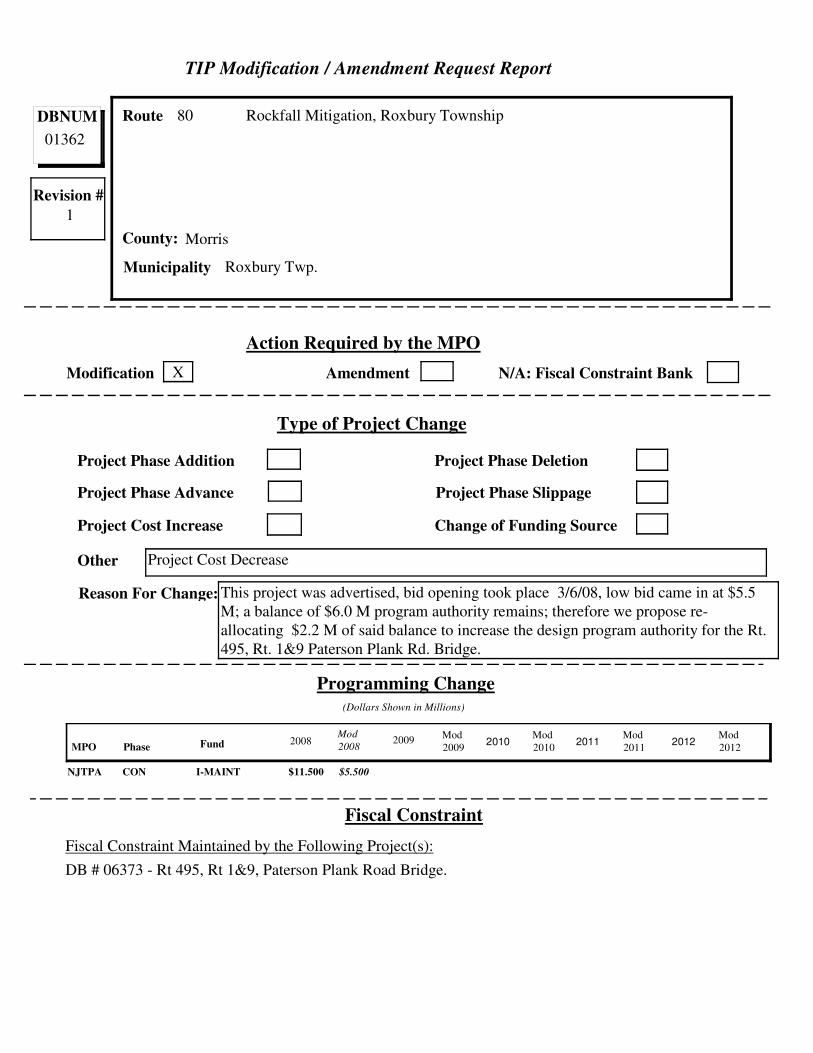
TIP Modification / Amendment Request Report
DBNUM
01362
Route 80 Rockfall Mitigation, Roxbury Township
County: Morris
Action Required by the MPO
Revision #
1
Modification X Amendment N/A: Fiscal Constraint Bank
Type of Project Change
Project Phase Addition Project Phase Deletion
Project Phase Advance Project Phase Slippage
Project Cost Increase Change of Funding Source
Other Project Cost Decrease
Programming Change(Dollars Shown in Millions)
Fiscal Constraint Maintained by the Following Project(s):
DB # 06373 - Rt 495, Rt 1&9, Paterson Plank Road Bridge.
Municipality Roxbury Twp.
Reason For Change: This project was advertised, bid opening took place 3/6/08, low bid came in at $5.5
M; a balance of $6.0 M program authority remains; therefore we propose re-
allocating $2.2 M of said balance to increase the design program authority for the Rt.
495, Rt. 1&9 Paterson Plank Rd. Bridge.
Fiscal Constraint
MPO Phase2008
Mod
20082009
Mod
2009Fund 2010Mod
20102011
Mod
20112012
Mod
2012
NJTPA CON $11.500 $5.500I-MAINT
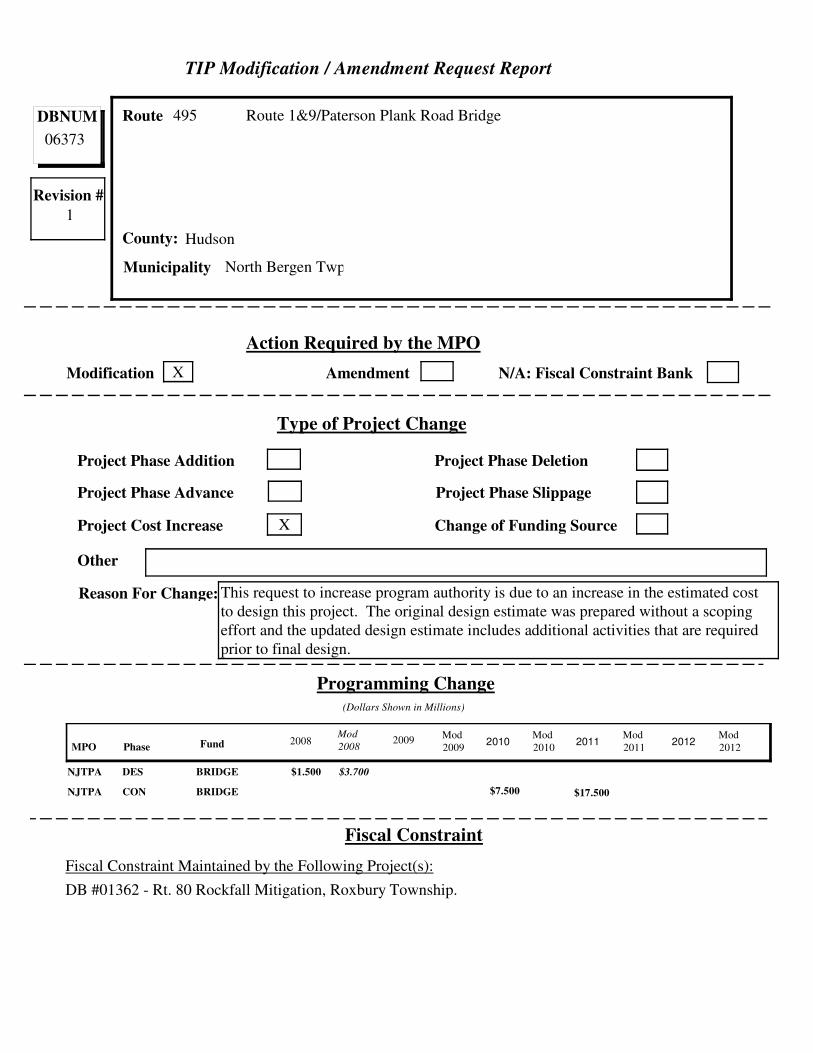
TIP Modification / Amendment Request Report
DBNUM
06373
Route 495 Route 1&9/Paterson Plank Road Bridge
County: Hudson
Action Required by the MPO
Revision #
1
Modification X Amendment N/A: Fiscal Constraint Bank
Type of Project Change
Project Phase Addition Project Phase Deletion
Project Phase Advance Project Phase Slippage
Project Cost Increase X Change of Funding Source
Other
Programming Change(Dollars Shown in Millions)
Fiscal Constraint Maintained by the Following Project(s):
DB #01362 - Rt. 80 Rockfall Mitigation, Roxbury Township.
Municipality North Bergen Twp.
Reason For Change: This request to increase program authority is due to an increase in the estimated cost
to design this project. The original design estimate was prepared without a scoping
effort and the updated design estimate includes additional activities that are required
prior to final design.
Fiscal Constraint
MPO Phase2008
Mod
20082009
Mod
2009Fund 2010Mod
20102011
Mod
20112012
Mod
2012
NJTPA DES $1.500 $3.700BRIDGE
NJTPA CON BRIDGE $7.500 $17.500
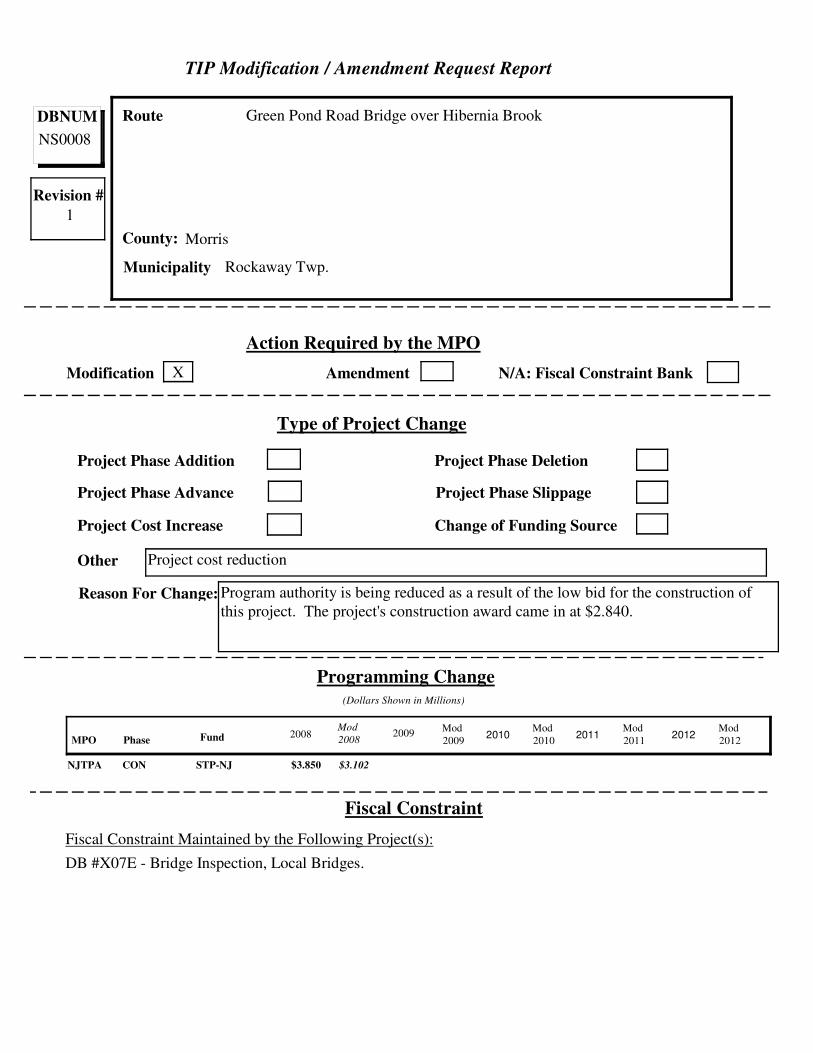
TIP Modification / Amendment Request Report
DBNUM
NS0008
Route Green Pond Road Bridge over Hibernia Brook
County: Morris
Action Required by the MPO
Revision #
1
Modification X Amendment N/A: Fiscal Constraint Bank
Type of Project Change
Project Phase Addition Project Phase Deletion
Project Phase Advance Project Phase Slippage
Project Cost Increase Change of Funding Source
Other Project cost reduction
Programming Change(Dollars Shown in Millions)
Fiscal Constraint Maintained by the Following Project(s):
DB #X07E - Bridge Inspection, Local Bridges.
Municipality Rockaway Twp.
Reason For Change: Program authority is being reduced as a result of the low bid for the construction of
this project. The project's construction award came in at $2.840.
Fiscal Constraint
MPO Phase2008
Mod
20082009
Mod
2009Fund 2010Mod
20102011
Mod
20112012
Mod
2012
NJTPA CON $3.850 $3.102STP-NJ
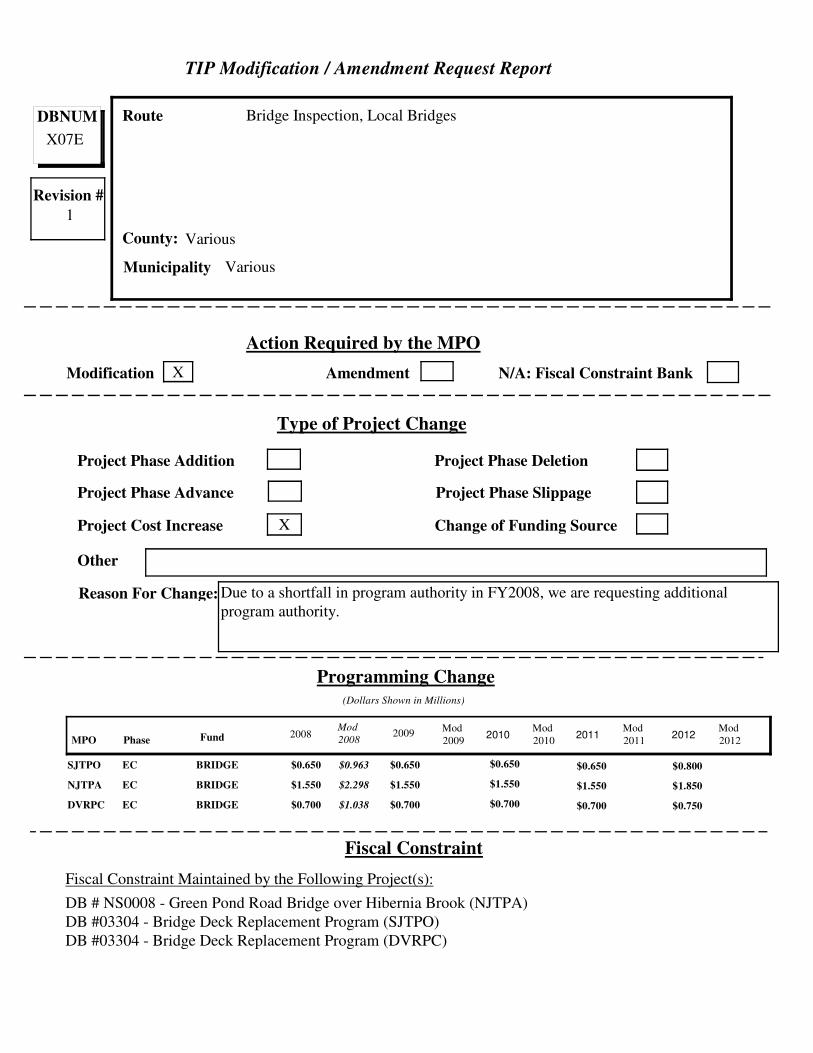
TIP Modification / Amendment Request Report
DBNUM
X07E
Route Bridge Inspection, Local Bridges
County: Various
Action Required by the MPO
Revision #
1
Modification X Amendment N/A: Fiscal Constraint Bank
Type of Project Change
Project Phase Addition Project Phase Deletion
Project Phase Advance Project Phase Slippage
Project Cost Increase X Change of Funding Source
Other
Programming Change(Dollars Shown in Millions)
Fiscal Constraint Maintained by the Following Project(s):
DB # NS0008 - Green Pond Road Bridge over Hibernia Brook (NJTPA)
DB #03304 - Bridge Deck Replacement Program (SJTPO)
DB #03304 - Bridge Deck Replacement Program (DVRPC)
Municipality Various
Reason For Change: Due to a shortfall in program authority in FY2008, we are requesting additional
program authority.
Fiscal Constraint
MPO Phase2008
Mod
20082009
Mod
2009Fund 2010Mod
20102011
Mod
20112012
Mod
2012
SJTPO EC $0.650 $0.963 $0.650BRIDGE $0.650 $0.650 $0.800
NJTPA EC $1.550 $2.298 $1.550BRIDGE $1.550 $1.550 $1.850
DVRPC EC $0.700 $1.038 $0.700BRIDGE $0.700 $0.700 $0.750
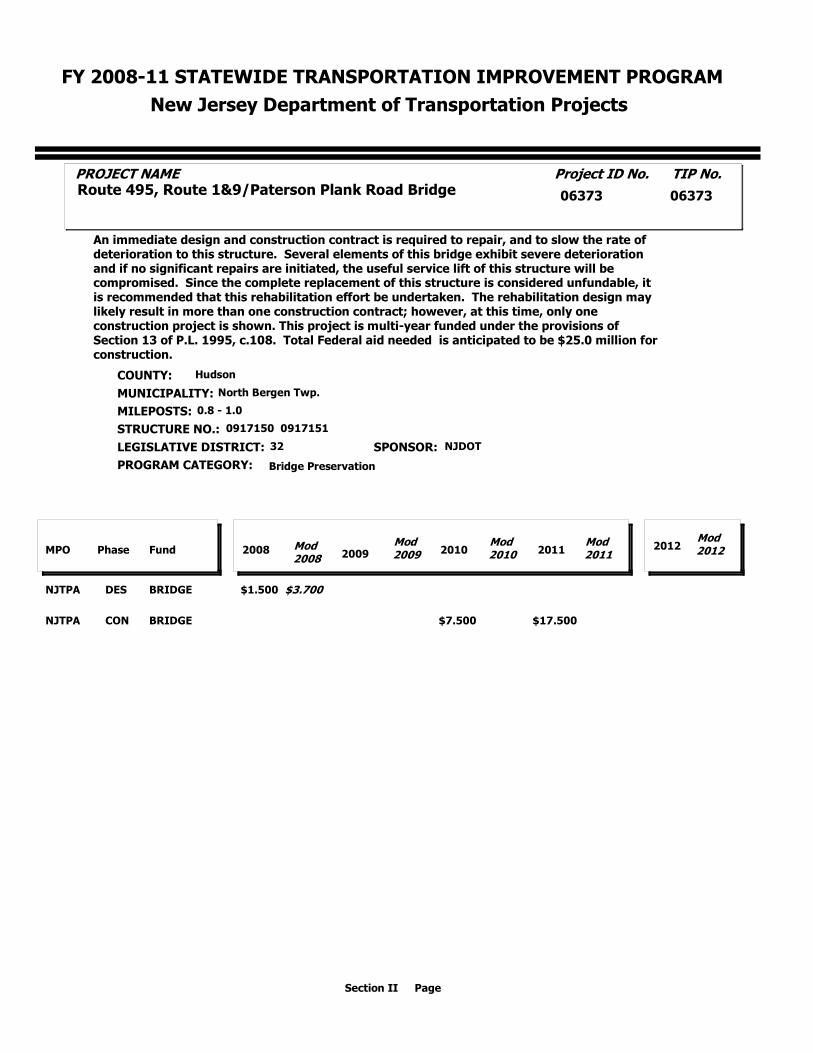
FY 2008-11 STATEWIDE TRANSPORTATION IMPROVEMENT PROGRAM
New Jersey Department of Transportation Projects
06373Route 495, Route 1&9/Paterson Plank Road Bridge
MILEPOSTS: 0.8 - 1.0
An immediate design and construction contract is required to repair, and to slow the rate of deterioration to this structure. Several elements of this bridge exhibit severe deterioration and if no significant repairs are initiated, the useful service lift of this structure will be compromised. Since the complete replacement of this structure is considered unfundable, it is recommended that this rehabilitation effort be undertaken. The rehabilitation design may likely result in more than one construction contract; however, at this time, only one construction project is shown. This project is multi-year funded under the provisions of Section 13 of P.L. 1995, c.108. Total Federal aid needed is anticipated to be $25.0 million for construction.
COUNTY: Hudson
North Bergen Twp. MUNICIPALITY:
STRUCTURE NO.: 0917150 0917151
LEGISLATIVE DISTRICT: 32
PROGRAM CATEGORY:
SPONSOR: NJDOT
PROJECT NAME Project ID No. TIP No.
06373
FundPhaseMPO 2008 Mod 2008
Mod 2010
Mod 20092009 2010
Mod 20112011 2012
Mod 2012
Bridge Preservation
NJTPA DES BRIDGE $1.500 $3.700
NJTPA CON BRIDGE $7.500 $17.500
Section II Page
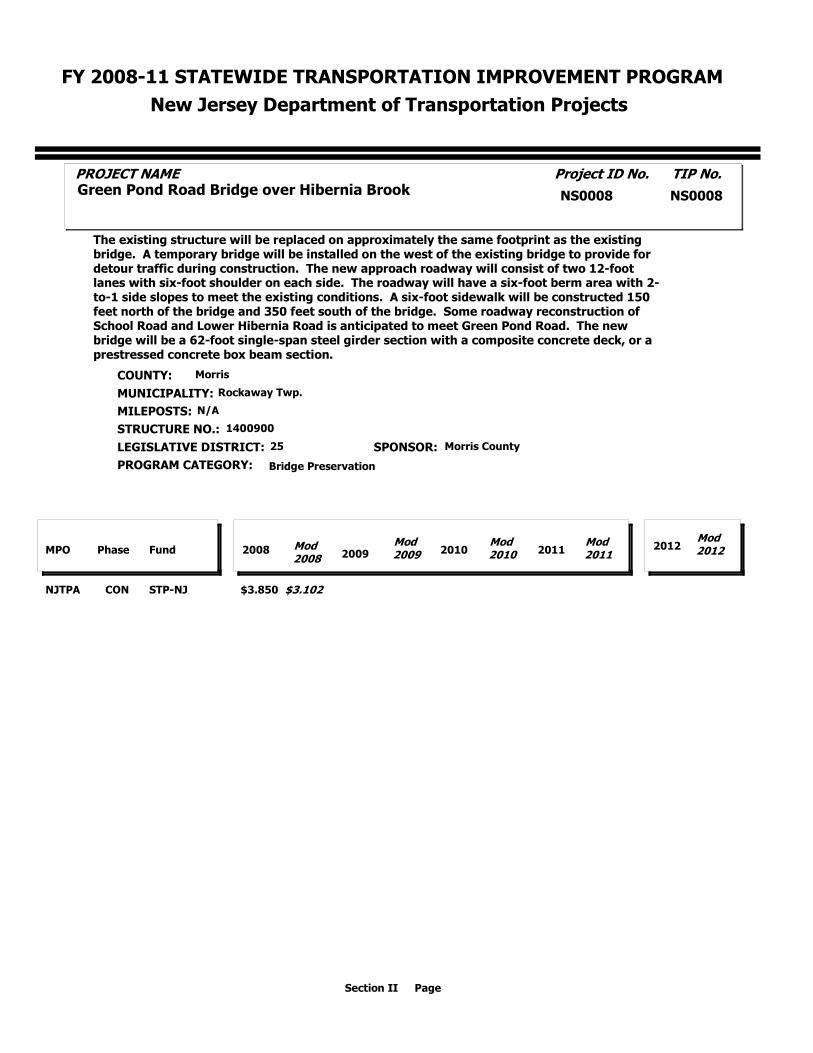
FY 2008-11 STATEWIDE TRANSPORTATION IMPROVEMENT PROGRAM
New Jersey Department of Transportation Projects
NS0008Green Pond Road Bridge over Hibernia Brook
MILEPOSTS: N/A
The existing structure will be replaced on approximately the same footprint as the existing bridge. A temporary bridge will be installed on the west of the existing bridge to provide for detour traffic during construction. The new approach roadway will consist of two 12-foot lanes with six-foot shoulder on each side. The roadway will have a six-foot berm area with 2-to-1 side slopes to meet the existing conditions. A six-foot sidewalk will be constructed 150 feet north of the bridge and 350 feet south of the bridge. Some roadway reconstruction of School Road and Lower Hibernia Road is anticipated to meet Green Pond Road. The new bridge will be a 62-foot single-span steel girder section with a composite concrete deck, or a prestressed concrete box beam section.
COUNTY: Morris
Rockaway Twp. MUNICIPALITY:
STRUCTURE NO.: 1400900
LEGISLATIVE DISTRICT: 25
PROGRAM CATEGORY:
SPONSOR: Morris County
PROJECT NAME Project ID No. TIP No.
NS0008
FundPhaseMPO 2008 Mod 2008
Mod 2010
Mod 20092009 2010
Mod 20112011 2012
Mod 2012
Bridge Preservation
NJTPA CON STP-NJ $3.850 $3.102
Section II Page
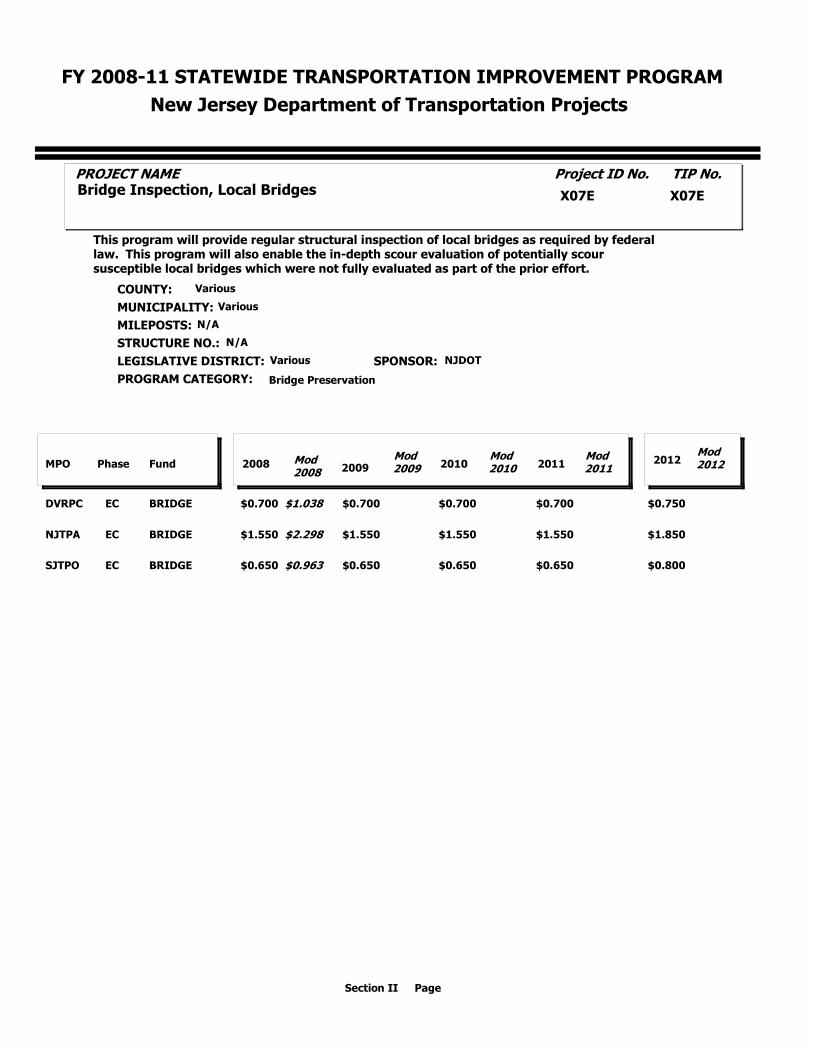
FY 2008-11 STATEWIDE TRANSPORTATION IMPROVEMENT PROGRAM
New Jersey Department of Transportation Projects
X07EBridge Inspection, Local Bridges
MILEPOSTS: N/A
This program will provide regular structural inspection of local bridges as required by federal law. This program will also enable the in-depth scour evaluation of potentially scour susceptible local bridges which were not fully evaluated as part of the prior effort.
COUNTY: Various
Various MUNICIPALITY:
STRUCTURE NO.: N/A
LEGISLATIVE DISTRICT: Various
PROGRAM CATEGORY:
SPONSOR: NJDOT
PROJECT NAME Project ID No. TIP No.
X07E
FundPhaseMPO 2008 Mod 2008
Mod 2010
Mod 20092009 2010
Mod 20112011 2012
Mod 2012
Bridge Preservation
DVRPC EC BRIDGE $0.700 $1.038 $0.700 $0.700 $0.700 $0.750
NJTPA EC BRIDGE $1.550 $2.298 $1.550 $1.550 $1.550 $1.850
SJTPO EC BRIDGE $0.650 $0.963 $0.650 $0.650 $0.650 $0.800
Section II Page
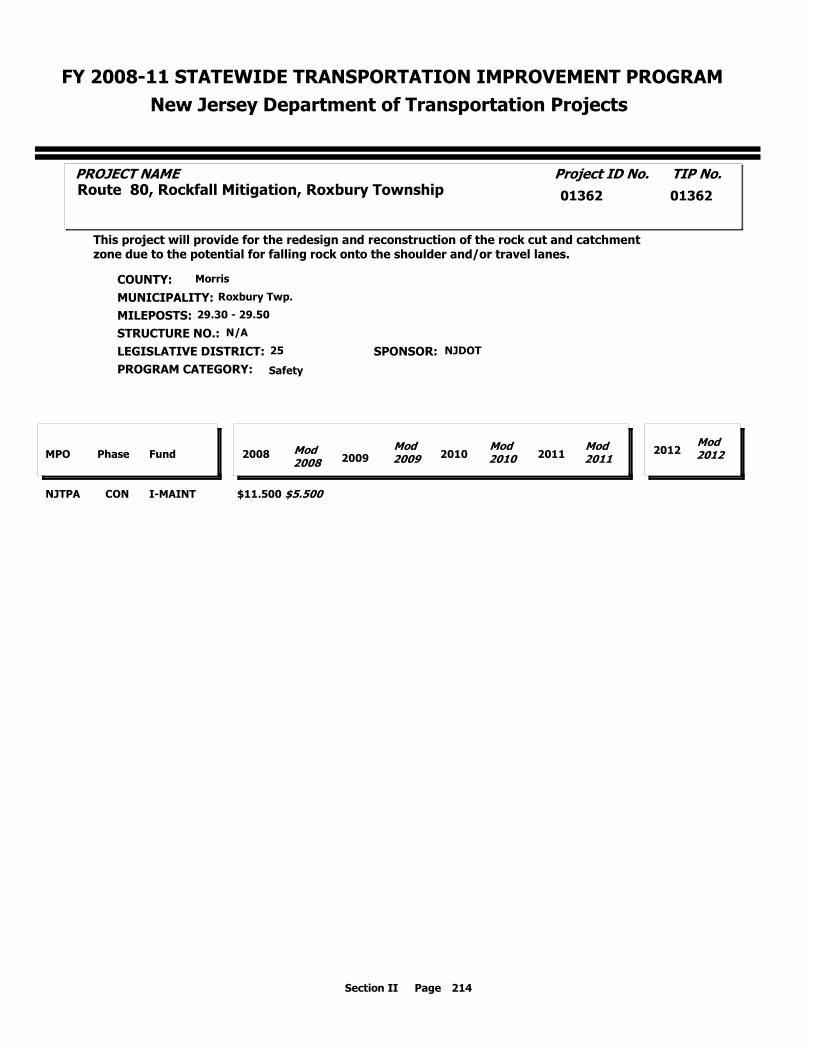
FY 2008-11 STATEWIDE TRANSPORTATION IMPROVEMENT PROGRAM
New Jersey Department of Transportation Projects
01362Route 80, Rockfall Mitigation, Roxbury Township
MILEPOSTS: 29.30 - 29.50
This project will provide for the redesign and reconstruction of the rock cut and catchment zone due to the potential for falling rock onto the shoulder and/or travel lanes.
COUNTY: Morris
Roxbury Twp. MUNICIPALITY:
STRUCTURE NO.: N/A
LEGISLATIVE DISTRICT: 25
PROGRAM CATEGORY:
SPONSOR: NJDOT
PROJECT NAME Project ID No. TIP No.
01362
FundPhaseMPO 2008 Mod 2008
Mod 2010
Mod 20092009 2010
Mod 20112011 2012
Mod 2012
Safety
NJTPA CON I-MAINT $11.500 $5.500
Section II 214Page
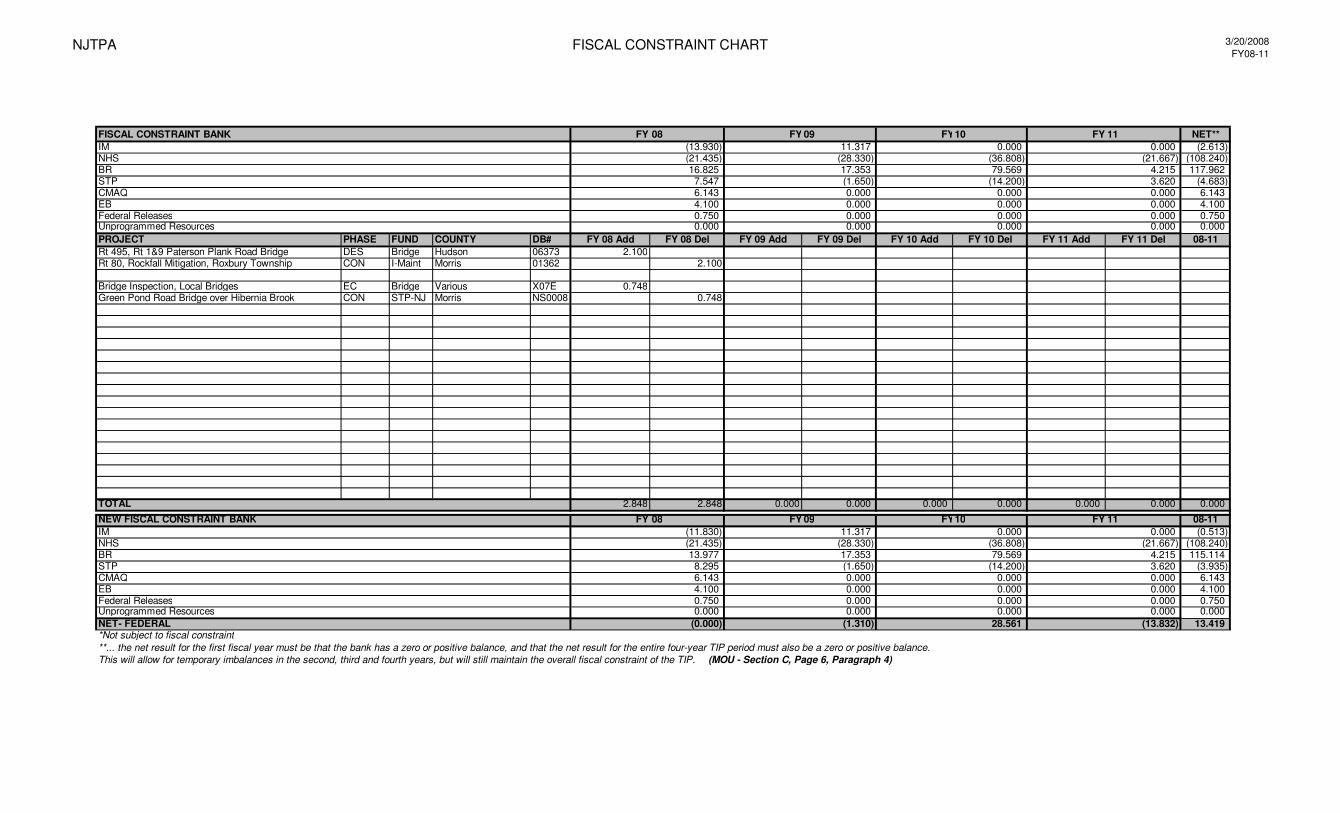
NJTPA FISCAL CONSTRAINT CHART 3/20/2008
FY08-11
FISCAL CONSTRAINT BANK FY 0508 FY 0609 FY 0710 FY 0711 NET**
IM (13.930) 11.317 0.000 0.000 (2.613)
NHS (21.435) (28.330) (36.808) (21.667) (108.240)
BR 16.825 17.353 79.569 4.215 117.962
STP 7.547 (1.650) (14.200) 3.620 (4.683)
CMAQ 6.143 0.000 0.000 0.000 6.143
EB 4.100 0.000 0.000 0.000 4.100
Federal Releases 0.750 0.000 0.000 0.000 0.750
Unprogrammed Resources 0.000 0.000 0.000 0.000 0.000
PROJECT PHASE FUND COUNTY DB# FY 08 Add FY 08 Del FY 09 Add FY 09 Del FY 10 Add FY 10 Del FY 11 Add FY 11 Del 08-11
Rt 495, Rt 1&9 Paterson Plank Road Bridge DES Bridge Hudson 06373 2.100
Rt 80, Rockfall Mitigation, Roxbury Township CON I-Maint Morris 01362 2.100
Bridge Inspection, Local Bridges EC Bridge Various X07E 0.748
Green Pond Road Bridge over Hibernia Brook CON STP-NJ Morris NS0008 0.748
TOTAL 2.848 2.848 0.000 0.000 0.000 0.000 0.000 0.000 0.000
NEW FISCAL CONSTRAINT BANK FY 08 FY 09 FY10 FY 11 08-11
IM (11.830) 11.317 0.000 0.000 (0.513)
NHS (21.435) (28.330) (36.808) (21.667) (108.240)
BR 13.977 17.353 79.569 4.215 115.114
STP 8.295 (1.650) (14.200) 3.620 (3.935)
CMAQ 6.143 0.000 0.000 0.000 6.143
EB 4.100 0.000 0.000 0.000 4.100
Federal Releases 0.750 0.000 0.000 0.000 0.750
Unprogrammed Resources 0.000 0.000 0.000 0.000 0.000
NET- FEDERAL (0.000) (1.310) 28.561 (13.832) 13.419*Not subject to fiscal constraint
**... the net result for the first fiscal year must be that the bank has a zero or positive balance, and that the net result for the entire four-year TIP period must also be a zero or positive balance.
This will allow for temporary imbalances in the second, third and fourth years, but will still maintain the overall fiscal constraint of the TIP. (MOU - Section C, Page 6, Paragraph 4)
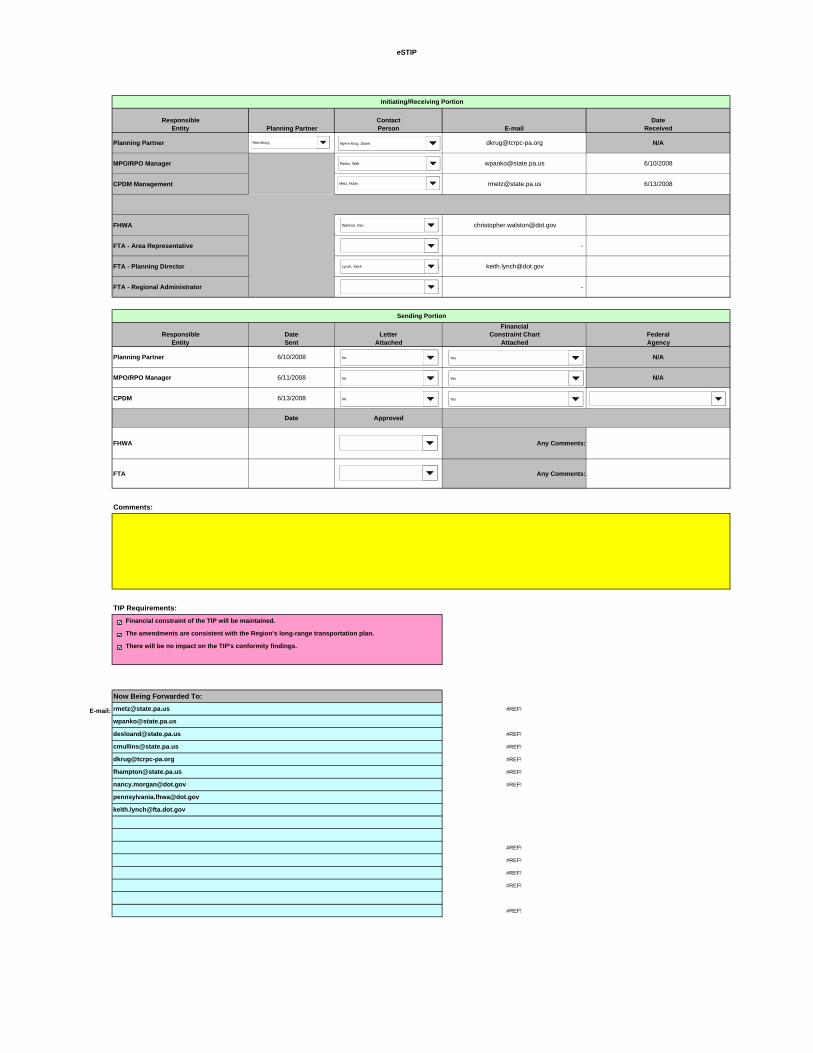
eSTIP
Responsible Contact DateEntity Planning Partner Person E-mail Received
Planning Partner 8 21 [email protected] N/A
MPO/RPO Manager 9 [email protected] 6/10/2008
CPDM Management 2 [email protected] 6/13/2008
FHWA 4 [email protected]
FTA - Area Representative 1 -
FTA - Planning Director 4 [email protected]
FTA - Regional Administrator 1 -
FinancialResponsible Date Letter Constraint Chart Federal
Entity Sent Attached Attached Agency
Planning Partner 6/10/2008 3 2 N/A
MPO/RPO Manager 6/11/2008 3 2 N/A
CPDM 6/13/2008 3 2 0
Date Approved
FHWA 0 Any Comments:
FTA 0 Any Comments:
Comments:
TIP Requirements:
Financial constraint of the TIP will be maintained.
The amendments are consistent with the Region's long-range transportation plan.
There will be no impact on the TIP's conformity findings.
Now Being Forwarded To:
E-mail: #REF!
#REF!
#REF!
#REF!
#REF!
#REF!
#REF!
#REF!
#REF!
#REF!
#REF!
Initiating/Receiving Portion
Sending Portion
Myers-Krug, Diane
Panko, Walt
Metz, Robin
Walston, Dan
No
Harrisburg
Lynch, Keith
No
No
No
Yes
Yes
Yes
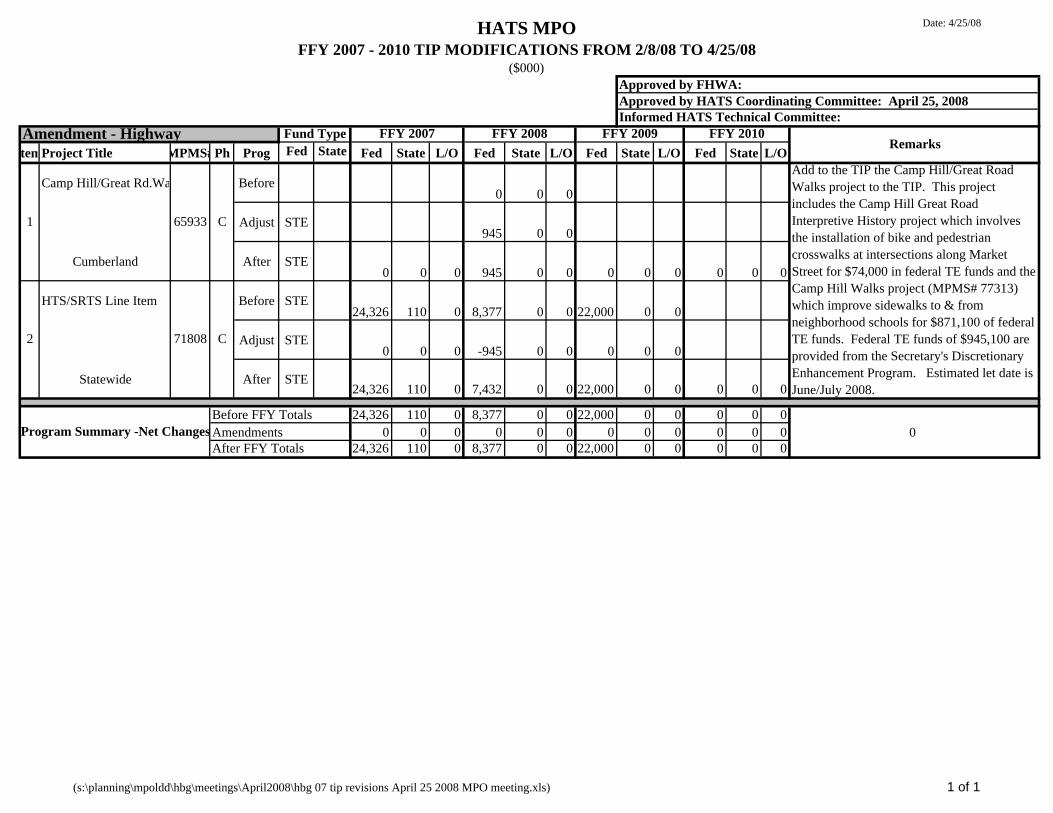
HATS MPOFFY 2007 - 2010 TIP MODIFICATIONS FROM 2/8/08 TO 4/25/08
($000)
Date: 4/25/08
temProject Title MPMS#Ph Prog Fed State Fed State L/O Fed State L/O Fed State L/O Fed State L/O
Camp Hill/Great Rd.Wa Before0 0 0
Adjust STE945 0 0
Cumberland After STE0 0 0 945 0 0 0 0 0 0 0 0
HTS/SRTS Line Item Before STE24,326 110 0 8,377 0 0 22,000 0 0
Adjust STE0 0 0 -945 0 0 0 0 0
Statewide After STE24,326 110 0 7,432 0 0 22,000 0 0 0 0 0
24,326 110 0 8,377 0 0 22,000 0 0 0 0 00 0 0 0 0 0 0 0 0 0 0 0 0
24,326 110 0 8,377 0 0 22,000 0 0 0 0 0Program Summary -Net Changes
Add to the TIP the Camp Hill/Great Road Walks project to the TIP. This project includes the Camp Hill Great Road Interpretive History project which involves the installation of bike and pedestrian crosswalks at intersections along Market Street for $74,000 in federal TE funds and the Camp Hill Walks project (MPMS# 77313) which improve sidewalks to & from neighborhood schools for $871,100 of federal TE funds. Federal TE funds of $945,100 are provided from the Secretary's Discretionary Enhancement Program. Estimated let date is June/July 2008.
After FFY Totals
Before FFY TotalsAmendments
Approved by FHWA: Approved by HATS Coordinating Committee: April 25, 2008
RemarksFFY 2009 FFY 2010
Informed HATS Technical Committee: FFY 2008
C718082
FFY 2007Amendment - Highway Fund Type
1 C65933
(s:\planning\mpoldd\hbg\meetings\April2008\hbg 07 tip revisions April 25 2008 MPO meeting.xls) 1 of 1
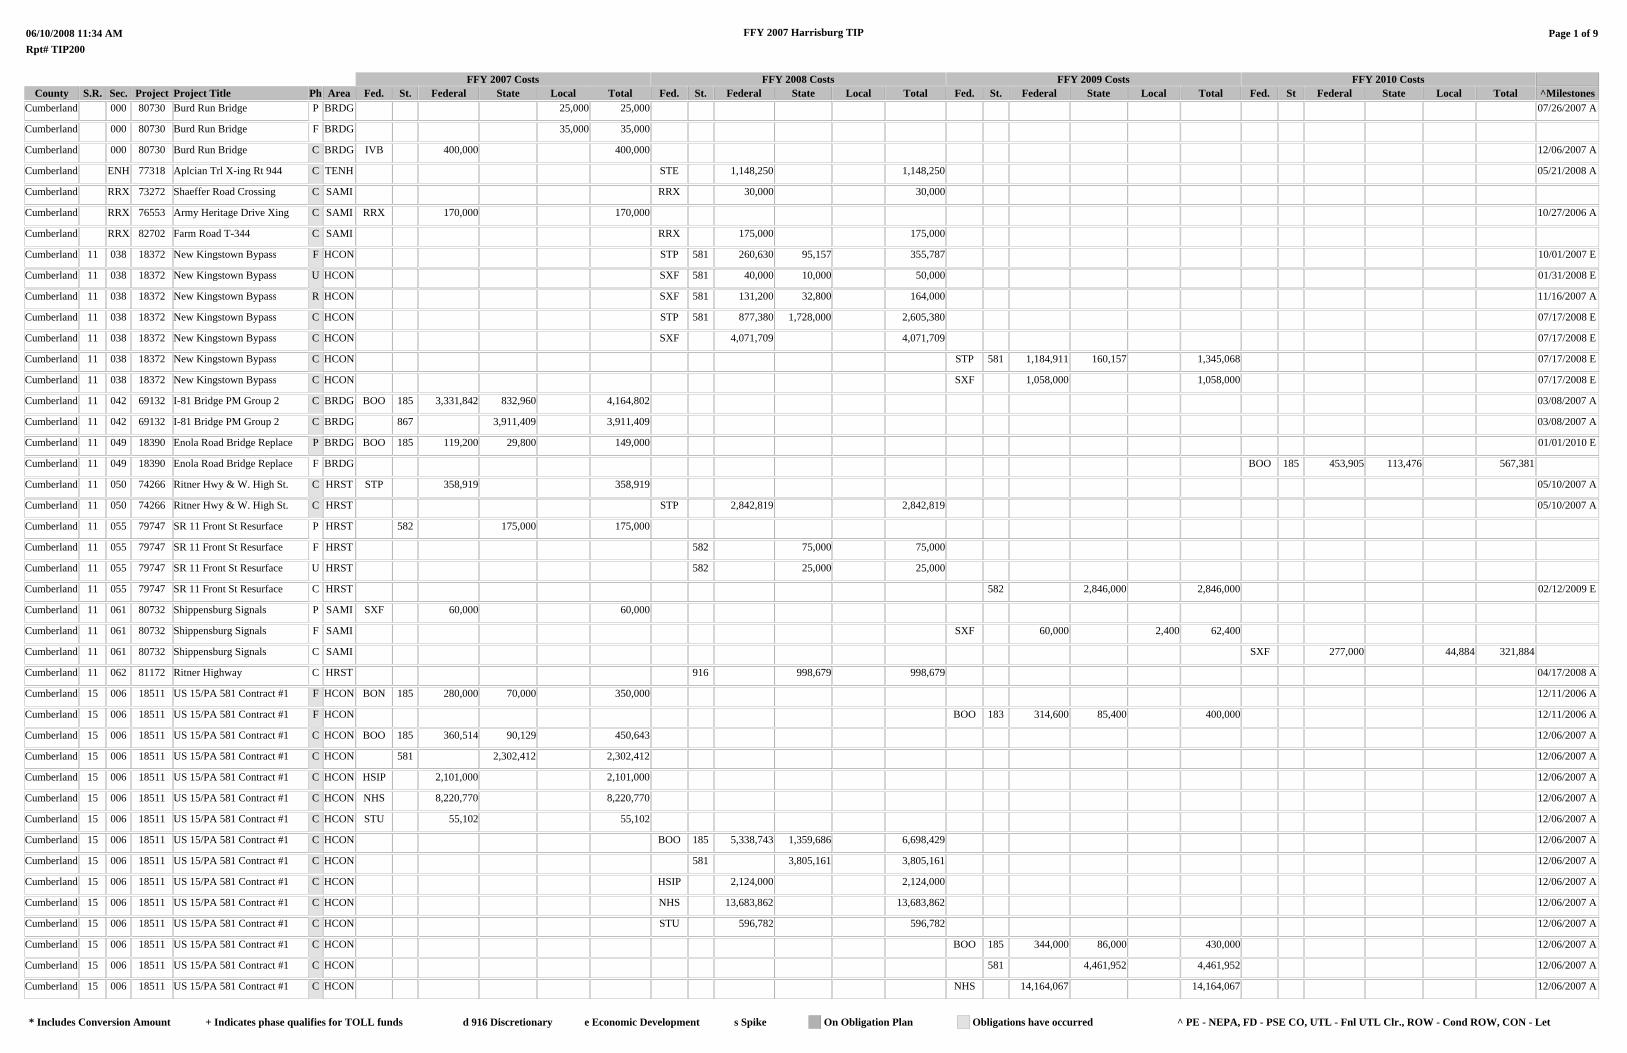
County S.R. Sec. Project
06/10/2008 11:34 AMRpt# TIP200
Project Title Ph AreaFFY 2007 Costs
FFY 2007 Harrisburg TIP
FFY 2008 Costs FFY 2009 Costs FFY 2010 CostsFed. St. Federal State Local Total Fed. St. Federal State Local Total Fed. St. Federal State Local Total Fed. St Federal State Local Total
Page 1 of 9
^MilestonesCumberland 000 80730 Burd Run Bridge P BRDG 25,000 25,000 07/26/2007 A
Cumberland 000 80730 Burd Run Bridge F BRDG 35,000 35,000
Cumberland 000 80730 Burd Run Bridge C BRDG IVB 400,000 400,000 12/06/2007 A
Cumberland ENH 77318 Aplcian Trl X-ing Rt 944 C TENH STE 1,148,250 1,148,250 05/21/2008 A
Cumberland RRX 73272 Shaeffer Road Crossing C SAMI RRX 30,000 30,000
Cumberland RRX 76553 Army Heritage Drive Xing C SAMI RRX 170,000 170,000 10/27/2006 A
Cumberland RRX 82702 Farm Road T-344 C SAMI RRX 175,000 175,000
Cumberland 11 038 18372 New Kingstown Bypass F HCON STP 581 260,630 95,157 355,787 10/01/2007 E
Cumberland 11 038 18372 New Kingstown Bypass U HCON SXF 581 40,000 10,000 50,000 01/31/2008 E
Cumberland 11 038 18372 New Kingstown Bypass R HCON SXF 581 131,200 32,800 164,000 11/16/2007 A
Cumberland 11 038 18372 New Kingstown Bypass C HCON STP 581 877,380 1,728,000 2,605,380 07/17/2008 E
Cumberland 11 038 18372 New Kingstown Bypass C HCON SXF 4,071,709 4,071,709 07/17/2008 E
Cumberland 11 038 18372 New Kingstown Bypass C HCON STP 581 1,184,911 160,157 1,345,068 07/17/2008 E
Cumberland 11 038 18372 New Kingstown Bypass C HCON SXF 1,058,000 1,058,000 07/17/2008 E
Cumberland 11 042 69132 I-81 Bridge PM Group 2 C BRDG BOO 185 3,331,842 832,960 4,164,802 03/08/2007 A
Cumberland 11 042 69132 I-81 Bridge PM Group 2 C BRDG 867 3,911,409 3,911,409 03/08/2007 A
Cumberland 11 049 18390 Enola Road Bridge Replace P BRDG BOO 185 119,200 29,800 149,000 01/01/2010 E
Cumberland 11 049 18390 Enola Road Bridge Replace F BRDG BOO 185 453,905 113,476 567,381
Cumberland 11 050 74266 Ritner Hwy & W. High St. C HRST STP 358,919 358,919 05/10/2007 A
Cumberland 11 050 74266 Ritner Hwy & W. High St. C HRST STP 2,842,819 2,842,819 05/10/2007 A
Cumberland 11 055 79747 SR 11 Front St Resurface P HRST 582 175,000 175,000
Cumberland 11 055 79747 SR 11 Front St Resurface F HRST 582 75,000 75,000
Cumberland 11 055 79747 SR 11 Front St Resurface U HRST 582 25,000 25,000
Cumberland 11 055 79747 SR 11 Front St Resurface C HRST 582 2,846,000 2,846,000 02/12/2009 E
Cumberland 11 061 80732 Shippensburg Signals P SAMI SXF 60,000 60,000
Cumberland 11 061 80732 Shippensburg Signals F SAMI SXF 60,000 2,400 62,400
Cumberland 11 061 80732 Shippensburg Signals C SAMI SXF 277,000 44,884 321,884
Cumberland 11 062 81172 Ritner Highway C HRST 916 998,679 998,679 04/17/2008 A
Cumberland 15 006 18511 US 15/PA 581 Contract #1 F HCON BON 185 280,000 70,000 350,000 12/11/2006 A
Cumberland 15 006 18511 US 15/PA 581 Contract #1 F HCON BOO 183 314,600 85,400 400,000 12/11/2006 A
Cumberland 15 006 18511 US 15/PA 581 Contract #1 C HCON BOO 185 360,514 90,129 450,643 12/06/2007 A
Cumberland 15 006 18511 US 15/PA 581 Contract #1 C HCON 581 2,302,412 2,302,412 12/06/2007 A
Cumberland 15 006 18511 US 15/PA 581 Contract #1 C HCON HSIP 2,101,000 2,101,000 12/06/2007 A
Cumberland 15 006 18511 US 15/PA 581 Contract #1 C HCON NHS 8,220,770 8,220,770 12/06/2007 A
Cumberland 15 006 18511 US 15/PA 581 Contract #1 C HCON STU 55,102 55,102 12/06/2007 A
Cumberland 15 006 18511 US 15/PA 581 Contract #1 C HCON BOO 185 5,338,743 1,359,686 6,698,429 12/06/2007 A
Cumberland 15 006 18511 US 15/PA 581 Contract #1 C HCON 581 3,805,161 3,805,161 12/06/2007 A
Cumberland 15 006 18511 US 15/PA 581 Contract #1 C HCON HSIP 2,124,000 2,124,000 12/06/2007 A
Cumberland 15 006 18511 US 15/PA 581 Contract #1 C HCON NHS 13,683,862 13,683,862 12/06/2007 A
Cumberland 15 006 18511 US 15/PA 581 Contract #1 C HCON STU 596,782 596,782 12/06/2007 A
Cumberland 15 006 18511 US 15/PA 581 Contract #1 C HCON BOO 185 344,000 86,000 430,000 12/06/2007 A
Cumberland 15 006 18511 US 15/PA 581 Contract #1 C HCON 581 4,461,952 4,461,952 12/06/2007 A
Cumberland 15 006 18511 US 15/PA 581 Contract #1 C HCON NHS 14,164,067 14,164,067 12/06/2007 A
^ PE - NEPA, FD - PSE CO, UTL - Fnl UTL Clr., ROW - Cond ROW, CON - Let On Obligation Plan Obligations have occurred* Includes Conversion Amount + Indicates phase qualifies for TOLL funds d 916 Discretionary e Economic Development s Spike
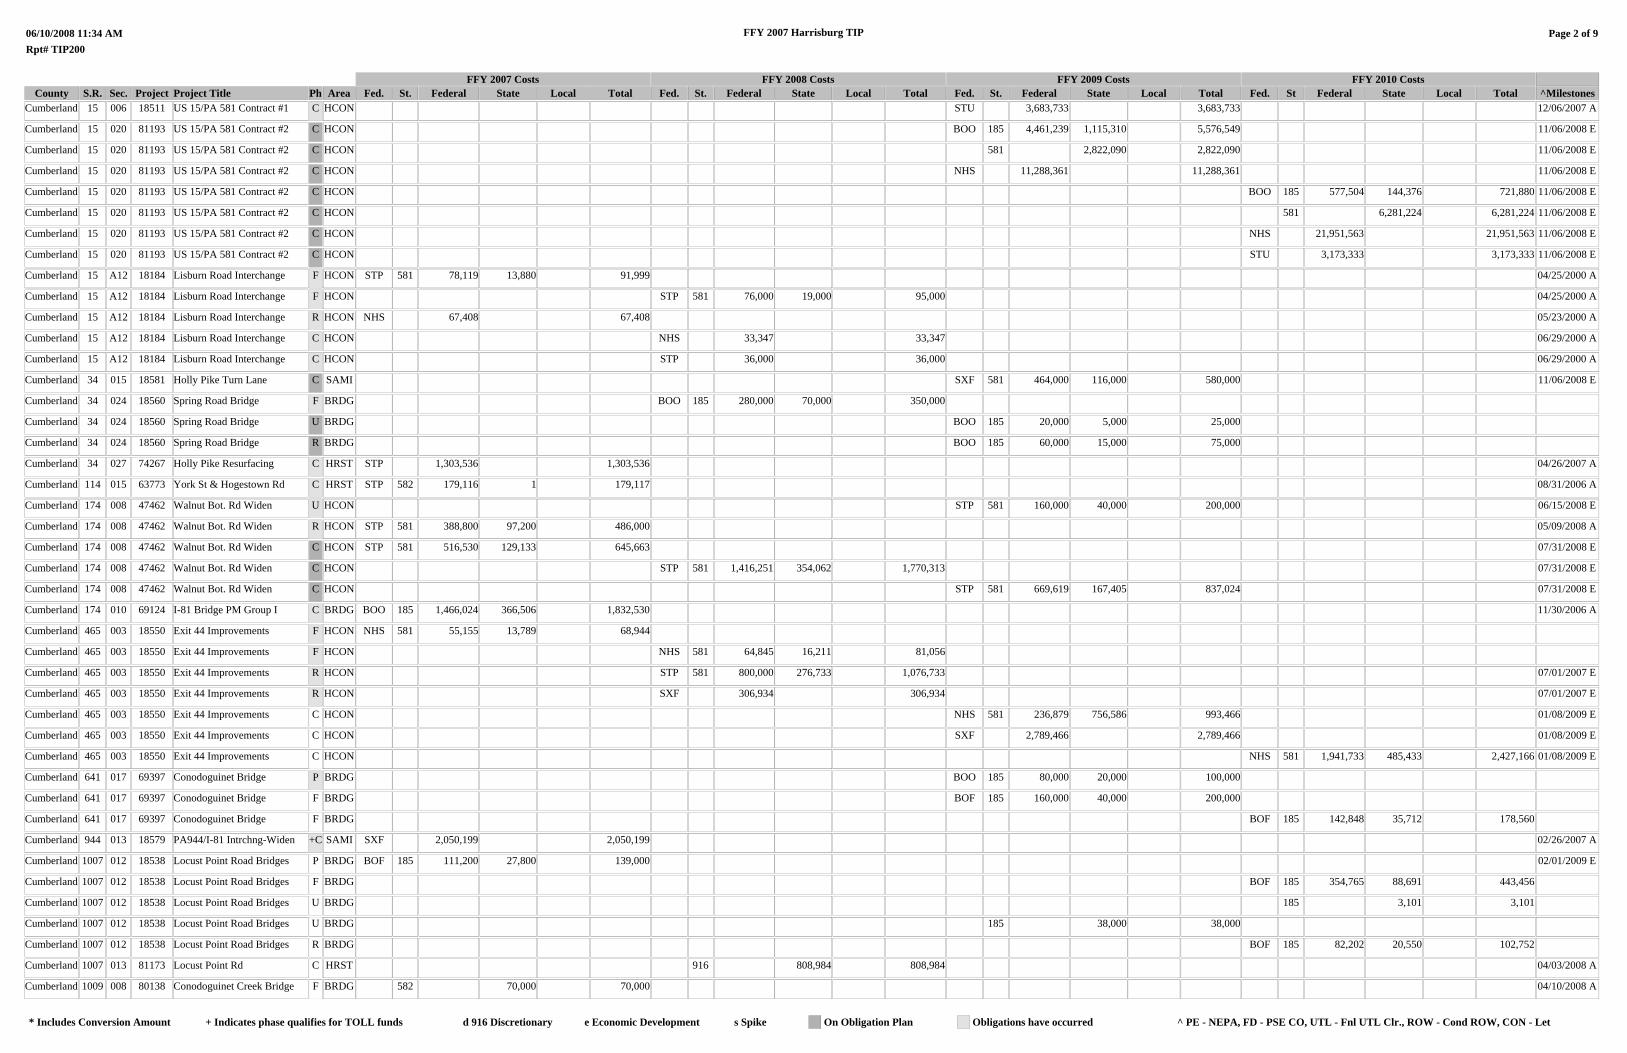
County S.R. Sec. Project
06/10/2008 11:34 AMRpt# TIP200
Project Title Ph AreaFFY 2007 Costs
FFY 2007 Harrisburg TIP
FFY 2008 Costs FFY 2009 Costs FFY 2010 CostsFed. St. Federal State Local Total Fed. St. Federal State Local Total Fed. St. Federal State Local Total Fed. St Federal State Local Total
Page 2 of 9
^MilestonesCumberland 15 006 18511 US 15/PA 581 Contract #1 C HCON STU 3,683,733 3,683,733 12/06/2007 A
Cumberland 15 020 81193 US 15/PA 581 Contract #2 C HCON BOO 185 4,461,239 1,115,310 5,576,549 11/06/2008 E
Cumberland 15 020 81193 US 15/PA 581 Contract #2 C HCON 581 2,822,090 2,822,090 11/06/2008 E
Cumberland 15 020 81193 US 15/PA 581 Contract #2 C HCON NHS 11,288,361 11,288,361 11/06/2008 E
Cumberland 15 020 81193 US 15/PA 581 Contract #2 C HCON BOO 185 577,504 144,376 721,880 11/06/2008 E
Cumberland 15 020 81193 US 15/PA 581 Contract #2 C HCON 581 6,281,224 6,281,224 11/06/2008 E
Cumberland 15 020 81193 US 15/PA 581 Contract #2 C HCON NHS 21,951,563 21,951,563 11/06/2008 E
Cumberland 15 020 81193 US 15/PA 581 Contract #2 C HCON STU 3,173,333 3,173,333 11/06/2008 E
Cumberland 15 A12 18184 Lisburn Road Interchange F HCON STP 581 78,119 13,880 91,999 04/25/2000 A
Cumberland 15 A12 18184 Lisburn Road Interchange F HCON STP 581 76,000 19,000 95,000 04/25/2000 A
Cumberland 15 A12 18184 Lisburn Road Interchange R HCON NHS 67,408 67,408 05/23/2000 A
Cumberland 15 A12 18184 Lisburn Road Interchange C HCON NHS 33,347 33,347 06/29/2000 A
Cumberland 15 A12 18184 Lisburn Road Interchange C HCON STP 36,000 36,000 06/29/2000 A
Cumberland 34 015 18581 Holly Pike Turn Lane C SAMI SXF 581 464,000 116,000 580,000 11/06/2008 E
Cumberland 34 024 18560 Spring Road Bridge F BRDG BOO 185 280,000 70,000 350,000
Cumberland 34 024 18560 Spring Road Bridge U BRDG BOO 185 20,000 5,000 25,000
Cumberland 34 024 18560 Spring Road Bridge R BRDG BOO 185 60,000 15,000 75,000
Cumberland 34 027 74267 Holly Pike Resurfacing C HRST STP 1,303,536 1,303,536 04/26/2007 A
Cumberland 114 015 63773 York St & Hogestown Rd C HRST STP 582 179,116 1 179,117 08/31/2006 A
Cumberland 174 008 47462 Walnut Bot. Rd Widen U HCON STP 581 160,000 40,000 200,000 06/15/2008 E
Cumberland 174 008 47462 Walnut Bot. Rd Widen R HCON STP 581 388,800 97,200 486,000 05/09/2008 A
Cumberland 174 008 47462 Walnut Bot. Rd Widen C HCON STP 581 516,530 129,133 645,663 07/31/2008 E
Cumberland 174 008 47462 Walnut Bot. Rd Widen C HCON STP 581 1,416,251 354,062 1,770,313 07/31/2008 E
Cumberland 174 008 47462 Walnut Bot. Rd Widen C HCON STP 581 669,619 167,405 837,024 07/31/2008 E
Cumberland 174 010 69124 I-81 Bridge PM Group I C BRDG BOO 185 1,466,024 366,506 1,832,530 11/30/2006 A
Cumberland 465 003 18550 Exit 44 Improvements F HCON NHS 581 55,155 13,789 68,944
Cumberland 465 003 18550 Exit 44 Improvements F HCON NHS 581 64,845 16,211 81,056
Cumberland 465 003 18550 Exit 44 Improvements R HCON STP 581 800,000 276,733 1,076,733 07/01/2007 E
Cumberland 465 003 18550 Exit 44 Improvements R HCON SXF 306,934 306,934 07/01/2007 E
Cumberland 465 003 18550 Exit 44 Improvements C HCON NHS 581 236,879 756,586 993,466 01/08/2009 E
Cumberland 465 003 18550 Exit 44 Improvements C HCON SXF 2,789,466 2,789,466 01/08/2009 E
Cumberland 465 003 18550 Exit 44 Improvements C HCON NHS 581 1,941,733 485,433 2,427,166 01/08/2009 E
Cumberland 641 017 69397 Conodoguinet Bridge P BRDG BOO 185 80,000 20,000 100,000
Cumberland 641 017 69397 Conodoguinet Bridge F BRDG BOF 185 160,000 40,000 200,000
Cumberland 641 017 69397 Conodoguinet Bridge F BRDG BOF 185 142,848 35,712 178,560
Cumberland 944 013 18579 PA944/I-81 Intrchng-Widen +C SAMI SXF 2,050,199 2,050,199 02/26/2007 A
Cumberland 1007 012 18538 Locust Point Road Bridges P BRDG BOF 185 111,200 27,800 139,000 02/01/2009 E
Cumberland 1007 012 18538 Locust Point Road Bridges F BRDG BOF 185 354,765 88,691 443,456
Cumberland 1007 012 18538 Locust Point Road Bridges U BRDG 185 3,101 3,101
Cumberland 1007 012 18538 Locust Point Road Bridges U BRDG 185 38,000 38,000
Cumberland 1007 012 18538 Locust Point Road Bridges R BRDG BOF 185 82,202 20,550 102,752
Cumberland 1007 013 81173 Locust Point Rd C HRST 916 808,984 808,984 04/03/2008 A
Cumberland 1009 008 80138 Conodoguinet Creek Bridge F BRDG 582 70,000 70,000 04/10/2008 A
^ PE - NEPA, FD - PSE CO, UTL - Fnl UTL Clr., ROW - Cond ROW, CON - Let On Obligation Plan Obligations have occurred* Includes Conversion Amount + Indicates phase qualifies for TOLL funds d 916 Discretionary e Economic Development s Spike
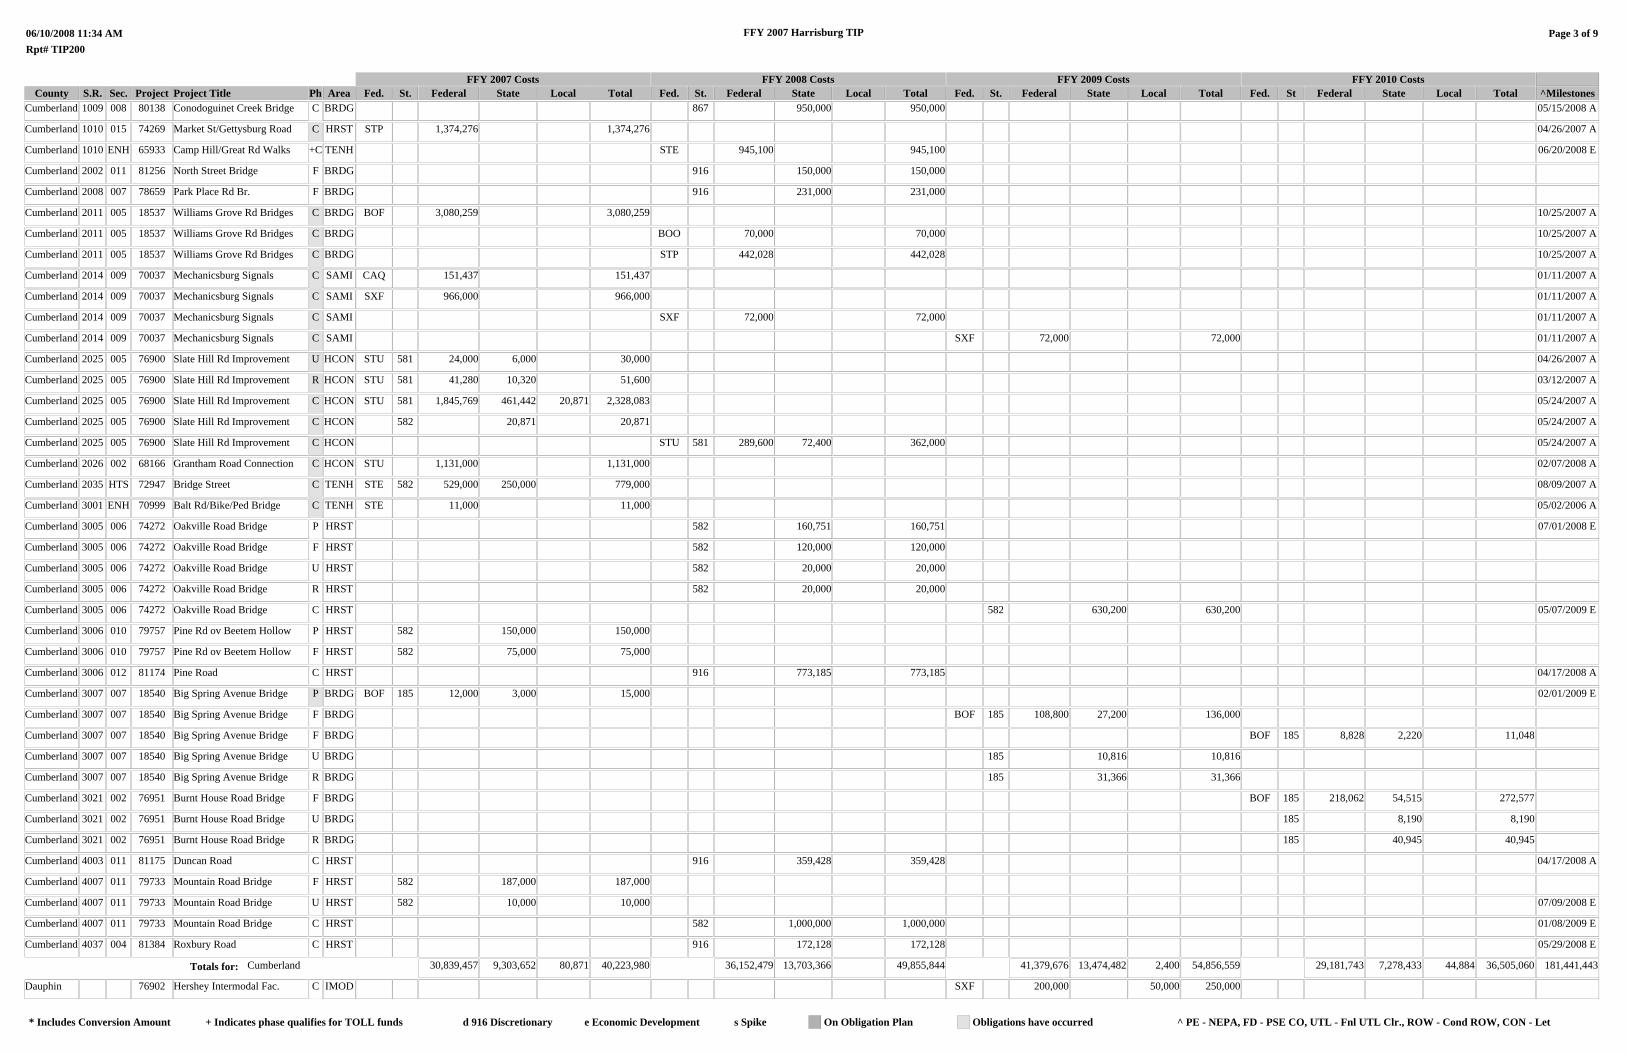
County S.R. Sec. Project
06/10/2008 11:34 AMRpt# TIP200
Project Title Ph AreaFFY 2007 Costs
FFY 2007 Harrisburg TIP
FFY 2008 Costs FFY 2009 Costs FFY 2010 CostsFed. St. Federal State Local Total Fed. St. Federal State Local Total Fed. St. Federal State Local Total Fed. St Federal State Local Total
Page 3 of 9
^MilestonesCumberland 1009 008 80138 Conodoguinet Creek Bridge C BRDG 867 950,000 950,000 05/15/2008 A
Cumberland 1010 015 74269 Market St/Gettysburg Road C HRST STP 1,374,276 1,374,276 04/26/2007 A
Cumberland 1010 ENH 65933 Camp Hill/Great Rd Walks +C TENH STE 945,100 945,100 06/20/2008 E
Cumberland 2002 011 81256 North Street Bridge F BRDG 916 150,000 150,000
Cumberland 2008 007 78659 Park Place Rd Br. F BRDG 916 231,000 231,000
Cumberland 2011 005 18537 Williams Grove Rd Bridges C BRDG BOF 3,080,259 3,080,259 10/25/2007 A
Cumberland 2011 005 18537 Williams Grove Rd Bridges C BRDG BOO 70,000 70,000 10/25/2007 A
Cumberland 2011 005 18537 Williams Grove Rd Bridges C BRDG STP 442,028 442,028 10/25/2007 A
Cumberland 2014 009 70037 Mechanicsburg Signals C SAMI CAQ 151,437 151,437 01/11/2007 A
Cumberland 2014 009 70037 Mechanicsburg Signals C SAMI SXF 966,000 966,000 01/11/2007 A
Cumberland 2014 009 70037 Mechanicsburg Signals C SAMI SXF 72,000 72,000 01/11/2007 A
Cumberland 2014 009 70037 Mechanicsburg Signals C SAMI SXF 72,000 72,000 01/11/2007 A
Cumberland 2025 005 76900 Slate Hill Rd Improvement U HCON STU 581 24,000 6,000 30,000 04/26/2007 A
Cumberland 2025 005 76900 Slate Hill Rd Improvement R HCON STU 581 41,280 10,320 51,600 03/12/2007 A
Cumberland 2025 005 76900 Slate Hill Rd Improvement C HCON STU 581 1,845,769 461,442 20,871 2,328,083 05/24/2007 A
Cumberland 2025 005 76900 Slate Hill Rd Improvement C HCON 582 20,871 20,871 05/24/2007 A
Cumberland 2025 005 76900 Slate Hill Rd Improvement C HCON STU 581 289,600 72,400 362,000 05/24/2007 A
Cumberland 2026 002 68166 Grantham Road Connection C HCON STU 1,131,000 1,131,000 02/07/2008 A
Cumberland 2035 HTS 72947 Bridge Street C TENH STE 582 529,000 250,000 779,000 08/09/2007 A
Cumberland 3001 ENH 70999 Balt Rd/Bike/Ped Bridge C TENH STE 11,000 11,000 05/02/2006 A
Cumberland 3005 006 74272 Oakville Road Bridge P HRST 582 160,751 160,751 07/01/2008 E
Cumberland 3005 006 74272 Oakville Road Bridge F HRST 582 120,000 120,000
Cumberland 3005 006 74272 Oakville Road Bridge U HRST 582 20,000 20,000
Cumberland 3005 006 74272 Oakville Road Bridge R HRST 582 20,000 20,000
Cumberland 3005 006 74272 Oakville Road Bridge C HRST 582 630,200 630,200 05/07/2009 E
Cumberland 3006 010 79757 Pine Rd ov Beetem Hollow P HRST 582 150,000 150,000
Cumberland 3006 010 79757 Pine Rd ov Beetem Hollow F HRST 582 75,000 75,000
Cumberland 3006 012 81174 Pine Road C HRST 916 773,185 773,185 04/17/2008 A
Cumberland 3007 007 18540 Big Spring Avenue Bridge P BRDG BOF 185 12,000 3,000 15,000 02/01/2009 E
Cumberland 3007 007 18540 Big Spring Avenue Bridge F BRDG BOF 185 108,800 27,200 136,000
Cumberland 3007 007 18540 Big Spring Avenue Bridge F BRDG BOF 185 8,828 2,220 11,048
Cumberland 3007 007 18540 Big Spring Avenue Bridge U BRDG 185 10,816 10,816
Cumberland 3007 007 18540 Big Spring Avenue Bridge R BRDG 185 31,366 31,366
Cumberland 3021 002 76951 Burnt House Road Bridge F BRDG BOF 185 218,062 54,515 272,577
Cumberland 3021 002 76951 Burnt House Road Bridge U BRDG 185 8,190 8,190
Cumberland 3021 002 76951 Burnt House Road Bridge R BRDG 185 40,945 40,945
Cumberland 4003 011 81175 Duncan Road C HRST 916 359,428 359,428 04/17/2008 A
Cumberland 4007 011 79733 Mountain Road Bridge F HRST 582 187,000 187,000
Cumberland 4007 011 79733 Mountain Road Bridge U HRST 582 10,000 10,000 07/09/2008 E
Cumberland 4007 011 79733 Mountain Road Bridge C HRST 582 1,000,000 1,000,000 01/08/2009 E
Cumberland 4037 004 81384 Roxbury Road C HRST 916 172,128 172,128 05/29/2008 E
Totals for: Cumberland 30,839,457 9,303,652 80,871 40,223,980 36,152,479 13,703,366 49,855,844 41,379,676 13,474,482 2,400 54,856,559 29,181,743 7,278,433 44,884 36,505,060 181,441,443
Dauphin 76902 Hershey Intermodal Fac. C IMOD SXF 200,000 50,000 250,000
^ PE - NEPA, FD - PSE CO, UTL - Fnl UTL Clr., ROW - Cond ROW, CON - Let On Obligation Plan Obligations have occurred* Includes Conversion Amount + Indicates phase qualifies for TOLL funds d 916 Discretionary e Economic Development s Spike
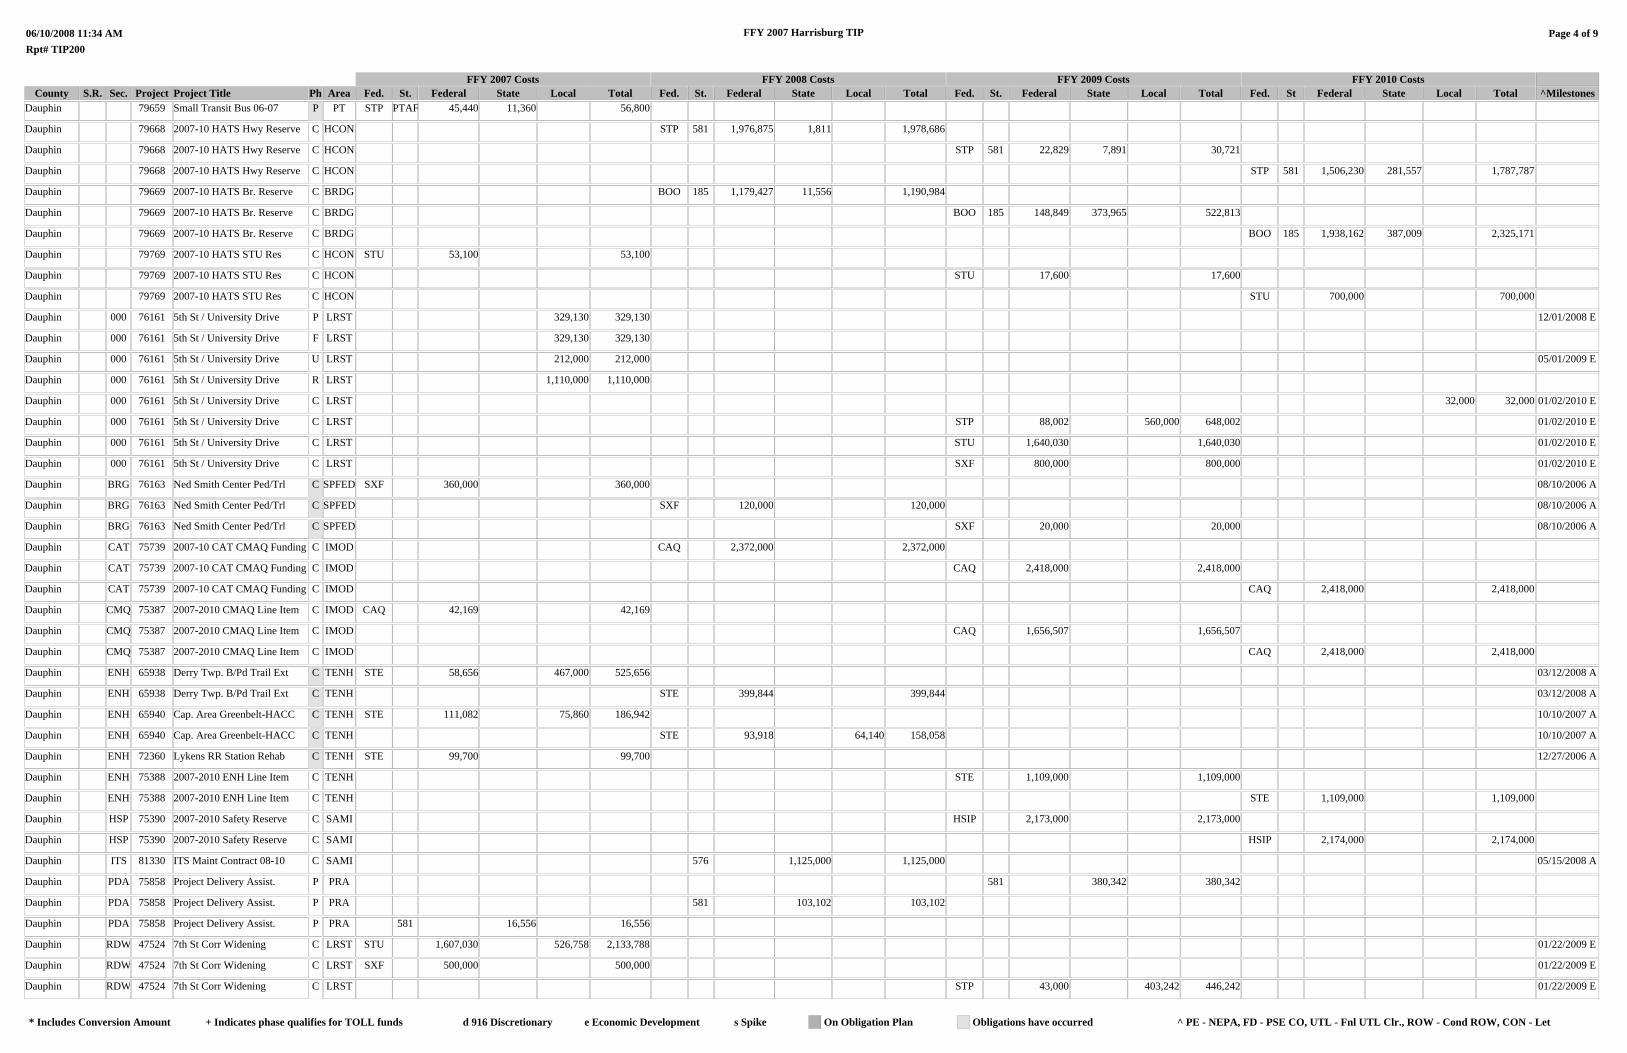
County S.R. Sec. Project
06/10/2008 11:34 AMRpt# TIP200
Project Title Ph AreaFFY 2007 Costs
FFY 2007 Harrisburg TIP
FFY 2008 Costs FFY 2009 Costs FFY 2010 CostsFed. St. Federal State Local Total Fed. St. Federal State Local Total Fed. St. Federal State Local Total Fed. St Federal State Local Total
Page 4 of 9
^MilestonesDauphin 79659 Small Transit Bus 06-07 P PT STP PTAF 45,440 11,360 56,800
Dauphin 79668 2007-10 HATS Hwy Reserve C HCON STP 581 1,976,875 1,811 1,978,686
Dauphin 79668 2007-10 HATS Hwy Reserve C HCON STP 581 22,829 7,891 30,721
Dauphin 79668 2007-10 HATS Hwy Reserve C HCON STP 581 1,506,230 281,557 1,787,787
Dauphin 79669 2007-10 HATS Br. Reserve C BRDG BOO 185 1,179,427 11,556 1,190,984
Dauphin 79669 2007-10 HATS Br. Reserve C BRDG BOO 185 148,849 373,965 522,813
Dauphin 79669 2007-10 HATS Br. Reserve C BRDG BOO 185 1,938,162 387,009 2,325,171
Dauphin 79769 2007-10 HATS STU Res C HCON STU 53,100 53,100
Dauphin 79769 2007-10 HATS STU Res C HCON STU 17,600 17,600
Dauphin 79769 2007-10 HATS STU Res C HCON STU 700,000 700,000
Dauphin 000 76161 5th St / University Drive P LRST 329,130 329,130 12/01/2008 E
Dauphin 000 76161 5th St / University Drive F LRST 329,130 329,130
Dauphin 000 76161 5th St / University Drive U LRST 212,000 212,000 05/01/2009 E
Dauphin 000 76161 5th St / University Drive R LRST 1,110,000 1,110,000
Dauphin 000 76161 5th St / University Drive C LRST 32,000 32,000 01/02/2010 E
Dauphin 000 76161 5th St / University Drive C LRST STP 88,002 560,000 648,002 01/02/2010 E
Dauphin 000 76161 5th St / University Drive C LRST STU 1,640,030 1,640,030 01/02/2010 E
Dauphin 000 76161 5th St / University Drive C LRST SXF 800,000 800,000 01/02/2010 E
Dauphin BRG 76163 Ned Smith Center Ped/Trl C SPFED SXF 360,000 360,000 08/10/2006 A
Dauphin BRG 76163 Ned Smith Center Ped/Trl C SPFED SXF 120,000 120,000 08/10/2006 A
Dauphin BRG 76163 Ned Smith Center Ped/Trl C SPFED SXF 20,000 20,000 08/10/2006 A
Dauphin CAT 75739 2007-10 CAT CMAQ Funding C IMOD CAQ 2,372,000 2,372,000
Dauphin CAT 75739 2007-10 CAT CMAQ Funding C IMOD CAQ 2,418,000 2,418,000
Dauphin CAT 75739 2007-10 CAT CMAQ Funding C IMOD CAQ 2,418,000 2,418,000
Dauphin CMQ 75387 2007-2010 CMAQ Line Item C IMOD CAQ 42,169 42,169
Dauphin CMQ 75387 2007-2010 CMAQ Line Item C IMOD CAQ 1,656,507 1,656,507
Dauphin CMQ 75387 2007-2010 CMAQ Line Item C IMOD CAQ 2,418,000 2,418,000
Dauphin ENH 65938 Derry Twp. B/Pd Trail Ext C TENH STE 58,656 467,000 525,656 03/12/2008 A
Dauphin ENH 65938 Derry Twp. B/Pd Trail Ext C TENH STE 399,844 399,844 03/12/2008 A
Dauphin ENH 65940 Cap. Area Greenbelt-HACC C TENH STE 111,082 75,860 186,942 10/10/2007 A
Dauphin ENH 65940 Cap. Area Greenbelt-HACC C TENH STE 93,918 64,140 158,058 10/10/2007 A
Dauphin ENH 72360 Lykens RR Station Rehab C TENH STE 99,700 99,700 12/27/2006 A
Dauphin ENH 75388 2007-2010 ENH Line Item C TENH STE 1,109,000 1,109,000
Dauphin ENH 75388 2007-2010 ENH Line Item C TENH STE 1,109,000 1,109,000
Dauphin HSP 75390 2007-2010 Safety Reserve C SAMI HSIP 2,173,000 2,173,000
Dauphin HSP 75390 2007-2010 Safety Reserve C SAMI HSIP 2,174,000 2,174,000
Dauphin ITS 81330 ITS Maint Contract 08-10 C SAMI 576 1,125,000 1,125,000 05/15/2008 A
Dauphin PDA 75858 Project Delivery Assist. P PRA 581 380,342 380,342
Dauphin PDA 75858 Project Delivery Assist. P PRA 581 103,102 103,102
Dauphin PDA 75858 Project Delivery Assist. P PRA 581 16,556 16,556
Dauphin RDW 47524 7th St Corr Widening C LRST STU 1,607,030 526,758 2,133,788 01/22/2009 E
Dauphin RDW 47524 7th St Corr Widening C LRST SXF 500,000 500,000 01/22/2009 E
Dauphin RDW 47524 7th St Corr Widening C LRST STP 43,000 403,242 446,242 01/22/2009 E
^ PE - NEPA, FD - PSE CO, UTL - Fnl UTL Clr., ROW - Cond ROW, CON - Let On Obligation Plan Obligations have occurred* Includes Conversion Amount + Indicates phase qualifies for TOLL funds d 916 Discretionary e Economic Development s Spike
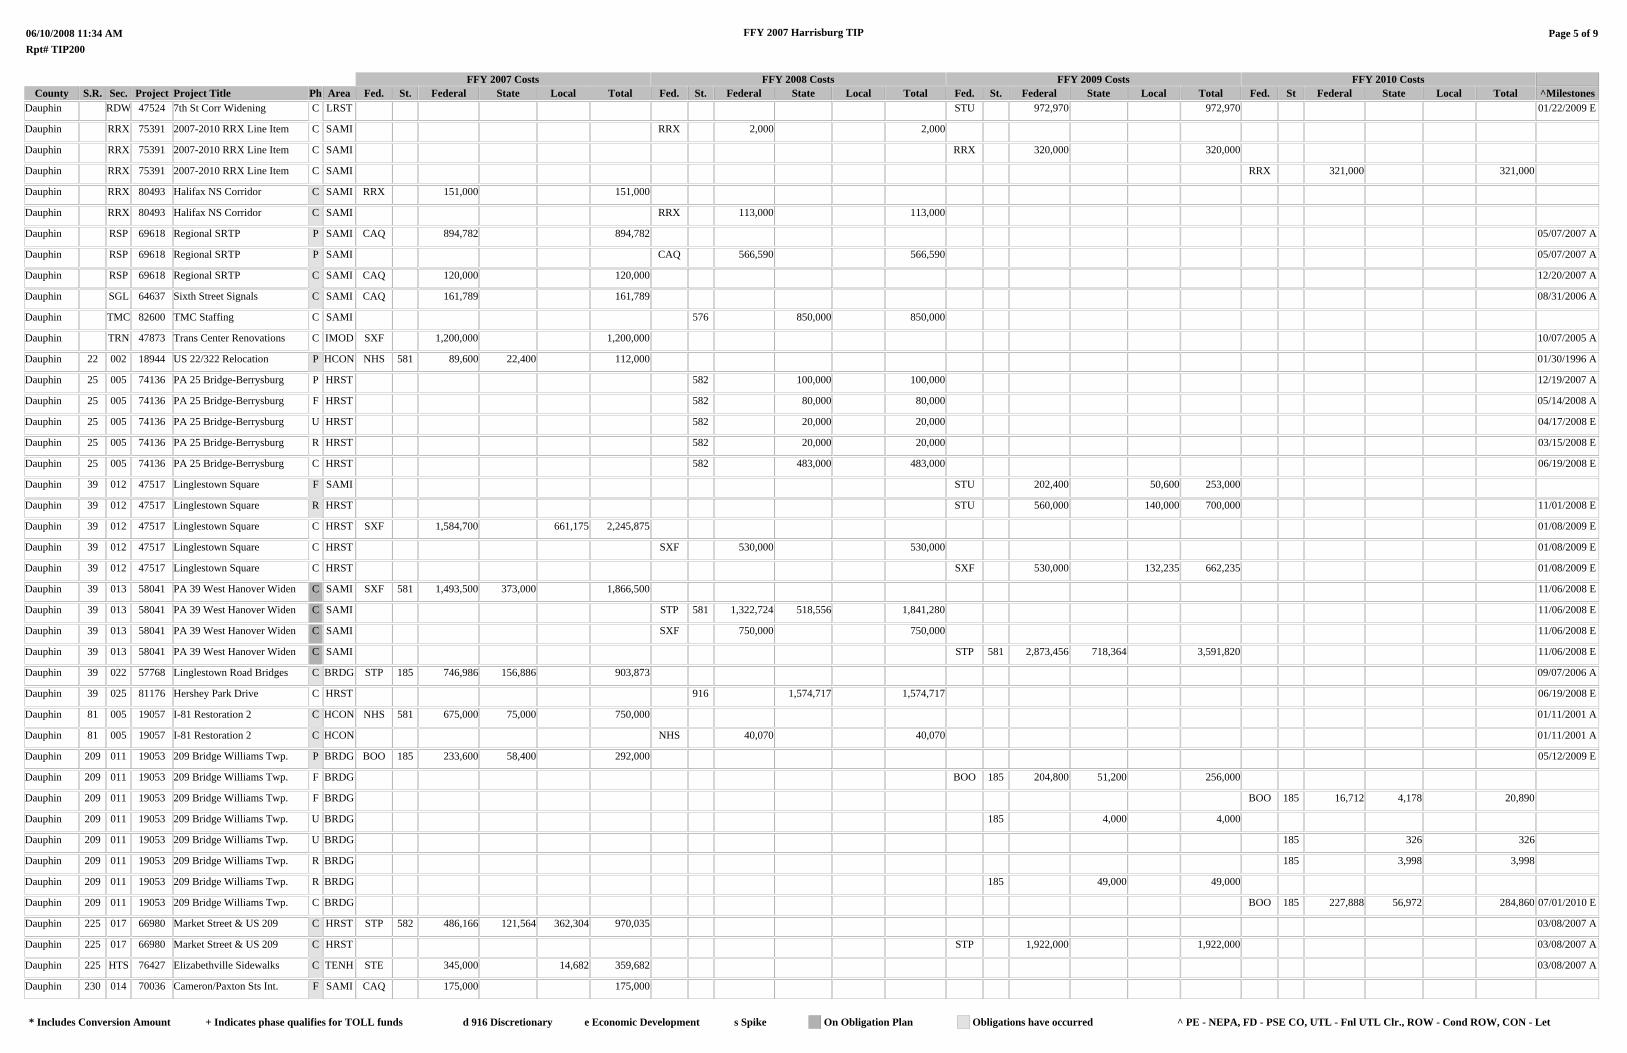
County S.R. Sec. Project
06/10/2008 11:34 AMRpt# TIP200
Project Title Ph AreaFFY 2007 Costs
FFY 2007 Harrisburg TIP
FFY 2008 Costs FFY 2009 Costs FFY 2010 CostsFed. St. Federal State Local Total Fed. St. Federal State Local Total Fed. St. Federal State Local Total Fed. St Federal State Local Total
Page 5 of 9
^MilestonesDauphin RDW 47524 7th St Corr Widening C LRST STU 972,970 972,970 01/22/2009 E
Dauphin RRX 75391 2007-2010 RRX Line Item C SAMI RRX 2,000 2,000
Dauphin RRX 75391 2007-2010 RRX Line Item C SAMI RRX 320,000 320,000
Dauphin RRX 75391 2007-2010 RRX Line Item C SAMI RRX 321,000 321,000
Dauphin RRX 80493 Halifax NS Corridor C SAMI RRX 151,000 151,000
Dauphin RRX 80493 Halifax NS Corridor C SAMI RRX 113,000 113,000
Dauphin RSP 69618 Regional SRTP P SAMI CAQ 894,782 894,782 05/07/2007 A
Dauphin RSP 69618 Regional SRTP P SAMI CAQ 566,590 566,590 05/07/2007 A
Dauphin RSP 69618 Regional SRTP C SAMI CAQ 120,000 120,000 12/20/2007 A
Dauphin SGL 64637 Sixth Street Signals C SAMI CAQ 161,789 161,789 08/31/2006 A
Dauphin TMC 82600 TMC Staffing C SAMI 576 850,000 850,000
Dauphin TRN 47873 Trans Center Renovations C IMOD SXF 1,200,000 1,200,000 10/07/2005 A
Dauphin 22 002 18944 US 22/322 Relocation P HCON NHS 581 89,600 22,400 112,000 01/30/1996 A
Dauphin 25 005 74136 PA 25 Bridge-Berrysburg P HRST 582 100,000 100,000 12/19/2007 A
Dauphin 25 005 74136 PA 25 Bridge-Berrysburg F HRST 582 80,000 80,000 05/14/2008 A
Dauphin 25 005 74136 PA 25 Bridge-Berrysburg U HRST 582 20,000 20,000 04/17/2008 E
Dauphin 25 005 74136 PA 25 Bridge-Berrysburg R HRST 582 20,000 20,000 03/15/2008 E
Dauphin 25 005 74136 PA 25 Bridge-Berrysburg C HRST 582 483,000 483,000 06/19/2008 E
Dauphin 39 012 47517 Linglestown Square F SAMI STU 202,400 50,600 253,000
Dauphin 39 012 47517 Linglestown Square R HRST STU 560,000 140,000 700,000 11/01/2008 E
Dauphin 39 012 47517 Linglestown Square C HRST SXF 1,584,700 661,175 2,245,875 01/08/2009 E
Dauphin 39 012 47517 Linglestown Square C HRST SXF 530,000 530,000 01/08/2009 E
Dauphin 39 012 47517 Linglestown Square C HRST SXF 530,000 132,235 662,235 01/08/2009 E
Dauphin 39 013 58041 PA 39 West Hanover Widen C SAMI SXF 581 1,493,500 373,000 1,866,500 11/06/2008 E
Dauphin 39 013 58041 PA 39 West Hanover Widen C SAMI STP 581 1,322,724 518,556 1,841,280 11/06/2008 E
Dauphin 39 013 58041 PA 39 West Hanover Widen C SAMI SXF 750,000 750,000 11/06/2008 E
Dauphin 39 013 58041 PA 39 West Hanover Widen C SAMI STP 581 2,873,456 718,364 3,591,820 11/06/2008 E
Dauphin 39 022 57768 Linglestown Road Bridges C BRDG STP 185 746,986 156,886 903,873 09/07/2006 A
Dauphin 39 025 81176 Hershey Park Drive C HRST 916 1,574,717 1,574,717 06/19/2008 E
Dauphin 81 005 19057 I-81 Restoration 2 C HCON NHS 581 675,000 75,000 750,000 01/11/2001 A
Dauphin 81 005 19057 I-81 Restoration 2 C HCON NHS 40,070 40,070 01/11/2001 A
Dauphin 209 011 19053 209 Bridge Williams Twp. P BRDG BOO 185 233,600 58,400 292,000 05/12/2009 E
Dauphin 209 011 19053 209 Bridge Williams Twp. F BRDG BOO 185 204,800 51,200 256,000
Dauphin 209 011 19053 209 Bridge Williams Twp. F BRDG BOO 185 16,712 4,178 20,890
Dauphin 209 011 19053 209 Bridge Williams Twp. U BRDG 185 4,000 4,000
Dauphin 209 011 19053 209 Bridge Williams Twp. U BRDG 185 326 326
Dauphin 209 011 19053 209 Bridge Williams Twp. R BRDG 185 3,998 3,998
Dauphin 209 011 19053 209 Bridge Williams Twp. R BRDG 185 49,000 49,000
Dauphin 209 011 19053 209 Bridge Williams Twp. C BRDG BOO 185 227,888 56,972 284,860 07/01/2010 E
Dauphin 225 017 66980 Market Street & US 209 C HRST STP 582 486,166 121,564 362,304 970,035 03/08/2007 A
Dauphin 225 017 66980 Market Street & US 209 C HRST STP 1,922,000 1,922,000 03/08/2007 A
Dauphin 225 HTS 76427 Elizabethville Sidewalks C TENH STE 345,000 14,682 359,682 03/08/2007 A
Dauphin 230 014 70036 Cameron/Paxton Sts Int. F SAMI CAQ 175,000 175,000
^ PE - NEPA, FD - PSE CO, UTL - Fnl UTL Clr., ROW - Cond ROW, CON - Let On Obligation Plan Obligations have occurred* Includes Conversion Amount + Indicates phase qualifies for TOLL funds d 916 Discretionary e Economic Development s Spike
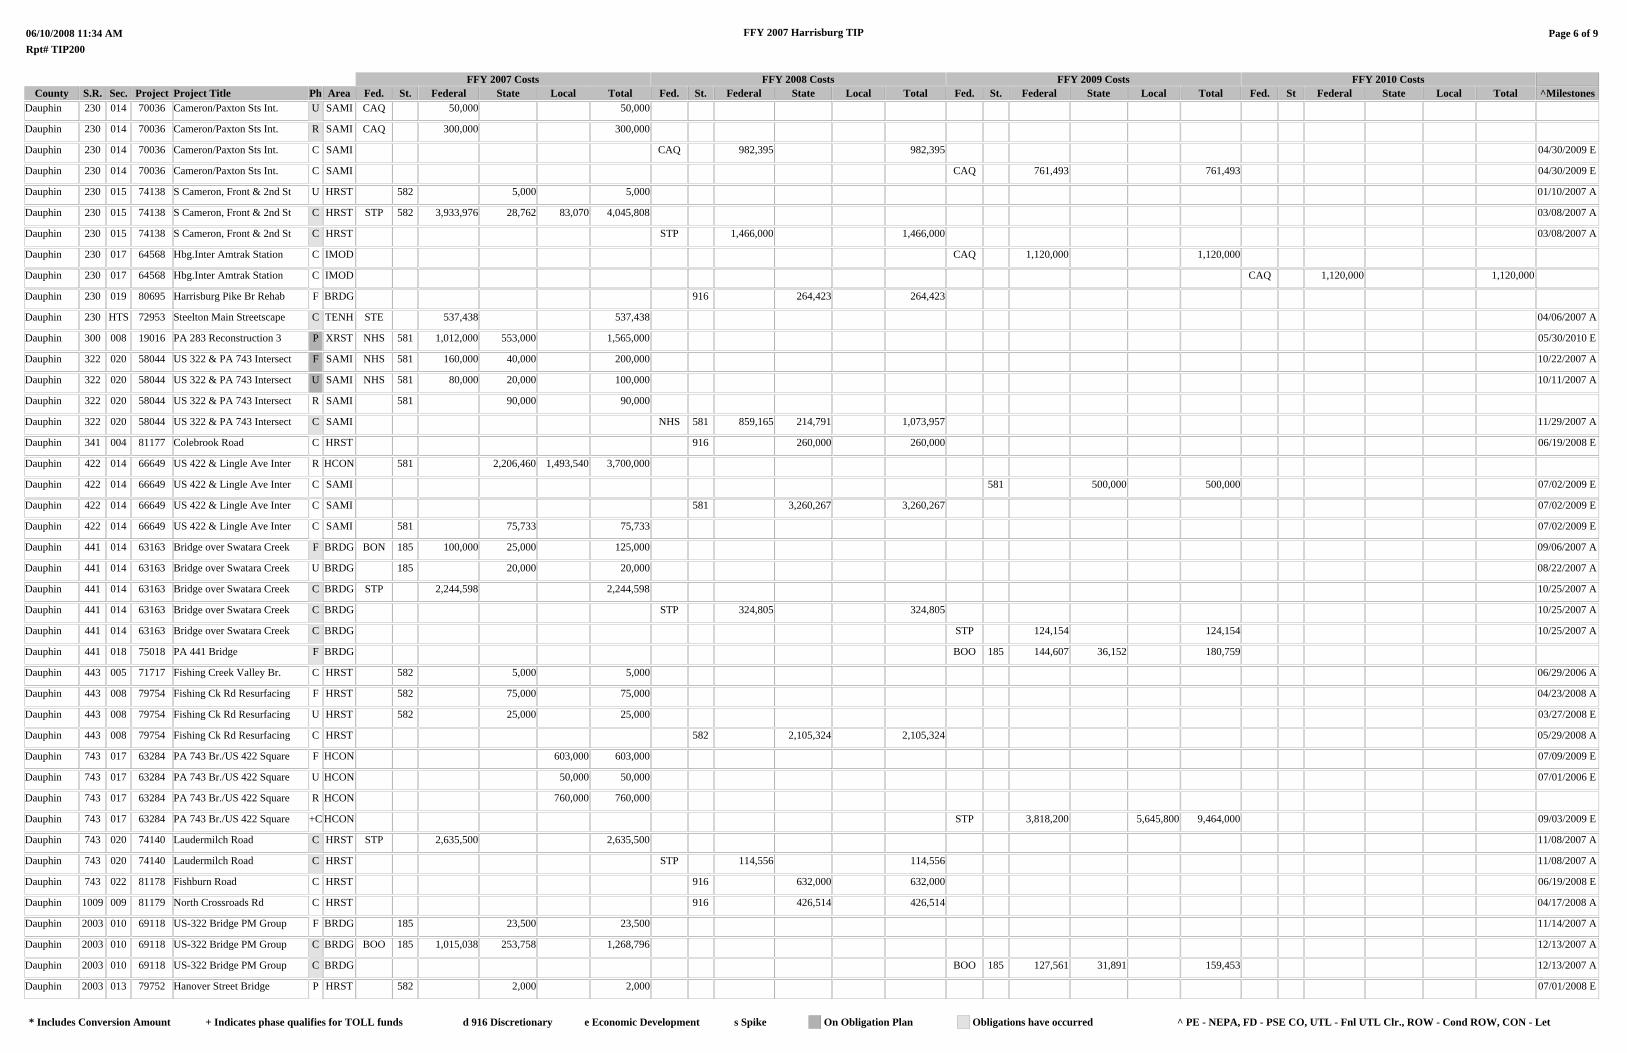
County S.R. Sec. Project
06/10/2008 11:34 AMRpt# TIP200
Project Title Ph AreaFFY 2007 Costs
FFY 2007 Harrisburg TIP
FFY 2008 Costs FFY 2009 Costs FFY 2010 CostsFed. St. Federal State Local Total Fed. St. Federal State Local Total Fed. St. Federal State Local Total Fed. St Federal State Local Total
Page 6 of 9
^MilestonesDauphin 230 014 70036 Cameron/Paxton Sts Int. U SAMI CAQ 50,000 50,000
Dauphin 230 014 70036 Cameron/Paxton Sts Int. R SAMI CAQ 300,000 300,000
Dauphin 230 014 70036 Cameron/Paxton Sts Int. C SAMI CAQ 982,395 982,395 04/30/2009 E
Dauphin 230 014 70036 Cameron/Paxton Sts Int. C SAMI CAQ 761,493 761,493 04/30/2009 E
Dauphin 230 015 74138 S Cameron, Front & 2nd St U HRST 582 5,000 5,000 01/10/2007 A
Dauphin 230 015 74138 S Cameron, Front & 2nd St C HRST STP 582 3,933,976 28,762 83,070 4,045,808 03/08/2007 A
Dauphin 230 015 74138 S Cameron, Front & 2nd St C HRST STP 1,466,000 1,466,000 03/08/2007 A
Dauphin 230 017 64568 Hbg.Inter Amtrak Station C IMOD CAQ 1,120,000 1,120,000
Dauphin 230 017 64568 Hbg.Inter Amtrak Station C IMOD CAQ 1,120,000 1,120,000
Dauphin 230 019 80695 Harrisburg Pike Br Rehab F BRDG 916 264,423 264,423
Dauphin 230 HTS 72953 Steelton Main Streetscape C TENH STE 537,438 537,438 04/06/2007 A
Dauphin 300 008 19016 PA 283 Reconstruction 3 P XRST NHS 581 1,012,000 553,000 1,565,000 05/30/2010 E
Dauphin 322 020 58044 US 322 & PA 743 Intersect F SAMI NHS 581 160,000 40,000 200,000 10/22/2007 A
Dauphin 322 020 58044 US 322 & PA 743 Intersect U SAMI NHS 581 80,000 20,000 100,000 10/11/2007 A
Dauphin 322 020 58044 US 322 & PA 743 Intersect R SAMI 581 90,000 90,000
Dauphin 322 020 58044 US 322 & PA 743 Intersect C SAMI NHS 581 859,165 214,791 1,073,957 11/29/2007 A
Dauphin 341 004 81177 Colebrook Road C HRST 916 260,000 260,000 06/19/2008 E
Dauphin 422 014 66649 US 422 & Lingle Ave Inter R HCON 581 2,206,460 1,493,540 3,700,000
Dauphin 422 014 66649 US 422 & Lingle Ave Inter C SAMI 581 500,000 500,000 07/02/2009 E
Dauphin 422 014 66649 US 422 & Lingle Ave Inter C SAMI 581 3,260,267 3,260,267 07/02/2009 E
Dauphin 422 014 66649 US 422 & Lingle Ave Inter C SAMI 581 75,733 75,733 07/02/2009 E
Dauphin 441 014 63163 Bridge over Swatara Creek F BRDG BON 185 100,000 25,000 125,000 09/06/2007 A
Dauphin 441 014 63163 Bridge over Swatara Creek U BRDG 185 20,000 20,000 08/22/2007 A
Dauphin 441 014 63163 Bridge over Swatara Creek C BRDG STP 2,244,598 2,244,598 10/25/2007 A
Dauphin 441 014 63163 Bridge over Swatara Creek C BRDG STP 324,805 324,805 10/25/2007 A
Dauphin 441 014 63163 Bridge over Swatara Creek C BRDG STP 124,154 124,154 10/25/2007 A
Dauphin 441 018 75018 PA 441 Bridge F BRDG BOO 185 144,607 36,152 180,759
Dauphin 443 005 71717 Fishing Creek Valley Br. C HRST 582 5,000 5,000 06/29/2006 A
Dauphin 443 008 79754 Fishing Ck Rd Resurfacing F HRST 582 75,000 75,000 04/23/2008 A
Dauphin 443 008 79754 Fishing Ck Rd Resurfacing U HRST 582 25,000 25,000 03/27/2008 E
Dauphin 443 008 79754 Fishing Ck Rd Resurfacing C HRST 582 2,105,324 2,105,324 05/29/2008 A
Dauphin 743 017 63284 PA 743 Br./US 422 Square F HCON 603,000 603,000 07/09/2009 E
Dauphin 743 017 63284 PA 743 Br./US 422 Square U HCON 50,000 50,000 07/01/2006 E
Dauphin 743 017 63284 PA 743 Br./US 422 Square R HCON 760,000 760,000
Dauphin 743 017 63284 PA 743 Br./US 422 Square +C HCON STP 3,818,200 5,645,800 9,464,000 09/03/2009 E
Dauphin 743 020 74140 Laudermilch Road C HRST STP 2,635,500 2,635,500 11/08/2007 A
Dauphin 743 020 74140 Laudermilch Road C HRST STP 114,556 114,556 11/08/2007 A
Dauphin 743 022 81178 Fishburn Road C HRST 916 632,000 632,000 06/19/2008 E
Dauphin 1009 009 81179 North Crossroads Rd C HRST 916 426,514 426,514 04/17/2008 A
Dauphin 2003 010 69118 US-322 Bridge PM Group F BRDG 185 23,500 23,500 11/14/2007 A
Dauphin 2003 010 69118 US-322 Bridge PM Group C BRDG BOO 185 1,015,038 253,758 1,268,796 12/13/2007 A
Dauphin 2003 010 69118 US-322 Bridge PM Group C BRDG BOO 185 127,561 31,891 159,453 12/13/2007 A
Dauphin 2003 013 79752 Hanover Street Bridge P HRST 582 2,000 2,000 07/01/2008 E
^ PE - NEPA, FD - PSE CO, UTL - Fnl UTL Clr., ROW - Cond ROW, CON - Let On Obligation Plan Obligations have occurred* Includes Conversion Amount + Indicates phase qualifies for TOLL funds d 916 Discretionary e Economic Development s Spike
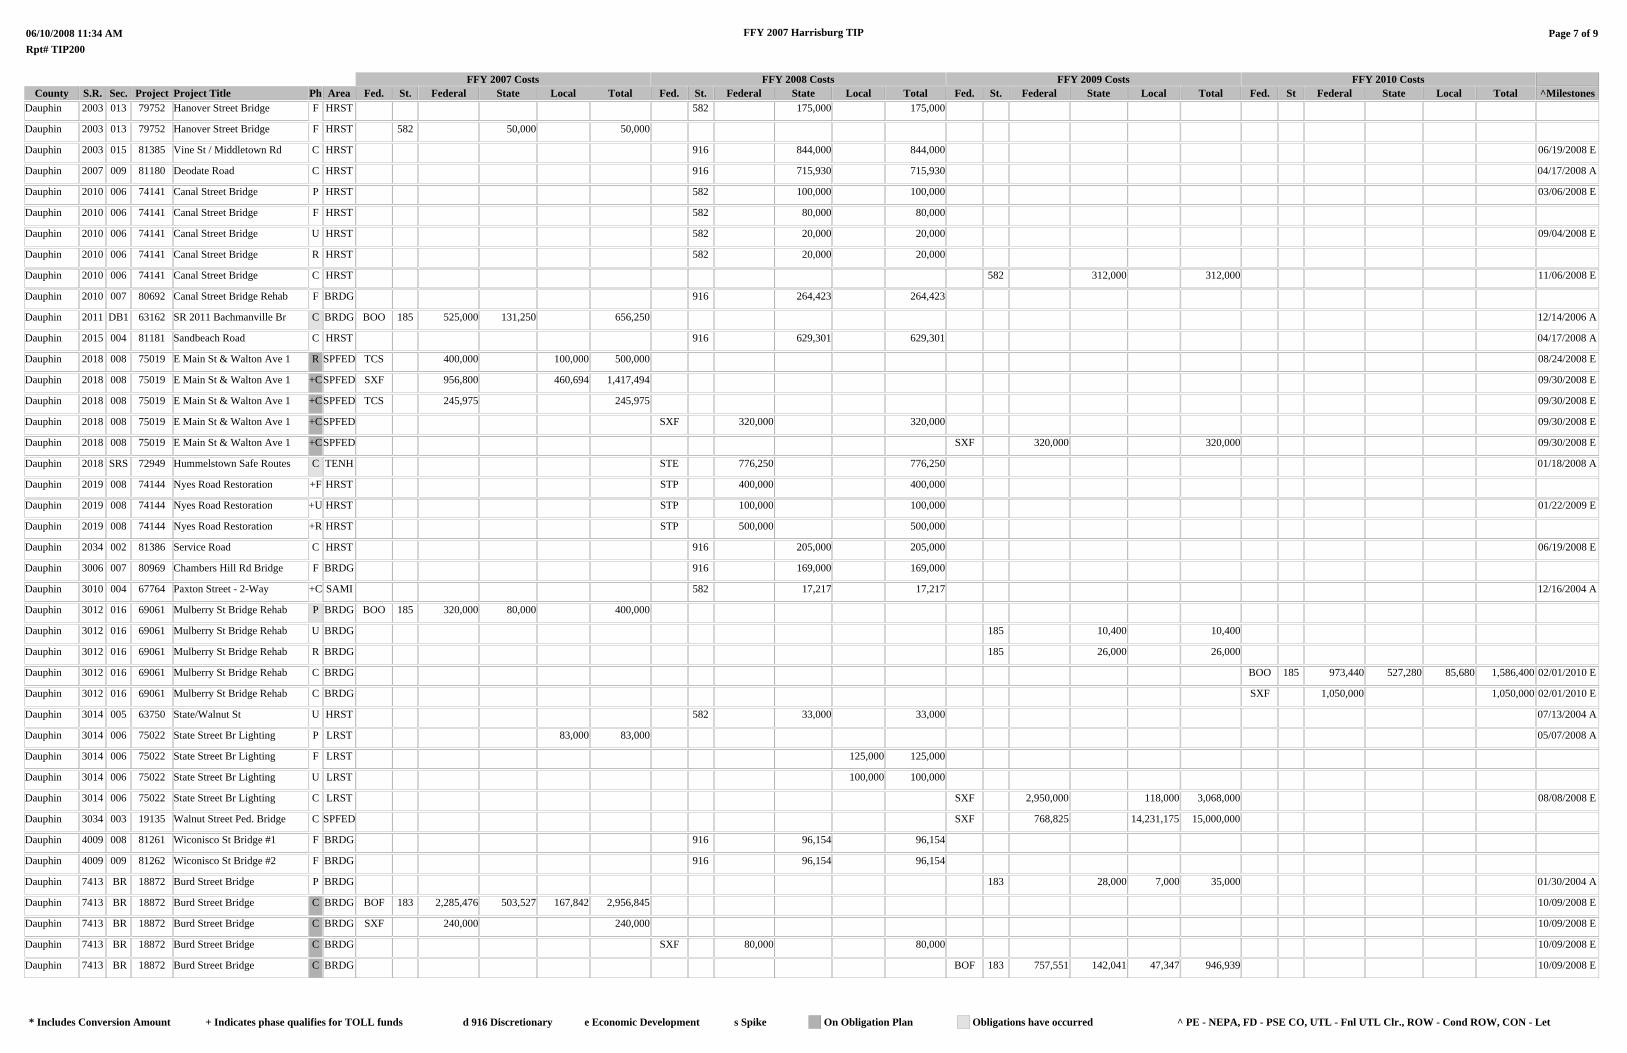
County S.R. Sec. Project
06/10/2008 11:34 AMRpt# TIP200
Project Title Ph AreaFFY 2007 Costs
FFY 2007 Harrisburg TIP
FFY 2008 Costs FFY 2009 Costs FFY 2010 CostsFed. St. Federal State Local Total Fed. St. Federal State Local Total Fed. St. Federal State Local Total Fed. St Federal State Local Total
Page 7 of 9
^MilestonesDauphin 2003 013 79752 Hanover Street Bridge F HRST 582 175,000 175,000
Dauphin 2003 013 79752 Hanover Street Bridge F HRST 582 50,000 50,000
Dauphin 2003 015 81385 Vine St / Middletown Rd C HRST 916 844,000 844,000 06/19/2008 E
Dauphin 2007 009 81180 Deodate Road C HRST 916 715,930 715,930 04/17/2008 A
Dauphin 2010 006 74141 Canal Street Bridge P HRST 582 100,000 100,000 03/06/2008 E
Dauphin 2010 006 74141 Canal Street Bridge F HRST 582 80,000 80,000
Dauphin 2010 006 74141 Canal Street Bridge U HRST 582 20,000 20,000 09/04/2008 E
Dauphin 2010 006 74141 Canal Street Bridge R HRST 582 20,000 20,000
Dauphin 2010 006 74141 Canal Street Bridge C HRST 582 312,000 312,000 11/06/2008 E
Dauphin 2010 007 80692 Canal Street Bridge Rehab F BRDG 916 264,423 264,423
Dauphin 2011 DB1 63162 SR 2011 Bachmanville Br C BRDG BOO 185 525,000 131,250 656,250 12/14/2006 A
Dauphin 2015 004 81181 Sandbeach Road C HRST 916 629,301 629,301 04/17/2008 A
Dauphin 2018 008 75019 E Main St & Walton Ave 1 R SPFED TCS 400,000 100,000 500,000 08/24/2008 E
Dauphin 2018 008 75019 E Main St & Walton Ave 1 +CSPFED SXF 956,800 460,694 1,417,494 09/30/2008 E
Dauphin 2018 008 75019 E Main St & Walton Ave 1 +CSPFED TCS 245,975 245,975 09/30/2008 E
Dauphin 2018 008 75019 E Main St & Walton Ave 1 +CSPFED SXF 320,000 320,000 09/30/2008 E
Dauphin 2018 008 75019 E Main St & Walton Ave 1 +CSPFED SXF 320,000 320,000 09/30/2008 E
Dauphin 2018 SRS 72949 Hummelstown Safe Routes C TENH STE 776,250 776,250 01/18/2008 A
Dauphin 2019 008 74144 Nyes Road Restoration +F HRST STP 400,000 400,000
Dauphin 2019 008 74144 Nyes Road Restoration +U HRST STP 100,000 100,000 01/22/2009 E
Dauphin 2019 008 74144 Nyes Road Restoration +R HRST STP 500,000 500,000
Dauphin 2034 002 81386 Service Road C HRST 916 205,000 205,000 06/19/2008 E
Dauphin 3006 007 80969 Chambers Hill Rd Bridge F BRDG 916 169,000 169,000
Dauphin 3010 004 67764 Paxton Street - 2-Way +C SAMI 582 17,217 17,217 12/16/2004 A
Dauphin 3012 016 69061 Mulberry St Bridge Rehab P BRDG BOO 185 320,000 80,000 400,000
Dauphin 3012 016 69061 Mulberry St Bridge Rehab U BRDG 185 10,400 10,400
Dauphin 3012 016 69061 Mulberry St Bridge Rehab R BRDG 185 26,000 26,000
Dauphin 3012 016 69061 Mulberry St Bridge Rehab C BRDG BOO 185 973,440 527,280 85,680 1,586,400 02/01/2010 E
Dauphin 3012 016 69061 Mulberry St Bridge Rehab C BRDG SXF 1,050,000 1,050,000 02/01/2010 E
Dauphin 3014 005 63750 State/Walnut St U HRST 582 33,000 33,000 07/13/2004 A
Dauphin 3014 006 75022 State Street Br Lighting P LRST 83,000 83,000 05/07/2008 A
Dauphin 3014 006 75022 State Street Br Lighting F LRST 125,000 125,000
Dauphin 3014 006 75022 State Street Br Lighting U LRST 100,000 100,000
Dauphin 3014 006 75022 State Street Br Lighting C LRST SXF 2,950,000 118,000 3,068,000 08/08/2008 E
Dauphin 3034 003 19135 Walnut Street Ped. Bridge C SPFED SXF 768,825 14,231,175 15,000,000
Dauphin 4009 008 81261 Wiconisco St Bridge #1 F BRDG 916 96,154 96,154
Dauphin 4009 009 81262 Wiconisco St Bridge #2 F BRDG 916 96,154 96,154
Dauphin 7413 BR 18872 Burd Street Bridge P BRDG 183 28,000 7,000 35,000 01/30/2004 A
Dauphin 7413 BR 18872 Burd Street Bridge C BRDG BOF 183 2,285,476 503,527 167,842 2,956,845 10/09/2008 E
Dauphin 7413 BR 18872 Burd Street Bridge C BRDG SXF 240,000 240,000 10/09/2008 E
Dauphin 7413 BR 18872 Burd Street Bridge C BRDG SXF 80,000 80,000 10/09/2008 E
Dauphin 7413 BR 18872 Burd Street Bridge C BRDG BOF 183 757,551 142,041 47,347 946,939 10/09/2008 E
^ PE - NEPA, FD - PSE CO, UTL - Fnl UTL Clr., ROW - Cond ROW, CON - Let On Obligation Plan Obligations have occurred* Includes Conversion Amount + Indicates phase qualifies for TOLL funds d 916 Discretionary e Economic Development s Spike
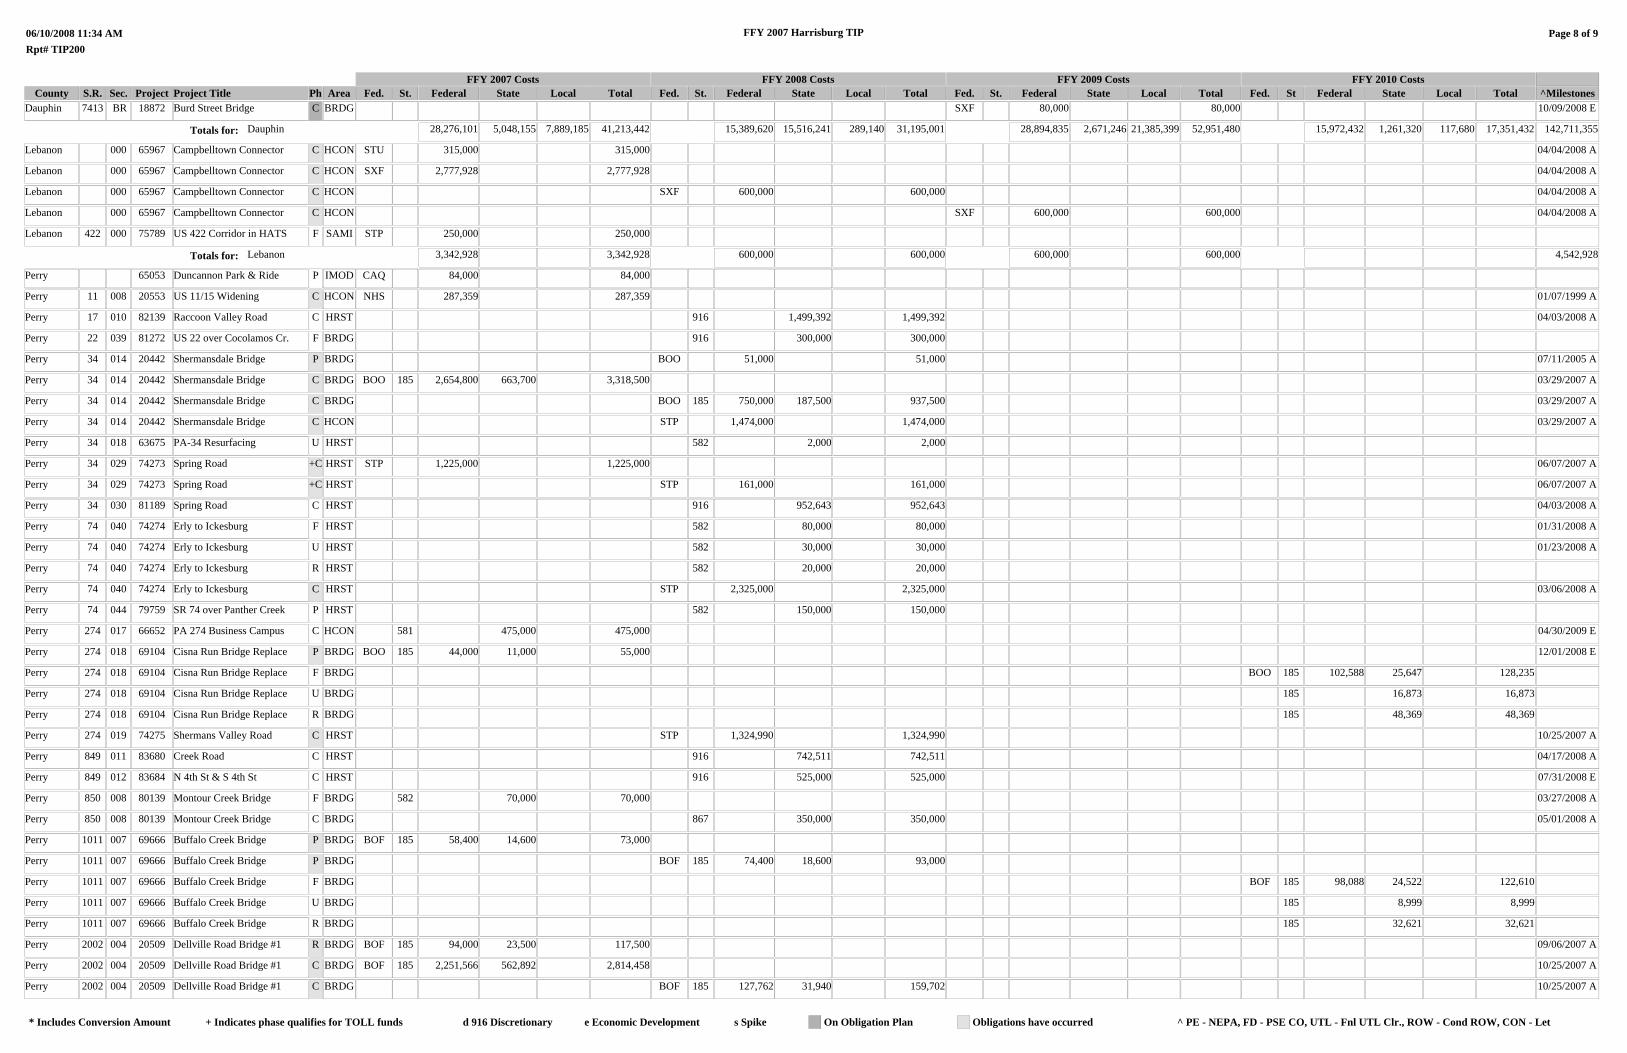
County S.R. Sec. Project
06/10/2008 11:34 AMRpt# TIP200
Project Title Ph AreaFFY 2007 Costs
FFY 2007 Harrisburg TIP
FFY 2008 Costs FFY 2009 Costs FFY 2010 CostsFed. St. Federal State Local Total Fed. St. Federal State Local Total Fed. St. Federal State Local Total Fed. St Federal State Local Total
Page 8 of 9
^MilestonesDauphin 7413 BR 18872 Burd Street Bridge C BRDG SXF 80,000 80,000 10/09/2008 E
Totals for: Dauphin 28,276,101 5,048,155 7,889,185 41,213,442 15,389,620 15,516,241 289,140 31,195,001 28,894,835 2,671,246 21,385,399 52,951,480 15,972,432 1,261,320 117,680 17,351,432 142,711,355
Lebanon 000 65967 Campbelltown Connector C HCON STU 315,000 315,000 04/04/2008 A
Lebanon 000 65967 Campbelltown Connector C HCON SXF 2,777,928 2,777,928 04/04/2008 A
Lebanon 000 65967 Campbelltown Connector C HCON SXF 600,000 600,000 04/04/2008 A
Lebanon 000 65967 Campbelltown Connector C HCON SXF 600,000 600,000 04/04/2008 A
Lebanon 422 000 75789 US 422 Corridor in HATS F SAMI STP 250,000 250,000
Totals for: Lebanon 3,342,928 3,342,928 600,000 600,000 600,000 600,000 4,542,928
Perry 65053 Duncannon Park & Ride P IMOD CAQ 84,000 84,000
Perry 11 008 20553 US 11/15 Widening C HCON NHS 287,359 287,359 01/07/1999 A
Perry 17 010 82139 Raccoon Valley Road C HRST 916 1,499,392 1,499,392 04/03/2008 A
Perry 22 039 81272 US 22 over Cocolamos Cr. F BRDG 916 300,000 300,000
Perry 34 014 20442 Shermansdale Bridge P BRDG BOO 51,000 51,000 07/11/2005 A
Perry 34 014 20442 Shermansdale Bridge C BRDG BOO 185 2,654,800 663,700 3,318,500 03/29/2007 A
Perry 34 014 20442 Shermansdale Bridge C BRDG BOO 185 750,000 187,500 937,500 03/29/2007 A
Perry 34 014 20442 Shermansdale Bridge C HCON STP 1,474,000 1,474,000 03/29/2007 A
Perry 34 018 63675 PA-34 Resurfacing U HRST 582 2,000 2,000
Perry 34 029 74273 Spring Road +C HRST STP 1,225,000 1,225,000 06/07/2007 A
Perry 34 029 74273 Spring Road +C HRST STP 161,000 161,000 06/07/2007 A
Perry 34 030 81189 Spring Road C HRST 916 952,643 952,643 04/03/2008 A
Perry 74 040 74274 Erly to Ickesburg F HRST 582 80,000 80,000 01/31/2008 A
Perry 74 040 74274 Erly to Ickesburg U HRST 582 30,000 30,000 01/23/2008 A
Perry 74 040 74274 Erly to Ickesburg R HRST 582 20,000 20,000
Perry 74 040 74274 Erly to Ickesburg C HRST STP 2,325,000 2,325,000 03/06/2008 A
Perry 74 044 79759 SR 74 over Panther Creek P HRST 582 150,000 150,000
Perry 274 017 66652 PA 274 Business Campus C HCON 581 475,000 475,000 04/30/2009 E
Perry 274 018 69104 Cisna Run Bridge Replace P BRDG BOO 185 44,000 11,000 55,000 12/01/2008 E
Perry 274 018 69104 Cisna Run Bridge Replace F BRDG BOO 185 102,588 25,647 128,235
Perry 274 018 69104 Cisna Run Bridge Replace U BRDG 185 16,873 16,873
Perry 274 018 69104 Cisna Run Bridge Replace R BRDG 185 48,369 48,369
Perry 274 019 74275 Shermans Valley Road C HRST STP 1,324,990 1,324,990 10/25/2007 A
Perry 849 011 83680 Creek Road C HRST 916 742,511 742,511 04/17/2008 A
Perry 849 012 83684 N 4th St & S 4th St C HRST 916 525,000 525,000 07/31/2008 E
Perry 850 008 80139 Montour Creek Bridge F BRDG 582 70,000 70,000 03/27/2008 A
Perry 850 008 80139 Montour Creek Bridge C BRDG 867 350,000 350,000 05/01/2008 A
Perry 1011 007 69666 Buffalo Creek Bridge P BRDG BOF 185 58,400 14,600 73,000
Perry 1011 007 69666 Buffalo Creek Bridge P BRDG BOF 185 74,400 18,600 93,000
Perry 1011 007 69666 Buffalo Creek Bridge F BRDG BOF 185 98,088 24,522 122,610
Perry 1011 007 69666 Buffalo Creek Bridge U BRDG 185 8,999 8,999
Perry 1011 007 69666 Buffalo Creek Bridge R BRDG 185 32,621 32,621
Perry 2002 004 20509 Dellville Road Bridge #1 R BRDG BOF 185 94,000 23,500 117,500 09/06/2007 A
Perry 2002 004 20509 Dellville Road Bridge #1 C BRDG BOF 185 2,251,566 562,892 2,814,458 10/25/2007 A
Perry 2002 004 20509 Dellville Road Bridge #1 C BRDG BOF 185 127,762 31,940 159,702 10/25/2007 A
^ PE - NEPA, FD - PSE CO, UTL - Fnl UTL Clr., ROW - Cond ROW, CON - Let On Obligation Plan Obligations have occurred* Includes Conversion Amount + Indicates phase qualifies for TOLL funds d 916 Discretionary e Economic Development s Spike
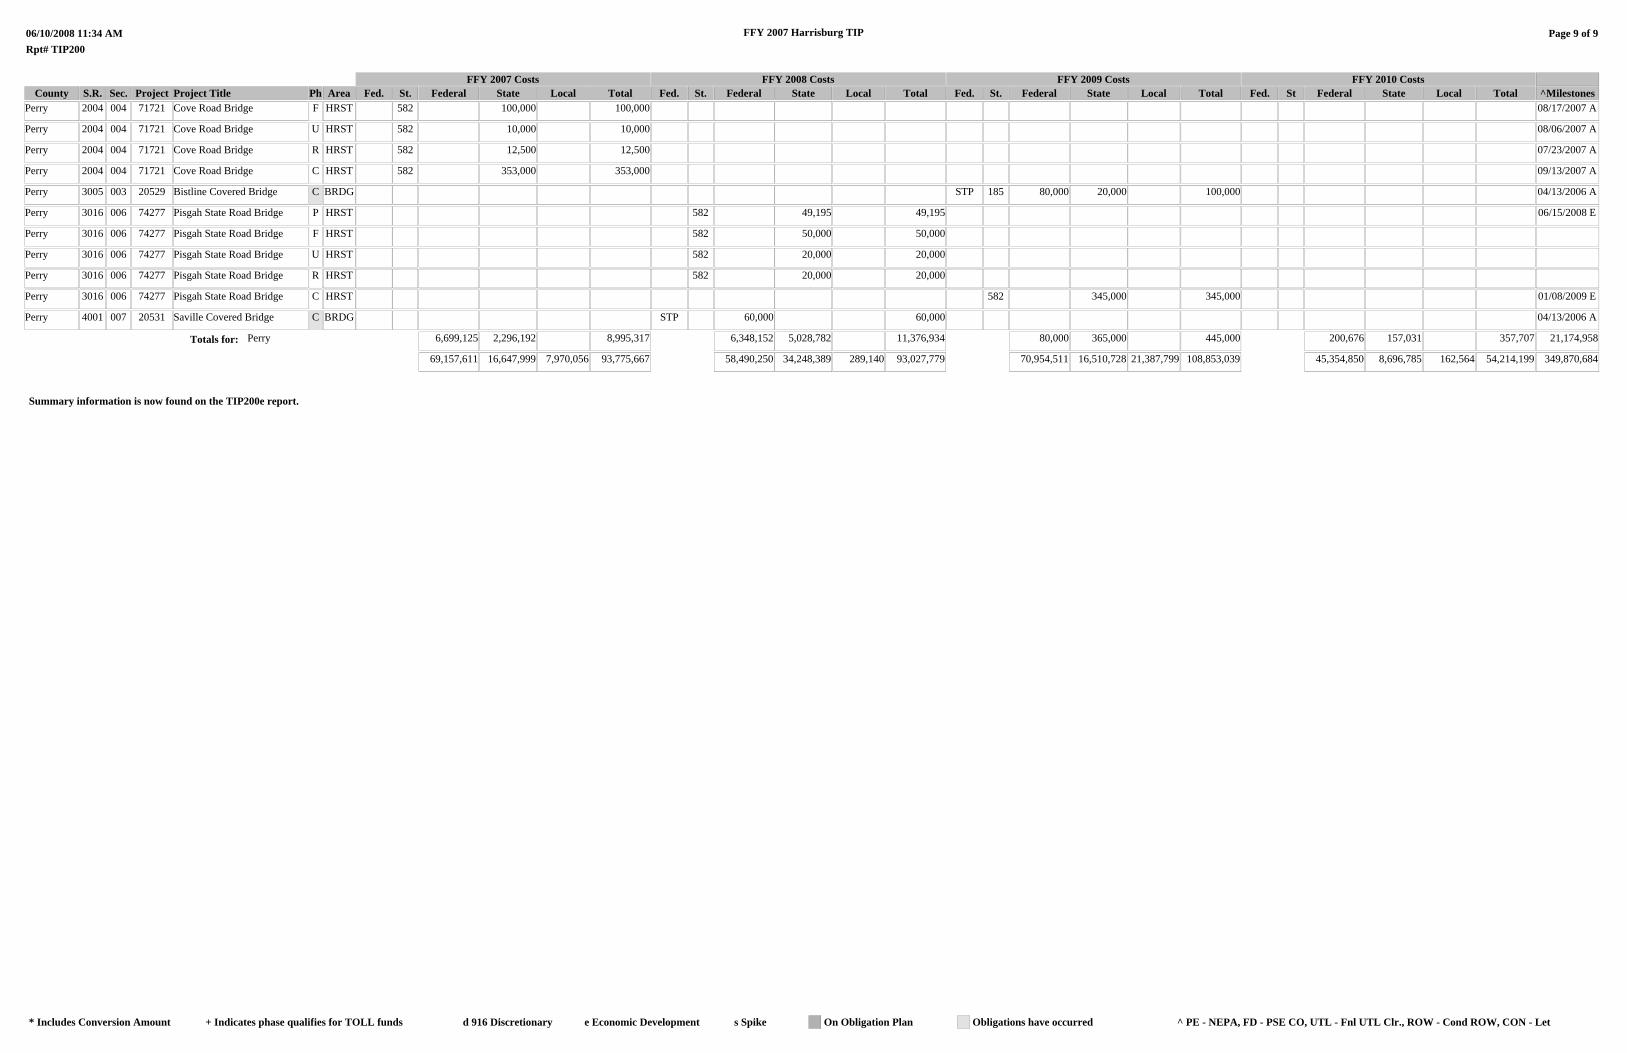
County S.R. Sec. Project
06/10/2008 11:34 AMRpt# TIP200
Project Title Ph AreaFFY 2007 Costs
FFY 2007 Harrisburg TIP
FFY 2008 Costs FFY 2009 Costs FFY 2010 CostsFed. St. Federal State Local Total Fed. St. Federal State Local Total Fed. St. Federal State Local Total Fed. St Federal State Local Total
Page 9 of 9
^MilestonesPerry 2004 004 71721 Cove Road Bridge F HRST 582 100,000 100,000 08/17/2007 A
Perry 2004 004 71721 Cove Road Bridge U HRST 582 10,000 10,000 08/06/2007 A
Perry 2004 004 71721 Cove Road Bridge R HRST 582 12,500 12,500 07/23/2007 A
Perry 2004 004 71721 Cove Road Bridge C HRST 582 353,000 353,000 09/13/2007 A
Perry 3005 003 20529 Bistline Covered Bridge C BRDG STP 185 80,000 20,000 100,000 04/13/2006 A
Perry 3016 006 74277 Pisgah State Road Bridge P HRST 582 49,195 49,195 06/15/2008 E
Perry 3016 006 74277 Pisgah State Road Bridge F HRST 582 50,000 50,000
Perry 3016 006 74277 Pisgah State Road Bridge U HRST 582 20,000 20,000
Perry 3016 006 74277 Pisgah State Road Bridge R HRST 582 20,000 20,000
Perry 3016 006 74277 Pisgah State Road Bridge C HRST 582 345,000 345,000 01/08/2009 E
Perry 4001 007 20531 Saville Covered Bridge C BRDG STP 60,000 60,000 04/13/2006 A
Totals for: Perry 6,699,125 2,296,192 8,995,317 6,348,152 5,028,782 11,376,934 80,000 365,000 445,000 200,676 157,031 357,707 21,174,958
69,157,611 16,647,999 7,970,056 93,775,667 58,490,250 34,248,389 289,140 93,027,779 70,954,511 16,510,728 21,387,799 108,853,039 45,354,850 8,696,785 162,564 54,214,199
Summary information is now found on the TIP200e report.
349,870,684
^ PE - NEPA, FD - PSE CO, UTL - Fnl UTL Clr., ROW - Cond ROW, CON - Let On Obligation Plan Obligations have occurred* Includes Conversion Amount + Indicates phase qualifies for TOLL funds d 916 Discretionary e Economic Development s Spike

FY2007-2009 STIP
All Projects
MPO: All
Jurisdiction: All
Road System: All
61407Project UPC:
HAMPTON ROADS DISTRICT
6/10/2008

6/10/2008
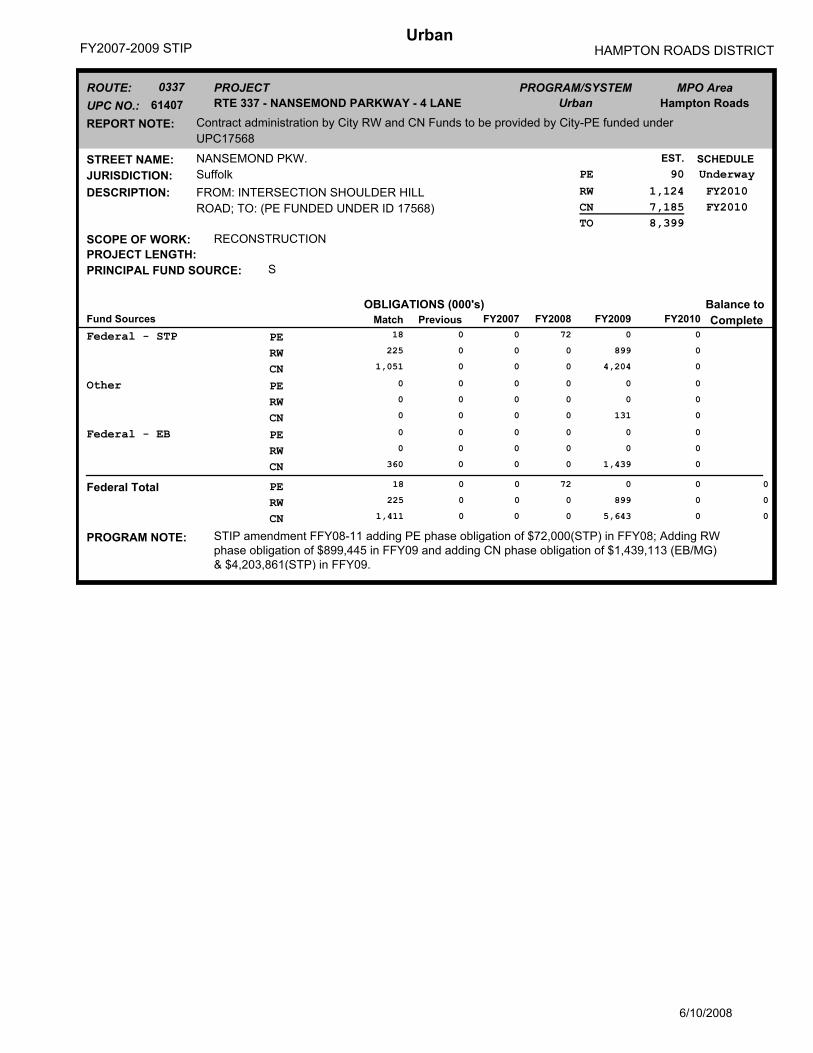
HAMPTON ROADS DISTRICTFY2007-2009 STIPUrban
MPO Area
Hampton RoadsUrban
PROGRAM/SYSTEM
RTE 337 - NANSEMOND PARKWAY - 4 LANE
PROJECT0337
UPC NO.:
ROUTE:
61407
REPORT NOTE: Contract administration by City RW and CN Funds to be provided by City-PE funded under
UPC17568
Underway
SCHEDULE
JURISDICTION:
NANSEMOND PKW.STREET NAME:
Suffolk
EST.
PE 90
FY2010
FY2010FROM: INTERSECTION SHOULDER HILL
ROAD; TO: (PE FUNDED UNDER ID 17568)
DESCRIPTION: RW 1,124
CN 7,185
TO 8,399
PROJECT LENGTH:
SCOPE OF WORK: RECONSTRUCTION
SPRINCIPAL FUND SOURCE:
OBLIGATIONS (000's)Fund Sources
Balance to
CompletePreviousMatch FY2007 FY2008 FY2009 FY2010
4,204
899
0
0
0
72
0
0
0
0
0
0
CN
RW
PEFederal - STP 18
225
1,051
0
0
0
131
0
0
0
0
0
0
0
0
0
0
0
CN
RW
PEOther 0
0
0
0
0
0
1,439
0
0
0
0
0
0
0
0
0
0
0
CN
RW
PEFederal - EB 0
0
360
0
0
0
0
0
CN
RW
PEFederal Total 0
18
225
1,411
0 0 72 0
0 0 0 899
0 0 0 5,643 0
0
0
PROGRAM NOTE: STIP amendment FFY08-11 adding PE phase obligation of $72,000(STP) in FFY08; Adding RW phase obligation of $899,445 in FFY09 and adding CN phase obligation of $1,439,113 (EB/MG) & $4,203,861(STP) in FFY09.
6/10/2008

6/10/2008
FY2007-2009 STIP
All Projects
MPO: All
Jurisdiction: All
Road System: All
86499Project UPC:

HAMPTON ROADS DISTRICT
6/5/2008

6/5/2008
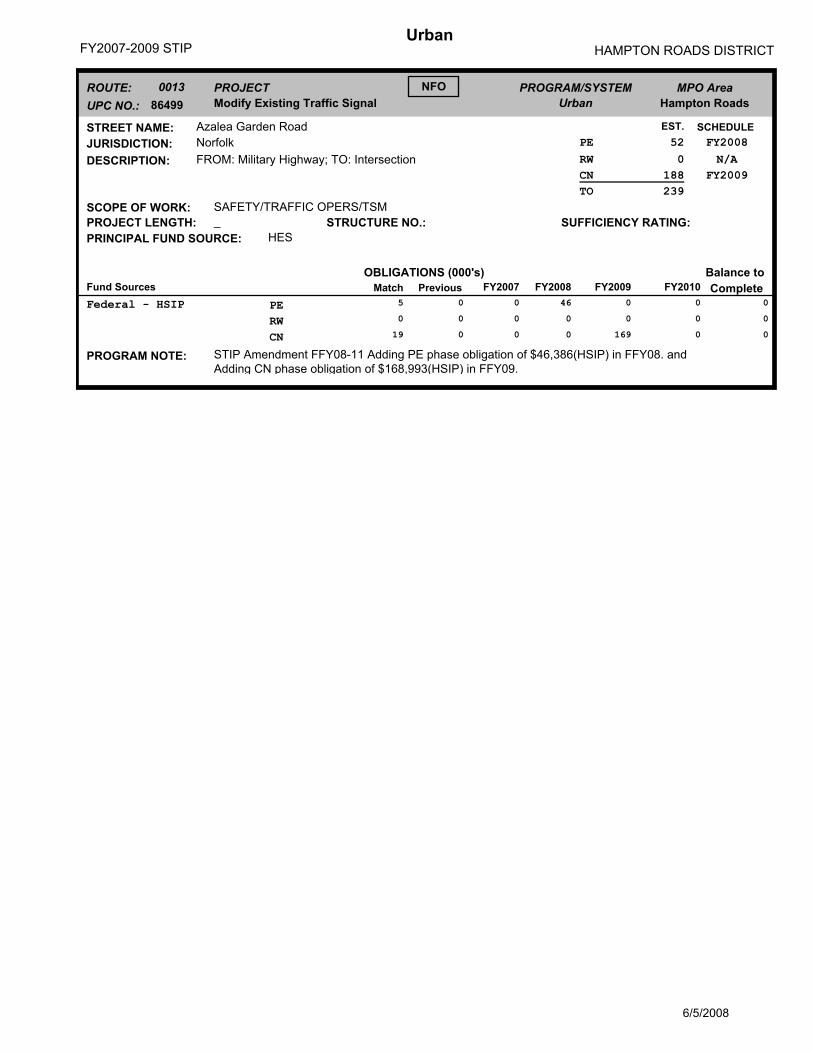
HAMPTON ROADS DISTRICTFY2007-2009 STIPUrban
MPO Area
Hampton RoadsUrban
PROGRAM/SYSTEM
Modify Existing Traffic Signal
PROJECT0013
UPC NO.:
ROUTE:
86499
NFO
FY2008
SCHEDULE
JURISDICTION:
Azalea Garden RoadSTREET NAME:
Norfolk
EST.
PE 52
FY2009
N/AFROM: Military Highway; TO: IntersectionDESCRIPTION: RW 0
CN 188
TO 239
PROJECT LENGTH: _ STRUCTURE NO.: SUFFICIENCY RATING:
SCOPE OF WORK: SAFETY/TRAFFIC OPERS/TSM
HESPRINCIPAL FUND SOURCE:
OBLIGATIONS (000's)Fund Sources
Balance to
CompletePreviousMatch FY2007 FY2008 FY2009 FY2010
169
0
0
0
0
46
0
0
0
0
0
0
CN
RW
PEFederal - HSIP 5
0
19
0
0
0
0
0
0
PROGRAM NOTE: STIP Amendment FFY08-11 Adding PE phase obligation of $46,386(HSIP) in FFY08. and Adding CN phase obligation of $168,993(HSIP) in FFY09.
6/5/2008

6/5/2008


