Download - Annual Equality and Diversity report 2013-14
EQUALITY, DIVERSITY AND INCLUSION
2013-14
Annual Report to the Board
December 2014
ANNUAL EQUALITY AND DIVERSITY REPORT 1. INTRODUCTION
The College’s equality and diversity policy statement is:
‘Barnet and Southgate College is committed to achieving equality and diversity for all its learners, staff and the broader community which it serves. We welcome, celebrate and value the diversity of our learning community and seek to promote an inclusive learning and working environment where everyone can achieve to their full potential. We have a zero tolerance of discrimination, harassment or bullying of any kind. ‘
The aim of the policy is to highlight the compliance with anti-discriminatory legislation and regulatory requirements and our on-going commitment to equality and diversity. It also acts as a framework for promoting and adopting best practice and delivering continuous improvements across the College.
During 2013-14, the College consulted on its Single Equality Scheme which outlines in more detail the way which the College will ensure that individuals and groups with one or more of the nine protected characteristics within the Equality Scheme are supported and safeguarded against any discrimination, harassment or victimisation. The final scheme was approved by the Board of Governors in October.
This annual report outlines the College’s progress in meeting the above statement and identifies further actions, which need to be taken to promote and develop equality and diversity at Barnet and Southgate College.
The College is committed to the promotion and implementation of equality and diversity in all its activities, both as a provider of services and as an employer. This report addresses both aspects of the implementation of the policy, i.e. equality and diversity for learners and for our staff.
2. EQUALITY ACT 2010
The general duty, which is set out in section 149 of the Equality Act 2010, requires us, as a College, to have due regard to the following aims:
o Eliminate unlawful discrimination, harassment and victimisation and other conduct
prohibited by the Act. o Advance equality of opportunity between people who share a protected characteristic
and those who do not. o Foster good relations between people who share a protected characteristic and those
who do not.
In addition to the general equality duty, as a publicly funded organisation, the College must also meet two further specific duties as outlined in the Public Sector Equality Duty. These are:
o to publish information to demonstrate its compliance with the Equality Act; o to set and publish equality objectives.
The College is meeting this specific duty within the Act, through the publication of this Annual Report, which provides data on students and staff and provides details of the College’s progress against the Equality and Diversity objectives.

3. LEARNER PARTICIPATION Gender
All Ages
16-18
19+
Female 11713 51.1% 2006 42.7% 9707 53%
Male 11204 48.9% 2697 57.3% 8507 47%
Total 22917 4703 18214
Overall 51.1% of learners are female, but the proportion of male to females varies when an analysis is carried out by age group. In the 16-18 year cohort, there are more males than females, whilst in the adult age group, there are more females.
The ratio of males to females also varies by curriculum area with a predominance of males in areas such as Motor Vehicle, Electrical Installation, Sports Studies and Construction and similarly a predominance of females in Hair and Beauty. The curriculum areas are aware of these imbalances and have taken steps to address them through, for example, promotional material and taster sessions, targeted at particular groups.
Ethnicity
ETHNICITY Nos. College Enfield* Barnet* London*
African 2906 14.5% 9% 5% 7%
Any Other Mixed / multiple ethnic background 431 2.1% 1% 3% 2%
Any Other White background 2878 14.3% 18% 16% 13%
Any other Asian background 1377 6.8% 4% 6% 5%
Any other Black / African / Caribbean background 461 2.3% 3% 1% 2%
Any other ethnic group 145 0.7% 5% 1% 2%
Arab 413 2.1% 1% 1% 1%
Bangladeshi 298 1.5% 2% 1% 3%
Caribbean 835 4.2% 6% 1% 1%
Chinese 177 0.9% 1% 2% 2%
English / Welsh / Scottish / Northern Irish / British 5384 26.8% 41% 46% 45%
51.1%
42.7%
53%48.9%
57.3%
47%
0.0%
10.0%
20.0%
30.0%
40.0%
50.0%
60.0%
70.0%
All Ages 16-18 19+
Learner Participation by Gender
Female
Male

ETHNICITY Nos. College Enfield* Barnet* London*
Gypsy or Irish Traveller 20 0.1% 0% 0% 0%
Indian 933 4.6% 4% 8% 7%
Irish 257 1.3% 2% 2% 2%
Not provided 2269 11.3% n/a n/a n/a
Pakistani 361 1.8% 1% 2% 3%
White and Asian 382 1.9% 1% 2% 1%
White and Black African 233 1.2% 1% 1% 1%
White and Black Caribbean 343 1.7% 2% 1% 2%
Total = 20103 100.0%
* 2011 Census data
The largest ethnic group within the College is the ‘White British’; however, at 26.8% the proportion of these learners is lower than that seen within the College’s immediate catchment area as measured by the 2011 Census.
The next largest cohort of learners is ‘Black African’, which at 14.5% is a higher profile than seen within the College’s immediate catchment area.
The third largest ethnic group is ‘White Other’, which at 14.3% of the learner population is below the profile seen in Enfield and Enfield.
The College recognises that it needs to do more to improve the collection of ethnicity data at enrolment, since 11.3% of learners did not provide this information.
0%
5%
10%
15%
20%
25%
30%
35%
40%
45%
50%
Black Chinese OtherWhite
Mixed Asian WhiteUK
Arab Other
Comparision of Ethnicity Profile with Local Community
College
Enfield
Barnet
London
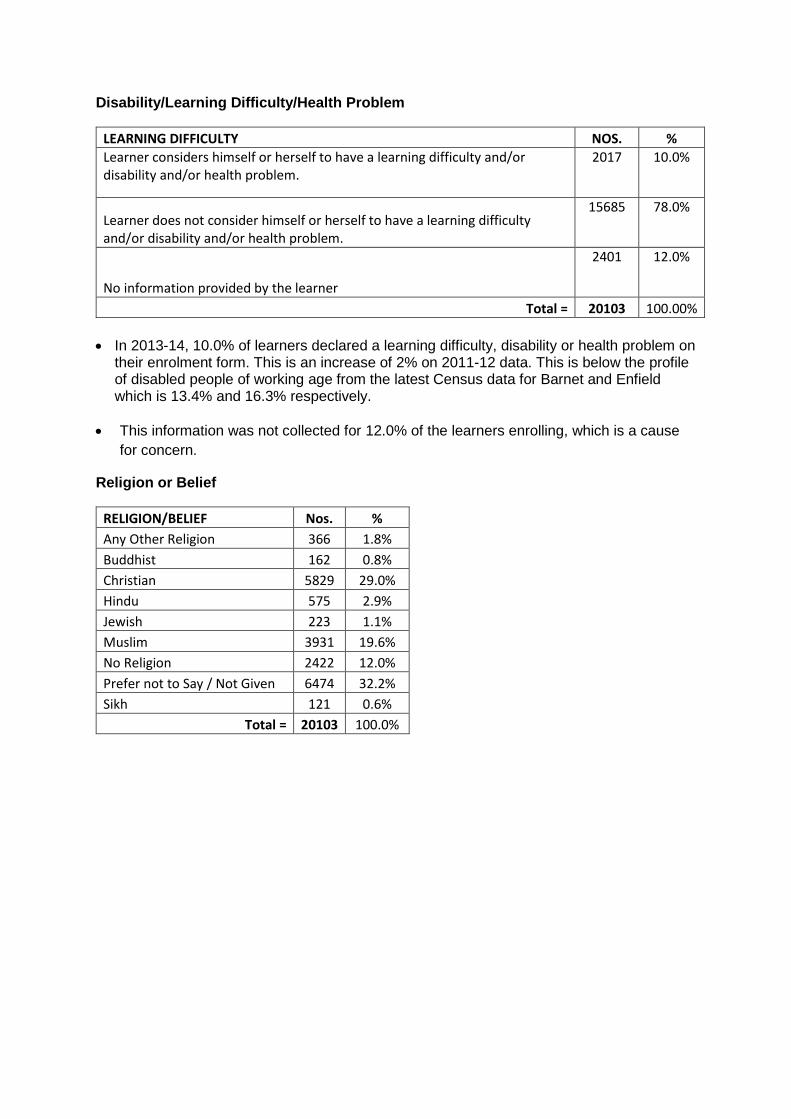
Disability/Learning Difficulty/Health Problem
LEARNING DIFFICULTY NOS. %
Learner considers himself or herself to have a learning difficulty and/or disability and/or health problem.
2017 10.0%
Learner does not consider himself or herself to have a learning difficulty and/or disability and/or health problem.
15685 78.0%
No information provided by the learner
2401 12.0%
Total = 20103 100.00%
In 2013-14, 10.0% of learners declared a learning difficulty, disability or health problem on their enrolment form. This is an increase of 2% on 2011-12 data. This is below the profile of disabled people of working age from the latest Census data for Barnet and Enfield which is 13.4% and 16.3% respectively.
This information was not collected for 12.0% of the learners enrolling, which is a cause
for concern.
Religion or Belief
RELIGION/BELIEF Nos. %
Any Other Religion 366 1.8%
Buddhist 162 0.8%
Christian 5829 29.0%
Hindu 575 2.9%
Jewish 223 1.1%
Muslim 3931 19.6%
No Religion 2422 12.0%
Prefer not to Say / Not Given 6474 32.2%
Sikh 121 0.6%
Total = 20103 100.0%
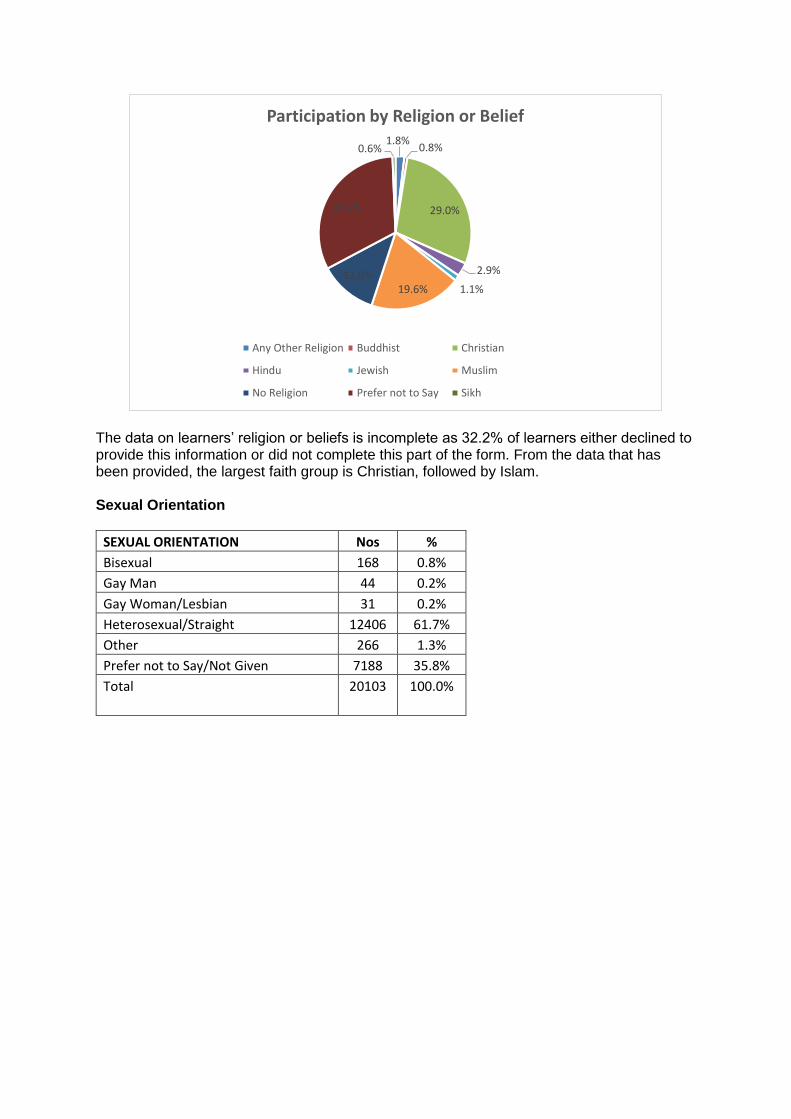
The data on learners’ religion or beliefs is incomplete as 32.2% of learners either declined to provide this information or did not complete this part of the form. From the data that has been provided, the largest faith group is Christian, followed by Islam. Sexual Orientation
SEXUAL ORIENTATION Nos %
Bisexual 168 0.8%
Gay Man 44 0.2%
Gay Woman/Lesbian 31 0.2%
Heterosexual/Straight 12406 61.7%
Other 266 1.3%
Prefer not to Say/Not Given 7188 35.8%
Total 20103 100.0%
1.8%0.8%
29.0%
2.9%
1.1%19.6%12.0%
32.2%
0.6%
Participation by Religion or Belief
Any Other Religion Buddhist Christian
Hindu Jewish Muslim
No Religion Prefer not to Say Sikh
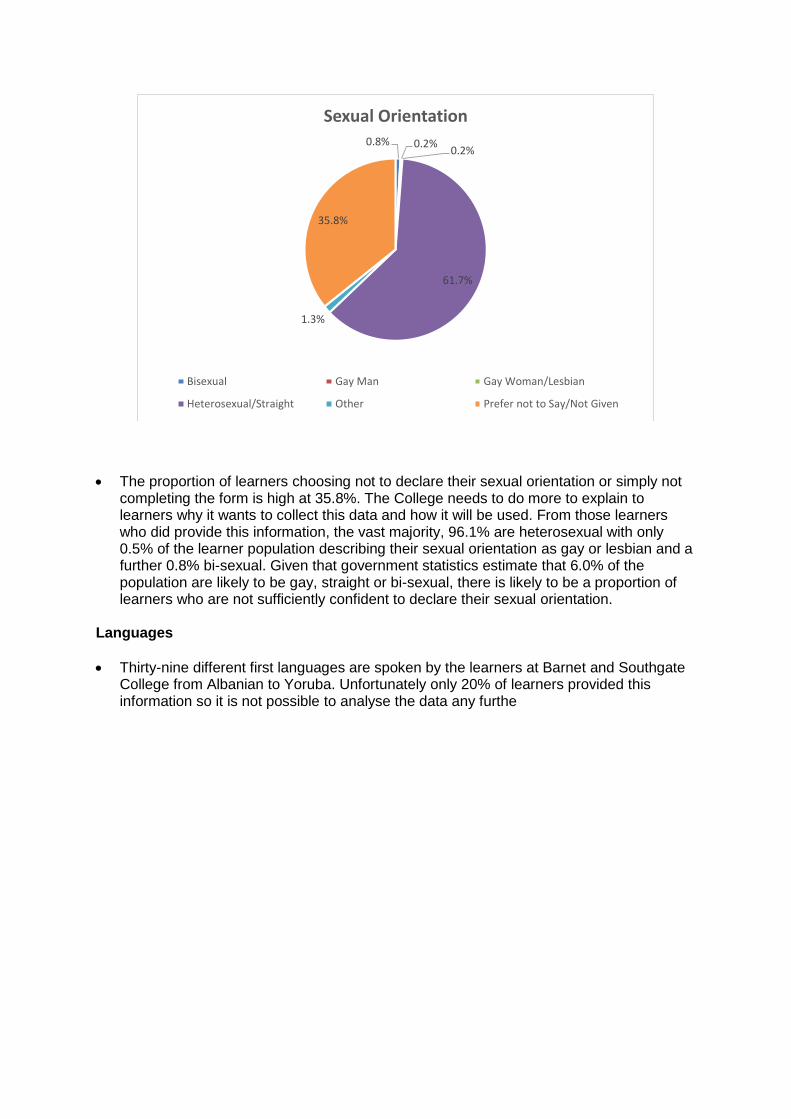
The proportion of learners choosing not to declare their sexual orientation or simply not completing the form is high at 35.8%. The College needs to do more to explain to learners why it wants to collect this data and how it will be used. From those learners who did provide this information, the vast majority, 96.1% are heterosexual with only 0.5% of the learner population describing their sexual orientation as gay or lesbian and a further 0.8% bi-sexual. Given that government statistics estimate that 6.0% of the population are likely to be gay, straight or bi-sexual, there is likely to be a proportion of learners who are not sufficiently confident to declare their sexual orientation.
Languages
Thirty-nine different first languages are spoken by the learners at Barnet and Southgate College from Albanian to Yoruba. Unfortunately only 20% of learners provided this information so it is not possible to analyse the data any furthe
0.8% 0.2%0.2%
61.7%
1.3%
35.8%
Sexual Orientation
Bisexual Gay Man Gay Woman/Lesbian
Heterosexual/Straight Other Prefer not to Say/Not Given
4. SUCCESS RATES DATA ANALYSIS
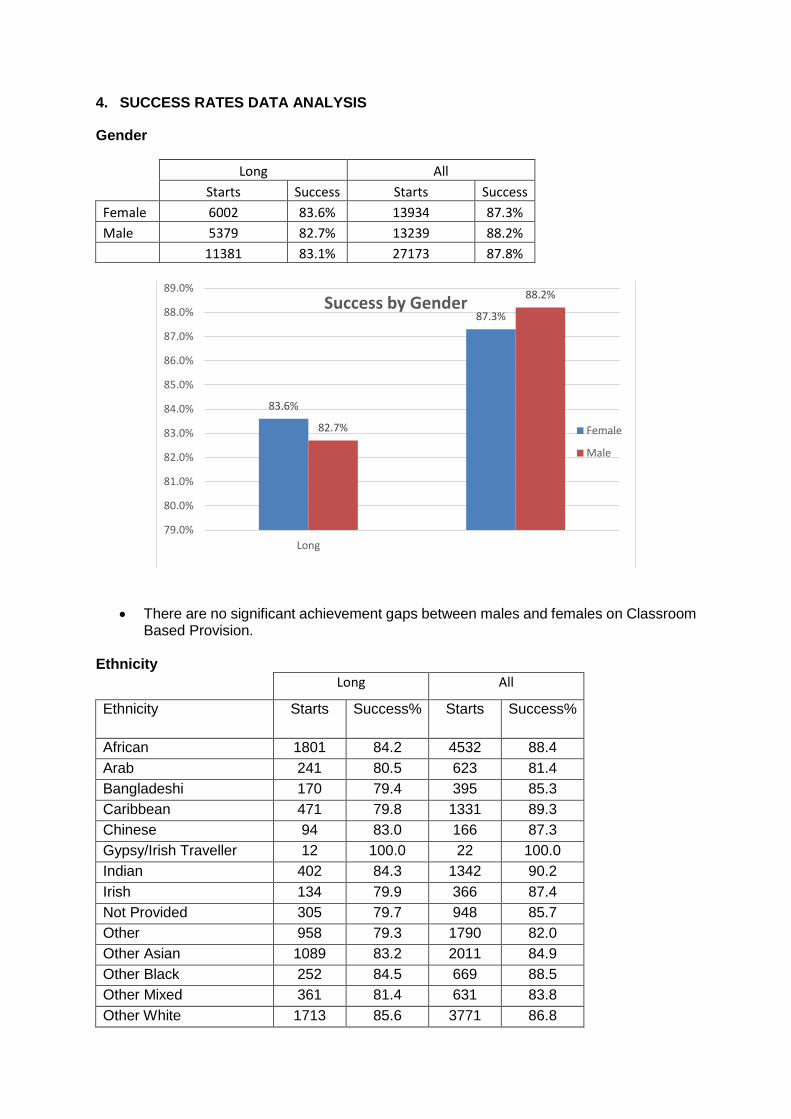
Gender
Long All
Starts Success Starts Success
Female 6002 83.6% 13934 87.3%
Male 5379 82.7% 13239 88.2%
11381 83.1% 27173 87.8%
There are no significant achievement gaps between males and females on Classroom Based Provision.
Ethnicity
Long All
Ethnicity Starts Success% Starts Success%
African 1801 84.2 4532 88.4
Arab 241 80.5 623 81.4
Bangladeshi 170 79.4 395 85.3
Caribbean 471 79.8 1331 89.3
Chinese 94 83.0 166 87.3
Gypsy/Irish Traveller 12 100.0 22 100.0
Indian 402 84.3 1342 90.2
Irish 134 79.9 366 87.4
Not Provided 305 79.7 948 85.7
Other 958 79.3 1790 82.0
Other Asian 1089 83.2 2011 84.9
Other Black 252 84.5 669 88.5
Other Mixed 361 81.4 631 83.8
Other White 1713 85.6 3771 86.8
83.6%
87.3%
82.7%
88.2%
79.0%
80.0%
81.0%
82.0%
83.0%
84.0%
85.0%
86.0%
87.0%
88.0%
89.0%
Long
Success by Gender
Female
Male
Long All
Ethnicity Starts Success% Starts Success%
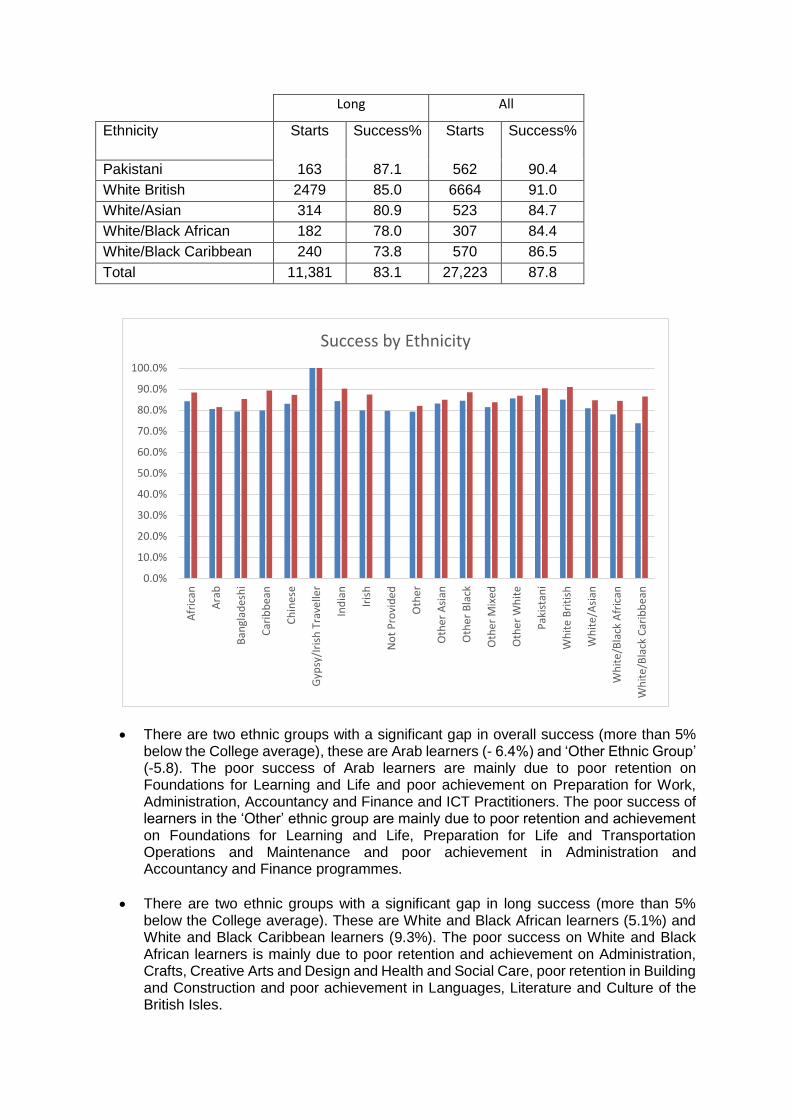
Pakistani 163 87.1 562 90.4
White British 2479 85.0 6664 91.0
White/Asian 314 80.9 523 84.7
White/Black African 182 78.0 307 84.4
White/Black Caribbean 240 73.8 570 86.5
Total 11,381 83.1 27,223 87.8
There are two ethnic groups with a significant gap in overall success (more than 5% below the College average), these are Arab learners (- 6.4%) and ‘Other Ethnic Group’ (-5.8). The poor success of Arab learners are mainly due to poor retention on Foundations for Learning and Life and poor achievement on Preparation for Work, Administration, Accountancy and Finance and ICT Practitioners. The poor success of learners in the ‘Other’ ethnic group are mainly due to poor retention and achievement on Foundations for Learning and Life, Preparation for Life and Transportation Operations and Maintenance and poor achievement in Administration and Accountancy and Finance programmes.
There are two ethnic groups with a significant gap in long success (more than 5% below the College average). These are White and Black African learners (5.1%) and White and Black Caribbean learners (9.3%). The poor success on White and Black African learners is mainly due to poor retention and achievement on Administration, Crafts, Creative Arts and Design and Health and Social Care, poor retention in Building and Construction and poor achievement in Languages, Literature and Culture of the British Isles.
0.0%
10.0%
20.0%
30.0%
40.0%
50.0%
60.0%
70.0%
80.0%
90.0%
100.0%
Afr
ican
Ara
b
Ban
glad
esh
i
Car
ibb
ean
Ch
ines
e
Gyp
sy/I
rish
Tra
velle
r
Ind
ian
Iris
h
No
t P
rovi
ded
Oth
er
Oth
er
Asi
an
Oth
er
Bla
ck
Oth
er
Mix
ed
Oth
er
Wh
ite
Pak
ista
ni
Wh
ite
Bri
tish
Wh
ite
/Asi
an
Wh
ite
/Bla
ck A
fric
an
Wh
ite
/Bla
ck C
arib
bea
n
Success by Ethnicity
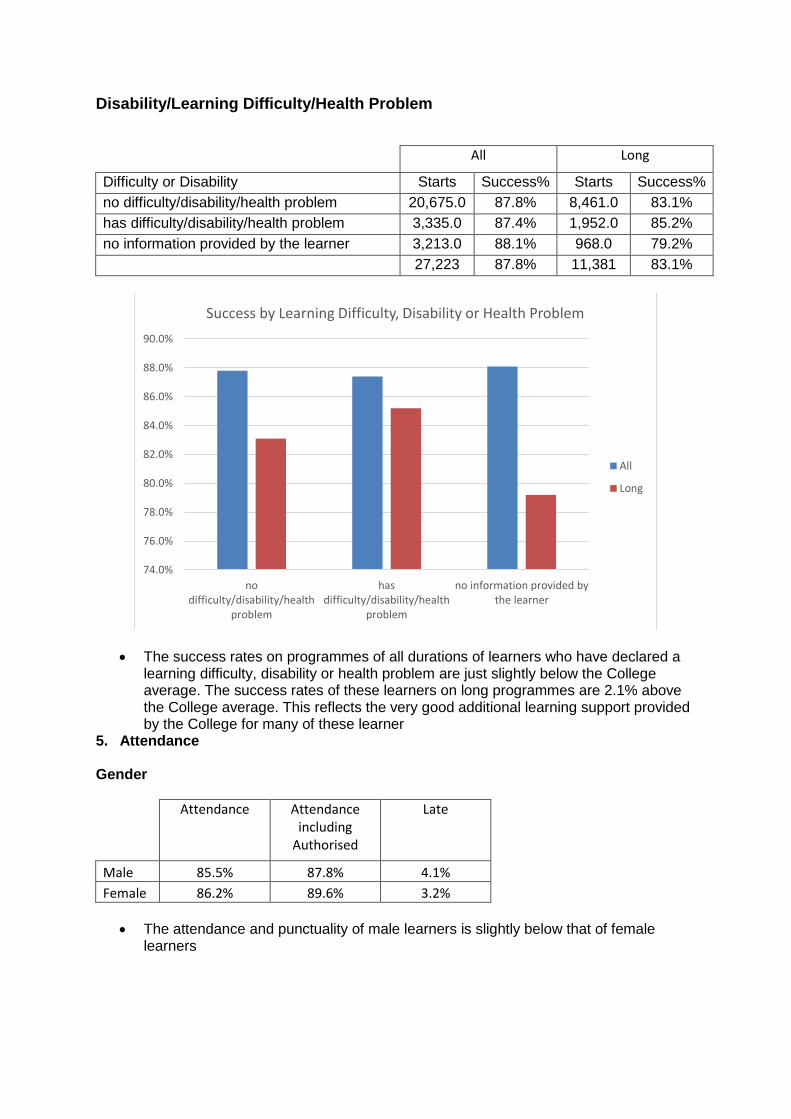
Disability/Learning Difficulty/Health Problem
All Long
Difficulty or Disability Starts Success% Starts Success%
no difficulty/disability/health problem 20,675.0 87.8% 8,461.0 83.1%
has difficulty/disability/health problem 3,335.0 87.4% 1,952.0 85.2%
no information provided by the learner 3,213.0 88.1% 968.0 79.2%
27,223 87.8% 11,381 83.1%
The success rates on programmes of all durations of learners who have declared a learning difficulty, disability or health problem are just slightly below the College average. The success rates of these learners on long programmes are 2.1% above the College average. This reflects the very good additional learning support provided by the College for many of these learner
5. Attendance Gender
Attendance Attendance including
Authorised
Late
Male 85.5% 87.8% 4.1%
Female 86.2% 89.6% 3.2%
The attendance and punctuality of male learners is slightly below that of female learners
74.0%
76.0%
78.0%
80.0%
82.0%
84.0%
86.0%
88.0%
90.0%
nodifficulty/disability/health
problem
hasdifficulty/disability/health
problem
no information provided bythe learner
Success by Learning Difficulty, Disability or Health Problem
All
Long
Ethnicity
ETHNICITY Attendance Attendance including
Authorised
Late
African 86.2 88.9 4.5
Any Other Mixed / multiple ethnic background 83.2 85.6 4.5
Any Other White background 86.3 89.7 3.2
Any other Asian background 86.8 89.7 3.7
Any other Black / African / Caribbean background 84.4 87.1 5.7
Any other ethnic group 87.9 90.8 3.7
Arab 85.8 88.6 4.1
Bangladeshi 86.0 88.9 3.3
Caribbean 86.0 88.1 4.7
Chinese 86.5 89.6 3.0
English / Welsh / Scottish / Northern Irish / British 85.6 88.4 2.7
Gypsy or Irish Traveller 89.0 90.9 1.9
Indian 88.2 90.6 3.8
Irish 84.3 87.2 2.6
Not provided 85.1 88.0 3.1
Pakistani 87.5 89.4 4.2
White and Asian 85.7 89.1 3.9
White and Black African 85.3 87.6 4.2
White and Black Caribbean 83.4 86.0 4.0
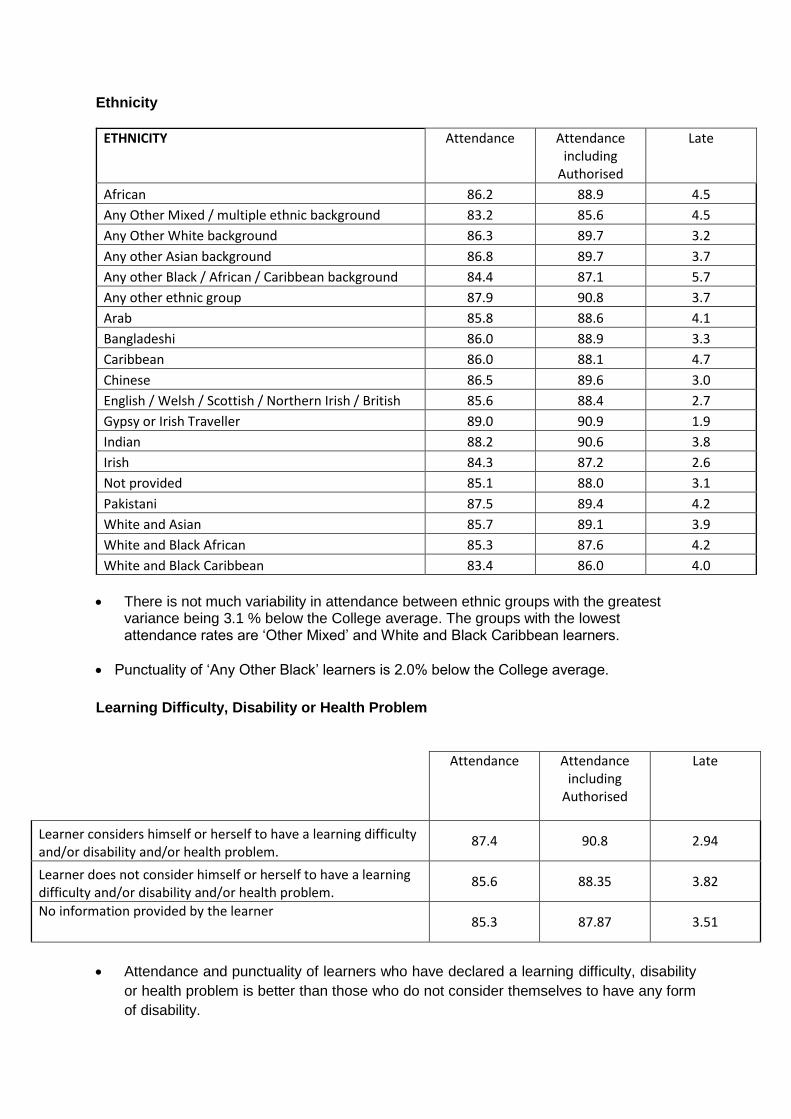
There is not much variability in attendance between ethnic groups with the greatest variance being 3.1 % below the College average. The groups with the lowest attendance rates are ‘Other Mixed’ and White and Black Caribbean learners.
Punctuality of ‘Any Other Black’ learners is 2.0% below the College average.
Learning Difficulty, Disability or Health Problem
Attendance Attendance including
Authorised
Late
Learner considers himself or herself to have a learning difficulty and/or disability and/or health problem.
87.4 90.8 2.94
Learner does not consider himself or herself to have a learning difficulty and/or disability and/or health problem.
85.6 88.35 3.82
No information provided by the learner 85.3 87.87 3.51
Attendance and punctuality of learners who have declared a learning difficulty, disability
or health problem is better than those who do not consider themselves to have any form
of disability.
6. Learner Satisfaction
The data used for learner satisfaction is taken from the end of year survey and is based on the response to the following statements:
o I am treated with respect o I would recommend the College to a friend
Gender
Generally females are more satisfied than males with 92% agreeing or strongly agreeing with the statement that they would recommend the College to a friend, 6% higher than the response from males.
95% of female learners agreed or strongly agreed with the statement that they are treated with respect as compared with a 93% agreement rate from males.
Ethnicity
The least likely to recommend the College to a friend are learners from ‘Any Other Black’ group with only a 77% agreement rate.
Other groups with an agreement rate below the College average are: ‘Any Other Mixed’, Caribbean, White UK, Indian and White and Black Mixed ethnicity.
Learners from most ethnic groups agree or strongly agree with the statement that they are treated with respect with an overall College average of 94%.
The two exceptions to this are ‘Any Other Black’ with an agreement rate of 86% and
Gypsy or Irish Traveller with an agreement rate of 83% although numbers of respondents for the latter group are very low.
Learning Difficulty or Disability
The majority of learners with a disability are at or above the College’s average agreement rate for the statement ‘I would recommend the College to a friend’. The two exceptions to this are learners with Asperger’s (78%) and those with a hearing impairment (74%)
Only two disability groups were below the College average for the statement ‘I am treated with respect’ and these were those with ‘Any Other Physical Disability’ and those with ‘Profound and Complex Disabilities’
Three categories of learning difficulties were below the College average for the
statement ‘I would recommend the College to a friend’. These are learners with dyslexia (85%), learners with moderate learning difficulties (86%) and learners with some other form of learning difficulty (72%)
Only learners with other learning difficulties had a lower agreement rate with the
statement ‘I am treated with respect’ (86
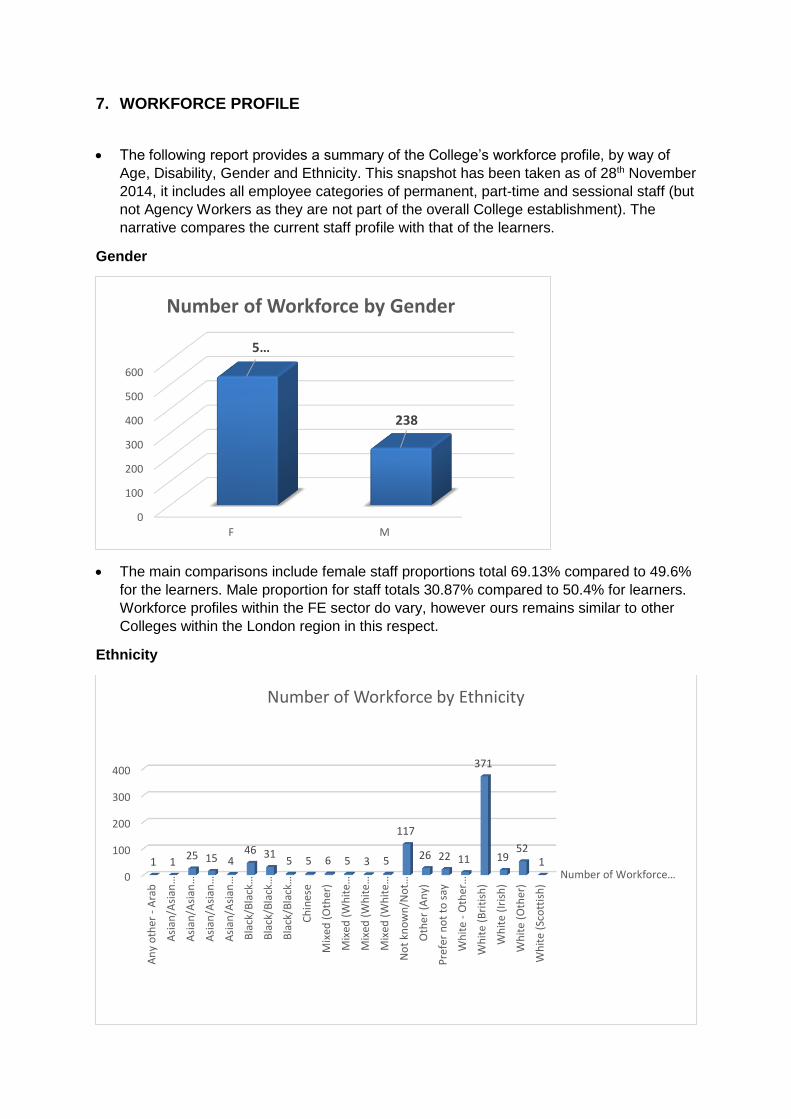
7. WORKFORCE PROFILE
The following report provides a summary of the College’s workforce profile, by way of
Age, Disability, Gender and Ethnicity. This snapshot has been taken as of 28th November
2014, it includes all employee categories of permanent, part-time and sessional staff (but
not Agency Workers as they are not part of the overall College establishment). The
narrative compares the current staff profile with that of the learners.
Gender
The main comparisons include female staff proportions total 69.13% compared to 49.6%
for the learners. Male proportion for staff totals 30.87% compared to 50.4% for learners.
Workforce profiles within the FE sector do vary, however ours remains similar to other
Colleges within the London region in this respect.
Ethnicity
0
100
200
300
400
500
600
F M
5…
238
Number of Workforce by Gender
Number of Workforce…0
100
200
300
400
An
y o
ther
- A
rab
Asi
an/A
sian
…
Asi
an/A
sian
…
Asi
an/A
sian
…
Asi
an/A
sian
…
Bla
ck/B
lack
…
Bla
ck/B
lack
…
Bla
ck/B
lack
…
Ch
ines
e
Mix
ed (
Oth
er)
Mix
ed (
Wh
ite…
Mix
ed (
Wh
ite…
Mix
ed (
Wh
ite…
No
t kn
ow
n/N
ot…
Oth
er
(An
y)
Pre
fer
no
t to
say
Wh
ite
- O
ther
…
Wh
ite
(B
riti
sh)
Wh
ite
(Ir
ish
)
Wh
ite
(O
ther
)
Wh
ite
(Sc
ott
ish
)
1 125 15 4
46 315 5 6 5 3 5
117
26 22 11
371
1952
1
Number of Workforce by Ethnicity
A broad comparison with our learners shows a distinct variation in the ethnic makeup of
the College (staff compared to Learners). Our staff profile shows 48.12% are ‘White
British’ and our Learners profile shows 41.1% are in the categories of
‘English/Welsh/Scottish/Northern Irish/British’ and ‘Any other White background’. The
other categories of Ethnicity within the Workforce profile making up 36.71% (with over
15% either not known or shown as blank entries), this compares to 47.6% (with over
11% shown as ‘not provided’) for the sum of the other categories for our Learners. Other
prominent categories within the staff profile include 6.74% are ‘White other’, 5.2% are
‘Black or Black British African’ and 4.02% are ‘Black or Black Caribbean. This compares
to the same categories for Learners where these were 14.3% (White other), 14.5%
(Black African) and 4.2% (Black Caribbean) respectively.
These continued disparities identify that if the College has aspirations to ‘mirror’ its
Learner profile large scale work is required.
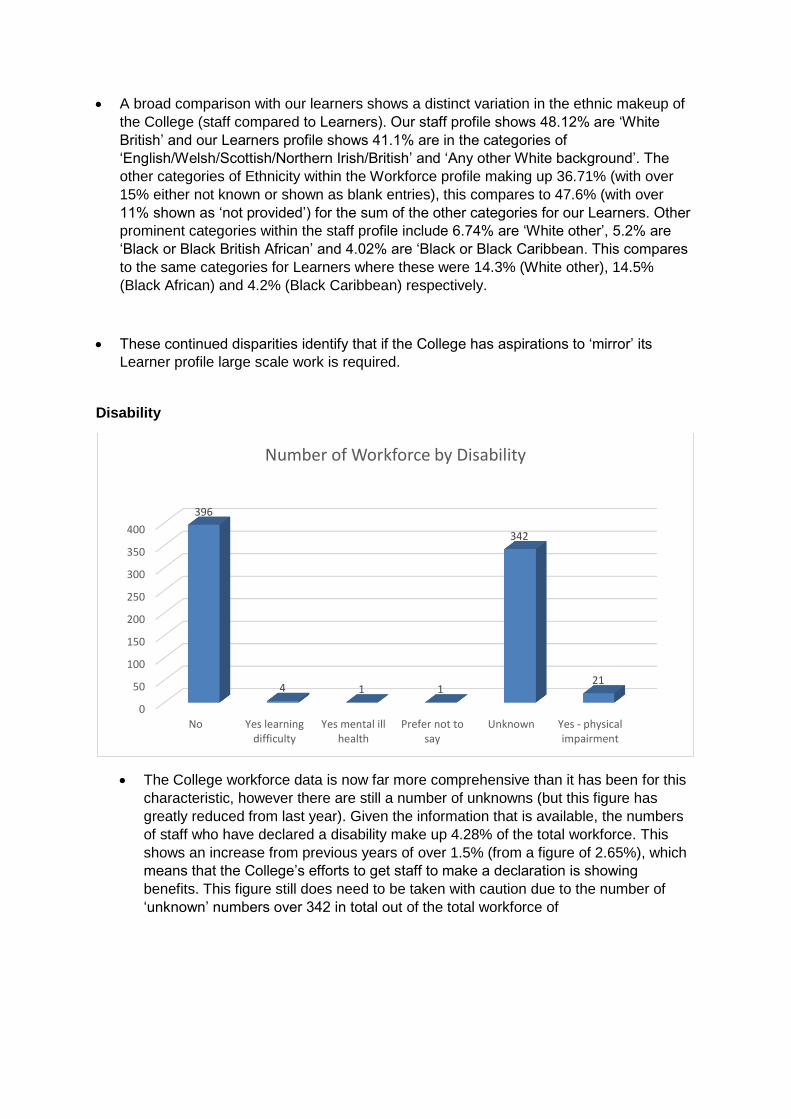
Disability
The College workforce data is now far more comprehensive than it has been for this
characteristic, however there are still a number of unknowns (but this figure has
greatly reduced from last year). Given the information that is available, the numbers
of staff who have declared a disability make up 4.28% of the total workforce. This
shows an increase from previous years of over 1.5% (from a figure of 2.65%), which
means that the College’s efforts to get staff to make a declaration is showing
benefits. This figure still does need to be taken with caution due to the number of
‘unknown’ numbers over 342 in total out of the total workforce of
0
50
100
150
200
250
300
350
400
No Yes learningdifficulty
Yes mental illhealth
Prefer not tosay
Unknown Yes - physicalimpairment
396
4 1 1
342
21
Number of Workforce by Disability

Age
The college workforce data is provided in age ranges. Analysis indicates that the
greatest density of staff within the ranges of ‘36-45 years old’ being 30.75% and ‘46-
55 years old’ being 36.96%. Other ranges where there are interesting trends include
far greater staff towards the higher age brackets of ‘60-64’ and ‘65+’ (totalling nearly
12.58% for both ranges), than the lower age brackets of ‘16-20’ and ‘21-25’ (these
total less than 4.41%). The College continues to have confidence in the data that has
been collected and shows only 1.03% are within the age range 16-18 alone, in line
with our provision for this group of learners.
Sexual Orientation
This is the first year that the College has collected this characteristics data and this
shows that there is a predominance in the heterosexual characteristic 34.32% of 265
of 772 total. There is more to be done in ensuring we carry on collecting this data, so
that the ‘unknown’ total is minimised.
0
50
100
150
200
250
300
Age 16-20 Age 21-25 Age 26-35 Age 36-45 Age 46-55 Age 56-59 Age 60-64 Age 65+
826
102
160
285
94
67
30
Number of Workforce by Age
Number of Staff
050
100150200250300350400450
4 1
265
1
93
408
Number of Staff by Sexual Orientation
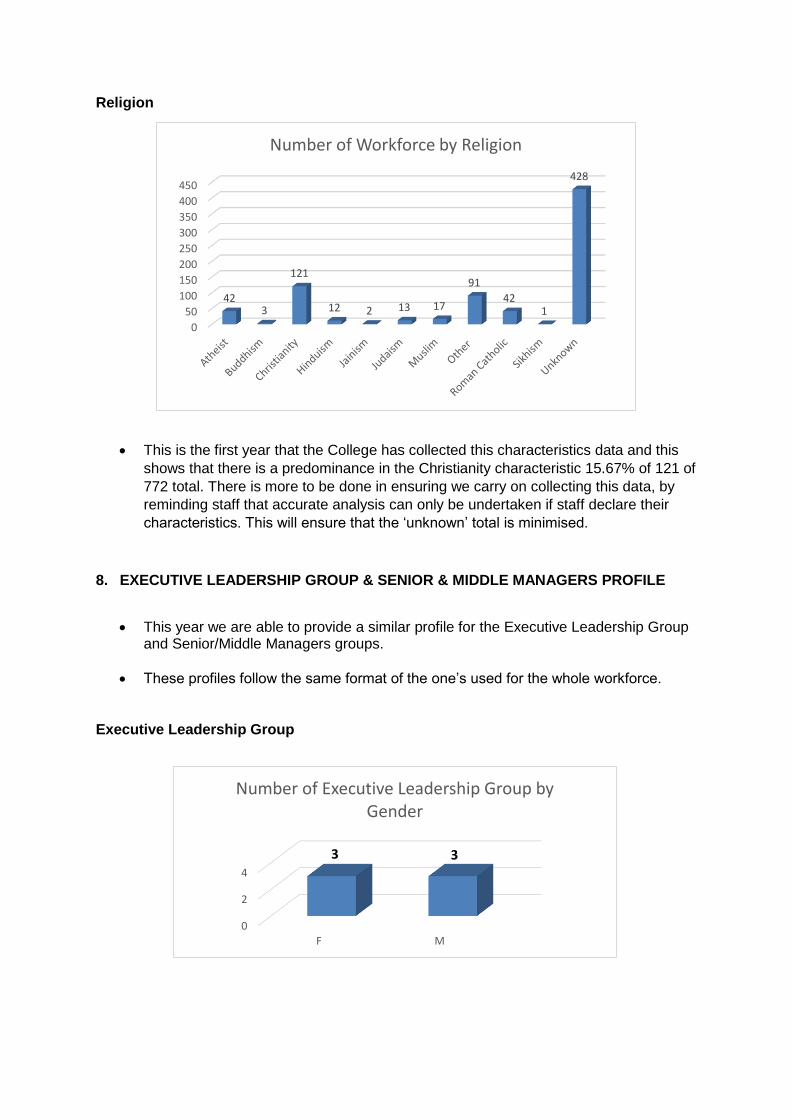
Religion
This is the first year that the College has collected this characteristics data and this
shows that there is a predominance in the Christianity characteristic 15.67% of 121 of
772 total. There is more to be done in ensuring we carry on collecting this data, by
reminding staff that accurate analysis can only be undertaken if staff declare their
characteristics. This will ensure that the ‘unknown’ total is minimised.
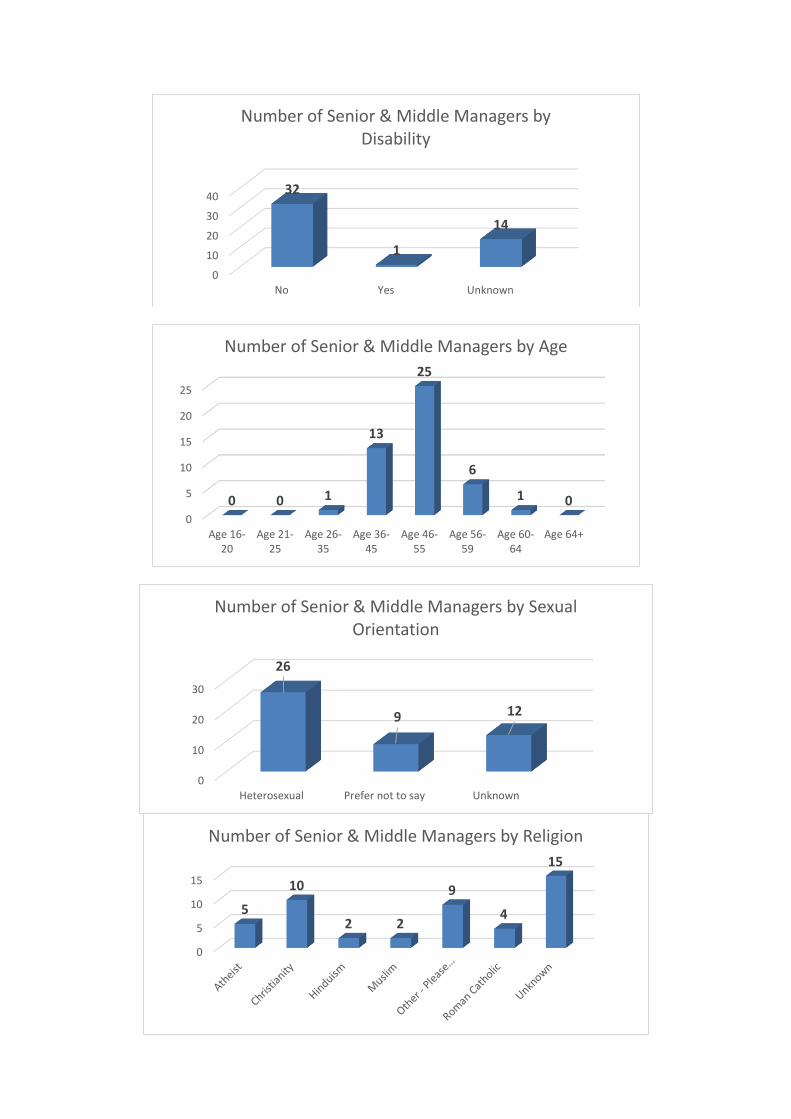
8. EXECUTIVE LEADERSHIP GROUP & SENIOR & MIDDLE MANAGERS PROFILE
This year we are able to provide a similar profile for the Executive Leadership Group and Senior/Middle Managers groups.
These profiles follow the same format of the one’s used for the whole workforce.
Executive Leadership Group
0
50
100
150
200
250
300
350
400
450
423
121
12 2 13 17
91
421
428
Number of Workforce by Religion
0
2
4
F M
3 3
Number of Executive Leadership Group by Gender

0
2
4
6
White (British) Any other race
6
0
Number of Executive Leadership by Ethnicity
0
2
4
6
No Yes
6
0
Number of Executive Leadership by Disability
0
0.5
1
1.5
2
Age 16-20
Age 21-25
Age 26-35
Age 36-45
Age 46-55
Age 56-59
Age 60-64
Age 65+
0 0
1 1
2 2
0 0
Number of Execuive Leadership Group by Age
0
2
4
Heterosexual Prefer not to say
4
2
Number of Executive Leadership by Sexual Orientation

Senior & Middle Managers Profile
0
0.5
1
1.5
2
Other - PleaseSpecify
Atheist Christianity
2 2 2
Number of Executive Leadership by Religion
0
5
10
15
20
25
30
F M
2621
Number of Senior & Middle Managers by Gender
05
101520253035
2 2 1 1 1 1 1
32
2 1 1 2
Number of Senior & Middle Managers by Ethnicity
0
10
20
30
40
No Yes Unknown
32
1
14
Number of Senior & Middle Managers by Disability
0
5
10
15
20
25
Age 16-20
Age 21-25
Age 26-35
Age 36-45
Age 46-55
Age 56-59
Age 60-64
Age 64+
0 0 1
13
25
6
1 0
Number of Senior & Middle Managers by Age
0
10
20
30
Heterosexual Prefer not to say Unknown
26
9 12
Number of Senior & Middle Managers by Sexual Orientation
0
5
10
15
5
10
2 2
9
4
15
Number of Senior & Middle Managers by Religion
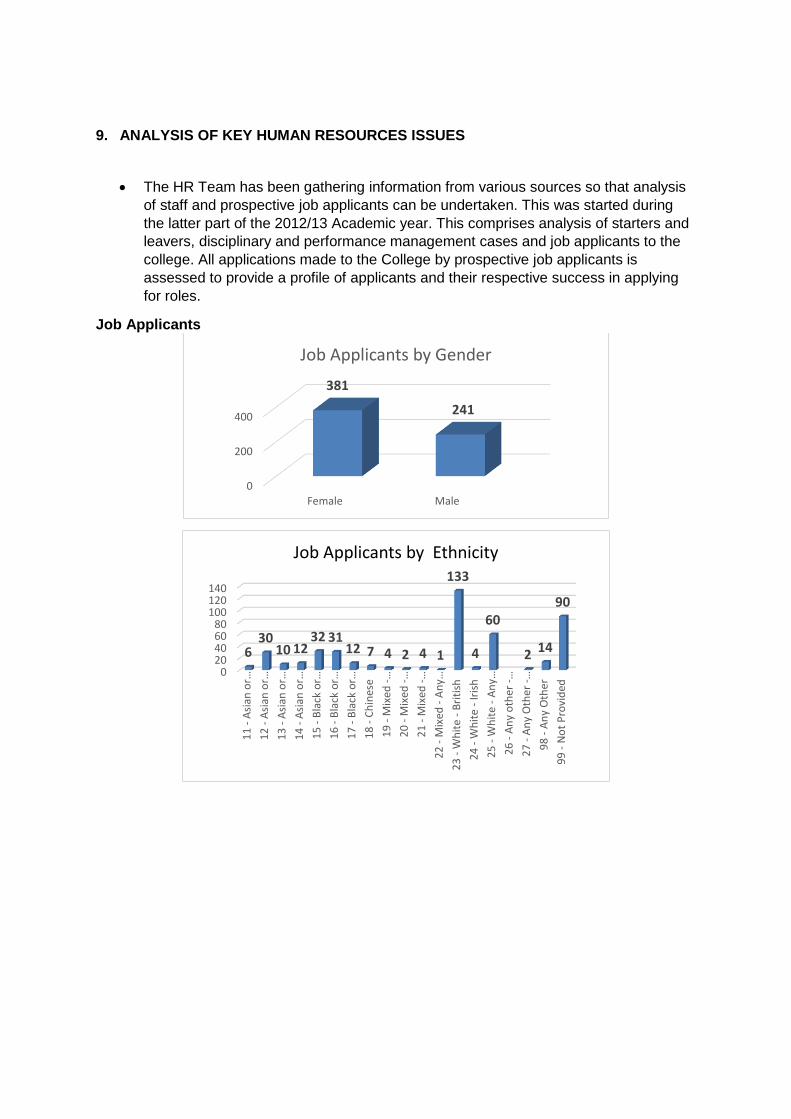
9. ANALYSIS OF KEY HUMAN RESOURCES ISSUES
The HR Team has been gathering information from various sources so that analysis
of staff and prospective job applicants can be undertaken. This was started during
the latter part of the 2012/13 Academic year. This comprises analysis of starters and
leavers, disciplinary and performance management cases and job applicants to the
college. All applications made to the College by prospective job applicants is
assessed to provide a profile of applicants and their respective success in applying
for roles.
Job Applicants
0
200
400
Female Male
381
241
Job Applicants by Gender
020406080
100120140
11
- A
sian
or…
12
- A
sian
or…
13
- A
sian
or…
14
- A
sian
or…
15
- B
lack
or…
16
- B
lack
or…
17
- B
lack
or…
18
- C
hin
ese
19
- M
ixed
-…
20
- M
ixed
-…
21
- M
ixed
-…
22
- M
ixed
- A
ny…
23
- W
hit
e -
Bri
tish
24
- W
hit
e -
Iris
h
25
- W
hit
e -
An
y…
26
- A
ny
oth
er -
…
27
- A
ny
Oth
er -
…
98
- A
ny
Oth
er
99
- N
ot
Pro
vid
ed
630
10 1232 31
12 7 4 2 4 1
133
4
60
2 14
90
Job Applicants by Ethnicity

This data uses the information that has been gathered and analysed since the last data
was reported on i.e. since December 2013, which includes analysis against the initial
protected characteristics of Gender, Ethnicity, Age and Disability. There were 622
applicants, of which 4.98% declared they had a disability.
Age range 16-20 21-25 26-35 36-45 46-55 56-59 60-64 Not provided
1.12% 5.14% 12.05% 8.84% 10.13% 2.09% 0.64% 25.08%
The College has had 113 new starters since the beginning of December 2013, out of
this, 1 (0.88%) new starter declared they had a disability, 19 (15.92%) declared they
had no disability and 93 (82.3%) with no declaration. Of these 113 new starters 42
(37.16%) were male and 71 (62.84%) were female.
0
50
100
150
200
732
7555 63
13 4
156
Age
Job Applicants by Age
0
50
100
150
200
250
300
350
Yes No Not provided
31
325
90
Job Applicants by Disability
Gender Male Female
38.74% 61.25%
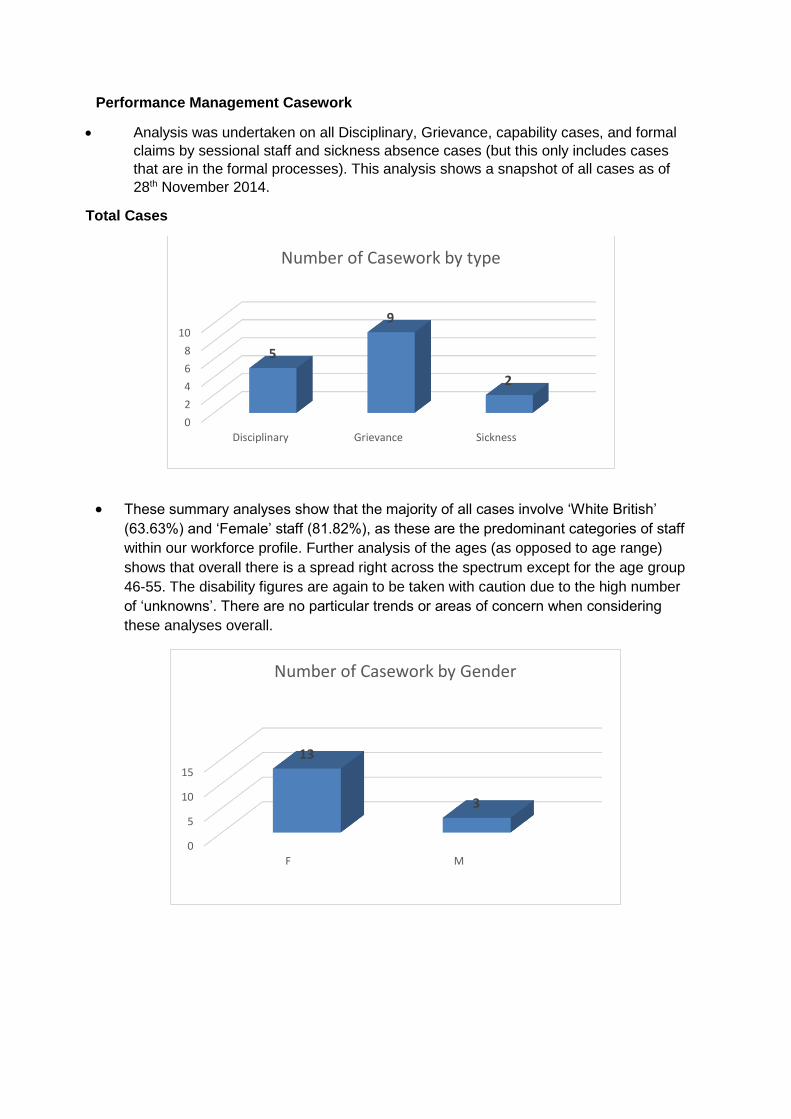
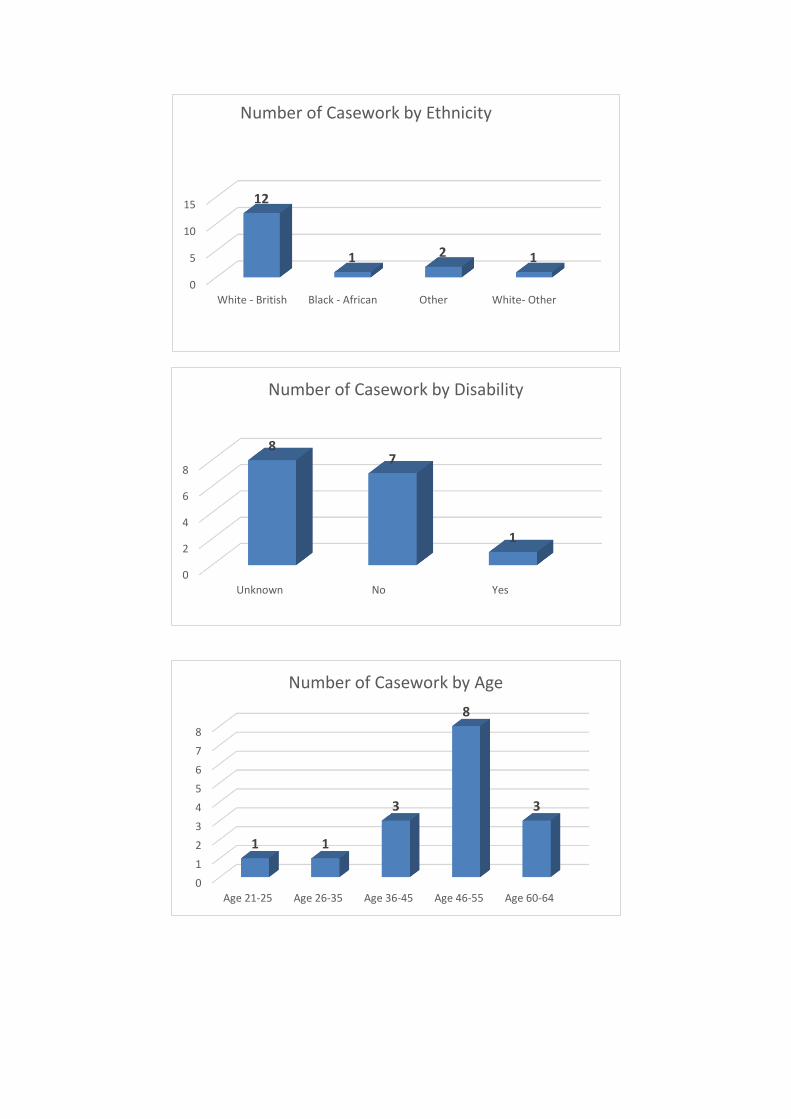
Performance Management Casework
Analysis was undertaken on all Disciplinary, Grievance, capability cases, and formal
claims by sessional staff and sickness absence cases (but this only includes cases
that are in the formal processes). This analysis shows a snapshot of all cases as of
28th November 2014.
Total Cases
These summary analyses show that the majority of all cases involve ‘White British’
(63.63%) and ‘Female’ staff (81.82%), as these are the predominant categories of staff
within our workforce profile. Further analysis of the ages (as opposed to age range)
shows that overall there is a spread right across the spectrum except for the age group
46-55. The disability figures are again to be taken with caution due to the high number
of ‘unknowns’. There are no particular trends or areas of concern when considering
these analyses overall.
0
2
4
6
8
10
Disciplinary Grievance Sickness
5
9
2
Number of Casework by type
0
5
10
15
F M
13
3
Number of Casework by Gender
0
5
10
15
White - British Black - African Other White- Other
12
1 2 1
Number of Casework by Ethnicity
0
2
4
6
8
Unknown No Yes
87
1
Number of Casework by Disability
0
1
2
3
4
5
6
7
8
Age 21-25 Age 26-35 Age 36-45 Age 46-55 Age 60-64
1 1
3
8
3
Number of Casework by Age

Leavers
There has been a total of 134 leavers since Leavers during the period December 2013
and November 2014.
The majority of leavers are women, 79 (58.95%) out of 134 leavers. This is in proportion to the numbers of females working within the College which is 69.13%.
0
1
2
3
4
5
6
7
8
9
Atheist Christianity Other RomanCatholic
Unknown
1 1
32
9
Number of Casework by Religion
0
50
100
F M
7955
Number of leavers by Gender
1 1 2 3 1 3 4 1 1
23
8 4
66
410
1 10
10203040506070
Number of leavers by Ethnicity

The majority of leavers are White British, which is where the majority of our workforce
is, so this is to be expected. There are no other worrying trends.
The majority of our workforce is in the 3 main age ranges of leavers, so this is to be
expected. The latter age ranges show more of an impact compared to the total
numbers within the workforce profile. This is due to the recent Voluntary Early
Retirements/Severances within the College
There were 134 leavers during the 2013/14 Academic Year of these 55 (41.04%)
were men and 79 (58.95%) were women, this compares to the overall workforce
profile of 30.87% men and 69.13% women, so the proportion of male and female
leavers is in direct correlation with that of the overall workforce profile. Leavers by
ethnicity shows a similar correlation, where the greatest level of leavers is within the
‘White British’ category with 49.25% of leavers, in line with the workforce profile (first
section of the HR data provided in this report) where ‘White British’ is the largest
group of staff with 48.05%. Staff who left the College who had declared a disability,
were 2.98% of total leavers compared with the workforce profile of 4.28% (caution
advised in using this figure due to the levels of ‘Blanks’ etc.). Leavers by age range,
0
5
10
15
20
25
30
35
Age 16-20
Age 21-25
Age 26-35
Age 36-45
Age 46-55
Age 56-59
Age 60-64
Age 65+
1
7
25 25
34
1215 15
Number of Leavers by Age Group
0
10
20
30
40
50
60
70
No Unknown Yes -learningdifficulty
Yes - mentalill health
Yes - mentalill health
Yes - rathernot say
6861
1 1 1 2
Number of leavers by Disability
does indicate that there are the greatest number of leavers in one of the largest age
ranges the College has in its workforce profile i.e. 46-55 years old. However the next
largest grouping of leavers is in the range of 26-35 and 36-45 years old being the
second largest group according to the workforce profile.
10. PROGRESS ON COLLECTING FURTHER EQUALITY AND DIVERSITY MONITORING
DATA
The College has a duty to collect, collate and analyse a full range of equality and
diversity data in order to respond to the Equalities Act 2010 and the Public Sector
Equalities Duty. The College does collect information on Gender, Age, Ethnicity and
Disability. It also knows when staff are on maternity/paternity leave, but has not
regularly or holistically done so with the other protected characteristics (sexual
preference, gender reassignment, religion and belief and marital status). From
November 2013, all existing staff will be able to update their ‘on-line E&D monitoring
information’ via the College’s ‘HR Self Service’ system. This will allow all existing
staff to provide the information that is missing. The College also utilises a full
monitoring request when new staff apply to the College for jobs (this was introduced
during the summer). The fuller information that the College receives will allow more
intuitive monitoring of the situation and allow matters to be highlighted, analysed and
appropriate action recommended and taken.
More analysis will be provided throughout this Academic year, this will involving the
refining of the methods used to analyse the data so that monitoring activity will
identify any trends or hotspots that maybe forming or occurring.
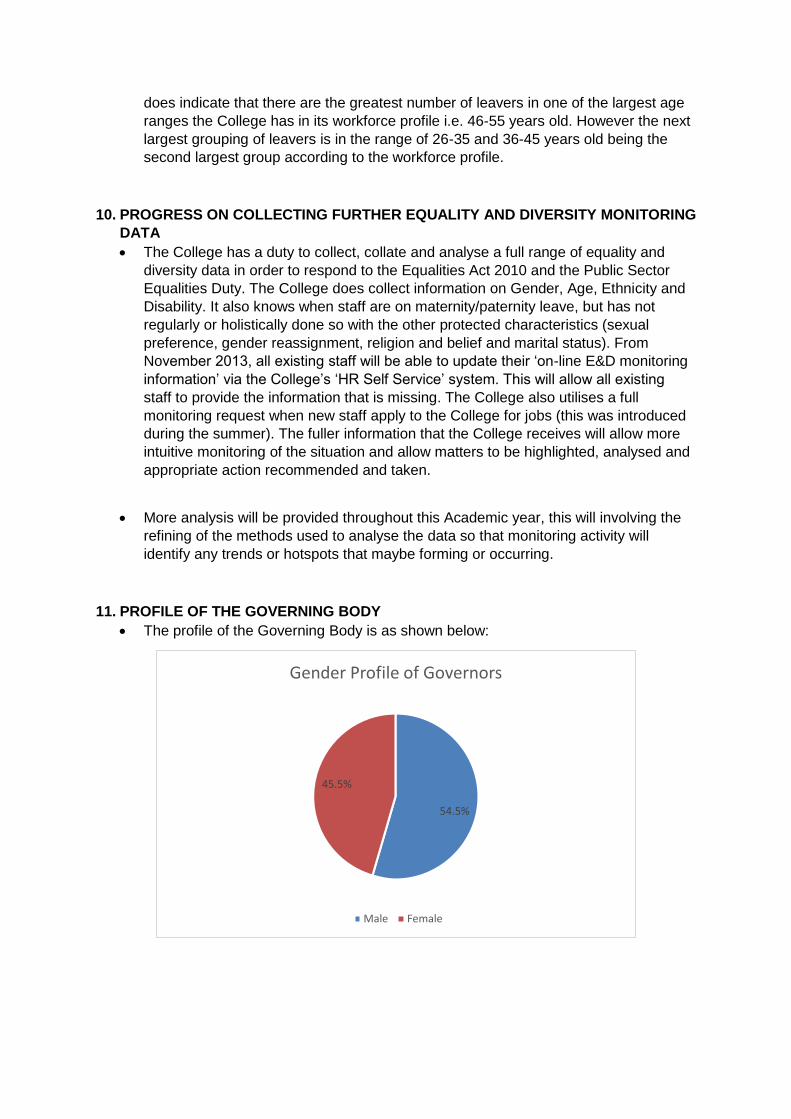
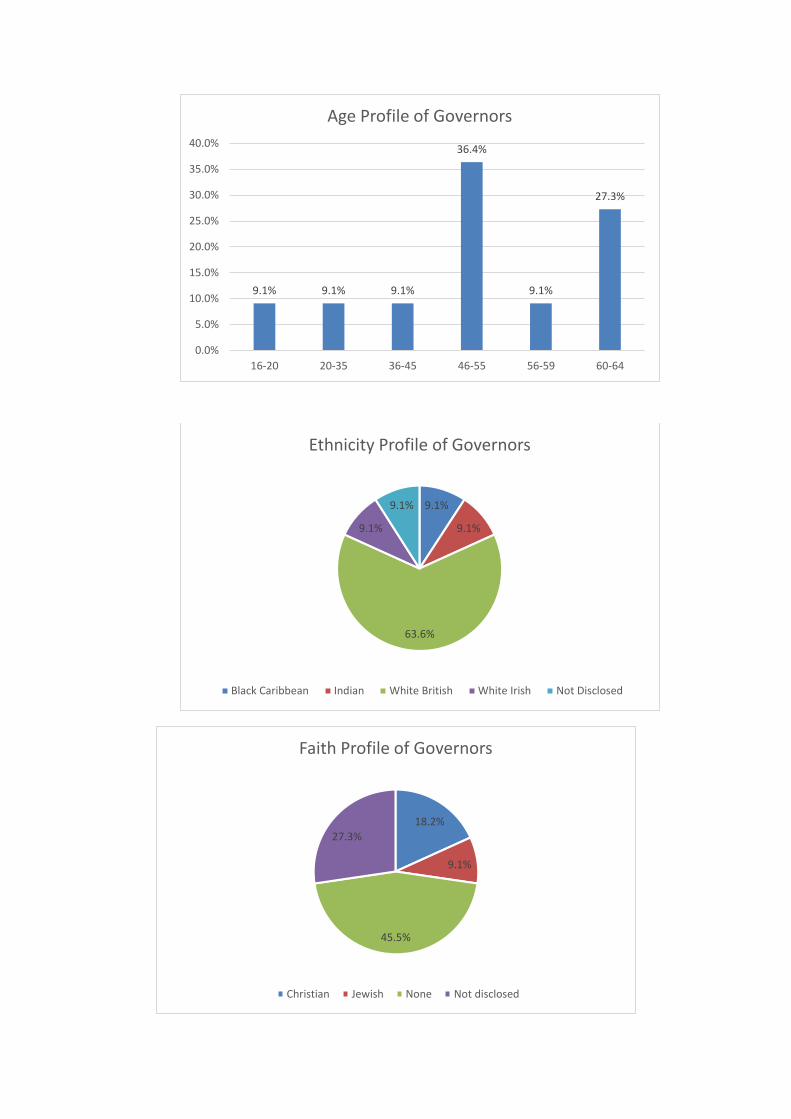
11. PROFILE OF THE GOVERNING BODY
The profile of the Governing Body is as shown below:
54.5%
45.5%
Gender Profile of Governors
Male Female
9.1% 9.1% 9.1%
36.4%
9.1%
27.3%
0.0%
5.0%
10.0%
15.0%
20.0%
25.0%
30.0%
35.0%
40.0%
16-20 20-35 36-45 46-55 56-59 60-64
Age Profile of Governors
9.1%
9.1%
63.6%
9.1%
9.1%
Ethnicity Profile of Governors
Black Caribbean Indian White British White Irish Not Disclosed
18.2%
9.1%
45.5%
27.3%
Faith Profile of Governors
Christian Jewish None Not disclosed
12. STAFF DEVELOPMENT
A total of 186 staff who attended a form of diversity training in the academic year 13/14. The topics included;
o AOC Annual Conference on Equality and Diversity – attended by a member
of the Executive Leadership Group o Equality Impact Assessments delivered by Christine Rose – attended by
members of the Diversity Forum and the Executive Leadership Group. A total of 10 people attended.
o Supported Learning attended their own workshop on ‘introduction to the equality act’ - attended by 14 people.
o Eclipse, a mental health service ran a series of three sessions on mental health awareness, which were piloted at Wood Street. The first session had 7 attendees, second had 16 attendees and the final one had 12. This was free of charge to the College.
o A total of 9 Teaching and Learning Coach sessions were scheduled and the total number of delegates was 28.
o An event was put on specifically for teaching staff entitled ‘integrating Equality and Diversity into the curriculum’ to which 47 people attended. Of those there were 2 heads of departments, one director, 5 Teaching and Learning Coaches and one of the diversity champions who had attended the Stonewall Training. This was delivered by Christine Rose.
o Three members of staff attended the one day ‘train the trainer programme with Stonewall’ so they could become diversity champions for the college.
o Diversity is a key element within the corporate induction and there were 54 people who attended one of the 5 sessions programmed throughout the academic year.
In addition to the above as part of the staff conference a series of seminars for staff on mindfulness were presented, again by Eclipse, free of charge.
The total spend on diversity training has been £3059.80 in the academic year 2013-14.
The evaluation of the training on Equality and Diversity has been very positive.
55% of staff rated the session on integrating equality and diversity into the curriculum as excellent, a further 295 rated it as good with 41% saying they had learnt new skills and 97% agreeing they had gained new knowledge.
60% of participants stated that they had gained new knowledge through the Equality Impact Assessment training.
For the Stonewall session, two of the champions attended the Equality and Diversity Strategy Group workshop and presented their findings. Their knowledge is being used to develop training packages on homophobia to learners and staff.
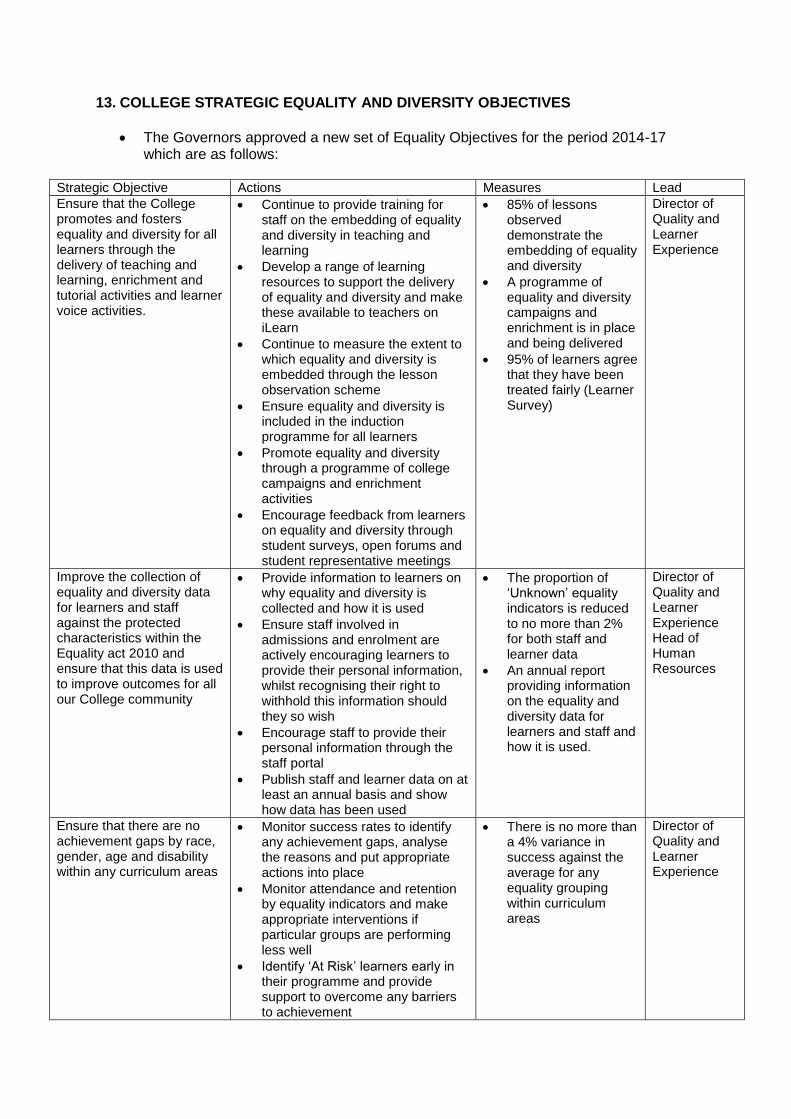
13. COLLEGE STRATEGIC EQUALITY AND DIVERSITY OBJECTIVES
The Governors approved a new set of Equality Objectives for the period 2014-17 which are as follows:
Strategic Objective Actions Measures Lead
Ensure that the College promotes and fosters equality and diversity for all learners through the delivery of teaching and learning, enrichment and tutorial activities and learner voice activities.
Continue to provide training for staff on the embedding of equality and diversity in teaching and learning
Develop a range of learning resources to support the delivery of equality and diversity and make these available to teachers on iLearn
Continue to measure the extent to which equality and diversity is embedded through the lesson observation scheme
Ensure equality and diversity is included in the induction programme for all learners
Promote equality and diversity through a programme of college campaigns and enrichment activities
Encourage feedback from learners on equality and diversity through student surveys, open forums and student representative meetings
85% of lessons observed demonstrate the embedding of equality and diversity
A programme of equality and diversity campaigns and enrichment is in place and being delivered
95% of learners agree that they have been treated fairly (Learner Survey)
Director of Quality and Learner Experience
Improve the collection of equality and diversity data for learners and staff against the protected characteristics within the Equality act 2010 and ensure that this data is used to improve outcomes for all our College community
Provide information to learners on why equality and diversity is collected and how it is used
Ensure staff involved in admissions and enrolment are actively encouraging learners to provide their personal information, whilst recognising their right to withhold this information should they so wish
Encourage staff to provide their personal information through the staff portal
Publish staff and learner data on at least an annual basis and show how data has been used
The proportion of ‘Unknown’ equality indicators is reduced to no more than 2% for both staff and learner data
An annual report providing information on the equality and diversity data for learners and staff and how it is used.
Director of Quality and Learner Experience Head of Human Resources
Ensure that there are no achievement gaps by race, gender, age and disability within any curriculum areas
Monitor success rates to identify any achievement gaps, analyse the reasons and put appropriate actions into place
Monitor attendance and retention by equality indicators and make appropriate interventions if particular groups are performing less well
Identify ‘At Risk’ learners early in their programme and provide support to overcome any barriers to achievement
There is no more than a 4% variance in success against the average for any equality grouping within curriculum areas
Director of Quality and Learner Experience
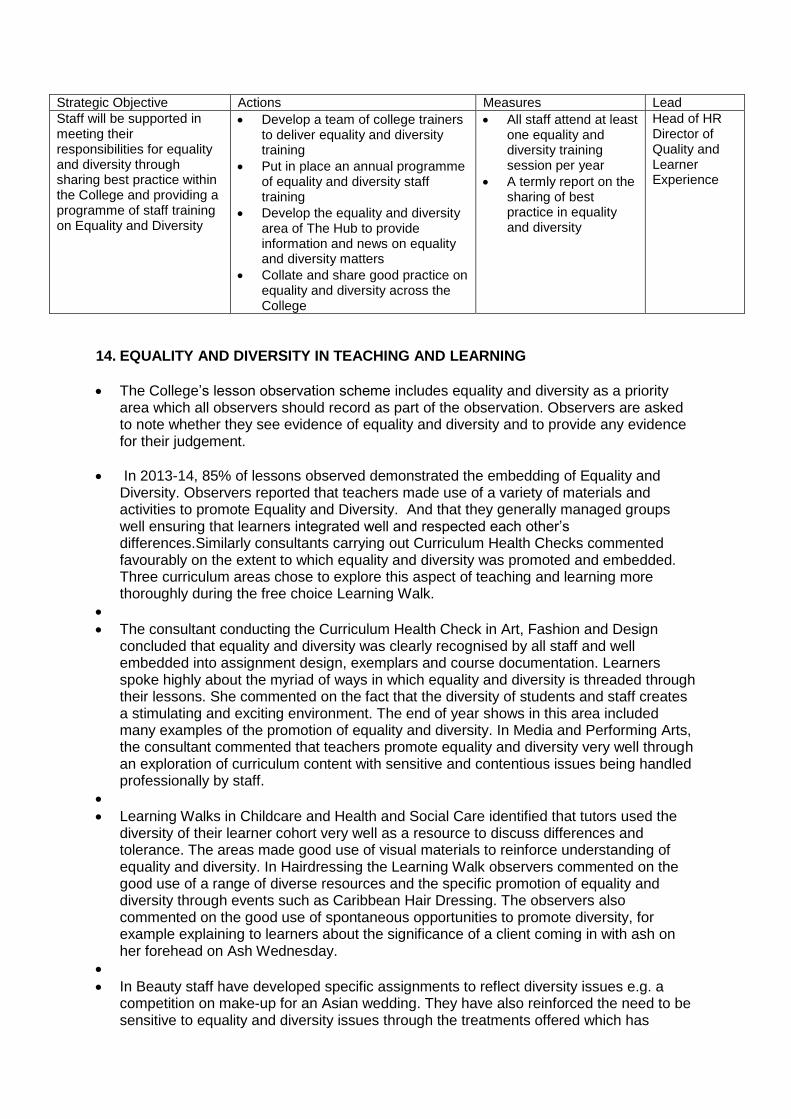
Strategic Objective Actions Measures Lead
Staff will be supported in meeting their responsibilities for equality and diversity through sharing best practice within the College and providing a programme of staff training on Equality and Diversity
Develop a team of college trainers to deliver equality and diversity training
Put in place an annual programme of equality and diversity staff training
Develop the equality and diversity area of The Hub to provide information and news on equality and diversity matters
Collate and share good practice on equality and diversity across the College
All staff attend at least one equality and diversity training session per year
A termly report on the sharing of best practice in equality and diversity
Head of HR Director of Quality and Learner Experience
14. EQUALITY AND DIVERSITY IN TEACHING AND LEARNING
The College’s lesson observation scheme includes equality and diversity as a priority area which all observers should record as part of the observation. Observers are asked to note whether they see evidence of equality and diversity and to provide any evidence for their judgement.
In 2013-14, 85% of lessons observed demonstrated the embedding of Equality and Diversity. Observers reported that teachers made use of a variety of materials and activities to promote Equality and Diversity. And that they generally managed groups well ensuring that learners integrated well and respected each other’s differences.Similarly consultants carrying out Curriculum Health Checks commented favourably on the extent to which equality and diversity was promoted and embedded. Three curriculum areas chose to explore this aspect of teaching and learning more thoroughly during the free choice Learning Walk.
The consultant conducting the Curriculum Health Check in Art, Fashion and Design concluded that equality and diversity was clearly recognised by all staff and well embedded into assignment design, exemplars and course documentation. Learners spoke highly about the myriad of ways in which equality and diversity is threaded through their lessons. She commented on the fact that the diversity of students and staff creates a stimulating and exciting environment. The end of year shows in this area included many examples of the promotion of equality and diversity. In Media and Performing Arts, the consultant commented that teachers promote equality and diversity very well through an exploration of curriculum content with sensitive and contentious issues being handled professionally by staff.
Learning Walks in Childcare and Health and Social Care identified that tutors used the diversity of their learner cohort very well as a resource to discuss differences and tolerance. The areas made good use of visual materials to reinforce understanding of equality and diversity. In Hairdressing the Learning Walk observers commented on the good use of a range of diverse resources and the specific promotion of equality and diversity through events such as Caribbean Hair Dressing. The observers also commented on the good use of spontaneous opportunities to promote diversity, for example explaining to learners about the significance of a client coming in with ash on her forehead on Ash Wednesday.
In Beauty staff have developed specific assignments to reflect diversity issues e.g. a competition on make-up for an Asian wedding. They have also reinforced the need to be sensitive to equality and diversity issues through the treatments offered which has
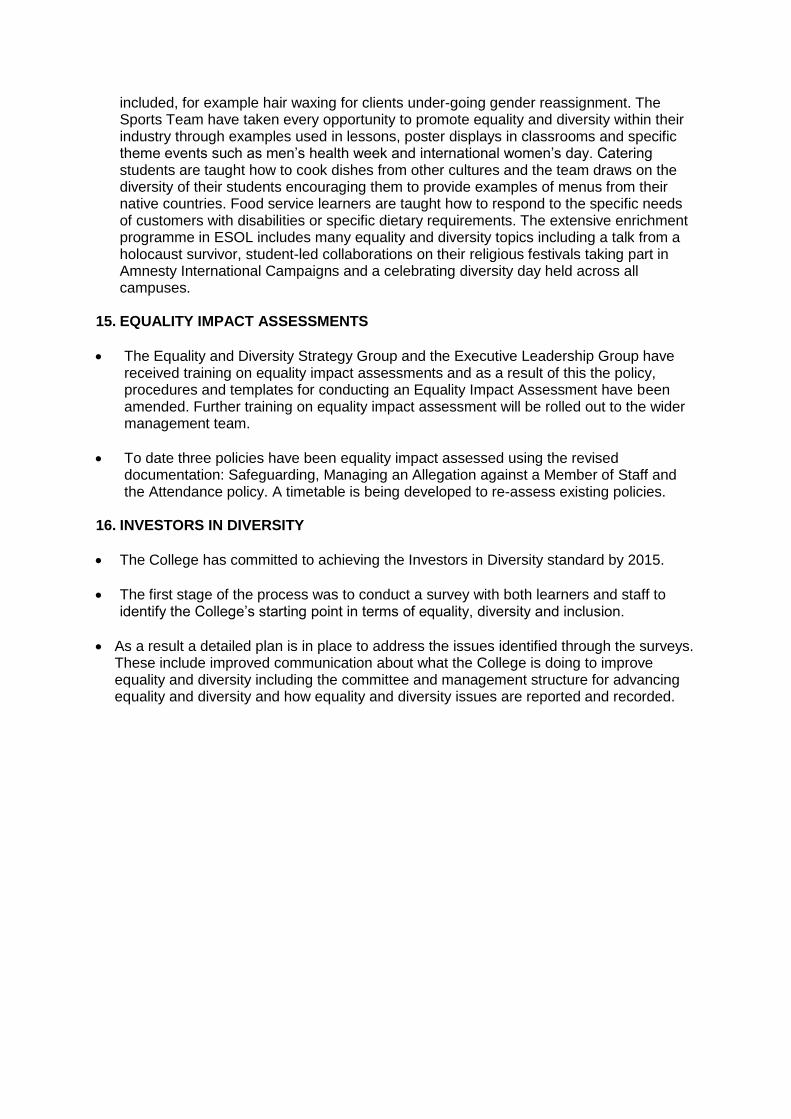
included, for example hair waxing for clients under-going gender reassignment. The Sports Team have taken every opportunity to promote equality and diversity within their industry through examples used in lessons, poster displays in classrooms and specific theme events such as men’s health week and international women’s day. Catering students are taught how to cook dishes from other cultures and the team draws on the diversity of their students encouraging them to provide examples of menus from their native countries. Food service learners are taught how to respond to the specific needs of customers with disabilities or specific dietary requirements. The extensive enrichment programme in ESOL includes many equality and diversity topics including a talk from a holocaust survivor, student-led collaborations on their religious festivals taking part in Amnesty International Campaigns and a celebrating diversity day held across all campuses.
15. EQUALITY IMPACT ASSESSMENTS
The Equality and Diversity Strategy Group and the Executive Leadership Group have received training on equality impact assessments and as a result of this the policy, procedures and templates for conducting an Equality Impact Assessment have been amended. Further training on equality impact assessment will be rolled out to the wider management team.
To date three policies have been equality impact assessed using the revised documentation: Safeguarding, Managing an Allegation against a Member of Staff and the Attendance policy. A timetable is being developed to re-assess existing policies.
16. INVESTORS IN DIVERSITY
The College has committed to achieving the Investors in Diversity standard by 2015.
The first stage of the process was to conduct a survey with both learners and staff to identify the College’s starting point in terms of equality, diversity and inclusion.
As a result a detailed plan is in place to address the issues identified through the surveys. These include improved communication about what the College is doing to improve equality and diversity including the committee and management structure for advancing equality and diversity and how equality and diversity issues are reported and recorded.

EQUALITY, DIVERSITY AND INCLUSION
2013-14
Annual Report to the Board
December 2014


