Page 1 2017 Easy REACH Example Pigment Report v2.docx
Analytical Report
Characterisation of an Example substance
Client – Example Report
Contact – Example Report
Author – Example Report
Date - 2017
Page 2 2017 Easy REACH Example Pigment Report v2.docx
Contents 1. Study Summary Page 3
2. Samples/Appearance Page 5
3. Analytical Methods & Results Page 6
3.1 FT-IR Spectroscopy Page 6
3.2 Qualitative 1H NMR Spectroscopy Page 8
3.3 UV-Vis Spectroscopy Page 16
3.4 Elemental Analysis for C, H and N Content Page 19
3.5 Organic Components Page 20
3.6 Impurities Page 23
3.7 Coulometric Water Content Determination Page 27
4. Conclusion Page 28 Appendix Page 30 XXXXXX Page 42
Page 3 2017 Easy REACH Example Pigment Report v2.docx
1. Study Summary The chemical structure of Example substance was characterised by the standard spectrographic analytical methods; UV-vis, FT-IR, and NMR Pigments are by definition insoluble in most solvents therefore standard chromatographic analytical procedures to establish the purity of the substance and impurities cannot be used. Text removed for Example report – other methods used. Example substance is a monoazo pigment, manufactured by a diazotisation and coupling reaction. In this type of reaction, the xxxxxx xxxxxxxxx xx xx xxxxxx xxx xxxxxxxx xx x xxxxxx xxxxxx.
Manufacturing process
Removed for Example Report
Page 4 2017 Easy REACH Example Pigment Report v2.docx
Text removed from Example Report
Page 5 2017 Easy REACH Example Pigment Report v2.docx
2. Samples/Appearance
Sample Name Ref No Ref No Appearance
Example substance Example
substance Example Report Example substance
Product Name C.I. Example substance CAS Number Example substance EC Number Example substance Chemical Name Example substance Structure:
Molecular formula = Example substance
Molecular weight = Example substance
Structure removed for Example Report
Page 6 2017 Easy REACH Example Pigment Report v2.docx
3. Analytical Methods & Results All volume determinations were made using autopipettors unless stated otherwise.
3.1 FT-IR Spectroscopy
FTIR with ATR accessory
Instrument Example Report
ATR accessory Example Report
Scan Range / cm-1 Example Report
No. of Scans Example Report
Background subtraction Example Report
Resolution Example Report
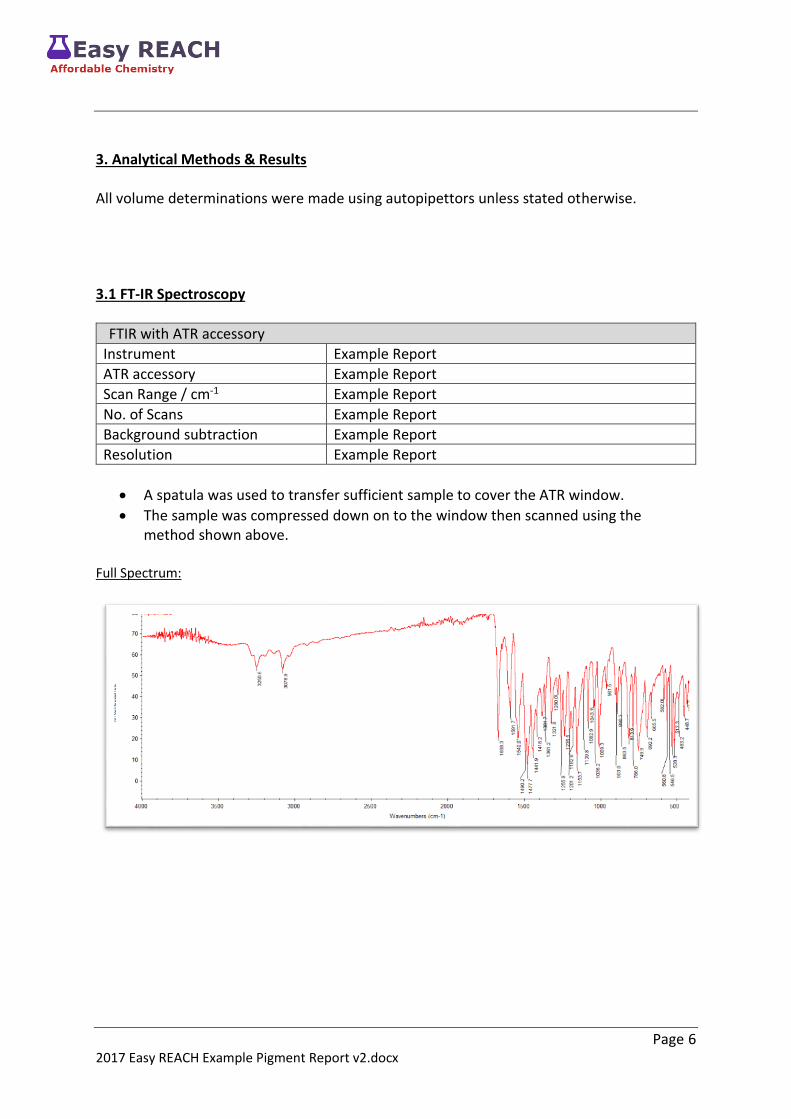
A spatula was used to transfer sufficient sample to cover the ATR window.
The sample was compressed down on to the window then scanned using the method shown above.
Full Spectrum:
Page 7 2017 Easy REACH Example Pigment Report v2.docx
400 – 2000 cm-1;
2000 – 4000 cm-
As the peaks are primarily found in the fingerprint region of the FTIR spectrum (<1500 cm-1) definitive assignment is difficult. A broad assignment of peaks is shown below:
Wavenumber / cm-1 Assignment
3251 NH2 amides
3079 OH + ArCH
1668 C=O amide
1592 Ar
1540 NH secondary amide
1410 – 1500 NH amide, Ar, C-N
1322 Ar-OH
1230 – 1260 C-N
1150 – 1210 C-C-N, C-OH
1000 – 1110 C-N
650 - 900 ArCH + Ar-Cl
FTIR is consistent with the proposed structure
Removed for Example Report
Removed for Example Report
Page 8 2017 Easy REACH Example Pigment Report v2.docx
3.2 Qualitative 1H NMR Spectroscopy
NMR Parameters – 1H
NMR model Example Report
Frequency Example Report
Probe Example Report
Pulse program Example Report
Size of FID Example Report
Solvent Example Report
Number of Scans Example Report
Dummy scans Example Report
Sweep Width Example Report
Decay FID Res Example Report
Acquisition time Example Report
Receiver gain Example Report
Dwell time Example Report
Pre-scan delay Example Report
Temperature of acquisition Example Report
Delay time, D1 Example Report
Nucleus Example Report
90o pulse width Example Report
Freq of observed channel Example Report
20 mg of sample was weighed into a 7 ml vial and 1 ml of text removed from example report was added using a pipette.
The vial was capped and sonicated for 20 mins to aid dissolution of the sample. Approximately 0.6 ml of the resulting solution was then transferred to an NMR tube for analysis.
Page 9 2017 Easy REACH Example Pigment Report v2.docx
1H NMR – Full Spectrum:
Removed for Example Report
Page 10 2017 Easy REACH Example Pigment Report v2.docx
7.5 – 9.5 ppm: Text and interpretation removed from example report.
Removed for Example Report
Page 11 2017 Easy REACH Example Pigment Report v2.docx
Text removed from Example Report

Page 12 2017 Easy REACH Example Pigment Report v2.docx
Text removed from Example Report

Page 13 2017 Easy REACH Example Pigment Report v2.docx
Text removed from Example Report

Page 14 2017 Easy REACH Example Pigment Report v2.docx
Text removed from Example Report

Page 15 2017 Easy REACH Example Pigment Report v2.docx
Text removed from Example Report
Page 16 2017 Easy REACH Example Pigment Report v2.docx
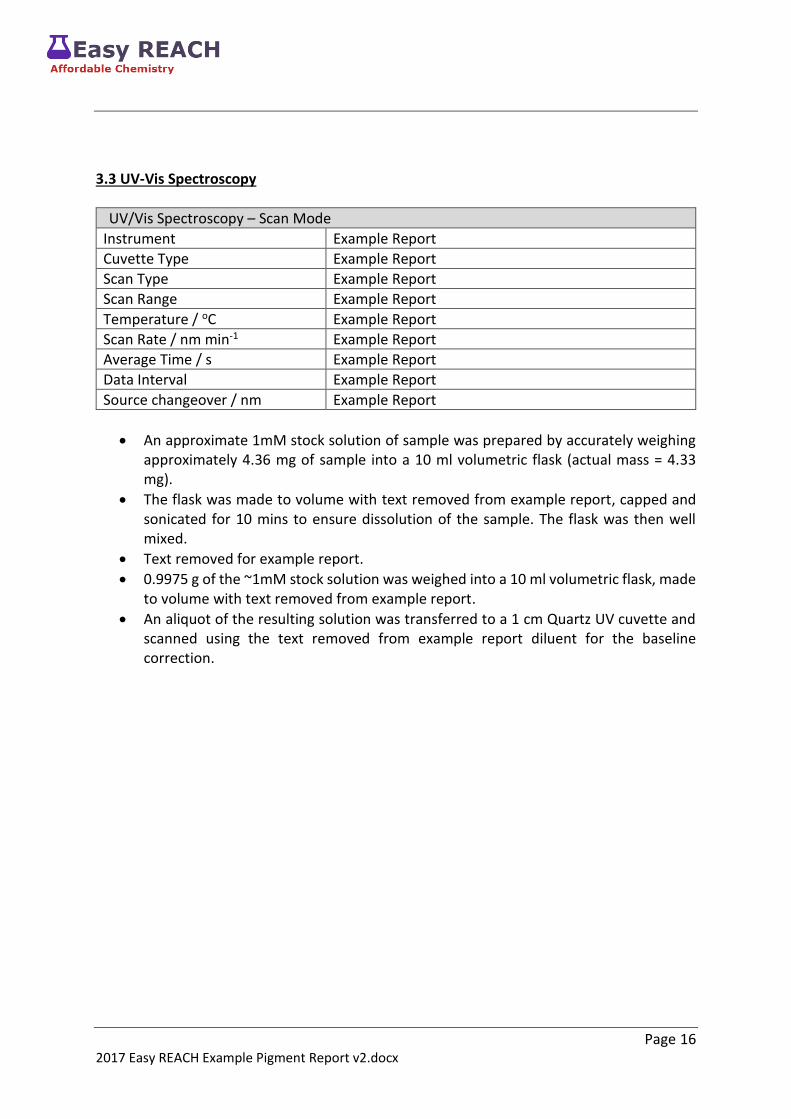
3.3 UV-Vis Spectroscopy
UV/Vis Spectroscopy – Scan Mode
Instrument Example Report
Cuvette Type Example Report
Scan Type Example Report
Scan Range Example Report
Temperature / oC Example Report
Scan Rate / nm min-1 Example Report
Average Time / s Example Report
Data Interval Example Report
Source changeover / nm Example Report
An approximate 1mM stock solution of sample was prepared by accurately weighing approximately 4.36 mg of sample into a 10 ml volumetric flask (actual mass = 4.33 mg).
The flask was made to volume with text removed from example report, capped and sonicated for 10 mins to ensure dissolution of the sample. The flask was then well mixed.
Text removed for example report.
0.9975 g of the ~1mM stock solution was weighed into a 10 ml volumetric flask, made to volume with text removed from example report.
An aliquot of the resulting solution was transferred to a 1 cm Quartz UV cuvette and scanned using the text removed from example report diluent for the baseline correction.
Page 17 2017 Easy REACH Example Pigment Report v2.docx
Blank Spectrum: Sample Spectrum:
Graph removed for Example Report
Graph removed for Example Report
Page 18 2017 Easy REACH Example Pigment Report v2.docx
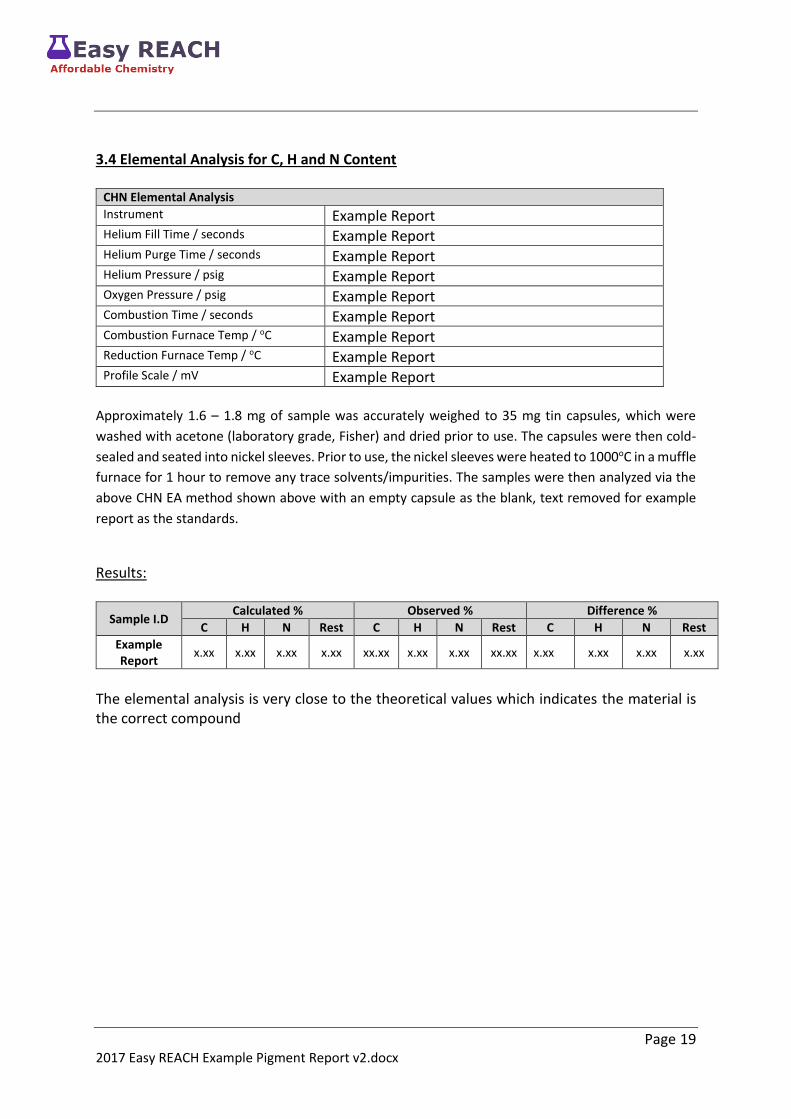
Extinction Co-efficient Data:
I.D Number
Analytical Solution
Concentration / ppm
Analytical Solution
Concentration* / mM
Wavelength / nm
Absorbance ε / Abs. M.cm-
1
Example Report xx.xx x.xxxxx
xxx.x x.xxx Xx,xxx
xxx.x x.xxx Xx,xxx
xxx.x x.xxx Xx,xxx
xxx.x x.xxx Xx,xxx
Page 19 2017 Easy REACH Example Pigment Report v2.docx
3.4 Elemental Analysis for C, H and N Content
CHN Elemental Analysis
Instrument Example Report Helium Fill Time / seconds Example Report Helium Purge Time / seconds Example Report Helium Pressure / psig Example Report Oxygen Pressure / psig Example Report Combustion Time / seconds Example Report Combustion Furnace Temp / oC Example Report Reduction Furnace Temp / oC Example Report Profile Scale / mV Example Report
Approximately 1.6 – 1.8 mg of sample was accurately weighed to 35 mg tin capsules, which were
washed with acetone (laboratory grade, Fisher) and dried prior to use. The capsules were then cold-
sealed and seated into nickel sleeves. Prior to use, the nickel sleeves were heated to 1000oC in a muffle
furnace for 1 hour to remove any trace solvents/impurities. The samples were then analyzed via the
above CHN EA method shown above with an empty capsule as the blank, text removed for example
report as the standards.
Results:
Sample I.D Calculated % Observed % Difference %
C H N Rest C H N Rest C H N Rest
Example Report
x.xx x.xx x.xx x.xx xx.xx x.xx x.xx xx.xx x.xx x.xx x.xx x.xx
The elemental analysis is very close to the theoretical values which indicates the material is the correct compound
Page 20 2017 Easy REACH Example Pigment Report v2.docx
3.5 Components All info removed for example report.

Page 21 2017 Easy REACH Example Pigment Report v2.docx
Text removed from Example Report

Page 22 2017 Easy REACH Example Pigment Report v2.docx
Text removed from Example Report

Page 23 2017 Easy REACH Example Pigment Report v2.docx
3.6 Impurities All Text removed for Example Report. Text removed for Example Report.

Page 24 2017 Easy REACH Example Pigment Report v2.docx
Text removed from Example Report
Page 25 2017 Easy REACH Example Pigment Report v2.docx
Text removed from Example Report

Page 26 2017 Easy REACH Example Pigment Report v2.docx
Text removed from Example Report
Page 27 2017 Easy REACH Example Pigment Report v2.docx
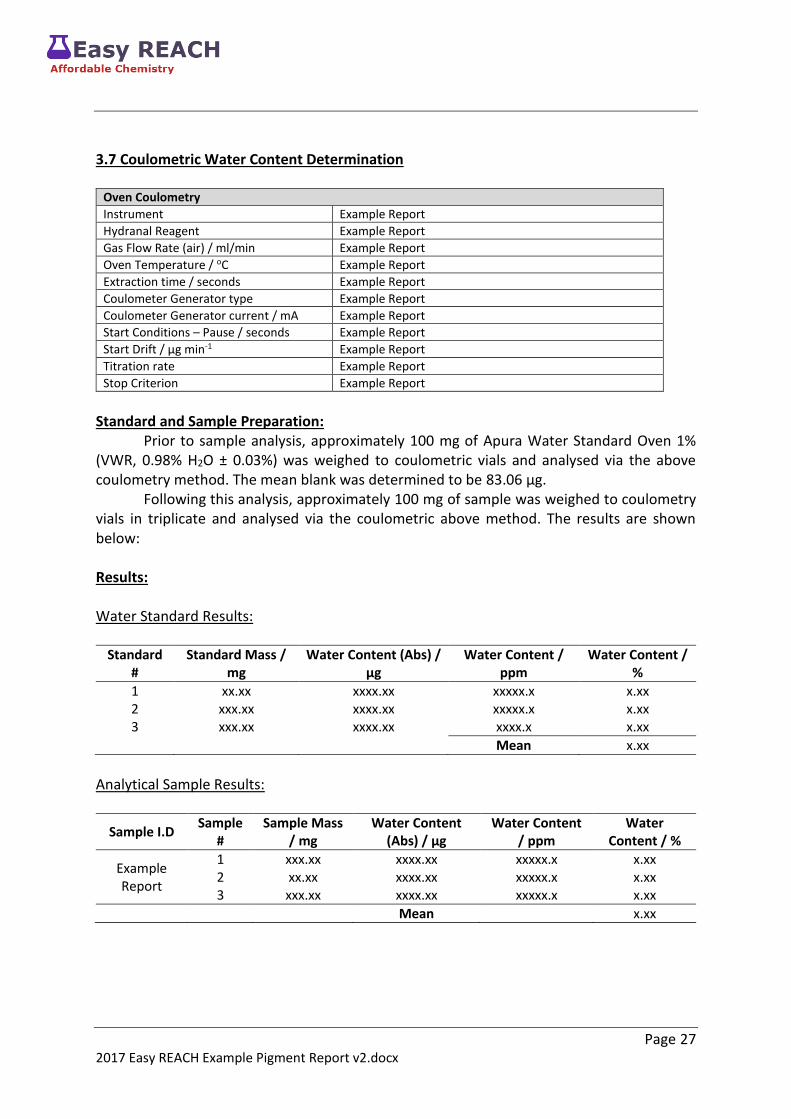
3.7 Coulometric Water Content Determination
Oven Coulometry
Instrument Example Report
Hydranal Reagent Example Report
Gas Flow Rate (air) / ml/min Example Report
Oven Temperature / oC Example Report
Extraction time / seconds Example Report
Coulometer Generator type Example Report
Coulometer Generator current / mA Example Report
Start Conditions – Pause / seconds Example Report
Start Drift / µg min-1 Example Report
Titration rate Example Report
Stop Criterion Example Report
Standard and Sample Preparation: Prior to sample analysis, approximately 100 mg of Apura Water Standard Oven 1% (VWR, 0.98% H2O ± 0.03%) was weighed to coulometric vials and analysed via the above coulometry method. The mean blank was determined to be 83.06 µg. Following this analysis, approximately 100 mg of sample was weighed to coulometry vials in triplicate and analysed via the coulometric above method. The results are shown below: Results: Water Standard Results:
Standard #
Standard Mass / mg
Water Content (Abs) / µg
Water Content / ppm
Water Content / %
1 xx.xx xxxx.xx xxxxx.x x.xx 2 xxx.xx xxxx.xx xxxxx.x x.xx 3 xxx.xx xxxx.xx xxxx.x x.xx
Mean x.xx
Analytical Sample Results:
Sample I.D Sample
# Sample Mass
/ mg Water Content
(Abs) / µg Water Content
/ ppm Water
Content / %
Example Report
1 xxx.xx xxxx.xx xxxxx.x x.xx 2 xx.xx xxxx.xx xxxxx.x x.xx 3 xxx.xx xxxx.xx xxxxx.x x.xx
Mean x.xx
Page 28 2017 Easy REACH Example Pigment Report v2.docx
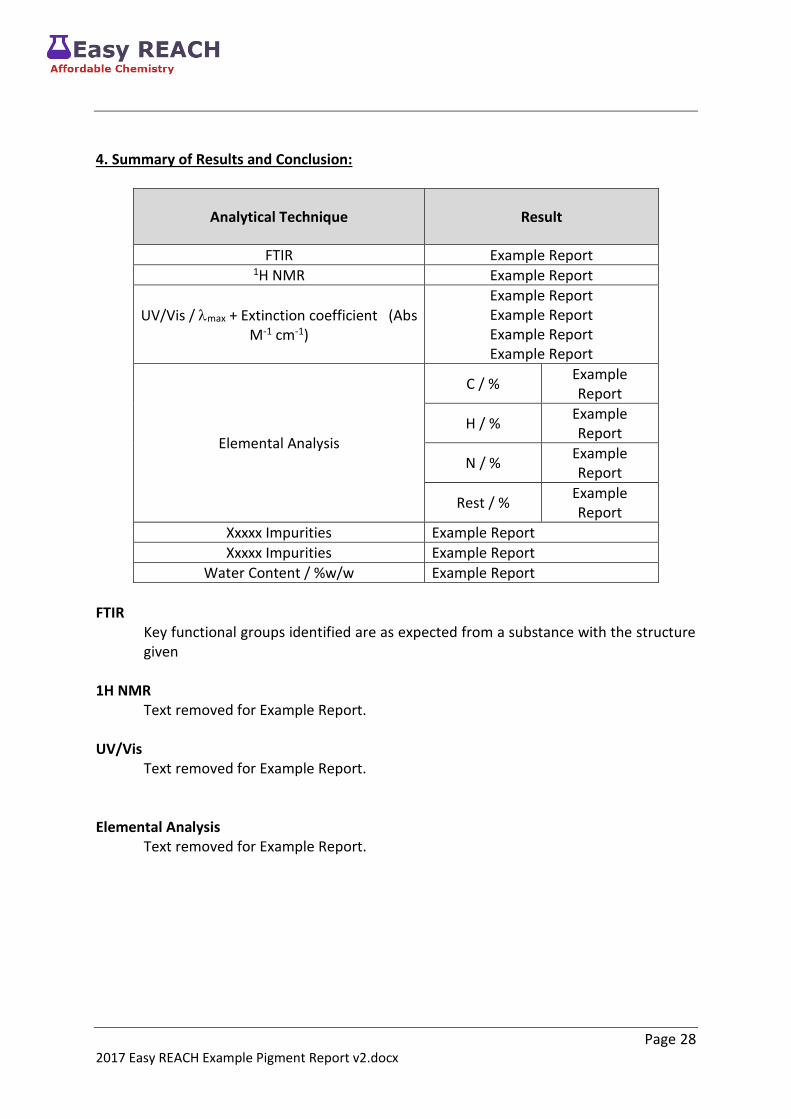
4. Summary of Results and Conclusion:
Analytical Technique Result
FTIR Example Report 1H NMR Example Report
UV/Vis / max + Extinction coefficient (Abs M-1 cm-1)
Example Report Example Report Example Report Example Report
Elemental Analysis
C / % Example Report
H / % Example Report
N / % Example Report
Rest / % Example Report
Xxxxx Impurities Example Report
Xxxxx Impurities Example Report
Water Content / %w/w Example Report
FTIR
Key functional groups identified are as expected from a substance with the structure given
1H NMR
Text removed for Example Report. UV/Vis
Text removed for Example Report.
Elemental Analysis
Text removed for Example Report.
Page 29 2017 Easy REACH Example Pigment Report v2.docx
Impurities
Text removed for Example Report. Water Content
Text removed for Example Report.
Page 30 2017 Easy REACH Example Pigment Report v2.docx
Appendix


