
02/03/2017
1
Agronomics and marketing
of milling oatsLouisa Winkler
Washington State University
Dave Moore
Ponta Ray Ranch
Cascadia Grains Conference
7th Jan. 2017
• Quality specifications
• Management and weather factors influencing crop quality
• Variety choice
• Revenue potential
• Oats in eastern WA
• Seed sourcing
• Questions
Information in this talk is included in upcoming WSU Extension Manual, “Producing milling oats in western Washington: Guide to quality optimization and marketing”.
Today’s talk
Photo: Louisa Winkler

02/03/2017
2
F.A. Coffman, 1961:
"One of the areas of highest
acre yields in North America
is in the Puget Sound
region, where cool, moist
weather usually prevails."
Threshing oats at Dunlap Farm, circa 1900.Skagit County Historical Museum
Potential for milling oats in WAPotential for milling oats in WA
• Milling oats: food quality• Regional buyer: Grain Millers, Inc. in Eugene, OR (hulled oats)
Look out for a WSU Extension publication,
Producing milling oats in western Washington: Guide to grain quality optimization and marketing
Coming soon!
Picture of hulled and dehulled oats
Potential for milling oats in WA

02/03/2017
3
• Test weight
• Kernel plumpness, uniformity
• Damage and foreign material
• Hull weathering/brightness
and color
• Moisture content
Quality standards
Photo: Dept. of Agriculture and Food, Govt. of Western Australia
Target Min/Max Spec
Quality
Test weight 40lb/bu 36lb/bu 38lb/bu
Moisture 13% 10-14% 13.50%
Thin kernels (thins) 5% 20% 12%
De-hulled groats 6% 12% 8%
Quality standards - Specifications
Photo: Margolab on Wikimedia Commons Data source: Grain Millers, Inc.
02/03/2017
4
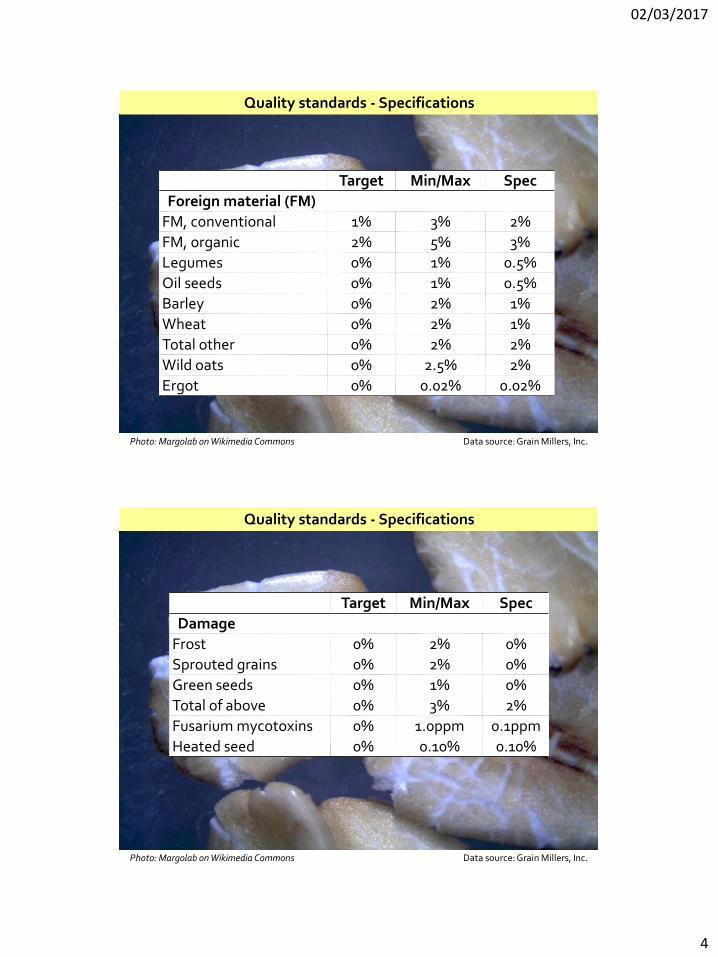
Target Min/Max Spec
Foreign material (FM)
FM, conventional 1% 3% 2%
FM, organic 2% 5% 3%
Legumes 0% 1% 0.5%
Oil seeds 0% 1% 0.5%
Barley 0% 2% 1%
Wheat 0% 2% 1%
Total other 0% 2% 2%
Wild oats 0% 2.5% 2%
Ergot 0% 0.02% 0.02%
Quality standards - Specifications
Photo: Margolab on Wikimedia Commons Data source: Grain Millers, Inc.
Target Min/Max Spec
Damage
Frost 0% 2% 0%
Sprouted grains 0% 2% 0%
Green seeds 0% 1% 0%
Total of above 0% 3% 2%
Fusarium mycotoxins 0% 1.0ppm 0.1ppm
Heated seed 0% 0.10% 0.10%
Quality standards - Specifications
Photo: Margolab on Wikimedia Commons Data source: Grain Millers, Inc.

02/03/2017
5
Conventional oats Organic oats
Test weight
Discounts apply 38-
36lb
Discounts apply 38-
36lb
$0.01 per ½lb $0.015 per ½lb
Reject under 36lb Reject under 36lb
Quality standards - Dockage
Photo: Louisa Winkler Data source: Grain Millers, Inc.
• Dockage is assessed on grain exceeding minimum standard but not meeting specification.
• Buyer should provide Discount Schedule to tell you their rules for price reductions.
• For example, Grain Millers discount schedule for test weight:
Understanding thins and test weight
Photo: Louisa Winkler
Both thins and test weight are related to single-grain weight.
• Test weight is also related to grain shape: rounder grains pack more tightly.
Genetics and environment.
• Crop nutrition, weather during the growing season influence plant
architecture, grain fill and shape.
Negative impacts on thins and test weight:
• Excessive fertility or warm temperatures → more grain sites per plant →
less photosynthate per grain.
• Plant stress in early summer (nutrient deficit, drought, heat, disease) →
shortened grain fill period or disrupted transfer of assimilates.
• Late seeding → heat stress more likely during anthesis and grain fill.
Waterlogging early in the growing season negatively impacts tillering, but oat plants
are able to compensate later in the season by increasing grain weight.

02/03/2017
6
Crop management
Photo: Louisa Winkler
SEEDING
Date
• Plant early if you can.
Rate
• Best to use plant density (target: 23 live plants per sq.ft.; assume 80%
germination).
• If you can’t, use 60-80lb/a.
• Planting too densely can cause increased plant height and lodging.
Crop management
FEEDING• Rough guide for N: 1.3lb/acre of available soil nitrogen for each bushel/acre of yield
sought (Forsberg and Reeves 1995).
• For 180bu/a (5,760lb/a) grain, aim for 234lb/a of available N (from soil + fertilizer).
• Excess N causes more damage to grain quality at later seeding dates.
• Similar with P (don’t apply extra if soil-available P>50lb/a) and K (not needed if soil
K >250lb/a).
• “Just enough.”

02/03/2017
7
Photo: Louisa Winkler
• Often seen in wWA.
• Neutral to high soil pH.
• Recent liming.
• High soil organic matter.
• High soil iron content .
• Probably not yield limiting.
Crop management
Manganese deficiency (gray speck)
VARIETY CHOICE

02/03/2017
8
Map by Bouchirron, Wikimedia Commons
Milling oat variety tests
• 2014 and 2015• 30 varieties• 4 locations
• TeVelde’s Farm, Whatcom• Ebey Road Farm, Island• NWREC, Skagit• Kirsop Farms, Thurston
Milling oat variety tests
LocationSeason length,
days
Min. air temp,
°F
Average air temp,
°F
Max. air
temp, °F
Precipitation, in.
2014Island 139 34 57 86 5.8
Skagit 143 36 59 86 11.8
Thurston 117 32 59 97 11.4
Whatcom 128 34 59 91 9.4
2015Island 111 37 57 91 1.3
Skagit 122 36 61 91 2.7
Thurston 118 39 63 99 3.7
Whatcom 96 36 63 99 1.3

02/03/2017
9
Milling oat variety tests
LocationYield, lb/a at
14% MCTest weight, lb/bu
at 14% MCThin kernels,
%
2014Island 3,524 42.3 4
Skagit 7,036 42.8 2
Thurston 3,478 39.6 9
Whatcom 6,514 40.8 9
2015Island 1,785 29.9 18
Skagit 3,391 36.3 9
Thurston 2,139 40.5 4
Whatcom 4,787 39.2 7
Milling oat variety tests
• 5 of 8 trial locations were organic. Two had high weed pressure.
• Heavy downpours near harvest caused lodging in 2014.
• There was an accidental late herbicide application (2,4D Ester) at one location in 2014.
• And there was an infestation of blackbirds at one location in 2015.

02/03/2017
10
Milling oat variety tests
VarietyMean
yield, lb/a
% test environments
meeting standards
Spec Minimum
AC Morgan 4,617 25 63
Jordan 4,434 0 38
Horsepower 4,333 63 88
Tack 4,152 75 88
Summit 4,022 57 86
Rockford 4,011 75 88
Esker 3,850 57 71
Excel 3,700 57 86
Ogle 3,529 29 43
• How consistently did varieties make milling quality specifications?
Other varieties
Shelby 427 (SDSU)
Hayden (SDSU)
Natty (SDSU)
Goliath (SDSU)
Colt (SDSU)
Betagene (U Wisc)
Badger (U Wisc)

02/03/2017
11
cv. Horsepower
LocationYield,
bu/a
TW,
lb/bu
Dockage
for TW,
$/bu
Thins,
%
Dockage
for
thins,
$/bu
Total
dockage,
$/bu
Gross
revenue,
$/a
Island C 166.6 44.2 0.00 2 0.00 0.00 $ 602.51
Skagit C 228.1 42.6 0.00 2 0.00 0.00 $ 824.67
Thurston O 102.9 38.2 0.00 16 0.08 0.08 $ 549.67
Whatcom C 216.1 41.6 0.00 7 0.00 0.00 $ 781.33
Revenue estimate
CALCULATION METHOD• Yield, TW and Thins data from field trials. • Price data from Grain Millers (annual average for 2014 and 2015).• Conventional price: $3.62/bu in 2014, $4.03/bu in 2015.• Organic price: $5.42/bu in 2014, $6.05 in 2015.
• Example:
2014 Esker Horsepower Rockford Tack
Island O $459.86 $602.51 $331.92 $493.56
Skagit C $846.31 $824.67 $711.53 $675.18
Thurston O $494.14 $549.67 $595.07 $699.08
Whatcom O - $781.33 $737.53 $745.95
Revenue estimate
2015 Esker Horsepower Rockford Tack
Island O Rejected Rejected Rejected Rejected
Skagit C Rejected $372.28 $394.07 $344.46
Thurston O $481.94 $374.61 $435.92 $503.36
Whatcom O $882.15 $531.62 $1,113.22 $806.41

02/03/2017
12
Shepherd’s Grain Inland NW Spring Oat Trials 2016
• Can oats make milling quality test weight in eastern Washington/northwest Idaho?• Three varieties; seeding rate; K level
Oats in Eastern Washington
0
1
2
3
4
5
6
20
30
40
50
60
70
80
90
100
05-May 15-May 25-May 04-Jun 14-Jun 24-Jun 04-Jul 14-Jul 24-Jul
Rai
nfa
ll, in
.
Tem
per
atu
re,
°F
Daily average temp. Daily max temp. Daily min temp. Rainfall
Weather
Planting date: 4th May Harvest date: ?Total rainfall during growing season: 29.3in.Temperatures were 52-66°F at the start of heading in June but climbed to almost 90°F by the end of heading in late June.
Oats in Eastern Washington

02/03/2017
13
Oats in Eastern Washington
Variety test
• AC Morgan, Rockford, Shelby 427
• Seeding rate 60lb/a
• Result: no significant effect of variety on yield or test weight
0
1000
2000
3000
4000
5000
Morgan Rockford Shelby
Yield, lb/a
32.0
34.0
36.0
38.0
Morgan Rockford Shelby
Test Weight, lb/bu
Oats in Eastern Washington
K rate test
• 0, 15, 30lb/a K
• Shelby 427
• Results: little effect on yield, but added K decreased test weight (p=0.07).
0
1000
2000
3000
4000
5000
No K 15lb/a K 30lb/a K
Yield, lb/a
34
35
36
37
38
39
No K 15lb/a K 30lb/a K
Test Weight, lb/bu

02/03/2017
14
Oats in Eastern Washington
Seeding rate and K rate• Shelby 427• Seeding rates of 30, 45, 60lb/a• K rates of 0, 15, 30lb/a• Results:
• Significant linear increase of test weight with seeding rate, but only without added K.
• Similar pattern in yield, though not as strong
Seed Sourcing
• Not a lot of milling oat seed is produced in WA, OR, ID or MT.
• Look for certified seed.
• Good information source: Wisconsin Crop Improvement Association, https://wcia.wisc.edu/ Go to “2017 Certified & Quality Assurance Seed & Forage/Mulch”
• Check other Crop Improvement Associations for Grower Directories, and call the seed companies you see listed.
• Albert Lea Seed House, Albert Lea, MN. Good selection, excellent quality and service. Organic seed available.
• Welter Seed & Honey Co., Onslow, IA. Organic seed available.
• Dakota’s Best Seed, Platte, SD.
• Mustang Seeds, Madison, SD.
Photo: University of Maine Cooperative Extension

02/03/2017
15
• Grain Millers, Inc. 2016. The Growth and Development of Oats: A Guide to Food Grade Oat Production.
• Senova. 2011. Oats: From Breeder to Market. http://www.senova.uk.com/#/publications/4538521681.
• Coming soon (spring 2017): WSU Extension Manual, Producing milling oats in western Washington: Guide to grain quality optimization and marketing.
• Pacific Northwest Insect and Weed Management Handbooks, http://pnwhandbooks. org/
Useful resources
Thank You!Louisa: [email protected]
Dave: [email protected]
Many thanks to my adviser, Dr. Kevin Murphy, and to Steve Lyon of the Northwest Washington Research & Extension Center. This work was funded by the Seed Matters Initiative of the ClifBar Family Foundation.


