1 | P a g e | Accounting for plantation forest groundwater impacts in the lower South East of South Australia
Accoun t ing f o r p lan t at ion f o rest
g round w at er im p act s in t he
low er Sout h East o f Sout h
Aust ralia
DWLBC 2009/13
Dar r y l Har vey
Scien ce, Mo n it o r in g an d In f o r m at ion Div ision
ISBN: 978-1-921528-44-6

2 | P a g e | Accounting for plantation forest groundwater impacts in the lower South East of South Australia
In t r od uct ion This report has been prepared to provide a record of the development of the annualised
plantation forest accounting models used in the water budgets of the lower South East of
South Australia. While the models appear to be suitable tools for accounting and managing
the South East groundwater resource, they may have some application in for other managed
water resources.
The initial annualised groundwater impact models developed for the South East were always
intended to be interim; at least until improved technical knowledge or a change in context
suggested a different accounting approach were appropriate. However, as a result of a
review in 2006, the conceptual models with the underpinning rationale and assumptions
have proven to be sufficiently robust for the current context.
The report is set out in three parts, a background to the issue in a lower South East context,
development of assumptions applied in the forest groundwater models and the actual
development of the annualised forest water accounting models.
3 | P a g e | Accounting for plantation forest groundwater impacts in the lower South East of South Australia
Execut ive sum m ary Plantation forests are an extensive land use in the lower South East, covering nearly 16 per cent of
the available landscape with about 103 000 ha of softwood and 43 000 ha of hardwood plantations.
The region is also home to important grazing and irrigation industries with significant investments
based on an assumption that extractions from the extensive unconfined limestone aquifer will remain
sustainable. Rainfall percolating past the root zone of the vegetation cover provides most of the
recharge to the local groundwater system.
The lower South East water resource can be considered at, or approaching, full allocation, with some
groundwater management areas over allocated. As plantation forests impact directly on groundwater
recharge and can extract groundwater where the water table is shallow, it is important there is an
accounting system which incorporates all water uses. Some over allocation is historical and other is
caused by the first time accounting for direct extraction of groundwater by about 60 000 ha of
plantation forest overlaying shallow water tables. All over allocation however requires a management
response.
It is impractical to measure actual forest water consumption, whether in terms of impacts on surface
water yield, groundwater recharge, or by direct extraction from shallow water tables. Based on
biophysical principles and assumptions, a system of forest water models with outputs expressed in
annualised deemed values have been developed. The annualised deemed values are not point
impact measurements, but an estimation of diffuse impacts based on a characterisation of plantation
forests of the same type in the same groundwater management area. The values ‘smooth’ the
hydrologic impacts of the forest over the full forest rotation period. The deemed annualised values,
while appropriate for South East groundwater accounting and management purposes may have some
application for water accounting in other regions.
In the case of hardwood plantations, the annualised forest water recharge model indicates forests
reduce the groundwater recharge that would normally occur to 22 per cent of that occurring if the site
were committed to a dryland agricultural land use. This represents a loss of recharge on that site of
78 per cent. In the case of softwood forest plantations, the recharge loss to any forest site is 83 per
cent of that occurring in a dryland agricultural landscape. Where the median water table is 6 metres,
or less, from ground level, hardwood plantations are deemed to extract 1.82 ML/ha/year, on an
annualised basis, and softwood plantations are considered to extract 1.66 ML/ha/year.
The forest water recharge and extraction models minimise administrative complexity by managing
each forest type as a single class for its life, providing administrative benefit for both forest owners
and the water resource manager.
4 | P a g e | Accounting for plantation forest groundwater impacts in the lower South East of South Australia
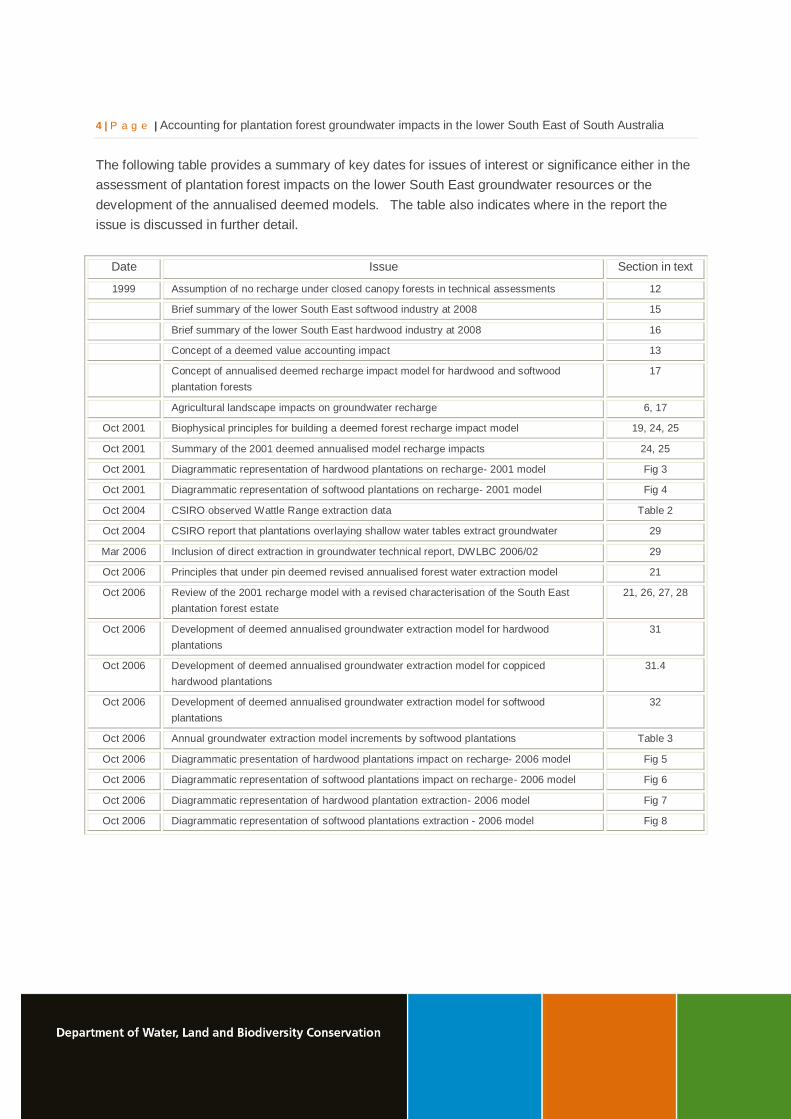
The following table provides a summary of key dates for issues of interest or significance either in the
assessment of plantation forest impacts on the lower South East groundwater resources or the
development of the annualised deemed models. The table also indicates where in the report the
issue is discussed in further detail.
Date Issue Section in text
1999 Assumption of no recharge under closed canopy forests in technical assessments 12
Brief summary of the lower South East softwood industry at 2008 15
Brief summary of the lower South East hardwood industry at 2008 16
Concept of a deemed value accounting impact 13
Concept of annualised deemed recharge impact model for hardwood and softwood
plantation forests
17
Agricultural landscape impacts on groundwater recharge 6, 17
Oct 2001 Biophysical principles for building a deemed forest recharge impact model 19, 24, 25
Oct 2001 Summary of the 2001 deemed annualised model recharge impacts 24, 25
Oct 2001 Diagrammatic representation of hardwood plantations on recharge- 2001 model Fig 3
Oct 2001 Diagrammatic representation of softwood plantations on recharge- 2001 model Fig 4
Oct 2004 CSIRO observed Wattle Range extraction data Table 2
Oct 2004 CSIRO report that plantations overlaying shallow water tables extract groundwater 29
Mar 2006 Inclusion of direct extraction in groundwater technical report, DWLBC 2006/02 29
Oct 2006 Principles that under pin deemed revised annualised forest water extraction model 21
Oct 2006 Review of the 2001 recharge model with a revised characterisation of the South East
plantation forest estate
21, 26, 27, 28
Oct 2006 Development of deemed annualised groundwater extraction model for hardwood
plantations
31
Oct 2006 Development of deemed annualised groundwater extraction model for coppiced
hardwood plantations
31.4
Oct 2006 Development of deemed annualised groundwater extraction model for softwood
plantations
32
Oct 2006 Annual groundwater extraction model increments by softwood plantations Table 3
Oct 2006 Diagrammatic presentation of hardwood plantations impact on recharge- 2006 model Fig 5
Oct 2006 Diagrammatic representation of softwood plantations impact on recharge- 2006 model Fig 6
Oct 2006 Diagrammatic representation of hardwood plantation extraction- 2006 model Fig 7
Oct 2006 Diagrammatic representation of softwood plantations extraction - 2006 model Fig 8
5 | P a g e | Accounting for plantation forest groundwater impacts in the lower South East of South Australia
Contents
In t r o d uct ion
Execu t ive sum m ar y
BACKGROUND 1. Ext en t o f p lan t at io n f o r est in lo w er So u t h East
2. Ot h er lan d uses
3. Ph ysical ch ar act er ist ics o f t h e r eg io n
4. Lo w er So u t h East h yd r o geo logy
4.1. Ter t iar y Co n f in ed San d Aq u if er
4.2. Ter t iar y Un co n f in ed Lim est o n e Aq u if er
5. Aq u if er r ech ar ge
6. Gr o un d w at er r ech ar ge values
7. Gr o un d w at er m an agem en t
8. Licen sed w at er al lo cat io n s
9. Allo cat ion st at us o f t h e un con f in ed w at er r eso u r ce
ACCOUNTING FOR PLANTATION FOREST IMPACTS ON LOWER SOUTH EAST GROUNDWATER
10. Need f o r f o r est w at er acco un t in g
11. Plan t at io n f o r est b io p h ysical issues
12. Fo r est im p act acco un t in g f o r cu r r en t w at er al lo cat io n p lan s
13. Deem ed acco un t in g values
14. An n ualised d eem ed values
15. So f t w oo d p lan t at ion in d ust r y
16. Har d w o o d p lan t at io n in d ust r y
17. An n ualised im p act o f p lan t at io n f o r est o n g ro un d w at er r eso u r ces
18. Hyd r o lo g ic r esp o n se b y p lan t at io n f o r est s
19. Th e ad o p t ed an n ualised f o r est w at er r ech ar ge m o d el
20. An n ualised g r o un d w at er ext r act io n im p act m o d els
21. Plan t at io n f o r est d escr ip t io n s f o r acco un t in g an d m an agem en t
21.1. Har d w o o d (sh o r t r o t at io n ) p lan t at ion f o r est
21.2. So f t w oo d (lon g r o t at io n ) p lan t at ion f o r est
22. Sum m ar y
6 | P a g e | Accounting for plantation forest groundwater impacts in the lower South East of South Australia
ANNUALISED PLANTATION FOREST GROUNDWATER IMPACT MODELS
23. Fo r est w at er acco un t in g co n cep t s
24. Har d w o o d r ech ar ge m o d el: ver sio n 2001
24.1. Fo r est m an agem en t assum p t io n s
24.2. Hyd r o lo g ical im p act assum p t io n s b ased o n f o r est b io p h ysical st age
24.3. Calcu lat ion o f an n ualised r ech ar ge im p act
25. So f t w oo d r ech ar ge m o d el: ver sio n 2001
25.1. Fo r est m an agem en t assum p t io n s
25.2. Hyd r o lo g ical im p act assum p t io n s b ased o n f o r est b io p h ysical st age
25.3. Calcu lat ion o f an n ualised r ech ar ge im p act
26. Rev isio n o f t h e 2001 ann ualised r ech ar ge im p act m o d el
27. Har d w o o d r ech ar ge m o d el: ver sio n 2006 (10-year r o t at io n )
27.1. Fo r est m an agem en t assum p t io n s
27.2. Hyd r o lo g ical im p act assum p t io n s b ased o n f o r est b io p h ysical st age
27.3. Calcu lat ion o f an n ualised r ech ar ge im p act
28. So f t w oo d r ech ar ge m o d el: ver sio n 2006 (35-year r o t at io n )
28.1. Fo r est m an agem en t assum p t io n s
28.2. Hyd r o lo g ical im p act assum p t io n s b ased o n f o r est b io p h ysical st age
28.3. Calcu lat ion o f an n ualised r ech ar ge im p act
29. Dir ect ext r act io n an n ualised m o d els
30. Assum p t io n s f o r t h e d ir ect ext r act io n an n ualised acco un t in g m o d els
31. Har d w o o d d ir ect ext r act io n m o d el
31.1. Fo r est m an agem en t assum p t io n s
31.2. Hyd r o lo g ical im p act assum p t io n s b ased o n f o r est b io p h ysical st age
31.3. Calcu lat ion o f an n ualised r ech ar ge im p act
31.4. Co p p iced h ar d w o o d d ir ect ext r act io n m o d el
32. So f t w oo d d ir ect ext r act io n m o d el
32.1. Fo r est m an agem en t assum p t io n s
32.2. Hyd r o lo g ical im p act assum p t io n s b ased o n f o r est b io p h ysical st age
32.3. Calcu lat ion o f an n ualised r ech ar ge im p act
33. Sum m ar y
7 | P a g e | Accounting for plantation forest groundwater impacts in the lower South East of South Australia
TABLES AND FIGURES
Tab le 1 Sum m ar y o f cu r r en t assign ed d eem ed an n ualised values f o r So u t h
East p lan t at io n f o r est s 2006
Tab le 2 Blue gum g r oun d w at er ext r act io n d at a
Tab le 3 An n ual assign m en t o f g ro un dw at er ext r act io n value f o r So u t h East
so f t w oo d p lan t at ion f o r est s 2006
Figu r e 1 Dist r ib u t io n o f p lan t at ion f o r est in r elat io n t o g r o un d w at er
m an agem en t ar eas
Figu r e 2a Cr o ss sect io n o f Lo w er So u t h East aq u if er syst em , east -w est
Figu r e 2b Cr o ss sect io n o f Lo w er So u t h East aq u if e r syst em , n o r t h -so u t h
Figu r e 3 Har d w o o d ann ualised r ech ar ge im p act m o d el: 2001
Figu r e 4 So f t w oo d ann ualised r ech ar ge im p act m o d el : 2001
Figu r e 5 Har d w o o d ann ualised r ech ar ge im p act m o d el: 2006
Figu r e 6 So f t w oo d ann ualised r ech ar ge im p act m o d el : 2006
Figu r e 7 Har d w o o d ann ualised ext r act io n im p act m o d el: 2006
Figu r e 8 So f t w oo d ann ualised ext r act io n im p act m o d el: 2006
GLOSSARY REFERENCES

8 | P a g e | Accounting for plantation forest groundwater impacts in the lower South East of South Australia
BACKGROUND
1. Ext en t o f p lan t at ion f o r est in low er Sout h
East
In the lower South East of South Australia, plantation forest industry activity and interest lies in the
land receiving 600 mm, or more, of mean annual rainfall. The area consists of approximately 1 million
hectares of land zoned as general farming or commercial forest in the various local development
plans.1 The industry also has an interest in neighbouring western Victoria which combined with the
South East of South Australia is recognised as the Green Triangle Region.2
Excluding special land use zones, native vegetation, national parks, non-arable land and permanent
lakes, plantation forests currently occupy nearly 16 per cent of the landmass that could be used for
plantation forestry. The current forest estate is approximately 146 000 ha,3 with 103 000 ha being
softwood (long rotation pine) mainly for sawlog production and 43 000 ha of hardwood (short rotation
Tasmanian blue gum [Eucalyptus globulus]) for wood chip production.
Figure 1 indicates the distribution of softwood and hardwood plantations in the lower South East and
the current groundwater management boundaries.
2. Ot her land uses
The dryland agricultural landscape generally comprises improved pastures for grazing with some
areas of annual cropping of oats, oilseed crops and other broad acre crops such as beans and
canola. The area and intensity of irrigated agriculture varies seasonally, but is of the order 100 000
ha. It includes perennial pastures, fodder crops, potatoes, onions, viticulture and specialised small
seed production. The irrigation activity is widely dispersed but there are areas of high value intense
activity around Mount Gambier, Naracoorte and Coonawarra.
1 Local government areas include District Council of Grant, District Council of Robe, Kingston Regional Council,
Naracoorte Lucindale Council, and Wattle Range Council
2 Green Triangle is an economic development region with numerous internal and informal links; it is not an
administrative zone, but it is a National Plantation Inventory region.
3 Source: SERIC, at December 2007
9 | P a g e | Accounting for plantation forest groundwater impacts in the lower South East of South Australia
3. Physical char act er ist ics o f t he r eg ion The topography of the region is relatively flat to gently undulating and the soils are mostly sandy.
There are over 20 low relief stranded ancient coastal dunes running approximately parallel to the
coast. The underlying regional geology is generally karstic limestone and in combination with the
surface features, results in no significant surface water streams draining to the marine environment.
The area around Mount Gambier has experienced volcanic activity, with a number of dormant
remnant craters evident in the landscape, including the Mount Gambier complex, Mount Schank, and
Lake Leake. The Blue Lake crater at Mount Gambier provides a ‘window’ into the local unconfined
aquifer.
The depth from ground surface to the unconfined aquifer water level ranges from 2-3 metres to about
60 metres in areas of higher relief.
Following early land clearance, a number of surface water drains were constructed to move excess
surface water to the coast (this water is considered as rejected groundwater recharge). These
drainage systems should not be confused with the mid and upper South East groundwater drains
recently constructed to help mitigate rising groundwater and increasing salinity.
4. Low er Sout h East hyd r ogeo logy There are two main aquifers under formal management in the lower South East, the unconfined
Tertiary Limestone Aquifer that overlies the Tertiary Confined Sand Aquifer. In some parts of the
region, the confined aquifer is not always clearly distinguishable or its water accessible for beneficial
use.
4.1 Tertiary Confined Sand Aquifer
The Tertiary Confined Sand Aquifer occurs within an interbedded sequence of sands, gravel and
clays. Minor sand horizons of the Mepunga Formation are considered to be a part of the confined
sand aquifer. The Tertiary Confined Sand Aquifer increases in thickness towards the south with a
maximum recorded thickness of 800 m, off-shore.
Artesian supplies of groundwater of up to 100 litres per second are available from some parts of the
Tertiary Confined Sand Aquifer. Salinity ranges from approximately 500 mg/L near Mount Gambier
to about 800 mg/L in the Kingston area.
Groundwater from the Tertiary Confined Sand Aquifer of the Dilwyn Formation is utilised mainly for
municipal and industrial water supplies in the southern portion and by agriculture in the Kingston -
10 | P a g e | Accounting for plantation forest groundwater impacts in the lower South East of South Australia
Lucindale - Beachport area for irrigation, and stock and domestic requirements. An industrial
allocation has also been made to the proposed Penola Pulp Mill, south of Penola.
4.2 Tertiary Unconfined Limestone Aquifer
The unconfined Tertiary Limestone Aquifer occurs within fossiliferous marine limestone, with
interbeds of marl, calcite and dolomite, and flint horizons. The thickness of the aquifer varies
regionally with the largest vertical sequence of about 300 m occurring in the area south of Mount
Gambier.
Figures 2a and 2b provide characterised cross sections of the Lower South East aquifer system.
Generally the unconfined Tertiary Limestone Aquifer has a dual porosity, with a primary inter-
granular porosity (which acts hydraulically as a porous medium) and secondary fracture porosity
resulting from dissolution of the limestone. The secondary porosity forms conduits for preferred flow.
A wide range of transmissivities are a reflection of the karstic nature of the limestone aquifer.
Salinity of the unconfined Tertiary Limestone Aquifer varies from less than 500 mg/L in the southern
part of the Otway Basin to greater than 3000 mg/L in the northern part of the Otway Basin. The
groundwater is used for a wide range of purposes, ranging from municipal supplies for Mount
Gambier and Millicent, stock and domestic water supplies, industrial use, and widespread irrigation
throughout the region.
5. Aq u if er r echar ge
Recharge to the Tertiary Confined Sand Aquifer in South Australia is highly reliant on the downward
percolation of water from the overlying unconfined aquifer. Separating the two aquifers is a ubiquitous
carbonaceous clay aquitard. The degree of connection between the two aquifers is controlled by the
ability of the aquitard to transmit water vertically. Low permeability may mean little or no recharge to
the confined aquifer is occurring through the aquitard via vertical leakage from the overlying
unconfined aquifer. However, there are some areas of preferential recharge from the unconfined
aquifer to the confined aquifer in the eastern area of the region due to geologic faulting and or
absence of a separating aquitard.
Recharge to the unconfined Tertiary Limestone Aquifer is largely from locally occurring rainfall which
percolates past the root zone of the vegetation. In some areas there are paths of preferential
recharge from occasionally occurring surface water. This can be through features locally known as
‘run away holes’, which are a characteristic of the lower South East karstic limestone geology. The
limestone geology, and in particular its connection to the aquifer, is evident in features such as the
Mount Gambier Cave Gardens, Umpherston Cave, Englebrecht Cave and the Naracoorte Cave
complex.
11 | P a g e | Accounting for plantation forest groundwater impacts in the lower South East of South Australia
In addition to local rainfall recharging the unconfined Tertiary Limestone Aquifer, there is a natural
through flow of groundwater, generally towards the coast, but with a northwest direction in the upper
regions. For groundwater management purposes, the extractable volume of water available for
allocation from the unconfined aquifer is considered to be a function of the local vertical recharge from
rainfall outside the Border Designated Area. The quantity of recharge for a groundwater management
area is generally reduced by 10 per cent and the balance is referred to as the total available recharge
(TAR). The 10 per cent reduction is a nominal allowance to ensure natural lateral groundwater
through flow to maintain salt transport towards the coast.
In the Border Designated Area, the Border Groundwaters Agreement Review Committee has
determined the permissible annual volumes (PAV) for licensed allocation based on observed trends
and risks to the groundwater resource.
6. Gr ound w at er r echar ge values
Groundwater recharge rates for the unconfined Tertiary Limestone Aquifer have been established and
refined over a number of years for the different groundwater management areas. The recharge rates
are generally based on the water table fluctuation methodology, with isotope analysis in some
management areas contributing to the recharge information.
Under this approach, the land-use associated with the groundwater management area recharge is
treated as homogenous and is not described or differentiated. The dryland agricultural landscape of
the lower South East is in constant change around the main activity of pasture. There is some broad
acre cropping interspersed with various forms of fallow in the transition from pasture to cropping. 4
Within this dryland agricultural landscape, point descriptions can vary significantly and consequently
the contribution to groundwater recharge at that point can also vary. Within the context of seasonal
variability, this homogeneous approach is considered both practical and robust for the purpose of
water budgeting and resource management.
However, should a significant change to land-use, land management, and or, seasonal rainfall trends
be observed, it may be necessary to re-evaluate the approach and the associated assigned
groundwater recharge values to ensure an appropriate accounting regime to maintain sustainable
4 Fallows can be in the form of a cultivated fallow or a weed free condition brought about herbicide applications,
or some variation, or combination of both. The significant feature being the conservation of soil moisture which
can result in an increase in groundwater recharge
12 | P a g e | Accounting for plantation forest groundwater impacts in the lower South East of South Australia
management of the groundwater resource. Currently, a review of all water allocation plans is
required, at least every five years.5
7. Gr ound w at er m anagem en t
The regional groundwater resources of the lower South East are prescribed under the Natural
Resources Management Act 2004. The lower South East is part of the Lower Limestone Coast
Prescribed Wells Area. The area previously comprised the three separate administrative areas of
Comaum-Caroline, Lacepede-Kongorong, and the Naracoorte Ranges Prescribed Wells Areas.6
The eastern Otway Basin that lays within the 20 km zone each side of the Victorian - South Australia
Border is also subject to management under the Groundwater (Border Agreement) Act 1985, which
takes precedence over the Natural Resources Management Act 2004.
8. Licensed w at er allocat ions
Approximately 600 000 ML of groundwater has been allocated for licensed extraction in the 46
individual groundwater management areas of the lower South East.7 The current water allocation
system is predominately area based for irrigation allocations, and in the past, the volumes pumped
were estimated.8 Flow recording meters for all licensed water allocations are now mandatory and
the existing area based allocations are to be converted to, and expressed, as volumes. This will
provide more accurate information for future technical assessments of resource capability and
subsequent management policies to ensure ongoing groundwater sustainability.
9. Allocat ion st at us o f t he u ncon f ined w at er
r esour ce
Of the 46-groundwater management areas, 11 do not have any commercial plantation forest activity.
This is mainly due to a range of reasons, singular, or collective, and can include:
5 Requirement of the Natural Resources Management Act 2004
6 Lower Limestone Coast Prescribed Wells Area comprises 59 groundwater management areas or zones
7 The 46 includes part of Border Designated Zone 5A
8 A conversion process is currently being finalised for converting existing area based allocations to volumetric
allocations for inclusion in a revised water allocation plan
13 | P a g e | Accounting for plantation forest groundwater impacts in the lower South East of South Australia
unsuitable soil or topography
distance to key forest infrastructure, such as milling, or Portland for wood chip export
proximity to existing plantations, for management efficiency, or risk management
rainfall considered marginal
land is tightly held by grazing interests
land price is too high due to competing land uses (e.g. dairy, viticulture)
In total, approximately 100 000 ML of groundwater remains unallocated in the Lower Limestone
Coast Prescribed Wells Area. Approximately half of this volume is reserved by the Minister for
Environment and Conservation and is only available for lease, subject to the criterion established by
regulation (at the time of preparing this report, criterion was yet to be made). Some of this
unallocated water is likely to remain in low demand, as it is considered marginal for irrigation and
industrial use, or the soil and topography is unsuitable for irrigation and or plantation forests.
In terms of the forest water policy position being addressed by the Intergovernmental Agreement on
a National Water Initiative (NWI) (particularly paragraphs 55-57), the lower South East can be
considered at a position of full water allocation or approaching full allocation, with some
management areas considered over allocated. In some cases, the over allocation is historical and
requires addressing in the next water allocation plan. Some over allocation has been brought about
by the first time accounting in the water budget for the direct extraction by about 60 000 ha of
plantation forest overlaying shallow water tables (six metres or less from ground level).9
9 Source is data from SERIC and DWLBC, Mount Gambier, 14 November 2008
14 | P a g e | Accounting for plantation forest groundwater impacts in the lower South East of South Australia
ACCOUNTING FOR PLANTATION FOREST
IMPACTS ON LOWER SOUTH EAST
GROUNDWATER
10. Need f o r f o r est w at er accoun t ing
Plantation forests are an extensive land use in the lower South East, covering nearly 16 per cent of
the available landscape. As plantation forests impact directly on groundwater recharge and can
extract groundwater where the water table is shallow, it is important there is an accounting system
particularly where there are threats to the water resources or its existing users. This accounting
need has led to the development and adoption of the forest water accounting systems discussed in
this report.
11. Plan t at ion f o r est b iop hysical issues
Plantation species are selected for the productivity and qualities of useable wood. The high dry
matter productivity of plantation species results in a greater evapotranspiration potential than the
replaced dryland agricultural landscape.10
To meet the increased plant water use, plantation forest
species generally extract soil moisture through a deep and extensive root zone, with the soil water
replacement being provided by local rainfall events. In addition, where the water table is shallow, it
has been established by the CSIRO that plantation forests can directly extract groundwater in an
endeavour to meet the evapotranspiration potential of the forest species.11
Although not regarded to be a significant issue in the South East, in addition to the impacts
mentioned above, plantation forests can also reduce surface water yields.12
Whether the higher
water use characteristics of plantation forest are manifested as impacts in reducing surface water
runoff, reduced groundwater recharge, or the direct extraction from shallow water tables, the impact
10 Zhang L, Dawes WR, and Walker GR, 2001. The response of mean annual evapotranspiration to vegetation
changes at catchment scale, Water Resources Research 37, 701-708
11 Benyon RG, Theiveyanathan S, and Doody TM, 2006. Impacts of tree plantations on groundwater in south-
eastern Australia, Australian Journal of Botany, 54, 181-192
12 While external to South Australia management, there is a potential for a reduction in surface water flows from
Victoria into Bool Lagoon caused by plantation forest expansion in the Mosquito Creek catchment.
15 | P a g e | Accounting for plantation forest groundwater impacts in the lower South East of South Australia
on the local water resource is largely determined by the underlying geology, topography and soil
type.
12. Fo r est im p act accoun t ing f o r cu r r en t
w at er allocat ion p lans
At the time of developing the water budgets for the current water allocation plans,13
the policy of no
groundwater recharge under plantation forests (and lakes and native vegetation) was taken. In the
absence of detailed scientific information relating to hydrological impacts of plantation forest and
given the anticipated rapid forest expansion, an initial ‘no recharge under plantation forest’ was the
only responsible accounting approach to account for forest recharge interception. This
management approach was applied to the area of known proposed plantation expansion as well as
the existing estate at the time.
Having employed the ‘no recharge’ accounting approach, it was considered necessary to develop
an accounting and management approach for plantation forest impacts on groundwater resources
for future management, particularly if plantation impacts were to involve transferable water
allocations.
13. Deem ed accoun t ing values
It is impractical to commercially measure actual forest water consumption, whether in terms of
impacts on surface water yield reduction, reduced groundwater recharge, or by direct extraction
from shallow water tables. Apart from the technical difficulties of achieving continuous point
measurements, there can be site differences brought about by seasonal variability, differing
biophysical characteristics within the plantation tree (or the stage within the plantation rotation cycle)
and silvicultural practices. The significant differences between the water uses of a seedling
plantation tree, a tree approaching canopy closure, or a tree just prior to clear felling, all add to
accounting complexities if accounting is to be accurate and accumulative for each point in time, for
each plantation management compartment, or water resource management unit.
Due to these technical and practical limitations, the use of deemed values for plantation forest
impacts appeared to be a practical way of accounting for the variable plantation impacts on water
resources. Deemed values are considered to reflect a reasonable characterisation of biophysical
reality in plantation forests of the same type in the same groundwater management area. They are
13 Naracoorte Ranges PWA, Comaum-Caroline PWA, and Lacepede Kongorong PWA
16 | P a g e | Accounting for plantation forest groundwater impacts in the lower South East of South Australia
not point measurements of impact, but are considered appropriate estimations of groundwater
impacts and suitable for accounting and management purposes.
14. Annualised d eem ed values
A further practical consideration is the temporal scale to which deemed values for forest impacts on
water resources are applied; should values reflect the annual impact, the forest growth stage,
seasonal conditions, and plantation site variability? In considering the use of deemed values in a
temporal context, the issue of spatial distribution of any assigned value also requires consideration
for each form of hydrological impact.
Significant factors in considering spatial and temporal issues include administrative practicality and
the ability of the aquifer to ‘buffer’ any inherent variability. Variability can be caused by different
stages of the plantation life cycle, seasonal variability, plantation site variability (productivity), or
plantation management variability. The causes for variability may be for multiple reasons and
consideration should be given to whether any accounting system, or systems, should be common to
both water accounting and water management policies.
While the annualised approach was developed specifically for the robust lower South East
unconfined aquifer, it may also be a useful concept for accounting and allocation purposes in
surface water systems and fragile aquifers. However, it may not be the appropriate mechanism for
management in these systems. In fragile and endangered water systems, the management
approach may need to include site management of peak annual water impacts, with consideration to
plantation design for optimal water sustainability outcomes for other water users and the forest
owner.14
This report discusses the rationale and approaches taken in establishing the adopted deemed
annualised values for accounting and managing the impacts of plantation forest on South East
groundwater resources.
14 Plantation design criteria may include buffer widths, maintenance of open drainage lines to prevent interception
of overland flows of water, the orientation of planting rows in relation to natural contours, or breaks in planting
mounds to allow the passage of water.
17 | P a g e | Accounting for plantation forest groundwater impacts in the lower South East of South Australia
15. So f t w ood p lan t at ion ind ust r y
At the time of considering the options for accounting and management of plantation forest water
issues,15
the South East plantation forest estate was about 100 000 ha of softwood long rotation
plantation, mostly comprising Pinus radiata. The softwood industry has well-established infrastructure
in place, for both plantation management and value adding to the harvested product. In general,
there are well-established industry programs of plantation felling, thinning and replanting operations to
provide a steady flow of wood products to various markets. This implies a relatively consistent and
constant impact on regional water resources from the aggregated plantation biophysical processes.
Furthermore, the aggregate softwood forest area expansion rate remains at less than one per cent
per year.
16. Har d w ood p lan t at ion ind ust r y
While the softwood industry can be considered as a ‘mature’ industry, the hardwood short rotation
plantation industry has not settled to a regular work and replanting routine. Most of the existing
hardwood (Tasmanian blue gum) plantation forest area was planted in the four-year period from1999
to 2002.16
Due to the investment nature of the South East hardwood industry, it is anticipated that
harvesting will generally occur in plantations 9-12 years of age, depending on productivity,
management obligations to investors, and logistics such as harvesting capacity, transport, and wood
chip contract conditions.
The existing hardwood plantations were largely established to supply the export wood chip market for
paper pulp production. If the proposed Penola Pulp Mill proceeds to construction, it is anticipated that
the local hardwood industry will need to manage future harvests to provide a steady product flow to
the local mill when operational. This will require a plantation replanting strategy that will support the
contractual commitments for a consistent product flow to the pulp mill.
The area of Tasmanian blue gum plantations in the lower South East at the end of 2008 was
estimated to be 43 000 ha.
15 These issues were being considered in the period 1999-2000, when the water allocation plan for the
Lacepede-Kongorong Prescribed Wells Area was being considered
16 During the period 1999-2000, development applications for land use change were approved, or proposed for
about 35 000 ha of blue gum plantations. At 2002, about 25 000 ha of the 35 000 ha had been planted.
18 | P a g e | Accounting for plantation forest groundwater impacts in the lower South East of South Australia
17. Annualised im p act o f p lan t at ion f o r est on
g r ound w at er r esour ces
Using biophysical principles and a plantation forest management calendar to characterise forest water
use, a simple numeric model was developed in 2001 to represent plantation water requirements, or
conversely, to express how much groundwater recharge occurred under plantation forests in the
lower South East. 17
This was considered to be an important need as there was a likelihood of
further extensive plantation forest expansion with a species that was relatively unknown to the region,
with respect to impacts on water resources.
Since the mid 1970s, most forest development has occurred on land previously utilised as dryland
pasture. It is this agricultural landscape that is largely responsible for groundwater recharge and
influences the quantity of water allocated to licensed beneficial uses. Therefore, any significant
reduction in groundwater recharge from anthropogenic induced causes requires accounting and
management, particularly where the water resource is fully allocated, approaching full allocation, or
valued water dependant environments are placed at risk.
While lower South East agricultural land use and management is in ‘constant change’, responding to
market demands, seasonal variability and technology advances, recharge impacts vary at a point
scale. However, in terms of broad management area scale, the observed water table trends have
generally remained within the historic range of variability until the early 2000s when the accumulative
effect of a number of recent years of below average rainfall started to take effect.18
The historic data indicates that while there may be differences in recharge in the agricultural
landscape, the fluctuations have not been of a magnitude to warrant hydrologic management of the
agricultural landscape changes at this time.
This also provides a reinforcement of the view that the proposed annualised approach to forest
accounting is suitable for a mature and relatively stable industry with a continuous program of felling
17 At the time, as it was considered there was no significant relevant technical advice regarding direct extraction
of groundwater by plantation species, it was decided that this possibility would not be included in a plantation
forest water budget until further investigated.
18 The long-term (100 year) mean annual rainfall for Naracoorte is 565 mm and the median value is 570 mm. For
eleven of the last 15 years, the annual rainfall has been below the long term mean, with the cumulative deviation
below the mean annual rainfall for the four years 2005-2008 being 688 mm. For the previous 15 years (1978 to
1992), only 6 years had an annual rainfall less than the long term mean.
19 | P a g e | Accounting for plantation forest groundwater impacts in the lower South East of South Australia
and re planting, as practiced by the current softwood industry. With the prospect of the development
of a regional pulp mill, it is expected that the hardwood industry will ‘mature’ quickly because of the
relatively short time from planting to harvest and the need to establish a stable and constant flow of
raw material into the future for local pulp processing.
18. Hyd r o log ic r esp onse b y p lan t at ion f o r est
Different hydrological responses are expected from a forest plantation at each site or development
stage. In the accounting model, the hydraulic responses are summarised as an expression of what
would normally occur in the dryland agricultural landscape that the forest has replaced, or could be
substituted for. The responses are treated as assumptions that are generally accepted by forest and
water resource scientists and the forest industry. The base hydrological assumptions were adopted in
2001.19
The impact phases are separated into the following forest development stage descriptors:
Pre-planting period of one year before the planting of seedling trees. Based on the
assumption of some weed control, recharge occurred at the same rate as the management
area rate (that of the dryland agricultural landscape).
From canopy closure, or full site occupancy, until the site was clear felled, there was no
aquifer recharge from rainfall (100% interception of groundwater recharge by plantation
forests).
Transition from the recharge phase in the pre planting period to the no recharge condition in
the post canopy closure phase is considered linear.
19. The ad op t ed annualised f o r est w at er
r echar ge m od el The adopted forest water model ‘smoothes’ hydrologic impacts over the full forest rotation period and
expresses impacts as an annualised value for the full rotation of all plantations of the same species in
the same groundwater management area. An important model aspect is the annualised impact of
commercial plantation forests on groundwater recharge is expressed as a percentage of recharge that
occurs in a dryland agricultural landscape in each individual groundwater management area.
The forest water model minimises administrative complexity for water accounting by not having to
assess and track forest water use at different stages of forest growth throughout the forest rotation.
19 At a meeting late in 2001, CSIRO forest scientists and hydrogeologists, state hydrogeologists, water resource
managers and forest owners agreed with the base hydrological assumptions associated with the forest stage.
20 | P a g e | Accounting for plantation forest groundwater impacts in the lower South East of South Australia
The model is considered relatively robust and reliable for a ‘mature’ plantation forest industry, such as
in the South East where there is a constant activity of planting, thinning and clear felling. This activity
is generally distributed throughout the region, rather than being concentrated at any one point in the
general landscape. This is largely an historic consequence of land acquisitions combined with a
deliberate risk management approach by the industry. It is considered any model limitations,
compared to actual physical reality, are insignificant when compared to the natural recharge variability
of annual rainfall and its incidence.20
The recharge model indicates hardwood plantations use more water than the replaced or alternative
dryland agricultural landscape. The impact of hardwood plantations on groundwater recharge is that
they intercept 78 per cent of the average annual groundwater recharge that would normally occur
under the agricultural landscape.21
Conversely, the annualised groundwater recharge under a
hardwood plantation is 22 per cent of that occurring under a dryland agricultural landscape.
For softwood plantations, the corresponding values are an annual water use equivalent to 83 per cent
of the recharge under an agricultural landscape. Alternatively, the annualised forest impact on
groundwater recharge can be expressed as the forest allowing 17 per cent of the recharge that
occurred under the previous, or alternative, agricultural landscape.
Applying the model outputs to the most recent assessments of groundwater recharge in the main
forested groundwater management zones, in comparison to the dryland agricultural landscape,
hardwood plantations reduce recharge of the local groundwater system by between 94 mm and 117
mm per year.22
In the case of softwood plantations, the relative reduction is between 100 mm and
125 mm per year.23
If the forest threshold area24
was fully developed, plantation forest would reduce recharge to the lower
South East unconfined aquifer by about 205 000 ML per year, under mean rainfall conditions.
20 In 2006 key stakeholders reviewed and reaffirmed the model concept, during a consultation process
convened by the South East Natural Resources Management Board.
21 Agricultural landscape consists of pastures and annual cropping. It is a mixed and variable landscape
reflective of traditional agriculture and is the main source of groundwater recharge.
22 For the management areas of Coles and Short, annual groundwater recharge on the agricultural landscape is
assessed at 120 mm and 150 mm /yr respectively- ref DWLBC 2007/11
23 For the management areas of Hindmarsh, 2A and 3A, annual groundwater recharge on the agricultural
landscape is assessed at 150 mm, 140mm and 120 mm /yr respectively- ref DWLBC 2007/11
24 Threshold area is a term used in the National Water Initiative. It is the sum of the existing plantation forest
estate plus any allowance for plantation expansion that has been accounted for within the water budget. In the
21 | P a g e | Accounting for plantation forest groundwater impacts in the lower South East of South Australia
20. Annualised g r ound w at er ext r act ion im p act
m od els
In addition to the annualised recharge impact values for softwood and hardwood, plantations,
annualised groundwater extraction impact models have also been developed for both plantation types
overlying shallow water tables.
The adopted annualised groundwater extraction model indicates that where the median water table is
six metres or less below ground level, hardwood plantation forests extract 1.82 ML/ha/year and
softwood plantation forests extract 1.66 ML/ha/year.25
The extraction model is based on biophysical principles and information provided by the CSIRO
technical report Water use by Tree Plantations in South East South Australia.26
Based on the latest data and the depth to water table determined by the recent LIDAR survey and
digital elevation modelling (DEM), there is approximately 60 000 ha of plantation forest extracting
about 106 000 ML per year from the groundwater system.27
A previous extraction estimate, prior to the availability of the DEM, was 80 000 ML/year and this was
presented in the DWLBC 2007/11 report.28
Based on recharge data reported in DWLBC 2007/11, the
combined impact of plantation forests on the total water budget is about 32 per cent of the total water
available for allocation and that assigned to forest impacts.
case of the lower South East, threshold tables were developed by summing the forest estate, as at 2002, and
approximately 59 000 ha of recharge allowed for expansion potential.
25 These figures are annualised values derived from a model that was refined by a technical working group
convened by the SENRMB during the key stakeholder consultation process of September - November 2006
26 CSIRO Report 148, Benyon, R and T Doody; September 2004; and also presented in Australian Journal of
Botany, 2006, 54, 181-192; Impacts of tree plantations on groundwater in south-eastern Australia; Richard G.
Benyon, S Theiveyanathan and Tanya M. Doody
27 Base data from SERIC and calculations by DWLBC Mt Gambier; per coms, Jeff Lawson, 14 November 2008
28 DWLBC 2007/11. A New Understanding on the Level of Development of Groundwater Resources in the South
East. Latchem B, R Carruthers, G Harrington and D Harvey
22 | P a g e | Accounting for plantation forest groundwater impacts in the lower South East of South Australia
21. Plan t at ion f o r est d escr ip t ions f o r
accoun t ing and m anagem en t
To manage both forest types (hardwood or softwood), as separate but single classes, has
administrative benefit for both forest owners and the water resource manager. It minimises the need
to account for the various plantation growth stages or for individual years. This is achieved by treating
each forest type as a single accounting class, regardless of age. In reality there is, and expected to
be, significant point variability of impacts on the groundwater resource at each growth stage, or site, in
the same management area, but an acceptance of the ‘unders’ and ‘overs’ and aquifer resilience to
short term fluctuations, it is considered the annualised models are suitable in the current context.
In consultation with the forest industry, the two forest types have been described in terms of forest life
(years) from planting to clear felling. In the case of softwood plantations, the number of thinning
operations is also included. To assist in ‘visualising’ the characterised plantation, each industry has
estimated the productivity, or site quality, of its ‘standard plantation’.
The hardwood plantation industry has advised that second rotations will be established by replanting
and not by the coppice method.29
Industry has acknowledged if coppicing were to be practiced, there
is an expectation the forest manager would be responsible for the additional water impact associated
with a coppiced plantation. This additional impact would likely be accounted for by quarantining an
appropriate water allocation for the plantation life for the additional deemed annualised impact.
In the case of softwood plantations, there is considerable variation in how the three main South East
forest companies manage and harvest their plantations. During the 2006 review, it was generally
agreed plantation rotation length varied from about 28 years to 45 years, with some compartments
being harvested at a greater age, however, industry agreed on a single description that takes account
of different plantation management strategies through a ‘weighting’ approach.
In the development of future water allocation plans, a review of silvicultural practices or forest
management changes is anticipated to be undertaken, including a review of the current description of
the typical plantation and hence, the annualised water accounting model.
While it is a policy issue to be confirmed, through the relevant water allocation plan, the impact of
changing annualised deemed values for recharge impacts should only impact on the transfer water
29 Current view of the hardwood industry is higher forest productivity will be gained from improved genetic
material that is associated with replanting with seedling stock, rather than continuing by coppicing the existing
tree stock. There are also management cost issues in establishing a second rotation by coppicing.
23 | P a g e | Accounting for plantation forest groundwater impacts in the lower South East of South Australia
accounting, that is, for a business enterprises entering and exiting the industry, or changing the forest
type. In the case of a stable mature forest industry, a change to the deemed recharge values should
have no consequence for ongoing forest water rights if the accounting approach remains a function (a
percentage) of management area recharge.
In 2006, the respective plantation industries supported the following basic descriptors for the
‘standard plantation’ forest: 30
21.1 Hardwood (short rotation) plantation forest
Planting to harvest, the time period is ten years;
Expectation of a site index of 14 with an aggregated productivity of 220 cubic metres by
year ten; and
Establishment of next rotation is one year after clear felling and by planting new seedlings
(no coppicing).
21.2 Softwood (long rotation) plantation forest
Planting to harvest, the time period is 35 years;
Four thinning operations, where the object is to approximately halve the tree stocking
existing at the time of commencing the thinning;
Plantations expected to be site quality three; and
Establishment of next rotation is one year after clear felling.
Table 1 presents a summary of current (2006) assigned deemed annualised values for South East
plantation forests. Details on the assumptions, rationale, construct and mathematics of the models
are presented in the section titled Development of the plantation forest annualised recharge impact
model, later in this report.
30 Determined and agreed by industry representatives in consultation with the South East Natural Resources
Management Board in October 2006.
24 | P a g e | Accounting for plantation forest groundwater impacts in the lower South East of South Australia
22. Sum m ar y
The impact of plantation forest on water resources in the lower South East is determined by
the deemed annualised impact per hectare of forested land, relative to the agricultural
landscape replaced or substituted for. In the case of hardwood plantations, groundwater
recharge for the forested area is reduced by 78 per cent of that of the agricultural landscape
and softwood plantations reduce recharge by 83 per cent.
Where the median water table is six metres, or less, from ground level, hardwood plantations
are deemed to extract 1.82 ML/ha/year, on an annualised basis, and softwood plantations are
considered to extract 1.66 ML/ha/year.
Dryland agricultural uses are constantly changing, but at a management area scale the
outcome on the groundwater system remains relatively constant. It is recognised that if any
significant hydrological changes were brought about by agricultural land-use change, or by
land management change, they would need to be assessed on merit at the time of
identification.
The overall impact of plantation forest on water resources is estimated to be equivalent to
about 32 per cent of the volume of water potentially available for allocation in the lower South
East.
25 | P a g e | Accounting for plantation forest groundwater impacts in the lower South East of South Australia
ANNUALISED PLANTATION FOREST GROUNDWATER IMPACT MODELS
23. Fo r est w at er accoun t ing con cep t s
The following discussion describes the two initial conceptual numeric recharge models developed in
2001. These characterised the hardwood and softwood plantation impacts on groundwater recharge
and currently underpin the accounting and administrative processes in South East water resource
management.
The area of a plantation forest that impacts on the groundwater resource was agreed with the
plantation industry as being the effective or productive plantation forest area that lay between the
outer stump lines of a plantation compartment. This area may incorporate minor access tracks, but
excludes firebreaks and easements for electricity transmission lines, and protective buffers around
native vegetation and wetlands. It is the area that a forest owner/manager generally reports for fire
information surveys.
In 2006, the two initial recharge models were revised and the revisions are expected to underpin
forest water management in the next water allocation plan. In addition, groundwater extraction
models were developed for both forest types in 2006. These currently apply to new plantation forests
established over shallow water tables.31
Each model version and the underpinning applied assumptions are described in this section.
24. Har d w ood r echar ge m od el: ver sion 2001 (11-year r o t at io n )
The assumptions applied to the conceptual numeric models were based on descriptions of plantation
forest industry management at the time (2001) and agreed by a meeting of CSIRO forest scientists
and hydrogeologists, State hydrogeologists and water managers, Catchment Water Management
Board representatives and South East plantation forest owners.
Within the models, the particular hydrological responses are related to the plantation biophysical
stage and management assumptions for the forest site.
31 Introduced by regulation on 31 July 2007
26 | P a g e | Accounting for plantation forest groundwater impacts in the lower South East of South Australia
24.1 Forest management assumptions:
One year of weed control prior to planting seedling trees.
Canopy closure occurs three years after planting.
Clear felling occurs 11 years after planting.
One year clean up following clear felling.
24.2 Hydrological impact assumptions based on forest biophysical stage:
Recharge occurs for one year prior to planting at the management area recharge rate
(MARR).
No recharge under a closed canopy forest.
Reduction in recharge from planting to canopy closure is linear.
Recharge resumption after clear felling back to the MARR is linear.
24.3 Calculation of annualised recharge impact (refer to Figure 3) :
Recharge impacts expressed as a percentage of MARR.32
Recharge credit for the one year prior to planting is 100% MARR
Recharge credit for three years from planting to canopy closure is [3/2]*100% MARR
Recharge credit for final year of rotation, for clean up, is [½]*100% MARR
Sum of all credits divided by 13 years is the annualised recharge impact of hardwood
plantations, expressed as a percentage of MARR:
[100 + (300/2) + (100/2)] /13 % MARR
= 23% MARR
25. So f t w ood r echar ge m od el: ver sion 2001 (30-year r o t at io n )
The assumptions were based on descriptions of plantation forest industry management at the time
and developed using similar principles as applied to the hardwood model.
32 For offset accounting, recharge can be expressed as an annual volume, or irrigation area based equivalent.
The units of licensed water allocations at the time were area based Irrigation Equivalents (IE) with a designated
exchange rate in ML.

27 | P a g e | Accounting for plantation forest groundwater impacts in the lower South East of South Australia
25.1 Forest management assumptions:
One year of weed control prior to planting of seedling tree.
Canopy closure occurs six years after planting.
Clear felling occurs, on average at 30 years after planting.
Two thinning operations occurring before clear felling.
One year ‘clean-up’ following clear felling.
25.2 Hydrological impact assumptions based on forest biophysical stage:
Recharge occurs for one year prior to planting at the MARR.
No recharge under a closed canopy forest.
Reduction in recharge from planting to canopy closure is linear.
Recharge resumption after clear felling back to MARR is linear.
A recharge, equivalent to 50% MARR, occurs in the year immediately following each
thinning operation.
25.2 Calculation of annualised recharge impact (refer to Figure 4):
Recharge impacts expressed as a percentage of MARR.
Recharge credit for the one year prior to planting is100% MARR
Recharge credit for six years from planting to canopy closure is [6/2]*100% MARR
Recharge credit for each year following the thinning is [2*1/2]*100% MARR
Recharge credit for final year of rotation, for ‘clean-up’ is [½]*100% MARR
Sum of all credits divided by 32 years is the annualised recharge impact of softwood
plantations, expressed as a percentage of MARR:
[100 + (600/2) + (200/2) + (100/2)] /32 % MARR
=17% MARR
A graphic expression of the two annualised recharge models are presented in Figures 3 (hardwood)
and 4 (softwood).
28 | P a g e | Accounting for plantation forest groundwater impacts in the lower South East of South Australia
26. Revisio n o f t he 2001 annualised r echar ge
im p act m od els
As an input to the report DWLBC 2006/02,33
based on the same plantation forest calendar, a
groundwater extraction model was developed. The plantation forest industry later indicated that the
forest calendar required revision to better reflect its management practices and the estate at the time
(2006). This request was addressed during an industry consultation process conducted by the South
East Natural Resources Management Board (SENRMB) in 2006.34
Consequently, the hardwood and
softwood recharge models were revised to reflect a more considered description of a typical
plantation forest estate, its management, and the related biophysical characteristics. These
discussions led to refined models being developed for the Lower Limestone Coast Prescribed Wells
Area Water Allocation Plan.
In the 2001 model, the decreasing recharge benefit from planting to canopy closure was presented
linearly. The plantation industry expressed a view that it preferred the recharge representation (while
still essentially linear) as a specified percentage of the management area recharge rate in each
consecutive and relevant year.
The revised 2006 recharge models are summarised below.
27. Har d w ood r echar ge m od el: ver sion 2006 (10-year r o t at io n )
27.1 Forest management assumptions:
Weed control (mid row between seedling rows strip sprayed, representing 50% of area) is
practiced at time of planting seedling trees, and generally considered as persisting until
canopy closure.
Canopy closure occurs three years after planting.
Clear felling occurs 10 years after planting.
One year ‘clean-up’ following clear felling.
An 11-year management cycle for a 10-year forest rotation.
33 Review of groundwater resource condition and management principles for the Tertiary Limestone Aquifer in the
South East of South Australia, Brown KG, Harrington GA and Lawson J, DWLBC 2006/02
34 SENRMB Technical sub- committee meeting 4 October 2006
29 | P a g e | Accounting for plantation forest groundwater impacts in the lower South East of South Australia
27.2 Hydrological impact assumptions based on forest biophysical stage:
Recharge credit of 120% of MARR for the planting year.
No recharge under a closed canopy forest.
Recharge from planting to canopy closure is 120% of MARR for 1st year. In subsequent
years until canopy closure, recharge is 80% and 40% respectively.
No recharge in clean up year, but recommences in following year, which is the planting
year of the next rotation.
27.3 Calculation of annualised recharge impact:
Recharge impacts expressed as a percentage of MARR.
Recharge credit from planting to canopy closure is [120% + 80% + 40%] MARR
Sum of all credits divided by 11 (years) is the annualised recharge impact of hardwood
plantations, expressed as a percentage of MARR.
[120% + 80% + 40%] /11 MARR
= 22% MARR
28. So f t w ood r echar ge m od el: ver sion 2006 (35-year r o t at io n )
The assumptions are based on descriptions of plantation forest industry management at the time
(2006) and developed using similar principles as the hardwood model.
28.1 Forest management assumptions:
Full weed control at time of planting seedling trees (usually follows clear felling and clean
up year of a previous rotation).
Canopy closure occurs six years after planting.
Clear felling occurs at 35 years.
Four thinning operations occurring before clear fell.
One year clean up following clear felling.
28.2 Hydrological impact assumptions based on forest biophysical stage:
Recharge occurs at 120% of MARR for planting year.
No recharge under a closed canopy forest.
30 | P a g e | Accounting for plantation forest groundwater impacts in the lower South East of South Australia
Recharge from planting to canopy closure is 120% of MARR for 1st year and in
subsequent years to canopy closure; recharge is 100%, 80%, 60%, 40% and 20%
respectively.
No recharge in clean up year, but recommences in following year, which is the planting
year of the next rotation.
A recharge spike in each year following the four thinning operations is equivalent to 50%
of MARR for that year following the thinning operation.
A 36-year management cycle for a 35-year forest rotation.
28.3 Calculation of annualised recharge impact:
Recharge impacts expressed as a percentage of MARR.
Recharge credit from planting to canopy closure is [120% + 100%+ 80% + 60% + 40% +
20%] MARR
Recharge credits aggregated following the four thinning operations is [50% + 50% + 50%
+ 50%] MARR
Sum of all credits divided by 32 (years) is the annualised recharge impact of softwood
plantations:
{[120%+100%+80%+60%+40%+20%] + [50%+50%+50%+50%]} /36 MARR
= 17% MARR
A graphic expression of the two revised annualised recharge models are presented in Figures 5
(hardwood) and 6 (softwood).
29. Dir ect ext r act ion ann ualised m od els
From 2002 to 2004, CSIRO observed and sampled a number of sites situated in commercial
hardwood plantation forests in the area known as Wattle Range, west of Penola. Following this study
and combined with observations at other sites, CSIRO released a technical report and other technical
papers on the issue of direct extraction of groundwater by plantation forest species from shallow
water tables.

31 | P a g e | Accounting for plantation forest groundwater impacts in the lower South East of South Australia
Essentially, the value attributed to groundwater extraction by the plantations is the difference
between the annual evapotranspiration of the observed trees and the rainfall observed at the
respective sites. The CSIRO report includes adjustments for changes in soil moisture storage.
The methodology is described in the CSIRO papers, Water use by Tree Plantations in South
East South Australia35
and Impacts of tree plantations on groundwater in south-eastern
Australia36
. In order to develop a numerical model that characterised the direct extraction of
groundwater by plantation forests, the following findings of the CSIRO documents were noted:
Hardwood and softwood species in the lower South East can extract groundwater where the
water table is shallow (a six metre median depth, or less, from ground level to the water table)
and there is no root impedance between the ground surface and the water table.
All observations were taken in closed canopy forests.
Eight of the nine research plots used groundwater, while at the ninth site a shallow hardpan
layer is believed to have prevented Pinus radiata trees accessing groundwater.37
A mean annual extraction rate of 4.35 ML/ha was observed for the eight water extraction
sites, with lower and upper 90% confidence limits of 3.22 ML/ha and 5.48 ML/ha.
Annual extraction values for the observations ranged from 1.08 ML/ha to 6.70 ML/ha.
To develop an accounting numeric model for direct extraction by plantation forest, the following
principles and preferences were assumed:
For management purposes, the groundwater extraction impacts should be based on the
principle that hydrogeological impacts are averaged over the forest life cycle. This is the
same approach adopted in estimating plantation impacts on groundwater recharge and could
be considered complementary to the existing annualised recharge models.
While CSIRO observations did indicate extraction from depths greater than six metres, there
was (and is) no obvious justification or policy reasons at this time to depart from the CSIRO
specified median depth of six metres, or less.
35CSIRO Report 148, Benyon, R and T Doody; September 2004.
36 Australian Journal of Botany, 2006, 54, 181-192; Richard G. Benyon, S Theiveyanathan and Tanya M.
Doody
37 A shallow hardpan layer condition has occurred at some commercial forest sites, resulting in lower forest
productivity. The industry now uses extensive soil analysis in selecting plantation sites; with many land purchase
agreements being subject to a full soil analysis. The land selection process now minimises the likelihood of
significant future impact of this condition on forest production.
32 | P a g e | Accounting for plantation forest groundwater impacts in the lower South East of South Australia
CSIRO have presented no evidence to suggest that either pine or blue gum have any greater
propensity to extract groundwater than the other. Consequently, CSIRO has assumed that the
mean annual impact of the two species is identical.
Observed values are representative of closed canopy plantations at peak productivity.
To ensure a fair and reasonable baseline value was established, it was considered important
to only use data that was collected:
o during the same time sequence; and
o from plantations recognised by the industry as being commercially managed sites.
The outcome was the peak annual mean baseline extraction value of 3.64 ML/ha for plantation forests
overlying a shallow water table of six metre median depth, or less, from ground level. This is
compared to the CSIRO reported value of 4.35 ML/ha/year.
Five observation sites contribute to the value of 3.64 ML/ha/year, while eight sites provided data to
give the CSIRO value of 4.35 ML/ha/year. A hardpan site is believed to exist at one site of the five
sites used in the above DWLBC calculation, essentially discounting the potential impact down to the
adopted management value of 3.64 ML/ha/year. Abbreviated data used to establish the 3.64
ML/ha/year value is presented in Table 2.
30. Assum p t ions f o r t he d ir ect ext r act ion
annualised accoun t ing m od els
The assumptions for the direct extraction models are based on the plantation forest management
practices and associated biophysical assumptions applied to the 2006 revision of the recharge
models. These were established in consultation with the plantation forest industry technical
representatives.
During these discussions, the hardwood industry expressed a view that coppicing to establish a
second tree harvest was unlikely. This was contrary to an earlier position of the industry in not
dismissing the use of coppicing. As a result, a precautionary approach was taken in the technical
report DWLBC 2006/02 in applying the principle that all hardwood plantations would be coppiced to
establish a second wood chip harvest. 38
38 It is unclear how a restructured blue gum plantation industry (due to the failure of the main MIS forest
managers in early 2009), will approach the issue of establishing the next forest rotation.
33 | P a g e | Accounting for plantation forest groundwater impacts in the lower South East of South Australia
31. Har d w ood d ir ect ext r act ion m od el
31.1 Forest management assumptions:
Canopy closure occurs three years after planting.
Clear felling occurs 10 years after planting.
An 11-year management cycle for a 10-year forest rotation.
31.2 Hydrological impact assumptions based on forest biophysical stage:
Where there is a shallow water table, no direct extraction commences before canopy
closure.
Extraction commences at canopy closure and gradually increases until peak
productivity in the 7th year after planting, when extraction plateaus at 3.64 ML/ha.
Increased extraction from the 4th year to 7th year is considered to be linear, but
expressed as a discrete volume for each year.
Extraction ceases with clear felling.
31.3 Calculation of annualised extraction impact:
Annualised extraction is expressed as ML/ha/year.
Extraction is calculated to be 0.91 ML/ha in the year following canopy closure.
Extraction for each consecutive year is 1.82, 2.73 and 3.64 ML/ha respectively after
canopy closure:
[0.91 + 1.82 + 2.73 + 3.64] ML/ha
Extraction continues at the peak rate of 3.64 ML /ha for the remaining three years, until
clear felling in the 10th year after planting:
[3.64 + 3.64 + 3.64] ML/ha
The sum of all extraction debits divided by 11 (years) is the annualised recharge impact
of hardwood plantations:
{[0.91 + 1.82 + 2.73 + 3.64] + [3.64 + 3.64 + 3.64]} /11
= 1.82 ML/ha/year
34 | P a g e | Accounting for plantation forest groundwater impacts in the lower South East of South Australia
31.4 Coppiced hardwood direct extraction model
As there is a possibility that some hardwood plantations may generate a second tree harvest
by coppicing, a model with the following key characteristics was adopted:
A coppiced plantation has the same assumptions as the above single rotation model,
but with the following additions for the second tree harvest:
From felling to coppicing, there is no recharge of groundwater or direct
extraction of groundwater during this one-year period. This year is already
incorporated into the initial rotation calculation.
From the first year of the coppiced regeneration to peak extraction of the
second cropping phase, there is a time lapse of three years. Extraction in
this period advances from zero to the adopted peak rate of 3.64 ML /ha. This
is apportioned at the rates of 0.91, 1.82 and 2.73 ML/ha respectively for the
consecutive years.
There are four years of peak extraction of 3.64 ML/ha to clear felling.
After clear felling there is one year of site recovery with no groundwater
extraction.
The aggregated groundwater extraction described in the above assumptions
is divided by 19 (years), based on a 10-year standard rotation (an 11-year
time lapse) and an eight-year continuation for the coppiced crop, to provide
an annualised extraction impact for the hardwood plantation.
The coppiced plantation extraction can be expressed as:
an increase from 1.82 ML/ha/yr to 2.50 ML/ha/yr for the 8 years of the
coppiced period, or alternatively;
As an average annualised rate of 2.11 ML/ha/yr for the full 19 year plantation
period.
32. So f t w ood d ir ect ext r act ion m od el
32.1 Forest management assumptions:
Canopy closure occurs six years after planting.
Clear felling occurs 35 years after planting.
A 36-year management cycle for a 35-year forest rotation.
35 | P a g e | Accounting for plantation forest groundwater impacts in the lower South East of South Australia
32.2 Hydrological impact assumptions based on forest biophysical stage:
Where there is a shallow water table, no direct extraction commences before canopy
closure.
Extraction commences in the 7th year after planting.
Extraction increases from canopy closure until peak productivity in the 11th year after
planting when extraction reaches 3.64 ML/ha.
Increasing extraction from the 7th year to 11th year is considered to be linear, but
expressed as a discrete volume for each year.
Direct extraction is considered to assume a generalised linear taper from the peak of
3.64ML/ha to 1.0 ML/ha towards the end of the rotation. The general decline in
extraction reflects the impact of the reducing stem density associated with thinning.
The trend is interrupted with each of the four thinning operations, with extractions
recommencing at 1 ML/ha, following each thinning, and increasing to offset the
increased production until next thinning. This results in a ‘ratchet’ effect, but within the
general overall declining trend.
Extraction ceases with clear felling.
32.3 Calculation of annualised extraction impact:
Extraction is expressed as ML/ha /year.
Sum of all extraction debits divided by 36 (years) is the annualised recharge impact of
softwood plantations.
The individual adopted values contributing to the aggregated extraction of 59.9 ML is
presented in Table 3.
The outcome is an annualised value of 1.66 ML/ha/year
A graphic expression of the two-groundwater extraction models is presented in Figures 7 (Hardwood)
and 8 (Softwood), but Figure 8 must be considered with accompaniment of Table 3.
33. Sum m ar y
The deemed annualised accounting approach for plantation forest impacts on South East
groundwater resources appears to provides a simple administrative accounting tool with the recharge
impacts expressed as a percentage of that recharge that would normally occur in the dryland
agricultural landscape. The approach is suitable for a mature plantation forest industry in a region
with a relatively robust groundwater resource. The system requires little administrative input by the
forest or water resource managers, but it should be subject to a regular review to ensure that it is
reflective of silvicultural practices for the forest estate being accounted for. Similarly, any new relevant
technical knowledge gains, with respect to forest biophysical characteristics or hydrogeology, need to
be considered in any revision.
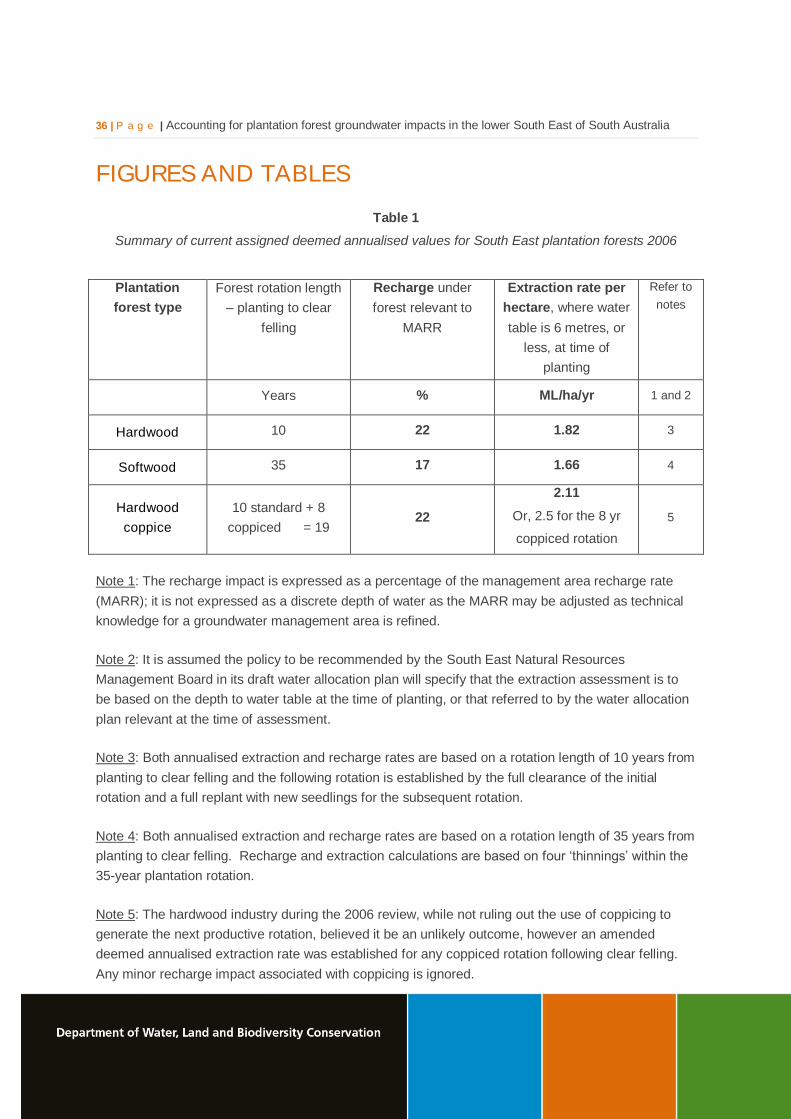
36 | P a g e | Accounting for plantation forest groundwater impacts in the lower South East of South Australia
FIGURES AND TABLES
Table 1
Summary of current assigned deemed annualised values for South East plantation forests 2006
Plantation
forest type
Forest rotation length
– planting to clear
felling
Recharge under
forest relevant to
MARR
Extraction rate per
hectare, where water
table is 6 metres, or
less, at time of
planting
Refer to
notes
Years % ML/ha/yr 1 and 2
Hardwood 10 22 1.82 3
Softwood 35 17 1.66 4
Hardwood
coppice
10 standard + 8
coppiced = 19 22
2.11
Or, 2.5 for the 8 yr
coppiced rotation
5
Note 1: The recharge impact is expressed as a percentage of the management area recharge rate
(MARR); it is not expressed as a discrete depth of water as the MARR may be adjusted as technical
knowledge for a groundwater management area is refined.
Note 2: It is assumed the policy to be recommended by the South East Natural Resources
Management Board in its draft water allocation plan will specify that the extraction assessment is to
be based on the depth to water table at the time of planting, or that referred to by the water allocation
plan relevant at the time of assessment.
Note 3: Both annualised extraction and recharge rates are based on a rotation length of 10 years from
planting to clear felling and the following rotation is established by the full clearance of the initial
rotation and a full replant with new seedlings for the subsequent rotation.
Note 4: Both annualised extraction and recharge rates are based on a rotation length of 35 years from
planting to clear felling. Recharge and extraction calculations are based on four ‘thinnings’ within the
35-year plantation rotation.
Note 5: The hardwood industry during the 2006 review, while not ruling out the use of coppicing to
generate the next productive rotation, believed it be an unlikely outcome, however an amended
deemed annualised extraction rate was established for any coppiced rotation following clear felling.
Any minor recharge impact associated with coppicing is ignored.
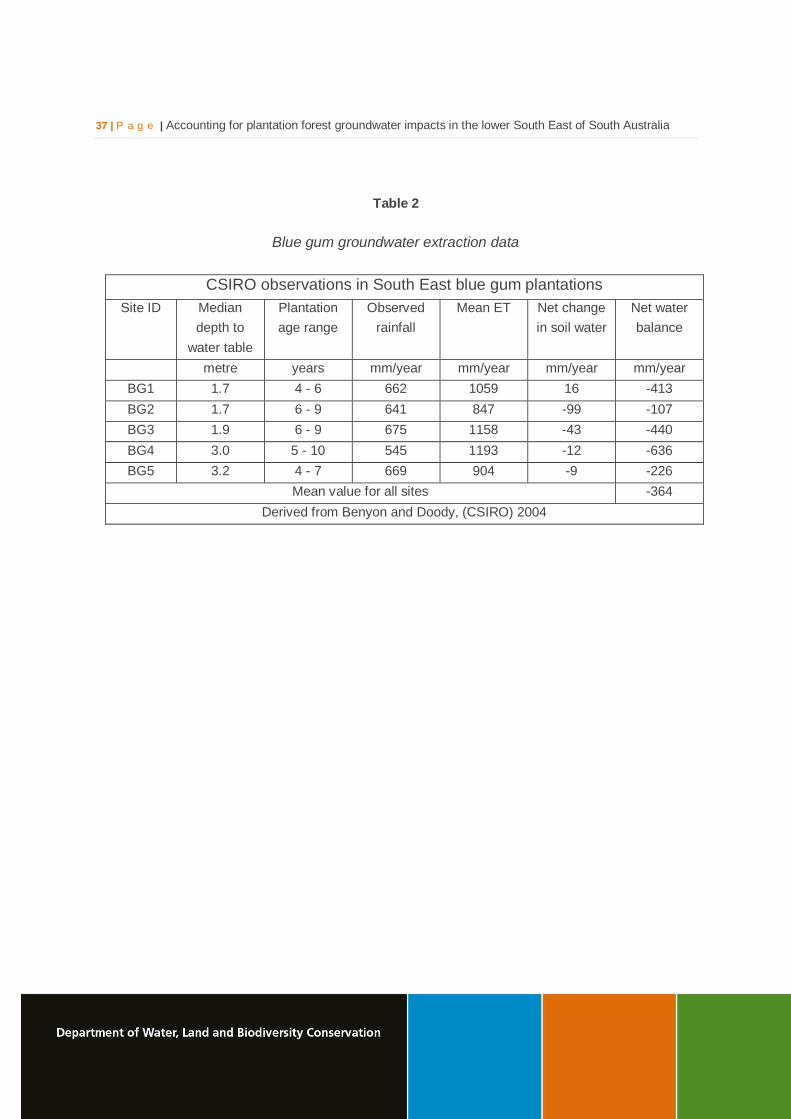
37 | P a g e | Accounting for plantation forest groundwater impacts in the lower South East of South Australia
Table 2
Blue gum groundwater extraction data
CSIRO observations in South East blue gum plantations
Site ID Median
depth to
water table
Plantation
age range
Observed
rainfall
Mean ET Net change
in soil water
Net water
balance
metre years mm/year mm/year mm/year mm/year
BG1 1.7 4 - 6 662 1059 16 -413
BG2 1.7 6 - 9 641 847 -99 -107
BG3 1.9 6 - 9 675 1158 -43 -440
BG4 3.0 5 - 10 545 1193 -12 -636
BG5 3.2 4 - 7 669 904 -9 -226
Mean value for all sites -364
Derived from Benyon and Doody, (CSIRO) 2004
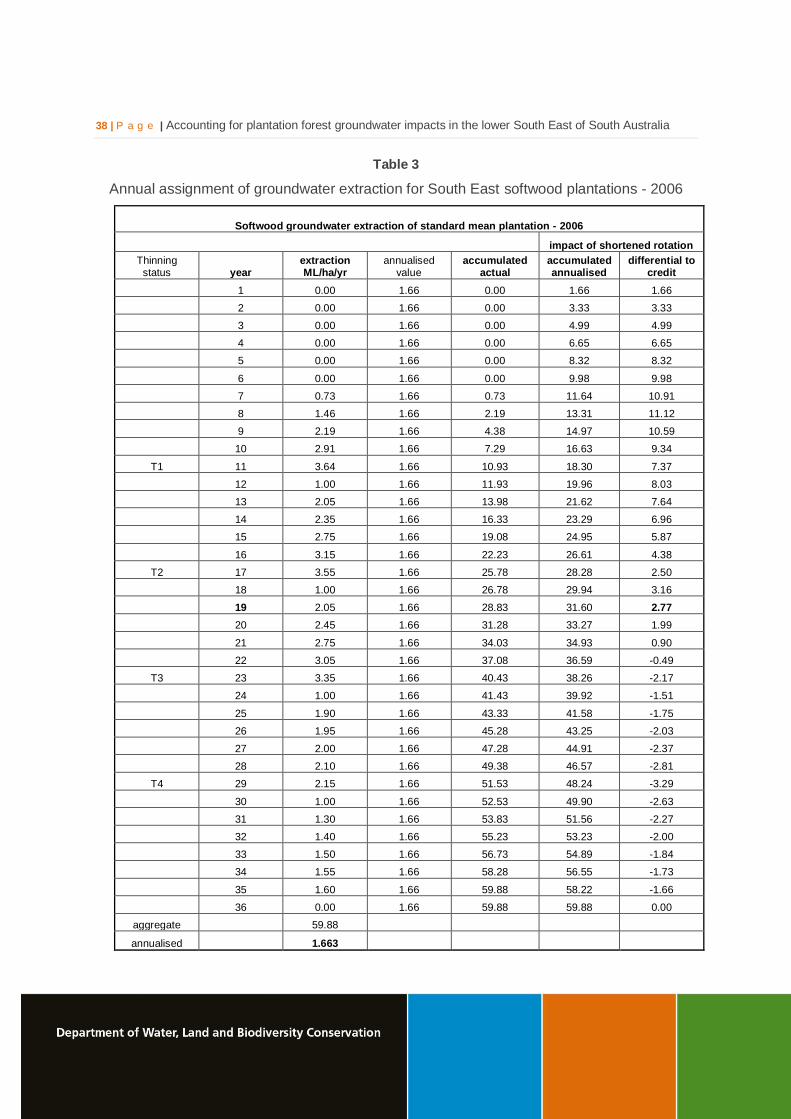
38 | P a g e | Accounting for plantation forest groundwater impacts in the lower South East of South Australia
Table 3
Annual assignment of groundwater extraction for South East softwood plantations - 2006
Softwood groundwater extraction of standard mean plantation - 2006
impact of shortened rotation
Thinning status year
extraction ML/ha/yr
annualised value
accumulated actual
accumulated annualised
differential to credit
1 0.00 1.66 0.00 1.66 1.66
2 0.00 1.66 0.00 3.33 3.33
3 0.00 1.66 0.00 4.99 4.99
4 0.00 1.66 0.00 6.65 6.65
5 0.00 1.66 0.00 8.32 8.32
6 0.00 1.66 0.00 9.98 9.98
7 0.73 1.66 0.73 11.64 10.91
8 1.46 1.66 2.19 13.31 11.12
9 2.19 1.66 4.38 14.97 10.59
10 2.91 1.66 7.29 16.63 9.34
T1 11 3.64 1.66 10.93 18.30 7.37
12 1.00 1.66 11.93 19.96 8.03
13 2.05 1.66 13.98 21.62 7.64
14 2.35 1.66 16.33 23.29 6.96
15 2.75 1.66 19.08 24.95 5.87
16 3.15 1.66 22.23 26.61 4.38
T2 17 3.55 1.66 25.78 28.28 2.50
18 1.00 1.66 26.78 29.94 3.16
19 2.05 1.66 28.83 31.60 2.77
20 2.45 1.66 31.28 33.27 1.99
21 2.75 1.66 34.03 34.93 0.90
22 3.05 1.66 37.08 36.59 -0.49
T3 23 3.35 1.66 40.43 38.26 -2.17
24 1.00 1.66 41.43 39.92 -1.51
25 1.90 1.66 43.33 41.58 -1.75
26 1.95 1.66 45.28 43.25 -2.03
27 2.00 1.66 47.28 44.91 -2.37
28 2.10 1.66 49.38 46.57 -2.81
T4 29 2.15 1.66 51.53 48.24 -3.29
30 1.00 1.66 52.53 49.90 -2.63
31 1.30 1.66 53.83 51.56 -2.27
32 1.40 1.66 55.23 53.23 -2.00
33 1.50 1.66 56.73 54.89 -1.84
34 1.55 1.66 58.28 56.55 -1.73
35 1.60 1.66 59.88 58.22 -1.66
36 0.00 1.66 59.88 59.88 0.00
aggregate
59.88
annualised
1.663
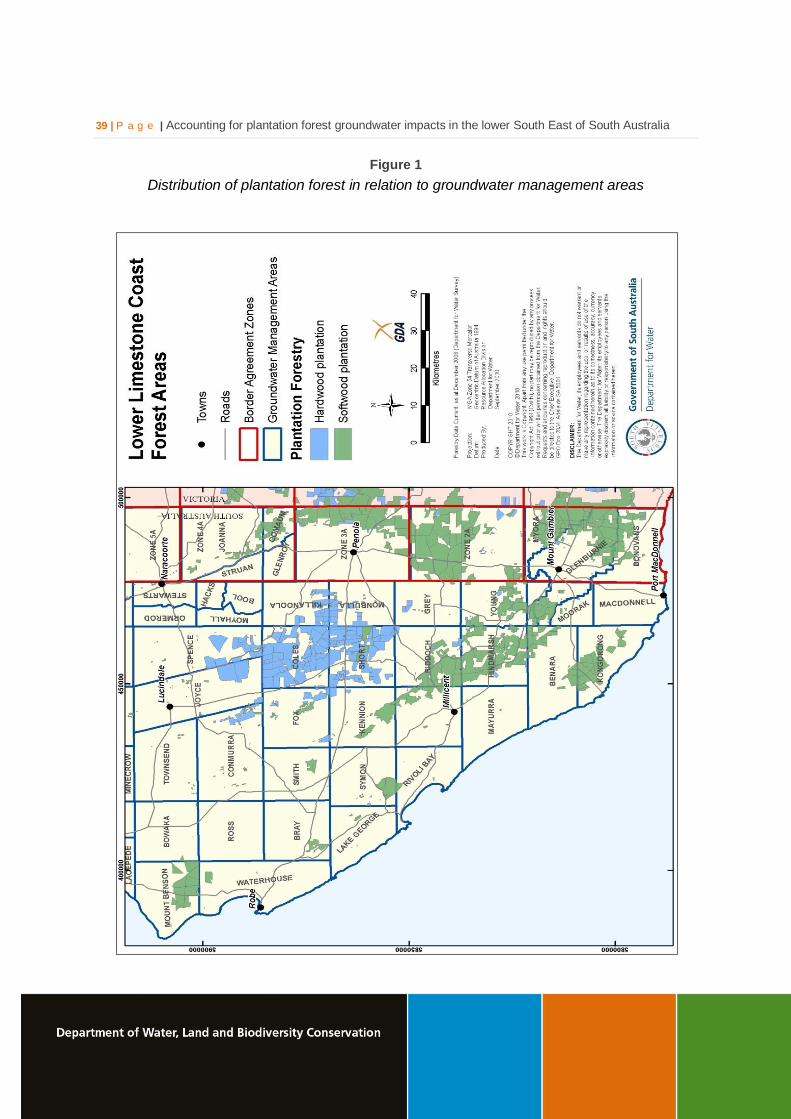
39 | P a g e | Accounting for plantation forest groundwater impacts in the lower South East of South Australia
Figure 1
Distribution of plantation forest in relation to groundwater management areas
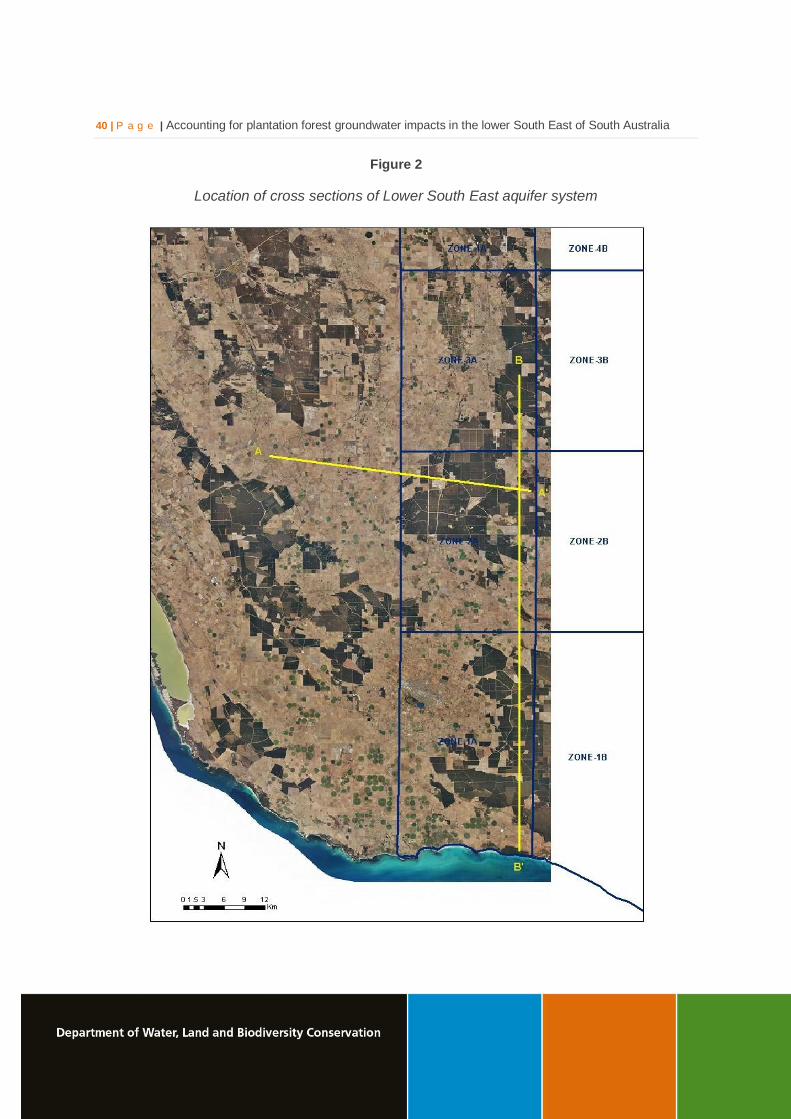
40 | P a g e | Accounting for plantation forest groundwater impacts in the lower South East of South Australia
Figure 2
Location of cross sections of Lower South East aquifer system
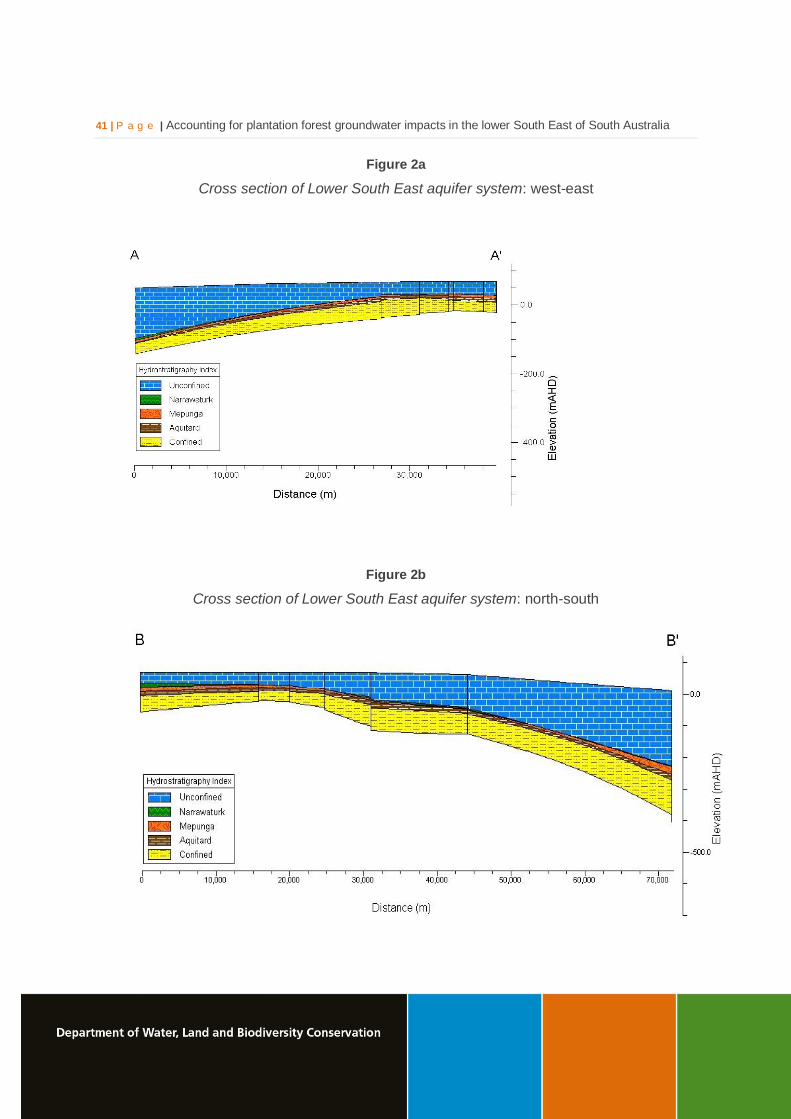
41 | P a g e | Accounting for plantation forest groundwater impacts in the lower South East of South Australia
Figure 2a
Cross section of Lower South East aquifer system: west-east
Figure 2b
Cross section of Lower South East aquifer system: north-south
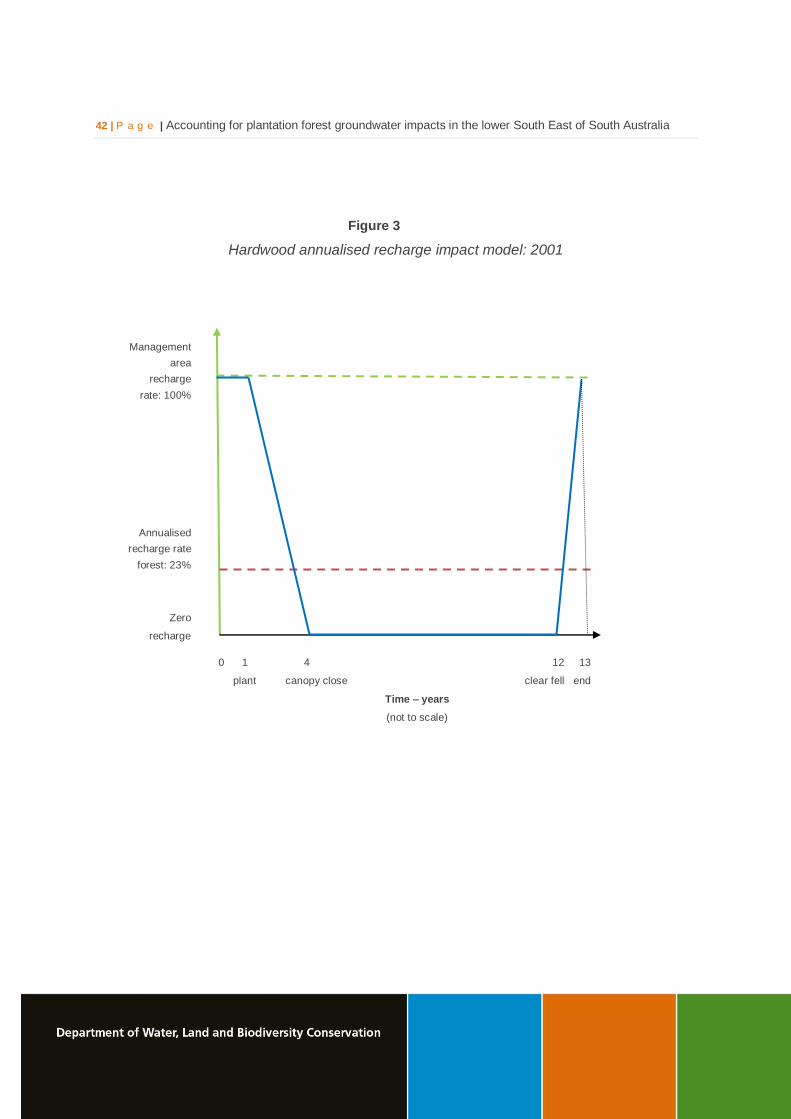
42 | P a g e | Accounting for plantation forest groundwater impacts in the lower South East of South Australia
Figure 3
Hardwood annualised recharge impact model: 2001
Management
area
recharge
rate: 100%
Annualised
recharge rate
forest: 23%
Zero
recharge
0 1 4 12 13
plant canopy close clear fell end
Time – years
(not to scale)
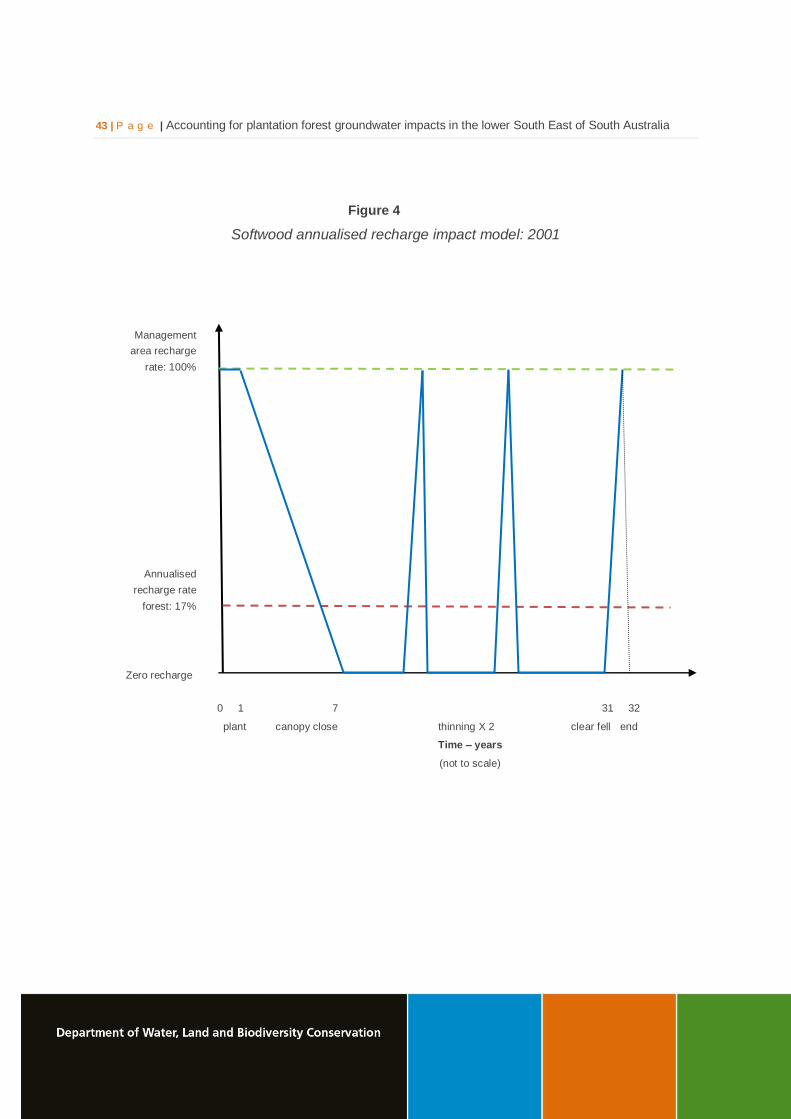
43 | P a g e | Accounting for plantation forest groundwater impacts in the lower South East of South Australia
Figure 4
Softwood annualised recharge impact model: 2001
Management
area recharge
rate: 100%
Annualised
recharge rate
forest: 17%
Zero recharge
0 1 7 31 32
plant canopy close thinning X 2 clear fell end
Time – years
(not to scale)
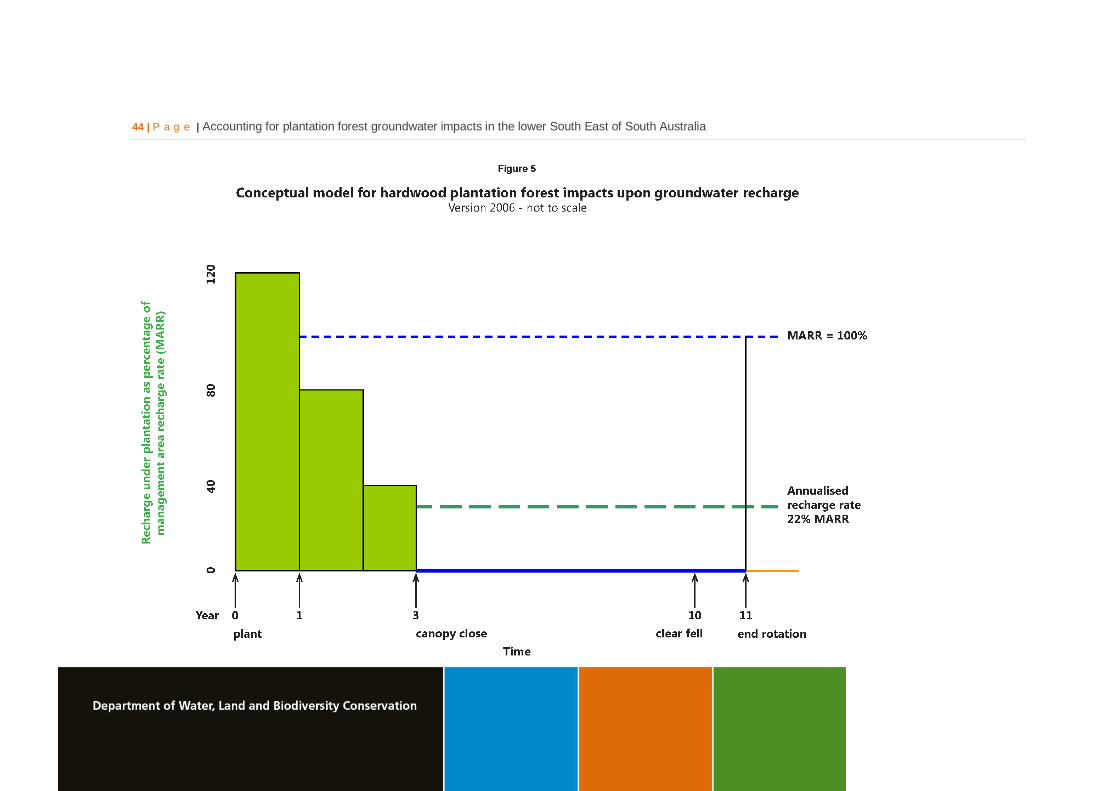
44 | P a g e | Accounting for plantation forest groundwater impacts in the lower South East of South Australia

45 | P a g e | Accounting for plantation forest groundwater impacts in the lower South East of South Australia
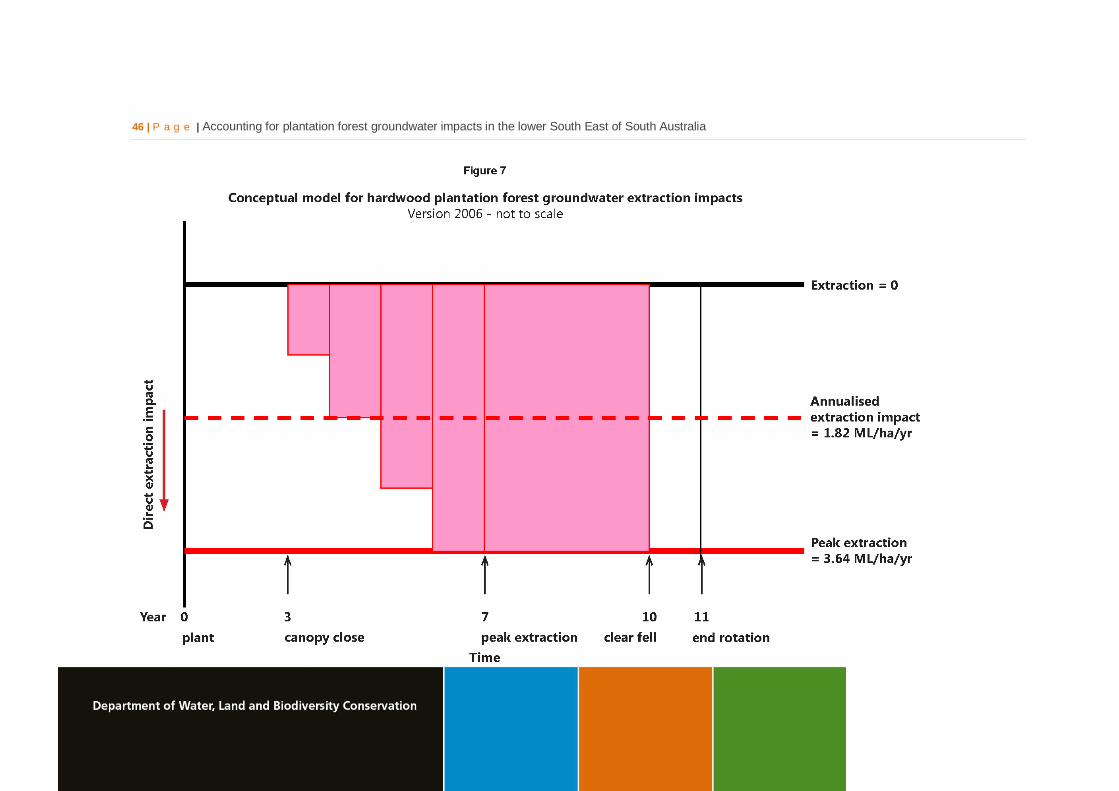
46 | P a g e | Accounting for plantation forest groundwater impacts in the lower South East of South Australia

47 | P a g e | Accounting for plantation forest groundwater impacts in the lower South East of South Australia
48 | P a g e | Accounting for plantation forest groundwater impacts in the lower South East of South Australia
GLOSSARY
Accounted, accounting or accountable — means the process of recording the impact of the
plantation forest in the water budget for a management area, or catchment. It does not intend to
imply any assignment of responsibility
Act (the) — in this document, refers to the Natural Resources Management (SA) Act 2004, which
supercedes the Water Resources (SA) Act 1997
Catchment — that area of land determined by topographic features within which rainfall will
contribute to run-off at a particular point
Catchment Water Management Board — statutory body established under the Act whose prime
function is to implement a catchment water management plan for its area
Commercial forest — the term used in development plans (under the Development Act 1993) for
commercial or industrial scale plantation forest land-use. Some members of the plantation forest
industry prefer the term ‘industrial scale’. Also refer Plantation forest
Coppicing — the term applied to allowing another eucalyptus plantation tree crop to establish after
the clear felling of the original plantation forest. Regrowth occurs from the cut stump of the clear
felled trees. While coppicing obviates the need to replant new seedlings, it requires a change to
forest management practices due to the numerous new shoots (and potential stems) from the parent
stump. There are differing views about the cost effectiveness of the aggregate plantation outcomes,
but it is an accepted alternative management strategy to single harvest plantings.
CSIRO — Commonwealth Scientific and Industrial Research Organisation
CWMB — Catchment Water Management Board
DWLBC — Department of Water, Land and Biodiversity Conservation (Government of South
Australia)
Evapotranspiration — the total loss of water as a result of transpiration from plants and
evaporation from land, and surface water bodies
Groundwater — water occurring naturally below ground level or water pumped, diverted and
released into a well for storage underground; see also ‘underground water’
Groundwater management area — a zone described in a water allocation plan for a prescribed
wells area in the South East. Many are the cadastral Hundred
49 | P a g e | Accounting for plantation forest groundwater impacts in the lower South East of South Australia
Hardwood plantation forest — for the purpose of South East management, this term refers to
Tasmanian blue gum (Eucalyptus globulus) plantations grown expressly for wood chip production.
South East stakeholders consider this forest type has a planting to harvest period of ten years and
second rotation plantations are established with new seedling stock. It is noted that the life cycle
can be up to 12 years, but ten years is a weighted mean value recommended by the plantation
industry in 2006
Hydrogeology — the study of groundwater, which includes its occurrence, recharge and discharge
processes, and the properties of aquifers; see also ‘hydrology’
Hydrology — the study of the characteristics, occurrence, movement and utilisation of water on and
below the earth’s surface and within its atmosphere; see also ‘hydrogeology’
Impact — a change in the chemical, physical, or biological quality or condition of a water body
caused by external sources
Interception — term used in the Intergovernmental Agreement on a National Water Initiative (NWI),
paragraphs 55-57. This is interpreted as meaning any interruption to the natural water cycle,
resulting in a diversion of natural water movement, or a reduction in the consumptive pool by a
particular activity. In this document the use of the term interception refers to the impact of plantation
forest in:
reducing surface water catchment yield
reducing groundwater recharge, and
extraction of groundwater from shallow water tables
Land capability — the ability of the land to accept a type and intensity of use without sustaining
long-term damage
Licence system — would record plantation forest impacts as offsets through the water allocation
system. Under a licensed allocation system a transferable property right is assigned to the
plantation owner/manager/landowner for the deemed impact on the water resource
Model — a conceptual or mathematical means of understanding elements of the real world that
allows for predictions of outcomes given certain conditions. Examples include estimating storm run-
off, assessing the impacts of dams or predicting ecological response to environmental change
Natural recharge — the infiltration of water into an aquifer from the surface (rainfall, streamflow,
irrigation etc). See also recharge area, artificial recharge
Plantation forest — for the purpose of this document, the term is used to describe a commercial
plantation forest activity carried out at an industrial scale by companies, or private individuals,
50 | P a g e | Accounting for plantation forest groundwater impacts in the lower South East of South Australia
recognised as commercial forest operators. It excludes small-scale commercial forest integrated
into a farming operation
Plantation forest area — for management purposes, the area of plantation forest considered to be
relevant for water resource management is the area of the plantation compartment. It is based on
the ‘stump to stump’ measurement of the outer boundary. It may include minor access tracks, but
excludes firebreaks and easements for electricity transmission lines and protective buffers around
native vegetation and wetlands. It is the area that a forest owner/manager reports for fire
information surveys and considers to be the productive forest area
Prescribed water resource — a water resource declared by the Governor to be prescribed under
the Act, and includes underground water to which access is obtained by prescribed wells.
Prescription of a water resource requires that future management of the resource be regulated via a
licensing system
Property right — a right of ownership or some other right to property, whether real property or
personal property
PWA — Prescribed Wells Area
Recharge area — the area of land from which water from the surface (rainfall, streamflow, irrigation,
etc.) infiltrates into an aquifer
Significant (or significance) — term used in the NWI (paragraphs 55-57) When the aggregated
impact of plantation forests represents a noteworthy portion of the total water budget in the relevant
water allocation plan and has considerable impact, the impacts are considered significant
Silviculture — dealing with the development and care of forests
Softwood plantation forest — for the purpose of South East water resource management, this
description refers to pine plantations (mostly Pinus radiata) grown mainly for sawlog production.
South East stakeholders consider this forest type has a planting to harvest period of 35 years, with
four plantation thinning operations prior to clear felling. The life cycle is generally between 25 and
50 years, but 35 years is a weighted mean value recommended by the plantation industry in 2006
Surface water — (a) water flowing over land (except in a watercourse), (i) after having fallen as rain
or hail or having precipitated in any another manner, (ii) or after rising to the surface naturally from
underground; (b) water of the kind referred to in paragraph (a) that has been collected in a dam or
reservoir
Sustainability — the ability of an ecosystem to maintain ecological processes and functions,
biological diversity, and productivity over time
51 | P a g e | Accounting for plantation forest groundwater impacts in the lower South East of South Australia
Tertiary aquifer — a term used to describe a water-bearing rock formation deposited in the Tertiary
geological period (1–70 million years ago)
Threshold area — a term used in the NWI. 39 It is the sum of the existing plantation forest estate
plus any allowance for plantation expansion for which the impact on groundwater recharge has been
accounted for within the water budget
In the case of the lower South East, threshold tables were developed by summing the forest estate,
as at 2002, and approximately 59 000 ha of expansion potential. Within the threshold area, the
impacts of the plantation forest on groundwater recharge are fully accounted for within the relevant
groundwater management areas
It should be noted that no allowance has been made for the impacts of direct extraction of
groundwater by plantation forest within water budget of the threshold areas that were developed on
2002 data and implemented in 2004
Transmissivity — a parameter indicating the ease of groundwater flow through a metre width of
aquifer section (taken perpendicular to the direction of flow), measured in m2/d
Water affecting activities — Activities referred to in Part 4, Division 1, s. 9 of the Act
Water allocation — (1) In respect of a water licence means the quantity of water that the licensee is
entitled to take and use pursuant to the licence. (2) In respect of water taken pursuant to an
authorisation under s.11 means the maximum quantity of water that can be taken and used
pursuant to the authorisation
39 NWI paragraph 57
52 | P a g e | Accounting for plantation forest groundwater impacts in the lower South East of South Australia
REFERENCES
Benyon, R and T Doody: Water use by Tree Plantations in South East South Australia,
September 2004, CSIRO Report 148
Benyon Richard G, S Theiveyanathan and Tanya M. Doody: Impacts of tree plantations on
groundwater in south-eastern Australia. Australian Journal of Botany, 2006, 54, 181-192
Brown KG, Harrington GA and Lawson J: Review of groundwater resource condition and
management principles for the Tertiary Limestone Aquifer in the South East of South
Australia. DWLBC 2006/02
Intergovernmental Agreement on a National Water Initiative (NWI) signed by Australian
Government and State Governments on 26 June 2004
Latchem B, R Carruthers, G Harrington and D Harvey: A New Understanding on the Level of
Development of Groundwater Resources in the South East. DWLBC 2007/11
Zhang L, Dawes WR, and Walker GR: The response of mean annual evapotranspiration to
vegetation changes at catchment scale, 2001, Water Resources Research 37, 701-708
Zhang L, Vertessy R, Walker G, Gilfedder M and Hairsine P. (2007): Afforestation in a
catchment context: understanding the impacts on water yield and salinity . Industry report
1/07, eWater CRC, Melbourne, Australia, page 26


