
A STRUCTURAL STUDY OF THE
CAPSULAR ANTIGENS OF ESCHERICHIA COLI K36
AND KLEBSIELLA K68
THESIS
Submitted in Fulfilment of the
Requirements for the Degree of
MASTER OF SCIENCE
of RHODES UNIVERSITY
by
SHAWN MARK ROSS STANLEY
SEPTEMBER 1986

ACKNOWLEDGEMENTS
The author wishes to express his sincere gratitude to Professor
H.Parolis, for his invaluable advice, unending encouragement and dedi
cated supervision throughout this study.
The author also expresses grateful appreciation to:
Dr. L.A.S.Parolis for help and advice during the time the research was
being carried out;
Mr D.Morley for valuable technical assistance;
Miss J.V.Humphrey for time spent proof reading this manuscript;
Mr A.N.Anderson for help in culturing the E.coli K36 bacteria and
extracting the capsular polysaccharide;
the C.S.I.R., Pretoria, for financial support and the use of their
n.m.r. facilities;
Rhodes University for financial support;
the mass spectrometry unit of the University of Cape Town for the use
of their m.s.

i i
TABLE OF CONTENTS
PAGE
1 INTRODUCTION: THE ANATOMY OF THE BACTERIAL CELL SURFACE . ... 1
2 CHEMISTRY AND SEROLOGY OF THE ESCHERICHIA COLI •. . •.... . ..... 4
3 STRUCTURAL ELUCIDATION OF BACTERIAL POLYSACCHARIDES
A CHEMICALLY BASED ANALYTICAL PROCEDURES
i) INTRODUCTION ........ . .. ..... .. . .. . .....•....... . .... 8
ii) COMPOSITION AND MOLECULAR SIZE . ...• •.... •.. . .. ...• . 9
(a) COMPOSITION ANALYSIS .. .. ..... . ................ 9
(b) MOLECULAR SIZE DETERMINATION . . . .... •. ... . . . .. . 16
iii) CONFIGURATIONAL ANALYSIS OF MONOSACCHARIDES . ...... 18
iv) LINKAGE PATTERN •. ... ... .• .... .. . . .. ..• .. .•.. .. •.. . . 20
(a) METHYLATION ANALYSIS .... .. . . . .... ..• . .•... . ... 20
(b) PERIODATE/LEAD TETRAACETATE OXIDATION OF THE POLYSACCHARIDE . . ..• . .. . . . ....... .•. ... . •. . . ... 23
v) MONOSACCHARIDE SEQUENCING •... . .......•... . .. .. . .. .. . 25
(a) PARTIAL ACID HYDROLYSIS . .. .. . . .. ... ... .. .•. • .. 25
(b) ENZYMIC HYDROLYSIS . •.... • .. . . •. .... • ....... . .. 28
B INSTRUMENTAL ANALYTICAL TECHNIQUES
i) INTRODUCTION . . . . . . . .. . ... . . •..... . ... . ... • . . ..• •... . 33
ii) GAS-LIQUID CHROMATOGRAPHY AND G. L. C. -M.S •. . ...•.• . . 35
iii) NUCLEAR MAGNETIC RESO NANCE SPECTROSCOPY OF CARBOHYDRATES ... ... . ... . . . .••......• . .••. .. .•. . •.. 40
(a) INTRODUCTION .... .•. ... •... .. .... . ... •. •• . .•. . 40
(b) PROTON MAGNETIC RESONANCE SPECTROSCOPY .. . . . . . 43
(e) NUCLEI OTHER THAN PROTONS AS NUCLEAR PROBES .. 47
(d) TWO DIMENSIONAL NUCLEAR MAG NETIC RESONANCE SPECTROSCOPY • . .....•... • . ... ... . . • . . ... .. •... 49
(e) CONCLUSION .. . . ...... . . . .•.... . •...... .. ...•.. 51
iii
4 THE STRUCTURAL ELUCIDATION OF THE E.COLI K36 CAPSULAR ANTIGEN
i) ABSTRACT ........... . ............................ .. .. 52
ii) INTRODUCTION .•.••.•.••.••.•..•••.••.•.••••.•••.•.•. 52
iii) RESULTS AND DISCUSSION .•.•••.....••.•.•••........• 53
iv) CONCLUSION .•.. .. .....•••••••••.• • ••• • ••. ••• ••••••• • 58
v) PLOTTED AND TABULATED DATA .... ••.. .•...•...•........ 60
vi) EXPERIMENTAL •• ••.••.•••• . •.•...••... • .......•.....• 76
5 THE PREPARATION AND N.M.R. STUDY OF THE REPEATING UNIT OF KLEBSIELLA K68 POLYSACCHARIDE
i) ABSTRACT .................•.......................... 79
ii) INTRODUCTION .••••••••.••••••••••••••••••••••••••••• 79
iii) RESULTS AND DISCUSSION ••••••• ••• .•••••••••••••••.• 80
iv) CONCLUSION .. • .••••.••••••••.•. • ••••.•••••••••••••• • 85
v) PLOTTED AND TABULATED DATA ....•.•••• •• •••••••••• •••• 86
vi) EXPERIMENTAL ••• •••••.• ••. ...• ••.••••••• .••.•.• •• .•• 94
6 STRUCTURES AND COMPONENTS OF THE E.COLI CAPSULAR ANTIGENS REPORTED IN THE LITERATURE
A PUBLISHED E.COLI K ANTIGEN STRUCTURES •••••.•••••••••.••• 98
B COMPONENTS OF THE E.COLI CAPSULAR (polysaccharide) ANTIGENS ... .. .............•.•.... .... ....... ... ... .•.... 102
7 ANNEXURE 1
A NUCLEAR MAGNETIC RESONANCE SPECTRA .••••••.••••••••••••••• 103
8 ANNEXURE 2
A MEDIA ................•........•.....•..........•..•..•... 104
9 REFERENCES ........... .. . •... .. .................•............ 106

1 INTRODUCTION: THE ANATOMY OF THE BACTERIAL CELL SURFACE

I
1 THE ANATOMY OF THE BACTERIAL CELL SURFACE
Bacterial cells all have a cytoplasmic membrane (see Figure 1)
which regulates the movement of ions and molecules into and out of the
bacterium. Enclosing this membrane is a cell wall of which there are
~ ---- ....... ......--- ....... , ./ , , / ,
\ I \ I \ I \
Cytoplasm I Plasma membrane Cytoplosm
(phOSphOhpid blloyer, Pfotelns) I \ Cell wall (peptidoglycan, \
Pla smo membrane (phospholipid bilayer, proteins) Peptidog lycan
\ I , /
"- ./ ,
" ~ - - -Gram - Pos itive Cell
polysaccharides, relchoic ocids) \
"-Capsule (when present) "-
/ (po lysacchar ide) .<,
" ---Gram - Negal lve Celt
. ( 01 ) FIgure 1.THE BACTERIAL CELL.
I Outer membrane ( li poprotein, lipopolys acCharide)
Capsule (when present) (polysacChar ide)
two general types, which are differentiated by the Gram stain(02) as
being either gram positive or gram negative (depending upon whether
they hold the gram stain after washing with ethanol). The cell wall
provides the cell with shape and rigidity and is composed, in the case
of gram positive types, of peptidoglycan, and in the case of gram
negative bacteria, of a peptidoglycan and an outer membrane (see
Figure 2). The peptidoglycan layer, common to both cell wall types,
consists of a backbone of alternating units of N-acetylglucosamine
and N-acetylmuramic acid to which peptides are attached by amide

-2-
links. This heteropolymer is a highly cross linked mosaic and this
Capsule
Peptidoglycan
~ Capsule I ., '0
;;:;;;;:':' '::':~~' uter Membrane
~ Peptidoglycan
Cytoplasmic membrane
GRAM POSITIVE GRAM NEGATIVE
Figure 2.DIAGRAMATIC REPRESENTATION OF THE CELL SURFACE OF GRAM
POSITIVE AND GRAM NEGATIVE BACTERIAL CELLS . (03)
gives it strength and rigidity. In gram positive bacteria, this layer
also contains two carbohydr ate antigens, a simple polysaccharide and a
teichoic acid; these are usually the type specific or major group
antigens of the bacterium.
Many of the bacteria also produce exopolysaccharides (see Figure
3) either as discrete capsules (for example, the Enterobacteriaceae
K antigens) or unattached slime layers (for example, the Enterobac-
teriaceae M antigens). The vast majority of these polysaccharides are
heteroglycans(03) composed of contiguous oligosaccharide repeating
units. Their monosaccharide components are largely neutral hexoses,
6-deoxy hexoses and also amino sugars. (03) Pentose units are
rare. (03) The capsular polysaccharides usually have a high content of

-3-
acidic constituents such as uronic acids, phosphate groups, or pyru
vate ketals. (01)
bacterium -----I--.c:---...., +-__ slime
capsule
Figure 3. DIAGRAMATIC REPRESENTATION OF THE EXOPOLYSACCHARIDES
SURROUNDING THE BACTERIAL CELL. (03)

2 CHEMISTRY AND SEROLOGY OF THE E.COLI

-4-
2 CHEMISTRY AND SEROLOGY OF THE ESCHERICHIA COLI
Escherichia coli fall within the family Enterobacteriaceae and are
a group of mostly motile saprophytic gram negative bacilli. (04) They
are also the predominant constituent of the colonic flora, where they
are important for intraintestinal physiological functions; colonisation
occurs shortly after birth. Generally they remain safely confined to
the intestinal lumen, however, should the host be debilitated, immuno
suppressed or have critical anatomical barriers disrupted, E.coli can
become pathogenic. (04) Some of the E.coli strains, because of their
ability to overcome the host's defence mechanism in a healthy indivi
dual, are inherently pathogenic; such strains are mainly implicated in
three disease states, namely, urinary tract infections, neonatal menin
gitis, and diarrhoeal disease. (04)
Kauffmann subdivided the E.coli into a number of O-groups and as
such was the first person to successfully classify the E.coli by sero
logical methods. (05) In conjunction with Vahlne, he also classifed the
envelope or capsule (K) antigen; when present these mask the O-somatic
antigen. The criterion for the presence of the K antigen was the
inagglutinability of a non-heated bacterial culture in
O-antiserum. (05) Three different types of K antigen were described
and designated A,B, and L. This classical division has been reviewed
by 0rskov et al (05) who recommended that it be discontinued because of
the difficulties associated with it; they suggested that the nomencla
ture of K antigens be restricted to polysaccharides (acidic) and

-5-
protein (fimbrial) K antigens only. (05) At present the E.coli are
serotyped, not only on the basis of the lipopolysaccharide O-somatic
antigen and the capsular K antigen, but also by the flagella, or so
called H antigen . Thus, they are categorised into O:H:K serotypes.
The O-somatic antigen, a lipopolysaccharide (LPS) surface antigen
that is thermostable, is found in all smooth (S) Enterobacteriaceae.
Mutants without the O-specific polysaccharide (see Figure 4), known
as the rough (R form), can arise spontaneously from the S forms. (05)
. IO-speeific polysaccharideloleore oligosaccharideloiLipid AI
. . (05) F 1gure 4. General structure of the bacter1al LPS.
The chemical basis for the specificity of the O-antigen of gram nega-
tive bacteria arises from the structure of the O-specific poly-
saccharide. At present, 164 structurally different 0 antigens have
been identified and, with the exception of the mannans of DB and
09, (06) they are heteropolysaccharides. (05)
The K antigens, with the exception of KBB and K99 which are pro-
teins, are all thought to be polysaccharides. These capsules or K
antigens, if present, can easily be detected by immunoelectrophoresis.
This is a more reliable method for detection than the inagglutination

-6-
reaction in O-antisera. It was previously t hought that over one
hundred of the K antigens ex i sted, however, further study has shown
some strains have no surface antigen other than the O-antigen, while
others share the same K antigen. At present seventy four different K
antigens have been identified. (05) 0rskov et al noted that the poly
saccharide K antigens associated with 08, 09, 0101 and probably 020
differ from those found in association with all other O-antigen
combinations. (05) The K antigens of this group can be subdivided
into those having polysaccharides with or without amino sugars. Those
devo i d of the am i no sugars have mo l ecular weights in the range 3 x
105 to 106, are physically heterogeneous, but can be rendered homoge
neous by treatment with dilute alkali. (05) They have a strong simi
larity to the K antigens of Klebsiella. Polysaccharides with amino
sugars are homogeneous with a Mw between 105 and 3 x 10⁵• (05)
Certain conditions, such as low temperatures and a high osmotic
pressure, cause many of the Enterobacteriaceae to produce a non-
specific s l ime antigen; this is loosely assoc iated with the cell sur-
face and is distinct from the K antigens. This ubiquitous slime
capsule, commonly termed the M-antigen, is represented by a group of
five acidic polysaccharides all very similar in structure.(05)
o cn, y' /
D-Cal. C
jl ,/, J 0 R
• D-CA
J 1~ D-Cal
, J 1: I' I 3 I _ I,-P'uo--+ L- Yuc __ 0-0_
J l' J 2 or J
A.
Figure 5 . THE STRUCTURE OF THE M ANTIGEN. (05)

-7-
At present, approximately a third of the known K antigens have been
structurally elucidated and reported in the literature (see Section
6). Gl ucuronic acid, galactose, glucose, KDO, galacturonic acid and
mannose commonly occur as components of the repeating unit. Although
the size of the repeat unit can vary from two to six monosaccharides,
many of the units are disaccharides.
those from K2(07), K12(08), K52(09),
Several of the structures, viz.
and Kl00(l19) also have phosphate
units attached. In many respects, some of the polysaccharides from
the E.coli do not differ greatly from the bacterial polysaccharides
found in other species of bacteria; for example, the Klebsiella.

3 STRUCTURAL ELUCIDATION OF BACTERIAL POLYSACCHARIDES

-8-
3 STRUCTURAL ELUCIDATION OF BACTERIAL POLYSACCHARIDES
A CHEMICALLY BASED ANALYTICAL PROCEDURES
i) INTRODUCTION
Chemical procedures, either alone or in combination with instru
mental techniques, are the mainstay of bacterial polysaccharide pri
mary structure elucidation. The procedures employed should define
the total monosaccharide composition, abso l ute configuration of the
sugars, inter-monosaccharide covalent bonds, molecular size, and the
glycosyl sequence. Unfortunately, chemical procedures in general are
destructive and, especially in cases where the amount of poly
saccharide is limited, this tends to be a drawback . To a certain
extent this has been overcome by using smaller samples (i.e. in the
milligram range) as the analytical procedures have become more sen
sitive, and in some cases, a single milligram may be sufficient for all
the chemical analyses that have to be performed on th~ polysaccharide.
A detailed discussion of all the chemical techniques available
for polysaccharide structural elucidation is not within the scope of
this review. Only those techniques that are widely used (for
example, partial acid hydrolysis for glycosyl sequencing) and those
techniques which have been used in the experimental part of this the
sis will be mentioned.

-9-
ii) COMPOSITION AND MOLECULAR SIZE
Monosaccharide composition and molecular weight, which give the
size of the repeat unit and the number of repeat units per chain
respectively, are both required for the overall characterization of
the bacterial polysaccharide under study. While the uniform nature of
the repeat unit allows the composition to be quoted (within limits) as
an exact value, the same is not true of the molecular weight deter
mination; this value, because the polysaccharides consist of chains of
varying length, is usually quoted as an average. (10)
(a) Composition analysis
The identification of sugar components, as well as their quan
tification, gives essential information on the primary structure of
the polysaccharide. Composition analysis is predominantly by chemical
means, although certain instrumental methods are also used in the ana
lysis of carbohydrates, such as nuclear magnetic resonance and infra
red spectroscopy. Often these prove to be useful adjuncts to the che
mical methods as a number of acid labile constituents can be readily
identified by these techniques, helping to devise a suitable, chemi
cally based, analytical procedure. (10)
In order to determine the sugar ratio of the polysaccharide, the
glycosidic linkages between the component monosaccharides must be
cleaved. A number of methods have been described for achieving this,
inc l uding: hydrolysis, acetolysis, methanolysis, and

-10-
mercaptolysis. (10) The method and specific reaction conditions
needed to cleave the polymer vary according to the monosaccharide
composition, configuration of the glycosidic linkages, and the ring
form of the component sugars. To obtain maximum depolymerisation and
minimum degradation, the following factors are taken into account:
furanosidic are more labile than pyranosidic linkages and beta linka
ges are generally more stable than alpha. In addition, the presence of
either a hexuronic acid or an amino sugar stabilises a linkage to acid
hydrolysis. (11)
Degradation of ' labile sugars can be overcome by the protecting
the anomeric hydroxyl group as soon as the glycosidic linkages are
broken; e.g. methanolysis of sialic acids. Chemical modification of
the polysaccharide prior to acid hydrolysis can also increase the
yield of the free sugar; for example, milder conditions are needed to
cleave the linkages after conversion of a glycosyl uronic acid or an
amino sugar to the parent sugar. The modification of the hexuronic
acid to the neutral hexose can be achieved by treatment with water
soluble carbodiimide and sodium borohydride, or with lithium aluminium
hydride in tetrahydrofuran (THF). (10) An additional benefit of this is
that the uronic acid can then be estimated by gas liquid chroma
tography (g.l.c.); uronic acids, due to their low volatility, even
after conversion to alditol acetates or peracetylated aldononitri-
les (PAANs), can not be analysed directly by g.l.c. techniques .
Methods for complete acid hydrolysis have been described(11,12)

-11-
using mineral (especially sulfuric, nitric, and hydrochloric acids),
formic, acetic, and trifluoroacetic acids (TFA). TFA is recommended
for use, because (a) the yields are at least equal to those from hydo
lysis with a mineral acid, and (b) it may be readily removed by
evaporation. (12) Glycoside cleavage with Hel in dry methanol, metha-
nolysis, is al so recommended as the sugars are released as their
methyl-glycosides, thereby minimising the possibilities of side
reactions. (13,14) Formic acid is recommended as it has the advantage
of being able to solubilise l ess hydrophilic polymers that are not
fully solub l e in the other acids available.
Analytical methods for the hydrolysate fall into two broad
categories; those based on liquid chromatographic separation:
high performance liquid chromatography (h.p.l.c.), thin layer chroma
tography (t. l.c.), paper chromatography and exchange chromatography
where the analysis is usually of the reducing sugars themselves; and
those employing g.l.c. of suitable derivatives. Analysis may also be
done spectrophotometrically where the sugars are reacted with specific
reagents to give various coloured products. Aspinall (10) has listed
the commonly used colorimetric methods.
In this laboratory, preliminary sugar identification is
carried out by paper chromatography of the hydrolysate. This method
can separate and identify components of the hydrolysate quickly,
simply, and accurately with the expenditure of less than a milligram
of material;(15) also a high degree of sample purity is not a prere
quisite. The paper chromatograms are run in several different so l vent

-12-
developers and then visualisation, using selective colour reagents,
allows sugars to be identified on the basis of their position on the
chromatogram relative to that of a standard run concurrently with the
sample. The standard consist either of glucose, in which case the
sugars are identified relative to glucose (R gl )09), or of all the
commonly occurring sugars, where the identification is by finding the
corresponding sugar in the standard. Churms lists a value, relative
to glucose and 2,3,4,6-tetra-O-methyl-glucose, for all of the commonly
encoun~ered sugars when run in several developers.(16)
There are four distinct types of colour reagents used which take
advantage of one of the fol l owing: (a) the reducing power of the
sugars, (b) the action of acids upon the sugar to produce furfural
derivatives which give coloured products after treatment with aromatic
amines and phenols, (c) the cleavage reactions of periodate and lead
tetra-acetate followed by tests for fragments, and (d) reactants spe
cific for structural features. (25) In this laboratory, we commonly use
three detection reagents, namely:
(i) akaline silver ni t rate-
sodium thiosulphate, specifically for reducing sugars, (17)
(ii) periodate-benzidine
reagent, which can be used for both non-reducing and reducing
sugars, (8) and
(iii) ~-anisidine reagent,
which differentiates between hexoses and pentoses. (9)
The solvent developers used to separate the hydrolysate are

-13-
selected depending upon the nature of the substance being analysed.
Solvent combinations commonly used in our laboratory are:
1. 8 :2
2. 18 : 3
3. 5 : 5 :1
4. 40
5. 1 :2
KEY: EthAc*Ethyl acetate Pyr *Pyridine HAc *Acetic acid I-But*I-Butanol FormA*Formic acid EtOH *Ethanol
ommon use :
:1 monomers
:1 :4 momomers
:3 uronic and amino monomers/oligomer
:11 :9 monomers
:1 oligomers
p
basic
acidic
slightly
neutral
ac i d i c
The solvent mixture is chosen on the basis of suitability for
basic
the separation being carried out, reactivity towards the sample, and
its stability as a mixture. (15) The solvent developers have a number
of disadvantages; they are highly volatile and, thus, liable
to changes in the solvent ratio; they are sensitive to temperature
change; ethyl acetate has a tendency to undergo hydrolysis; and the
composition of the mixture may be altered as a result of esterifica-
tion (if the mixture contains an acid). In addition, if pyridine is
present, any heat applied in the removal of the solvent may cause epi
merisation of the sugars. (15)
There are a number of methods for quantitati ve estimation of
sugars from the hydrolysate using paper chromatography, the most
accurate of these involve dissection of the paper chromatogram after

-14-
developing in the solvent, extraction of the monomers from each sec
tion, followed by microanalysis of the extract. (15) In this laboratory
the use of paper chromatography to determine the total sugar ratio has
been superceded by g.l.c. analysis of derivatised sugars from the
hydrolysate.
Gas-liquid chromatographic methods of carbohydrate analysis are
restricted to material that is volatile, stable to the operating con
ditions of the instrument, and does not bind irreversibly to the chro
matographic column. It is necessary, as a result of their low
volatility, that the free reducing sugars released by glycosidic
cleavage be derivatised. Some of the derivatives of neutral sugars
used for g.l.c., e.g. trimethylsilyl, acetyl and trifluoroacetyl, tri
methylsilylated and acetylated methyl-glycosides, give rise to
multiple peaks for each sugar, producing complex chromatograms which
make quantitative analysis difficult. (20) The peracetylated aldono
nitrile acetates (PAAN) and trimethylsilylated and acetylated alditol
acetates, which give single peaks as well as having good chroma
tographic properties are, as a result, the derivatives of choice. (20)
Preparation of PAANs from the free sugars is done, by us, using
the method described by McGinnis(21) which utilises N-methylimidazole
as both solvent and catalyst; this derivatisation has also been found,
by others, to be both simple and rapid. (22) The alditol acetates are
not used to derivatise xylose, owing to the symmetry of xylitol, or
arabinose and lyxose as they yield the same alditol acetate. (20)
The method for producing alditol acetates that we use is essentially

-15-
that reported by Sloneker; (23) however, Blakeney et al (24) have
developed this method further, so that the need to transfer or eva
porate the material during derivatisation is avoided. The latter
method should thus give better percentage yields of the alditol aceta
tes .

-16-
(b) Molecular size determination
A wide variety of methods are available for determ i ning the
macromolecular size of polysaccharides and the most useful of these
give either number average values Mn, weight average values Mw' or the
relative molecular weight Mr' (10) The Mn is the arithmetic mean weight
of molecules, and is given by meth ods that count the number of par-
ticles in solution, while Mw is an average of the weight fractions;
consequently the result depends on the method used. (26) In addition,
the difference between these two values gives an indication of the
polyd i spersity of the sample. (27) Lastly, the Mr is a va l ue relative
to some standard (for example, dextrans of known weight) and is used
when the determination is via a secondary method, i.e. the weight is
not determined directly .
Of the methods available, we find gel filtration, a simple proce-
dure employing commonly available apparatus, to be the most applicable
to our polysaccharides. This method, in order to separate molecu l es
of differing size, relies upon the ab i l i ty of some molecu l es to enter
pores in the gel, which hold the stationary phase, more readily than
other molecules. (28) Very large molecules never enter the stationary
phase and, thus, move direct ly through the chromatographic bed, while
smaller ones, which can enter the pores and consequently spend a por-
tion of time there, move more slowly. Molecules are, therefore,
eluted in order of decreasing molecular size . (28) A linear rela-
tionship exists between Ve- the elution volume- and the log molecular

-17-
weight of the solute eluted and it is on this relationship that the
molecular weight is determined. (28)
A drawback of this method is that it is a secondary technique
and, therefore, needs calibration with structurally related compounds
of known molecular weight. The first step , thus, in determ i ning the
Mr of a sample is to plot the calibration curve for the column
(V e against log molecular weight). This requires establishing Ve for
the standard, which is taken as the volume at which its peak con
centration elutes. This can be ascertained colorimetrica l ly after
treatment of the eluate with pheno l -sulphuric(29) reagent. The next
step is to determine Ve for the sample by the same procedure. The
molecular weight can then be determined graphically from the calibra
tion curve. Finally, the elution profile and thus the molecular
weight distribution, is plotted.
The eluants used in gel filtration are aqueous solutions of weak
acids, weak bases, or electrolytes. These are used in preference to
distilled water because of their ability to retard adsorption or acce
leration of charged solutes as a result of interactions with the
gel. (29)
There are several limitations to this method, the most impor tant
of these being that the polysaccharides take up different conformations
in solution and this can affect the partitioning between the pores and
mobile phase, distorting results. (30)

-18-
iii) CONFIGURATIONAL ANALYSIS OF MONOSACCHARIDES
Monosaccharides consist of a number of contiguous assymetric
centers and to assign the absolute configuration the full stereoche
mistry must be specified; for example, B-D-Glucose specifies the con
figuration at all the centers. Once the sugar has been identified
and, therefore, the assignment of the stereochemistry at most of the
centers specified, only the OIL and ~ and B configurations remain
unassigned. Commonly, resolution of the anomeric linkages as either ~
or B is, in most cases, by n.m.r. spectroscopy, where a signal down-
field of 5 ppm is assigned as a and those upfield of 5 ppm are
assigned as B. In general, the procedures used to assign the abso
lute configuration of the component sugars involve either, polari-
metry, specific enzymes or, more recently, g.l.c. analysis of
stereospecific monosaccharide derivatives.
Of these, the usual method of assigning either the D or the L
configuration to a specific sugar in our laboratory was by the
measurement of the specific optical rotation of the sugars, but, this
technique has several drawbacks. These include: (a) it requires a
substantial amount of material; (b) the sugars have to be separated
after hydrolysis (c) the sample must be highly purified; and (d) the
specific rotation varies with temperature and solvent used. (31) For
these reasons, we use g.l.c. as an alternative method to polarimetry
when assigning the D or L configuration to the component mono
saccharides of a polymer.
-19-
Gas-liquid chromatography can be used to differentiate enan
tiomers either by the application of an achiral stationary phase, or
the conversion of the enantiomers into diasteriomers with a chira l
reagent and subsequent separation on a non-chiral phase. (32) We have
chosen the latter alternative since it was the most convenient,(an OV-
225 column can be used as the non chiral phase; this was also used to
separate alditol acetates and aldononitri le s). Chiral reagents that
are recommended in the literature for producing diasteriomers from
sugar enantiomers include: (-)-2-butanol, (32) (+)-1-phenyl etha
nethi ol, (33) and (+)-2-octanol; (34) of these we elected to use octa-
nol and separate the diastereomers on an OV-225 column. This method
has successfully assigned configurations of sugars in a hydrolysate
containing three different sugars (described in this thesis). Uronic
acids require conversion to the neutra l parent sugar prior to reaction
with the chiral reagent if they too are to be detected during g.l.c.
analysis. This method does not seem to be appl icable to some amino
sugars; (35) in these cases specific enzymes for the 0 or L con
figuration of the amino sugar are combined with paper chromatographic
analysis to determine if the sugar is enzymatical ly degraded by either
the enzyme specific for the 0 or the L configuration.

-20-
iv) LINKAGE PATTERN
After identification and quantification of the individual mono-
saccharide components, as well as assignment of their absolute con-
figuration, the linkage pattern has to be determined. Most frequently
this is effected by chemical procedures, e.g. methylation, although it
is possible that in the future, physical methods, e.g. double quantum
coherence n.m.r. spectroscopy, (36,95) may become paramount in this
fiel d. Chemical linkage pattern analyses utilise both methylation and
oxidative methods.
(a) Methylation analysis
The most common way of resolving the manner in which the sugars
are linked invo lves the conversion of all the free hydroxy groups to
methyl ethers; these O-methyl bonds are resistant to acid cleavage
and, therefore, any free hydroxyls on the sugar residue after hydroly
sis of the methylated polymer indicate a positi on of attachment. The
partially methylated monosaccharides can then be separated from each
other, usually as suitably volatile derivatives, by g.l.c. (we have
found experimentally that the alditol acetates are superior to PAANs).
Identi fication, hence, is by either g.l.c., where the retention times,
compared to a standard , are collated with reference data(37) and the
permethylated sugar identified, or g.l.c.-m.s. where identification
of the peaks is on the basis of the fragmentation pattern of the
eluting compound. (38,39) More recently, mass spectrometry alone has

-21-
been sufficient, with all the different methylated monosaccharides in
a hydrolysate being successfully identified by mass spectrometry per
se. (40) Etherification of the free hydroxyl groups, prior to the
introduction of the Hakomori method in 1964, (41) was by treatment of
the polymer with dimethyl sulphate and sodium hydroxide(42,43) or the
modified Purdie and Irvine method put forward by Kuhn, (44) which
employed silver oxide and methyl iodide in N,N-dimethylformamide.
These methods required repeated treatments of the polymer to effect
complete methylation. The Kuhn method is still used by us, primarily
for polymers that have only been partially methylated by the Hakomori
method and also for uronic acid containing polymers which are me thy-
lated by the Hakomori method, carboxyl group reduced and then remethy
lated by the Kuhn method. (This methylates the 6 position on what was
previously the uronic acid sugar). The Hakomori method by which, it
is claimed, complete methylation is ordinarily achieved in a single
step, invo l ves alkoxide formation from the free hydroxyl groups of the
polysaccharide catalysed by methylsulfinyl carbanion in dimethyl
sulphoxide (DMSO). Methylation occurs at these al koxide groups after
treatment with methyl iodide. (41)
A number of modifications to the original procedure have been
suggested, including (i) the addition of 1,1,3,3,-tetramethylurea to
restrict intra- and inter-molecular hydrogen bonding of the polymer
and, thus, lower resistance to 0-methylation;(45) (ii) the rep l acement
of sodium hydride with one of the following:butyl lithium, (46)
potassium hydride, (47) or potassium tert butoxide, (48) for the

-22-
generation of the methyl sulfinyl carbanion from DMSO (these are sup-
posed to give a more stable reagent and, therefore, chromatograms with
fewer artifacts) and (iii) the optimisation of the steps, to improve
both recovery and reduce the time required to successfully methylate
the polymer. (49) However, not all of these modifications have been
found to be successful, for example, potassium tert butoxide was
found, in a study, to be unsuitable for methylation. (49) In addition
to modifications of the Hakomori method, several alternative tech-
niques have been put forward which claim to give better methylation
results (50,51) and protect material that would be degraded under the , alkaline conditions of a Hakomori methylation. (52,53)
Methylation analysis is a valuable technique for resolving the
linkage position of the intermonosaccharide bond between the sugars,
but, in order to determine the actual monosaccharide sequence, other
methods are used.

-23-
(b) Periodate/lead tetra-acetate oxidation of polysaccharides
Treatment of the intact polymer with periodate or lead tetra
acetate is a useful supplement to methylation analysis and, in fact, at
times the techniques are used sequentially. Selective oxidation with
either of the compounds mentioned results in a 1,2 glycol scission(54)
of the 1,2 diol and 1,2,3 triol groups found in some of the sugar
residues. If a sugar is substituted in a manner that leaves no
hydroxy groups adjacent to each other, it will be resistant to oxida
tion by these compounds, for example, a 3-0-linked hexopyranosyl
residue will, thus, not be oxidised under these conditions. The
choice of oxidant, because of the difficulties in finding a suitable
solvent for both the lead tetra-acetate and the carbohydrate, is,
in most cases, restricted to periodate. (55)
Several approaches to structural elucidation using periodate
exist and the specific method used depends upon the nature of the
polysaccharide and the information to be derived. One of the proce
dures, monitoring the uptake of periodate per mo l e of repeat unit,
gives the number of susceptible linkages within the r epeat unit, while
the rate of reaction(56) and/or the end products of the reaction
gives information on the type of structure being cleaved by
oxidation. (55) Similarly, modifications of oxidation to include steps
to remove all oxidised residues (sometimes, using less periodate
than required to cleave all the oxidatively labile linkages) coupled
with recovery of the unoxidised portion of the polysaccharide, also

-24-
reveals the nature of the sample more clearly. In comparison to the
unmodified method, this procedure also furnishes information on the
monosaccharide sequence. Selective removal of the oxidised poly
saccharide is accomplished using either the Barry(S7) or Smith(S8)
method. Of the two, the latter has been found by others(S6) to be the
more satisfactory. We have also found this to be suited to our poly-
saccharides.
The quantitative nature of this reaction and the specific pro
ducts from some of the structural features, makes the selective oxida
tion of vic-dials a useful analytical tool, especially when
accompanied by methylation analysis of the unoxidised portions of the
polymer. Unfortunately, as with methylation analysis, selective oxi
dation gives little information on the monosaccharide sequence and
this must be obtained by other methods.

-25-
v) MONOSACCHARIDE SEQUENCING
Several techniques are available for determining the glycosyl
sequence in a polysaccharide, including: B-elimination of residues
attached to C-4 of glycopyranosyluronic acid residues, selective aceto
lysis, keto degradation, acid-catalysed partial hydrolysis and also
enzymic hydrolysis. (77) Most of these methods are of limited value in
monosaccharide sequencing and are used, more often, just as supplemen
tary techniques to either partial acid hydrolysis or selective enzymic
hydrolysis methods. For this reason, the discussion of the procedures
used in sequencing will only include these last two methods. Acid
catalysed partial hydrolysis, the classical method of glycosyl
sequencing, has been employed frequently and consequently there are
numerous examples where sequencing has been by this
technique; (e.g.63,70,75) however, the emphasis is changing, several
papers have been published where enzymes alone were used for
sequencing (notably those that are bacteriophage-borne
endoglycosidases). (64-69) In this thesis, the acidic capsular poly-
saccharide from E.coli K36 was sequenced using a bacteriophage-borne
endo-galactosidase.
(a) Partial acid hydrolysis
Acid hydrolysis of a polysaccharide, stopped prior to the reac
tion going to completion, gives fragments of varying molecular weight.

-26-
These oligosaccharides, which consist of two or more glycosyl residues,
can then be separated by one of the fo l low i ng procedures: gel per
meation, ion-exchange, partition, or high performance liqu i d chroma-
tography. Characterization of these fr agments after isolation
provides comp l ementary and overlapping data from which the glycosyl
sequence can be pieced together.
In heteropolysaccharides, where a number of different glycosyl
linkages exist, the glycosid i c bonds are hydrolysed at different
rates dependant upon the hydrolytic conditions and sugar residues
involved. For examp l e, during aqueous acidic hydro lysis, furanosidic
l inkages are hydro lysed 10-103 times faster than corresponding pyrano
sidic l i nkages. (40) This differential lability of the polysaccharide
glycosidic linkages is essential for the success of the experiment.
If al l the linkages have an equivalent probablity of being cleaved, the
number of different ol i gosaccharides would be large, yields low, and
separation difficult. In order to get the best yield of the desired
oligosaccharides the following are optimised:
i) the procedure, which, in most cases, entails
heating a so l ution of 0.5%, or less, of the polysaccharide in acid,
after which the acid is removed and the oligosaccharides are isolated.
There are several modifications(60,61) to this approach e.g. the
continuous removal (by dialysis) of the smaller fragments from the
acid medium, as they are formed preserves the acid labile oligo-
saccharides from degradation,
ii) the reaction conditions, for example, liquid

-27-
hydrogen fluoride used at _40 0 gives optimum yield of the larger oli
gosaccharides and at _23 0 of the smaller oligosaccharides, (63)
iii) the hydrolytic reagent- often this is an acid
in an aqueous solution, although, occasionally, non-aqueous reagents are
used if, (a) alternate splitting patterns to the aqueous solutions can be
achieved (and these are of use in sequencing the polymer) or, (b) the
sugars are less liable to be degraded under non-aqueous conditions or,
(c) the polysaccharide is insol uble in water. (10) Several of the
reagents have a specific application, for example, the glycosyl
linkage of a 2-amino-2-deoxy- residue and (1->6) linkages, both
resistant under normal hydrolytic conditions, can be easily cleaved by
acetolysis. (10)
Partial acid hydrolysis is a widely applied technique for glycosyl
sequencing, but, when dealing with polymers with acid labile com
ponents, alternative methods must be employed.
-28-
(b) Enzymic hydrolysis
Hydrolytic enzymes, in particular those which selectively cleave
glycosyl bonds, are increasingly applied in bacterial polysaccharide
structural elucidation and are, in some cases, the only method of
preparing oligosaccharides that correspond exactly to the integral
repeat unit. This is especially valid in those polysaccharides that
contain acid labile constituents, e.g. acetal (64) or pyruvate. (65)
The enzymes used, either purified isolates or those that are bac
teriophage-borne, are highly specific (they are often of the endo
series, which are specific for both linkage type and the mono
saccharide residue(73». They give controlled hydrolysis of a single
bond type in the polymer; enzymic cleavage, therefore, produces oligo
saccharides that consist of either one, or more, integral repeat
units. Of the two types of enzymes used for sequencing, bacteriophage
enzymes have found wider application and a number of structures have
been published where sequencing has been by bacteriophage depolymeri
sation . (59,62,64-69,79) For this reason, much of the discussion will
be confined to those procedures involving bacteriophages .
There are several sources of the enzymes used, as bacteria, fungi
and bacteriophages all produce enzymes that hydrolyse polysaccharides
in their host organism. Some of the glycoside hydrolyases are well
characterized and commercially available, but, in certain instances,
the required enzyme must be isolated by the researcher; this involves
either (1) enzyme induction, brought about by growing a suitable orga-

-29-
nism on a sole carbon source similar to the polysaccharide to be
cleaved and then extraction of the induced enzyme, (72) or, (2) the
isolation of a suitable bacteriophage (sewage provides a rich source
of bacteriophages). Some of the bacteriophages that interact with the
E.coli are designated K bacteriophages, this is because the K antigen,
generally the acidic polysaccharide that surrounds the bacterium, acts
as a receptor for the bacteriophage. (73) These phages carry, asso
ciated with their tail spikes, endo-glYCosidases(74) which depoly
merise the capsular polysaccharide of the host strain. We have found
the phages to be highly host specific, the majority will adsorb to and
lyse only their host strain. (71) Similarly, they will not adsorb to
acapsular mutants of the host strain, (74) thus, the polysaccharide is
essential for the phage/bacterium interaction . The specificity of the
phage for the host proves to be highly advantageous as bacteriophage
hydrolysis of the polysaccharide yields oligosaccharides that
correspond to either a single repeat unit (designated P1) or mUltiples
thereof (e . g. P2 etc.).
Incubation of polysaccharide with the homologous phage (2mg of
polysaccharide per ml of solution containing~. 1 x 10¹⁰ phage par
ticles) at 37° for several days is usual ly sufficient to hydrolyse the
polysaccharide. Thereafter, separation and purification of the bac
teriophage depolymerised polysaccharide is by chromatography. In this
laboratory, we have found paper and gel permeation chromatography
(using Biogel® P2 or P4) to be efficient methods of isolating pure
samples of P1 and P2 . Following isolation, characterization of P1

-30-
and P2 is by the same methods as those applied to the polysaccharide
and, in fact, a great deal of information is derived from comparing
and contras t ing the information from the ol igo- and poly-sacc haride.
Methylation of PI reveals, when the results are compared to those from
the native polysaccharide, (i) which sugars are the reducing and non-
reducing termini of the oligosaccharide; (ii) the position of attach-
ment of the terminal sugar when it is in the polysaccharide chain and
the sugar to which it is linked; and (iii) for trisaccharides and
branched chain tetrasaccharides, the comp lete glycosyl sequence. If,
as happened in the bacteriophage depolymerisation of E.coli K36, t he
phage enzyme cleaves at a branch point, and there are less than three
residues attached, the linkage position of the various residues can
also be resolved by methylation. Supplementary sequencing information
is provided by an n.m.r. study of the PI oligosaccharide, which ,
because it is released by the enzyme with a terminal reducing . . t· d" . 1 (78) sugar, glves rlse to "Wlnne Slgna s. There is a mutarotational
equilibrium between the CI and B orientation of the terminal sugar ano-
meric hydroxyl and two different molecules coexist. The situation is
further complicated by t he pyranose/furanose equilibrium for the ter-
minal sugar that can occur under these cond i tions, and in fact, four
different molecules may coexist in the solution. (67) The reducing
terminus is, therefore, readily identifiable as it has a signal for
both the CI and B anomers. The mutarotational effect is transmitted
along the oligosaccharide chain and those sugars in closest proximity
to the reducing sugar are the more profoundly affected, for example,

-31-
in the spectrum of PI from E.coli K36 and from Klebsiella K68 (both
included in this thesis) the signal from the 2-0- linked mannosyl
residue l inked to the terminal reducing ga l actose shows the biggest
chemical shift difference between its "twinned signals". The chemical
shift difference falls off considerably with increasing distance of
the sugar from the reducing terminus. Methylation and n.m.r. study of
PI are, therefore, complimentary techniques as any structural hypothe
sis made from the methylation results can be tested by examinat i on of
the n.m.r. spectra. Other methods are available for characterizing
PI, for example, the method of Morrison(76) identi f ies the reducing
terminus, but, these are seldom required if methylation and n.m.r.
results are unambiguous.
Enzyme applications are not limited to generating oligosacchari
des, some, usually well characterized purified enzyme iso l ates, are
used to determine whether a structural feature is present or absent in
a molecule; for example, the anomeric configuration of the glucuronic
acid residue in E.coli K27 capsular polysaccharide was assigned when a
B-D-glucuronidase was applied to the polymer and the enzyme did not
split the mo l ecule, therefore, assuming the enzyme was active the
structure had to be ~-D-glucuronic acid. (75)
Enzymatic procedures are rapid and can be adapted to a
microscale. Optimal reaction conditions at pH 7, or thereabouts, and
temperatures near room temperature, ensure only selected bonds react
and the sugar or quarternary structures are not altered by extremes of
pH or temperature. However, should the enzyme be contaminated with

-32-
other glycoside hydrolyases, due to inadequate purification, more than
one oligomer will result from the hydrolysis, giving an ambiguous
result. Selective enzymic hydrolysis, when a suitable enzyme
(especially a bacteriophage-borne endo-glycanase) is available, is a
convenient method of preparing an oligosaccharide that corresponds to
one, or more, intact repeat units, particularly for those polymers
containing components not stable to the conditions required for par
tial acid-catalysed hydrolysis.

-33-
B INSTRUMENTAL ANALYTICAL TECHNIQUES
i) INTRODUCTION
This section deals with those methods which involve instruments
for the identification and determination of carbohydrate structures.
The procedures/instruments that we use include:
(1) ultra-violet spectrophotometry (u.v.), a useful
technique for monitoring the uptake of sodium metaperiodate during
periodate oxidation,
(2) polarimetry, although the use of this instrument
is dwindling owing to the inherent requirement of the method, name ly,
the high degree of sample purity, it is still used for the deter
mination of the overall optical rotation of the poly- or oligo-
saccharides,
(3) mass spectrometry (m.s.), (either alone or in
tandem with g.l . c. known as g.l.c.-m.s.) is used to identify com
pounds derived from methylation analysis. Moreover, this technique
can also be used to determine the molecular weight, sequence, and
position of the glycosidic linkages in small oligosaccharides (i.e.
those with up to five monosaccharide units), (40)
(4) nuclear magnetic resonance (n.m.r.), a method
that gives a great deal of usable information, for example, the proton
attached to the anomeric carbon in monosaccharides have larger chemi
cal shifts when in the equatorial position compared to the ax i al posi-

-34-
tion,
(5) gas-l iq ui d chromatography (g. 1. c.) is used to
analyse a hydrolysate for component monosaccharides and more impor
tantly, is used for analyses of the permethylated sugar mixtures
produced during methylation analysis. It is also possible to separate
and identify the various anomers and establish the ring size of sugars
by this method.
The latter techniques- mass spectrometry, g.l.c., g.l.c . -m.s.,
and n.m.r . - because of their applicabilty to structural studies of
carbohydrates, warrant a more detailed review.

-35-
ii) GAS-LIQUID CHROMATOGRAPHY AND G.L.C.-M.S
Gas liquid chromatography is a process in which the components of
the sample are volatilised and distributed between a moving inert gas
phase (He,H 2 or N2) and a liquid phase held stationary on a support.
Those compounds that are most compatible with the liquid phase will
spend a correspondingly larger portion of their time held in the sta
tionary phase than those compounds with less affinity for the liquid,
therefore, the net result is that components are eluted progressively
with increasing affinity for the stationary phase.
The samp l e, usually a solution of volatile derivatives of the
saccharide components (e.g. acetylated aldononitriles) in a volatile
solvent, is injected into a heated chamber whereupon it is volatilised
and carried along the co l umn by the gas stream. The column is main
tained uniformly at a temperature sufficient to keep the components
volatile and afford a suitable partition ratio of the sample between
the mobile and stationary phases. (80) Compounds eluting from the
column are monitored with an appropriate detector, for example, a
flame ionisation detector (FlO).
Identification of the compounds is by comparing the retention
time (time taken to travel the full length of the column) with that of
a standard. In some cases, the eluate is fed directly into a mass
spectrometer (known as g.l.c.-m.s.) and this allows the identities of
the compounds, which are already tentatively assigned by their reten
tion times, to be confirmed by their mass spectra. Absolute iden-

-36-
tification of methylated sugars by mass-spectral analysis alone is
not possible. Firstly, different isomers having the same substitution
pattern give identical spectra, thus, no distinction can be made bet-
ween them; secondly, alditols derived from 2,4- and 3,5-di-O-methyl
hexoses will give identical mass spectra. (82) To a large extent, the
latter problem can be overcome by reducing the permethylated sugars
with borodeuteride instead of borohydride, thus ensuring a unique
spectrum from each molecule. (83) The fragmentation of permethylated
alditol acetates gives rise to primary fragments that arise by
fission between two carbon atoms in the alditol chain, with either of
the carbon fragments carrying the positive charge, and secondary
fragments that are formed from the primary fragments by elimination of
acetic acid and/or ketene. (82) The intensities of the fragment peaks
in the analysis of alditol acetates are influenced by the structures
present. Fission occurs preferentially between certain chemical
groups on the molecule, for example, fission occurs between the carbon
atoms in partial structure 1 and 2 in preference to partial structure
3. (82)
I I JC-OCOCH3 HC-OCH 3 HC-OCH 3 I I I
HC-OCH 3 HC-OCOCH3 HC-OCOCH 3 I I I l. 2. 3.
In addition, fission also occurs more frequently between the carbons
in partial structure 1 than in partial structure 2. (82) A discrete
fragmentation pattern will, therefore, be obtained for most of the

-37-
substitution patterns on the monosaccharide. This means that, com
bined with the identi fication by relative retention time and a
knowledge of the polysaccharide composition, g.l.c.-m.s. should give
unambiguous identification of partially methylated monosaccharides.
Quantitation of the various components eluted during the g.l.c.
run requires either determination of the molar response factor (m.r.f.)
of indi vidual compounds analysed by the detector, or an assumption of
these values. In some cases, where accuracy is not of paramount
importance or the compounds are simil ar, it is satisfactory, as a com
parison, to consider that the molar response is equal to the weight
response. The effective carbon response factor is also used to calcu-
late individual sugar responses. This theory assumes that each type
of carbon (e.g. carbonyl or ether moiety) contributes to the same
extent in all molecules regardless of the identity of the the com
pound, therefore, the total response will be the summation of all the
individual carbon responses. (84) However, for accurate analyses the
m.r.f. should be determined for each compound. (81)
The choice of an appropriate liquid phase is important in
obtaining meaningful results in g.l.c. analysis; both the ability of
the liquid to effect separation and its stability under the operating
conditions are considered. The stationary phase can be either non
polar or polar. The non-polar phases are most efficient when
separating components of differing carbon number, while those that are
polar afford better separation of molecules that fall within a
narrow and low molecular weight range and are therefore, par-

-38-
ticularly well suited to separating monosaccharides. Those liquids
that have found application in separating sugar derivatives include:
ECNSS-M, OV-17, OV-225, and apiezon greases. (37) The column type is
selected to suit the application. There are two types of column
available, those filled with a solid support phase to which the liquid
phase adheres, and those known as a wall coated or a capillary
column. The l atter have the liquid phase bound to the wall of a sma l l
diameter column and are the most suited to analytical work because
they give better peak separation(37) than the more conventional packed
columns. They are of little use, however, in preparative separation
as the sample size is limited to l~g or less. (80)
For the majority of our research using the g.l.c., we use a
bonded fused silica OV-225 column as this, in most cases, successfully
separates vo latile derivatives (PAANs or alditol acetates) of mono
saccharides, octyl glycosides, and partially methylated alditol aceta
tes. It also has greater stability under the operating conditions of
the instrument compared to some of the other liquid phases available
e.g. ECNSS-M. (80) Occassionally OV-17 is used in preference to the
OV-225 as the liquid phase as the order in which the partially methy-
lated alditol acetates are eluted is different and the quantitative
determination properties are superior to OV-225. (37) In addition,
some of the partially methylated sugars co-elute on a particular
column, e.g. 3,4,6- and 2,4,6-tri-O-methylhexose derivatives, which
emerge as a single peak on OV-225, but, are separated on OV-17. The
reverse is true when dealing with 2,3,6- and 2,3,4-tri-O-methyl hexose

-39-
derivatives. However, it is feasible to resolve all the different
methylated sugars by the correct use of both OV-17 and OV-225.
Gas-liquid chrom atography and g.l.c.-m.s. have been limited to a
few fields bec ause of the inherent restrictions of the method, in par
ticular, the components to be separated must be stable and volatile
under the operating conditions. At present, when used in carbohydrate
research, they are used only in the analysis of the component mono
saccharides after hydrolysis of the polysaccharide, the assignment of
the absolute configuration by separation of diasteriomers produced by
chiral reagents and, more importantly, for the analysis of partially
methylated sugars produced by hydrolysis of the permethylated polymer.

-40-
iii) NUCLEAR MAGNETIC RESONANCE SPECTROSCOPY OF CARBOHYDRATES
(a) Introduction
Nuclear magnetic resonance (n.m.r.) is a powerful tool for
obtaining structural information on poly-, oligo- and di-saccharides.
It has an advantage over ot her methods as it is non-destructive, that
is, the sample is generally neither destroyed nor modified during ana
lysis. This ability to examine and then recover the sample intact
is especially appealing when the saccharide is available in limited
quantities. In addition, methods and instrumentation have been
evolved that make it possible to analyse a sample in a solid form,
thus, ensuring the true physical and chemical nature of a solid car
bohydrate is preserved.
Most n.m.r. spectra can be fully described by five sets of para
meters, (96) namely:
(1) the integral, which is the area of the signal
and is proportional to the number of nuclei resonating at that par-
ticular frequency,
(2) the chemical shift, which is defined with respect
to an arbitrarily selected standard, e.g. tetramethylsilane (TMS),
these values are quoted in dimensionless units of parts per mil l ion or
the a scale, where
a frequency separation (Hz) between the resonance and TMS x 10
6 = spectrometer radiofrequency (Hz)

-41-
(3) the spin coupling, which causes signal
splitting, is reported in Hz,
(4) spin-lattice relaxation time, or t1 value, is a
time constant for the transfer of absorbed energy from the resonating
nucleus to the environment, and
(5) the spin-spin relaxation time, or t2 value (the
time constant for the loss of phase coherence of the resonating
nuclei ).
The resolution of these parameters has improved vastly compared
to earlier instruments and advances in a number of areas are respon
sible for this. The introduction of superconducting solenoids (which
provide a stronger magnetic field than the electromagnets used pre
viously) allow the operational frequency of the instruments to be
increased from less than 100 MHz to over 500 MHz. The benefits
operating at higher frequency are two-fold, firstly, there is an
appreciable increase in the sensitivity of the machine when used at
higher magnetic field and secondly, the chemical shifts of the nuclei
are magnified while the couplings remain invariant. Clearly, there
fore, the spectrum is more spread out and interpretation is easier,
which allows more detailed information to be obtained and smaller
samples to be analysed. Similarly, the use of pulsed Fourier transform
(FT) techniques, instead of continuous wave methods, has increased the
sensitivity of n.m.r. analysis thus allowing nuclei, other than pro
tons, to be used as the probe. Dedicated computers (and in some cases
array processors) have become necessary additions to the machines used

-42-
since the advent of FT methods; these have, by improved data manipula-
tion, increased the number of parameters that can be studied on a
routine basis. For example, spin-lattice (t l ) and spin-spin (t2)
relaxation times, which furnish detailed information on the nature of
the polysaccharide, can now be determined. Unfortunately, despite
these advances, no single method allows all the parameters to be
accurately determined in a single experiment and, as a result, it is
necessary to choose the technique that will give the majority of the
information required (see Table 2).
PrOOI.."
Carbon assignments are known, but what arB the proton assignments?
Which protons ant coupled to which?
Which groups are nearby uch other In space?
What are the proton-proton coupling constants In a heavily overlapping region of the spectrum?
CH and CH 2 regions 01 the carbon spectrum are heavily overlapped. Which are which?
How can carbon signalS from the deuterated solvent be suppressed?
Which carbons are connected to which?
Two--dimensional heteronuclear correlated
Two-dimensional J-correlated (COSY)
Two-dimensional NOE (NOESY) or one-<jimensional difference NOE
Two-dimensional J-resolved
Insensitive nuclei enhanced by polarization transfer (INEPT), distortion less enhancement by polarization transfer (DEPT)
INEPT. DEPT
Two-dimensional 13C-correlated
R •• ul~
The proton spectrum will be along one axis. the carbon along the other. In contour format. the spots wltl show the correlations.
The one-dimensionat spectrum will be along the diagonal. The off-diagonal peaks will show the coupling correlations.
In two dimensions, the on~lmensional spectrum will be along the diagonal. Those protons nearb each other can be correlated by the off-diagonc peaks. In one dimension. the magnitude of the NOE is related to the distance between nucleI.
The proton...(jecoupled proton spectrum will be along one axis and the proton-proton coupling constants will be spread out along the other.
Intensity enhancement Is obtained and proper choice of the delay times in these pulse sequences allows selective inVersion of the different types of carbons.
These pulse sequences rely upon transfer of polarization from protons to the insensitive nucleus. and thus the deuterated solvent Is not observed.
Correlations between the carbons that are connected to each other can be made immediately.
Table 2. NUCLEAR MAGNETIC RESONANACE EXPERIMENTAL OPTIONS . (85)
One aspect of determining the five n.m.r. parameters that has lead to

-43-
confusion is the large number of standards used, for example, external
carbon disulphide, internal sodium 2,2,3,3,-tetra-deuterio-4,4,
-dimethyl-4-silapentanoate (TSP), sodium 4,4-dimethyl-4-silapentane
-I-sulphonate (055), as well as external TMS, have all been used as
standards. (92) The net result is the introduction of an experimental
variation in the chemical shift of substituents.
At present most of the n.m.r. studies of carbohydrates utilise
either proton or carbon substituents as the nuclear probe. These are
used to furnish information on the total sugar ratio, sugar and chain
conformations, nature of the anomeric linkage, additional substituents,
and solution conformations. (85-90,94)
(b) Proton magnetic resonance spectroscopy
IH_n . m.r . data from polysaccharides and oligosaccharides are
affected, principally, in two ways. The first is by exchangeable pro
tons (O-H,N-H) in the molecule. These give rise to a strong residual
water peak known as the HOD signal and this has a chemical shift at
ambient temperature, such that it interferes with signals in the
import ant anomeric region. (This s igna l can be reduced, but not
removed,by exchanging the protons with deuterons using quality
deuterium oxide >99.98%). Thus, some of the anomeric signals are
obscured by the HOD signal and its spinning sidebands. The second
effect is from both signal broadening and the low sensitivity of the
IH nuclear chemical shift to changes in chemical and stereochemical

-44-
environment. The signal broadening is due to the short spin-spin
relaxation times of the po lysaccharide protons as a result of the high . (89)
viscosity of the polymer Solutlons. These result in a con-
siderable overlapping of resonances, especially where the molecule is
large and complex. Clearly, to obtain easily decipherable spectra
1 from H-n.m.r. experiments these problems known as "hidden
resonance,,(90) must be overcome. Several methods have been put for-
ward. These can be subdivided into (1) chemical and (2) physical/
instrumental methods, although, in some cases, a combination approach
can be adopted with greater success.
The chemical methods used include:
(a) solvent induced shifts; in practice these are
seldom used as the induced shift is small «0.5 p.p.m.) and poly-
saccharide solubility is usua l ly limited to water and solvents of
similar nature,
(b) functional derivatisation of hydroxyl groups,
as this often results in a downfield shift of protons on adjacent car-
bon atoms,
(c) specific deuteration; specific protons are
replaced with deuterons and, thus, no longer give rise to a inter-
fering resonance,
(d) deploymerisation; the viscosity is reduced by
either producing oligosaccharides that correspond to the intact repeat
unit or cleaving a few intersaccharide linkages, and this gives
smaller linewidths than in the spectra of the polymer,

-45-
(e) paramagnetic shift reagents (e.g. Lanthanide)
when added to the sample induce large shifts (up to 40 ppm) in some
of the resonances, (90) thereby shifting interfering resonances to dif
ferent parts of the spectrum.
Unfortunately, all of these methods to some extent alter the
sample; so under conditions where it is important to recover the
sample unchanged, instrumental sol utions to these problems are pre
ferable. As mentioned previously, chemical shifts are dependant
upon the external magnetic field and, therefore, the transmitter
radiofrequency. Thus, a facile method of circumventing resonance
overlap is to perform experiments at higher frequency and instruments
are available that operate at fields up to 600MHz. Unfortunately, even
at the highest field available, not all of the resonances are discrete
(especially those in the non-anomeric region(88» and this has lead to
the development of several experiments to overcome this. Included
here are spin decoupling, spin tickling, internuclear double
resonance (INDOR), partially relaxed Fourier transform, and two
dimensional techniques (see page 49) to improve the resolution in
these areas. (89)
The effect of the HOD signal is minimised by either raising the
temperature of the sample during analysis, whereupon, the HOD signal
is displaced upfield (approximately 4.2 ppm at 95°) and that part
of the spectrum previously hidden will be exposed or, by using one of
the pulsed FT techniques. For example, saturation decoupling(89)
effectively removes the HOD signal by using an appropriate pulse

-46-
sequence.
The anomeric protons of the polysaccharide give the most useful
information and of the five parameters determined for these protons
during a 1H_n. m. r . experiment, the chemical shift (0) and the spin-
spin couplings (J) are the most useful. The shift value is indicative
of the environment of the proton and the coupling constant correlates
with the size of the dihedra l angle (B) between the anomeric proton
and H-2. This value is at its greatest when the angle is 1800 (the
protons are transdiaxial), falling to a minimum when the angle is
90 0 (the protons are gauche). When applied to those signals where the
difference in the angle between H-1 and H-2 of the ~ and B form is
large, the J value is characteristic of the anomeric linkage. For
example, the value for a B galactose is 8 Hz (both protons are
axial) and 3.5 Hz for'" galactose (H-1 equatorial,H-2 axial).
However, where the difference is small (as in mannosyl residues) the
coupling constant is not a reliable method of assigning anomeric con-
figuration.
Although the "hidden resonance" problems associated with complex
1 carbohydrates threaten to curtail the use of H-n.m.r. experiments in
favour of other nuclei as probes, there is a wealth of information to
be derived by using this technique. Indeed, the full potential of
proton magnetic resonance has yet to be achieved.

-47-
(c) Nuclei other than protons as nuclear probes
The majority of n.m.r investigat ions of carbohydrates have uti
lised protons as the nuclear probe, but there are several other nuclei
suitable for this type of study- 15N, 19F, 31 p, and especially 13C•
It only became possible to study 13C nuclei after the introduction of
FT instrumentation which provided a substantial increase in the sen-
sitivity of n.m.r. analyses. This was because the low natural abun
dance (about 1.1%) and the limited intrinsic sensitivity
(approximately 1.6% of the 1H nucleus sensitivity) prevented meaning
ful analysis using the pre-FT instruments and methods. (91) These
drawbacks are, fortunately, compensated by the enhanced sensitivity
(nearly 30 fold) of the 13C chemical shifts to changes in chemical and
stereochemical environment compared to an equivalent proton substi-
tuent. Similarly, the line broadening as a result of high viscosity
that occurs in 1H_n•m. r . spectra does affect 13C spectra. Hence, the
resonances are sharp and well spread out, which is an advantage when
dealing with polysaccharides where the "signal density" is high. The
radiofrequency of the instrument does not have to be as high as in
1H_n.m•r • experiments, a frequency of 100MHz is quite adequate to
ensure the separation of the resonances even in complex spectra.
The parameters that can be determined in a 13C n.m.r. experiment
include the chemical shift, spin-spin coupling constants between the
carbon and other resonating nuclei, nuclear Overhauser enhancement
(nOe) and the nuclear relaxation times t1 and t 2• (93) The chemical

-48-
shift, characteristic of the environment of the nucleus, is used to
identify various substituents and the configurations of the anomeric
carbons in the molecule . Anomeric con figuration can be assigned on
the basis of the 1JCH coupling constant for an anomeric linkage. This
is because coupling constants give information on the angles of the
bonds connecting the coupled nuclei. (93) It was shown(g3) that the
1JCH coupling constants for the a and B anomer are 160Hz and 169Hz
respectively. Other couplings of interest include the 3JC _1 ' H value , which is used to determine the torsion angles of the glycosidic linka
ges in the molecule. Three 13C parameters studied nOe, t1 and t2 are
of use in evaluating internuclear distances and polymer substituent
mobility, but, due to the absence of a comprehensive data bank of
values for reference compounds, their application to carbohydrate
structural studies is limited.
Experimentally, there are two ways of obtaining 13C n.m.r
spectra. The first, using broad band decoupling of protons, produces
spectra that are simple as each carbon in a different environment pro-
duces a single sharp resonance. This is because at natural abundance
levels 13C_13 C couplings are not observed. While using the second
method, where the protons remain coupled, the signals from those car-
bons covalently bonded to one, or several, protons are split into two
or more resonance peaks. Furthermore, in this method spectra are
complicated by longer range couplings which cause signal broadening
and splitting. The negative aspects are, however, offset by the
increase in the usable information obtained from this experiment.

-49-
Experimental options for analysis of I3C resonances and I3C coupling
constants include: IH decoupling, selective I3C saturation combined
with gated IH decoupling, off resonance decoupling, FT difference
spectroscopy, as well as two dimensional techniques. (90) Therefore,
it is often possible to select a technique that is well suited to the
task at hand.
(d) Two dimensional nuclear magnetic resonance spectroscopy
The techniques discussed previously have been mainly one
dimensional (ID) in which the chemical shift data are displayed along
a single horizontal axis, while in two dimensional (2D) n.m.r. a
second axis is introduced on which either shift or coupling values are
displayed. Experimentally the techniques differ in the pulse sequence
used; the ID pulse sequence (see Figure 6) is altered so that the evo-
lution period tl becomes variab l e within a sequence of pulse cycles.
Detection
t> .. FID
----.I4-.---..... I:~ . I, '2
Preparation Evolution
Figure 6. TIME SEQUENCE OF MODERN PULSE EXPERIMENTS. (36)
If tl is increased (from tl =0) by a constant time increment ~ t l , the
receiver signal and therefore the resonance amplitude, will become
dependant upon t l . Therefore, the data can be transformed with

-50-
respect to t2 and also t1 to obtain frequency variables F2 and
F1, respectively. F2 yields the chemical shifts of the nuclei, as in
10 experiments, while F1 reveals the modulation, i . e. the coupling
constants.
Two dimensional n.m.r. exper iments can be subdivided into corre-
lated and J-resolved 20 spectra. The latter, characterized by one axis
for the coupling information and one for the chemical shift data,
resolves both the coupling constants and the chemical shift, while
the former, where both of the axes contain chemical shift data, corre-
lates nuclei based on interactions such as the nOe or coupling
constant. (36) There is a slight experimental difference between the
two as correlation spectra require an additional time interval, called
the mixing time, between the evol ution and detection periods. (36) The
connection between F1 and F2 axis is established through scalar
coupling or dipolar coupling with measurements of coupling constants
made from a contour plot of the J-resolved spectra. Hence, the
20-n.m.r. experiment chosen depends upon the information to be
derived. For example, 1H COSY (correlated spectroscopy) is used to
determine the homonuclear (proton) couplings within a molecule, while
1H 20- J-resolved experiments are used for determining the size of the
homonuclear coupling.
Two dimensional n.m.r., despite its ability to improve upon the
poor resolution found in some of the 10 experiments and its unsur-
passed ability to pinpoint couplings, is unlikely to entirely replace 10
experiments. This is because 20 experiments require a longer acquisi-

-51-
tion time and more sophisticated pulse transmitters than 10.
Moreover, 10 data reduces the minimum 20 acquisition times and simpli
fies 20 spectral interpretation. The techniques are, therefore,
complementary.
(e) Conclusion
Clearly, n.m.r. has already proven itself a useful method of
determining carbohydrate structures. It can identify component mono
saccharides, anomeric configuration, position of linkages and the con
formation of both monosaccharides and glycosidic linkages, without
alteration or destruction of the sample. Yet, .all of the techniques
discussed 10 and 20, (13C and 1H n.m.r.), have the potential to be
developed further as technology advances, whereupon, the information
will be available in greater detail than at the present. Examples of
these developments are already becoming evident; the introduction of
array processors, for example, has reduced the time required for data
manipulation, an important advance in a technique where the computation
is often time consuming. These advances hold exciting implications
for the carbohydrate chemist involved in the field of structural elu
cidation.

4 THE STRUCTURAL ELUCIDATION OF THE E.COLI K36 CAPSULAR ANTIGEN
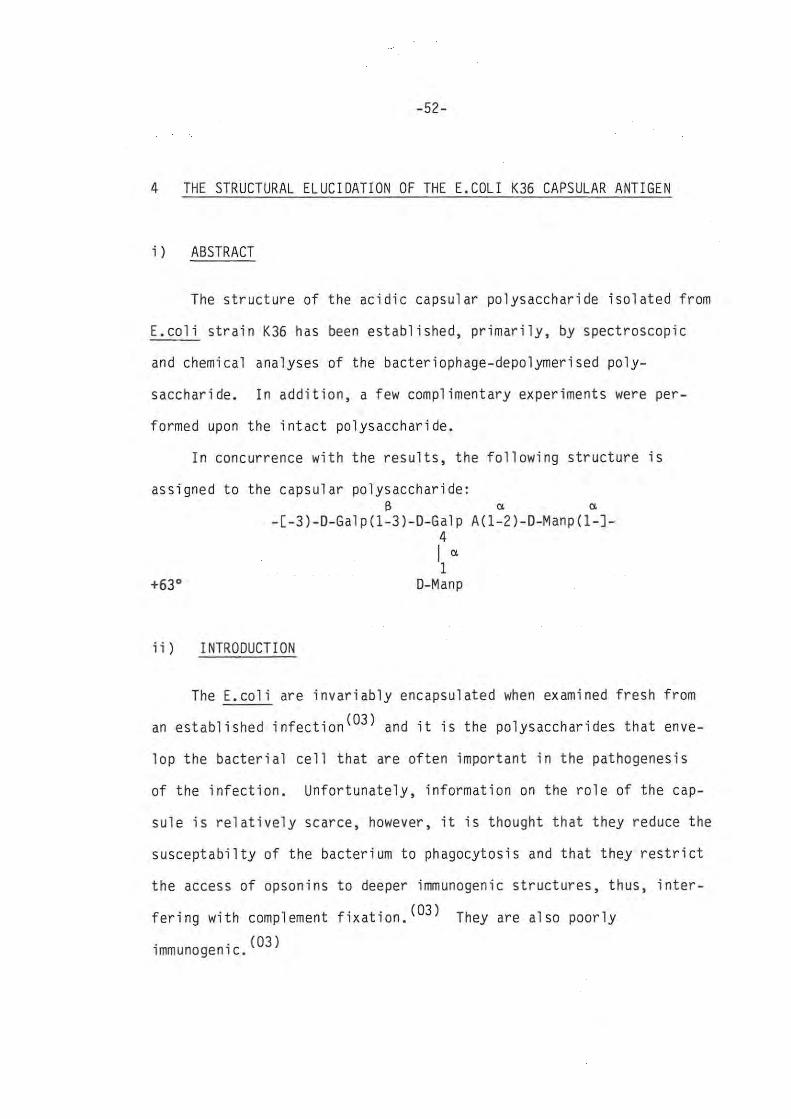
-52-
4 THE STRUCTURAL ELUCIDATION OF THE E.COLI K36 CAPSULAR ANTIGEN
i) ABSTRACT
The structure of the acidic capsular polysaccharide isolated from
E.coli strain K36 has been established, primarily, by spectroscopic
and chemical analyses of the bacteriophage-depolymerised poly-
saccharide. In addition, a few complimentary experiments were per-
formed upon the intact polysaccharide.
In concurrence with the results, the following structure is
assigned to the capsular polysaccharide: B c< c<
-[-3)-D-Galp(1-3)-D-Galp A(1-2)-D-Manp(1-J-4 I c< 1
+63 0 D-Manp
ii) INTRODUCTION
The E.coli are invariably encapsulated when examined fresh from
an established infection(03) and it is the polysaccharides that enve-
lop the bacterial cell that are often important in the pathogenesis
of the infection. Unfortunately, information on the role of the cap-
sule is relatively scarce, however, it is thought that they reduce the
susceptabilty of the bacterium to phagocytosis and that they restrict
the access of opsonins to deeper immunogenic structures, thus, inter
fering with complement fixation. (03) They are also poorly
immunogenic . (03)

-53-
It is noteworthy that the E.coli capsular polysaccharides also
have diversity of struc ture and this reduces the likelihood that the
host has had previous exposure to the antigen, limiting the
possibility that there will be a specific antigen present. (03)
Similarly, some of the E.coli, for example the strain K5, (97) have
capsule s that closely resemble the body's polysaccharides and, as a
result, are non-immunogenic. The E.coli are, thus, able to mediate
the host's defence mechanism to some extent.
The study of the E.coli strain K36 capsular polysaccharide,
which we report on now, forms a part of a study to identify the struc
ture of all the K antigens.
iii) RESULTS AND DISCUSSION
The E.coli K36 was cultured on Mueller-Hinton agar (see Annexure
2) with 2% sodium chloride added and the polysaccharide was extracted
from the cells with 2% aqueous phenol. The isolation and purification
involved ethanol and cetyltrimethylammonium bromide precipitation steps
as well as dialysis. The native polysaccharide, examined by gel
permeation chromatography on a Sepharose® 4B Cl column, was found to be
monodisperse (Mr of 2.7 x 10⁷ relative to dextran) with respect to
its molecular weight distribution (see Profile 1)
The enzymatic depolymerisation of the capsular polysaccharide
with a polymer specific bacteriophage-borne endoglycanase gave a 78%
yield of material with a Mw below 6 000; from this material an oligo-

-54-
saccharide (PI), that corresponds to a single intact polysaccharide
repeat unit, was isolated by paper chromatography in a 20% yield.
The optical rotation of PI (+89°) when compared with the optical rota
tion of the polysaccharide (+63°), suggests that a B linkage had been
cleaved during the depolymerisation.
Total sugar analysis of both the polysaccharide and oligo
saccharide, with and without reduction of any carboxylic acid groups
present, gave an overall molar ratio (see Table D) of 2:1:1 for man-
nose, galactose and galacturonic acid. The monosaccharides were all
shown to be of the D configuration by g.l.c. analysis of the sugars as
their derived(34) acetylated 2(-)-octyl glycosides.
The K36 oligoalditol PI (produced by borohydride reduction of
oligosaccharide PI) was methylated, carboxyl reduced with LiA1H4 and
then treated with trifluoroacetic acid (TFA) to release the per
methylated monosaccharides. G. l.c analysis of these sugars as the
derived alditol acetates revealed (see Table C,column(c)) that the oli
goalditol PI is a linear tetrasaccharide with a 3-0- linked galac
titol and a non-reducing mannose as the termini. A 4-0- galacturonic
acid and a 2-0- linked mannose comprise the rest of the chain. There
are, thus, only two possible structures for this PI oligoalditol:
A. Manp(I-4)Galp A(I-2)Manp(l-3)Galactitol
B. Manp(I-2)Manp(I-4)Galp A(I-3)Galactitol
The I H_n•m. r • spectrum of PI recorded at both ambient temperature
(30°) and 95° (see Table A and Spectrum 1 and 2) is characterized by
several fractional signals. These arise due to the mutarotation of

-55-
the terminal sugar unit and the pyranose/furanose equ i librium of the
terminal sugar that occurs in solution. (67) In the spec t rum of PI
recorded at 95 0 the resonances at 5.28 ppm (0.55 H) and 4.62 ppm (0.45
H) which together integrate for a single proton, represent H-1 of the
a and B pyranosyl configuration of the termina l residue. These may be
confidently assigned as the a and B galactose signals on the basis of
the methylation and Morrison(76) analyses, both of which identified
the galactose as the reducing terminus. The presence of the frac
tional signals in the spectrum of PI at 30 0 and 95 0 al lows other
assignments to be made. This is because the mutarotationa l
equilibrium measurably affects the resonances of those residues in
close proximity to the reducing terminal. Thus, four signa l s arise
f rom one of the man nose residues, of which the signals at 5.23 ppm
and 5.22 ppm (at 95 0) represent H-1 of a mannosyl residue when the
oligosaccharide has an a and a B galacto pyranosyl reducing terminus
r espectively, whi le the other resonances at 5.16 and 5.13 ppm arise
when the mo l ecule has an a and B galactofuranosyl terminal residue.
The different forms of the galactose, thus, have a strong influence
upon the chemical shif t of the man nose residue causing its anomeric
proton signal to be "twinned". (67) It may thus be concl uded that the
mannose residue is linked to the terminal galactose in Pl . The
"twinning" further enables the assignment of the more downfield of the
mannosyl signals to the mannose linked to the galactose, i.e. the 2-0-
linked mannose.
The correctness of the spectral assignments made from the PI
spect r um were confirmed by the spectrum (see Table A and Spectrum 3)

-56-
of PI oligoalditol (PI reduced with NaBH4). The terminal galactose
residue has been reduced to galactitol (whereupon the residue no
longer has a signal in the anomeric region) which causes the "twinned"
H-I signal of the 2-0- l inked mannosyl sugar to collapse into a single
signal (5.20 ppm). The signal for the anomeric proton of the second
mannosy l
from the
residue could not be concl usively assigned as either a or B
I H-n.m.r. data. A generalisation, when dealing with anomeric
resonances of individual monosaccharides, is that H-l signa l s down
field of 5 ppm arise from sugars with a anomeric confi gurations (that
is the protons are in the equatorial plane), whilst those upfield of 5
ppm arise from sugars of the B anomeric configuration. The second
mannosyl signal falls almost upon 5 ppm and therefore no anomeric
assignment can be made for this mannose, from the IH spectrum. It was
necessary, in order to ascertain the nature of this last anomeric
configuration, to perform a 13C proton coupled experiment. The value
for the C-l,H-l coup l ing for this mannose was 169.83 Hz, which is con
sistent for a coupling where the proton linked to the anomeric carbon
is in the equatorial position;(93) the anomeric configuration can
thus be confidently assigned as a.
The polysaccharide was examined by proton and 13C_n•m•r .
spectroscopy. It was, however, necessary to partially autohydrolyse
(PA) the native polysaccharide prior to n.m.r. analysis due to the
high viscosity of the polysaccharide solution. The I H_n•m•r • spectrum
of the PA polysaccharide showed six well resolved signals in the ano
meric r egion (see Spectrum 4). From the chemical shift and coupling

-S7-
constant (4 . 63 ppm,7.S Hz) of the galactose residue(70,99) in the
polysaccharide its anomeric configuration was assigned as B.
Finally, after assigning the resonances of the four anomeric protons
from the chemical shift and coupling data (IH and 13C) of the PI and
polysaccharide spectra (see Tables A and B) there are a further two
signals in the IH_n. m. r . anomeric region without assignments. These
assignments were made from a IH_two dimensional correlated n.m.r.
spectroscopic (2D COSY) spectrum of a structural analogue of the
E.coli K36 PI oligosaccharide (see Spectrum 13) . (This analogue was
derived from the deploymerisation of Klebsiella K68 capsular poly
saccharide by a homologous bacteriophage). In the 2D COSY (IH) experi
ment the chemical shifts of the individual protons are displayed along
a 4So diagonal and each pair of coupled protons give rise to two sym
metrically displaced off diagonal responses. The resonances are
correlated to their off diagonal responses by a connectivity plot,
illustrating those protons that are coupled to each other (see Figure
I,Annexure 1) Using this technique we were able to assign these
signals as the H-4 (4.63 ppm) and H-S (4.49 ppm) resonances of the
galacturonic acid residue.
Analyses were conducted on the neutral sugars of methylated
native polysaccharide and methylated native polysaccharide reduced
with lithium aluminium hydride (see Table C,columns (a) and (b)).
These data showed that the galacturonic acid along with the 2-0- linked
mannose and 3-0- linked galactose constitute a trisaccharide backbone
to which the last mannosyl residue is linked to the galacturonic acid
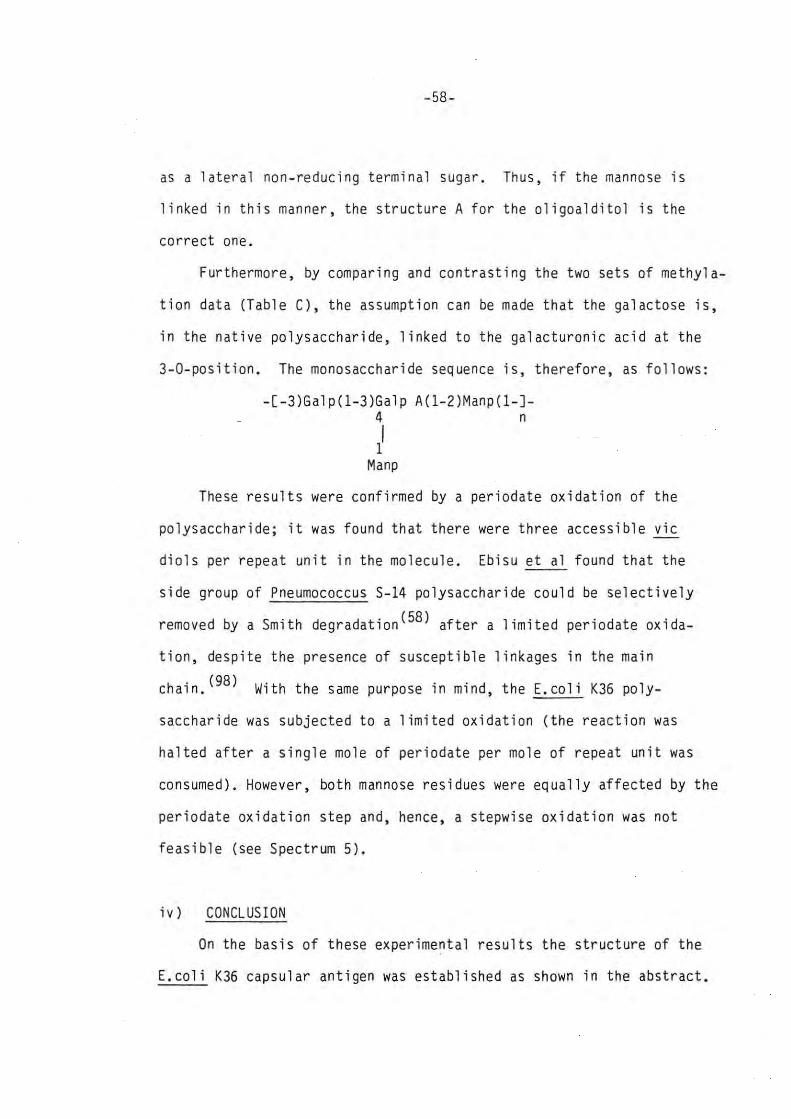
-58-
as a lateral non-reducing terminal sugar. Thus, if the mannose is
linked in this manner, the structure A for the oligoalditol is the
correct one.
Furthermore, by comparing and contrasting the two sets of methyl a-
tion data (Table C), the assumption can be made that the galactose is,
in the native polysaccharide, linked to the galacturonic acid at the
3-0-position. The monosaccharide sequence is, therefore, as follows:
-C-3)Galp(l-3)Galp A(l-2)Manp(l-J-4 n
J Manp
These results were confirmed by a periodate oxidation of the
polysaccharide; it was found that there were three accessible vic
diols per repeat unit in the molecule. Ebisu et al found that the
side group of Pneumococcus S-14 polysaccharide could be selectively
removed by a Smith degradation(58) after a limited periodate oxida-
tion, despite the presence of susceptible linkages in the main
chain. (98) With the same purpose in mind, the E.coli K36 poly-
saccharide was subjected to a limited oxidation (the reaction was
halted after a single mole of periodate per mole of repeat unit was
consumed). However, both mannose residues were equally affected by the
periodate oxidation step and, hence, a stepwise oxidation was not
feasible (see Spectrum 5).
iv) CONCLUSION
On the basis of these experimental results the structure of the
E.coli K36 capsular antigen was established as shown in the abstract.

-59-
The use of a bacteriophage-borne endogalactosidase circumvented the
need for a number of other experiments which are normally required in
order to sequence the polysaccharide. Had a more traditional approach
been adopted it would have been necessary to perform a partial hydro-
lysis as well as other complementary experiments in order to fully
elucidate the polysaccharide structure. When available, a
bacteriophage provides a convenient alternative to the other methods
of structural elucidation and this technique may, in certain
circumstances, be the only method of locating the position of attached
labile constituents; for example, O-acetyl groups. (100) B
The viral endogalactosidase cleaved the D-Galp(1-3)-D-Galp A-
bond to produce the following oligomer: cr cr cr crIB
D-Manp(1-4)-D-Galp A(1-2)-D-Manp (1-3)-D-Gal-OH •..•.... PI
+8g o
A survey of the literature shows that the primary structure of
the E.coli K36 capsular polysaccharide is identical to that from
Klebsiella K57(101) and very closely related to the structure of
Klebsiella K68(70) capsular antigen. The latter differs only in the
linkage of the galactose to the galacturonic acid (0-2 instead of 0-3)
and the presence of pyruvate on the pendant mannose. It is of
interest to note that these differences are sufficient to preclude
the adsorption of the heterologous (~K36,K68) bacteriophages by
either strain.

Table A. 1H_n.m.r. dataa for E.coli K36 polysaccharide, derived oligo- and polysaccharides (500 MHz).
I.OLIGOSACCHARIDE P1:derived from the depolymerisation of the capsular polysaccharide with a phage-borne endogalactosidase.
Chemical shift b
(ppm) ..b 2 (H:Zl
Ambient temperature d 95"C
4. 47
4.62
4.91
5.22 ( 5.24 )
5.26 5.27
5.28 5.29
~ I \
4.49
4.62
4.72
4.74
4.93
5. 13
5.16
5.22 ( 5.23 )
7.5
5. 26 I 5.27 \ -
5.28 ( 5.29 )
Integra 1 (H )
Assignment
Ambient temperature 95"C
1
0.3
1
0.95
0.9
0.5
1
0.45
0.4
0.6
0.9
0.2
0. 2
H-4 of 4 -Ga 1 A_C1.
3-Gal~OH
H-5 of 4_Ga l A!!
H-5 of 4_Gal A!!-
Man!!-
2 -Man'~G a If ~OH
2-Man~Galf~H
0.6 c2 -Man£'
1 4_Gal A£'
0.55 3-Gal~OH

II.OLIGOALDITOL Pl:oligosaccharide PI reduced with NaBD4
Chemical shift tR2
Integral Assignment ( ppm) Hi) Tffi
4. 47 1 H-4 of 4_Gal A'=
4.72 0.6 H-5 of 4_Gal A'=
4.94 0.5 Man'=
5.22 0.7 2 " -Man-
5.29 0.8 4_Gal A'=
III . PARTIALLY AUTOHYDROLYSED NATIVE POLYMER.
Chemical shift tR 2
Integral Assignment (ppm) Hi) Tffi
4. 43 1 H-4 of 3,4_Gal A'=
4.63 1 H-5 of 3,4_Gal A'=
4.68 7.5 1 3 -Ga 1 ~
5. 05 1 \ M,"' 2 " -Man-
5.23 2 3,4_Gal A'=

IV.SMITH DEGRADED POLYSACCHARIDE:produced from native polysaccharide subjected to aqueous sodium metaperiodate for two hours prior to treatment with 0.5M trifluoroacetic acid.
Chemical shift ( ppm)
4.59
4.64
4.78
4.98
5.11
5.27
112 (Hz)
7.5
Integral
1
0.6
0.45
0.2
0.4
0.9
Assignment
H-4 of 3,4_Gal A~
3 -Ga III
H-5 of 3,4_Gal A~
Man~
2 -Man~
3,4_Gal~
BSignals tabulated and assigned are those of protons with 8 chemical shift between 4.3 ppm and 5.5 ppm. bChemical shift down field from 4,4-dimethyl-4-silapentane-l-sulphonste(OSS), measured from acetone (2.23 ppm) as the internal standard. c The symbol 2_Man~, refers to the anomeric proton signal of a 2-0-1inked mannosyl residue in the ~ anomeric configuration. The absence of 8 numerical prefix, 8S in Man - , indicates a non-reducing
terminal group. dAmbient temperature is 30 0

Table B. 13c_n.m.r. data a for E.coli K36 polysaccharide, derived oligo- and polysaccharides (100MHz).
I.OLIGOSACCHARIDE P1:derived from the depolymerisation of the capsular polysaccharide with a phage-borne endogalactosidase.
Chemical shift b Assignment (ppm)
93.05 3 '" -Ga l-OH
95.1 2 '" '" -Man-Ga l-OH
95.41 2 '" e -Man-Ga l-OH
97.04 3 -Ga 1 ~OHc
'" 101.75 Man-
102.49 4_Gal A5!
173.14 4 '" COOH of -Gal A-

II . OLIGOALDITOL P1 : oligosaccharide PI reduced with NaBD4•
Chemical shift (ppm)
(A . )Proton decoupled spectrum
100.29
101.58
102 . 51
173.15
(B.)Proton coupled spec t rum JC1 - H1 (Hz)
169.83
169.83
168.57
Ass i gnment
2_Man::'
Man::'
4 '" -Gal A-
COOH of 4_Gal A~
'" Man-
2 -Man~
4_ Gal A~

III.NATIVE POLYMER:after partial autolysis.
Chemical shift ( ppm)
95 . 47
100.79
101. 65
105.16
173.1
Assignment
2 M a - an-
Man~
34 '" , -Gal A-
3_Gal ll
COOH of 3,4_Gal A~
a bSignals tabulated and assigned are of those carbons with a chemical shift between 90 ppm and 180 ppm. cChemical shi~t downfield fr om 055, measured from acetone as the i nte rnal standard (37.0 7 ppm).
The symbols -Ga l~ refer to the signal of the anomeric carbon of a 3-0-1inked galactosyl residue in the B-configufation.

Table C. METHYLATION ANALYSIS OF K36 NATIVE POLYSACCHARIDE, CARBOXYL-REDUCED POLYSACCHARIDE AND OLIGOALDITOL Pl.
STARTING MATERIAL:
(a).NATIVE POLYSACCHARIDE I
(b).NATIVE POLYSACCHARIDE II (COOH reduced)
(c).OLIGOALDITOL PI III (COOH reduced)
I, Methylated and hydrolysed.
METHYLATED SUGARS: b 1,2,4,5,6-Gal 2,3,4,6-Man
TaO.75 0.98
1.0c
1.0
1. 29 1.0
II, Methylated, reduced with LiA1H4 then hydolysed.
III, Methylated and methanolysed.
3,4,6-Man 2,4,6-Gal 2,3-Gal
1.55 1. 70 3.21
1.13 1.3
1.28 1.2
1.55 0.79
2-Gal d
4.03
1.6
a b Retention time relative to tetra-D-methyl-glucitol-di-D-acetate on an OV -2 25 column isothermally at 205 0
1,2,4,S,6-Gal refers to a 1,2,4,5,6-penta-D-methyl-galactitol-3-D-acetate. C Values shown are the molar ratios of the corresponding derived alditol acetates, quantification is by d the use of the ECR(ref. 84) values.
All assignments were confirmed by g .l.c.-m.s.
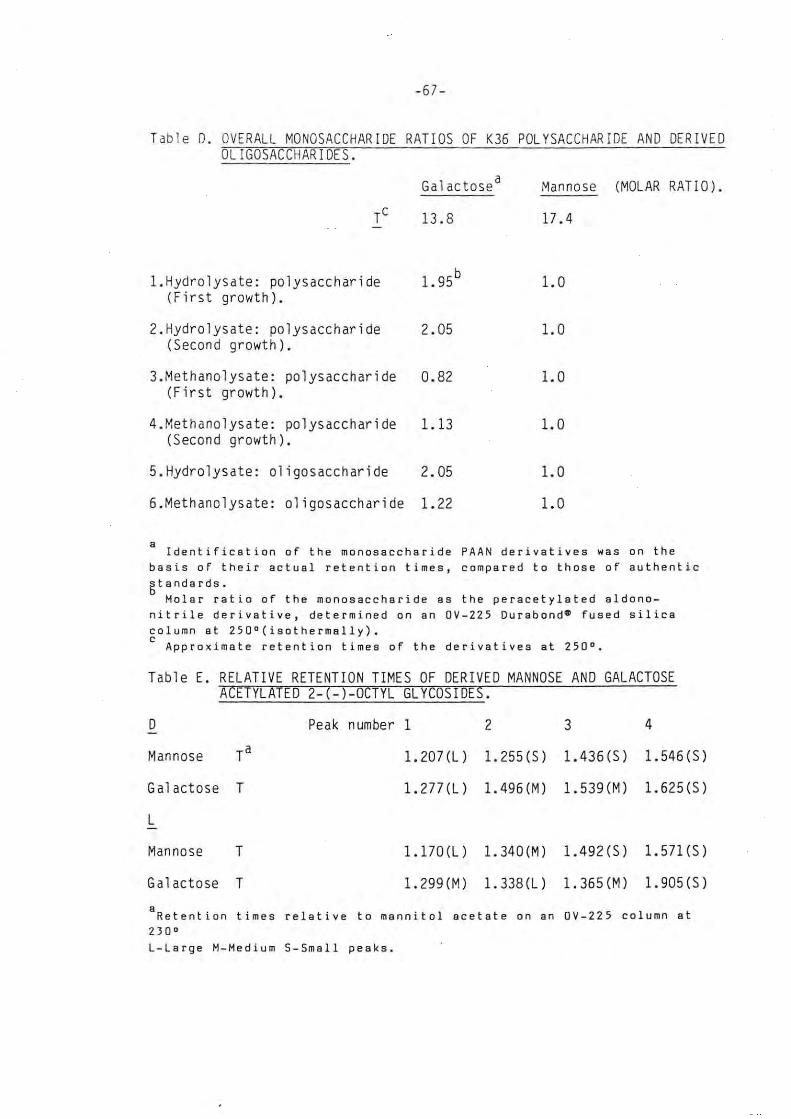
-67-
Ta bl e D. OVERALL MONOSACCHARIDE RATIOS OF K36 POLYSACCHARIDE AND DERIVED OLIGOSACCHARIDES.
Gal actose a Mannose (MOLAR RATIO).
13.8 17.4
1.Hydrolysate: polysaccharide 1. 9S b 1.0 (First growth).
2. Hydrolysate: polysaccharide 2. OS 1.0 (Second growth).
3.Methanolysate: polysaccharide 0.82 1.0 (First growth).
4.Methanolysate: polysaccharide 1.13 1.0 (Second growth).
S.Hydrolysate: 01 igosaccharide 2.05 1.0
6.Methanolysate: oligosaccharide 1.22 1.0
a Identification of the monosaccharide PAAN derivatives was on the basis of their actual retention times, compared to those of authentic gtandards.
Molar ratio of the monosaccharide 8S the peracetyleted aldononitrile derivative, determined on an OV-225 Durabond e fused silica column at 250 D (isothermally). c
Approximate retention times of the derivatives at 250°.
Table E. RELATIVE RETENTION TIMES OF DERIVED MANNOSE AND GALACTOSE ACETYLATED 2-(-)-OCTYL GLYCOSIDES.
D Peak number 1 2 3 4
Mannose Ta 1.207(L) 1.25S(S) 1.436(S) 1.546(5)
Gal actose T 1. 277 (L) 1.496(M) 1.539(M) 1.625(5)
L
Mannose T 1.170(L) 1. 340 (M) 1.492(5) 1.S71(5)
Galactose T 1.299(M) 1.338(L) 1.36S(M) 1.90S(S)
BRetent ion times relative to mannitol acetate on an OV-225 column at 230· L-Large M-Medium S-Small peaks.

-68-
I I I I
3.0~ o
I I I I I I I I I
2.0~ 0
I I I I I I I I I
1. oj I I I I I I I I
M 104
/ consumed a 4 8 12 16 20 24 28 32 36 40 44 48 I '-I 100 per mole repeat HOUR S unit
Graph 1.PERIODATE OXIDATION OF THE E.COLI K36 CAPSULAR POLYSACCHARIDE.

1. O~ I I I I I
0.5~
o
-69-
+
+
+
+ +
+ +"-+-+-+
45 50 55 ELUTION VOLUME
+NATIVE POLYMER in the acidic form.
60 mi
ELUANT:IM NaCI in water .
TEMPERATURE:Z3'± COLUMN:I.6x40cm GEL:Sepharose*4B CL
Profile I.E LUTION PROFILE OF THE POLYSACCHARIDE IN THE ACIDIC FORM.

-70-
~
"' ,. c c ~
~
~
~
~
~
m ~
~
~
'" ~
~
~
~
~
.,
co
,",. C C
~
q
~
~.
~
~
m ~.
~
.0
"' ~
o .0
~ ~
~ c..
~ co co CD
"" '" +-'
0 ~
0-
c:: 0 .-+-'
'" ~ (J)
'-'-0 u
>-(/)
0 u
-(J)
'-::J 01
LL.

-71-
v) EXPERIMENTAL
(a) General methods
Solutions were concentrated under reduced pressure at tem
peratures not exceeding 40°, unless specifically stated.
(b) Chromatography
For preparative and analytical paper chromatography, both by the
descending method, Whatman number 1 paper was used with one of the
following solvent systems as the eluant; viz.
(a). 8:2:1 v/v ethyl acetate, pyridine, water;
(b). 2:1:1 v/v I-butanol, acetic acid, water;
(c). 5:1:5:3 v/v ethyl acetate, acetic acid, pyridine, water;
(d) . 40:11:9 v/v I-butanol, ethanol, water.
Chromatograms were either developed with silver nitrate(17) or
periodate-benzidine(18) reagents. A Sepharose® 4B-CL gel column with
1M NaCl in water as the mobile phase was used for the molecular weight
determining gel permeation chromatography. A Hewlett-Packard 5890 A
gas-liquid chromatograph fitted with a flame ionisation detector
was used for analytical g.l.c. separations. A Durabond® fused sil ica
capillary column (30m x.25mm, wall coated with either .25~m OV-225 or
OV-17) was fitted. Integration of the signal output was by a
Hewlett-Packard 3392 A recording integrator. G.l.c.-m.s. was per
formed with a V.G. Micromass 16F spectrophotometer; spectra were

-72-
recorded at 40eV with an ion source temperature of 170°.
(c) Nuclear magnetic resonance spectroscopy
Proton magnetic resonance experiments on the samples (20mg±) were
recorded at 95° and, in some cases, at ambient temperature (30°) using
a Bruker WM 500 MHz FT spectrometer. Preparation was by dissolution of
the sample in 99.8% deuterium oxide followed by lyophilisation. This
was repeated three times after which single exchanges with 99.96% and
99.996% °20 followed. It was then run in 99.996% °20 with acetone (2.23
ppm_1H, 31.07ppm_13C) as the internal standard. (This was measured
downfield from aqueous sodium 4,4-dimethyl-4-silapentane for 1H_n. m. r •
spectra and from 055 for 13C n.m.r. spectra). In all cases except
where stated, all the 13C determinations were proton-decoupled
experiments.
(d) Optical rotation
The optical rotation of a filtered solution (8.0~m millipore LCWP
filter) of the sample was determined in a O.1dm cell at 23°(±2°) with
a Perkin Elmer model 141 polarimeter (sodium lamp).
(e) Polysaccharide isolation
A culture of E.coli 09:H19:K36 (culture no. A 198a) was obtained

-73-
from Drs. F. and I. Orskov and grown on Mueller-Hinton agar (see
Annexure 2) with 2% NaCl added. Five trays were used (1 . 51 of medium,
surface area: 1650cm2). The slime was harvested, diluted with an
equal volume of 2% aqueous phenol and the extraction was allowed to
continue for 20 hours (4°), whereafter the cells and debris were
removed by ultacentrifugation at 35K (5°) for 1BO minutes . The super
natant was added to a large volume of ethanol (6x that of the super -
natant) and cooled to 4° prior to the precipitate being removed . The
precipitate was then dissolved in water and precipitated a second time
using 5% cetyltrimethylammonium bromide to form an insoluble complex
with the acidic polysaccharide. After recovery, this complex was bro
ken by dissolving the precipitate in 3M NaCl, whereupon ethanol preci
pitation and several dialyses were performed to purify the
polysaccharide further . The polysaccharide (1.1743g) was obtained
finally as the solid sodium salt after freeze-drying the contents of
the dialysis bag .
(f) Bacteriophage depolymerisation
The polysaccharide (50Bmg) as the sodium salt was dissolved in a
250ml suspension containing 2.B x 1013 plaque forming units (PFU) of
the homologous K36 bacteriophage which had been isolated by methods
described previously . (102) (see page 94, this thesis) . This suspen
sion had been partially purified by dialysis (Mw cutoff 12 000 -14 000,
for 2 days) against tap water . The.· phage/polymer mixture was stirred

-74-
at 29 0 for three days with chloroform added to discourage bacterial
growth, after which time the mixture was freeze dried and the lyophi-
lisate (743mg) dissolved in SOml of distilled water and dialysed
exhaustively (Mw cutoff <8 000) against distilled water (five changes
of SOml each). The dialysates were combined, freeze dried and oligo-
saccharide PI was isolated by paper chromatography in solvent C.
Oligosaccharide PI (20mg/10ml water) was reduced to the
oligoalditol with NaBH4 (200mg). Excess borohydride was removed by
+ passage down an Amberlite® IR-120 (H) column, followed by additions of
methanol (2ml) and evaporation to dryness under reduced pressure
repeated several times.
(g) Analysis of the total sugar ratio
Hydrolysis of a sample (Smg) was effected with 2M TFA (2ml)at
1000 for approximately 16 hours, after which the TFA was removed and
the sample concentrated under reduced pressure. The 1 iberated sugars
were transformed into peracetylated aldononitriles (PAANs) using the
method described previously by Mc Ginnis. (21) Another sample (6mg) was
methanolysed with 3% anhydrous HCl (2ml) at 100 0 for approximately 16
hours under dry refluxing conditions and the acid neutralised with
PbC0 3 (100mg). Insoluble material was removed by centrifugation,
whereafter the solution was treated with NaBH 4 (200mg). Finally the
solution was passed down an Amberlite® IR-120 (H)+ column, methanol
added to the eluate (2ml x 4) which was concentrated under reduced

-75-
pressure. The methyl glycosides were cleaved with 2M TFA
(2ml,16h,lOOO) to release the free reducing sugars which were con
verted to PAANs. Analysis of the hydrolysate and methanolysate PAAN
mixtures was by g.l.c. on an OV-225 column at 225° (see Table D).
In addition, some of the underivatised hydrolysate and
methanolysate was also separated by paper chromatography using solvent
systems A,B,C,and D. In both cases, silver nitrate-sodium thiosulphate
was used to develop the chromatograms; monosaccharides were identified
by comparison with a standard containing all the commonly encountered
sugars, run concurrently with the sample.
(h) Determination of the absolute configuration of the sugar components
The D-/L- configuration of the monosaccharide units present was
determined by the g.l.c. analysis of the derived acetylated octyl gly
cosides on an OV-225 column. These were derived by reacting(34) the
free reducing monosaccharides from a hydrolysate (lOmg) and a methano
lysate (12mg) with 2(-)octanol (O.5ml,140°,18hr). Removal of the octa
nol was at 100° under reduced pressure and was followed by acetylation
(pyridine,acetic anhydride l:l,lOO°,lhr.) of the derived octyl glyco
sides. Analysis was on an OV 225 column at 230°. Assignments were
made by comparing the results with those in Table E.
(i) Methylation analysis
The polysaccharide (48mg, as the acid) was methylated under
-76-
Hakomor i conditions, (41) foll owed by the Kuhn methylation
procedure. (44) Hydrolysis of the permethylated polymer (26mg) with
2M TFA (2ml,100°,12hr) was followed by reduction with NaBH 4 (200mg in
5ml H20,lhr). The sol ution was passed down an Amberl ite illl IR-120
(H)+ column, whereafter, methanol (2ml) was added to the eluate which
was evaporated to dryness (repeated four times). Acetylation
(pyridine, acetic anhydride 1:1,100°,lhr) of the product afforded a
mixture of partially methylated alditol acetates.
Methylated polymer(23mg) was reduced with LiA1H4 (200mg) in
anhydrous tetrahydrofuran (4ml) at 23° (±2°) for 12 hours. The sample
was then heated to 65° for 16 hours under reflux conditions. Excess
L iA1H4 was removed by the addition of ethyl acetate (5ml) then water
(lOml). After acidification with tartaric acid (lOOmg), the
methylated and carboxyl reduced polysaccharide was extracted with
CHC1 3 (4X20ml). The extract was passed down an Sephadexilll LH 20
column, concentrated, hydrolysed, and derivatised. Analysis was on
an OV-225 column at 205° (see Table C).
The oligosaccharide PI (20mg) was treated under Hakomori
conditions(41) after being treated with NaBH4 (200mg) for an hour,
the permethylated oligoalditol was methanolysed using the same
procedure as detailed in section g. The free permethylated
monosaccharides from the oligosaccharide were converted into al ditol
acetate derivatives. (23) All permethylated alditol acetates were
separated and analysed by g. l.c on an OV-225 and OV-17 columns (205°)
(see Table C). Confirmation of these results was by g.l.c.-m. s.
analysis .

-77-
(j) Periodate Oxidation
A solution of the polysaccharide (1.5mg/ml) was mixed with an
equal volume of an 0.03M NaI0 4 solution. The reaction which was
allowed to proceed at 24°(±2°) in the absence of light, was monitored
spectrophotometrically for the NaI04 concentration, using a Beckman DB
u.v. spectrophotometer (214nm); by reference to a calibration curve
the moles of NaI04 consumed during the reaction were determined (see
Graph 1).
To 0.03M sodium metaperiodate solution (20ml) was added
polysaccharide (30mg in 20ml of water). The oxidation was monitored
spectrophotometrically and the reaction was terminated by the addition
ethylene glycol (5ml) after a single mole of periodate per mole Qf
repeating unit had been consumed. After dialysis for two days
(Mw cutoff 4 000), the solution was freeze dried and the material
recovered was made up to 50ml with distilled water and reduced with
NaBH 4 (100mg) for 12 hours, excess borohydride was neutralised with
20% acetic acid and the solution dialysed (3d,tap water,Mw cutoff 4
000) and freeze-dried. The freeze dried product (23mg) was 020
exchanged and analysed by 1H_n.m. r . spectroscopy (see Table A,IV and
Spectrum 4).

-78-
(k) Partial autohydrolysis (PA) of the polysaccharide
The polymer was converted to the acidic form by passage down an
+ Amberlite® IR-120 (H) column, the eluate was heated to 60° for 10
minutes, dialysed (Mw cutoff 12 000) for 24 hours against tap water and
then the contents of the dialysis bag were freeze-dried.

5 THE PREPARATION AND N.M . R. STUDY OF THE REPEATING UNIT OF
KLEBSIELLA K68 POLYSACCHARIDE

-79-
5 THE PREPARATION AND N.M.R. STUDY OF THE REPEATING UNIT OF KLEBSIELLA K68 POLYSACCHARIDE
i ) ABSTRACT
The Klebsiella K68 acidic capsular polysaccharide was treated
with the homologous Klebsiella K68 bacteriophage which was isolated
from sewage . This bacteriophage, which possesses an endoglycanase that B
cleaves Galp(1-2)Galp A bonds, produced several oligosaccharides. The
oligosaccharides correspond to the repeat unit of the intact poly-
saccharide and multiples thereof. The structure of the smallest oli-
gosaccharide, designated Pl, which corresponds to a single intact
repeat unit, was found to be as follows : m m m m~
(pyruvalated)-Manp(1 -3)Galp A(1-2)Manp(1-3)Gal -OH Pl
This tetrasaccharide, without pyruvate, was isolated during the struc-
tural elucidation of the E.coli K36 acidic capsular polysaccharide.
ii) INTRODUCTION
Stirm demonstrated(74) that there are bacteriophages which are
speci f ic for En t erobacter i aceae K strains and these often possess gly
cosidases that depolymerise the acidic capsular polysaccharides . Each
of these enzymes i s specific for one or a few capsu l ar polysacchari-
des . The products of the depolymerisation are oligosaccharides that
cons i st of either one or more repeating units of the polysaccharide
and these can be valuable i n the study of the capsular polysaccharide .

-80-
The capsular polysaccharide of Klebsiella K68 has been reported(70)
to have a pyruvalated tetrasaccharide repeating unit, which is composed
of D-galacturonic acid and D-mannose and D-ga l actose in the ratio of
1:2:1. The polysaccharide structure, which was established(70) by
methylation analysis, Smith degradation, and partial hydrolysis
studies, is as follows: 8 cr cr
-[-D-Gal p(1-2)-D-Gal pA(1-2)-D-Man p(1-3)-J-4 Icr 1
D-Man p
During the partia l hydrolysis study only non-pyruvalated
oligosaccharides were isolated. We now report on the production of
the intact pyruvalated tetrasaccharide repeating unit (PI) of K68 by
bacteriophage depolymerisation, its isolation by gel permeation chro-
matography and on the n.m.r . spectroscopic study of Pl.
iii) RESULTS AND DISCUSSION
The propagation of the Klebsiella K68 bacteriophage on its host
proved difficult as the titre of the phage suspensions from the flask
lyses (at 37°,dialysable P medium(102)(see Annexure 2)) was approxima
tely 1 x 10⁸ plaque forming units(PFU)/ml. (In general ,for a selective
enzymic hydrolysis approximately 250ml of a 4 x 10¹⁰ PFU/ml suspension
is required to depolymerise one gram of polysaccharide). It appeared
that the copious quantities of capsule produced by the Klebsiella K68
bacteria (capsular polysaccharide was harvested from a culture in high
yield- 560mg per litre of solid medium(35)) and the slow growth
characteristic of this strain adversely affected the ability of the

-Sl-
phage to adhere to the bacteria and to multiply. Several attempts
were made to improve the yield of the phage. The lysis was carried
out at 29° as it was noticed in this laboratory, that K6S grew
faster at this temperature. However, there was no appreciable
improvement in the titre of the product. The host was grown in a
carbon restricted medium (see Annexure 2) at 29° and, again, the
result was the same (titre: 1 x lOS PFU/ml). It was unlikely that we
were going to get a sufficiently concentrated phage solution from a
flask lysis. Consequently, all the phage suspensions were pooled
(2 SOOml, 9 x 10⁷ PFU/ml) and concentrated to a vol ume of 250ml and a
titre of 1 x 10⁹ PFU/ml, by dialysis against a saturated solution of
polyethlene glycol 6 000. Although there were only 2.5 x lOll PFU
this suspension was used to depolymerise the polysaccharide (500mg),
for, even though the yield of PI was low, about 40%, this was
outweighed by the advantage of obtaining other useful oligosaccharides
(P2 etc.).
Af ter depolymerisation (three days,29°) the saccharide/phage mix
ture was freeze dried. The crude lyophilisate, when examined by ana
lytical gel permeation chromatography on a Biogel® P4 col umn at 50°
and at ambient temperature (24°) showed four and three distinct peaks
respectively (see Profiles 2 and 3) . This material was dialysed
against distilled water and low molecular weight material (less than
4 000) from the dialysate, corresponding to the first, second and third
days of dialysis and the contents of the dialysis bag, were separated
by preparative ge l permeation chromatography on a Biogel® P4 column

-82-
(see Profiles 3-6). The eluate corresponding to the slowest eluting
peak was collected and lyophilised; carbohydrate material from this
fraction was shown by n.m.r. analysis to be oligosaccharide Pl.
Higher oligosaccharides were isolated, but were not investigated
further. Oligosaccharide PI was subjected to a series of n.m.r.
experiments (see Tables F and G).
The spectra obtained from lH_ and l3C_n. m. r . analysis of PI were
clear and the information obtained, particularly when considered in
conjunction with the data from K68 polysaccharide, was unambiguous.
Previous analyses(70) of the K68 polysaccharide had shown a B
galactose as well as galacturonic acid and two mannose residues which
were all of the alpha anomeric configuration. Comparison of the
lH_n.m.r. spectra of K68 polysaccharide (Table F,I) and of K68 PI
(Table F,II) shows that a B linkage has been cleaved by the phage enzyme
and this establishes the galactose as the reducing terminus of Pl.
From a methylation analysis, (70) we know that, with the exception of
the attached pyruvate group and the B galactose linkage at 0-2 instead
of 0-3 of the galacturonic acid residue, the linkage, sequence and
composition of the Klebsiella K68 and E.coli K36 polysaccharide are
the same. Since the B galactose linkage has been cleaved, PI has the
same linkage and sugar sequence as PI from K36 polysaccharide.
Comparing the lH_n.m.r. data from both oligosaccharides (Tables A and
F,Spectra 2 and 10) a few differences were apparent. These can be
ascribed to the influence of the pyruvate moiety, since this is the
only difference between the two oligosaccharides.
Although the majority of the non-anomeric signals are contained
-83-
in a region approximately 1 ppm wide, a few are shifted downfield
into the anomeric region. For example, it has been shown that the
H-5 glucuronic acid signal resonates in the anomeric region, especially
when the anomeric configuration is a-D-. (103) The presence of these
signals has led to a degree of confusion over signal assignments. In
the structural elucidation of Klebsiella K17 Dutton and Folkman found
that the spectrum of the polysaccharide was difficult to interpret as
there were six signals present between 4.5 and 5.5 ppm one of which
was a non-anomeric signal. They assigned the signal at 4.60 ppm to
the B-D-glucose residue. (103) However, as mentioned by the
authors, (103) the coupling constant of 10 Hz is larger than that
normally associated with B-D-glucose. Thus, the possibilty exists
that this signal and the H-5 glucuronic acid signal have been
incorrectly assigned. To confidently assign the non-anomeric signals
in the oligosaccharide IH_n•m•r • spectra, a two dimensional
correlation (20 COSY) experiment was performed upon the
Oligosaccharide PI (depyruvalated). The 20 COSY experiment, by way of
a connectivity plot linking all coupled protons with their
symmetrically displaced off-diagonal responses, identifies coupled
protons and it is possible to positively assign signals on the basis of
their couplings. The PI spectrum has two non-anomeric signals in the
region 4.4 to 5.5 ppm, that is, there are a total of seven signals in
the anomeric region. From the 20 COSY (see Spectrum 13) it was
evident that both non-anomeric resonances arose from the a-D-
galacturonic acid. The one (4.73 ppm), identified from the
correlation plot as the H-5 proton of the uronic acid, has been

-84-
assigned as such before, (70) the second signal was assigned as H-4 of
the acid. These assignments were confirmed by the expanded scale plot
of the 1D spectrum; H-4 (double doublet) and H-S (doublet) both have a
coupling of 1. S Hz, values which are consistent for a galacturonic
acid H-4 and a H-S signal. (104) The H-2 resonance signals of both
mannose residues could be unambiguously identified and it is
noteworthy that a 2-0- linkage has a downfield effect of .17 ppm on
this signal, but does not shift it into the anomeric region.

-85-
iv) CONCLUSION
When a suitable molecular weight range gel is available, gel per-
meation is an appropriate means of separating the oligosaccharides
produced by bacteriophage enzyme hydrolysis, allowing not only the
recovery of the PI oligosaccharide but also the recovery of P2 and
P3 oligosaccharides. These can be used during a structural analysis to
provide complementary data to that obtained from the PI molecule.
In concurrence with the n.m.r. results, the structure of the oli-
gosaccharide PI, produced by the action of the viral endogalactosidase
on the Klebsiella K68 capsular polysaccharide, is as follows:
'" '" '" ", I f3 Manp(I-4)Galp A(I-2)Manp(I-3)Gal-OH X
pyr
This is in agreement with the structure aSSigned to the
Klebsiella K68 capsular antigen by Dutton et al. (70)

Table F.1H_n.m.r. data a for Klebsiella K58 polysaccharide, derived 01i90- and polysaccharides (500 MHz) .
I.OLIGOSACCHARIDE Pl:derived from the depolymerisation of the capsu lar polysaccharide with a phage-borne endogalactosidase.
Chemi ca 1 sh ift (ppm)
1.58
4.44
4.48
4.53
4.71
4.73
4.90
4.94
S .13
S .16
S.23
S.27
S.28
S.29
~
11,2 (Hz)
7.S
~
Integral (H)
2.2
0.9
0.3
0.4
0.8
0.2
0.7
0.3
0.2
O.S
1.1
~
Assignment
CH 3 of Pyruvate 4 a . d
H-4 of -Gal A- .......... Pyr
4 a H-4 of -Gal A-
3-Gal~OH
H-S of 4_Gal A!! .......... Pyr
f 4 a H-S 0 -Gal A-
Man!!
Man!!
2 "'" e -Man-balf-OH
2-Man~alf~H 2 a C -Man-
2 -Man!!
4_ Gal A!!
3_Gal <:!OH
•••••••.•• P yr
••••••••••• P yr

II.OLIGOALDITOL PI:oligosaccharide PI reduced with NaBH4.
Chemical shift lI,2 Integra 1 Assignment (ppm) (Hz) (R)
Amb ie nt temperature 95°C Ambient temperature 95°C
1. 58 1. 58 2. 9 1.3 CH 3 of Pyruvate
4. 43 4.43 1.1 0.7 4 '" H-4 of -Gal A- .......... Pyr
4. 47 0. 5 4 '" H-4 of -Gal A-
4.72 0.4 4 '" H-5 of -Gal A- .......... Pyr
4.74 0.6 4 '" H-5 of -Gal A-
4. 86 4.89 1 0.7 Man.:" ..... ... .. P yr
4.93 0.4 '" Man-
5.24 5.21 1.0 1.1 2 '" -Man-5.28 5.27 0.9 0.4 4 '" -Gal A-
5.29 0.6 4 '" -Ga l A-

III.PARTIALLY AUTOHYDROLYSED NATIVE POLYMER. e
Chemical shift (ppm)
1.68
4.52
4.65
4.72
4.95
5.21
5.46
~,2 (Hz)
7.5
Integra l (R)
0.3
1
1
1
1
1
1
Assignment
CH 3 of pyruvate
H-4 of 3,4_Gal A~
3_Gal Jl
H-5 of 3,4_Gal A~
Man~
2 -Man~
3,4_Gal A!'-
a bSignals tabulated and assigned are those of protons with a chemical shift between 4.3 ppm. and 5.5 ppm.
Chemical s h i ft downfield from 4,4-dimethyl-4-silapentane-l-sulphonate(DSS), measured from acetone (2.23 ppm.) as the internal standard. c The symbols 2_Man~, r efer to the anomeric proton signal of a 2-0- linked mannosyl r esid ue in the aanomeric configuration. The absence of 8 numerical prefix, as in Man-, indicates a non-reducing
aerminal group. Resonances from protons in the oligosaccharide wh en a pyruvate is attached to the molecule.
eReference 70.

Table G. 13C_n.m . r. data a for Klebsiella K6B polysaccharide, derived oligo- and polysaccharides (100MHz) .
I.OLIGOSACCHARIDE P1:derived from the depolymerisation of the capsular polyasaccharide with a phage-borne endogalactosidase.
Chem i cal shift b (ppm)
Assignment
25.45 CH 3 of Pyruvate
93.01 3 -Ga 1 '=OH
95 . 01 2 '" 1 '" -Man-Ga -OH
95 .39 2-Man~Gal~OH
97.14 3_Gal~OHc
100.76 Man.:"
101 . 76 Man.:" . ••• ....... P yr
102.51 4 1 ", -Ga A-
103.06 4 1 '" -Ga A- ..••..••••. P yr
173 . 16 COOH of 4_Gal A.:"
174 . 01 COOH of 4_Gal A.:" • • •• P yr

II.OLIGOALDITOL P1:derived by reducing oligosaccharide PI with NaBH4•
Chemical shift ( ppm)
25.27
99.97
101.24
102.70
172.54
Assignment
CH3
of Pyruvate
2 a -Man-
Man~
4_Gal A'!:
COOH of 4_Gal A'!:
:5i gn819 tabulated and assigned are of those carbons with a chemical shift between 90 ppm and 180 ppm. Chemical shift downfield from DS5, measured from acetone as the internal standard (37.07 ppm).
c The symbols J_Gal~ refer to the signal of the anomeric carbon of 8 3-0- linked galactosyl residue in ahe B-configuration.
These are the resonances from carbons in oligosac charid es where a pyruvate group is attached.

i v ) •
1. o~ I I I I I I I
0.5~ I I I I I I
0
-91-
COLUMN 1.6 X 40cm .
P4 etc.
P3
PI
P2
30 50
VOID:50ml TUBE VOLUME: 5ml
ELUANT : py r idin i um acetate TEMP:50'
55 60 TUBE NUMBER
Profile 2 .ANALYS IS AT 50' OF THE CRUDE PRODUCT FROM K68 ENZYMIC HYDROLYSIS.
1. O~ I I I I I I I
0.5~ I I I I I I
0 30 35
VOID:70ml TUBE VOLUME: 5ml
P3 etc.
\
PI
P2
40
ELUANT:pyridinium acetate TE MP:24'
55 60 TUBE NUMBER
Profile 3.ANALYSIS AT 24' OF THE CRUDE PRODUCT FROM THE K68 ENZYMIC HYDROLYSIS.

1. 0-1
I I I I I I I
0.5-1
I I I I I I
-92-
P3 etc.
P2
o ~I ~ ________ ~~ __ ~ __ -= ________________________ __ 30 35
VOIO:IOOml TUBE VOLUME:IOml
40 45 50
ELUANT:pyridinium acetate TEMP:23'±2'
Profile 4.MATERIAL FROM THE SECONO DAY OF OIALYSIS.
55 60 TUBE NUMBER

VOIO:IOOml TUBE VOLUME:lOml
-93-
ELUANT:pyridinium acetate TEMP :23'±2'
Profile 7.CONTENTS OF THE DIALYSIS BAG.

-94-
vi) EXPERIMENTAL
The procedures used in the structural study of Klebsiella K68
capsular polysaccharide were essentially the same as those used in the
elucidation of the E.coli K36 antigen; and therefore, only those methods
which differ will be discussed.
(a) Bacteriophage isolation
To isolate a suitable bacteriophage a 10ml culture (6hr. old) of
Klebsiella K68 (obtained from Drs. F. and I.0rskov,Copenhagen) was
added to 10ml of sewage (from Port Elizabeth) and 50ml of nutrient
broth (see Annexure 2). This was shaken at 37° for six hours, after
which a small amount (5ml) of chloroform was introduced. The bac
terial cells and other debris were then removed by centrifugation (15K
x 10min.), leaving a clear supernatant containing the bacteriophages.
Bacteriophage activity was tested for by applying a drop
(approximately 0.006ml) of the supernatant ( 10- 2 to 10-8 serial
dilution of the suspension in saline) to a fresh l awn of the host bac
terium (Mueller-Hinton agar plates seeded wi th Klebsiella K68).
As a control a drop of pure saline was applied to a lawn and incubated
at 29° . After 12 hours at 29° the plates were inspected for clear
areas i.e. plaques. Whereafter, in order to purify the bac-
teriophages found, a single plaque with a large halo was picked from
the the 10-6 dilution plate and added to a nutrient broth tube (5ml),
freshly innoculated with the host strain. This bacteriophage/host

-95-
mixture was centrifuged (with 1ml chloroform added) after incubation
at 37° for six hours. A pure line of the phage was established by
successive single plaque isolations. Assays of the phage containing
suspensions were done by applying a known volume of a serial dilution
to a fresh lawn of the host, which was incubated at 29° for 12 hours.
Plates with between 30 and 300 plaques, had the number of plaques
counted. After the dilution was corrected for, the titre of the
. suspension was quoted from these numbers as plaque forming units (PFU)
per ml of suspension.
The titre and volume of the bacteriophage were increased first by
a tube lysis and then several flask lyses. Tube lysis involved inno
culating six 10ml nutrient broth tubes with 1ml of a six hour old bac
terial cell culture after which at 0, 15, 30, 45, 60 and 75 minutes
successive tubes were innoculated with O.lml of the purified phage
suspension. Those tubes that cleared after several hours were treated
with CHC1 3 to kill any remaining bacterial cells and centrifuged (15K
x 10 min.) leaving pure phage suspension in nutrient broth. A flask
lysis represents the same procedure on a larger scale. All volumes
used were scaled up five times, thus 5ml of the bacterial cell culture
is added to 50ml of medium and 0.5ml of the phage solution is added
after the various time intervals. The medium used for the flask lyses
was dialysable P-medium (see Annexure 2).
The flask lyses were repeated until there were approximately
2.5 x 10¹¹ plaque forming units (PFU), in 2800ml. However, the

-96-
vol ume of t his suspension was too large and was reduced by removing
the water by osmosis. The method applied in the case of Klebsiella
K68 homologous bacteriophage was to put the suspension into a dialysis
tube (Mw cutoff <4 000) and this was then suspended in a saturated
solut ion of polyethylene glycol 6 000. The final suspension was
further dialysed against tap water in an attempt to purify the phage
solution before it was added to the polysaccharide.
(b) Bacteriophage deploymerisation of the polysaccharide
A sample (500mg) of the pure Klebsiella K68 capsular antigen
was treated with 250ml (109PFU/ml) of the bacteriophage suspension.
After incubation with stirring at 37° for three days with CHC1 3 included to act as a bactericide, the mixture was freeze dried. The
lyophilisate (770mg) was made up to 50ml with distilled water and then
dialysed (M cutoff <4 000) against 50ml of distilled water for 24 w hours. This was repeated twice. In each case the dialysate was
lyophilised and retained separate from the the other fractions.
Four fractions, viz. the contents of the dialysis bag (153mg) and
dialysates 1 (161mg),2 (120mg) and 3 (155mg), were separated on a
Biogel® P4 column (2.6 x 40cm, 20ml/hr) using pyridinium acetate
(water,acetic acid,pyridine 500 :2:5) as the eluant. A better separa
tion of the oligosaccharides was effected by elevating the column tem-
perature to 50° with a water jacket. After the elution profile was

-97-
determined by spectrophotometric analysis (at 490nm) of samples
treated with phenol-sulphuric acid reagent, those fractions identified
as containing carbohydrate material were lyophilised and retained.

6 THE STRUCTURES AND COMPONENTS OF THE E. COLI CAPSULAR ANTIGENS
REPORTED IN THE LITERATURE

-98-
A. PUBLISHED E. COLI K ANTIGEN STRUCTURES.
Where more than one structure has been reported for a single K antigen, the one mos t recently reported is shown.
Kl.(106)
-[-8)N acetyl neuraminic acid(2-J-
K2. (07)
-[-P-4-Galp(1-2)Glyc(1-3)-J- .... -[-P-4-Galf(1-2)Glyc(1-3)-]-
K5 . (97)
-[-4)Glc A(1~4)Glc N Ac(l~J-
K6 . (107)
-[-2)D-Ribf(1~2)-D-Ribf(1~7)-D-KDO(1~J-
K7. (108)
-[-3)D-Man B B N Ac A(1 - 4)-D-Glc(1-J-6 I OAc
K 12. (08)
Rha(1~2)Rha(1~5)KDO(2-[~3)Rha(1~2)Rha(1~5)KDO~J-phosphodiester-phosphatidic aci d 7(8) 7(8) I I
OAc OAc
K13. (110)
-[-3)Ribf(1~7)KDO(2~J -4 I OAc

-99-
K14. (l09)
-[-6)-2-aeetamido-2-deoxy-D-Galp(l~5)KDO(2~J-
K20. (110)
-[-3)Rib!(l~7)KDO(2~J-5 I OAe
K23. (110)
-[-3)Rib!(l§7)KDO(2§J
K27. (75)
-[-4)D-Gle(l~3)-D-Gle A(l~3)-D-Fue(l~J-3
I" 1 D-Gal
K28. (l00)
-[-3)-D-Gle(l~4)-D-Gle A(l~4)-D-Fue(l~J-4 3 Ie I 1 OAe
D-Gal
K29.(69)
-[-2)-D-Manp(l~3)-D-Glep(l~3)-D-Glep A(l~3)-D-Galp(l~J-4
I" 1
D-Manp 2 Ie 1
D-Glep X
4 6 Pyr

K30.(113)
-[-2)-D-Manp(1~3)-D-Galp(1~J-3
I" 1
D-Galp 3 III 1
D-Glcp A
K32(A). (114)
-[-3)Glc(1£'4)Rha(1£'3)Gal (1£'J-3 III + OAc 1
Gl c A
K40. (112)
-100-
-[-4)Glcp A(1~4)-2-acetamido-2-deoxy-D-Glcp(1~6)-2-acetamido-2-deoxy-D-Glcp(l~J -I
L-Serine
K42. (115)
-[-3)Gal (1-3)Gal A(1-2)FucO-J-
K52. (09)
-[-3)Galp(1~ J -0-P=O 2 I
11 (0-) Frucf ........ . + OAc or 0 propionate
K54. (116)
-[-3)-D-Glc A(1~3) -L-R ha(1~J-6 I Threonine(90%) or Serine(10%)

-101-
K62. (07) ....... (see K2)
-[-P-4)Galp(1~2)Glyc(1(3)-J- ........ -[-P-5)Galf(1~2)Glyc(1(3)-J-2(3) 2(3) I I OAc OAc
K87. (117)
-[-4)D-Glc A(1~3)-L-Fuc N Ac(1-3)-D-Glc N Ac(1-6)-D-Gal (l-J-4
K92. (118)
-[-8)NANA(2~9)NANA(2~J-
K95. (111)
-[-3)-D-Rib(1@8)KDOf(2-J-
K100. (119)
-[-P02-D-Ribf(1-1)-D-Rib(5-J
IOH
III 1
D-Glc

-102-
B. COMPONENTS OF THE E.COLI CAPSULAR (polysaccharide) ANTIGENS.
K antigen acidic/amino sugars neutral sugars other Gal Glc Man Fuc Rha Rlb Fruc
K1 NANAe
K2a Gal A, bGal
+ glycine K4 NC + K5 GlcdA, Glc N Ac K6 KDO +
OAc f K7a Man N Ac A + K8 Glc A, Gal N, Gl c N + K9 a NANA, Gal N + K12 KDO + phosphatidic acid
and OAc K13 KDO + OAc K14 KDO, + acetami do K17 a Gl c A, Gal N + K20 KDO + OAc K23 KDO + K25 a Glc A, Gal N + K26 a Glc .A + + K27 Glc A + + + K28 Glc A + + + OAc K29 Glc A + + + pyruvate K30 Glc A + + K31 a Glc A + + K32 Glc A + + + OAc K34 a Glc A, Gal A + + + K40 Glc A + acetamido/serine K42 Ga 1 A + + K52 + + OAc/propionate K54 a Glc A + Threonine/serine K57 Ga 1 A, Gal N + K62 + glycine/OAc K85 Glc A, Glc N K87 Glc A, Glc N Ac, Fuc N Ac+ + K92 NANA K95 KDO + K100 + Phosphate
a b-Reference 05. -Galacturonic acid.
e . d-Galactosamlne. .
acid. -3-deoxY-D-manno-octuloson 1 c e
acid. -N-acetylneuTaminic f-O acetyl group.

7 ANNEXURE 1

-103-
ANNEXURE 1
A NUCLEAR MAGNETIC RESONANCE SPECTRA
i) E.coli K36 proton magnetic resonance spectra
(I)-Oligosaccharide PI run at ambient temperature.
(2)-01igosaccharide PI run at 95°.
(3)-01igoalditol PI run at 95°.
(4)-Partially autohydrolysed native polysaccharide run at 95°.
(5)-Periodate oxidised polysaccharide run at 95°.
ii) E.coli K36 l3C resonance spectra
(6)-01igosaccharide Pl. a
(7)-01igoalditol Pl.
(8)-01igoalditol PI proton coupled spectrum.
(9)-Partially autohydrolysed native polysaccharide.
iii) Klebsiella K68 proton magnetic resonance spectra
(lO)-Oligosaccharide PI run at 95°.
(ll)-Oligoalditol PI run at ambient t emperature .
(12)-01igoalditol PI run at 95°.
(13)-Two dimensional COSY plot for the oligosaccharide Pl . (Figure I)
iv) Klebsiella K68 l3C resonance spectra
(14)-01igosaccharide Pl.
(15)-01igoalditol Pl.
a 13 Except where specifically stated, all C spectra were run as proton-
decoupled experiments.
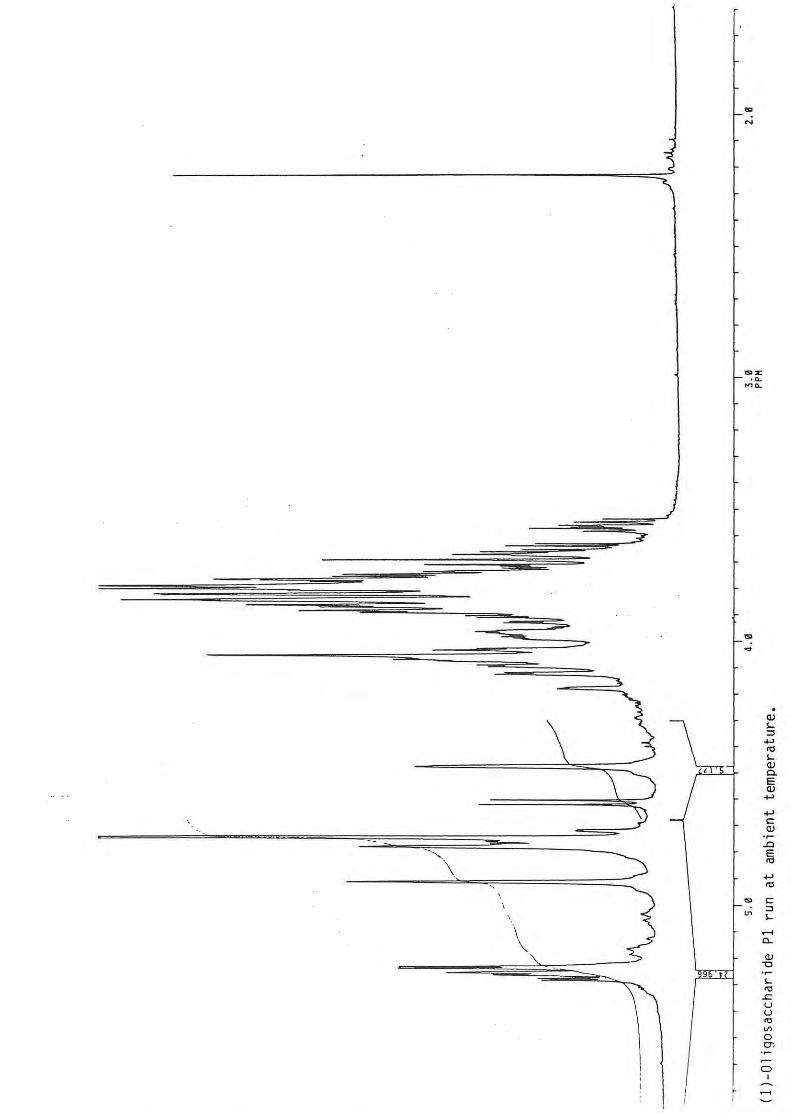
'" N
'" .... '" ..., '" .... (lJ Co E
'" ..., ..., " '" ..0 E
'" ..., '"
'" " ~ '" ....
.-< "-
'" -0
.... '" ~ u u
'" '" 0 en
0
" -

---=-
--
~ =--
.=-
........ "
\-~\
", - -
~~
\-\ -
"~ ' . "" "
"
-
I
")
j
~ ~
J
d '\
:-
r~ N
mx f- .~ "'~
r~ ~
;m::rrf-~ ~
f.
0 LO en
..... "-O!
" !-
'" .r:: u u
'" '" o C>
o I
N
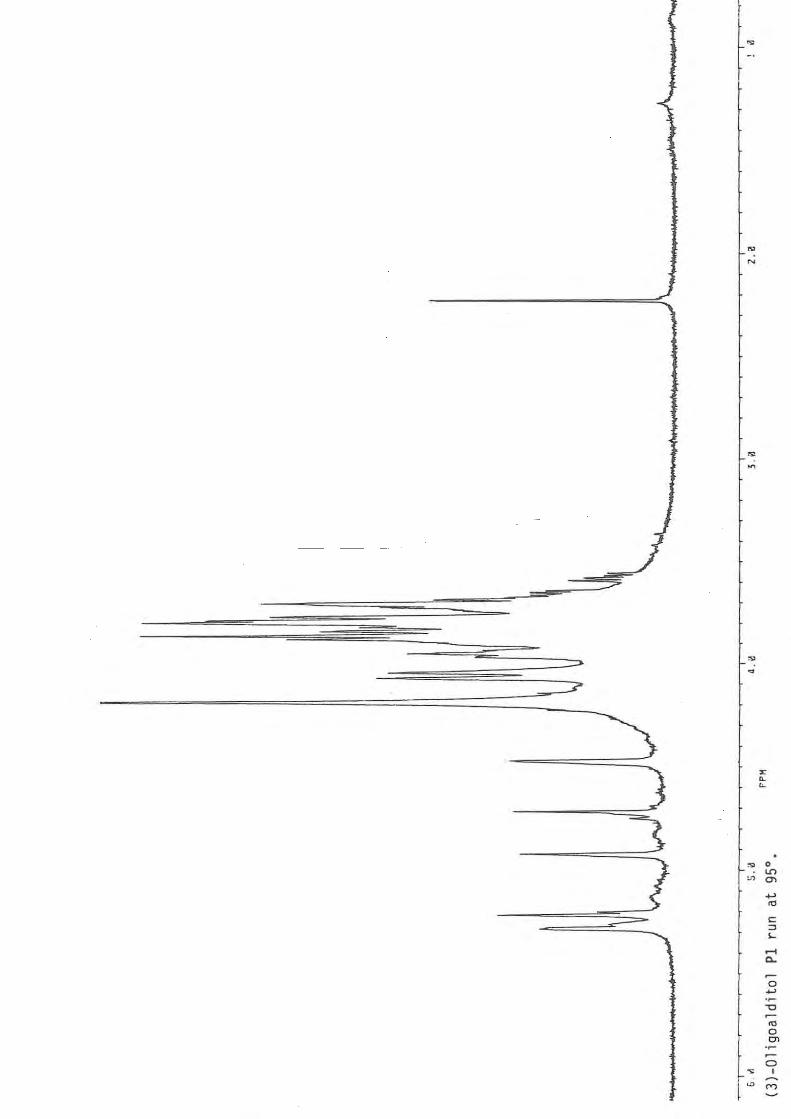
s 0
'" ~ a-..... '" c ::> '-
.-< 0..
0 ..... -0
'" 0 0>
0 ~ I
l ~ M

0
'" en
+-' nO
c: ~
<-Q)
"0 ., <-
~ nO .c u u nO
'" >, ~
0 C-
Q)
> +-' nO c:
"0 Q)
'" >,
0 <-
"0 >, .c 0 +-' ~ ., nO
~ >,
~
nO
+-' <-nO "-
I
""

, .
o Ln
'" en Q ....,
'" c " '-(lJ
"0
''" ..c u u
'" V> >.,
o c..
"0 (lJ V>
"0
X o
J'_...!.. lSI Q)
...., V> '"
"0 o
'(lJ
C>-O

IS>
"" If'
..... Cl.
." Q)
C "0 .~
cD I-
'" .<= u u
'" V> 0
U 0>
f~ 0 I
\D
r

'" '" ~
..... 0-
'" 0
'" ...,
~
"0 ~
<0 0 en
'" '" 0 · w
I
.....

~ E .. ::l ... ...., u OJ
~ C. ~ V> ~
"0 QJ ~
C. ~ ::l
0 ~ u ~
c:: 0 ...., 0
~ ... c. ~ C>-
~ 0 ...., ~ ro "0
'" 0 0>
'" ~
0 m I
OJ

o co C)
t~ I co ! , ,J
OJ -0
''" .<: u u
'" '" >,
o a. OJ > ~
'" c: -0 OJ
'" >,
0 '-
-0 >,
.<: 0 ..... '" '" >,
~
'"

\
----
,
o en "" ..... <d
C ::J I-
...... "-
'" U
ln:>
..c "'u ~u
<d
'" o 0>
C) I

-
J
>
'" . =
~. Q) ... " ...., '" ...
1 Q) c. ---. E
\ Q) ...., ;I
~,-. ...., c: 1-- .... Q)
"-... } I .0 ! E ......... '"
+-'
'" c: C:::::- .. : - - "
~ ...
--\ ...... 0..
~ 0
L ....,
~ .~
"0 ~
'" 0 1'- . en
! .~
~
>- f 0 , )
I
\ ! ~
J ......
\ ...... ,

N
l 0 U')
0\
+"'
'" c:
'" '-...... C>-
O +"' .~
~ "0 ,0 ~
'" 0 0> .~
0 I
N ......
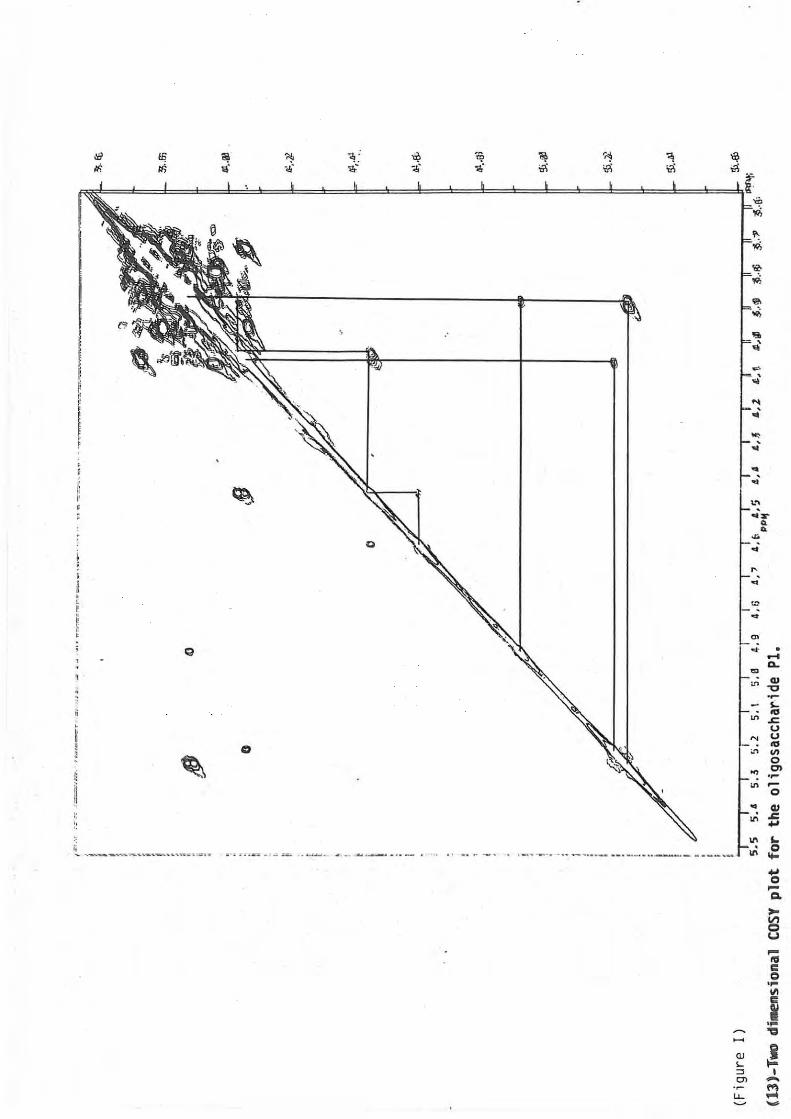
o
Q.J \.. :::I en u..
.. ..
.., •• .. .. ,~
"r " .. ... ....
" ....
'" .;
'" .; . .... .... '" ~
QJ "0 .~
'-on ..
.£; u
'" u .. ." en
0
'" '" .~
on ~ 0 .. QJ .£; .. .. of .. 0 .... CI.
>-~ u .... .. c: 0 .... '" c: W ....
-.::I
! I ....
f"l ... '"'
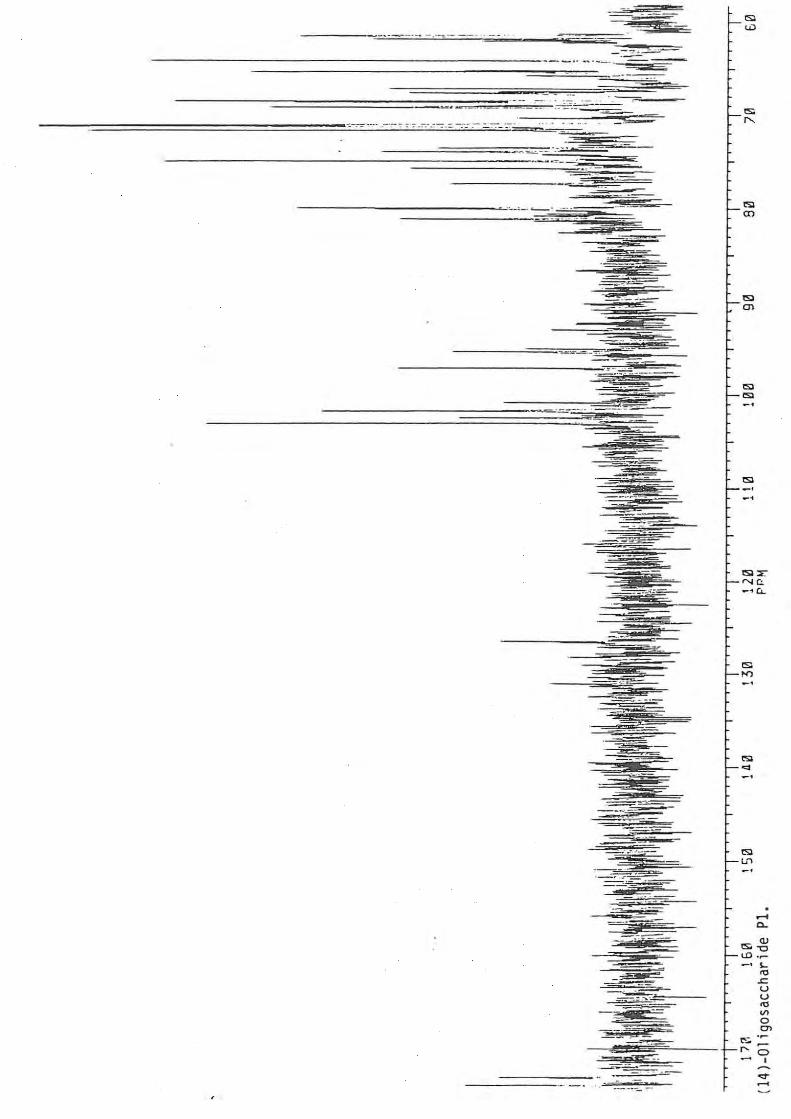
.~ -
.- -.---.-.
--_. -:.----= ----.-.
~ .. -.. . ... , ..... ~ "-_ ."'--:- ':':7-
IS> en
IS> <Sl -.
-'
tSl U1
.-. C>.
'" ""-0 <D .~ _. '-
'" .c u u
'" '" o en
"'::. ""0
I
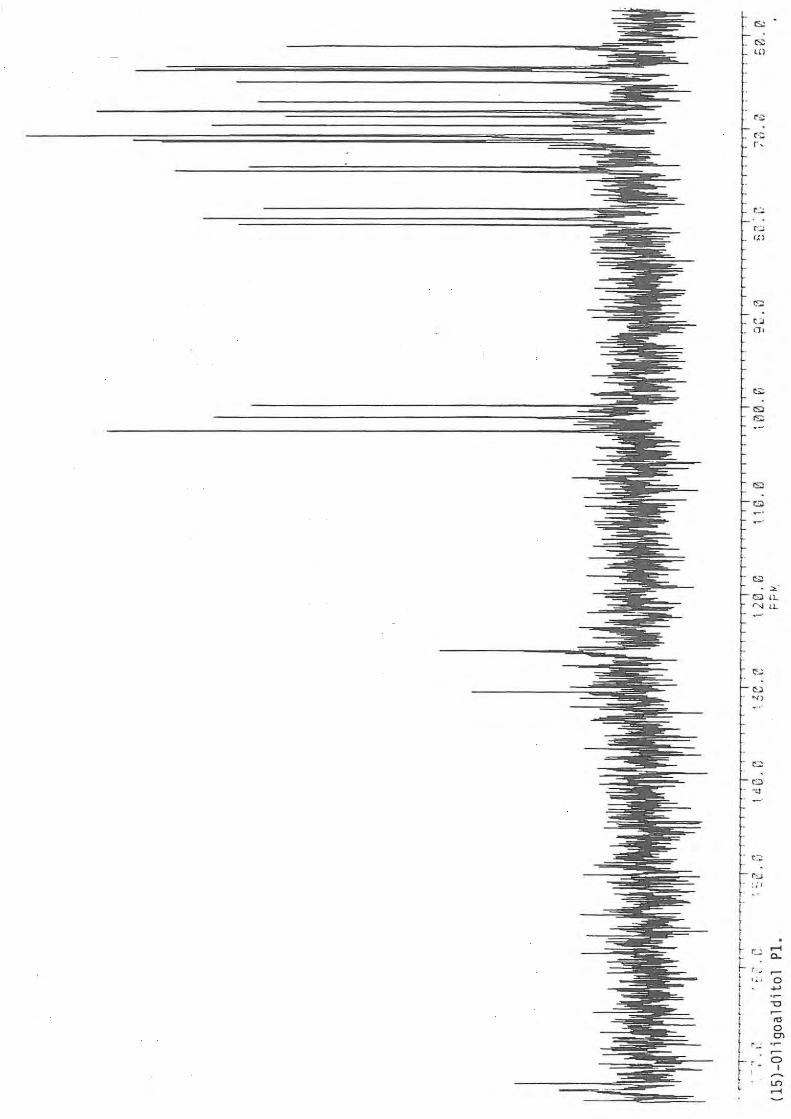
F~ . :; ,
r l f .... r.:...;
"'-" i- e" , ,~ ; 0 , , ....,
i -0 i ~
l '" 0 I en ! e~
r 0 . . I
In i ....

8 ANNEX URE 2

MEDIA .
A. Mueller Hinton Agar.
Meat i nfus i on
Casein hydrolysate
Starch
Agar
B. Mueller Hinton Broth.
Meat i nfus i on
Casein hydro lysate
Starch
C. DIALYSABLE P MEDIUM. (lOS)
Glucose
Casamino acids (Difco® BZ30)
L-tryptophan
L-cysteine
KH ZP04 NaZHP04·12HZO
NH 4Cl
Gelatin
MgS04·7H20
FeS04 CaC1 2
-104-
gil
5. 0
17.5
1.5
14.0
gil
5. 0
17.5
1.5
gil
5.0
5.0
0.32
0.24
Z.O
12.48
1.04
0.008
0.5
0.001
0.1

-105-
D DIALYSABLE P-MEDIUM (carbohydrate restricted)
Glucose
Casamino acids(Difco® B230)
L-trptophan
L-Cysteine
KH/04
Na2HP04·12H20
NH4
Cl
Gelatin
MgS04·7H20
FeS04
CaC1 2 Glycerol
gil
1.0
5.0
0.32
0.24
2.0
12.48
1. 04
0.008
0.5
0.001
0.1
2.0

-107-
29. M.Dubois,K.A.Giles,J.K.Hamilton,P.A.Rebers and F.Smith, Anal.Chem., 28, (1956) 350-356.
30. G.H.Fleet and D.J.Manners, Biochem.soc.trans., 3, (19 75) 981-983. 31. C.f.Snyder,H.L .frush,H.S.Isbell,A.Thompson and M.L.Wolfrom,
I'Methods in Carbohydrate Chemistry" (R.L.Whistler and M.L.Wo1from), Vo1.I, pp.524-534 . Academic Press, London (1962)
32. G.J.Gerwig,J.P .K amerling and J.F.G.Vliegenthart, Carbohydr.Res., 62, (1978) 349-352.
33. M.R.Little, Carbohyr.Res., 105, (1982) 1-8. 34. K.Leontein,B.Lindberg and J.Lonngren, Carbohydr.Res., 62, (197 8 )
359-362. 35. L.A.S.Parolis, Ph.D. Thesis, Rhodes University (1985). 36. R.8enn and H.Gunther, Angew.Chem.Int.Ed.Eng1 ., 22, (1983) 350-380. 37. E.Barreto-Bergeter,L.Hogge and P.A.J.Gorin, Carbohydr.Res., 97,
(1981) 147-150. 38. A.Van Langenhove and V.N.Reinhold, Carbohydr.Res., 143, (1985) 1-20. 39. H.BjorndaI,C.G.Hellerquist,B.Lindberg and S.Svensson,
Angew.Chem.Int.Ed.Eng1 . , 9, No.8, (1970) 610-619. 40 . J.F.Kennedy and C.A.White, "Bioactive Carbohydrates " pp.66-68.
Ellis Horwood LTD, Chichester (1983). 41 . S.Hakomori, J.Biochem.(Tokyo), 55, (1964) 205-208. 42 . W.S.Oenham and H.Woodhouse, J.Chem.Soc.(London), 103, (1913) 1735. 43. W.N.Haworth, J.Chem.Soc.(London), 107, (1915) 8-16. 44. R.Kuhn,H.Trischmann and I . Low, Angew.Chem., 67, (1955) 32. 45. T.Narui,K.Takahsshi,M .K obayashi and S.Shibata, Carbohdyr . Res., 103,
(1982) 293-295. 46. A.B. Blakeney and B.A.Stone , Carbohydr .Res., 140, (1985) 319-324. 47. L.R.Phi11ips and B.A.Fraser, Carbohydr.Res., 90, (1981) 149-152. 48. J.Finne,T.KrusiuB and H.Rauvala, Carbohdyr,Res., 80, (1980)
336-339. 49. P. J . Harris,R.J.Henry,A.B.Blakeney and B. A.Stone, Carbohydr . Res.,
127, (1984) 59-73. 50. A.Isogai,A.Ishizu,J.Nakano,S.Eda and K.Kato, Carbohydr.Res., 138,
(1985) 99-108. 51. I.Ciucanu,F.kerek, Carbohydr.Res., 131, (1984) 209-217. 52. P.Prehm, Carbohydr.Res., 78, (1980) 372-374. 53. I.O.Mastronardi,S.M.Flematti,J.O.Deferrani and E.G.Gros,
Carbohydr.Res., 3, 177-183 (1966). 54. J.M.Bobbitt, Adv.Carbohydr.Chem.Biochem., 11, pp.1-41 (1956). 55. H.W.Kircher, "Methods in Carbo hydrate Chemistry" (R.L.Whistler and
M.L.Wolfrom), Vol. 1, pp.13-20. Academic Press, London (1962). 56. A.S.Perlin, liThe Carbohydrates" (W.Pigman and D.Horton), Vol.lB,
pp.1167-1207 . Academic Press, New York (1980). 57. V.C.Barry, Nature, 152, (1943) 538. 58. I.J.Goldstein,G.W.Hay,B.A.Lewis and F.Smith, IIMethods in
Carbohydrate Chemistry" (R.L.Whist1er) Vo1.V, pp.361 - 377. Academic Press,New York (1965).
59 . J.L.Di Fabio,G.G.S.Dutton and H.Parolis, Carbohydr.Res., 126, (1984) 261-269.
-108-
60. C.Galanos,O.LOderitz and K.Himme!spach, Eur.J.Biochem., 8, (1969) 332-336.
61. T.J.Peinter, "Methods in Carbohydrate Chemistry" (R.L . Whistler), Vol.V, pp.280-285. Academic Press, London (1965).
62. H.Nieman,N.Frank and S.Stirm, Carbohydr.Res., 59, (1977) 165-177. 63. A.J.Mort,J.P.Utille,G.Torri and A.S.Perlin, Carbohydr.Res., 121,
(1983) 221-232. 64. G.G.S.Dutton and D.Nedra Karunaratne, Carbohydr.Res., 138, (1985)
277-291. 65. G.G.S.Dutton,K.L.Mackie,A.V.Savage,D.Rieger-Hug and S.Stirm,
Carbohydr.Res., 84, (1980) 161-170. 66. A.K.Chakraborty,H.Frieholin and 5.Stirm, J.Bacteriol., 141, No.2,
(1980) 971-972. 67. G.G.S.Dutton,H.Parolis,J-P.Joseleau and M-F.Marais,
Carbohydr.Res., 149, (1986) 411-423 . 68. G.G.S.Dutton,A.V.Savage and M.Vignon, Can.J.Chem., 58, No.23,
(1980 ) 2588-2591. 69. Y-M.Choy,F.Fehmel,N.Frank and S.Stirm, J.Virolagv., 16, No.3,
(1975) 581-590. 70. G.G.S.Dutton, H.Parolis,L.A.S.Paro!is, In Press. 71. _S . M.R.Stanley, unpublished. 72. J.J.Marshall, Adv.Carbohydr.Chem.Biochem., 3D, (1974) 257-370. 73. S.Stirm,W.Bess!er,F.Fehmel,and E.Freund-Molbert, J.Virologr, B,
No.3, (1971) 343-346. 74. S.Stirm, J.Virology, 2, No.10, (1968) 1107-1114. 75. A.K.Chakraborty, Makromol.Chem., 183, (19B2) 2881-2887. 76. I.M.Morrison, J.Chromatogr., 108, (1975) 361-364. 77. B.S . Valent,A.G.Oarvill,M.McNeil,B.K.Robertson and P.A1bersheim,
Carbohydr.Res., 79, (1980) 165-192. 7B. J.L.Oi Fabio,G.G.S.Dutton and H.Paro1is, Carbohydr.Res., 133,
(1984) 125-133. 79. G.G.S.Dutton,J.L.Di Fabio,D.M.Leek,E.H.Merrifield,J.R.Nunn and
A.M.Stephen, Carbohydr.Res., 97, (1981) 127-138. BO. M.I.Horowitz, "The Carbohydrates" (W.Pigman and D.Horton), Vol.lS,
p . 1464. Academic Press, New York (1980). 81. G.G.S.Outton, Adv.Carbohydr.Chem.Biochem., 3D, (1974) 10-52. B2. H.Bjorndal,B.Lindberg and S.Svensson, Carbohydr.Res., 5, (1967)
433-440. 83. H.Bjorndal,B.Lindberg,a.Pilotti and S.Svensson, Carbohydr.Res.,
15, (1970) 339-349. 84. D.P.Sweet,R.H.Shapiro and P.A1bersheim, Carbohydr.Res., 40,
(1975) 217-225. 85. L.W.Jelinski, Chem.Eng . News, 62, No.45, (1984) 26-47 . 86. B.Coxon, Adv . Carbohydr . Chem.Biochem., 27, (1972) 7-62. 87. Y.M.Choy and G.G.S.Outton, Can.J.Chem., 51, (1973) 198-206. BB. W.Curatolo,L.J.Neuringer,D.Ruben and R.Haberkorn, Carbohydr . Res.,
112, (1983) 297-300. 89 . A.S.Perl i n and B.Casu, "The Polysaccharides" (G.O.Aspinall),
Vol.1, pp.133-193. Academic Press, New York (1982). 90. L.O.Hall, Adv.Carbohydr.Chem.Biochem., 29, (1973) 11-14.

-109-
91. H.J.Jennings and I.C.P.Smith, Methods in Enzymology, 50, part c, (1 978) 39-50.
92. P.A.J.Gorin, Adv.Carbohydr.Chem.Biochem., 3B, (19BO) p . 15. 93. R.Barker,H.A.Nunez,P.Rosevear,A.S.Serianni, Methods i n
Enzymology, B3, (19B2) 5B-69. 94. A.S.Perlin and B.Casu, Tetrahedron Lett.Eng., 34, (1969) 2921-2924. 95. S.L.Patt,F.Sauriol and A.S.Per1in, Carbohydr.Res., 107, (19B2)
CI-C4. 96. L.O.Hall, "The Carbohydrates" (W.Pi gman and D.Horton) Vol.lS,
pp.1300-1320. Academic Press, New York (19BO). 97. W.f.Vann,M.A.Schmidt,B.Jann and K.Jann, [ur.J,Biochem., 116,
(19Bl) 359-364. 98. S.Ebisu,J.L5nngren and I.J.Goldstein, Carbohydr.Res., 58, (1977)
1B7-191. 99. J.Haverkamp,J.P.C.M.Van Dongen and J.F.G.Vliegenthart,
Carbohydr.Res., 33, (1974) 319-327. 100. E.A 1tman and G.G.S.Outton, Carbohydr.Res., 13B, (19B5) 293-303. 101. J.P.Kamerling,B.Lindberg,J.Lonngren and W.Nimmich,
Acta.Chem.Scand. Set B., B29, (1975) 593-598. 102. H.ThufOw,H.Niemann and S.Stirm, Carbohydr.Res., 41, (1975)
257-271. 103. G.G.S.Outton and T.E.Fo1kman, Carbohydr.Res., BO, (19BO) 147-161. 104. B.Matsuhiro,A.B.Zanlungo and G.G.S.Dutton, Carbohydr.Res., 97,
(1981) II-lB. 105. S.Stirm,E.Freund-Molbert, J.Virology, 8, No.2, (1971) 330-342. 106. [.J .McGuir e and s.B.Blin kley, Biochemistry, 3, No.2, ( 1964)
247-251. 107. H.J.Jennings,K-G.Rosell, and K.G.Johnson, Carbohydr.Res., 105,
(1982) 45-56. lOB. F-P.Tsui,R.A.Boykins and W.Egan, Ca rboh ydr.Res., 102, (19B2)
263-271. 109. B.Jann,P.Hofmann and K.Jann, Carbohydr.Res., 120, (1983) 131-141. 110. W.F.Vann,T.Soderstrom,W.Egan,F.-P.Tsui,R.Schneerson,I.Orskov and
F.Orsk ov, Infection and Immunity, 39, No.2, (1982) 623-629. Ill. T.Oeng1er,B.Jann and K.Jann, Carbohydr.Res ., 142, (1985) 269-276. 112. T.Oeng1er,B.Jann and K.Jann, Carbohydr.Res., 150, (1986) 233-240. 113 . A.K.Chakraborty,H.Friebolin ans S.Stirm, J.Bacteriology, 141,
No.2, (19BO) 971-972. 114. E.Altman,L.M.Beynon,G.G.s.Dutton and B.A.Lewis, Abstracts of the
XIIth Internstional Carbohydrate Symposium, (1985) p.368. 115. K.Jann,B.Jann"F.Orskov,I.Orskov and O.Westphal, Biochemie
Zeitschrift, 342, (1965) 1-22. 116 . P.Hoffmann,B.Jann and K.Jann, Carbohydr.Res., 139, (1985) 261-271. 117. L.Tarcsay,B.Jann and K.Jann, Eur . J.Biochem., 23, (1971) 505-514. 118. M.R.Lifely,J.C.Lindon,J.M.Williams and C. Moreno, Carbohydr.Res.,
143, 191-205 (1985). 119. B.A.Fraser,F.-P.Tsui and W.Egan, Carbohydr.Res., 73, (1979) 59-65.


