
1
A Method For Determining Stand Relative Density
And Using The Information to Prescribe a Thinning
For Even-aged Northern Hardwoods In New York State
Ralph D. Nyland
Distinguished Service Professor Emeritus – Silviculture
Department of Forest and Natural Resources Management
Based On A Methodology Described in:
Marquis, D.A., R.L. Ernst, and S.L. Stout. 1984. Prescribing silvicultural
treatments in hardwood stands of the Alleghenies. US For. Serv. Gen. Tech.
Rpt. NE-96.
Nyland 2017
Roach and Gingrich 1968
Roach and Gingrich developed the first stocking guide
as an aid in planning thinning ...
FOR OAK STANDS
… for oak community types
in the central states
2
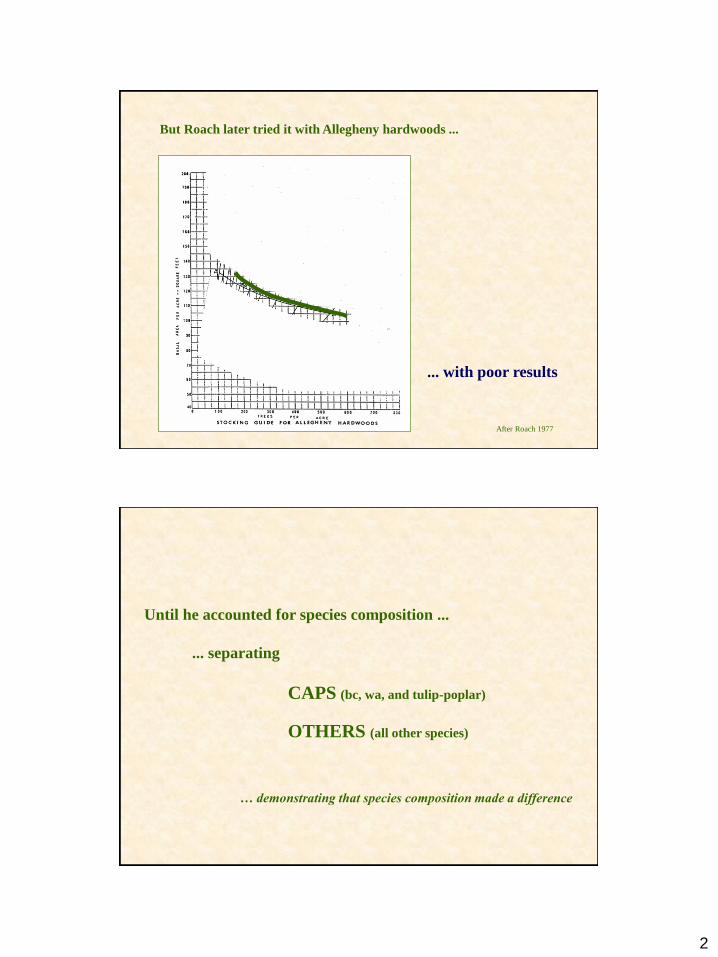
But Roach later tried it with Allegheny hardwoods ...
... with poor results
After Roach 1977
Until he accounted for species composition ...
... separating
CAPS (bc, wa, and tulip-poplar)
OTHERS (all other species)
… demonstrating that species composition made a difference

3
With a separate line for each species group ...
... each A line to represent
a different proportion
of basal area in CAPs
Roach 1977
And then adding a family of B lines ...
... one for each species group
(set at 60% of each A line)
B
... and this worked well
in most cases

4
So Stout asked ...
WHAT IF I add additional species groups?
But experience suggested that this guide needed
enhancement ...
... particularly to account for stands with
lots of red maple
TREE-AREA RATIO (TAR)
- a mathematical device for apportioning
ground area by size of stem diameter
- where the area of the a stand is expressed
as a function of D & D2
- (TAR) of all trees present = 1.00
She approached it using the Tree-Area Ratio (TAR) …
5
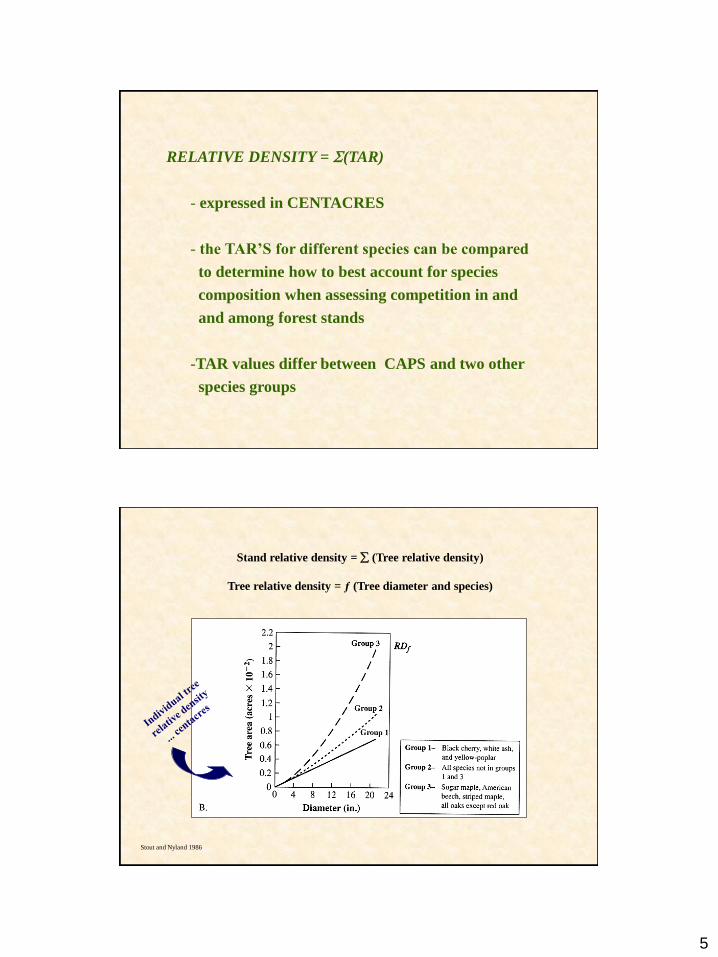
RELATIVE DENSITY = (TAR)
- expressed in CENTACRES
- the TAR’S for different species can be compared
to determine how to best account for species
composition when assessing competition in and
and among forest stands
-TAR values differ between CAPS and two other
species groups
Stand relative density = (Tree relative density)
Tree relative density = ƒ (Tree diameter and species)
Stout and Nyland 1986
6
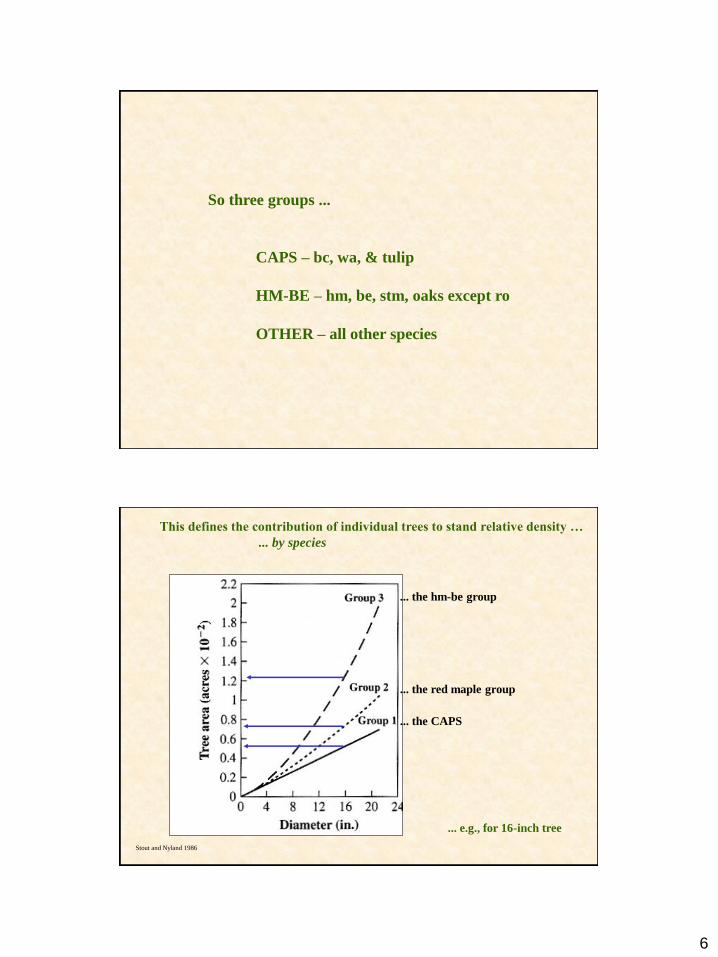
So three groups ...
CAPS – bc, wa, & tulip
HM-BE – hm, be, stm, oaks except ro
OTHER – all other species
This defines the contribution of individual trees to stand relative density …
... by species
... e.g., for 16-inch tree
Stout and Nyland 1986
... the CAPS
... the red maple group
... the hm-be group
7
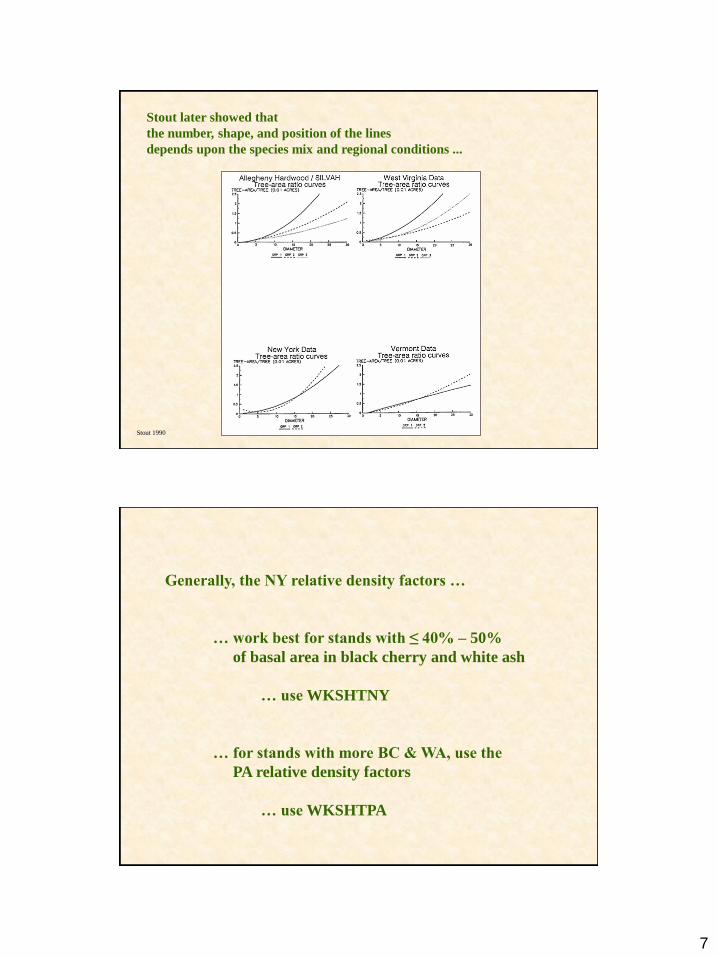
Stout 1990
Stout later showed that
the number, shape, and position of the lines
depends upon the species mix and regional conditions ...
Generally, the NY relative density factors …
… work best for stands with ≤ 40% – 50%
of basal area in black cherry and white ash
… use WKSHTNY
… for stands with more BC & WA, use the
PA relative density factors
… use WKSHTPA

8
Stout 1990
… only two species groups works better
for even-aged northern hardwoods in New York
But …
… and with simple tests showing the difference in
calculated relative density using PA and NY factors
Using NY stand data

9
So how to use it ...
... in practical application
Tim Davis 2001
So complicated … ...
Marquis et al. 1984
Try this field sheet ...
RD factors
included
(Pennsylvania)

10
Acceptable
Growing
Stock
Quality considered ...
Unacceptable
Growing
Stock
Poor trees, too ...
Marquis 1984

11
Unacceptable Growing Stock (UGS)
(… what Nyland uses)
-- a fruiting body on the main stem*
-- holes in the main stem
-- ≥25% of major branches dead or dying
in the upper crown
*Also signs of beech bark disease
This example defines UGS as follows …
These criteria identify high risk trees that likely
will die or deteriorate within a 15-20 year period …
… making them candidates for salvage
UGS …
12
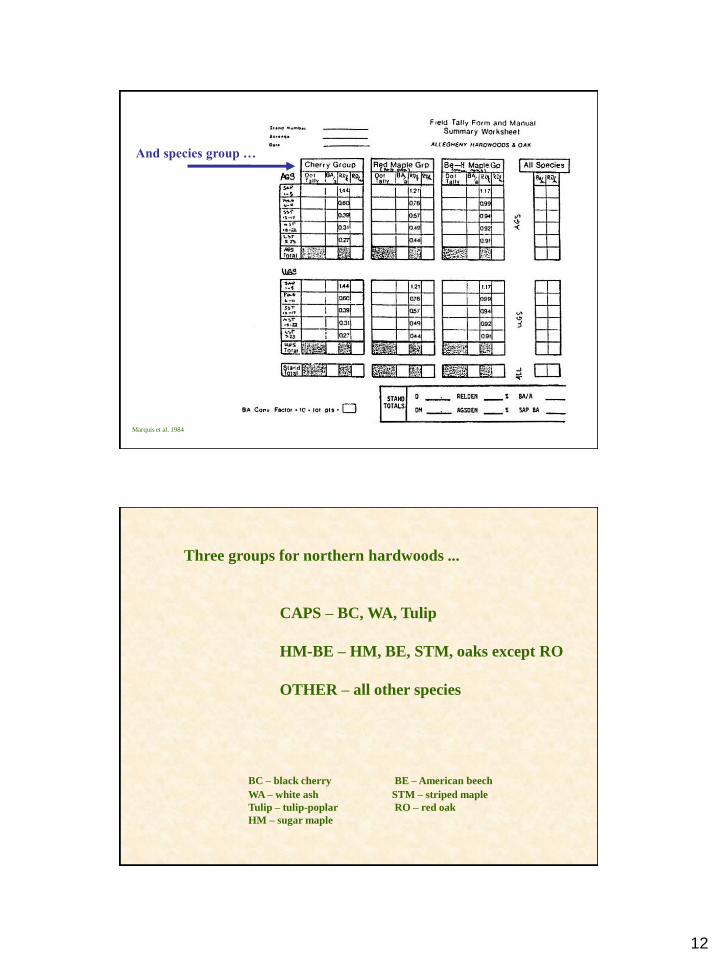
And species group …
Marquis et al. 1984
Three groups for northern hardwoods ...
CAPS – BC, WA, Tulip
HM-BE – HM, BE, STM, oaks except RO
OTHER – all other species
BC – black cherry BE – American beech
WA – white ash STM – striped maple
Tulip – tulip-poplar RO – red oak
HM – sugar maple
13
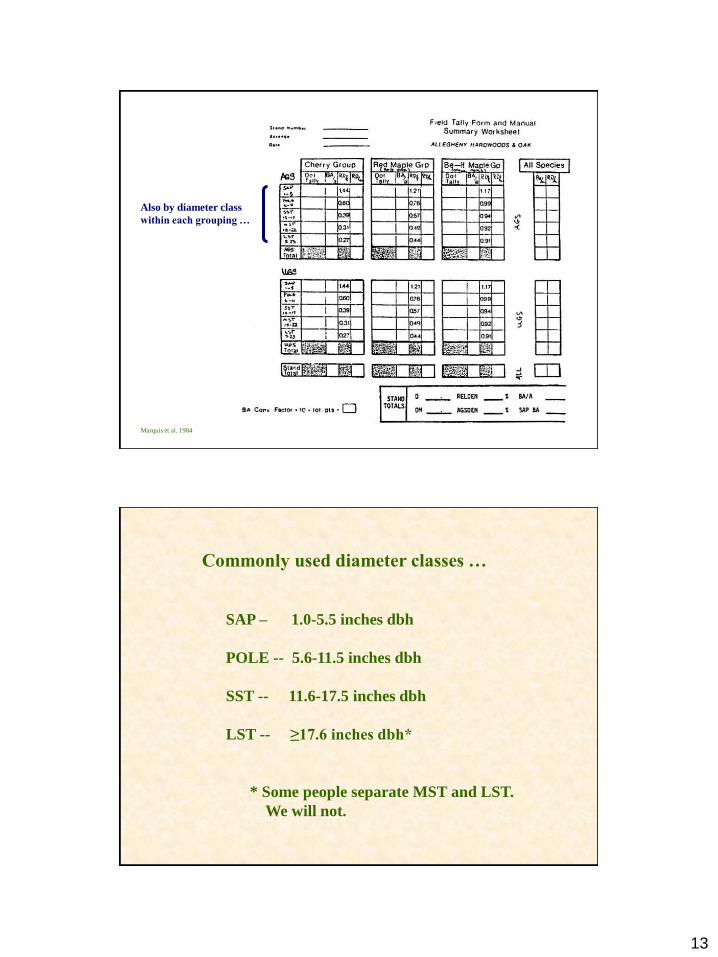
Also by diameter class
within each grouping …
Marquis et al. 1984
Commonly used diameter classes …
SAP – 1.0-5.5 inches dbh
POLE -- 5.6-11.5 inches dbh
SST -- 11.6-17.5 inches dbh
LST -- ≥17.6 inches dbh*
* Some people separate MST and LST.
We will not.
14
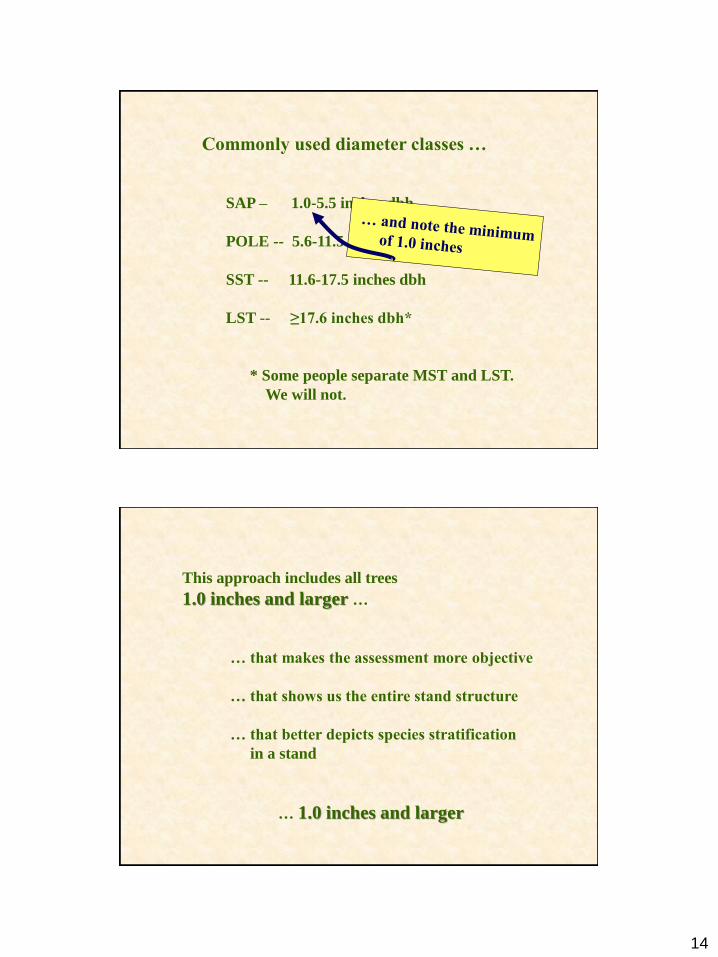
Commonly used diameter classes …
SAP – 1.0-5.5 inches dbh
POLE -- 5.6-11.5 inches dbh
SST -- 11.6-17.5 inches dbh
LST -- ≥17.6 inches dbh*
* Some people separate MST and LST.
We will not.
This approach includes all trees
1.0 inches and larger …
… that makes the assessment more objective
… that shows us the entire stand structure
… that better depicts species stratification
in a stand
… 1.0 inches and larger

15
As an example:
Develop thinning prescriptions for Cuyler C-7
using relative density measures to control the
intensity of a crown thinning …
Stand __________
1.20
0.77
0.67
0.64
0.64
0.63
1.70
0.44
0.76
0.76
0.63
1.70
0.44
0.76
0.76
0.63
1.70
0.44
0.76
0.76
0.63
1.70
0.44
0.76
0.76
1.20
0.77
0.67
0.64
0.64
USING THIS WORK SHEET …

16
1.20
0.77
0.67
0.64
0.64
0.63
1.70
0.44
0.76
0.76
0.63
1.70
0.44
0.76
0.76
0.63
1.70
0.44
0.76
0.76
0.63
1.70
0.44
0.76
0.76
1.20
0.77
0.67
0.64
0.64
But note that it uses the NY RD factors …
… with NO difference between CAPS and RM group
You need point sample information
about a stand to determine stand
relative density …
… by convention we install at least 15 point samples in an even-aged
stand
… using a BAF-10 prism
… and laid out at random
or along a randomly
placed grid of points

17
Heiberg Forest
Stand 97
Grid points at 2- x 2-chain intervals
Dashed lines show boundaries of
study plots to receive specified
treatments.
So let’s use this stand
to illustrate the process …
North
… providing a data set that looks like this

18
For clarity presented here in a printed format …
So lets figure out how to do the calculations
and develop a prescription for crown thinning …

19
… this instruction sheet
shows how to do
the calculations using
a pocket calculator
FIRST determine the BA conversion factor …
[Carry this to 3 places]
BA Convert = (BAF factor / # point samples)
= 10 / 18 = 0.556

20
Now the BA per diameter class …
BA/ac = (Trees sampled * BA Conversion factor)
So for the Small Sawtimber (SST) in CAPs …
14 trees * 0.556 = 7.78
[Carry this and subsequent
calculations to 2 places]
… and done for all cells on the sheet … done for all cells by row and column

21
… then sum the totals from each segment
to determine overall stand conditions
Next determine the average diameters …
D = average for all size classes
DM = average for trees ≥ 6 inches dbh
… using the separate diameter calculation worksheet

22
… using this worksheet
… first writing in the
basal area by size class

23
… then making these calculations for D
DIA BA
FOR FOR
CLASS CLASS = Di * BAi
3 1.67 = 5.01
8 45.57 = 364.56
14 68.35 = 956.90
20 9.45 = 189.00
26 4.45 = 115.70
TOTAL 129.49 1631.17 / 129.49 12.6 D
>=6" 127.82 1626.16 / 127.82 12.7 DM
… a weighted average
across all diameter
classes
… using BA/size class
as the weighting factor
DIA BA
FOR FOR
CLASS CLASS = Di * BAi
3 1.67 = 5.01
8 45.57 = 364.56
14 68.35 = 956.90
20 9.45 = 189.00
26 4.45 = 115.70
TOTAL 129.49 1631.17 / 129.49 12.6 D
>=6" 127.82 1626.16 / 127.82 12.7 DM
… done using only
poles and larger
… and those for DM
24
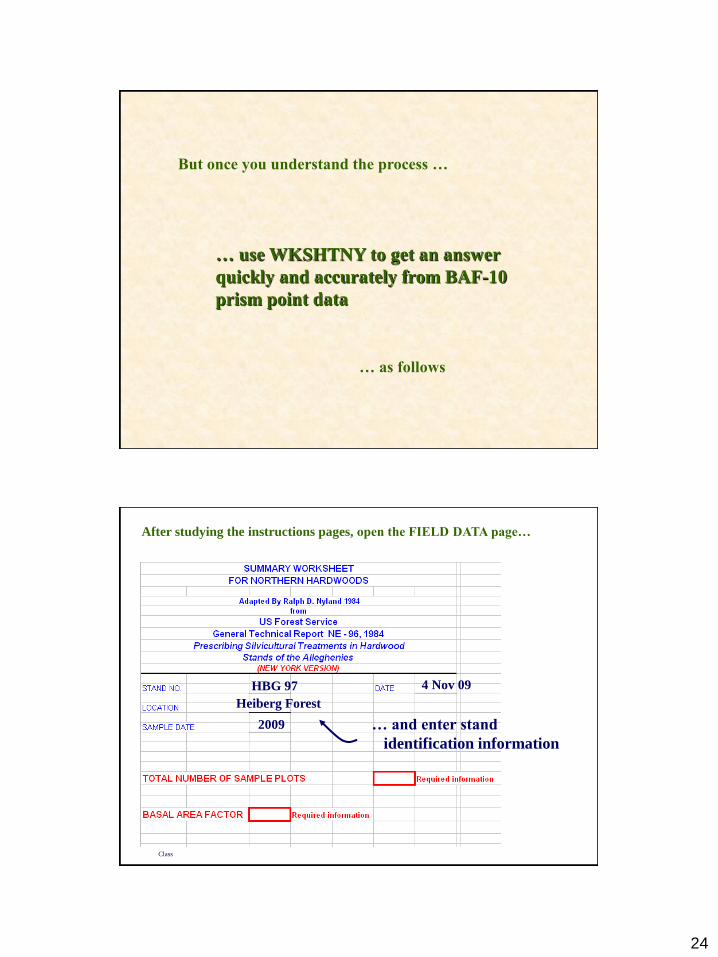
… use WKSHTNY to get an answer
quickly and accurately from BAF-10
prism point data
… as follows
But once you understand the process …
HBG 97
Heiberg Forest
4 Nov 09
2009
Class
After studying the instructions pages, open the FIELD DATA page…
… and enter stand
identification information
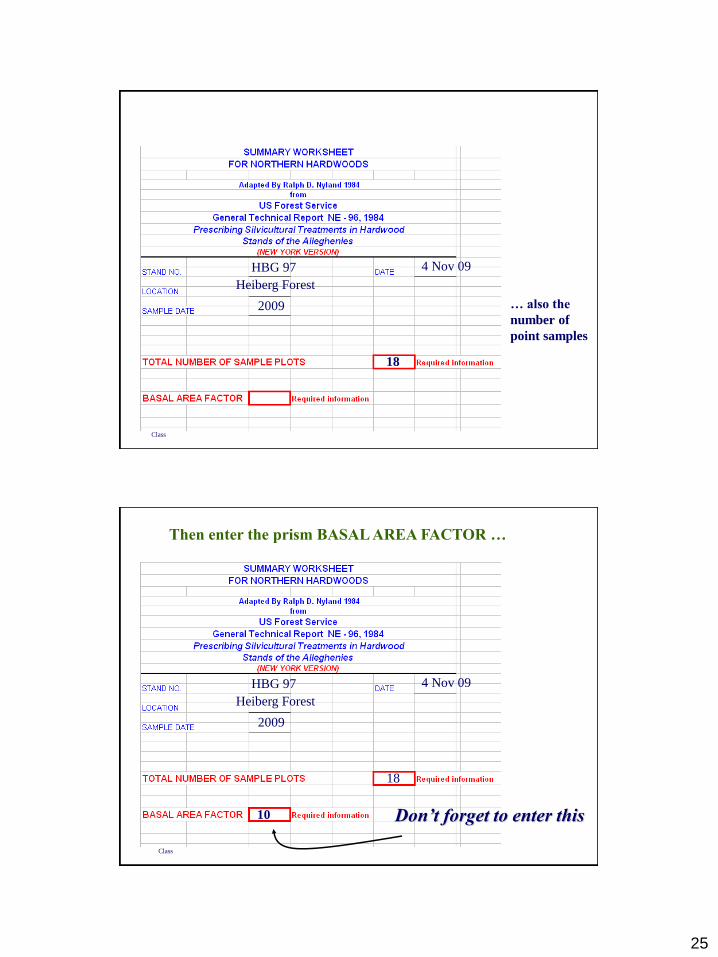
25
… also the
number of
point samples
18
HBG 97
Heiberg Forest
4 Nov 09
2009
Class
Then enter the prism BASAL AREA FACTOR …
Class
18
Don’t forget to enter this 10
HBG 97
Heiberg Forest
4 Nov 09
2009

26
NEW YORK VERSION
FIELD TALLY FORM AND MANUAL
SUMMARY WORKSHEET
Cherry Group Red Maple Group
AGS Dot tally BA/a RDf RD/a
SAP 1-5 0 0.00 1.70 0.00
POLE 6-11 1 0.56 0.44 0.25
SST 12-17 14 7.78 0.63 4.90
MST 18-22 9 5.00 0.76 3.80
LST 23+ 6 3.33 0.76 2.53
AGS Total 30 16.67 11.48
HBG 97 (18 sample points)
Then go to the
SUM page …
… entering the field
tally data in the
yellow columns
Automatically giving you a summary output … Class
27
DIA BA
FOR FOR
CLASS CLASS = Di * BAi
3 1.67 = 5.01
8 45.57 = 364.56
14 68.35 = 956.90
20 9.45 = 189.00
26 4.45 = 115.70
TOTAL 129.49 1631.17 / 129.49 12.6 D
>=6" 127.82 1626.16 / 127.82 12.7 DM
To calculate D and DM …
… PUSH buttons on
the D / DM page
HBG 97 18 pt samples … the results

28
This stand has …
129 ft2/ac of basal area
a DM of 12.7 inches
a relative density of 92%
71% relative density of AGS
… shown in the box at the bottom of the SUM page

29
Now lst’s use these findings to prescribe a thinning …
… taking out 35% of the relative density
… but not reducing the stand below 60%
Note: if taking 35% reduces RD below 60%,
adjust the intensity to leave 60%
You should find these values on the MARKING page …
30
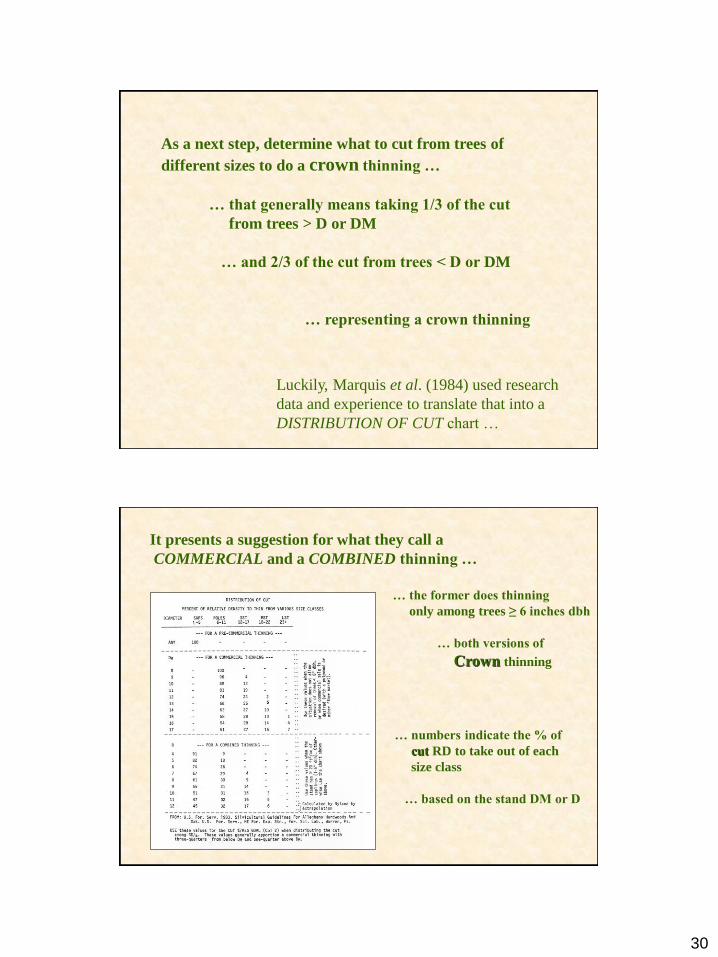
As a next step, determine what to cut from trees of
different sizes to do a crown thinning …
… that generally means taking 1/3 of the cut
from trees > D or DM
… and 2/3 of the cut from trees < D or DM
… representing a crown thinning
Luckily, Marquis et al. (1984) used research
data and experience to translate that into a
DISTRIBUTION OF CUT chart …
It presents a suggestion for what they call a
COMMERCIAL and a COMBINED thinning …
… the former does thinning
only among trees ≥ 6 inches dbh
… both versions of
Crown thinning
… numbers indicate the % of
cut RD to take out of each
size class
… based on the stand DM or D

31
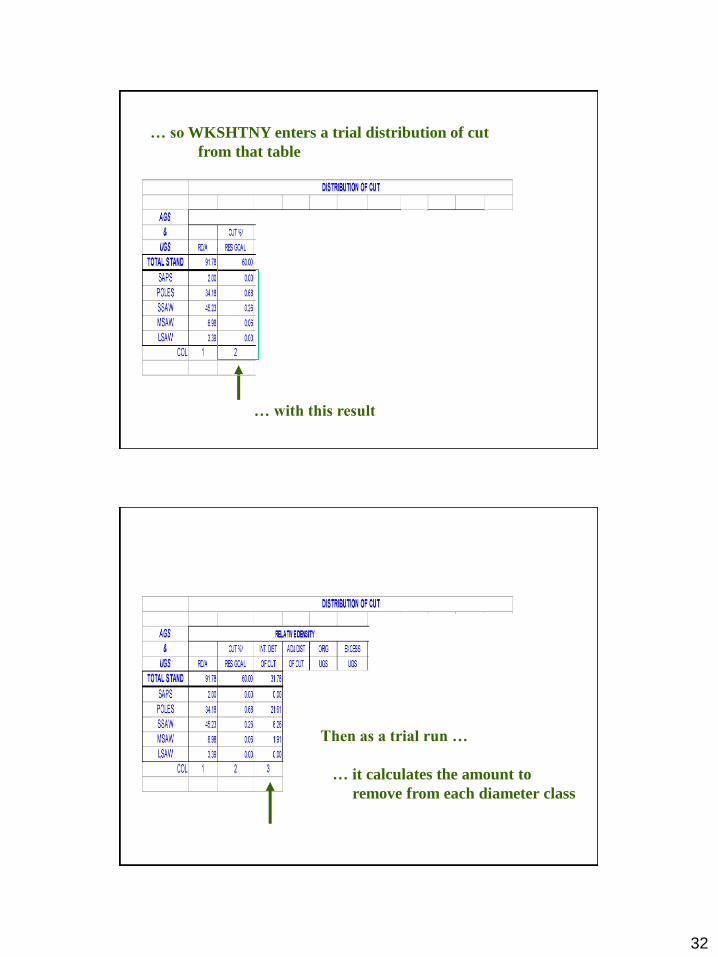
… so WKSHTNY enters a trial distribution of cut
from that table
… for DM 12.72
… rounding
dbh to the
nearest
inch
32
… so WKSHTNY enters a trial distribution of cut
from that table
… with this result
Then as a trial run …
… it calculates the amount to
remove from each diameter class
33
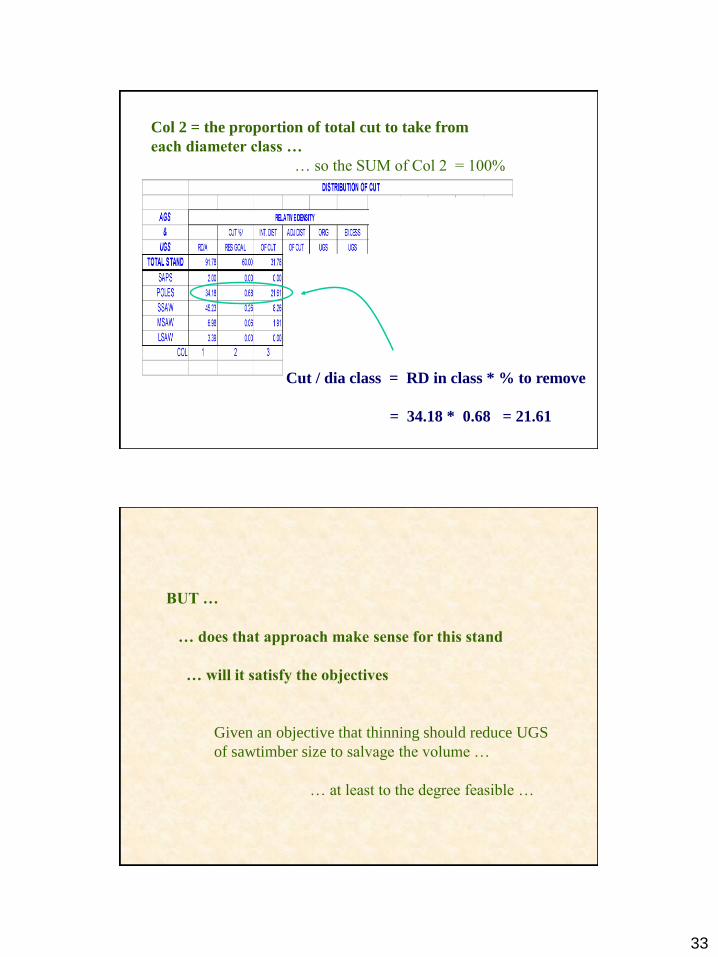
Cut / dia class = RD in class * % to remove
= 34.18 * 0.68 = 21.61
Col 2 = the proportion of total cut to take from
each diameter class …
… so the SUM of Col 2 = 100%
BUT …
… does that approach make sense for this stand
… will it satisfy the objectives
Given an objective that thinning should reduce UGS
of sawtimber size to salvage the volume …
… at least to the degree feasible …
34
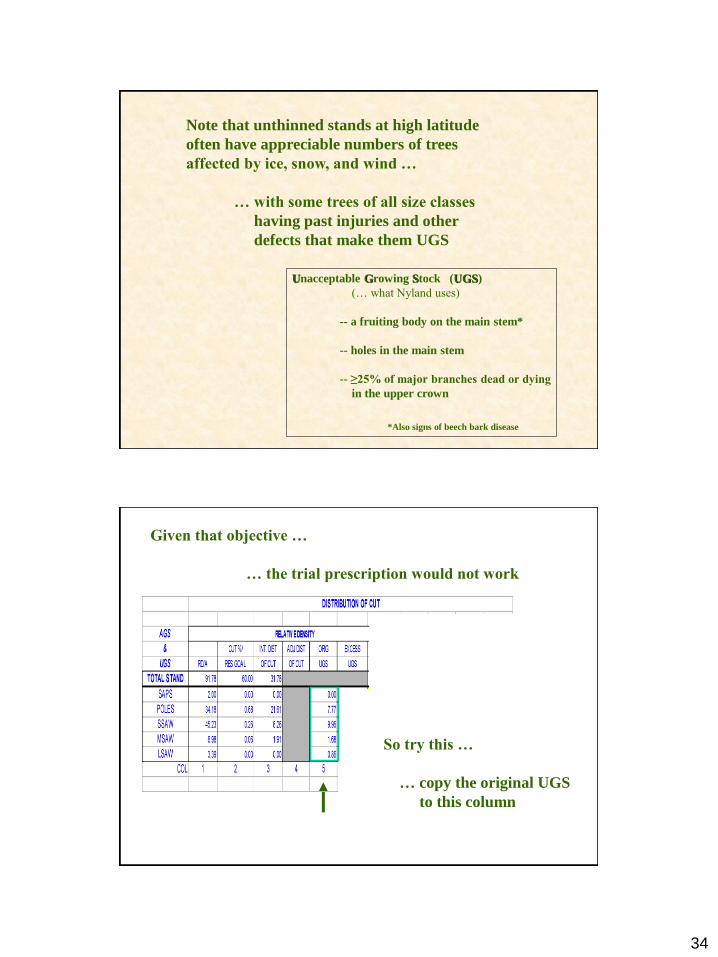
Note that unthinned stands at high latitude
often have appreciable numbers of trees
affected by ice, snow, and wind …
… with some trees of all size classes
having past injuries and other
defects that make them UGS
Unacceptable Growing Stock (UGS)
(… what Nyland uses)
-- a fruiting body on the main stem*
-- holes in the main stem
-- ≥25% of major branches dead or dying
in the upper crown
*Also signs of beech bark disease
So try this …
… copy the original UGS
to this column
Given that objective …
… the trial prescription would not work

35
… and subtract the
original UGS from
the trial cut
… Col 3 – Col 6
… a NEGATIVE result
means some UGS
will still remain
So …
… adjust the cut to remove UGS of ST sizes
Indicating that you
must make a change
to satisfy the assigned
objectives …
Remember the objective …
… reduce UGS in sawtimber classes to the degree possible

36
… the first trial cut
would leave some UGS
of SST
… so adjust the cut to
remove all the UGS of SST
… the first trial cut
would leave some UGS
of SST
… so adjust the cut to
remove all the UGS of SST
… try starting this process by removing UGS from LST,
then go to MST, and then to SST
… that seems to work best
As a \practical matter …

37
… but DO NOT drop
RD below the target
level
… here 60%
… WKSHTNY determines the proportion to cut
from each diameter class
Finally …

38
% to cut = 9.96 45.23 = 0.22 or 22% :
… translated into 1/5 for practical application
1/5

39
The end point of the analysis …
MARK
NONE
3/5
1/5
1/4
1/4
11
AGS
&
UGS
TOTAL STAND
SAPS
POLES
SSAW
MSAW
LSAW
COL
NONE
3/5
1/5
1/4
1/4
… look at the original basal area
To get a picture of the effect in more tangible terms …

40
… and see what proportion of basal area to cut
Cut BA = Original BA * % RD to cut
= 68.35 * 0.22 = 15.05 ft2/ac
… and check the expected residual basal area
Residual BA = Original BA - Cut BA
= 68.35 - 15.05 = 53.3 ~ 53 ft2/ac ~
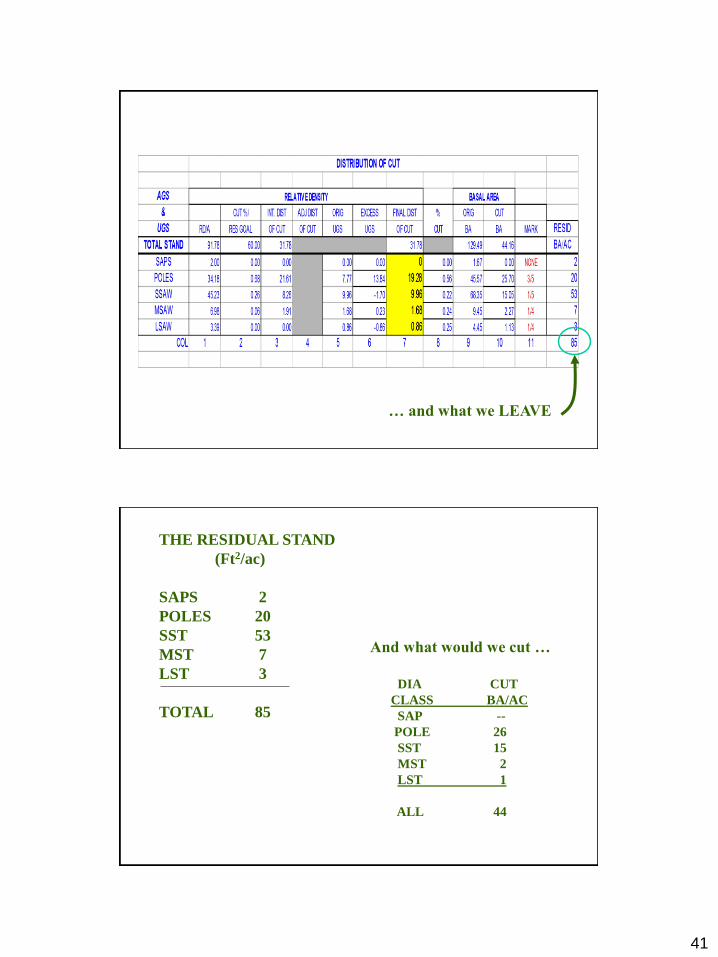
41
… and what we LEAVE
THE RESIDUAL STAND
(Ft2/ac)
SAPS 2
POLES 20
SST 53
MST 7
LST 3
TOTAL 85
And what would we cut …
DIA CUT
CLASS BA/AC
SAP --
POLE 26
SST 15
MST 2
LST 1
ALL 44
42
… when all else fails, read the instructions again
As my mother-in-law’s friend commonly said …
So what to do now?
And she said …
Background reading:
Chapter 17, in Nyland, R.D. 2002. Silviculture: Concepts and Applications. Waveland Press. Long Grove, IL.
Sources cited:
Marquis, D.A., R.L. Ernst, and S.L. Stout. 1984. Prescribing silvicultural treatments in hardwood stands
of the Alleghenies. US For. Serv. Gen. Tech. Rpt. NE-96.
Roach, B.A. 1977. A stocking guide for Allegheny hardwoods and its use in controlling intermediate cuttings.
US For. Serv. Res. Pap. NE-373.
Roach, B.A., and S.F. Gingrich. 1968. Even-aged silvicutlure for upland central hardwoods. US Dept. Agric.,
Agric Handbk. No. 355.
Stout, S.L., and R.D. Nyland. 1968. Role of species composition in relative density measurement in
Allegheny hardwoods. Can. J. For. Res. 16:574-579.
Stout, S.L. 1990. Progress Report For Relative Density In Northern Hardwoods Throughout The Northeast.
US For. Serv. For. Sci. Lab, Warren, PA.


