determining the in-place density and relative compaction ... · determining the in-place density...
TRANSCRIPT

California Test 375
STATE OF CALIFORNIA—BUSINESS, TRANSPORTATION AND HOUSING AGENCY February 2012
DEPARTMENT OF TRANSPORTATION DIVISION OF ENGINEERING SERVICES Transportation Laboratory 5900 Folsom Boulevard Sacramento, California 95819-4612
DETERMINING THE IN-PLACE DENSITY AND RELATIVE COMPACTION OF HOT MIX ASPHALT PAVEMENT USING NUCLEAR GAGES
A. SCOPE This test method provides procedures for determining the average in-place density and relative compaction of hot mix asphalt (HMA). It may be applied to HMA having a compacted thickness of at least 0.10 ft. The test method includes six parts:
1. Standardization and Calibration of the Nuclear Density Gage
2. Correlation with Core Densities
3. Selection of Test Site
4. Determination of In-Place Density with the Nuclear Density Gage
5. Determination of Test Maximum Density (TMD)
6. Calculation of Relative Compaction
B. REFERENCED DOCUMENTS California Test 111 – Developing Density and Moisture Calibration Tables for Nuclear Gages California Test 125 – Sampling Highway Materials and Products Used in the Roadway
Structural Sections California Test 304 – Preparation of Bituminous Mixtures for Testing California Test 308 – Bulk Specific Gravity and Weight Per Cubic Foot of Bituminous Mixture C. PROCEDURES PART 1. STANDARDIZATION AND CALIBRATION OF THE NUCLEAR DENSITY GAGE This part of the test method adds specific minimum requirements to the procedures on standardization and calibration recommended by the manufacturer. 1A. APPARATUS
1. Nuclear gage – a portable instrument containing radioactive sources, detectors, electronics and battery packs. The instrument shall be calibrated in accordance with California Test 111.
2. Reference standard block – a block provided by the gage manufacturer primarily checking instrument operation and establishing standard counts against which future measurements are compared.

California Test 375 February 2012
-2-
1B. DETERMINING STANDARD COUNT The standard count for the nuclear density gage shall be determined at the beginning of each day’s testing.
1. Follow manufacturer’s instruction for start-up.
2. Set the manufacturer’s reference standard block a minimum of 5 ft from any object and a minimum of 25 ft from any other nuclear gage to avoid any influence to the readings.
3. Place the gage on the reference standard block in the closed (safe) position and take one 4-minute density count. Record the reading in the gage logbook and on Line A of Form TL-3112. NOTE: The 4-minute count determined above is required to be within the acceptable
deviation limits (ADL) stated in the most recent calibration table (within last 12 months) established in accordance with California Test 111. Otherwise, the gage shall not be used.
NOTE: For thin lift gages, follow manufacture’s recommendation. Record the last
accepted count as the standard count in the logbook and on Line A of Form TL-3112.
PART 2. CORRELATION WITH CORE DENSITIES This part of the test method describes the procedure used to determine a “conversion factor” through the use of a test strip. A conversion factor must be developed for each gage on each project. All conversion factor data shall remain with the nuclear density gage for the duration of the project. Establish a new conversion factor whenever there is a change in pertinent criteria such as a lift thickness of ½" or more, underlying material, material source, mix design, or recalibration of the nuclear density gage. 2A. TEST STRIP
1. Each test strip must be constructed in compliance with the project specifications and the following conditions:
a. The HMA must be representative of the material (binder type and content, aggregate
source, type and grading) to be placed on the project and have a compacted thickness that is within ± 0.03 ft of the thickness that will be tested on the job. In no case will the lift thickness be less than 0.10 ft.
b. Each test strip must be at least 600 ft long, one traffic lane wide, and placed on surface representative of that on the project.
NOTE: If a contiguous 600 ft section cannot be placed because of specific project
limitations, engineers may reduce the test strip length or combine broken segments to achieve as close to 600 ft of effective length as possible. The test strip can be a portion of the HMA work and shall meet the contract requirements.

California Test 375 February 2012
-3-
2. Establish a minimum of ten random test site locations on the test strip following the procedure described in Part 3 of this test method. In no case shall the required number of test sites for the test strip be reduced.
3. Determine nuclear density values at each of the test sites using the procedure specified in Part 4 of this test method.
2B. CORRELATING TO CORES
1. Obtain a set of two cores (4" or 6" in diameter) from within the outlined test position of the nuclear density gage for each of the test sites. Permanently mark each core to identify the corresponding station as shown on Line J of Form TL-3112.
NOTE: Cores that are damaged during the coring operation must be discarded and replaced by additional cores from the same test site. If additional core(s) cannot be obtained from within the outlined position of the nuclear gage, an alternate site shall be selected and outlined for two replacement nuclear readings and a replacement set of two core samples.
2. Remove all extraneous core material beyond the top layer of HMA. Determine the density of each core in accordance with California Test 308 - Method A.
3. Determine the average core density for each test site. If the two core densities from a site do not agree to within 0.05 g/cc, exclude all the data from this site.
4. Determine the correlation value for each test site by subtracting the average nuclear density on Line N from the average core density for the site.
5. Determine the conversion factor(s) as follows:
a. Compute the average and the standard deviation of the correlation values from the test strip.
S v =
n 2 v –
v 2
n n 1
where:
v = average of correlation values
Sv = standard deviation of the correlation values
v = summation of individual correlation values
2
v= summation of the squares of the individual correlation values
( v ) 2 = summation of the individual correlation values squared n = number of individual tests
v =
v
n
California Test 375 February 2012
-4-
b. If any correlation value varies from the average correlation value by more than two standard deviations at the 95 % confidence level, consider this correlation value statistically invalid and exclude it from the data. If more than three values are excluded, repeat steps 2A.2 through 2B.5.
c. Determine the conversion factor by averaging the valid correlation values and record the conversion factor on Line P.
PART 3. SELECTION OF TEST SITE This part of the test method provides the procedure for determining the number and location of test sites to be tested within a contiguous and uninterrupted portion of pavement. 3A. TESTING FREQUENCY
1. Test a minimum of ten sites for each 500 tons of HMA placed.
2. For areas containing less than 500 tons, test at the rate of one test site for each 50 tons or portion of HMA placed. No area shall be represented by fewer than five test sites.
3B. TEST SITE LOCATION The locations of the test sites shall be determined using the following procedures:
1. Determine the number of sites to be tested.
2. Randomly select a block of numbers from either TABLE 1 or TABLE 2 depending on the number of sites to be tested.
a. TABLE 1 shall be used when ten sites are to be tested. Each set of ten random numbers in this table has been arranged in the sequential order of stationing.
b. TABLE 2 shall be used when the number of test sites is less than ten. The numbers in this table have not been arranged sequentially in order of stationing.
c. The numbers for transverse location will always be in random order.
PART 4. DETERMINATION OF IN-PLACE DENSITY WITH THE NUCLEAR DENSITY GAGE This part of the test method describes the procedures for preparing the test site and taking readings with a nuclear density gage. 4A. APPARATUS / MATERIAL
1. Nuclear gage - calibrated with an appropriate conversion factor established for the project material determined in accordance with Part 2 of this test method.
NOTES:
a. If the thickness of an individual layer is 2.4 in. (0.20 ft) or greater, conventional gages shall be used. For combination gages equipped with asphalt mode and thin lift mode, use only the asphalt mode.

California Test 375 February 2012
-5-
b. If the thickness of an individual layer is less than 2.4 in. (0.20 ft) but not less than 1.2 in. (0.10 ft) in., use thin lift gages that do not require nomographs. Combination gages shall be placed in the thin lift mode.
c. In multiple layers of similar materials, if the combined thickness of a previously tested layer and a newly placed layer is greater than or equal to 2.4 in. (0.20 ft), conventional or thin lift gages may be used.
2. Sand - Passing a No. 30 sieve obtained from the aggregate blend used for the HMA.
3. Straightedge – A straightedge approximately 14 in. long.
4. Marker – Lumber crayon or equivalent
5. Distance measuring device - A measuring system capable of locating test sites to the nearest 4 in.
4B. DETERMINING IN-PLACE DENSITY
1. Determine the test site locations using the procedure in Part 3 of this test method. Observe the surface texture of the pavement. If the surface texture is not representative of the overall pavement surface or if the nuclear density gage cannot be seated because of irregularities on the pavement surface, then select an alternate test site 10 ft forward in the longitudinal direction, while keeping the same transverse location.
2. Fill any surface voids with sand passing a No. 30 sieve. Pour a small amount of sand from the aggregate blend over the test site. Use a straightedge to work the sand into the surface until the voids are filled and the surface is smooth. Remove excess sand.
3. Place the nuclear density gage on the test site with its long axis aligned parallel to traffic, and seat it on the pavement by applying a light vertical pressure while working the gage back and forth in a short horizontal arc. Press the gage on each corner to make sure it is adequately seated and does not rock.
4. Lower the source rod to the backscatter position. Thin lift gages shall be set to the thin lift mode and input lift thickness.
5. Obtain a 1-min count. Record this reading on Line L of Form TL-3112. Retract the source rod.
6. Use a marker to outline the base of the gage on the pavement immediately after the first reading is taken. Set the gage aside and use the straightedge to re-smooth the surface. Do not add sand unless voids are obvious. Carefully turn the gage 180 degrees and place it precisely over the initial test position as indicated by the markings on the pavement. Seat the gage in accordance with Step 3 and repeat Steps 4 and 5 above.
7. Repeat Steps 1 through 6 at each test site.
8. Determine the count ratios to the nearest thousandth (0.001) by dividing nuclear readings on Line L by the standard count on Line A and record on Line M. From the count ratio/density table, determine the density. Record the result to the nearest 0.01 g/cc on Line N.
California Test 375 February 2012
-6-
NOTE: Recording the count and calculating the count-ratio is not necessary for gages that are designed to display the density directly.
9. If the two density measurements at a test site do not agree to within 0.05 g/cc, repeat Steps 2 through 6 at the same site until a set of two measurements agree within 0.05 g/cc. If a valid set of density measurements cannot be obtained after three attempts, select and test a new site 10 ft forward in the longitudinal direction and at the same transverse location. Document site change(s) in the “Field Notes and Calculations” portion of Form TL-3112.
NOTE: During a test strip when a new site is selected, all gages previously tested on the original site are required to retest the new site and record the new data.
10. Average the two densities from the same site and record the result to the nearest 0.01 g/cc on Line N.
11. Calculate the average in-place density (all sites) for the test area by averaging the average densities from each of the test sites on Line N. Record the result to the nearest 0.01 g/cc on Line O.
12. Calculate the corrected in-place density by adding the conversion factor on Line P to the average in-place density on Line O. Record this result on Line Q for calculating the relative compaction in Part 6.
PART 5. DETERMINATION OF TEST MAXIMUM DENSITY (TMD) This part of the test method describes two procedures for determining the TMD, the standard for evaluating the compaction achieved on the roadway. The procedures are: a laboratory test maximum density (LTMD) and a field test maximum density (FTMD). The FTMD is normally slightly lower than the LTMD, therefore a procedure is also provided to develop a correlation factor for using the FTMD to calculate relative compaction. 5A. APPARATUS
1. Laboratory Procedure
See California Test 304 and California Test 308 for the required apparatus.
2. Field Procedure
a. Sampling equipment including containers - a square-point shovel and metal buckets with a capacity of approximately 5 gallons.
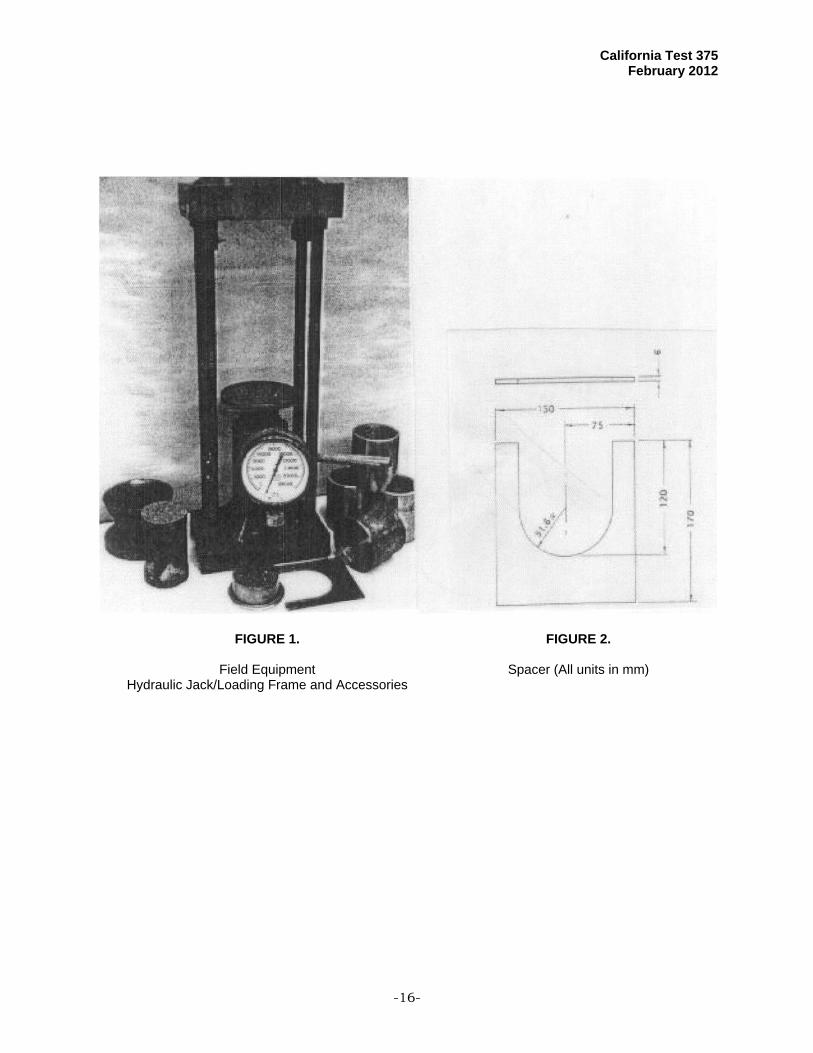
b. A compression device capable of applying and maintaining a total static load of 30,000 lbs. The upper and lower platens shall be in a fixed horizontal position parallel to one another. The loading ram shall have a stroke length of at least 4 in. and when fully retracted the clearance between the upper and lower platens shall be at least 14 in. The device shall include a pressure control and monitoring system allowing the static load to be gradually increased from 0 to 30,000 lbs over a period of approximately 30 seconds. The hydraulic jack and loading frame shown in Figure 1 are acceptable.

California Test 375 February 2012
-7-
c. Compaction molds and accessories:
(1) Compaction molds (three required) having an inside diameter of 4 in. ± 0.005 in. and an outside diameter of 4.49 in. ± 0.05 in. and a height of approximately 5 in. The steel molds used for California Test 304 meet these requirements.
(2) A bottom plunger having an outside diameter of 3.950 in. ± 0.005 in. and a height of 1.50 in. ± 0.10 in. attached to a base plate approximately 5 in. in diameter and 0.25 in. thick.
(3) A top plunger having an outside diameter of 3.950 in. 0.005 in. and a height of approximately 6 in.
(4) A spacer conforming to the dimensions in Figure 2.
(5) An extraction sleeve as shown in Figure 6 conforming to the dimensions in Figure 3.
NOTE: Other sample extraction devices may be used if they do not damage or distort the test specimen.
d. A balance or scale with a capacity of at least 15 kg accurate to ± 1 g equipped to weigh the test samples in air and immersed in water as shown in Figure 4.
e. Miscellaneous accessories including, but not limited to, splitting and/or quartering equipment, gloves, spatula, funnel, scoop, sample weighing container, and a thermometer to measure HMA temperature up to 300˚F.
5B. SAMPLING
1. Follow the procedures in California Test 125 to obtain a representative sample of HMA.
2. Samples obtained for fabrication in the field shall have a mass of approximately 50 lb. and be placed in a covered 5 gallon metal bucket (half full) to aid in maintaining temperature during transport. Cardboard boxes, as described in California Test 125, may be substituted for metal buckets if the transportation distance is of sufficient length to require re-heating of the HMA sample.
5C. TEST FREQUENCY
1. Obtain a representative sample of HMA from each day’s production.
2. When daily production exceeds 5,000 tons, take additional representative samples from each 5,000 tons or portion thereof.
3. Determine a LTMD at least once for the following occurrences:
a. Project start-up.
b. Every five paving days or every 25,000 tons placed, whichever occurs first.
c. Change in the HMA or Job Mix Formula (JMF).
California Test 375 February 2012
-8-
4. Determine either a LTMD or FTMD for each daily sample.
5. Testing for LTMD or FTMD may be waived for selected daily samples providing all of the following conditions are met:
a. Five consecutive days of LTMD or FTMD do not differ by more than 1 % from their average.
b. At least one sample is tested for LTMD or FTMD every five paving days and the LTMD or FTMD of each tested sample does not differ by more than 1 % from the average of the previous five days of tested samples.
NOTE: If the 1 % average test fails, an additional test shall be performed (for verification) using an untested portion of the same sample.
c. Untested daily samples are retained for subsequent testing if needed.
6. TMD determined from each test strip may be used as daily TMD tests and may be included in the average of TMD determinations during regular production.
5D. LABORATORY PROCEDURE FOR FABRICATING TEST SPECIMENS AND DETERMINING LABORATORY TEST MAXIMUM DENSITY (LTMD)
1. Compact five test specimens from each sample by following the procedures described in
California Test 304 for field-mixed HMA.
2. Determine the bulk specific gravity (Gmb) of each compacted specimen by following the procedures in California Test 308 - Method A and record the Gmb as density to the nearest 0.01 g/cc.
3. Determine the LTMD of the sample by averaging the Gmb values of the five individual specimens. Record the result on Line T of Form TL-3112.
5E. FIELD PROCEDURE FOR FABRICATING TEST SPECIMENS AND DETERMINING FIELD TEST MAXIMUM DENSITY (FTMD)
1. Place a compaction mold on the base and insert a U-shaped spacer between the bottom
of the mold and the foot of the base.
NOTE: The temperature of the HMA sample must be between 203˚F and 221˚F. If not, heat the sample in a 212ºF 9˚F oven until the temperature is achieved.
2. Place a manila disc in the bottom of the mold.
3. Place the funnel on the mold.
4. Use a scoop to dip out an appropriate amount of HMA based on the following table and immediately place the material into the compaction mold. Use the spatula to work the material into the mold and even out the surface. Remove the funnel.
California Test 375 February 2012
-9-
Specific Gravity of Compacted HMA Mass of Test Portion Over 2.30 1200 10 g 2.20 - 2.30 1150 10 g Under 2.20 1100 10 g
5. Place a manila disc on the material in the mold and seat the follower ram on the disc,
taking care to align the follower ram so it does not contact the top edge of the mold.
6. Position the compaction mold assembly in the compression device as shown in Figure 5.
7. Gradually apply an initial static load of approximately 5,000 lb. Release the initial load and remove the U-shaped spacer.
8. Gradually increase the load over a period of approximately 30 seconds until a total static load of 30,000 lbs is achieved. Hold this total load for 1 minute and then slowly release the load.
9. Refer to “Precautions and Adjustments” in Part 5F below before compacting subsequent test specimens. Repeat Steps 1 through 9 until three test specimens have been compacted.
10. Allow the compacted test specimens to cool sufficiently to prevent distortion before removing them from the compaction mold (see Precaution 5F.3 for rubberized HMA).
11. Push the test specimen from the mold using any system that will not damage or distort the specimen. The compression device and follower rams can be used to push the test specimen into the extraction sleeve as shown in Figure 6.
12. Determine the density of each test specimen to the nearest 0.01 g/cc in accordance with the procedures in California Test 308 – Method A. It is permissible to use Method C of California Test 308 provided a correlation is established and a correction factor is applied as follows:
a. A minimum of three test specimens from the same sample shall be tested by Method A and Method C.
b. The difference between the average value determined by Method A and the average value determined by Method C will be the correction factor applied to subsequent Method C test results.
c. Verify the correction factor every three months or any time there is a change in the source of the aggregate, the gradation of the aggregate, the source or grade of asphalt, or the binder content of the HMA.
13. Determine the FTMD to the nearest 0.01 g/cc by averaging the specific gravity values of the three individual test specimens. Record the result on Line R of Form TL-3112.
5F. PRECAUTIONS AND ADJUSTMENTS
1. Preparation and compaction of the test specimens must be completed in a timely manner to avoid excessive heat loss.

California Test 375 February 2012
-10-
2. The U-shaped spacer is used during initial loading to allow compression of the test specimen from both ends as it is loaded to 30,000 lb. If the mold makes contact with the base of the bottom plunger before the 30,000 lb. load is achieved, discard the specimen and increase the initial load applied prior to removing the spacer for subsequent specimens.
3. Rubberized HMA (RHMA) must be supported in the mold until the test specimen has cooled. Push the compacted specimen to the end of the mold immediately after compaction and allow the bottom surface to rest on a counter or tabletop until cool.
5G. CORRELATION FACTOR
1. At the beginning of each project and whenever a new LTMD is determined, establish a correlation factor to adjust the FTMD values to correspond with the LTMD values.
2. Obtain a representative sample of HMA in accordance with California Test 125.
3. Split the sample into two representative portions. Submit one portion to the laboratory to determine the LTMD. Use another portion to determine the FTMD.
4. Compact a minimum of five test specimens using the laboratory procedure and five test specimens using the field procedure.
5. Determine the density (Gmb) of each specimen to the nearest 0.01 g/cc in accordance with California Test 308 - Method A.
6. Calculate the average density (Gmb) for each compaction procedure to the nearest 0.01 g/cc.
7. Determine the Correlation Factor by dividing the average of the LTMD values by the average of the FTMD values and record on Line S.
8. When the LTMD, as described in Part 5D, is not used for Line T, determine a Correlated FTMD by multiplying the FTMD on Line R to the Correlation Factor on Line S. Record the result on Line T.
PART 6. CALCULATION OF RELATIVE COMPACTION This part of the test method provides a method for computing the relative compaction (RC).
1. Calculate relative compaction (RC) to the nearest 0.1 % as follows:
100(1)TMD
DensityPlace-In Corrected(%)RC
(1) Use either the LTMD from Part 5E or the Correlated FTMD from Part 5G.
2. Use the most recent TMD for the lot tested to calculate the RC and record on Line U of
Form TL-3112.
3. When the conditions for waiving the TMD tests on selected samples are met, use the average of the five most recent TMD values to calculate RC.

California Test 375 February 2012
-11-
D. PRECISION AND BIAS Data to establish the following precision statements were obtained from a Caltrans research study reported in the Transportation Research Record 1491. The data consists of single measurements with a nuclear density gage repositioned after each measurement.
Number of Operator, gage
Density, g/cc
Standard Deviation (S) Acceptable Range of Two Results (D2S)
Single 0.02 0.06
Multiple 0.04 0.12 The precision expected for gage calibration using multiple counts on test blocks has not been determined, but is expected to be significantly better than those determined using a 1-min count on HMA pavements. Adjusting the measured gage densities to correlated core densities minimizes any bias. E. SAFETY AND HEALTH Prior to sampling, handling or testing, read the Laboratory Safety Manual, Part B Sections 5.1, 5.2, 10.4, 12.1, 12.2, 12.3 and Part C Section 2.0. Requirements for general safety principles, standard operating procedures, protective apparel and how to handle spills, accidents and emergencies are discussed in the above-noted reference. Personnel should observe the following precautions:
1. Use reasonable care, including wearing heat resistant gloves, when working with hot materials or equipment.
2. Use proper lifting techniques when handling samples and equipment.
3. Exercise caution when assembling and positioning the compaction mold and accessories in the compression device to avoid pinching hands or fingers in the apparatus.
4. When disassembling compaction mold and accessories, exercise care to prevent the ram, base or other internal parts of the apparatus from falling out causing injuries to personnel or damage to the equipment. Users of this method do so at their own risk.
This test method does not purport to address all safety problems associated with its use. It is the responsibility of the user of this test method to consult and establish appropriate safety and health practices and determine the applicability of regulatory limitations prior to use. Users of this method do so at their own risk.
End of Text (California Test 375 contains 18 pages)

California Test 375 February 2012
-12-
TABLE 1. Sequential Random Numbers
Longit. Trans. Longit. Trans. Longit. Trans. Longit. Trans. Longit. Trans.
0.053 0.730 0.035 0.627 0.231 0.870 0.081 0.137 0.106 0.239
0.081 0.948 0.137 0.163 0.251 0.114 0.285 0.542 0.231 0.291
0.095 0.726 0.164 0.093 0.271 0.505 0.324 0.538 0.253 0.858
0.576 0.482 0.225 0.921 0.396 0.125 0.470 0.414 0.398 0.761
0.609 0.824 0.334 0.417 0.427 0.392 0.522 0.235 0.517 0.463
0.669 0.899 0.356 0.850 0.549 0.760 0.569 0.608 0.640 0.993
0.810 0.159 0.434 0.838 0.690 0.405 0.579 0.977 0.749 0.919
0.892 0.277 0.554 0.375 0.860 0.507 0.751 0.592 0.904 0.501
0.971 0.468 0.576 0.155 0.935 0.806 0.815 0.787 0.986 0.131
0.982 0.801 0.794 0.638 0.997 0.884 0.879 0.871 0.998 0.222
0.068 0.095 0.109 0.548 0.021 0.887 0.100 0.472 0.335 0.683
0.165 0.459 0.127 0.964 0.150 0.169 0.123 0.086 0.348 0.996
0.371 0.996 0.209 0.064 0.159 0.979 0.396 0.355 0.358 0.743
0.470 0.535 0.412 0.356 0.289 0.187 0.423 0.460 0.601 0.595
0.477 0.101 0.587 0.284 0.448 0.894 0.673 0.652 0.698 0.539
0.509 0.815 0.622 0.862 0.654 0.169 0.817 0.259 0.740 0.466
0.566 0.342 0.667 0.843 0.767 0.985 0.833 0.317 0.796 0.212
0.788 0.682 0.757 0.283 0.919 0.962 0.890 0.665 0.864 0.069
0.874 0.242 0.831 0.908 0.942 0.313 0.925 0.404 0.896 0.247
0.901 0.420 0.873 0.218 0.947 0.215 0.928 0.305 0.909 0.326 INSTRUCTIONS:
1. Begin with the numbers at the top of each column; use each successive pair of numbers to determine the longitudinal and transverse distance to each test site.
2. Arrange the pairs in sequential order based on the longitudinal location. Record the paired numbers on Lines G and H of Form TL-3112.
3. To determine the longitudinal distance from the start station on Line B, multiply the numbers on Line G by the length of the pavement on Line D. Round the product up to the next whole number and record on Line I. To determine the station of a test site, add the distance on Line I to the start station on Line B and record the result on Line J.
4. To determine the transverse distance from the edge of pavement, multiply the numbers on Line H by the width of the pavement on Line E. Round the product up to the next whole number and record on Line K. Any test site within 1 ft. of the pavement edge should be relocated to 1 ft. from the edge.
5. Reference all test sites to identifiable locations; e.g., edge of pavement, stationing, centerline, etc.

California Test 375 February 2012
-13-
TABLE 2. Table of Random Numbers
Longit. Trans. Longit. Trans. Longit. Trans. Longit. Trans. Longit. Trans.
0.576 0.730 0.430 0.754 0.271 0.870 0.732 0.721 0.998 0.239
0.971 0.824 0.858 0.125 0.396 0.095 0.153 0.508 0.749 0.291
0.810 0.159 0.902 0.470 0.997 0.392 0.009 0.420 0.517 0.858
0.081 0.277 0.554 0.627 0.427 0.760 0.937 0.310 0.253 0.761
0.982 0.468 0.225 0.163 0.549 0.405 0.892 0.957 0.640 0.463
0.371 0.359 0.035 0.339 0.860 0.507 0.470 0.080 0.106 0.131
0.165 0.996 0.334 0.921 0.654 0.979 0.285 0.542 0.796 0.996
0.477 0.535 0.794 0.850 0.767 0.187 0.081 0.538 0.358 0.595
0.788 0.101 0.164 0.838 0.021 0.894 0.324 0.871 0.698 0.539
0.566 0.815 0.873 0.964 0.942 0.985 0.123 0.086 0.864 0.466
0.901 0.342 0.412 0.641 0.195 0.313 0.396 0.460 0.335 0.212
0.470 0.682 0.667 0.356 0.428 0.117 0.833 0.652 0.909 0.819
0.068 0.242 0.127 0.284 0.759 0.239 0.100 0.259 0.601 0.326
0.874 0.420 0.209 0.862 0.666 0.491 0.523 0.665 0.195 0.887
0.875 0.969 0.552 0.077 0.865 0.333 0.673 0.305 0.058 0.075
0.341 0.688 0.503 0.447 0.545 0.731 0.994 0.307 0.220 0.659
0.123 0.791 0.721 0.137 0.069 0.998 0.798 0.879 0.631 0.422
0.006 0.120 0.914 0.574 0.263 0.176 0.104 0.755 0.432 0.391 INSTRUCTIONS:
1. Begin with the numbers at the top of each column; use each successive pair of numbers to determine the longitudinal and transverse distance to each test site.
2. Arrange the pairs in sequential order based on the longitudinal location. Record the paired numbers on Lines G and H of Form TL-3112.
3. To determine the longitudinal distance from the start station on Line B, multiply the numbers on Line G by the length of the pavement on Line D. Round the product up to the next whole number and record on Line I. To determine the station of a test site, add the distance on Line I to the start station on Line B and record the result on Line J.
4. To determine the transverse distance from the edge of pavement, multiply the numbers on Line H by the width of the pavement on Line E. Round the product up to the next whole number and record on Line K. Any test site within 1 ft. of the pavement edge should be relocated to 1 ft. from the edge.
5. Reference all test sites to identifiable locations; e.g., edge of pavement, stationing, centerline, etc.
California Test 375 February 2012
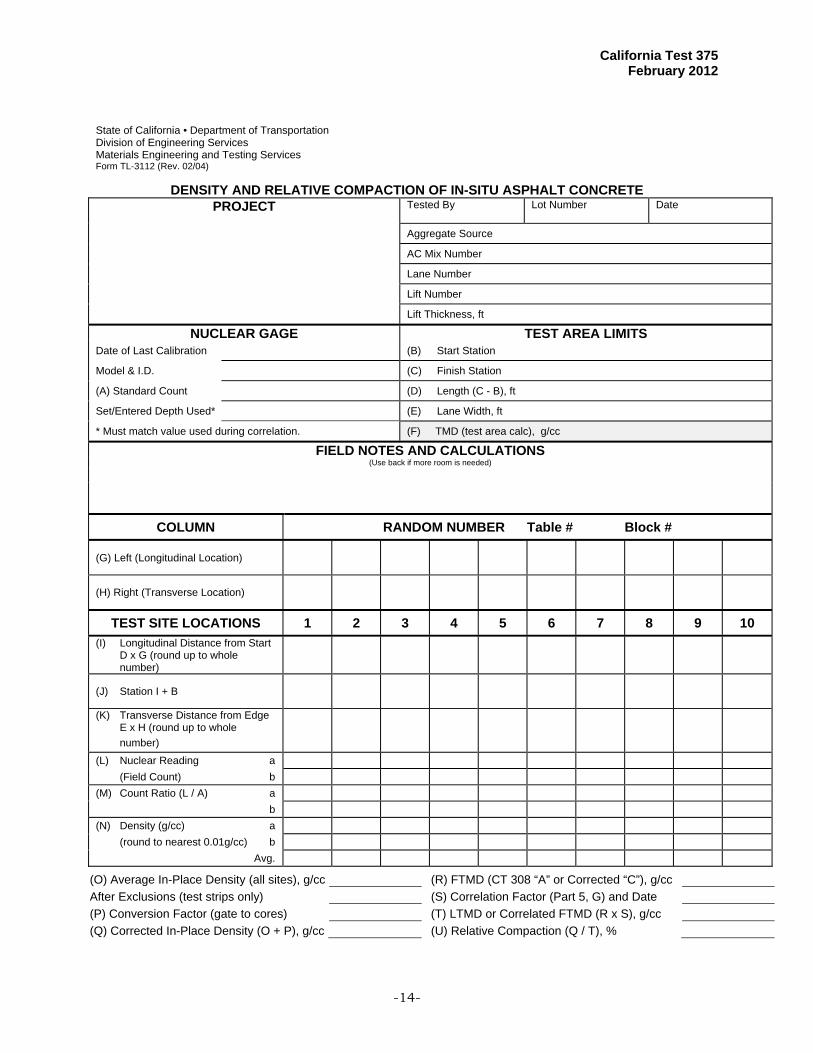
-14-
State of California • Department of Transportation Division of Engineering Services Materials Engineering and Testing Services Form TL-3112 (Rev. 02/04)
DENSITY AND RELATIVE COMPACTION OF IN-SITU ASPHALT CONCRETE PROJECT Tested By
Lot Number Date
Aggregate Source
AC Mix Number
Lane Number
Lift Number
Lift Thickness, ft
NUCLEAR GAGE TEST AREA LIMITS Date of Last Calibration (B) Start Station
Model & I.D. (C) Finish Station
(A) Standard Count (D) Length (C - B), ft
Set/Entered Depth Used* (E) Lane Width, ft
* Must match value used during correlation. (F) TMD (test area calc), g/cc
FIELD NOTES AND CALCULATIONS (Use back if more room is needed)
COLUMN RANDOM NUMBER Table # Block #
(G) Left (Longitudinal Location)
(H) Right (Transverse Location)
TEST SITE LOCATIONS 1 2 3 4 5 6 7 8 9 10
(I) Longitudinal Distance from Start D x G (round up to whole number)
(J) Station I + B
(K) Transverse Distance from Edge E x H (round up to whole
number)
(L) Nuclear Reading a (Field Count) b (M) Count Ratio (L / A) a b (N) Density (g/cc) a (round to nearest 0.01g/cc) b
Avg.
(O) Average In-Place Density (all sites), g/cc (R) FTMD (CT 308 “A” or Corrected “C”), g/cc
After Exclusions (test strips only) (S) Correlation Factor (Part 5, G) and Date
(P) Conversion Factor (gate to cores) (T) LTMD or Correlated FTMD (R x S), g/cc
(Q) Corrected In-Place Density (O + P), g/cc (U) Relative Compaction (Q / T), %

California Test 375 February 2012
-15-
State of California • Department of Transportation Division of Engineering Services Materials Engineering and Testing Services Form TL-3112 (Rev. 02/04)
EXAMPLE DENSITY AND RELATIVE COMPACTION OF IN-SITU ASPHALT CONCRETE
PROJECT Tested By Harry Roberts
Lot Number 1- Sublot 10
Date 06-11-2003
25-4567U8 Aggregate Source ACME Materials, Bristoville
25-XYZ-555-61.7/87.3 AC Mix Number QC-123456-AB
Lyon County in Bristoville from Blue Streak Lane Number 2-A Line
Road to Glenn River Lift Number 3
Lift Thickness, ft. 0.18
NUCLEAR GAGE TEST AREA LIMITS Date of Last Calibration 12-05-2002 (B) Start Station 698+59
Model & I.D. Trox-3440-55555 (C) Finish Station 708+77
(A) Standard Count 2662 (D) Length (C - B), ft 1018
Set/Entered Depth Used* BS (E) Lane Width, ft 12
* Must match value used during correlation. (F) TMD (test area calc), g/cc 2.44
FIELD NOTES AND CALCULATIONS (Use back if more room is needed)
Multiple layers of similar materials. 1st lift of 0.20 ft (conventional), 2nd lift of 0.20 ft, (conventional) and 3rd lift of 0.18 ft (similar material with combined thickness of at least 0.20 ft, thin lift or conventional). Conventional Troxler 3440 was used here for all three lifts. At station 699+42, the transverse distance was moved from 12 to 11 (site is now 1 ft from edge).
COLUMN RANDOM NUMBER Table # 1 Block # 0
(G) Left (Longitudinal Location) 0.053 0.081 0.095 0.576 0.609 0.669 0.810 0.892 0.971 0.982
(H) Right (Transverse Location) 0.730 0.948 0.726 0.482 0.824 0.899 0.159 0.277 0.468 0.801
TEST SITE LOCATIONS 1 2 3 4 5 6 7 8 9 10
(I) Longitudinal Distance from Start D x G (round up to whole number)
54 83 97 587 620 682 825 909 989 1000
(J) Station I + B 699+13 699+42 699+56 704+46 704+79 705+41 706+84 707+68 708+48 708+59
(K) Transverse Distance from Edge E x H (round up to whole
number)
9 11 9 6 10 11 2 4 6 10
(L) Nuclear Reading a 600 601 587 584 591 598 581 594 587 598 (Field Count) b 594 587 594 587 578 594 591 580 593 586 (M) Count Ratio (L / A) a .225 .226 .221 .219 .222 .221 .218 .223 .221 .225 b .223 .221 .223 .221 .217 .223 .222 .218 .223 .220 (N) Density (g/cc) a 2.36 2.35 2.37 2.38 2.37 2.37 2.38 2.36 2.37 2.35 (round to nearest 0.01g/cc) b 2.35 2.37 2.36 2.37 2.39 2.36 2.37 2.38 2.36 2.37
Avg. 2.36 2.36 2.37 2.38 2.38 2.37 2.38 2.37 2.37 2.36
(O) Average In-Place Density (all sites), g/cc 2.37 (R) FTMD (CT 308 “A” or Corrected “C”), g/cc 2.43
After Exclusions (test strips only) N/A (S) Correlation Factor (Part 5, G) and Date 1.016 (02/11/03)
(P) Conversion Factor (gate to cores) 0.01 (T) LTMD or Correlated FTMD (R x S), g/cc 2.47
(Q) Corrected In-Place Density (O + P), g/cc 2.38 (U) Relative Compaction (Q / T), % 96.4
California Test 375 February 2012
-16-
FIGURE 1.
Field Equipment Hydraulic Jack/Loading Frame and Accessories
FIGURE 2.
Spacer (All units in mm)

California Test 375 February 2012
-17-
FIGURE 3.
Extraction Sleeve (All units in mm)
FIGURE 4.
Balance for Weighing Samples in Air and in Water

California Test 375 February 2012
-18-
FIGURE 5.
Field Compaction Mold Assembly in Compression Device
FIGURE 6.
Field Extraction Sleeve Assembly in Compression Device